nechoic hamber measurement improvement · termination-vswr measurement method, then the new avswr...
TRANSCRIPT
more accurate, it provided phase informationand it was possible to measure S-parametersover a full bandwidth in a very short time. Theavailability of accurate phase measurements,mainly due to the use of synthesizers to pro-duce the RF and microwave signals and to theaccurate system calibration, has enabled so-phisticated mathematical treatments to bemade on the measured signals such as Fouriertransform, allowing calculation of echoes inthe time domain, filtering and removal of un-wanted echoes (time-gating capability), andreturning back to the frequency domain withan improved measurement accuracy. Thesame methodology can now be used also tomeasure the voltage standing wave ratio(VSWR) of an absorber wall over a full band-width, with improved accuracy and in a short-er time. For that purpose, the transmitter/receiver and the stub tuner are now replaced
G. COTTARDANTEMSaint-Maur-des-Fosses, FranceY. ARIENEmerson & Cuming MWPWesterlo, Belgium
The well known and widely used “Termi-nation-VSWR” method, used to mea-sure the reflectivity of an absorber wall
in an anechoic chamber, has been consider-ably modernized with the help of new vectornetwork analyzers (VNA) and personal com-puters (PC), taking advantage of fast sweepersor synthesizers and of the time-domain capa-bility, both automated by the PC. In the past,the measurement, using a slotted line, wasmade one frequency at a time. It is now possi-ble to cover a complete range of frequencies,with no moving parts, using two differentmethods: the Advanced VSWR (AVSWR) orthe radar cross-section (RCS) method. It isnot an exaggeration to say that the progressmade in this measurement is as high as thetransition between a slotted line measurementand the automated VNA at the end of the1970s. These new methods allow measuring acomplete range of frequencies in the sametime it took to measure only one or two fre-quencies before.
GENERAL CONSIDERATIONSAs a matter of fact, the VNA replaced the
slotted line a long time ago to measure RFand microwave components because it was
ANECHOIC CHAMBERMEASUREMENTIMPROVEMENT
Reprinted with permission of MICROWAVE JOURNAL® from the March 2006 issue.©2006 Horizon House Publications, Inc.
by a VNA with pos-sibly a time-gatingcapability (time-do-main option). Thisarticle will first de-scribe the classicalTermination-VSWRm e a s u r e m e n tmethod, then thenew AVSWR andRCS methods.
PREVIOUS VSWR MEASUREMENTMETHOD
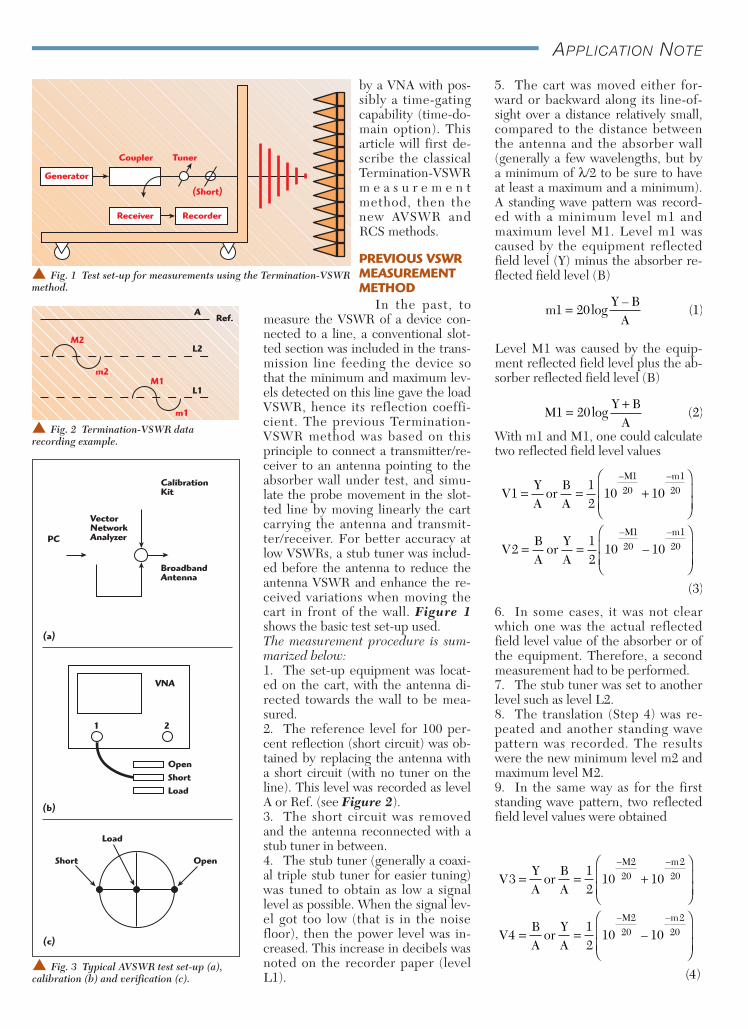
In the past, tomeasure the VSWR of a device con-nected to a line, a conventional slot-ted section was included in the trans-mission line feeding the device sothat the minimum and maximum lev-els detected on this line gave the loadVSWR, hence its reflection coeffi-cient. The previous Termination-VSWR method was based on thisprinciple to connect a transmitter/re-ceiver to an antenna pointing to theabsorber wall under test, and simu-late the probe movement in the slot-ted line by moving linearly the cartcarrying the antenna and transmit-ter/receiver. For better accuracy atlow VSWRs, a stub tuner was includ-ed before the antenna to reduce theantenna VSWR and enhance the re-ceived variations when moving thecart in front of the wall. Figure 1shows the basic test set-up used.The measurement procedure is sum-marized below:1. The set-up equipment was locat-ed on the cart, with the antenna di-rected towards the wall to be mea-sured.2. The reference level for 100 per-cent reflection (short circuit) was ob-tained by replacing the antenna witha short circuit (with no tuner on theline). This level was recorded as levelA or Ref. (see Figure 2).3. The short circuit was removedand the antenna reconnected with astub tuner in between.4. The stub tuner (generally a coaxi-al triple stub tuner for easier tuning)was tuned to obtain as low a signallevel as possible. When the signal lev-el got too low (that is in the noisefloor), then the power level was in-creased. This increase in decibels wasnoted on the recorder paper (levelL1).
5. The cart was moved either for-ward or backward along its line-of-sight over a distance relatively small,compared to the distance betweenthe antenna and the absorber wall(generally a few wavelengths, but bya minimum of λ/2 to be sure to haveat least a maximum and a minimum).A standing wave pattern was record-ed with a minimum level m1 andmaximum level M1. Level m1 wascaused by the equipment reflectedfield level (Y) minus the absorber re-flected field level (B)
Level M1 was caused by the equip-ment reflected field level plus the ab-sorber reflected field level (B)
With m1 and M1, one could calculatetwo reflected field level values
6. In some cases, it was not clearwhich one was the actual reflectedfield level value of the absorber or ofthe equipment. Therefore, a secondmeasurement had to be performed.7. The stub tuner was set to anotherlevel such as level L2.8. The translation (Step 4) was re-peated and another standing wavepattern was recorded. The resultswere the new minimum level m2 andmaximum level M2.9. In the same way as for the firststanding wave pattern, two reflectedfield level values were obtained
VYA
orBA
VBA
orYA
M m
M m
312
10 10
412
10 10
4
220
220
220
220
= = +
= =
– –
– –
–
( )
VYA
orBA
VBA
orYA
M m
M m
112
10 10
212
10 10
3
120
120
120
120
= = +
= =
– –
– –
–
( )
MY B
A1 20 2= +
log ( )
mY B
A1 20 1= log
–( )
APPLICATION NOTE
Ref.A
M2
m2M1
m1
L2
L1
Fig. 2 Termination-VSWR datarecording example.
Coupler Tuner
(Short)
Generator
Receiver Recorder
Fig. 1 Test set-up for measurements using the Termination-VSWRmethod.
VectorNetworkAnalyzer
BroadbandAntenna
VNA
CalibrationKit
PC
2
OpenShortLoad
Open
Load
Short
1
(a)
(b)
(c)
Fig. 3 Typical AVSWR test set-up (a),calibration (b) and verification (c).
10. Between the first and secondmeasurement the reflected field levelof the absorbers (B) did not change.However, by changing the setting ofthe stub tuner, the reflected field lev-el of the equipment (Y) changed.Therefore, the two identical valuesout of the four, V1 = V3 or V4, or V2= V3 or V4 corresponded to the re-flectivity (linear) of the absorbers.Examples of the recording and calcu-lations are given in Appendix A.
This method was powerful butrather slow because only one fre-quency could be measured at a time(receiver limitation), and many cartpositions were necessary to find con-tiguous maximum and minimum lev-els (slotted line method limitation).Also, with the cart and receiver accu-racies, this method was almost neverused above 12 GHz.
Now that recent VNAs with time-domain capability and broadband di-rective antennas exist, it has becomepossible to modernize the “VSWRmethod” with two methods:
The “Advanced VSWR method” tomeasure an absorber wall VSWR.This method works fine between 0.5and 6 GHz with the help of a wide-band horn antenna.
The “RCS method,” for 6 to 18GHz, which measures the wall reflec-tivity through its radar cross-sectionwith a quasi-monostatic bench usingtwo wideband horn antennas, locatedclose to each other.
THE AVSWR MEASUREMENTMETHOD
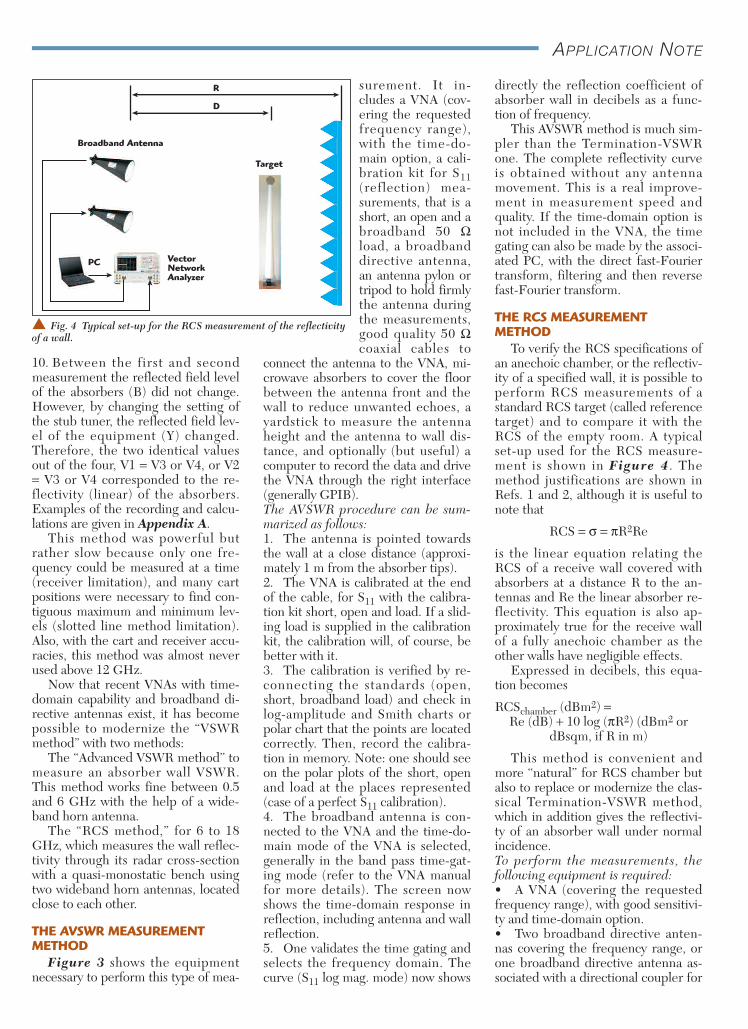
Figure 3 shows the equipmentnecessary to perform this type of mea-
surement. It in-cludes a VNA (cov-ering the requestedfrequency range),with the time-do-main option, a cali-bration kit for S11(reflection) mea-surements, that is ashort, an open and abroadband 50 Ωload, a broadbanddirective antenna,an antenna pylon ortripod to hold firmlythe antenna duringthe measurements,good quality 50 Ωcoaxial cables to
connect the antenna to the VNA, mi-crowave absorbers to cover the floorbetween the antenna front and thewall to reduce unwanted echoes, ayardstick to measure the antennaheight and the antenna to wall dis-tance, and optionally (but useful) acomputer to record the data and drivethe VNA through the right interface(generally GPIB).The AVSWR procedure can be sum-marized as follows:1. The antenna is pointed towardsthe wall at a close distance (approxi-mately 1 m from the absorber tips).2. The VNA is calibrated at the endof the cable, for S11 with the calibra-tion kit short, open and load. If a slid-ing load is supplied in the calibrationkit, the calibration will, of course, bebetter with it.3. The calibration is verified by re-connecting the standards (open,short, broadband load) and check inlog-amplitude and Smith charts orpolar chart that the points are locatedcorrectly. Then, record the calibra-tion in memory. Note: one should seeon the polar plots of the short, openand load at the places represented(case of a perfect S11 calibration).4. The broadband antenna is con-nected to the VNA and the time-do-main mode of the VNA is selected,generally in the band pass time-gat-ing mode (refer to the VNA manualfor more details). The screen nowshows the time-domain response inreflection, including antenna and wallreflection.5. One validates the time gating andselects the frequency domain. Thecurve (S11 log mag. mode) now shows
directly the reflection coefficient ofabsorber wall in decibels as a func-tion of frequency.
This AVSWR method is much sim-pler than the Termination-VSWRone. The complete reflectivity curveis obtained without any antennamovement. This is a real improve-ment in measurement speed andquality. If the time-domain option isnot included in the VNA, the timegating can also be made by the associ-ated PC, with the direct fast-Fouriertransform, filtering and then reversefast-Fourier transform.
THE RCS MEASUREMENTMETHOD
To verify the RCS specifications ofan anechoic chamber, or the reflectiv-ity of a specified wall, it is possible toperform RCS measurements of astandard RCS target (called referencetarget) and to compare it with theRCS of the empty room. A typicalset-up used for the RCS measure-ment is shown in Figure 4 . Themethod justifications are shown inRefs. 1 and 2, although it is useful tonote that
RCS = σ = πR2Re
is the linear equation relating theRCS of a receive wall covered withabsorbers at a distance R to the an-tennas and Re the linear absorber re-flectivity. This equation is also ap-proximately true for the receive wallof a fully anechoic chamber as theother walls have negligible effects.
Expressed in decibels, this equa-tion becomes
RCSchamber (dBm2) =Re (dB) + 10 log (πR2) (dBm2 or
dBsqm, if R in m)
This method is convenient andmore “natural” for RCS chamber butalso to replace or modernize the clas-sical Termination-VSWR method,which in addition gives the reflectivi-ty of an absorber wall under normalincidence.To perform the measurements, thefollowing equipment is required:• A VNA (covering the requestedfrequency range), with good sensitivi-ty and time-domain option.• Two broadband directive anten-nas covering the frequency range, orone broadband directive antenna as-sociated with a directional coupler for
APPLICATION NOTE
VectorNetworkAnalyzer
Broadband Antenna
Target
D
R
PC
Fig. 4 Typical set-up for the RCS measurement of the reflectivityof a wall.

a real monostatic measurement. Thebandwidth of each antenna must besufficient to have a time-domain reso-lution able to isolate the antenna(s)from the wall.• Antenna pylons or tripods to holdfirmly the antennas during the mea-surements.• At least one metallic referenceRCS target to make the referencemeasurement with its transparent py-lon (expanded polystyrene, for exam-ple).• A manual or automated positionerto locate the RCS reference target atthe right elevation and azimuth an-gles in front of the antennas (if a di-rective flat target), not necessary inthe case of a sphere reference target(omni-directional target).• Good quality 50 Ω coaxial cablesto connect the antennas to the VNA.• Eccosorb absorbers to cover thefloor between the antenna front andthe wall to reduce unwanted echoes(if necessary), and also to reducedirect coupling between an-tennas.• Means to determine the distancesbetween antennas and wall (R) andbetween antennas and target (D).• Optionally (and usefully) a com-puter to record the data and drive theVNA through the right interface(generally GPIB).
• Optionally (if necessary) a lownoise amplifier (LNA) with its DCsupply to enhance the received sig-nals so that the signal-to-noise ratio issufficient to have correct accuracy.The RCS Procedure can be summa-rized as follows:1. The antennas are installed on theirpylons or tripods, pointed towards thereceive wall at a distance R from theabsorber wall (see Figure 5).2. The broadband antennas are con-nected through their respective 50 Ωcables to the VNA ports (port 1 forthe transmit antenna and port 2 forthe receive antenna, if the VNA has aclassical test set, or an equivalentconnection in the case of transmit-ter/receiver capability). 3. The time-domain mode of theVNA (generally band pass, time-gat-ing mode) is selected. The screennow shows the time-domain re-sponse, including antennas couplingand wall reflection.4. The time gating (around wall) isvalidated and frequency domain is se-lected. The curve (S21 log mag.mode) now directly shows the reflec-tion level of the absorber wall in dB,also called empty room level “Emp.”5. One then sets the metallic RCSreference target in the middle of thequiet zone on its low RCS pylon
above a positioner at a distance Dfrom the antennas (see Figure 6).The RCS reference target is a knownRCS target (conducting flat plate or ametallic sphere or a metallic trihe-dron, etc.). If the target is a sphere ora well-oriented trihedron, no posi-tioner is needed, since they are al-most omni-directional targets.6. One selects the time-domainmode of the VNA. The screen nowshows the time-domain response, in-cluding antennas coupling, target andwall reflection. The gating must nowstart before the target and finish af-ter. One then validates the time gat-ing and selects the frequency domainmode. The curve (S21 log mag. mode)now directly shows the reflection lev-el of the RCS reference target in dB,also called reference level “Ref” (if noother obstacle can exhibit reflectionin the same time-gating window).7. From the linear “Emp” and “Ref”measured data, one computes theRCS of the receive wall, which is alsothe anechoic chamber RCS. The ab-sorbers reflectivity is obtained fromthe following formulas
RCSchamber =RCSref(Emp/Ref)2(D/R)4 (m2)
RCSref being the theoretical refer-ence target RCS, given in dBm2 ordBsqm.
RCSchamber (dBm2) = RCSref (dBm2)+ Emp (dB) – Ref (dB) – 40 log(R/D)
Note: 40 log(R/D) is the distance cor-rection factor added to Ref RCS asthis target is not at the same distancefrom the antennas as the wall. Thewall absorber reflectivity can be thendeduced from
RCSchamber = πR2Reflectivity
or, in dBsqm
Reflectivity (dB) = RCSchamber(dBm2) – 10 log (πR2) (dBm2)
COMPARISON BETWEEN THEOLD (VSWR) AND NEW (AVSWR AND RCS) METHODS
The AVSWR was used to test ane-choic chamber walls, with a configu-ration shown in Figure 7, with awideband horn on a tripod associatedwith a compact VNA and a laptop.
This technique was originally vali-dated on a dedicated test wall cov-ered with 16 pieces (4 × 4 square) of
APPLICATION NOTE
Receive End-wall
T/R
Fig. 5 “Empty room” measurement set-up.
Receive End-wall
Reference RCS Target
D
R
T/R
Fig. 6 Reference target measurementset-up.
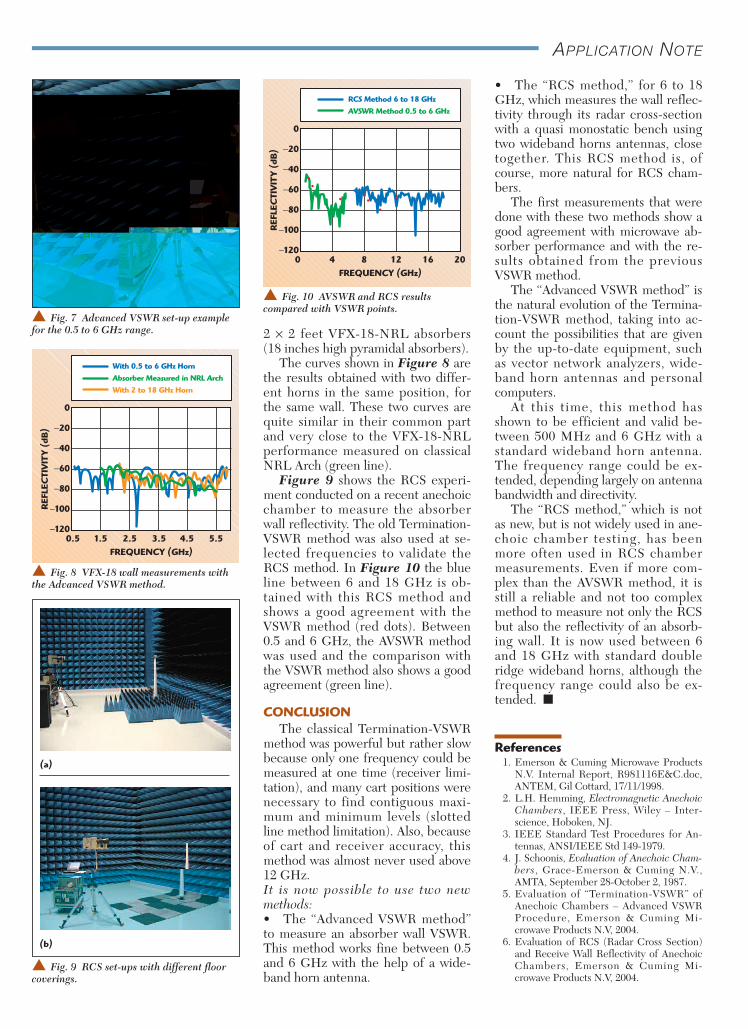
2 × 2 feet VFX-18-NRL absorbers(18 inches high pyramidal absorbers).
The curves shown in Figure 8 arethe results obtained with two differ-ent horns in the same position, forthe same wall. These two curves arequite similar in their common partand very close to the VFX-18-NRLperformance measured on classicalNRL Arch (green line).
Figure 9 shows the RCS experi-ment conducted on a recent anechoicchamber to measure the absorberwall reflectivity. The old Termination-VSWR method was also used at se-lected frequencies to validate theRCS method. In Figure 10 the blueline between 6 and 18 GHz is ob-tained with this RCS method andshows a good agreement with theVSWR method (red dots). Between0.5 and 6 GHz, the AVSWR methodwas used and the comparison withthe VSWR method also shows a goodagreement (green line).
CONCLUSIONThe classical Termination-VSWR
method was powerful but rather slowbecause only one frequency could bemeasured at one time (receiver limi-tation), and many cart positions werenecessary to find contiguous maxi-mum and minimum levels (slottedline method limitation). Also, becauseof cart and receiver accuracy, thismethod was almost never used above12 GHz.It is now possible to use two newmethods:• The “Advanced VSWR method”to measure an absorber wall VSWR.This method works fine between 0.5and 6 GHz with the help of a wide-band horn antenna.
• The “RCS method,” for 6 to 18GHz, which measures the wall reflec-tivity through its radar cross-sectionwith a quasi monostatic bench usingtwo wideband horns antennas, closetogether. This RCS method is, ofcourse, more natural for RCS cham-bers.
The first measurements that weredone with these two methods show agood agreement with microwave ab-sorber performance and with the re-sults obtained from the previousVSWR method.
The “Advanced VSWR method” isthe natural evolution of the Termina-tion-VSWR method, taking into ac-count the possibilities that are givenby the up-to-date equipment, such as vector network analyzers, wide-band horn antennas and personalcomputers.
At this time, this method hasshown to be efficient and valid be-tween 500 MHz and 6 GHz with astandard wideband horn antenna.The frequency range could be ex-tended, depending largely on antennabandwidth and directivity.
The “RCS method,” which is notas new, but is not widely used in ane-choic chamber testing, has beenmore often used in RCS chambermeasurements. Even if more com-plex than the AVSWR method, it isstill a reliable and not too complexmethod to measure not only the RCSbut also the reflectivity of an absorb-ing wall. It is now used between 6and 18 GHz with standard doubleridge wideband horns, although thefrequency range could also be ex-tended.
References1. Emerson & Cuming Microwave Products
N.V. Internal Report, R981116E&C.doc,ANTEM, Gil Cottard, 17/11/1998.
2. L.H. Hemming, Electromagnetic AnechoicChambers, IEEE Press, Wiley – Inter-science, Hoboken, NJ.
3. IEEE Standard Test Procedures for An-tennas, ANSI/IEEE Std 149-1979.
4. J. Schoonis, Evaluation of Anechoic Cham-bers, Grace-Emerson & Cuming N.V.,AMTA, September 28-October 2, 1987.
5. Evaluation of “Termination-VSWR” ofAnechoic Chambers – Advanced VSWRProcedure, Emerson & Cuming Mi-crowave Products N.V, 2004.
6. Evaluation of RCS (Radar Cross Section)and Receive Wall Reflectivity of AnechoicChambers, Emerson & Cuming Mi-crowave Products N.V, 2004.
APPLICATION NOTE
Fig. 7 Advanced VSWR set-up examplefor the 0.5 to 6 GHz range.
REF
LEC
TIV
ITY
(dB
)
FREQUENCY (GHz)
0
−20
−40
−60
−80
−100
−1200.5 1.5 2.5 3.5 4.5 5.5
With 0.5 to 6 GHz HornAbsorber Measured in NRL ArchWith 2 to 18 GHz Horn
Fig. 8 VFX-18 wall measurements withthe Advanced VSWR method.
(a)
(b)
Fig. 9 RCS set-ups with different floorcoverings.
REF
LEC
TIV
ITY
(dB
)FREQUENCY (GHz)
0
−20
−40
−60
−80
−100
−1200 4 8 12 16 20
RCS Method 6 to 18 GHzAVSWR Method 0.5 to 6 GHz
Fig. 10 AVSWR and RCS resultscompared with VSWR points.
Gil Cottard received his engineering degree inradio communications from Ecole Superieured’Electricite, Paris, France, in 1981.
Yoeri Arien received his engineering degree intelecommunications from Hogeschool Limburg,Belgium, in 1996.
APPLICATION NOTE
APPENDIX A
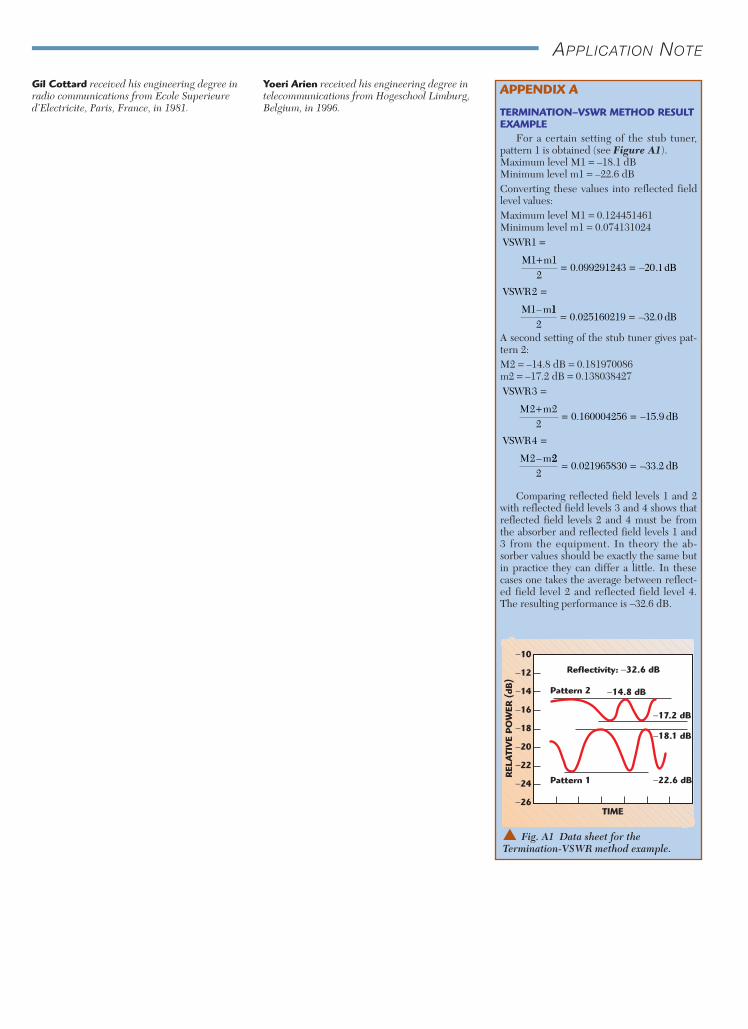
TERMINATION–VSWR METHOD RESULTEXAMPLE
For a certain setting of the stub tuner,pattern 1 is obtained (see Figure A1).Maximum level M1 = –18.1 dBMinimum level m1 = –22.6 dBConverting these values into reflected fieldlevel values:Maximum level M1 = 0.124451461Minimum level m1 = 0.074131024
A second setting of the stub tuner gives pat-tern 2:M2 = –14.8 dB = 0.181970086m2 = –17.2 dB = 0.138038427
Comparing reflected field levels 1 and 2with reflected field levels 3 and 4 shows thatreflected field levels 2 and 4 must be fromthe absorber and reflected field levels 1 and3 from the equipment. In theory the ab-sorber values should be exactly the same butin practice they can differ a little. In thesecases one takes the average between reflect-ed field level 2 and reflected field level 4.The resulting performance is –32.6 dB.
VSWR
M mdB
VSWR
M m
3
2 22
0 160004256 15 9
4
2
=
+= =
=
. – .
– 222
0 021965830 33 2= =. – . dB
VSWR
M m
VSWR
M m
1
1 12
0 099291243
2
1
=
+= =
=
. –
–
20.1 dB
112
0 025160219 32 0= =. – . dB
REL
ATI
VE
PO
WER
(dB
)
TIME
−10
−12
−14
−16
−18
−20
−22
−24
−26
Pattern 2
Reflectivity: −32.6 dB
Pattern 1
−14.8 dB
−17.2 dB
−18.1 dB
−22.6 dB
Fig. A1 Data sheet for the Termination-VSWR method example.