near ir spectral response of natural rubber latex in...
TRANSCRIPT

CHAPTER FOUR
Near IR Spectral Response of Natural Rubber
Latex in the Reflectance Mode
4.1: Introduction
The near Infrared (NIR) region of the electromagnetic spectrum
extends from the upper wavelength end of the visible region at about 770 nm
to 2500 nm (13,000 to 4000 cm"). Absorption bands in this region are
overtones or combinations of fundamental stretching vibrational bands that
occur in the region of 3000 crnvto 1700 cm". The bonds involved are usually
C-H, N-H and O_H'·2 Near-Infrared Reflectance Spectroscopy (NIRS) is an
important tool in chemical analysis", It is a secondary technique to obtain
primary patterns (a calibration set) to analyze substances" NIRS can be used
in a laboratory for routine scanning of samples, but continual monitoring is
necessary to ensure accurate results. This system for monitoring is detailed
by Shenk et al". Traditionally, NIRS has been used to determine the
composition of agricultural products, but today, it is also used in other areas,
such as the oil industry, pharmaceuticals, polymers, food industry, and clinical
95

laboratories". NIRS also has many advantages over traditional methods in that
it does not use chemical reactants and, thus, does not pollute the
environment'. Use of NIRS in chemical analysis has grown due to
development of computers and specific softwares in analytical techniques and
statistical tools". Near-infrared (NIR) techniques are quite suitable for short
wavelength (near NIR) range applications because of the inexpensive optical
sensors available today. Its other advantages include speed, simplicity, and
simultaneous measurement of a number of constituents"
In addition to the chemical composition of materials, near infrared
spectra are also influenced by the physical structure of material. The size and
shape of the particles, the voids between particles and the arrangement of
particles affect the extent of light transmission through a sample and thereby
influence the reflectance10 Near infra red reflectance spectroscopy is a non
destructive analytical technique for studying interactions between incident light
and a material surface". The technique was first developed more than three
decades ago for rapid moisture analysis of grains12 Now NIRS is the
dominant analytical technique used for grain and forage quality assessments.
Near - infrared reflectance spectroscopy is also used as an identification and!
or characterization technique in polymer and related industries13·15
Near-infrared (NIR) diffuse reflectance spectroscopy involves the
illumination of a spot on the sample with NIR light (750-2500 nm). The light is
partially absorbed and partially scattered, depending upon its interaction with
chemical components within the tissue, before being reflected back to a
96

detector". The instrumental setup and basic principle of the method is similar
to that of the double-sphere method, developed by Van den Akker12 et al. in
1966 and later refined and applied to establish the NIST (National Institute of
Standards and Technology) reflectance scale":".
Keyworth (1961) first demonstrated the analytical utility of NIR
spectroscopy for measurement of water in organic solvents, since water
strongly absorbs NIR radiation with a large absorption band centered at 5200
cm'. A band of NIR radiation is passed through the sample of interest, and
the amount of water present is calculated based on the absorbance of 5200
crn' radiation. Venz and Dickens (1989) also used NIR spectroscopy to follow
and quantify water uptake in various resin composite restorative materials.
In this work, our objective is to develop a method to determine the
DRC of rubber latex, which measures the variation of the NIR absorption in
the reflectance mode. This method is found to be accurate, fast, inexpensive,
user-friendly and adaptable to varying environmental conditions. The
correlation of NIR absorption with DRC is established and discussed.
4.2: NIR spectroscopy in agriculture and food sciences
Ben-Gera and Norris12 first described the potential of near-infrared
reflectance (NIRS) spectroscopy as a technique for routine quantitative
analysis of agricultural products. The technique has extensive applications for
the analysis of constituents of agricultural crops, feeds, and foods 19,23. Its
97

ability to accurately predict yield of field crops such as soybean or maize (Zea
mays L.) allows producers, economic agencies, and buyers to make decisions
with respect to crop management, pricing and available markets". Infrared
(IR) reflectance can provide an instantaneous, nondestructive, and
quantitative assessment of the crop's ability to intercept radiation and
photosynthesis" The input of reflectance into yield production models has
been shown to improve yield estimates":".
The amount of reflectance in the near IR (NIR) range is determined by
the optical properties of the leaf tissues: their cellular structure and the air-cell
wall-protoplasm-chloroplast interfaces". This technique is also used for
measuring the content of glucose in water and protein matrix. Infrared
technique is used for measuring glutamine, ammonia, lactate and glutamate in
aqueous solutions simuttaneously"?'. The most widespread use of this
technique has been for the determination of protein, moisture, starch, oil, Iipids
and cellulose in agricultural products such as grains and oil seeds".
Previous work has demonstrated the potential of NIR spectroscopy as
a tool for the rapid evaluation of detergent fiber, total dietary fiber, and the
components of dietary fiber in wheat bran mixtures, oat bran and diverse
cereal products":". NIR spectroscopy has also been investigated as a tool
for the evaluation of barley protein and moisture content and for the quality
evaluation of malt 40.42.
The NIR spectroscopy has been used to measure the contents of
various constitutes in dairy products such as milk, skim milk, milk powder,
98

whey and cheese43.54
, The NIRS is also used for the determination of soil
carbon55.59
, levels of ergovaline in tall fescue?", alkaloids and phenolics in
green tea'", phosphorus In sugarcane t.eaves'", vitamin content,
carbohydrates and fats 63,
4.3: NIR spectroscopy in medical and dental sciences
Combined with advanced data processing techniques, chemometric
analysis and fiber optic technologies, NIR spectroscopy has been applied to
biomedical fields and has demonstrated a substantial potential for diagnosing
diverse clinical otseases":". NIR spectroscopy is also an alternative method
for measurement of water sorption by dental materials".
NIRS is a continuous, noninvasive bedside technique that can be
used to monitor cerebral oxyqenation":", for conducting observational study
during carotid endarterectomy", determination of thresholds for severe
cerebral ischaemia during carotid surgery, measurement of cerebral blood
volume"·'8, blood flow index", blood flow and oxygen consurnption'",
noninvasive prediction of glucose in blood I tissue":", and detection of lipid
pool, thin fibrous cap, and inflammatory cells in human aortic atherosclerotic
plaque".
Near infra red reflectance spectroscopy (NIRS) is capable of rapidly
determining various chemical parameters of forages with a high degree of
accuracy"5.8'. NIRS has been successfully used to measure the composition

and quality of single species88~89 and mixed species forages90~92 as well as to
determine animal response".
4.4: Near Infrared absorption by molecules
Absorption of light by a sample at specific wavelengths is a
characteristic property of the sample The specific wavelengths absorbed by
a sample are determined by the electronic, vibrational and! or rotational
energy levels of the atomic and for molecular species present in the sample.
In the normal transmission mode one can apply the Beer- Lambert law to
determine the concentration of a specific analyte in the sample at a specific
wavelength, given by 9'.
A =E IC .... 4.1
where, at a specific wavelength, A is the measured absorbance, £ is the molar
absorption or the extinction coefficient ( M"cm"), I is the path length (cm) and
C is the analyte concentration. The relationship between Absorbance and
Transmittance T is given by97
A =-log T .....4.2
The Beer - Lambert law describes a linear relationship between absorbance
and concentration. The absorbance or transmittance in a sample can be
measured in the normal transmission mode of a UV-Vis-NIR
Spectrophotometer under normal circumstances.
100

Incident radiation
Sample
Sample
Transmitted radiation
Reflected radiation
Incident radiation
'.,
Fig 4.1: Through transmission and reflection modes of experimental set up
In addition to the normal transmission mode mentioned above, a UV-
Vis-NIR Spectrophotometer can also be used to measure the reflectance of
materials. Normal transmission and reflectance modes of measurement are
demonstrated in fig. 4.1. Reflectance refers to the intensity of light reflected
101

from the surface of a sample when light is incident at an angle larger than the
critical angle for the sample. Reflectance at a specific wavelength carries the
same information as the transmittance in the normal absorption mode.
Reflectance intensity is obtained by subtracting the absorbed intensity from
the incident intensity. It is much more convenient and accurate to measure
absorbance in the reflectance mode from samples that are highly absorbing or
scattering.
A diffuse reflectance spectrophotometer is similar to a standard UV
Vis-NIR Spectrophotometer, which can provide a bandwidth narrow enough to
record well resolved spectra, yet wide enough to cover the energy levels of
interest for the sample under test. A reflectance spectrophotometer must also
have necessary optics and electronic systems of high sensitivity, and should
be able to physically accommodate the reflectance accessories. Moreover,
the instrument should have capability to measure reflectance as the
wavelength is varied.
4.5: Experimental Method
First, we tried to record Near Infrared absorption spectra of natural
rubber latex samples using a Varian Make Carry 5000 UV-Vis-NIR
spectrophotometer in the normal absorption mode. It was noticed that the
absorbance is very high throughout this spectral range and it was not possible
to resolve any of the features of the absorption spectra in this mode. Then the
102

absorption spectrum in the same wavelength range was recorded in the
reflectance mode utilizing the Internal Diffuse Reflectance Attachment Model
ORA 2500 attached to the same spectrophotometer. The latex samples were
taken in rectangular Quartz cuvettes forthese measurements. The reflectance
spectra were recorded for several fresh latex samples. The spectra of the
same samples diluted with different percentages of water were also recorded
to understand the effect of dilution onthereflectance intensity.
Fig 4.2 Photograph of Varian Make Carry 5000 UV-Vis-NIR Spectrophotometer
We have used a vanan Make Carry 5000 UV-Vis-NIR
Spectrophotometer for conducting NIR reflectance studies on latex samples.
103

The spectrophotometer combines with PbS smart technology extending the
wavelength range into the NIR up to 3300 nm. The Carry 5000
spectrophotometer can be used for a range of applications from quantifying
out - of - band blocking characteristics of band pass filters to measuring the
high transmission of next generation fiber optic materials The Carry 5000
UV-Vis-NIR spectrophotometer is having a wavelength range from 175 to
3300 nm and floating aluminum casting for isolating the optics from external
disturbances. The PbS NIR detector used in this instrument provides
excellent signal to noise ratio and linearity for the instrument in the NIR region.
The Schwarzschild coupling optics employed in the instrument provides
maximum level of light throughput for more accurate measurements at low
transmission levels. The silica overcoating protects the optical system of the
instrument from the environment and allows cleaning the reflective surface
without any damage to it. The spectrophotometer is equipped with variable
and fixed slit arrangements for optimum control over data resolution and the
spectral bandwidth can be set down to 0.01 nrn. The slits can be fixed in the
NIR as well as the UV - Vis regions. The photometric noise and the effect of
stray light are optimized for excellent resolution using out - of - plane double
Littrow monochromator. The other feature of the Carry 5000
spectrophotometer is the advanced electronics system which can measure the
absorbance beyond 8 Abs with reference beam attenuation. The
spectrophotometer has separate nitrogen gas purge facility for
monochromator and sample compartments for creating a neutral atmosphere
104

during analysis. The lamps used in the instrument can be easily replaced and
are pre aligned requiring no adjustment. The lamp management electronic
ensures that a wide range of design can be accommodated.
Extending the PbSmart™ technology from the Cary 5000, the PbS NIR
detector is Peltier cooled and optimized in real time. This PbSmart technology
extends the performance of traditional PbS detectors. With Varian's Lock
down™ lever for installing accessories, one doesn't need any tools, saving
time. An internal ORA can be used with all of Varian's high end UV
instruments, so as to choose the detector options that best suit the needs.
Sample mounting options are provided as standard for the instrument. The
liquid sample holder is ideal for measuring the transmission of liquid samples.
It holds a standard 1 cm path length cuvette and mounts on the standard
poles. It can be placed over both the transmittance or reflectance port of the
internal ORA. When mounted in the reflectance position, it can be used to
measure the reflectance of powdered samples as well. The powder cell holder
allows for reflectance measurement of powder and paste samples. It fits in the
small sample holder and is mounted on the reflectance port of the internal
ORA This kit contains a pre-packed PTFE cell for use as a reflectance
standard, a powder cell holder for sample measurement, a funnel for easy
loading of powdered sample and small sample holder. Each cell has a quartz
window and can be used to measure samples across the 200-2500 nm
wavelength range. The powder cell holder is "plunger" operated allowing it to
105

accommodate a range of sample volumes, making it ideal for measuring small
amounts of sample. The minimum practical volume is approximately 100 rnm"
(which equates to a depth of 1 mm), and the maximum volume is
approximately 1 ern". However, this is dependent on the particle size and
opacity of the sample. The double aperture attachment is used in conjunction
with the Cary Win UV Validate software to measure the photometric accuracy
of the system. The double aperture attachment mounts onto the polarizer
mount which comes standard with the internal DRA.
The latex samples for all the experiments described in this work, were
collected from the Experimental Farm of Rubber Research Institute of India,
Kottayam, Kerala, India. The essential details of the trees from which latex
samples were collected are: Clone: RRII 105, Year of planting: 1989-93, D3
tapping system). Samples with wide variations in DRC were collected for
measurement. During sample collection 10-15 ml of each sample is collected
in two separate containers to determine their DRC values following the
standard laboratory drying procedure (gravimetric method) and from
reflectance measurements, as outlined above.
4.6: Treatment with adulterants
The DRC of latex forms the basis of payments to producers and hence
its accurate estimation is very important from a commercial point of view.
Comprehensive list of adulterants or treatments which have been used in
106
practice is not available, through several have been postulated by different
latex buyers". It is rather difficult to prove the use of adulterants in latex as
latex buyers find it difficult to separate the effect of adulterants from lower
ORC values of latex. So, even though use of adulterants is not proved beyond
doubts, latex buyers are always concerned about the possible use of
adulterants in latex. In this work we have carried out a systematic study with
five suspected adulterants, viz. coconut water, saturated salt solution, rice
effluent, rice water and ground water added to natural rubber latex. Latex
samples have been treated with three known concentrations (25 %, 50 %, and
75 %) of each adulterant and their reflectance measured using the UV-Vis
NIR spectrophotometer fitted with Internal ORA.
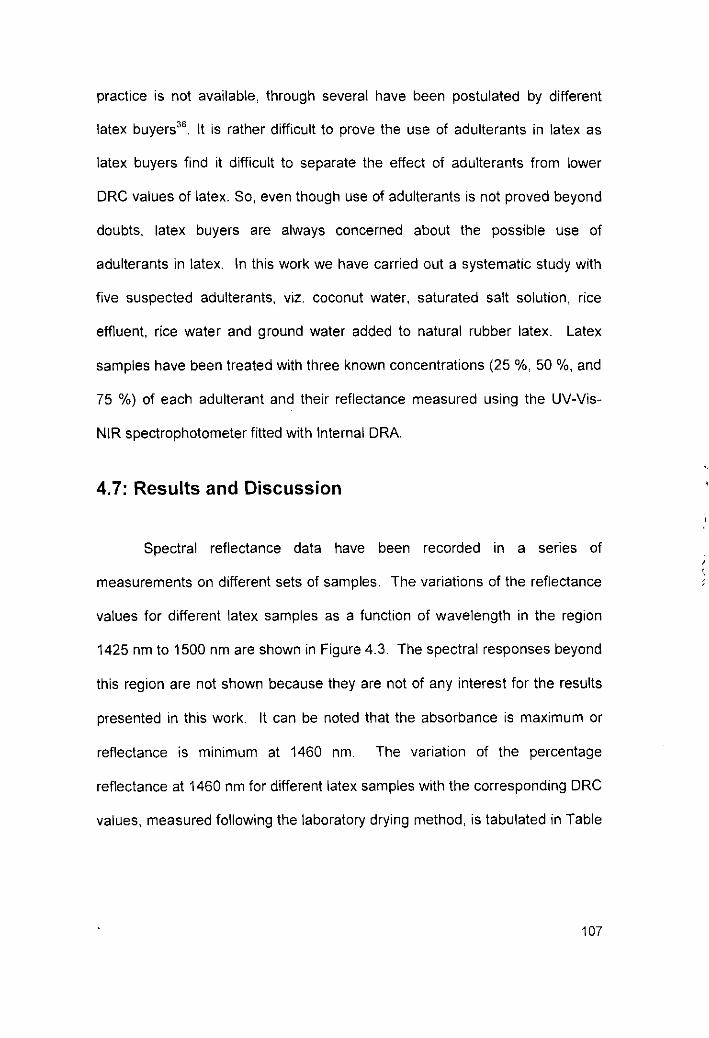
4.7: Results and Discussion
Spectral reflectance data have been recorded in a series of
measurements on different sets of samples. The variations of the reflectance
values for different latex samples as a function of wavelength in the region
1425 nm to 1500 nm are shown in Figure 4.3. The spectral responses beyond
this region are not shown because they are not of any interest for the results
presented in this work. It can be noted that the absorbance is maximum or
reflectance is minimum at 1460 nm The variation of the percentage
reflectance at 1460 nm for different latex samples with the corresponding ORC
values, measured following the laboratory drying method, is tabulated in Table
107

4.1, with the corresponding variation drawn in Fig. 4.4. The results are
analyzed using statistical tools and it is found that reflectance and the % ORC
values, as shown in Table 4.1 as well as Figure 4.4, possess a correlation
better than 0.95.
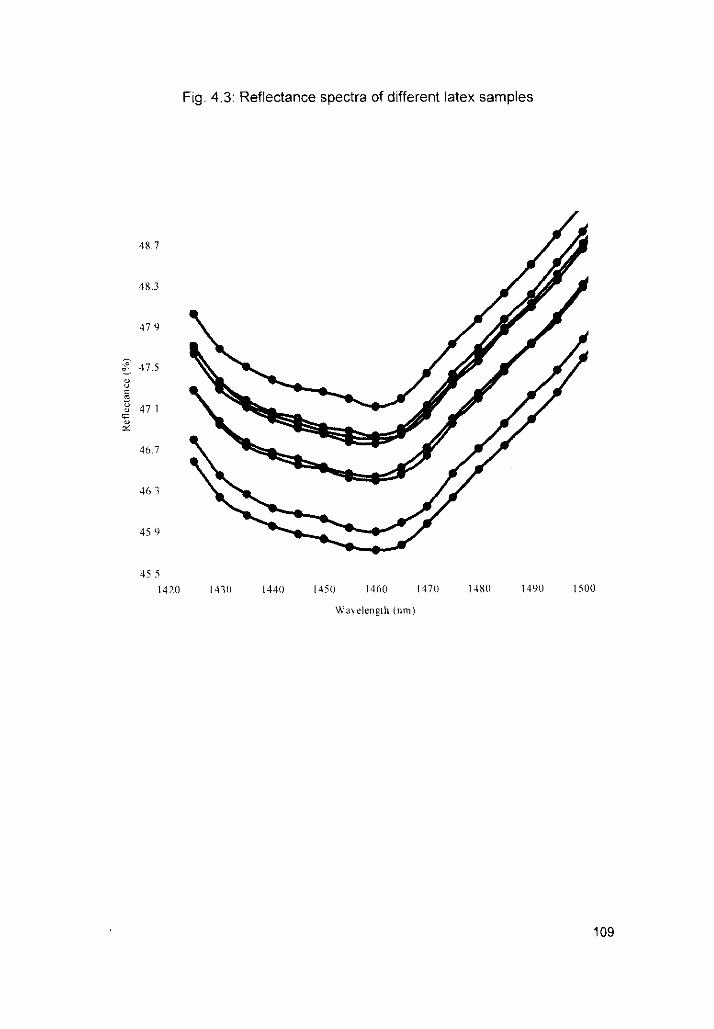
The reflectance values from latex samples after dilution with different
adulterants are tabulated in Table 4.2. Figures 4.5 to 4.9 show the reflectance
of latex samples diluted with different adulterants. Treatment of latex samples
with adulterants show that the reflectance decreases with increase in the
concentration of adulterants and thus no financial advantage would accrue by
doing this, if the ORC values are measured following this technique.
Measurements indicate that addition of adulterants would show up as a
decrease in ORC values. Uncertainties in these measurements have been
estimated from repeated measurements on the same sample. The estimated
uncertainties are ~ 0.6 %, with a coverage factor of 2, at a confidence level of
95%.
The very purpose of this work is to see whether there is a relation
between optical absorption and the ORC values of rubber latex. The spectral
reflectance measurements with the internal ORA of a high resolution UV-Vis
NIR Spectrophotometer have shown that latex sample absorbs infrared
radiation strongly around 1460 nm, which is due to the water molecules
present in the latex. The reflectance intensity from the sample decreases with
the increase of water content in the latex, and hence it is proportional to the
dry rubber content of the latex.
108
487
48.3
47.9
~ 47.5
"u"esU 47 1"'""'"
46.7
463
45.9
Fig. 4.3: Reflectance spectra of different latex samples
45.5
1420 1430 1440 1450 \460
Wavelength (1l1l1)
1470 1480 1490 1500
109

Table 4.1: Percentage Reflectance values in the Near IR region at 1460 nm
for samples with different DRe values (measured by gravimetric
method).
ORe (%) NIRSerial laboratory Reflectance
No. drying method (%)(2: 0.5%) (2:0.8%)
1 34.45 45.90
2 34.82 45.75- --
3 35.05 45.90
4 35.81 45.79
5 3639 4583f----~- ._----
6 37.34 46.21
7 38.61 46.03
8 39.28 46.33
9 41.51 46.27
10 44.35 46.89
11 44.77 46.86._-
12 44.89 46.91
13 46.43 46.74
14 4864 46.94f--
15 48.74 47.27---
110

Fig 4.4: Variation of % Reflectance with % ORe at 1460 nm in different latex
samples
48R2: 0.92
47.5
'"' 47t-'"'Vg46.5(!J..oV;;::: 46Va::
45.5
5035 40 45Dry Rubber Content (%)
45 -f-------r-------,-----.--------,
30
111

Table 4.2: Reflectance values of latex samples after dilution with different
adulterants
Name of No. of Reflectance (%) at wavelength 1460 nm
Adulterant treatment R, R, R3 R. Rs-
T, 3262 34.12 4708 47.34 48.13
T, 32.23 3389 47.29 47.48 48.47
A, T3 3137 32.12 46.70 46.57 47.84
T4 28.05 2829 43.90 4433 45.29
Ts 3215 3190 46.93 47.79 48.28
T6 30.94 31.30 45.86 4658 47.45
A, T7 28.37 30.29 43.18 44.77 45.18
T8 31.86 33.08 46.80 4768 4790
Tg 30.41 31.13 45.63 46.53 4651
A3 TlO 27.87 2788 42.47 44.01 4385
Tll 31.71 33.33 47.18 48.22 4823
T12 3116 32.11 46.58 47.64 4753
A4 T13 28.44 28.89 43.82 43.86 4464
T ' 4 3203 32.43 47.34 47.34 48.33
T , S 31.16 31.73 46.63 45.89 4786
As T ' 6 28.10 28.47 43.93 43.36 4556
DRe (%) of 38.65 39.00 43.17 43.58 44.35
unadulterated
samples-~-~.
A1 - ORDINARY WATER, A2 - COCONUT WATER, A3 - SATURATED SALT SOLUTION, A4
- RICE WATER, A5 - RICE EFFLUENT. R,- R5: Number of replications, T, : Unadultered latex
samples, T, - T , 6 : latex samples treated with adulterants. T2, r., T8 , T11, T14: 25%, h T6 , Tg,
T12, T15: 50%, T4 , T7, T lO, T13 , T16 : 75 %.
112

Fig 4.5: Variation of % Reflectance at 1460 nm diluted with ordinary water (in
%) to latex.
34RI =0.82
33
.-. 32~0'-' 31~0c
30t'Il....0~ 29lj:~
Cl::28
27
26o 20 40 60 80
%of water added to latex
113

Fig 4.6: Variation of % Reflectance at 1460 nm diluted with % coconut water
(in %) to latex.
34
33R2: 0.90
'"' 32~0'-'q)
310c\1J...0 30q)
q::q)
Cl:: 29
28
27o 20 40 60 80
%of coconut water added to latex
114

Fig 4.7: Variation of % Reflectance at 1460 nm diluted with saturated salt
solution (in %) to latex samples.
34
33 RI: 0,94
""' 32~; 310c
30ro...0ill 29q::ill
0::28
27
26o 20 40 60 80
%of saturated salt solution added to latex
115
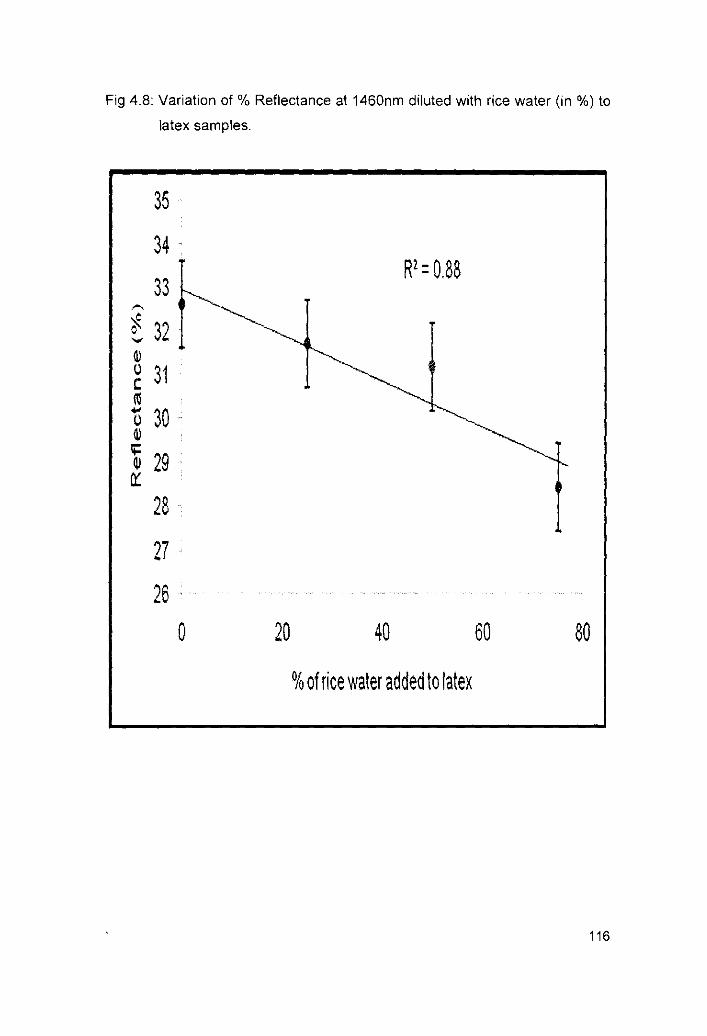
Fig 4.8: Variation of % Reflectance at 1460nm diluted with rice water (in %) to
latex samples.
35
34
33"'"'e~ 32IDo 31croo 30ID
~ 29Q:
28
27
26
o 20
R2: 0,88
40 60 80
%of rice water added to latex
116
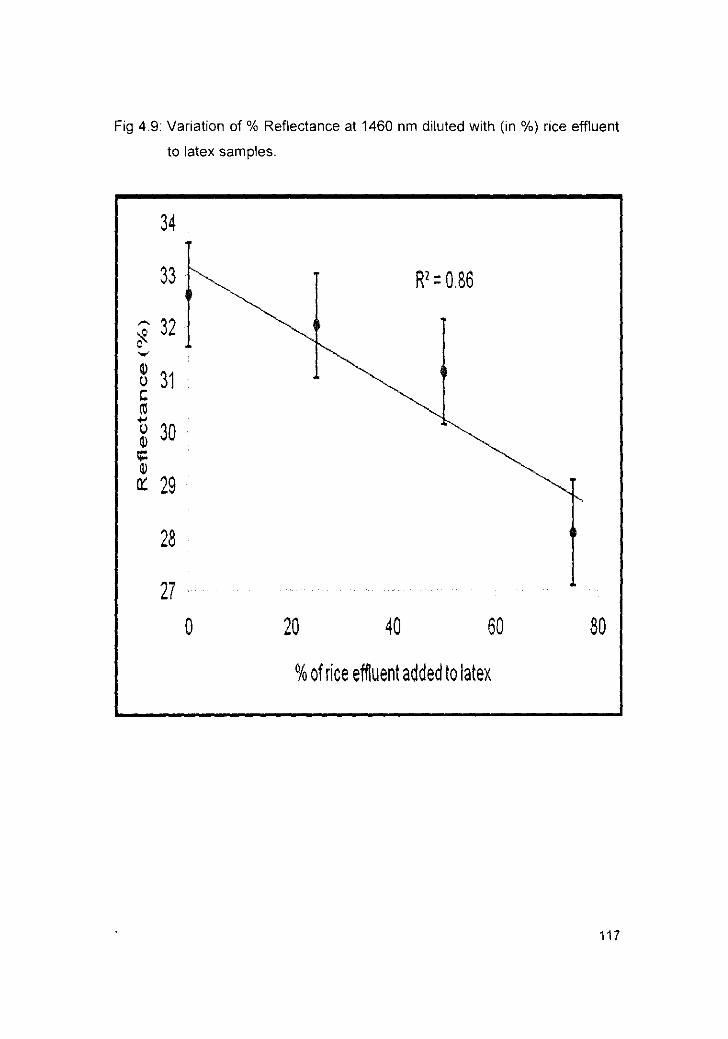
Fig 49: Variation of % Reflectance at 1460 nm diluted with (in %) rice effluent
to latex samples.
34
33 R2: 0.86
i 320
'"Q)
310c(C...0 30Q)q:Q)
a:: 29
28
27o 20 40 60 80
%of rice effluent added to latex
117

4.8: Conclusions
We have been able to establish a good correlation between % ORC
and reflectance of natural rubber latex samples in the near infrared region. It
is found that water molecules in the latex selectively absorb near infrared
radiation at specific wavelengths, which can be used as a technique to
estimate the ORC of natural rubber latex. Though we have been able to
establish the relationship between % ORC and % reflectance from latex, we
have not been able to bring out the influence of non rubber constituents on
reflectance in these measurements. The reflectance of latex with different
concentrations of adulterants decreases with the increase in concentration of
the adulterant Since the major contents of adulterants are again water, we
anticipate the reflectance values to decrease correspondingly with the addition
of such adulterants.
Based on the results obtained from the infrared absorption studies we
estimate that a viable ORC measurement system following this technique will
have measurement uncertainties in the range of :!: 1% due to various factors.
Measurement uncertainties can be further reduced by improving the signal to
noise ratio by increasing the radiant power, optimizing the detection
electronics and measurement procedures.
118

References
1. Burns, OR and Ciurczak, Eds. New York: Marcel Dekker (1992).
2. Mc Clure, Anal. Chem, (1994) 66: 43.
3. Shenk, J.S., and M.O. Westerhau, Forage Quality, Evaluation, and
Utilization, Madison (1994) 406 - 449.
4. Shenk, J.S., and M.O. Westerhaus, Analysis of Agriculture and Food
Products by Near Infrared Reflectance Spectroscopy, Infrasoft
International, Port Matilda, PA (1995).
5. Shenk, J.S., M.O. Westerhaus, and S.M. Abrams, Near Infrared
Reflectance Spectroscopy (NIRS): Analysis of Forage Quality.
Agriculture Handbook, USDA, Washington, DC (1989)
6. Hall, JW, and A. Pollard, Clin. Chem. (1992) 38:1623-1631.
7. Norris, K.H., Near Infrared Reflectance Spectroscopy (NIRS): Analysis
of Forage Quality. Agriculture Handbook, USDA, Washington, DC
(1989)
8. Moore, D.S., J.SWhite, and B.A Harbin, Anal. Chim. Acta (1994)
294:85 - 94.
9. Tsenkova, R, S. Atanassova, K. Toyoda, Y. Ozaki, K. Itoh and T.
Fearn, J Dairy Sci (1999) 82:2344 - 2351.
10. Wetzel, D.L., Anal. Chem (1983) 55:1165 A - 1176 A
119

11. Chen - Wen Chang, David A. Laird, Maurice J. Mausbach, and
Charles R Hurburgh Jr, Soil. Sci Soc. Am J (2001) 65:480-490.
12. Ben -Gera, I., and K.H. Nornes, tsr. J Agric, Res (1968) 18: 124 -132.
13. Craser, C.S and AM.C. Davies, Royal Soc. Chem, (1988) 1-171.
14. Murray, L and LA Cowe, Making light work: Advances in near infrared
spectroscopy, Weinheim, New York (1992)
15. Workman, JJ, Appl. Spec. Rev (1996) 31: 251-320.
16. Van Den Akker, J. A, et ai, J Opt. Soc. Am (1966) 56: 250-252.
17. Goebel, G. D., et ai, J Opt. Soc. Am, (1966) 56: 783-788.
18. Venable, H.W et ai, J Res. Natl. Bur Stand (1977) 82: 29-55.
19. Williams, P.C., and KH Norries, Near Infrared technology in the
agricultural and food industries. American Association of cereal
Chemists, si. Paul, MN (1987).
20. Williams, P.C., Near Infra red technology in the agricultural and food
industries, 2"d edition, Am. Asso. Of cereal chemists, St. Paul. MN
(2001).
21. Martin, G.C, J.S. Shenk, and FE Barton, Near infrared reflectance
spectroscopy (NIRS): Analysis of forage quality. USOA Agri. Hand
book 643, US. Govt. Print Office, Washington DC (1989).
22. Osborne, B.G., T. Fearn and PH Hindle, Practical NIR Spectroscopy
with applications in food and beverage analysis. Longman Scientific
and Technical, Harlow, UK (1993).
120

23. Roberts, CA, J.Workman, Jr. and J.B. Reeves Agron. Monogr, ASA,
CSSA, and SSSA, Madison, WI (2004) 44.
24. Ma, B. L, Lianne M. Dwyer, Carlos Costa, Elroy R Cober, and
Malcolm J. Morison. Agron. J (2001) 93:1227-1234.
25. Ma, B.L, M.J. Morrison, and LM. Dwyer. Agron. J (1996) 88:915
920.
26. Clevers, J., C Buker, HJ.C. Van Leeuwen, and BAM. Bourman,
Remote Sens. Environ (1994) 50:161-170.
27. Clevers, J Remote Sens. Enviton (1997) 61: 221-228.
28. Kumar, R, and L Silva., Appl. Optics (1973) 12: 2950-54.
29. Hazen KH, Arnold MA, Small GW, Appl Spectrosc (1998) 52: 1597
1605.
30. Marquardt, LA, Arnold, MA, Small, GW, Anal Chem (1993)
65:3271-3278.
31. Chung H, Arnold MA, Rhiel M, Murhammer, D.W, Appl Spectrosc
(1996) 50270-276
32. Reeves, J.B and C.M. Zaot., J Agr;c Food Chem (1998) 46:3614
3622.
33. Baker, D., Ceral Chem (1983) 60 217-219.
34. Horvath, L, K.H. Norries, M. Horvath - Masonyi, J. Rigo, and E.
Hegedus - Volgesi, Acta Aliment (1984) 13: 355-382
35. Williams, P.C, H.M. Cordeiro, and M.FTHarnden, Cereal foods world
(1991) 36 571-574
121

36. Kays, SE, W.R. Windham, and F.E. Barlon, J Agrie. Food Chem
(1996) 44 2266 - 2271.
37. Kays, SE, W.R. Windham and FE Barton, J Agrie. Food Chem
(1998) 46 854 - 861.
38. Kays, SE and FE. Barton, J Agrie. Food Chem (2002) 50: 3024
3029
39. Archibald, DD and SE Kays, J Agrie. Food Chem (2001) 48: 4477
-4486.
40. Angelino, SAG.F, MBAA Teeh. Quart (1986) 33: 170 -172.
41. Henry, RJ., J inst. Brew (1985) 91: 393 - 396.
42. Lu, MO, La' Brien and I.M. Stuart, Aust. J Agrie. Res. (2000) 51:
247 - 258.
43. Baer, R J, J. F. Frank, and M. Loewenstein, J AOAC (1983) 66:858
863.
44. Baraba'ssy. S. P and S. Turza, Near Infrared Speetroscopy: The
Future Waves. AM.C. Davies and P Williams, ed. NIR Publ,
Chichester, United Kingdom (1996) 611-616.
45. De Boever, J. L, G. Huyghebaert, CH Boucqe and G. De Groote,
Ptoc. 3rd tn: Conf, Near Infrared Spectrose (1990) 279.
46. Dyaz-Carrillo. E., A. Munoz-Serrano, A. Alonso-Moraga, and J.M.
Serradilla-Manrique, J Near Infrared Spectrosc (1993) 1:141-146.
47. Pierce, M. M. and R L Wehling, J Agric. Food Chem (1994) 42:2830
- 2835.
122

48. Pouliot, M., P. Paquin, R. Martel, S. F. Gauthier, and Y. Pouliot, J.
Food Sel (1997) 62:475-478
49. Saputra, D., F. E. Payne, R. A. Lodder, and S. A. Shearer, Trans
ASAE (1992) 35:1597-1605
50. Sato, T., S. Kawano, and M. Iwamoto, J.Dairy Sci (1990) 73:3408
3413.
51. Sato, T., M. Yoshino, S. Farukawa, Y. Someya, N. Yano, J. Uozumi,
and M. Iwamoto, Jpn. J. Zooteeh. Sel (1987) 58698 -706.
52. Wiltrup, C., and L. Norgaard, J. Dairy Sel (1998) 81:1803-1809.
53. H. M. AI-Quadiri, etal, J Dairy Sel (2008) 91: 950 - 958.
54. S. Sivakesava and J. Irudayaraj, J. Dairy Sei (2002) 85: 487-493.
55. Dalal, R.C. and R.J. Henry, Soil Sel. Soc. Am. J (1986) 50:120-123.
56. Meyer, J.H., S Afr. Tydskr. Plant Grond (1989) 6:59-63.
57. Janik, L.J. and J.O. Skjemstand, Aust. J. Soil Res (1995) 33:637-650.
58. Reeves, J.B., G.W. McCarty, and J.J. Meisenger, J. Near Infrared
Speetrose (1999) 7:179-193.
59. Reeves, J.B., G.W. McCarty, and V.B. Reeves, J. Agrie. Food Chem
(2001) 49:766-772.
60. Roberts, CA, RE Joost, and G.E. Rottinghaus, Crop Sel (1997) 37:
281-284.
61. Schulz, H., et ai, J. Agric. Food Chem (1999) 47:5064-5067.
62. Ming Chen, et ai, Agron. J (2002) 94:1324-1331.
123

63. Pires, F. F., M. C. Lemos, J. C Petersen and A M. Kessler, J. Appl.
Poul/. Res (2001) 10:412-418.
64. Jing Wang, et ai, Journal of the American College of Cardiology (2002)
39(8) : 1305-1306.
65. Hiroshi Shitomi and Ichiro Saito. National Metrology Institute of Japan
(NMIJ), National Institute of Advanced Industrial Science and
Technology Ibaraki, JAPAN p1.
66. Wetzel, D.L., Anal. Chem (1983) 55:1165 A -1176 A.
67. H.W. Venable, et ai, J. Res. Natl. Bur Stand (1977) 82: 29-55.
68. Watson, C, Anal Chemistry (1977) 49: 835 A
69. Wetzel, D.L., Anal Chemistry (1983),55: 1165 A
70. Kirkpatrick, P J, Lam, J., AI- Rawi et ai, J Neurosurg (1998) 89:389
94.
71. Dempsey, R, Davis, D.G., Buice, RG, and Lodder, RA, Appl.
Spectroscopy (1996) 50:18A-34A
72. AM. Diaz-Arnold, MA Arnold, and V.D. Williams, J Dent Res (1992)
71 (3): 438-442.
73. Timothy Lovelli, A., Huw Owen-Reece, Clare E. Elwell, Martin Smith,
and John C. Goldstone, Anesth Analg (1999) 88: 554.
74. Levy w.J, Levin, S and Chance, B., Anesthesiology (1995) 83:738
46.
75. Mason PF, Dyson EH, Sellars V, Beard, J. D, Eur J Vasc Surg (1994)
8:590-594.
124

76. Kirkpatrick PJ, Smielewski P, Whitefield PC, et al,J Neurosurg (1995)
82756-63
77. Gupta, A.K, Menon, OX, Czosnyka, M, et ai, Br J Anaesth (1997)
78:39 - 43.
78. Hopton, P, T. S Walsh, and A Lee, J Appl Physiol (1999) 87 1981
1987,8750-7587/99.
79. Patrick Meybohm, et ai, Clay Minerals (2000) 35 (5): 753-761.
80. De Blasi, R A, M. Ferrari, A Natali, G. Conti, A. Mega and A.
GaspareUo, Heart (2006) 921678-1685.
81. Jagemann K, Fischbacher C, Oanzer K, Muller Ua and Mertes B. Z.,
Phys Chem (1995) 191:179-190.
82. Stephen F. Malin, et ai, Clinical Chemistry (1999) 45 (9): 1651-1658
83. Malin S.F, Ruchti. T.L, Blank TB, Thennadi, S.N and Monfre, S.L.,
Clin Chem (1999) 45:1651-1658
84. Pedro R Moreno, et ai, Circulation (2002) 105923-927
85. Marten, G. C, et al, Crop Sci (1984) 24:1179.
86. Marten, G. C., J L. Halgerson and J. H. Cherney, Crop Sci (1983)
23:94.
87. Norris, K. H., R F. Barnes, J. E. Moore and J. S. Shenk, J Anita Sci.
(1976) 43889.
88. Shenk, J. S., M. 0 Westerhaus and M. R Hoover, J Dairy Sci (1979)
62:807.
89. Burdick, 0, F E. Barton and B. 0 Nelson, Agric. J (1981),73: 399.
125
90. Moe. A. J and S. B. Carr, J DairySci(1984) 67:1301.
91. Bengtson, Sand K. Larsson, J. Sci. Food Agric (1984) 35:951.
92. Colerman, S. W, F. E. Barton, and R. D. Meyer, Crop Sci (1985)
25:834.
93 Eckman, D. D., J S. Shenk, P. J. Wangsness, and M. O. Westerhaus,
J. Dairy Sci (1983) 66:1983.
94. Burns, OR. and Ciurczak, Handbook of Near Infrared Analysis, Marcel
Dekker, New York (1992).
95. Douglas A. Skoog, James Hollar, F and Timothy A., Nieman Principles
of Instrumental Analysis, Harcourt Brace College PUblishers, Chicago
(1998) 422.
96. Rubber Research Institute of Malaysia, Plrs" Bull (1974) 130: 21-29.
126