ncsa blue waters visualization course - osc
TRANSCRIPT
NCSA Blue Waters Visualization Course
Han-Wei Shen Department of Computer Science and Engineering
The Ohio State University
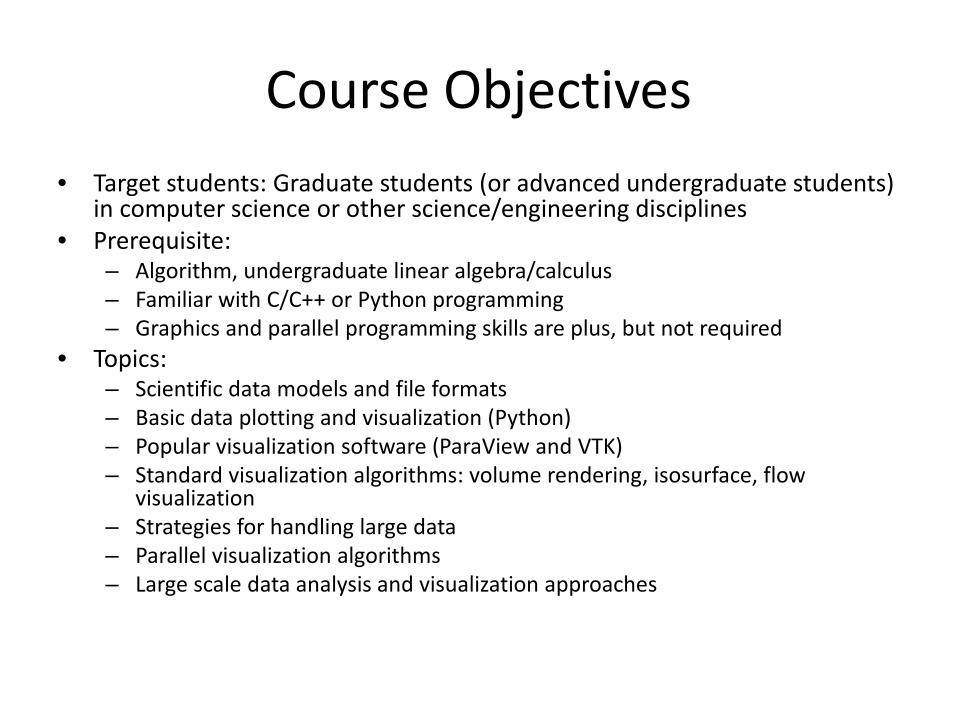
Course Objectives • Target students: Graduate students (or advanced undergraduate students)
in computer science or other science/engineering disciplines • Prerequisite:
– Algorithm, undergraduate linear algebra/calculus – Familiar with C/C++ or Python programming – Graphics and parallel programming skills are plus, but not required
• Topics: – Scientific data models and file formats – Basic data plotting and visualization (Python) – Popular visualization software (ParaView and VTK) – Standard visualization algorithms: volume rendering, isosurface, flow
visualization – Strategies for handling large data – Parallel visualization algorithms – Large scale data analysis and visualization approaches
Class Schedule
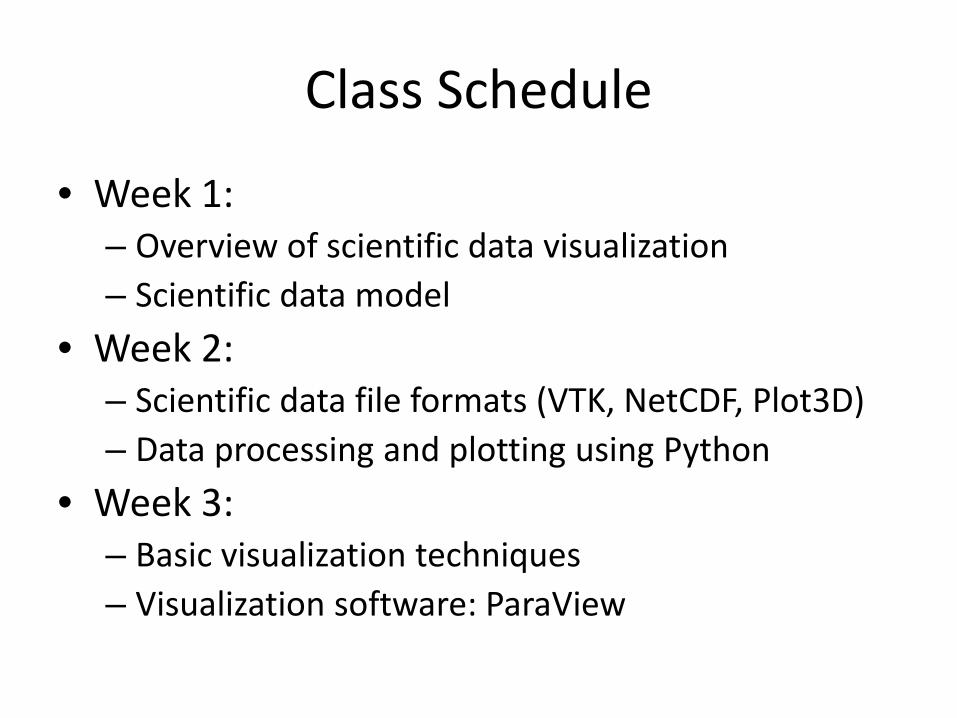
• Week 1: – Overview of scientific data visualization – Scientific data model
• Week 2: – Scientific data file formats (VTK, NetCDF, Plot3D) – Data processing and plotting using Python
• Week 3: – Basic visualization techniques – Visualization software: ParaView
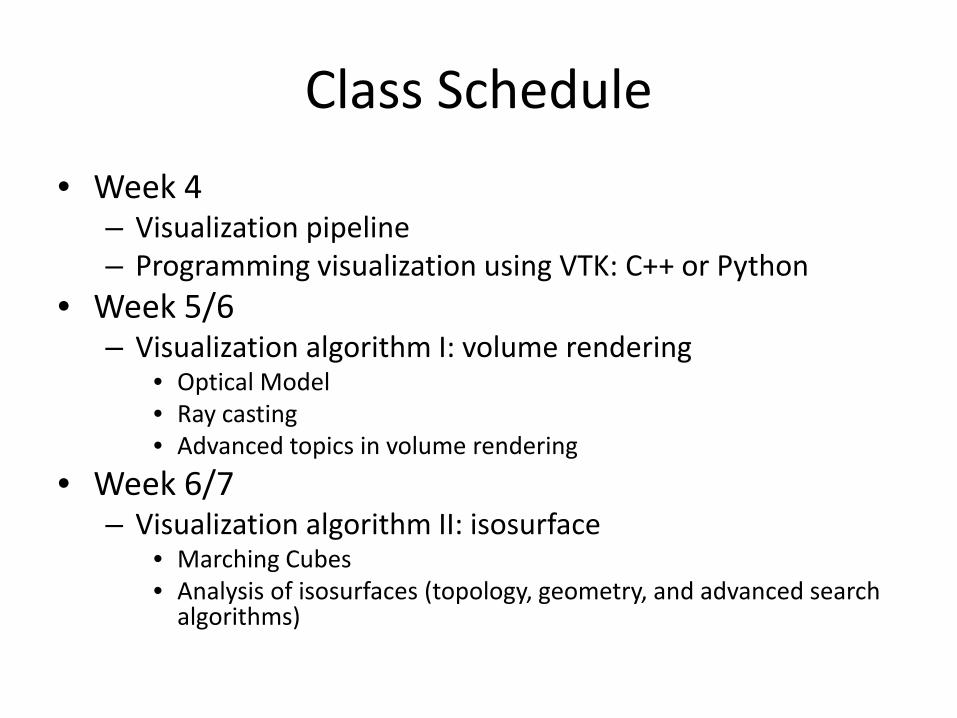
Class Schedule • Week 4
– Visualization pipeline – Programming visualization using VTK: C++ or Python
• Week 5/6 – Visualization algorithm I: volume rendering
• Optical Model • Ray casting • Advanced topics in volume rendering
• Week 6/7 – Visualization algorithm II: isosurface
• Marching Cubes • Analysis of isosurfaces (topology, geometry, and advanced search
algorithms)

Class Schedule
• Week 8/9 – Visualization algorithm III: flow visualization
• Particle tracing and numerical integration • Flow texture generation • Advanced flow analysis
• Week 9/10 – Strategies for handling large data sets
• Level of detail • Data partitioning and distribution • Out-of-core processing • Parallel computation • Query-driven processing
Class Schedule
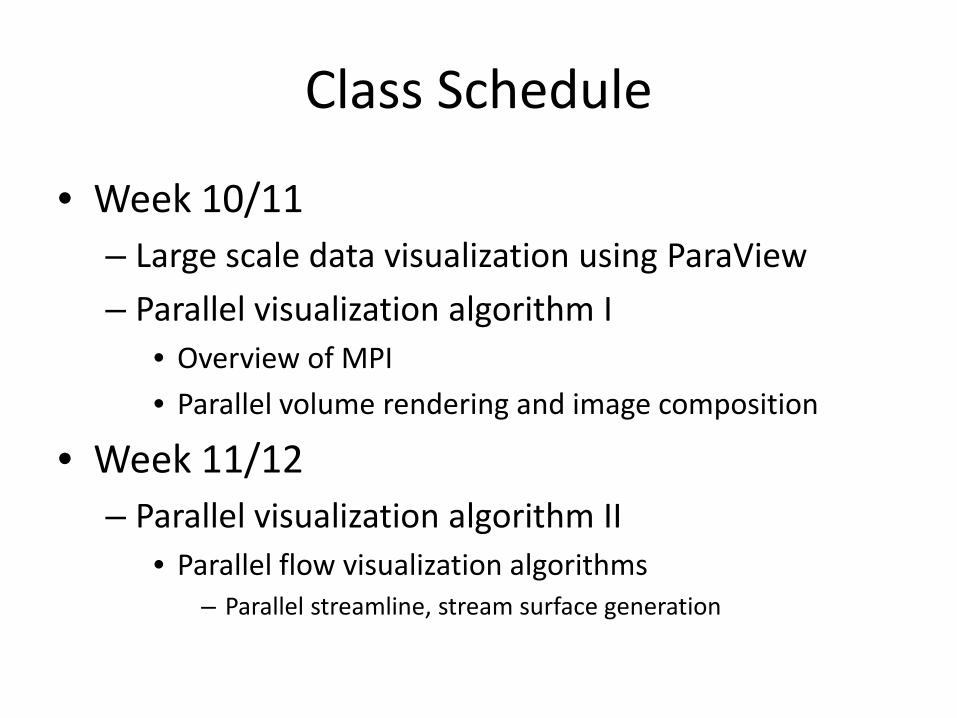
• Week 10/11 – Large scale data visualization using ParaView – Parallel visualization algorithm I
• Overview of MPI • Parallel volume rendering and image composition
• Week 11/12 – Parallel visualization algorithm II
• Parallel flow visualization algorithms – Parallel streamline, stream surface generation
Class Schedule
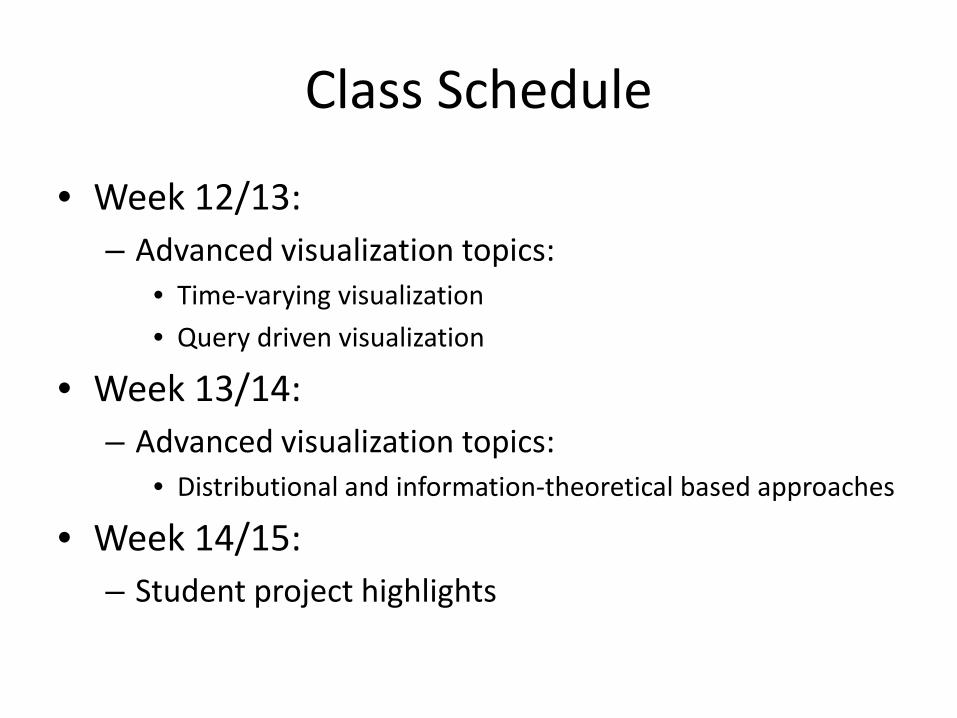
• Week 12/13: – Advanced visualization topics:
• Time-varying visualization • Query driven visualization
• Week 13/14: – Advanced visualization topics:
• Distributional and information-theoretical based approaches
• Week 14/15: – Student project highlights
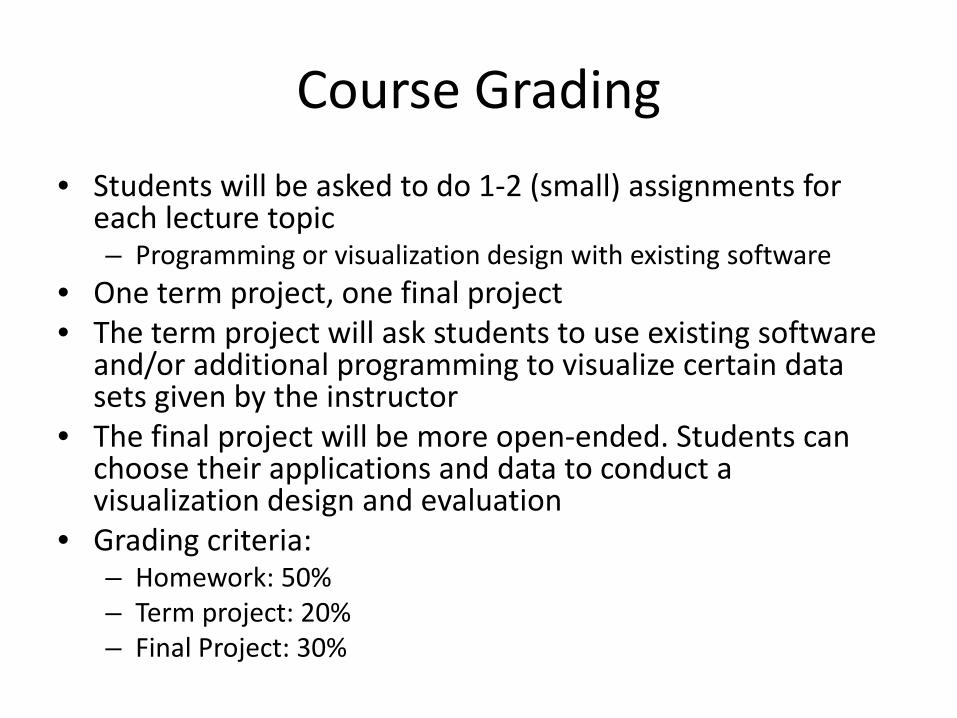
Course Grading • Students will be asked to do 1-2 (small) assignments for
each lecture topic – Programming or visualization design with existing software
• One term project, one final project • The term project will ask students to use existing software
and/or additional programming to visualize certain data sets given by the instructor
• The final project will be more open-ended. Students can choose their applications and data to conduct a visualization design and evaluation
• Grading criteria: – Homework: 50% – Term project: 20% – Final Project: 30%
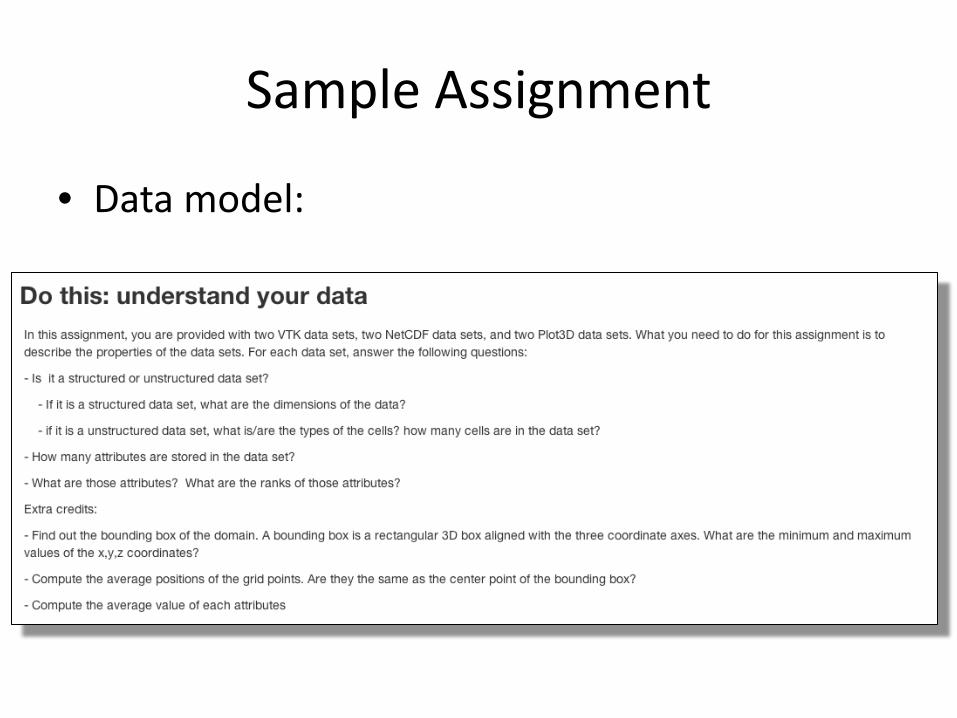
Sample Assignment
• Data model:
Sample Assignment
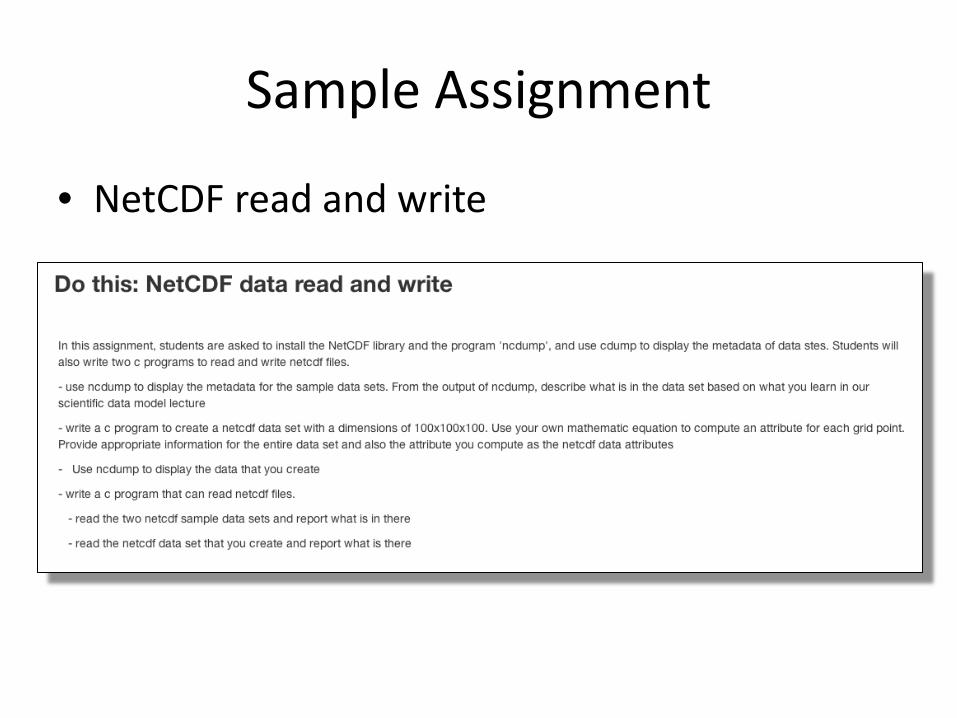
• NetCDF read and write
Sample Assignment
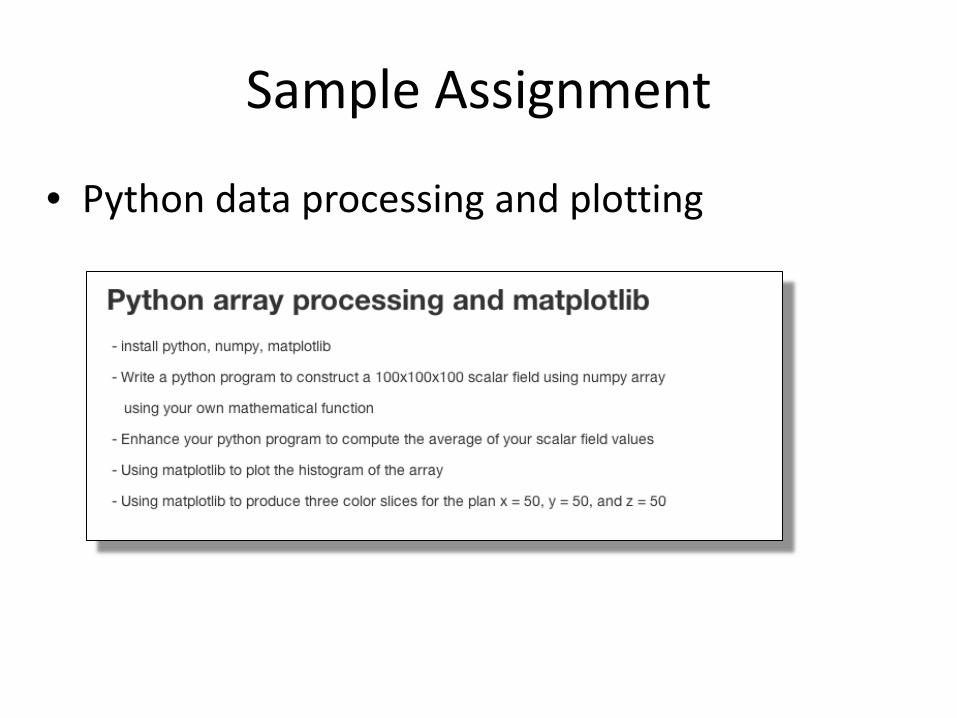
• Python data processing and plotting
Sample Assignment
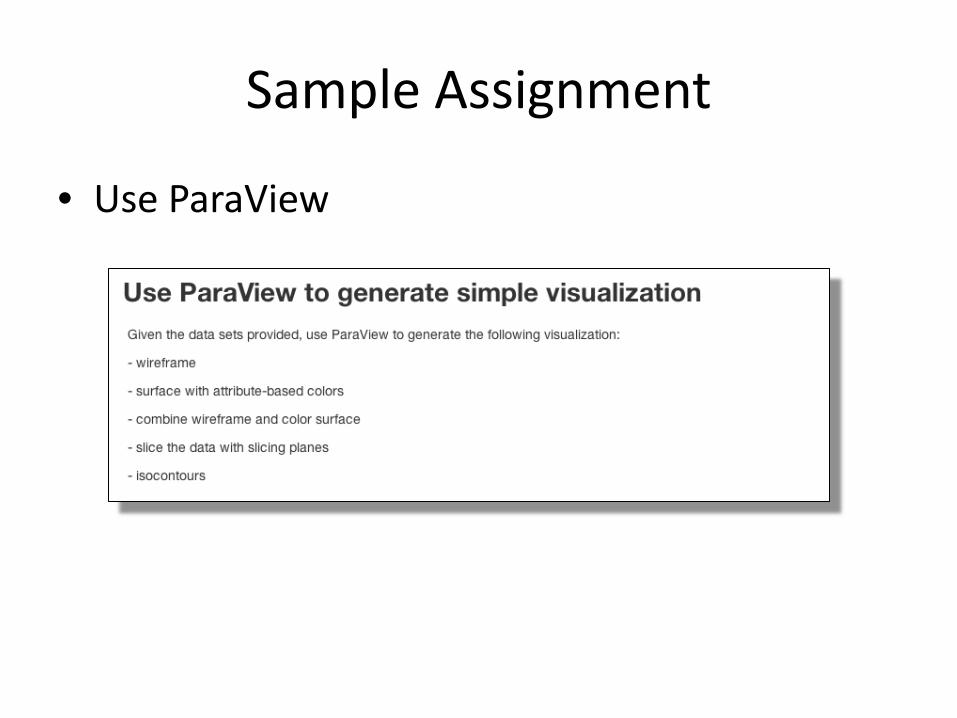
• Use ParaView

Sample Course Slides

Scientific Data Model
Han-Wei Shen The Ohio State University
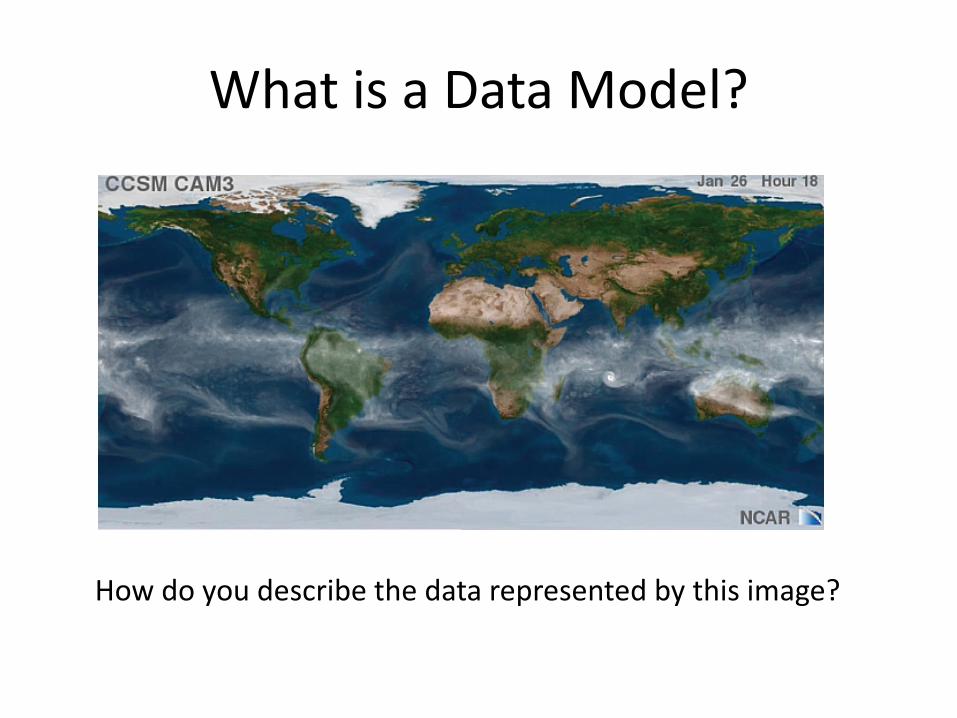
What is a Data Model?
How do you describe the data represented by this image?
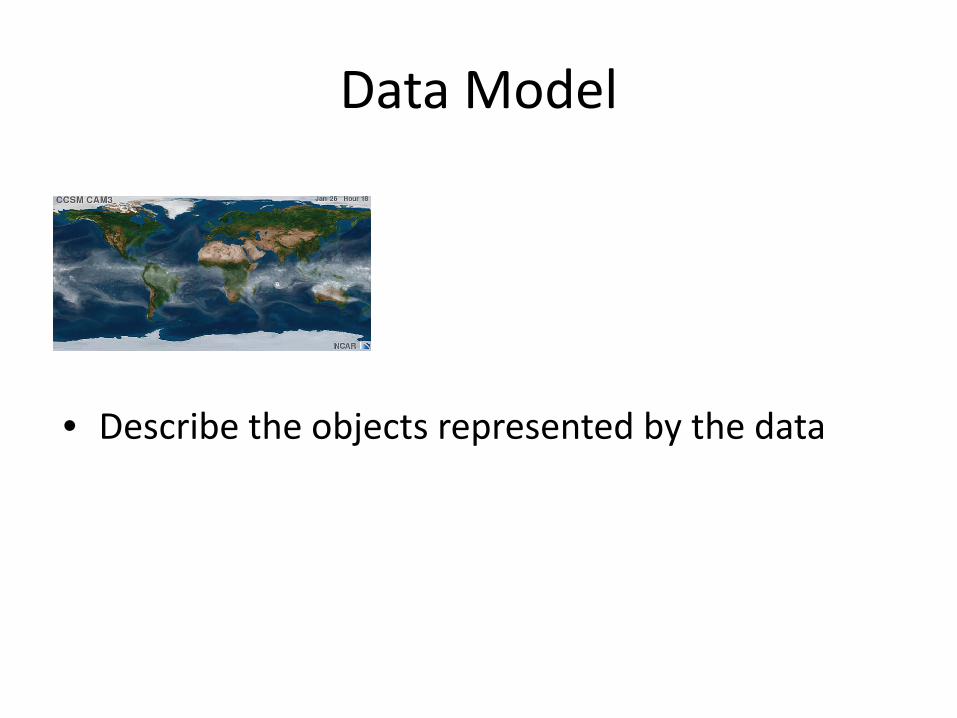
Data Model
• Describe the objects represented by the data
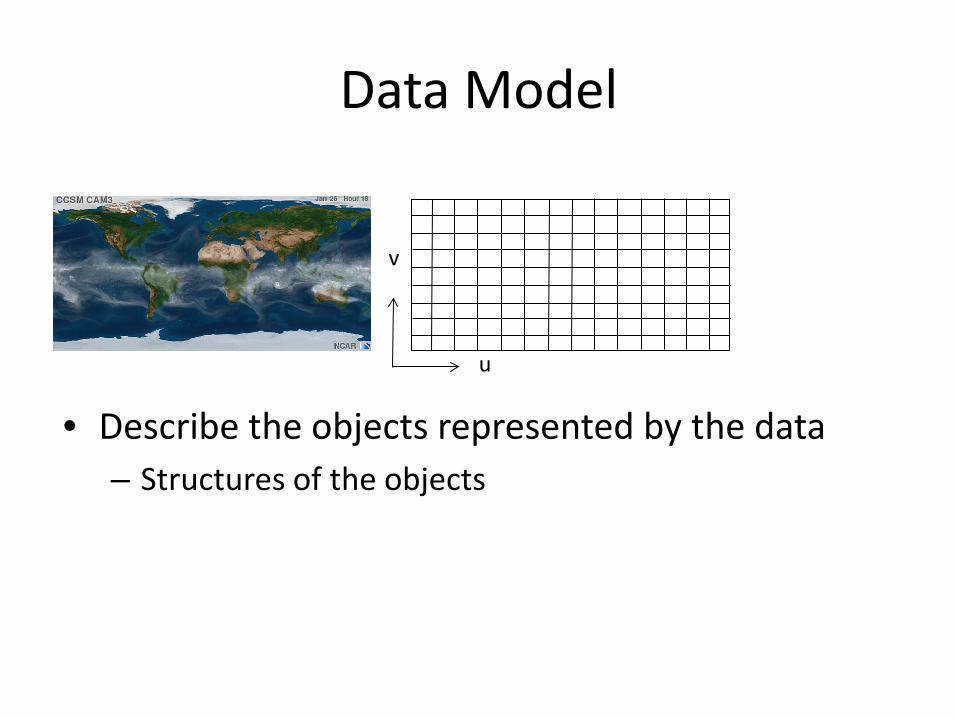
Data Model
• Describe the objects represented by the data – Structures of the objects
u
v
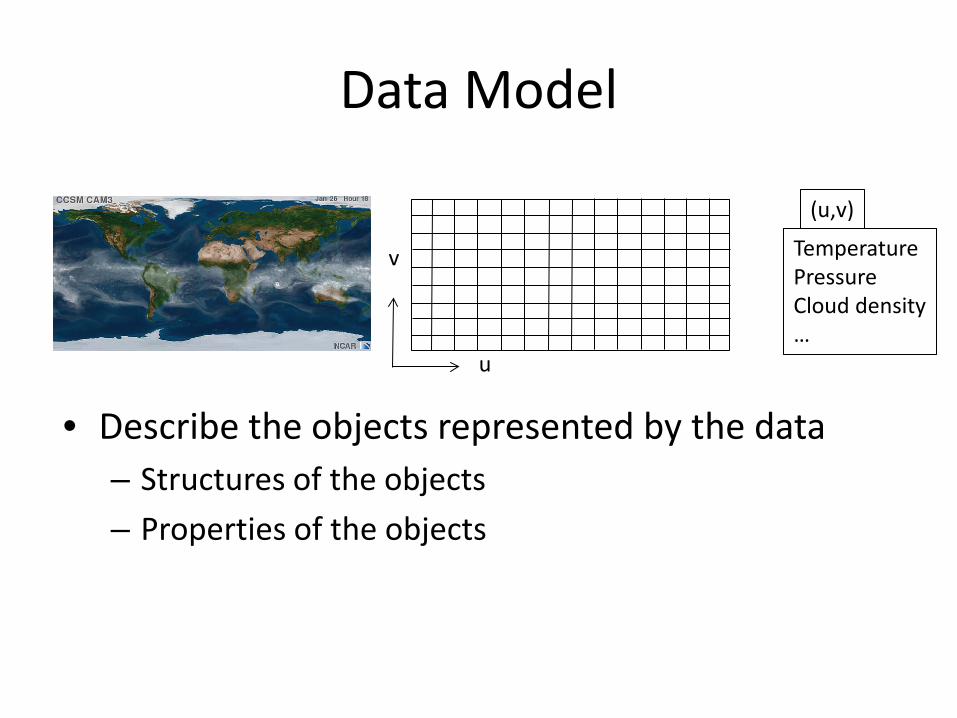
Data Model
• Describe the objects represented by the data – Structures of the objects – Properties of the objects
u
v Temperature Pressure Cloud density …
(u,v)

Data Model
• Describe the objects represented by the data – Structures of the objects – Properties of the objects – Relationships between the objects
u
v Temperature Pressure Cloud density …
(u,v)
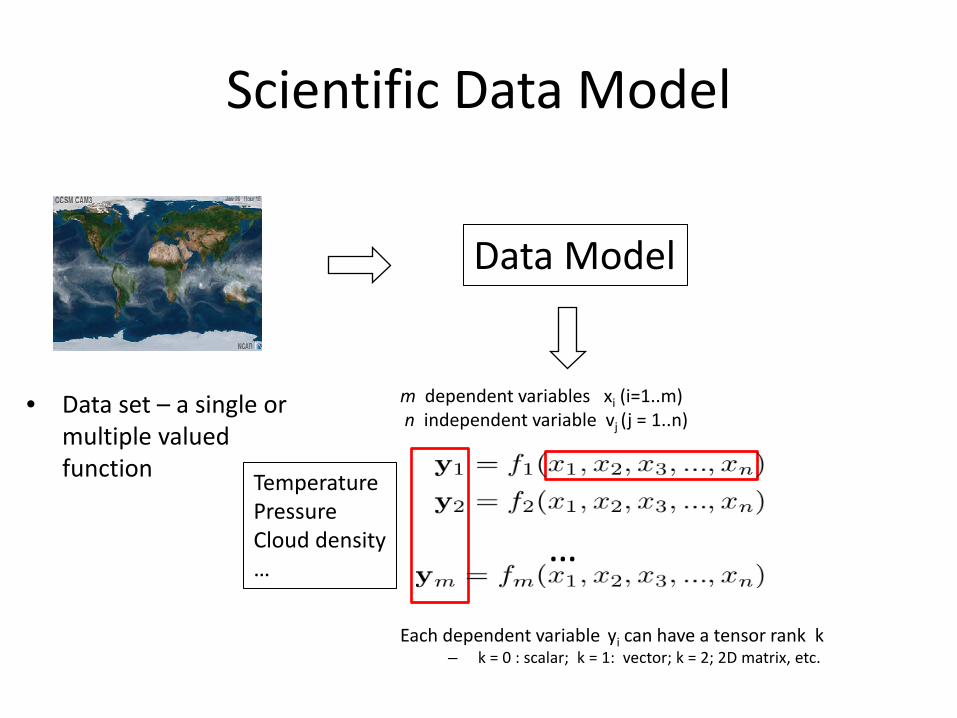
Scientific Data Model
Temperature Pressure Cloud density …
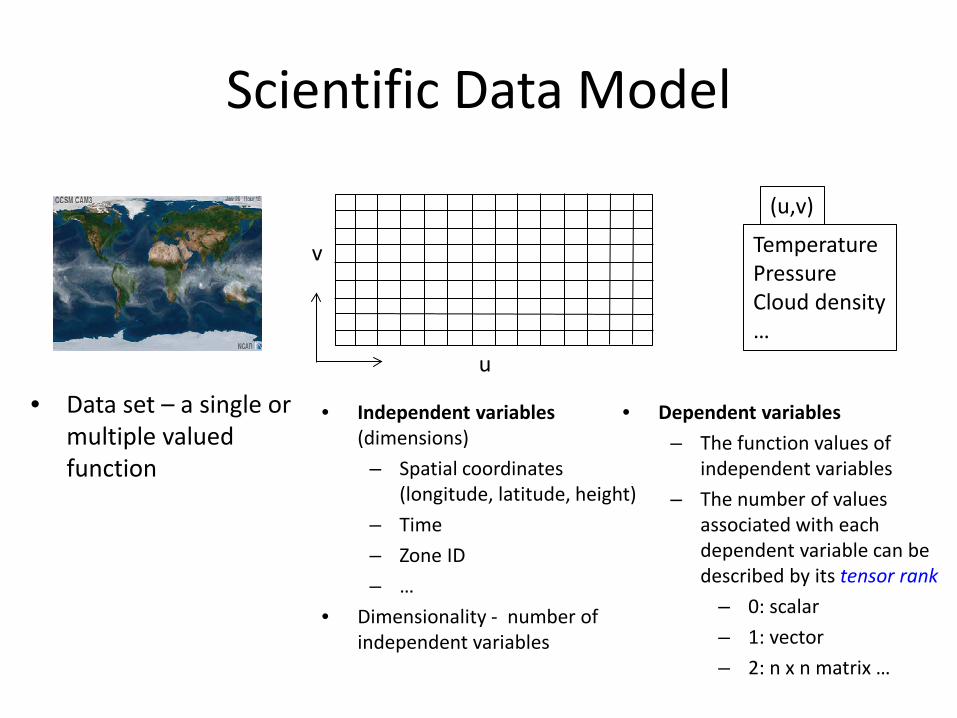
• Data set – a single or multiple valued function
Data Model
m dependent variables xi (i=1..m) n independent variable vj (j = 1..n)
Each dependent variable yi can have a tensor rank k
– k = 0 : scalar; k = 1: vector; k = 2; 2D matrix, etc.
…
Scientific Data Model
• Independent variables (dimensions)
– Spatial coordinates (longitude, latitude, height)
– Time – Zone ID – …
• Dimensionality - number of independent variables
u
v
• Data set – a single or multiple valued function
Temperature Pressure Cloud density …
(u,v)
• Dependent variables – The function values of
independent variables – The number of values
associated with each dependent variable can be described by its tensor rank
– 0: scalar – 1: vector – 2: n x n matrix …
Scientific Data Set
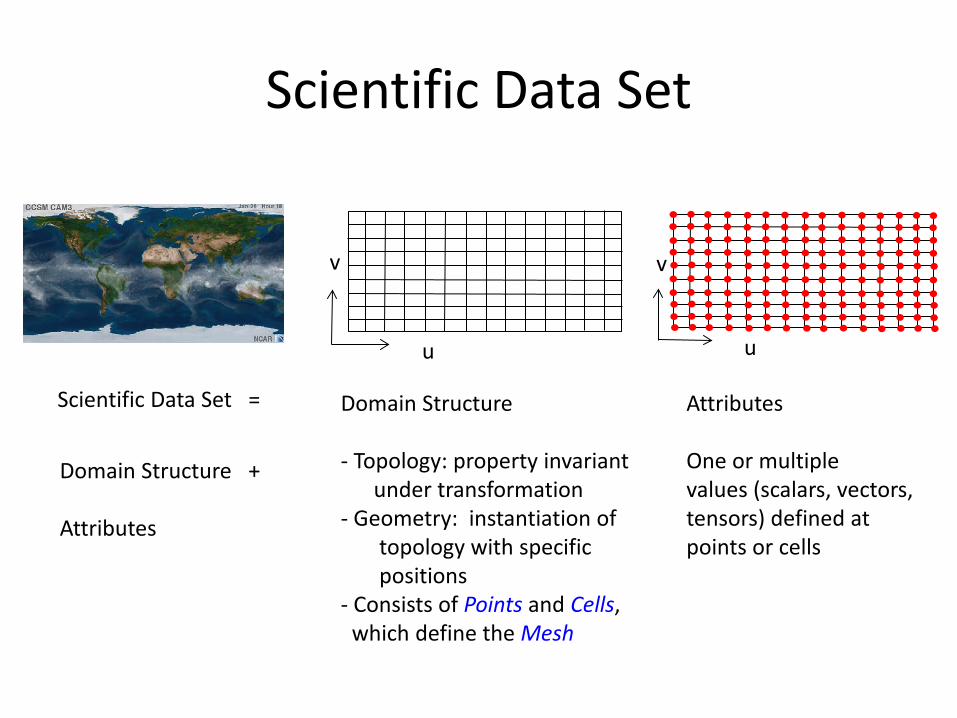
Scientific Data Set =
u
v
Domain Structure - Topology: property invariant under transformation - Geometry: instantiation of topology with specific positions - Consists of Points and Cells, which define the Mesh
u
v
Attributes One or multiple values (scalars, vectors, tensors) defined at points or cells
Domain Structure + Attributes
Domain Structure - Cell
u
v
u
v
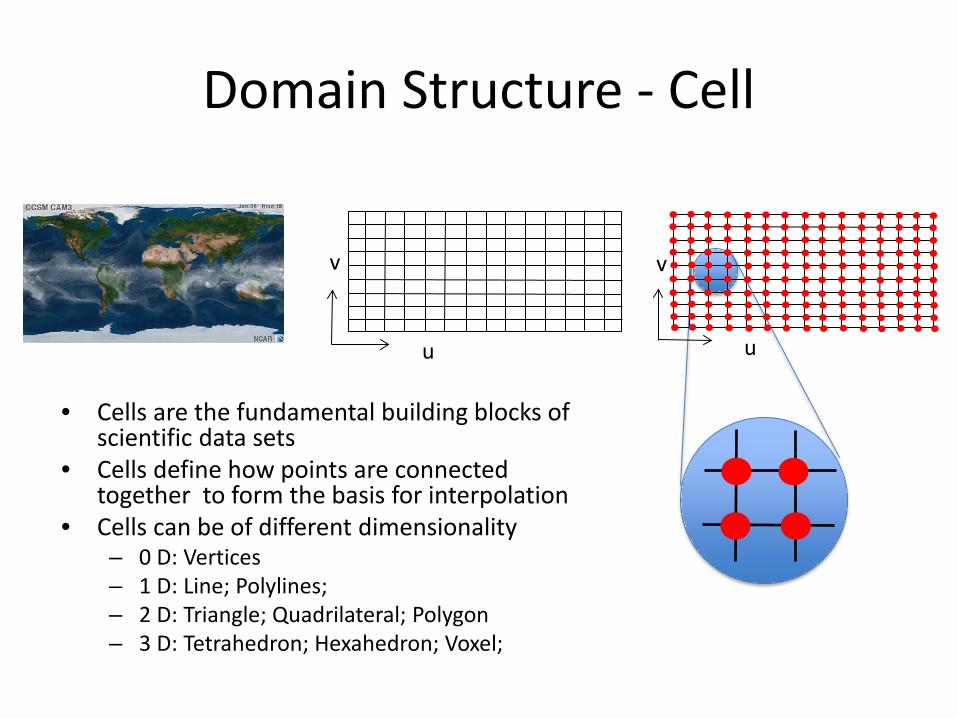
• Cells are the fundamental building blocks of scientific data sets
• Cells define how points are connected together to form the basis for interpolation
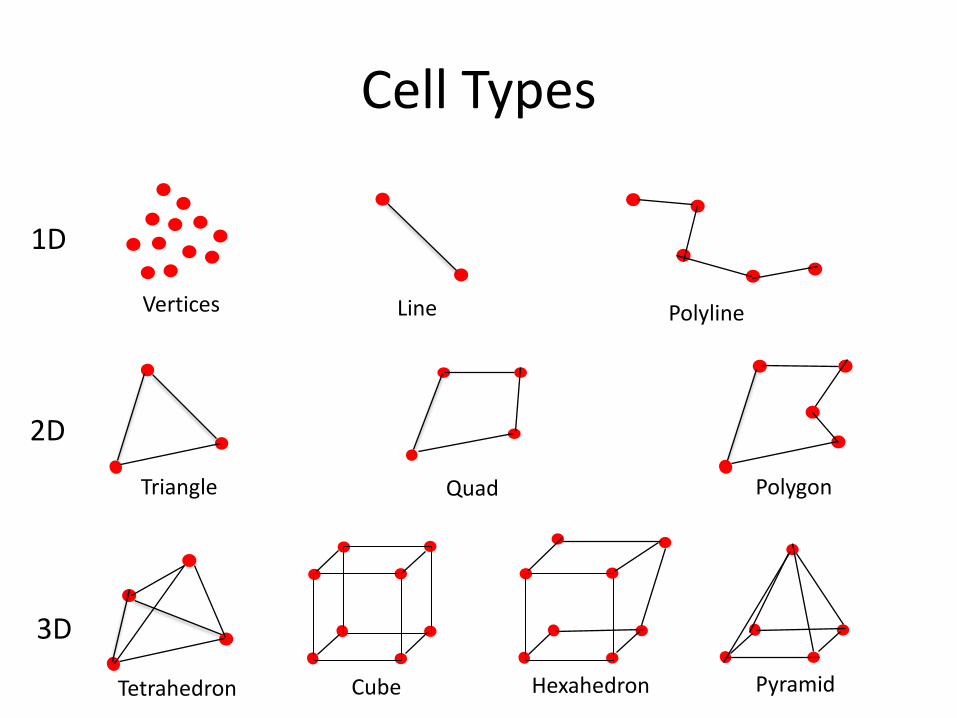
• Cells can be of different dimensionality – 0 D: Vertices – 1 D: Line; Polylines; – 2 D: Triangle; Quadrilateral; Polygon – 3 D: Tetrahedron; Hexahedron; Voxel;
Cell Types
Vertices Line Polyline
1D
Triangle Quad Polygon
2D
Tetrahedron Cube Hexahedron Pyramid
3D
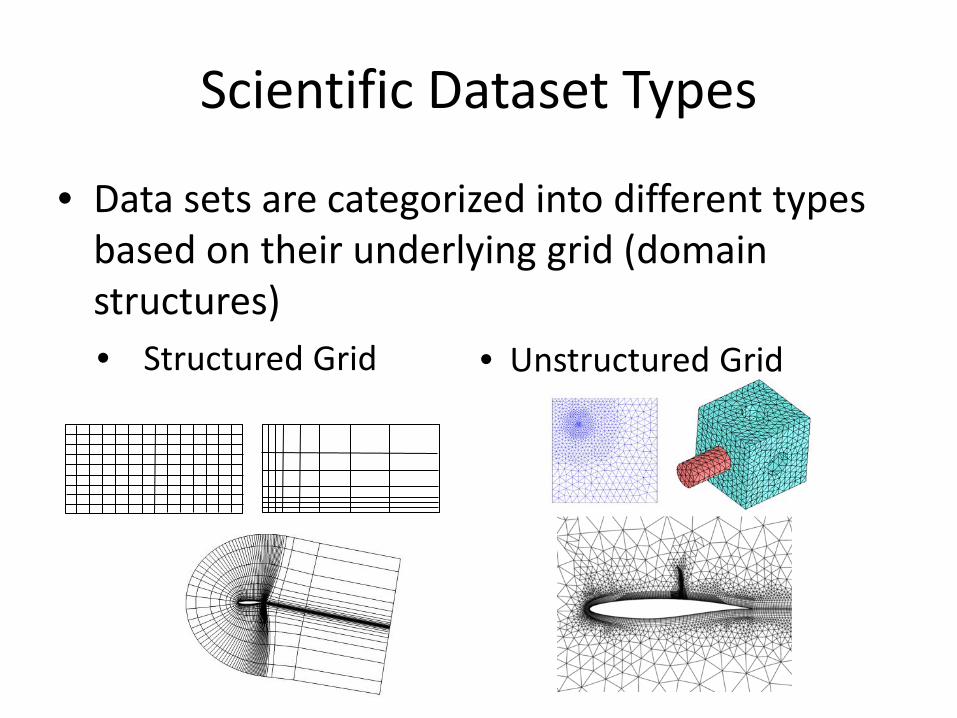
Scientific Dataset Types
• Data sets are categorized into different types based on their underlying grid (domain structures)
• Structured Grid
• Unstructured Grid

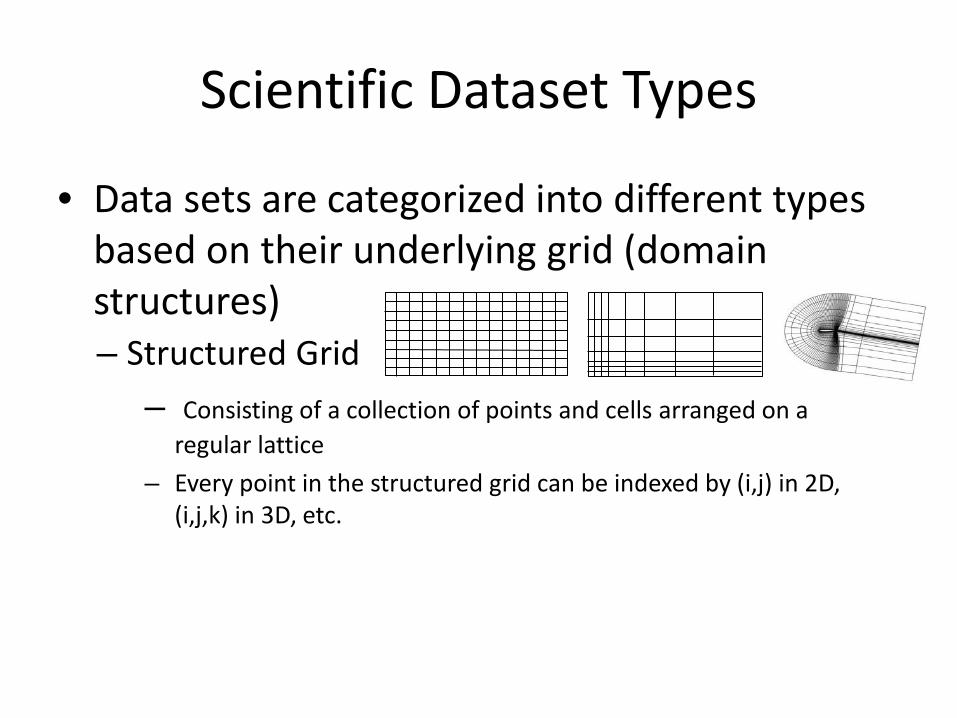
Scientific Dataset Types
• Data sets are categorized into different types based on their underlying grid (domain structures)
– Structured Grid – Consisting of a collection of points and cells arranged on a
regular lattice
Scientific Dataset Types
• Data sets are categorized into different types based on their underlying grid (domain structures)
– Structured Grid – Consisting of a collection of points and cells arranged on a
regular lattice – Every point in the structured grid can be indexed by (i,j) in 2D,
(i,j,k) in 3D, etc.
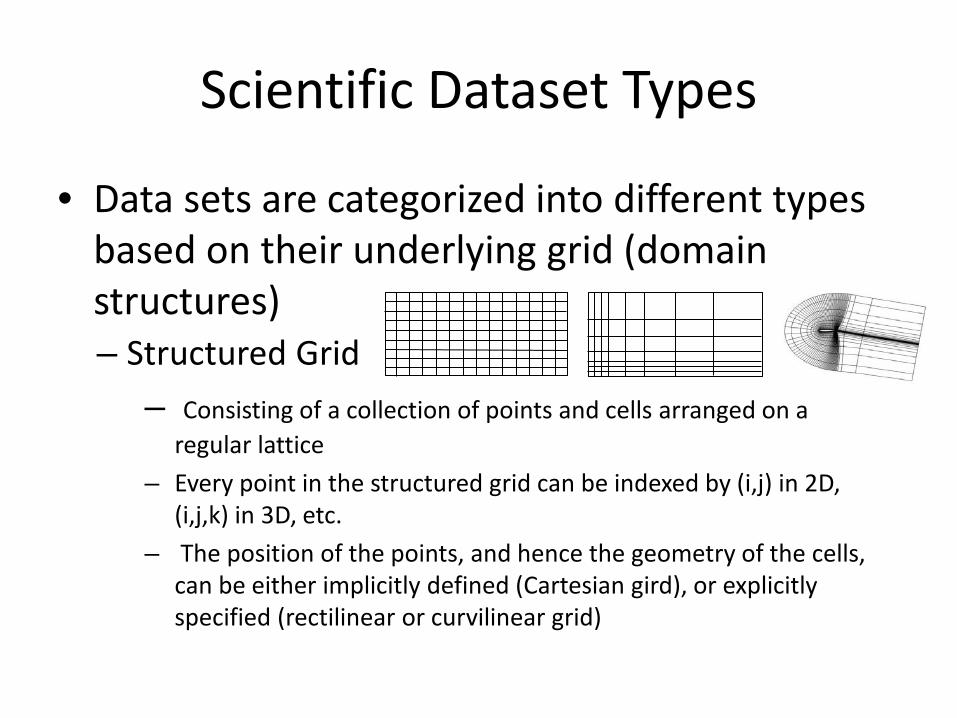
Scientific Dataset Types
• Data sets are categorized into different types based on their underlying grid (domain structures)
– Structured Grid – Consisting of a collection of points and cells arranged on a
regular lattice – Every point in the structured grid can be indexed by (i,j) in 2D,
(i,j,k) in 3D, etc. – The position of the points, and hence the geometry of the cells,
can be either implicitly defined (Cartesian gird), or explicitly specified (rectilinear or curvilinear grid)
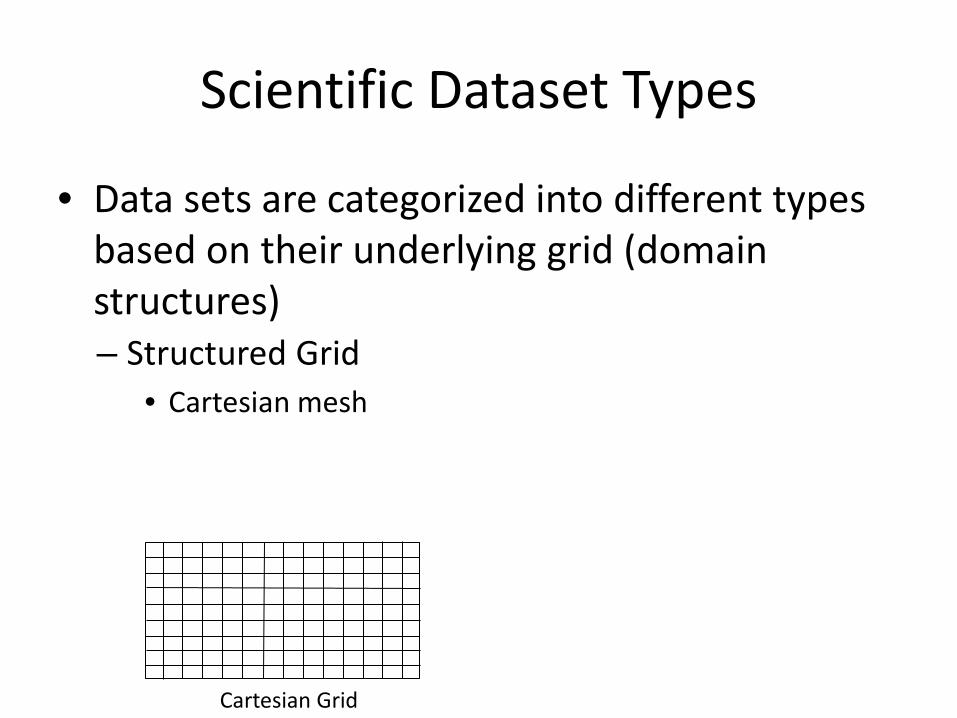
Scientific Dataset Types
• Data sets are categorized into different types based on their underlying grid (domain structures)
Cartesian Grid
– Structured Grid • Cartesian mesh

Scientific Dataset Types
• Data sets are categorized into different types based on their underlying grid (domain structures)
Cartesian Grid
Rectilinear Grid
– Structured Grid • Cartesian mesh • Rectilinear mesh
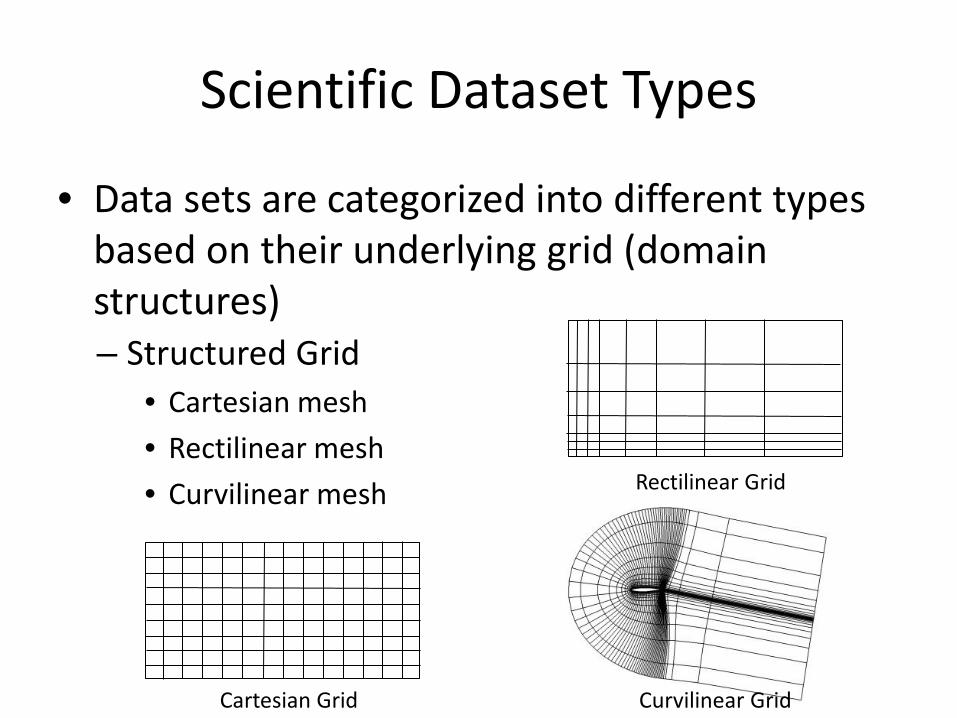
Scientific Dataset Types
• Data sets are categorized into different types based on their underlying grid (domain structures)
Cartesian Grid
Rectilinear Grid
Curvilinear Grid
– Structured Grid • Cartesian mesh • Rectilinear mesh • Curvilinear mesh
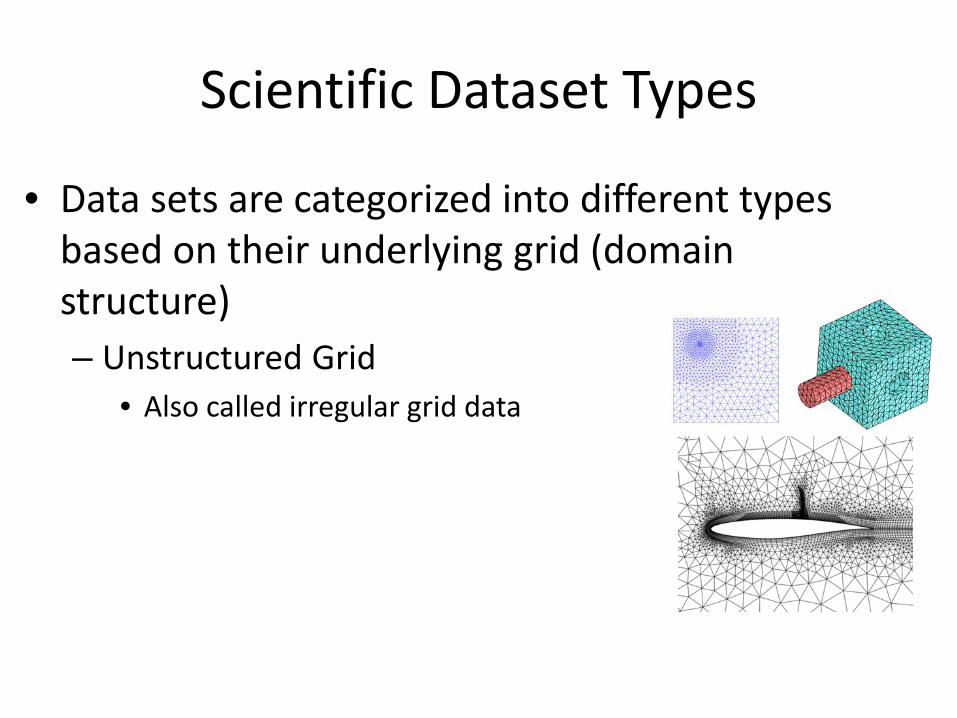
Scientific Dataset Types
• Data sets are categorized into different types based on their underlying grid (domain structure) – Unstructured Grid
• Also called irregular grid data

Scientific Dataset Types
• Data sets are categorized into different types based on their underlying grid (domain structure) – Unstructured Grid
• Also called irregular grid data • Unstructured grid points are irregularly distributed in space
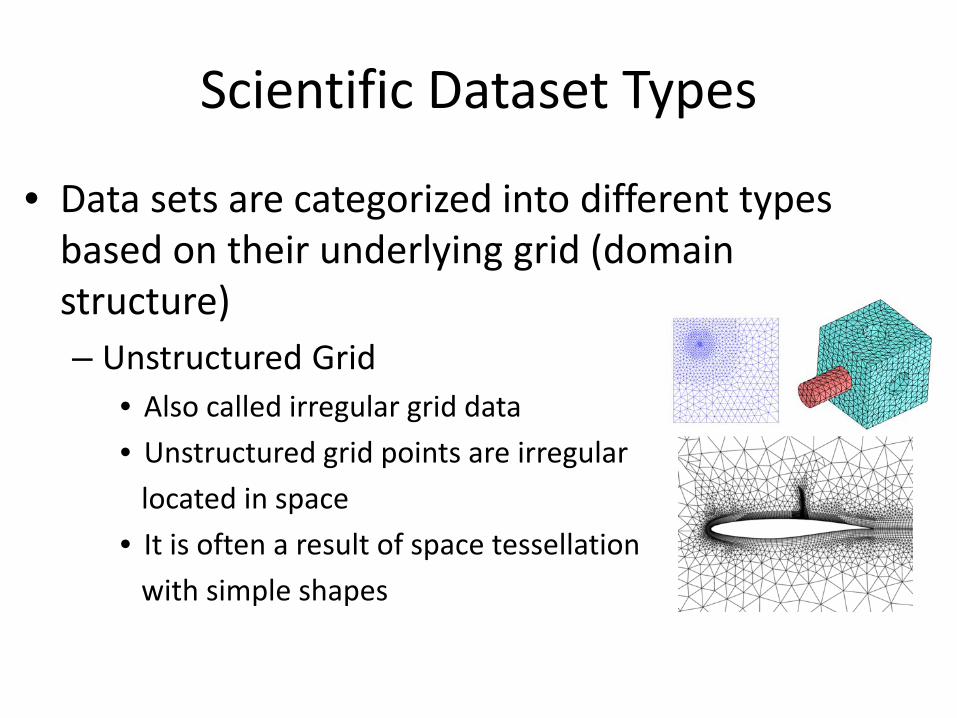
Scientific Dataset Types
• Data sets are categorized into different types based on their underlying grid (domain structure) – Unstructured Grid
• Also called irregular grid data • Unstructured grid points are irregular located in space • It is often a result of space tessellation with simple shapes
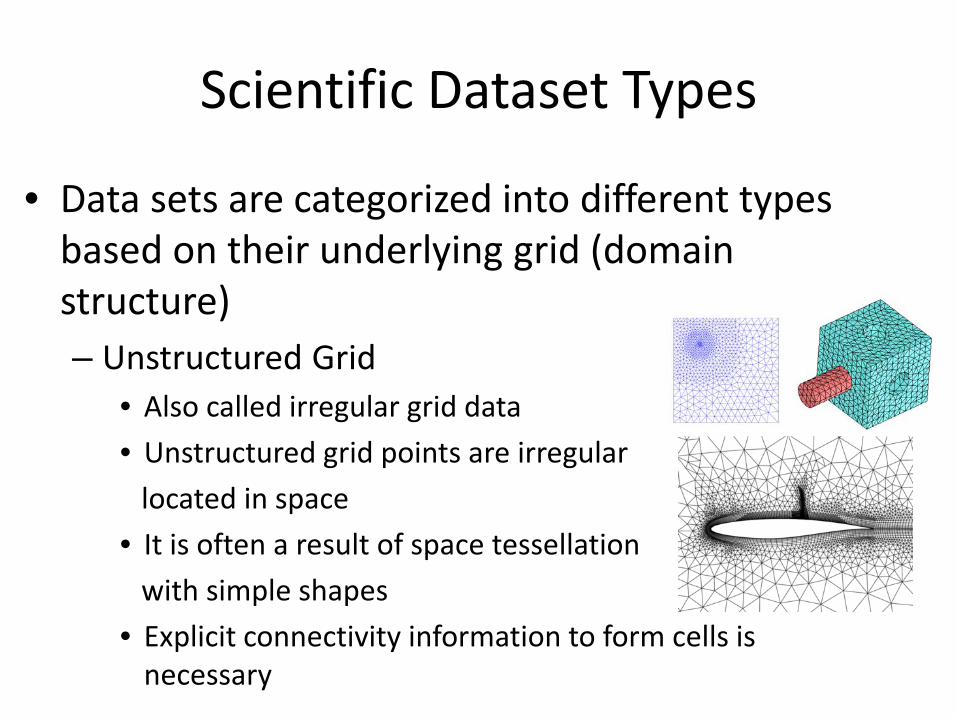
Scientific Dataset Types
• Data sets are categorized into different types based on their underlying grid (domain structure) – Unstructured Grid
• Also called irregular grid data • Unstructured grid points are irregular located in space • It is often a result of space tessellation with simple shapes • Explicit connectivity information to form cells is
necessary

Scientific Dataset Types
• Data sets are categorized into different types based on their underlying grid (domain structure) – Unstructured Grid
• Polygonal mesh Polygonal mesh
Scientific Dataset Types
• Data sets are categorized into different types based on their underlying grid (domain structure) – Unstructured Grid
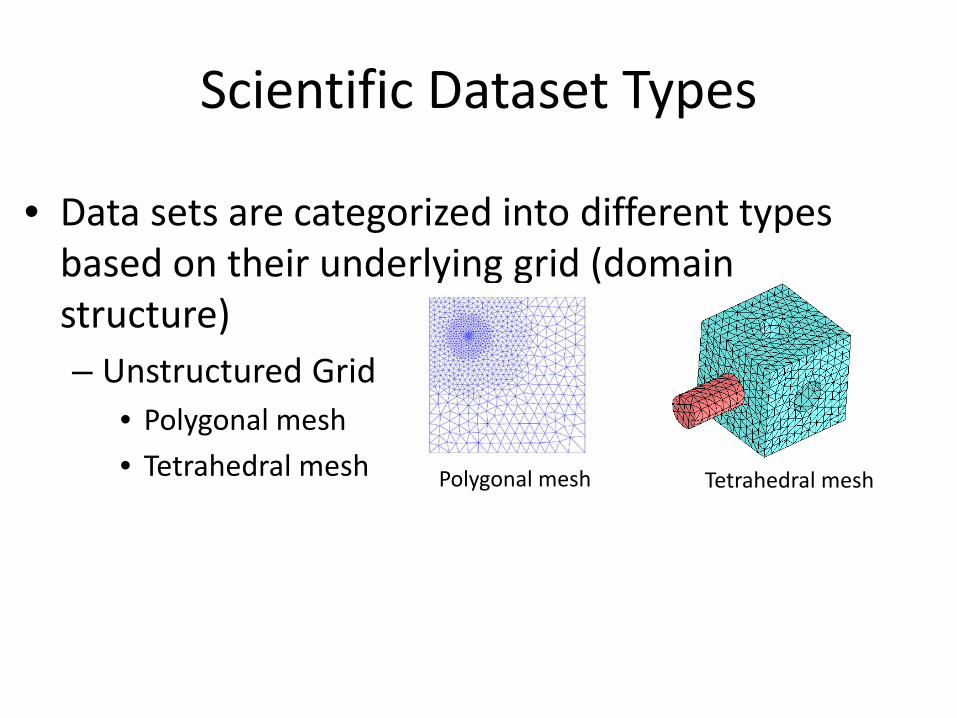
• Polygonal mesh • Tetrahedral mesh
Polygonal mesh Tetrahedral mesh
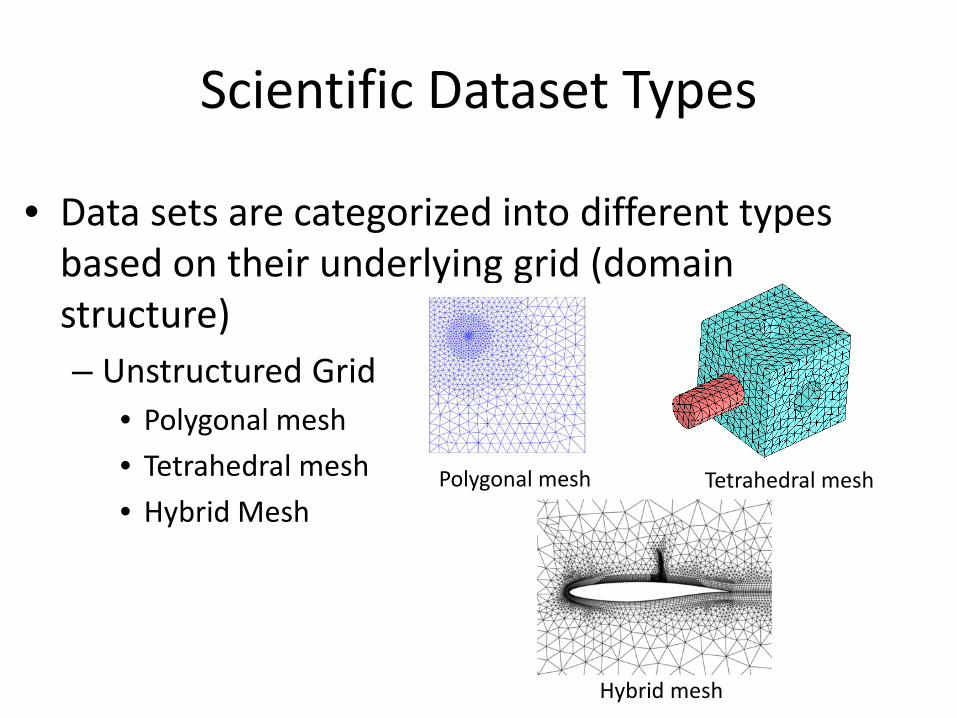
Scientific Dataset Types
• Data sets are categorized into different types based on their underlying grid (domain structure) – Unstructured Grid
• Polygonal mesh • Tetrahedral mesh • Hybrid Mesh
Polygonal mesh Tetrahedral mesh
Hybrid mesh