ncb financial group limited
TRANSCRIPT

NCB Financial Group Limited Index September 30, 2020
Page
Independent Auditor’s Report to the Members
Financial Statements
Consolidated income statement 1
Consolidated statement of comprehensive income 2
Consolidated statement of financial position 3 – 4
Consolidated statement of changes in equity 5
Consolidated statement of cash flows 6
Statement of comprehensive income 7
Statement of financial position 8
Statement of changes in equity 9
Statement of cash flows 10
Notes to the financial statements 11 – 203
PricewaterhouseCoopers, Scotiabank Centre, Duke Street, Box 372, Kingston, Jamaica T: (876) 922 6230, F: 876) 922 7581, www.pwc.com/jm
L.A. McKnight P.E. Williams B.L. Scott B.J. Denning G.A. Reece P.A. Williams R.S. Nathan C.I. Bell-Wisdom G.K. Moore T.N. Smith DaSilva K.D. Powell.
Independent auditor’s report
To the Members of NCB Financial Group Limited
Report on the audit of the consolidated and stand-alone financial statements
Our opinion In our opinion, the consolidated financial statements and the stand-alone financial statements give a true
and fair view of the consolidated financial position of NCB Financial Group Limited (the Company) and its
subsidiaries (together ‘the Group’) and the stand-alone financial position of the Company as at
September 30, 2020, and of their consolidated and stand-alone financial performance and their
consolidated and stand-alone cash flows for the year then ended in accordance with International
Financial Reporting Standards (IFRS) and with the requirements of the Jamaican Companies Act.
What we have audited
The Group’s consolidated and stand-alone financial statements comprise:
● the consolidated statement of financial position as at September 30, 2020;
● the consolidated income statement for the year then ended;
● the consolidated statement of comprehensive income for the year then ended;
● the consolidated statement of changes in equity for the year then ended;
● the consolidated statement of cash flows for the year then ended;
● the statement of financial position as at September 30, 2020;
● the statement of comprehensive income for the year then ended;
● the statement of changes in equity for the year then ended;
● the statement of cash flows for the year then ended; and
● the notes to the financial statements, which include significant accounting policies and other
explanatory information.
Basis for opinion We conducted our audit in accordance with International Standards on Auditing (ISAs). Our
responsibilities under those standards are further described in the Auditor’s responsibilities for the audit of
the consolidated and stand-alone financial statements section of our report.
We believe that the audit evidence we have obtained is sufficient and appropriate to provide a basis for
our opinion.
Independence
We are independent of the Group in accordance with the International Code of Ethics for Professional
Accountants (including International Independence Standards) issued by the International Ethics
Standards Board for Accountants (IESBA Code). We have fulfilled our other ethical responsibilities in
accordance with the IESBA Code.
Our audit approach Audit scope
As part of designing our audit, we determined materiality and assessed the risks of material misstatement in the consolidated and stand-alone financial statements. In particular, we considered where management made subjective judgements; for example, in respect of significant accounting estimates that involved making assumptions and considering future events that are inherently uncertain. As in all of our audits, we also addressed the risk of management override of internal controls, including, among other matters, consideration of whether there was evidence of bias that represented a risk of material misstatement due to fraud.
How we tailored our group audit scope We tailored the scope of our audit in order to perform sufficient work to enable us to provide an opinion on the consolidated financial statements as a whole, taking into account the structure of the Group, the accounting processes and controls, and the industry in which the Group operates.
We determined the scope of our audit by first considering the internal organisation of the Group and then identifying the components of the audit that have the most significant impact on the consolidated financial statements. The Group comprised 50 reporting components of which, we selected 23, which represents the principal business units within the Group and are located in Jamaica, Bermuda, Trinidad and Tobago and the Dutch Antilles. Full scope audits were performed for 14 components, while audits of one or more financial statements line items were performed for 9 components. The audit work performed covered 97% of the Group’s total assets and 99% of total revenue. For business units located in the Dutch Antilles, we used component auditors from a non-PwC firm that is familiar with the local laws and regulations to perform this audit work. Key audit matters
Key audit matters are those matters that, in our professional judgment, were of most significance in our
audit of the consolidated and stand-alone financial statements of the current period. These matters were
addressed in the context of our audit of the consolidated and stand-alone financial statements as a whole,
and in forming our opinion thereon, and we do not provide a separate opinion on these matters. We have
determined that there are no key audit matters, as it pertains to the stand-alone financial statements, in
our report.
Key audit matter How our audit addressed the key audit matter
IFRS 9 ‘Financial Instruments’ –
Probabilities of Default, Forward Looking Information and Significant Increase in Credit Risk (Group)
See notes 2(i), 21 and 22 to the financial statements for disclosures of related accounting policies, judgements, estimates and balances.
As at September 30, 2020, the Group’s loans and advances totalled $471.5 billion. The Group’s investment securities measured at amortised cost and fair valued through other comprehensive income (FVOCI) totalled $659.9 billion. In aggregate, the above exposures represent 63% of total assets at the reporting date. The resultant impairment recorded under the expected credit loss (ECL) impairment model amounted to $18.6 billion for loans and advances and $1 billion for debt securities.
In assessing impairment, IFRS 9 prescribes a forward looking ECL impairment model which takes into account reasonable and supportable forward looking information as well as probabilities of default (PD). Probabilities of default represent the likelihood of a borrower defaulting on its obligation over the next twelve months or over the remaining lifetime of the obligation. The twelve month and lifetime PDs are determined differently for loans and investments. For loans and advances, management developed PDs based on the Group’s specific historical default rates for each industry classification. In performing historical analyses, management identified economic variables impacting credit risk and ECLs for each portfolio. For debt securities, comprising sovereign and corporate securities, PDs are developed by reference to external data collated by Standard & Poor’s (S&P) with adjustments for industry and country specific risks, where appropriate.
Our approach to addressing the matter, with the assistance of our valuation specialist, involved the following procedures, amongst others:
• Updated our understanding of management’s ECL model including any changes to source data and assumptions.
• Tested the completeness of all loans and advances and debt securities to determine whether all items were included in the ECL models by agreeing the models to detailed loans and securities listings.
• Evaluated the reasonableness of management’s judgements pertaining to PD, SICR and forward looking information, including macroeconomic factors, impacting the weighting of the scenarios due to the negative impact of COVID-19 as follows:
Debt securities
PD:
● Tested the critical data fields used in the ECL
model, such as the maturity date, amortised
cost, accrued interest, credit rating and interest
rate by tracing data back to relevant source
documents.
● Agreed the inputs used to calculate the PDs to
external sources such as external rating
agencies.
Key audit matter How our audit addressed the key audit matter
The unprecedented economic impact of
COVID-19 resulted in a significant increase in
credit risk (SICR) for a number of borrowers
who migrated from Stage 1 to Stage 2 based
on an assessment of the industry in which the
borrower operates and other relevant factors.
In the event of a SICR, an allowance (or
provision) is required for ECL resulting from all
possible default events over the expected life
of the financial instrument (‘lifetime ECL’).
The estimation and application of forward
looking information requires significant
judgement. Stage 1 and Stage 2 credit loss
allowances are modelled based on the
macroeconomic variables (or changes in
macroeconomic variables) which most closely
correlate with credit losses in the relevant
portfolio. Each macroeconomic scenario used
in the ECL calculation incorporates forecasts
of the relevant macroeconomic variables.
The estimation of ECL in Stage 1 and Stage 2
is a discounted, probability-weighted estimate
that considers a minimum of three future
macroeconomic scenarios. The base case
scenario is based on macroeconomic forecasts
which are publicly available. Upside and
downside scenarios are set relative to the base
case scenario based on reasonably possible
alternative macroeconomic conditions.
Additional adjustments to the base, best case
and worst case scenario weightings were
required as a result of the COVID-19
pandemic.
We focused on this area due to the impact of COVID-19 on credit risk, the complexity of the techniques used to determine PDs and identify SICR, and the number of significant judgements made by management regarding possible future economic scenarios.
SICR:
• Tested, on a sample basis, the accuracy of
the initial credit risk and the credit risk at the
reporting date using rating agency definitions
of ‘investment grade’ and evaluated the
appropriateness of the group classification of
debt securities as Stage 2.
● Performed an independent qualitative
assessment for a sample of borrowers to
determine whether there was any adverse
public information affecting the criteria used
to perform the staging.
● Inspected the financial statements of a
sample of borrowers to determine whether
there was any significant downturn in
financial performance before and during the
pandemic. This aided in assessing
management’s staging for borrowers,
particularly for those who requested
forbearance as a result of COVID-19.
Forward Looking Information:
● Assessed the reasonableness of the Group’s
methodology for determining economic
scenarios and the probability weightings
applied.
● Evaluated the reasonableness of the increase
in the weighting used for the worst case
scenario by agreeing the forward looking
economic information to external sources
published or pronounced by reputable third
parties.
● Sensitized the probability weightings used in
the ECL calculation.
Key audit matter How our audit addressed the key audit matter
Loans and advances
PD:
● Tested the critical data fields used in the ECL
model for the PD determination, such as
default date, effective interest rate, write-off
data, and loan type by tracing data back to
source documents.
● Reperformed the calculation of days past
due, a key data input into the PD parameter,
in the Group’s banking system on a sample
basis.
SICR:
● Evaluated staging of loans and advances by
identifying the industries severely impacted
by the pandemic. These were identified
based on restrictions imposed by
governments across the Group’s operations.
● Tested whether the loans of borrowers from
these industries migrated to Stage 2.
Forward Looking Information:
● Assessed the reasonableness of the Group’s
methodology for determining economic
scenarios.
● Evaluated the reasonableness of the increase
in the weighting used for the worst case
scenario by agreeing the forward looking
economic information to external sources
published or pronounced by reputable third
parties.
● Sensitized the probability weightings used in
the ECL calculation.
The results of our procedures indicated that the
assumptions used by management for determining
the probabilities of default, significant increase in
credit risk and forward looking information were not
unreasonable.
Key audit matter How our audit addressed the key audit matter
Methodologies and assumptions used for
determining insurance contract liabilities
for life insurance and annuity contracts
(Group)
See notes 2(w) and 39 to the financial statements for disclosures of related accounting policies, judgements, estimates and balances.
As at September 30, 2020, reserves for life
insurance and annuity contracts account for
$359.3 billion or 22.5% of the total liabilities of
the Group.
Economic assumptions, such as investment
return, associated discount rates and borrowing
rates, policy expenses and assumptions
including mortality and persistency are key
inputs used to estimate these long term
liabilities.
Management used internal and external
actuarial experts to assist in determining these
assumptions and in valuing these actuarial
liabilities. Based on management’s
assessment, COVID-19 did not have a
significant impact on the liabilities for life
insurance and annuity insurance contracts.
We focused on this area because the valuation
of the provisions for the settlement of future
claims involves complex and subjective
judgements about future events, both internal
and external to the business, for which small
changes in assumptions may result in
significant impacts to the valuation of these
liabilities.
Our approach to addressing the matter, with the assistance of our actuarial specialists, involved the following procedures, amongst others:
• Tested the completeness, accuracy and
reliability of the underlying data utilised by
management to support the actuarial valuation.
We tested a sample of contracts to assess
whether contract features and demographic
data corresponded to the data file given by
management to its actuary.
• Evaluated the methodologies and assumptions
utilized by management’s actuarial experts
considering industry and component specific
facts and circumstances. Specific areas of
focus were mortality assumptions, contract
lapses, investment return and associated
discount rate, and policy expenses, all of which
are based on entity experience or publicly
available information.
The results of our procedures indicated that the
assumptions used by management for determining
insurance contract liabilities for life insurance and
annuity insurance contracts were not unreasonable
and that the methodologies used were actuarially
established and accepted and appropriate in the
circumstances.

Key audit matter How our audit addressed the key audit matter
Goodwill impairment (Group)
See notes 2(o)(i), 3(a), 28 and 43 to the
financial statements for disclosures of related
accounting policies, judgements, estimates
and balances.
The total carrying value of goodwill is $20.4
billion or 1.1% of total assets as at
September 30, 2020.
In accordance with IAS 36, ‘Impairment of
Assets’, management performed an annual
goodwill impairment assessment to determine
whether the carrying value exceeded the
recoverable amount of the cash generating
unit (CGU) to which the goodwill is allocated
and is therefore impaired at the reporting date.
Goodwill relating to the recoverable amount of
a CGU is calculated as the higher of the value-
in-use and fair value less costs of disposal.
Management determined the recoverable
amount by reference to value-in-use which is
based on discounted cash flow projections
over which management makes significant
judgements on key inputs. As a result of the
assessment, management determined there
was no impairment as at September 30, 2020.
We focused on this area as the goodwill
impairment assessment requires significant
management judgement and estimation, is
sensitive to changes in key assumptions and
due to the challenges involved in determining
the impact of COVID-19 on those key
assumptions.
The key assumptions were assessed by management as being:
● revenue growth rate;
● projected reinsurance;
● claims ratio;
● projected expenses;
● terminal growth rate projections; and
● discount rate.
Our approach to addressing the matter, with the
assistance of our valuation specialist, involved the
following procedures, amongst others: ● Updated our understanding of management’s
approach to performing their annual
impairment assessment. This included
updating our understanding of the process by
which management’s key assumptions and
methodologies were developed and assessing
their appropriateness.
● Compared previous forecasts to actual results
in order to assess the performance of the
business and the extent to which reliance
could be placed on management’s ability to
forecast.
● Confirmed that the three-year forecast used in
the valuation model was consistent with the
Board approved business plan, and that the
key assumptions were subject to oversight
from the Board of Directors.
● Tested the key assumptions, including the
impact of COVID-19 on those key assumptions
as follows:
• Evaluated the revenue growth rate and
the discount rate against valuations of
similar companies with the assistance of
our valuation specialist.
• Compared the key assumptions to
externally derived data where available,
including market expectations of
investment return, projected economic
growth, terminal growth rate and interest
rates.

Key audit matter How our audit addressed the key audit matter
• Agreed the projected claims and expense
ratios and reinsurance to audited financial
information and assessed for
reasonableness in light of the current
economic climate and market outlook.
• Tested the calculations for mathematical
accuracy and assessed the sensitivity of
the calculations by varying the key
assumptions and adjustments within
management’s cash flow forecast.
The results of our procedures indicated management’s determination that goodwill was not impaired at the reporting date was not unreasonable.
Business combination (Group) - finalisation
of purchase price allocation (PPA) of
liabilities under annuity and insurance
contracts
See notes 3(a), 54 and 61 to the financial statements for disclosures of related accounting policies, judgements, estimates and balances.
The Group acquired a controlling interest in Guardian Holdings Limited (GHL) in the prior financial year for a total consideration of $28.1 billion and consequently, GHL became a subsidiary of the Group.
The purchase price allocation accounting for the acquisition was recorded on a provisional basis in 2019, as allowed under IFRS 3 ‘Business Combinations’, and finalised during the current financial year.
We focused on this area due to the judgements and assumptions applied by management in finalising the fair value of select balances with the most significant being liabilities under annuity and insurance contracts, which resulted in a $9.2 billion adjustment. The main component of the adjustment related to the determination of the present value of the in-force business acquired (PVIF), which was actuarially determined and was subject to complex calculations.
The Group was assisted by an external actuarial expert in this process.
Our approach to addressing the matter, with the
assistance of our actuarial specialist, involved the
following procedures, amongst others:
● Evaluated the qualifications, competence,
independence and objectivity of management’s
actuarial expert who performed the valuation.
● Assessed the methodology used for
consistency with actuarial standards and
established best practice.
● Evaluated the assumptions used by
management and the actuarial expert over the
present value of the in-force business by
comparing to approaches taken by comparable
insurers and evaluating relevant experience
data.
The results of our procedures indicated that the
methodology and assumptions used by management
for assessing the fair value of liabilities under annuity
and insurance contracts were not unreasonable.

Key audit matter How our audit addressed the key audit matter
Valuation of unquoted corporate debt and
government securities classified as fair
value through profit or loss, fair value
through other comprehensive income and
pledged assets (Group).
See notes 3(d), 23 and 51 to the financial statements for disclosures of related accounting policies, judgements, estimates and balances.
As at September 30, 2020, unquoted corporate
debt and government securities classified as
investment securities at fair value through
profit or loss, fair value through other
comprehensive income, and pledged assets
together account for $76 billion or 4% of total
assets of the Group.
These securities are classified and disclosed
as Level 3 within the fair value hierarchy as
one or more of the significant inputs is not
based on observable market data.
For unquoted corporate debt and government
securities, management uses valuation
techniques which utilise the application of a
market yield curve adjusted by a risk premium
to discount the contractual cash flows of the
instruments.
We focused on this area as the yield curve is
an unobservable input requiring management’s
judgement and estimation, which is subject to
high estimation uncertainty.
Our approach to addressing the matter, with the assistance of our valuation expert, involved the following procedures, amongst others:
• Updated our understanding of management’s approach to performing the fair value assessment. This included updating our understanding of the process by which management’s key assumptions and methodologies were developed and assessing their appropriateness.
• Tested key data inputs used in the valuation model, including: issuance date, maturity date, coupon rate and risk premium at issuance, by performing confirmation procedures and comparison to source documentation on a sample basis.
• Independently developed territory specific yield curves and compared them to management’s yield curves.
• Tested, on a sample basis, the contractual cash flows of the underlying securities by comparing to source documentation and evaluated the impact of any variations.
The results of our procedures indicated that the
assumptions used by management for determining the
fair value of unquoted corporate debt and government
securities were not unreasonable.
Other information
Management is responsible for the other information. The other information comprises the Annual Report
(but does not include the consolidated and stand-alone financial statements and our auditor’s report
thereon), which is expected to be made available to us after the date of this auditor’s report.
Our opinion on the consolidated and stand-alone financial statements does not cover the other information
and we will not express any form of assurance conclusion thereon.
In connection with our audit of the consolidated and stand-alone financial statements, our responsibility is
to read the other information identified above when it becomes available and, in doing so, consider
whether the other information is materially inconsistent with the consolidated and stand-alone financial
statements or our knowledge obtained in the audit, or otherwise appears to be materially misstated.
When we read the Annual Report, if we conclude that there is a material misstatement therein, we are
required to communicate the matter to those charged with governance.
Responsibilities of management and those charged with governance for the consolidated and stand-alone financial statements Management is responsible for the preparation of the consolidated and stand-alone financial statements
that give a true and fair view in accordance with IFRS and with the requirements of the Jamaican
Companies Act, and for such internal control as management determines is necessary to enable the
preparation of consolidated and stand-alone financial statements that are free from material misstatement,
whether due to fraud or error.
In preparing the consolidated and stand-alone financial statements, management is responsible for
assessing the Group and Company’s ability to continue as a going concern, disclosing, as applicable,
matters related to going concern and using the going concern basis of accounting unless management
either intends to liquidate the Group or the Company or to cease operations, or has no realistic alternative
but to do so.
Those charged with governance are responsible for overseeing the Group and Company’s financial
reporting process.
Auditor’s responsibilities for the audit of the consolidated and stand-alone financial statements Our objectives are to obtain reasonable assurance about whether the consolidated and stand-alone
financial statements as a whole are free from material misstatement, whether due to fraud or error, and to
issue an auditor’s report that includes our opinion. Reasonable assurance is a high level of assurance, but
is not a guarantee that an audit conducted in accordance with ISAs will always detect a material
misstatement when it exists. Misstatements can arise from fraud or error and are considered material if,
individually or in the aggregate, they could reasonably be expected to influence the economic decisions of
users taken on the basis of these consolidated and stand-alone financial statements.
As part of an audit in accordance with ISAs, we exercise professional judgment and maintain professional
scepticism throughout the audit. We also:
● Identify and assess the risks of material misstatement of the consolidated and stand-alone financial
statements, whether due to fraud or error, design and perform audit procedures responsive to those
risks, and obtain audit evidence that is sufficient and appropriate to provide a basis for our opinion.
The risk of not detecting a material misstatement resulting from fraud is higher than for one resulting
from error, as fraud may involve collusion, forgery, intentional omissions, misrepresentations, or the
override of internal control.
● Obtain an understanding of internal control relevant to the audit in order to design audit procedures
that are appropriate in the circumstances, but not for the purpose of expressing an opinion on the
effectiveness of the Group and Company’s internal control.
● Evaluate the appropriateness of accounting policies used and the reasonableness of accounting
estimates and related disclosures made by management.
● Conclude on the appropriateness of management’s use of the going concern basis of accounting and,
based on the audit evidence obtained, whether a material uncertainty exists related to events or
conditions that may cast significant doubt on the Group or Company’s ability to continue as a going
concern. If we conclude that a material uncertainty exists, we are required to draw attention in our
auditor’s report to the related disclosures in the consolidated and stand-alone financial statements or,
if such disclosures are inadequate, to modify our opinion. Our conclusions are based on the audit
evidence obtained up to the date of our auditor’s report. However, future events or conditions may
cause the Group or Company to cease to continue as a going concern.
● Evaluate the overall presentation, structure and content of the consolidated and stand-alone financial
statements, including the disclosures, and whether the consolidated and stand-alone financial
statements represent the underlying transactions and events in a manner that achieves fair
presentation.
● Obtain sufficient appropriate audit evidence regarding the financial information of the entities or
business activities within the Group to express an opinion on the consolidated financial statements.
We are responsible for the direction, supervision and performance of the group audit. We remain
solely responsible for our audit opinion.

We communicate with those charged with governance regarding, among other matters, the planned scope
and timing of the audit and significant audit findings, including any significant deficiencies in internal
control that we identify during our audit.
We also provide those charged with governance with a statement that we have complied with relevant
ethical requirements regarding independence, and to communicate with them all relationships and other
matters that may reasonably be thought to bear on our independence, and where applicable, actions
taken to eliminate threats or safeguards applied.
From the matters communicated with those charged with governance, we determine those matters that
were of most significance in the audit of the consolidated and stand-alone financial statements of the
current period and are therefore the key audit matters. We describe these matters in our auditor’s report
unless law or regulation precludes public disclosure about the matter or when, in extremely rare
circumstances, we determine that a matter should not be communicated in our report because the
adverse consequences of doing so would reasonably be expected to outweigh the public interest benefits
of such communication.
Report on other legal and regulatory requirements
As required by the Jamaican Companies Act, we have obtained all the information and explanations
which, to the best of our knowledge and belief, were necessary for the purposes of our audit.
In our opinion, proper accounting records have been kept, so far as appears from our examination of
those records, and the accompanying consolidated and stand-alone financial statements are in agreement
therewith and give the information required by the Jamaican Companies Act, in the manner so required.
The engagement partner on the audit resulting in this independent auditor’s report is Paul Williams.
Chartered Accountants
November 29, 2020
Kingston, Jamaica
Page 1
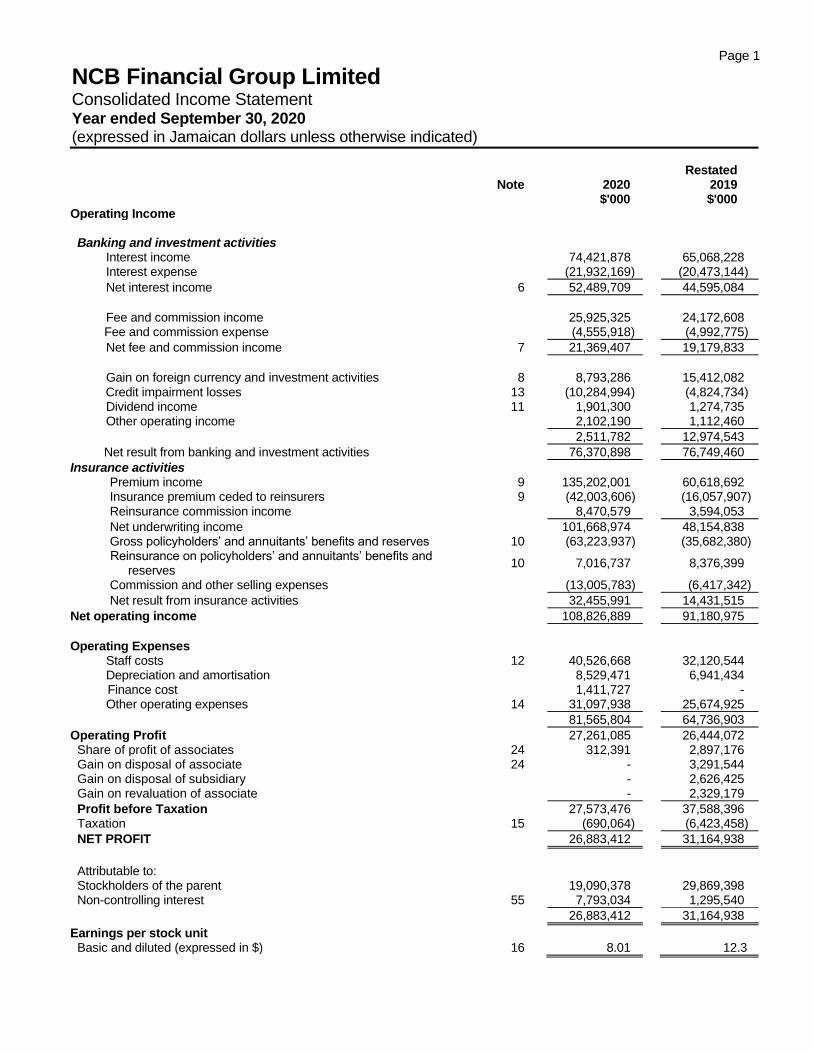
NCB Financial Group Limited Consolidated Income Statement Year ended September 30, 2020 (expressed in Jamaican dollars unless otherwise indicated)
Restated Note 2020 2019 $'000 $'000
Operating Income Banking and investment activities Interest income 74,421,878 65,068,228 Interest expense (21,932,169) (20,473,144)
Net interest income 6 52,489,709 44,595,084
Fee and commission income 25,925,325 24,172,608 Fee and commission expense (4,555,918) (4,992,775)
Net fee and commission income 7 21,369,407 19,179,833
Gain on foreign currency and investment activities 8 8,793,286 15,412,082
Credit impairment losses 13 (10,284,994) (4,824,734) Dividend income 11 1,901,300 1,274,735 Other operating income 2,102,190 1,112,460
2,511,782 12,974,543
Net result from banking and investment activities 76,370,898 76,749,460
Insurance activities Premium income 9 135,202,001 60,618,692 Insurance premium ceded to reinsurers 9 (42,003,606) (16,057,907) Reinsurance commission income 8,470,579 3,594,053
Net underwriting income 101,668,974 48,154,838 Gross policyholders’ and annuitants’ benefits and reserves 10 (63,223,937) (35,682,380) Reinsurance on policyholders’ and annuitants’ benefits and
reserves 10 7,016,737 8,376,399
Commission and other selling expenses (13,005,783) (6,417,342)
Net result from insurance activities 32,455,991 14,431,515
Net operating income 108,826,889 91,180,975
Operating Expenses
Staff costs 12 40,526,668 32,120,544 Depreciation and amortisation 8,529,471 6,941,434 Finance cost 1,411,727 - Other operating expenses 14 31,097,938 25,674,925
81,565,804 64,736,903
Operating Profit 27,261,085 26,444,072 Share of profit of associates 24 312,391 2,897,176 Gain on disposal of associate 24 - 3,291,544 Gain on disposal of subsidiary - 2,626,425 Gain on revaluation of associate - 2,329,179
Profit before Taxation 27,573,476 37,588,396 Taxation 15 (690,064) (6,423,458)
NET PROFIT 26,883,412 31,164,938
Attributable to: Stockholders of the parent 19,090,378 29,869,398 Non-controlling interest 55 7,793,034 1,295,540
26,883,412 31,164,938
Earnings per stock unit Basic and diluted (expressed in $) 16 8.01 12.3
Page 2
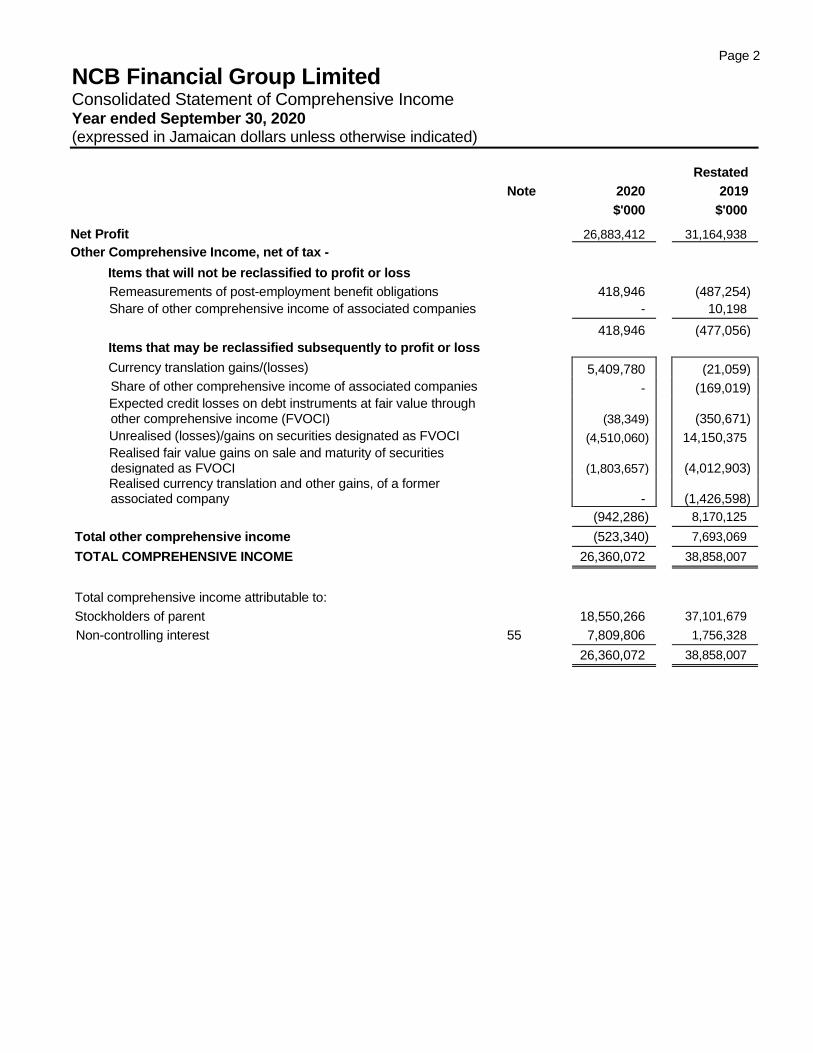
NCB Financial Group Limited Consolidated Statement of Comprehensive Income Year ended September 30, 2020 (expressed in Jamaican dollars unless otherwise indicated)
Restated
Note 2020 2019
$'000 $'000
Net Profit 26,883,412 31,164,938
Other Comprehensive Income, net of tax -
Items that will not be reclassified to profit or loss
Remeasurements of post-employment benefit obligations 418,946 (487,254)
Share of other comprehensive income of associated companies - 10,198
418,946 (477,056)
Items that may be reclassified subsequently to profit or loss
Currency translation gains/(losses) 5,409,780 (21,059)
Share of other comprehensive income of associated companies - (169,019) Expected credit losses on debt instruments at fair value through other comprehensive income (FVOCI)
(38,349)
(350,671)
Unrealised (losses)/gains on securities designated as FVOCI (4,510,060) 14,150,375 Realised fair value gains on sale and maturity of securities designated as FVOCI
(1,803,657)
(4,012,903)
Realised currency translation and other gains, of a former associated company
-
(1,426,598)
(942,286) 8,170,125
Total other comprehensive income (523,340) 7,693,069
TOTAL COMPREHENSIVE INCOME 26,360,072 38,858,007
Total comprehensive income attributable to:
Stockholders of parent 18,550,266 37,101,679
Non-controlling interest 55 7,809,806 1,756,328
26,360,072 38,858,007
Page 3
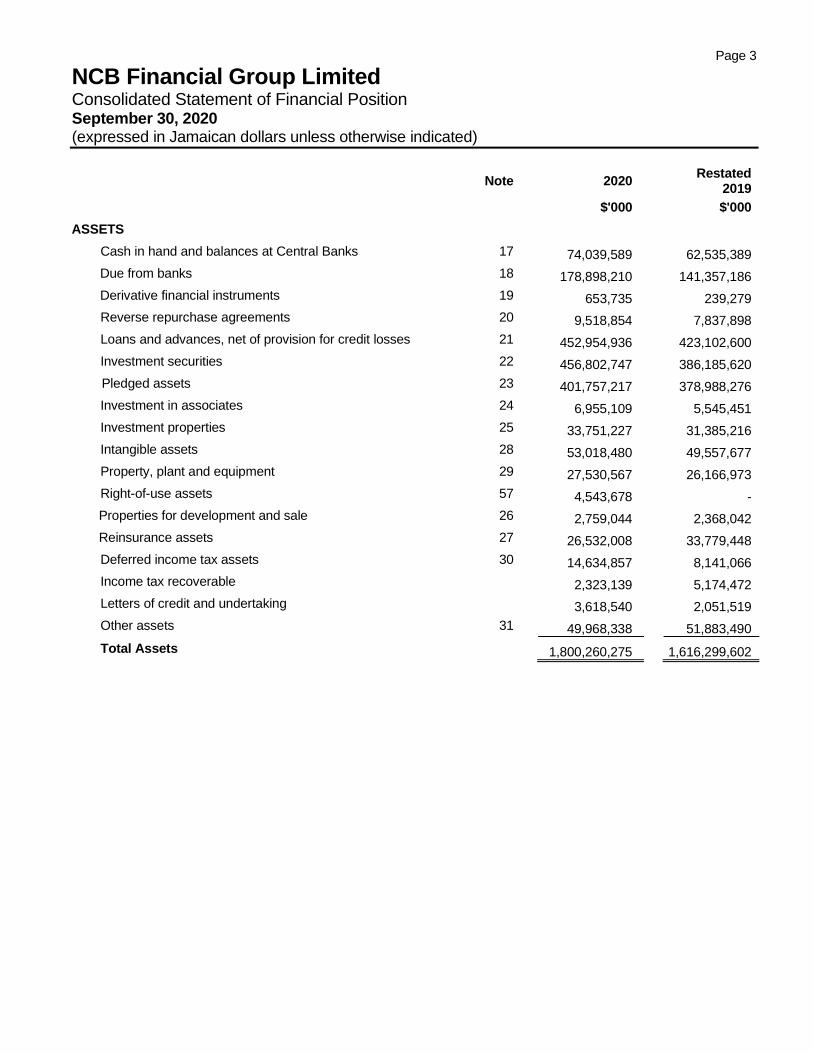
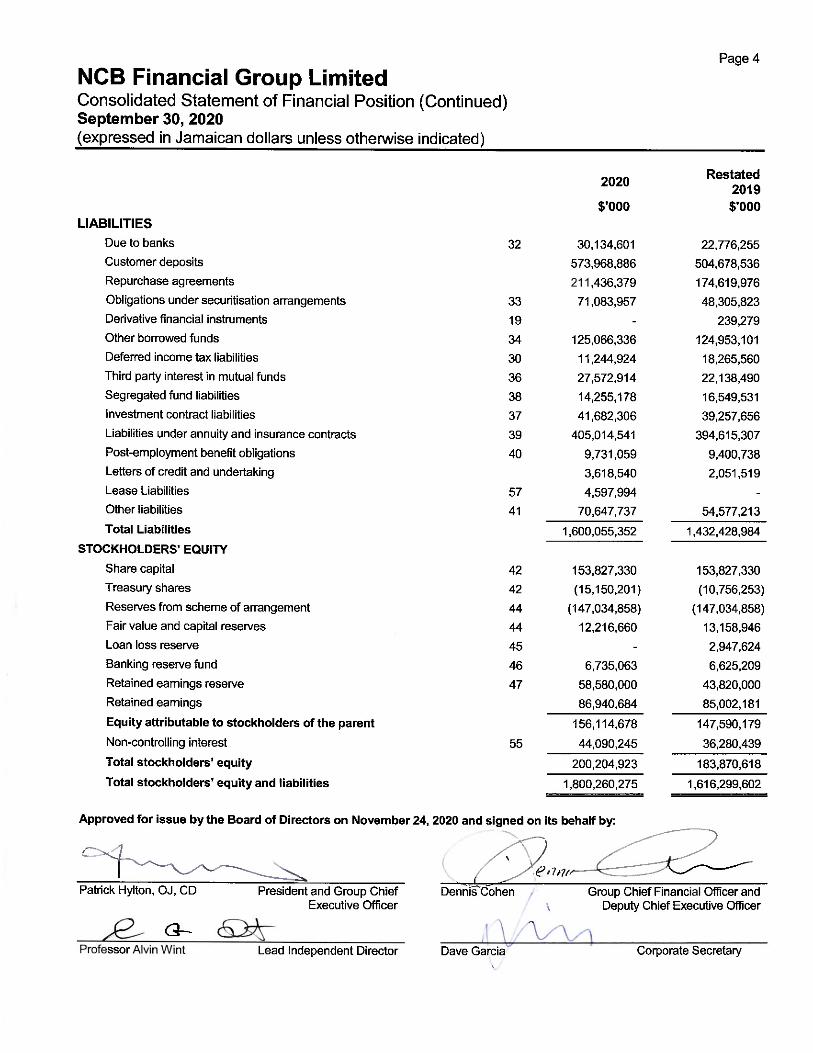
NCB Financial Group Limited Consolidated Statement of Financial Position September 30, 2020 (expressed in Jamaican dollars unless otherwise indicated)
Note 2020 Restated
2019
$'000 $'000
ASSETS
Cash in hand and balances at Central Banks 17 74,039,589 62,535,389
Due from banks 18 178,898,210 141,357,186
Derivative financial instruments 19 653,735 239,279
Reverse repurchase agreements 20 9,518,854 7,837,898
Loans and advances, net of provision for credit losses 21 452,954,936 423,102,600
Investment securities 22 456,802,747 386,185,620
Pledged assets 23 401,757,217 378,988,276
Investment in associates 24 6,955,109 5,545,451
Investment properties 25 33,751,227 31,385,216
Intangible assets 28 53,018,480 49,557,677
Property, plant and equipment 29 27,530,567 26,166,973
Right-of-use assets 57 4,543,678 -
Properties for development and sale 26 2,759,044 2,368,042
Reinsurance assets 27 26,532,008 33,779,448
Deferred income tax assets 30 14,634,857 8,141,066
Income tax recoverable 2,323,139 5,174,472
Letters of credit and undertaking 3,618,540 2,051,519
Other assets 31 49,968,338 51,883,490
Total Assets 1,800,260,275 1,616,299,602
Page 5
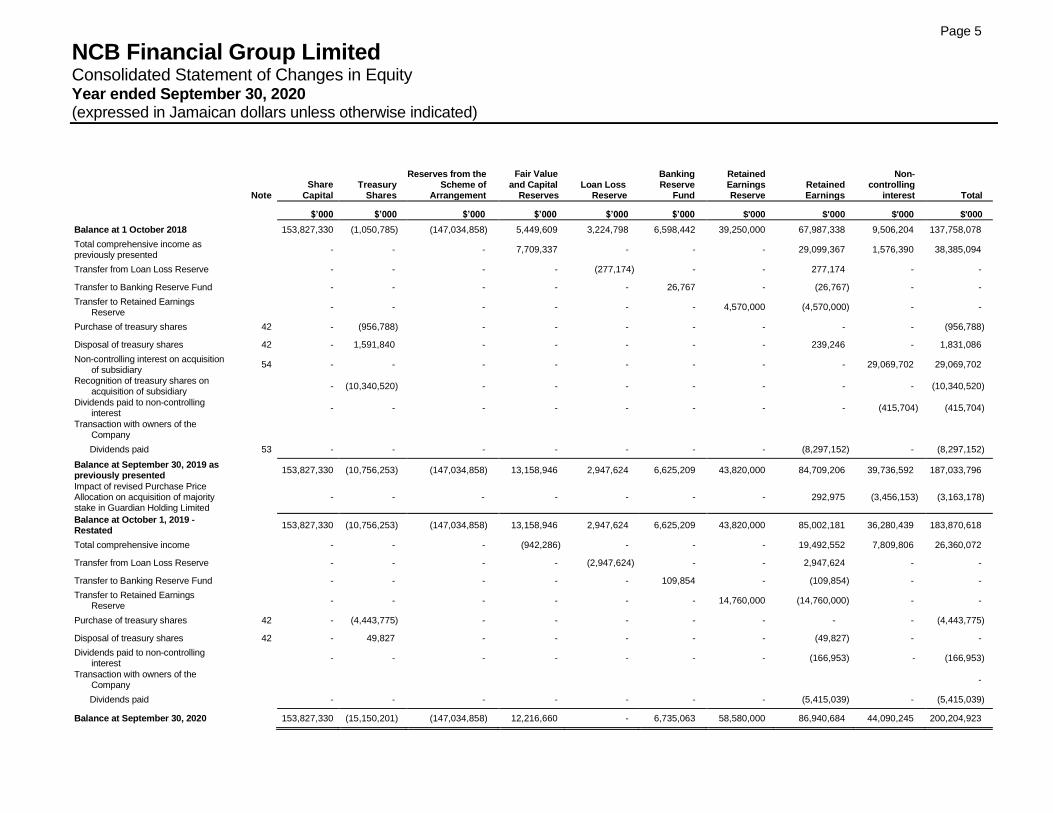
NCB Financial Group Limited Consolidated Statement of Changes in Equity Year ended September 30, 2020 (expressed in Jamaican dollars unless otherwise indicated)
Note Share
Capital
Treasury Shares
Reserves from the Scheme of
Arrangement
Fair Value and Capital
Reserves Loan Loss
Reserve
Banking Reserve
Fund
Retained Earnings Reserve
Retained Earnings
Non-controlling
interest Total
$’000 $’000 $’000 $’000 $’000 $’000 $'000 $'000 $'000 $'000
Balance at 1 October 2018 153,827,330 (1,050,785) (147,034,858) 5,449,609 3,224,798 6,598,442 39,250,000 67,987,338 9,506,204 137,758,078
Total comprehensive income as previously presented
- - - 7,709,337 - - - 29,099,367 1,576,390 38,385,094
Transfer from Loan Loss Reserve - - - - (277,174) - - 277,174 - -
Transfer to Banking Reserve Fund - - - - - 26,767 - (26,767) - -
Transfer to Retained Earnings Reserve
- - - - - - 4,570,000 (4,570,000) - -
Purchase of treasury shares 42 - (956,788) - - - - - - - (956,788)
Disposal of treasury shares 42 - 1,591,840 - - - - - 239,246 - 1,831,086
Non-controlling interest on acquisition of subsidiary
54 - - - - - - - - 29,069,702 29,069,702
Recognition of treasury shares on acquisition of subsidiary
- (10,340,520) - - - - - - - (10,340,520)
Dividends paid to non-controlling interest
- - - - - - - - (415,704) (415,704)
Transaction with owners of the Company
Dividends paid 53 - - - - - - - (8,297,152) - (8,297,152)
Balance at September 30, 2019 as previously presented
153,827,330 (10,756,253) (147,034,858) 13,158,946 2,947,624 6,625,209 43,820,000 84,709,206 39,736,592 187,033,796
Impact of revised Purchase Price Allocation on acquisition of majority stake in Guardian Holding Limited
- - - - - - - 292,975 (3,456,153) (3,163,178)
Balance at October 1, 2019 - Restated
153,827,330 (10,756,253) (147,034,858) 13,158,946 2,947,624 6,625,209 43,820,000 85,002,181 36,280,439 183,870,618
Total comprehensive income - - - (942,286) - - - 19,492,552 7,809,806 26,360,072
Transfer from Loan Loss Reserve - - - - (2,947,624) - - 2,947,624 - -
Transfer to Banking Reserve Fund - - - - - 109,854 - (109,854) - -
Transfer to Retained Earnings Reserve
- - - - - - 14,760,000 (14,760,000) - -
Purchase of treasury shares 42 - (4,443,775) - - - - - - - (4,443,775)
Disposal of treasury shares 42 - 49,827 - - - - - (49,827) - -
Dividends paid to non-controlling interest
- - - - - - - (166,953) - (166,953)
Transaction with owners of the Company
-
Dividends paid - - - - - - - (5,415,039) - (5,415,039)
Balance at September 30, 2020 153,827,330 (15,150,201) (147,034,858) 12,216,660 - 6,735,063 58,580,000 86,940,684 44,090,245 200,204,923
Page 6
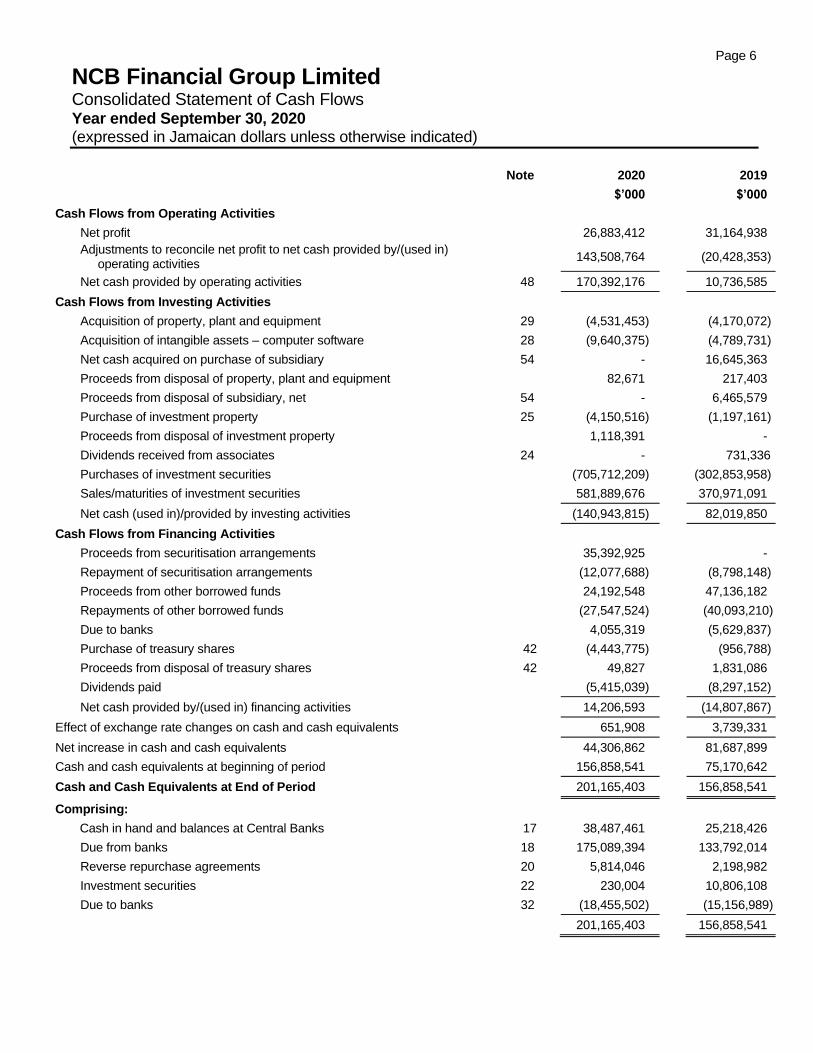
NCB Financial Group Limited Consolidated Statement of Cash Flows Year ended September 30, 2020 (expressed in Jamaican dollars unless otherwise indicated)
Note 2020 2019
$’000 $’000
Cash Flows from Operating Activities
Net profit 26,883,412 31,164,938
Adjustments to reconcile net profit to net cash provided by/(used in) operating activities
143,508,764 (20,428,353)
Net cash provided by operating activities 48 170,392,176 10,736,585
Cash Flows from Investing Activities
Acquisition of property, plant and equipment 29 (4,531,453) (4,170,072)
Acquisition of intangible assets – computer software 28 (9,640,375) (4,789,731)
Net cash acquired on purchase of subsidiary 54 - 16,645,363
Proceeds from disposal of property, plant and equipment 82,671 217,403
Proceeds from disposal of subsidiary, net 54 - 6,465,579
Purchase of investment property 25 (4,150,516) (1,197,161)
Proceeds from disposal of investment property 1,118,391 -
Dividends received from associates 24 - 731,336
Purchases of investment securities (705,712,209) (302,853,958)
Sales/maturities of investment securities 581,889,676 370,971,091
Net cash (used in)/provided by investing activities (140,943,815) 82,019,850
Cash Flows from Financing Activities
Proceeds from securitisation arrangements 35,392,925 -
Repayment of securitisation arrangements (12,077,688) (8,798,148)
Proceeds from other borrowed funds 24,192,548 47,136,182
Repayments of other borrowed funds (27,547,524) (40,093,210)
Due to banks 4,055,319 (5,629,837)
Purchase of treasury shares 42 (4,443,775) (956,788)
Proceeds from disposal of treasury shares 42 49,827 1,831,086
Dividends paid (5,415,039) (8,297,152)
Net cash provided by/(used in) financing activities 14,206,593 (14,807,867)
Effect of exchange rate changes on cash and cash equivalents 651,908 3,739,331
Net increase in cash and cash equivalents 44,306,862 81,687,899
Cash and cash equivalents at beginning of period 156,858,541 75,170,642
Cash and Cash Equivalents at End of Period 201,165,403 156,858,541
Comprising:
Cash in hand and balances at Central Banks 17 38,487,461 25,218,426
Due from banks 18 175,089,394 133,792,014
Reverse repurchase agreements 20 5,814,046 2,198,982
Investment securities 22 230,004 10,806,108
Due to banks 32 (18,455,502) (15,156,989)
201,165,403 156,858,541
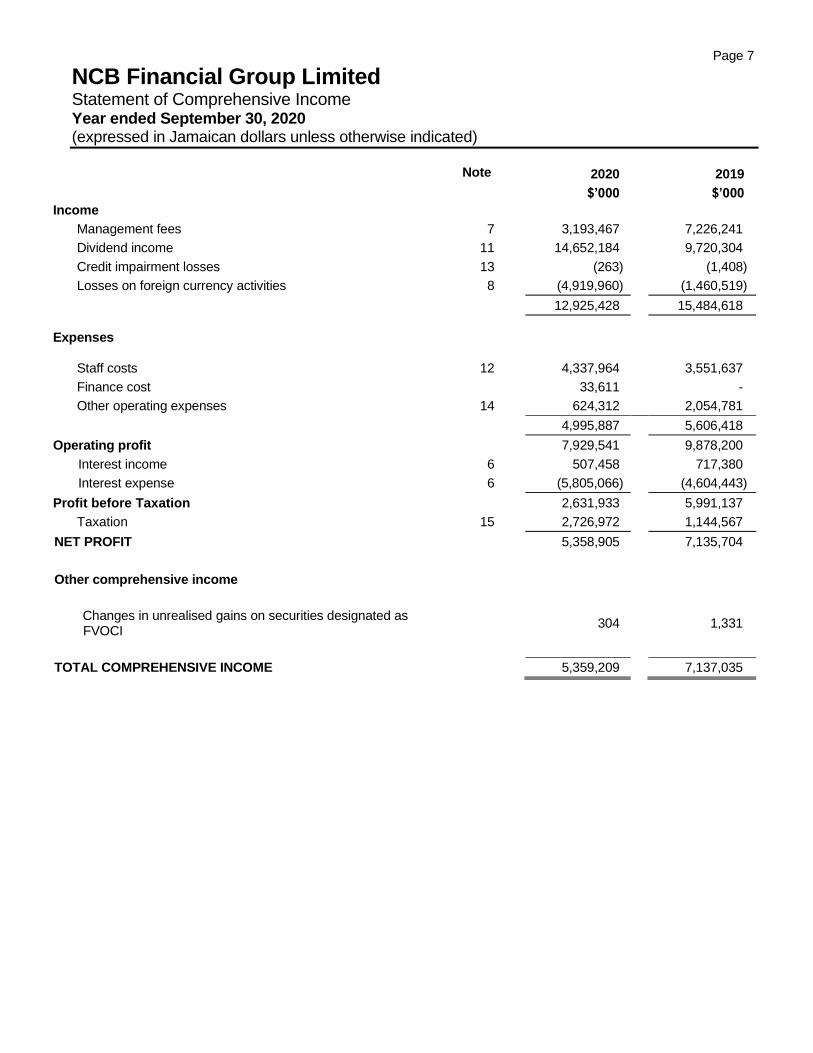
Page 7
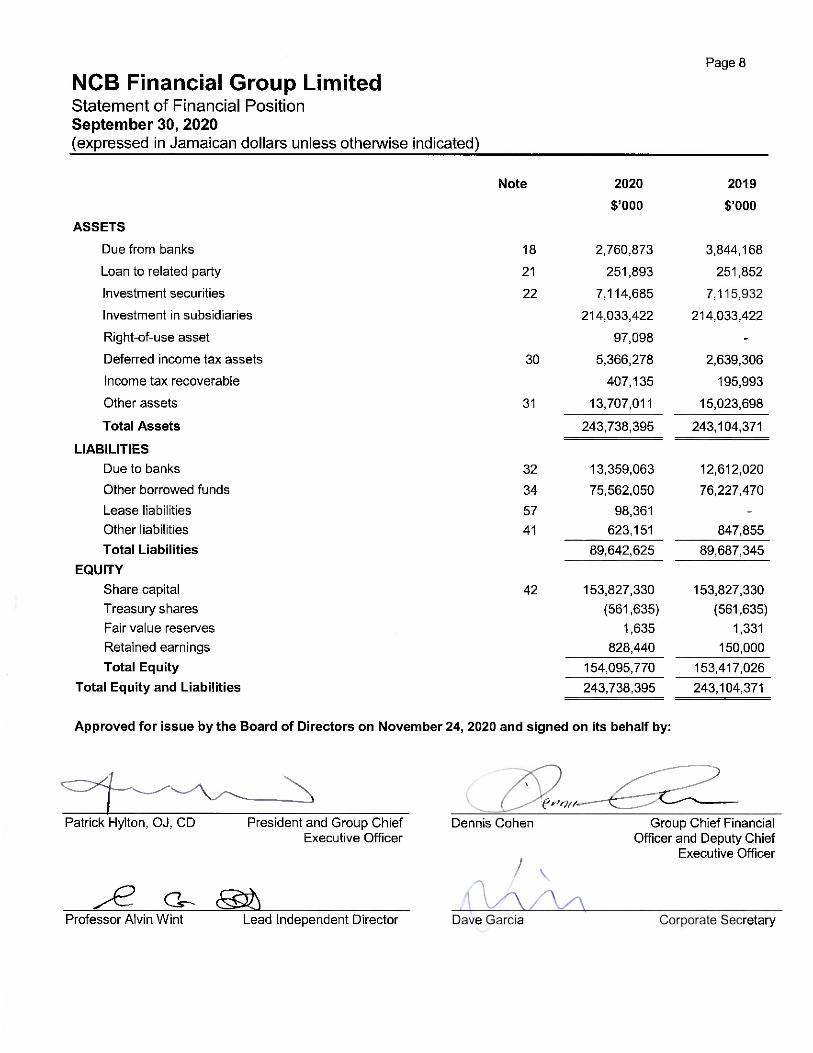
NCB Financial Group Limited Statement of Comprehensive Income Year ended September 30, 2020 (expressed in Jamaican dollars unless otherwise indicated)
Note 2020 2019
$’000 $’000
Income
Management fees 7 3,193,467 7,226,241
Dividend income 11 14,652,184 9,720,304
Credit impairment losses 13 (263) (1,408)
Losses on foreign currency activities 8 (4,919,960) (1,460,519)
12,925,428 15,484,618
Expenses
Staff costs 12 4,337,964 3,551,637
Finance cost 33,611 -
Other operating expenses 14 624,312 2,054,781
4,995,887 5,606,418
Operating profit 7,929,541 9,878,200
Interest income 6 507,458 717,380
Interest expense 6 (5,805,066) (4,604,443)
Profit before Taxation 2,631,933 5,991,137
Taxation 15 2,726,972 1,144,567
NET PROFIT 5,358,905 7,135,704
Other comprehensive income
Changes in unrealised gains on securities designated as FVOCI
304
1,331
TOTAL COMPREHENSIVE INCOME 5,359,209 7,137,035
Page 9
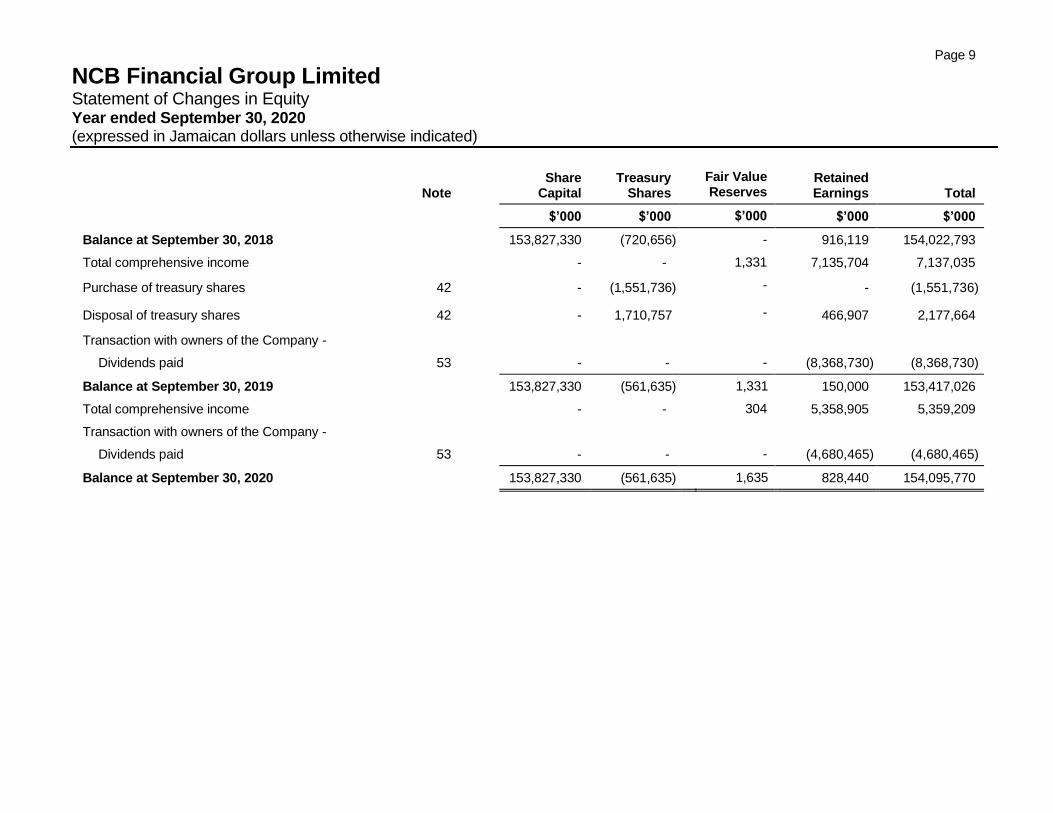
NCB Financial Group Limited Statement of Changes in Equity Year ended September 30, 2020 (expressed in Jamaican dollars unless otherwise indicated)
Note Share
Capital Treasury
Shares
Fair Value Reserves
Retained Earnings Total
$’000 $’000 $’000 $’000 $’000
Balance at September 30, 2018 153,827,330 (720,656) - 916,119 154,022,793
Total comprehensive income - - 1,331 7,135,704 7,137,035
Purchase of treasury shares 42 - (1,551,736) - - (1,551,736)
Disposal of treasury shares 42 - 1,710,757 - 466,907 2,177,664
Transaction with owners of the Company -
Dividends paid 53 - - - (8,368,730) (8,368,730)
Balance at September 30, 2019 153,827,330 (561,635) 1,331 150,000 153,417,026
Total comprehensive income - - 304 5,358,905 5,359,209
Transaction with owners of the Company -
Dividends paid 53 - - - (4,680,465) (4,680,465)
Balance at September 30, 2020 153,827,330 (561,635) 1,635 828,440 154,095,770
Page 10
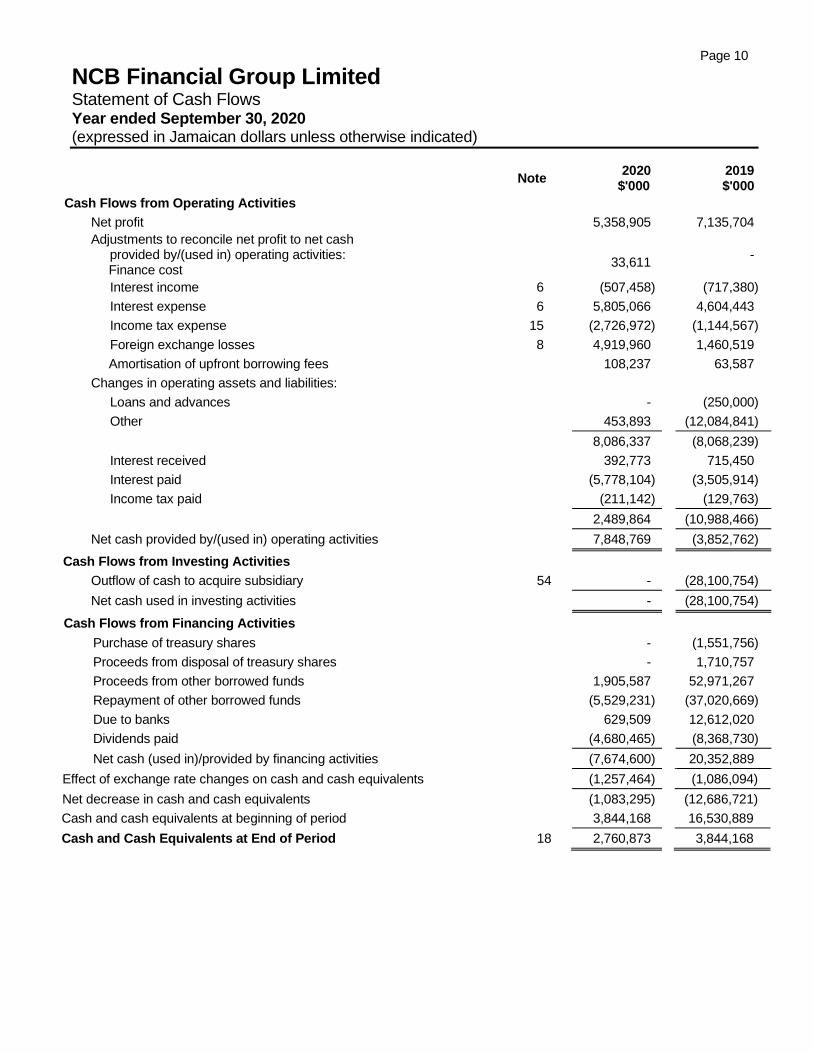
NCB Financial Group Limited Statement of Cash Flows Year ended September 30, 2020 (expressed in Jamaican dollars unless otherwise indicated)
Note 2020
$'000 2019
$'000
Cash Flows from Operating Activities
Net profit 5,358,905 7,135,704
Adjustments to reconcile net profit to net cash provided by/(used in) operating activities:
Finance cost
33,611
-
Interest income 6 (507,458) (717,380)
Interest expense 6 5,805,066 4,604,443
Income tax expense 15 (2,726,972) (1,144,567)
Foreign exchange losses 8 4,919,960 1,460,519
Amortisation of upfront borrowing fees 108,237 63,587
Changes in operating assets and liabilities:
Loans and advances - (250,000)
Other 453,893 (12,084,841)
8,086,337 (8,068,239)
Interest received 392,773 715,450
Interest paid (5,778,104) (3,505,914)
Income tax paid (211,142) (129,763)
2,489,864 (10,988,466)
Net cash provided by/(used in) operating activities 7,848,769 (3,852,762)
Cash Flows from Investing Activities
Outflow of cash to acquire subsidiary 54 - (28,100,754)
Net cash used in investing activities - (28,100,754)
Cash Flows from Financing Activities
Purchase of treasury shares - (1,551,756)
Proceeds from disposal of treasury shares - 1,710,757
Proceeds from other borrowed funds 1,905,587 52,971,267
Repayment of other borrowed funds (5,529,231) (37,020,669)
Due to banks 629,509 12,612,020
Dividends paid (4,680,465) (8,368,730)
Net cash (used in)/provided by financing activities (7,674,600) 20,352,889
Effect of exchange rate changes on cash and cash equivalents (1,257,464) (1,086,094)
Net decrease in cash and cash equivalents (1,083,295) (12,686,721)
Cash and cash equivalents at beginning of period 3,844,168 16,530,889
Cash and Cash Equivalents at End of Period 18 2,760,873 3,844,168
Page 11
NCB Financial Group Limited Notes to the Financial Statements September 30, 2020 (expressed in Jamaican dollars unless otherwise indicated)
1. Identification and Principal Activities
NCB Financial Group Limited (“the Company”) is a financial holding company, incorporated and domiciled in Jamaica. The Company is 52.10% (2019 – 53.08%) owned by AIC (Barbados) Limited. The ultimate parent company is Portland Holdings Inc., incorporated in Canada. Portland Holdings Inc. is controlled by Hon. Michael A. Lee-Chin, OJ, Chairman of the Company.
The Company’s registered office is located at 32 Trafalgar Road, Kingston 10, Jamaica. The Company’s ordinary stock units are listed on the Jamaica Stock Exchange and the Trinidad and Tobago
Stock Exchange.
Page 12
NCB Financial Group Limited Notes to the Financial Statements September 30, 2020 (expressed in Jamaican dollars unless otherwise indicated)
1. Identification and Principal Activities (Continued)
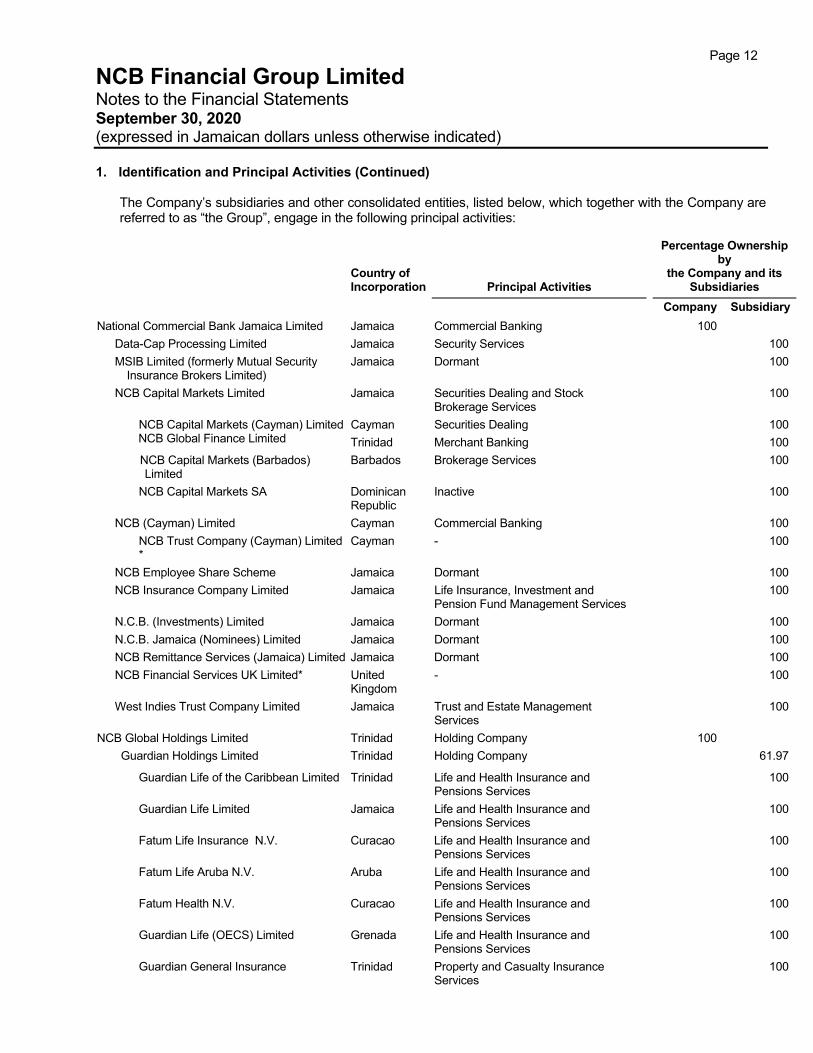
The Company’s subsidiaries and other consolidated entities, listed below, which together with the Company are referred to as “the Group”, engage in the following principal activities:
Country of Incorporation Principal Activities
Percentage Ownership by
the Company and its Subsidiaries
Company Subsidiary
National Commercial Bank Jamaica Limited Jamaica Commercial Banking 100
Data-Cap Processing Limited Jamaica Security Services 100
MSIB Limited (formerly Mutual Security Insurance Brokers Limited)
Jamaica Dormant 100
NCB Capital Markets Limited Jamaica Securities Dealing and Stock Brokerage Services
100
NCB Capital Markets (Cayman) Limited Cayman Securities Dealing 100 NCB Global Finance Limited Trinidad Merchant Banking 100
NCB Capital Markets (Barbados) Limited
Barbados Brokerage Services 100
NCB Capital Markets SA Dominican Republic
Inactive 100
NCB (Cayman) Limited Cayman Commercial Banking 100
NCB Trust Company (Cayman) Limited *
Cayman - 100
NCB Employee Share Scheme Jamaica Dormant 100
NCB Insurance Company Limited Jamaica Life Insurance, Investment and Pension Fund Management Services
100
N.C.B. (Investments) Limited Jamaica Dormant 100
N.C.B. Jamaica (Nominees) Limited Jamaica Dormant 100
NCB Remittance Services (Jamaica) Limited Jamaica Dormant 100
NCB Financial Services UK Limited* United Kingdom
- 100
West Indies Trust Company Limited Jamaica Trust and Estate Management Services
100
NCB Global Holdings Limited Trinidad Holding Company 100
Guardian Holdings Limited Trinidad Holding Company 61.97
Guardian Life of the Caribbean Limited Trinidad Life and Health Insurance and Pensions Services
100
Guardian Life Limited Jamaica Life and Health Insurance and Pensions Services
100
Fatum Life Insurance N.V. Curacao Life and Health Insurance and Pensions Services
100
Fatum Life Aruba N.V. Aruba Life and Health Insurance and Pensions Services
100
Fatum Health N.V. Curacao Life and Health Insurance and Pensions Services
100
Guardian Life (OECS) Limited Grenada Life and Health Insurance and Pensions Services
100
Guardian General Insurance Trinidad Property and Casualty Insurance Services
100
Page 13
NCB Financial Group Limited Notes to the Financial Statements September 30, 2020 (expressed in Jamaican dollars unless otherwise indicated)
1. Identification and Principal Activities (Continued)
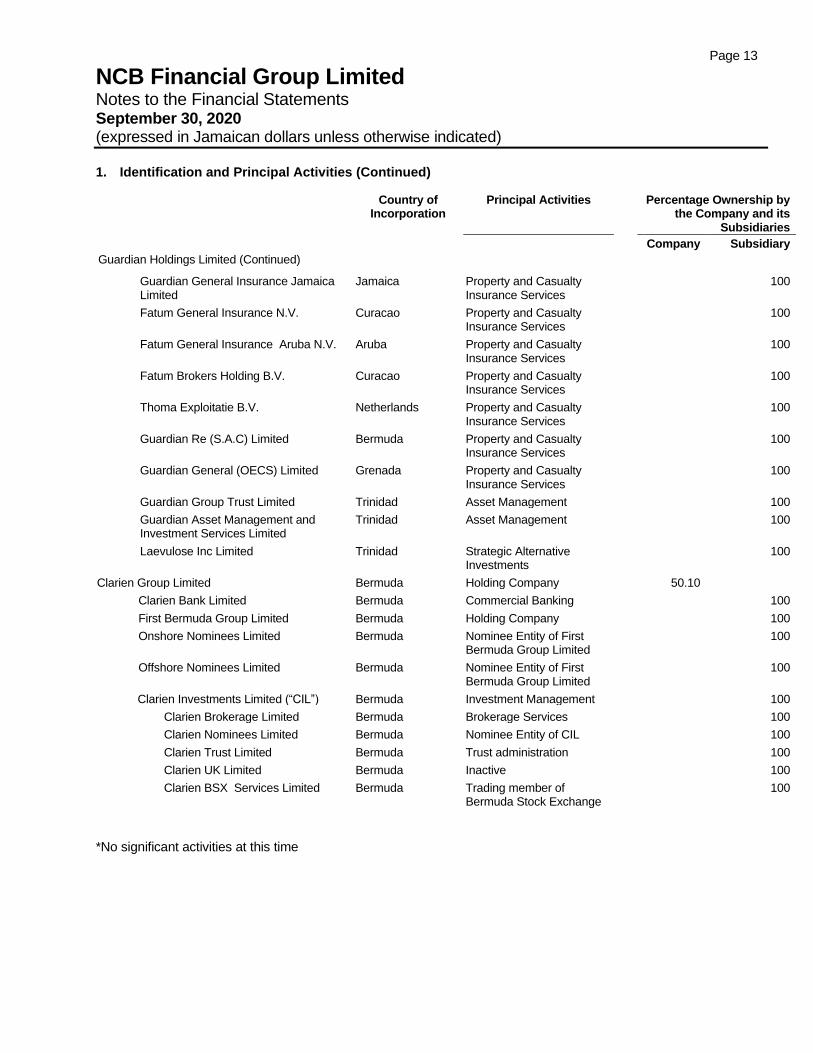
*No significant activities at this time
Country of
Incorporation Principal Activities Percentage Ownership by
the Company and its Subsidiaries
Company Subsidiary
Guardian Holdings Limited (Continued)
Guardian General Insurance Jamaica Limited
Jamaica Property and Casualty Insurance Services
100
Fatum General Insurance N.V. Curacao Property and Casualty Insurance Services
100
Fatum General Insurance Aruba N.V. Aruba Property and Casualty Insurance Services
100
Fatum Brokers Holding B.V. Curacao Property and Casualty Insurance Services
100
Thoma Exploitatie B.V. Netherlands Property and Casualty Insurance Services
100
Guardian Re (S.A.C) Limited Bermuda Property and Casualty Insurance Services
100
Guardian General (OECS) Limited Grenada Property and Casualty Insurance Services
100
Guardian Group Trust Limited Trinidad Asset Management 100
Guardian Asset Management and Investment Services Limited
Trinidad Asset Management 100
Laevulose Inc Limited Trinidad Strategic Alternative Investments
100
Clarien Group Limited Bermuda Holding Company 50.10
Clarien Bank Limited Bermuda Commercial Banking 100
First Bermuda Group Limited Bermuda Holding Company 100
Onshore Nominees Limited Bermuda Nominee Entity of First Bermuda Group Limited
100
Offshore Nominees Limited Bermuda Nominee Entity of First Bermuda Group Limited
100
Clarien Investments Limited (“CIL”) Bermuda Investment Management 100
Clarien Brokerage Limited Bermuda Brokerage Services 100
Clarien Nominees Limited Bermuda Nominee Entity of CIL 100
Clarien Trust Limited Bermuda Trust administration 100
Clarien UK Limited Bermuda Inactive 100
Clarien BSX Services Limited Bermuda Trading member of Bermuda Stock Exchange
100
Page 14
NCB Financial Group Limited Notes to the Financial Statements September 30, 2020 (expressed in Jamaican dollars unless otherwise indicated)
1. Identification and Principal Activities (Continued)
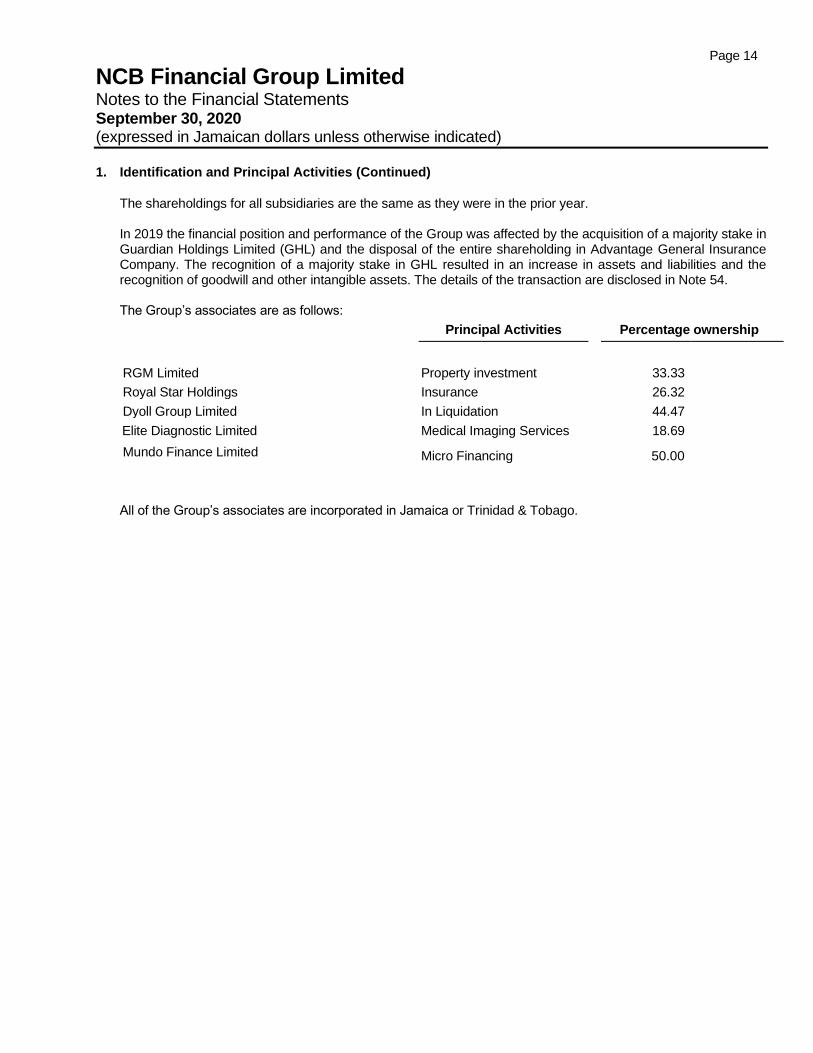
The shareholdings for all subsidiaries are the same as they were in the prior year. In 2019 the financial position and performance of the Group was affected by the acquisition of a majority stake in Guardian Holdings Limited (GHL) and the disposal of the entire shareholding in Advantage General Insurance Company. The recognition of a majority stake in GHL resulted in an increase in assets and liabilities and the recognition of goodwill and other intangible assets. The details of the transaction are disclosed in Note 54. The Group’s associates are as follows:
Principal Activities Percentage ownership
RGM Limited Property investment 33.33
Royal Star Holdings Insurance 26.32
Dyoll Group Limited In Liquidation 44.47
Elite Diagnostic Limited Medical Imaging Services 18.69
Mundo Finance Limited Micro Financing 50.00
All of the Group’s associates are incorporated in Jamaica or Trinidad & Tobago.
Page 15
NCB Financial Group Limited Notes to the Financial Statements September 30, 2020 (expressed in Jamaican dollars unless otherwise indicated)
2. Significant Accounting Policies
(a) Basis of preparation
These financial statements have been prepared in accordance with and comply with International Financial Reporting Standards (IFRS) and interpretations issued by the IFRS Interpretations Committee (IFRS IC) applicable to companies reporting under IFRS and have been prepared under the historical cost convention as modified by the revaluation of FVOCI securities, derivatives, investment property, certain property, plant and equipment, defined benefit pension plans where plan assets are measured at fair value and financial assets and liabilities at fair value through profit or loss. The preparation of financial statements in conformity with IFRS requires the use of certain critical accounting estimates. It also requires management to exercise its Judgment in the process of applying the Group’s accounting policies. Although these estimates are based on management’s best knowledge of current events and action, actual results could differ from these estimates. The areas involving a higher degree of Judgment or complexity, or areas where assumptions and estimates are significant to the financial statements are disclosed in Note 3.
Standards, interpretations and amendments to existing standards effective during the current year
Certain new standards, interpretations and amendments to existing standards have been published that
became effective during the current financial year. The Group has assessed the relevance of all such new
interpretations and amendments, and has adopted the following, which are relevant to its operations:
Amendment to IFRS 9, ‘Financial Instruments’, on prepayment features with negative compensation
and modification of financial liabilities (effective for annual periods beginning on or after January 1, 2019
(October 1, 2019 for the Group)).This amendment confirmed two points: i.) that reasonable compensation
for prepayments can be both negative or positive cash flows when considering whether a financial asset
solely has cash flows that are principal and interest and ii.) that when a financial liability measured at
amortised cost is modified without this resulting in de-recognition, a gain or loss should be recognised
immediately in profit or loss. The gain or loss is calculated as the difference between the original contractual
cash flows and the modified cash flows discounted at the original effective interest rate. This means that the
difference cannot be spread over the remaining life of the instrument which may be a change in practice from
IAS 39. There was no significant impact from the adoption of these amendments during the year.
IFRS 16, ‘Leases’, (effective for annual periods beginning on or after January 1, 2019) was issued in
January 2017 and replaces IAS 17, ‘Leases’. The standard introduces a single lessee accounting model
and requires a lessee to recognise assets and liabilities for all leases with a term of more than 12 months,
unless the underlying asset is of low value. A lessee is required to recognise a right-of-use asset
representing its right to use the underlying leased asset and a lease liability representing its obligation to
make lease payments.
IFRS 16 substantially carries forward the lessor accounting requirements in IAS 17. Accordingly, a lessor continues to classify its leases as operating leases or finance leases, and to account for those two types of leases differently. IFRS16 also requires enhanced disclosures to be provided by lessors and lessees that will improve information provided to users of the financial statements. The impact on the Group of implementing IFRS 16 is discussed in Notes 57 and 59 to the financial statements.
Page 16
NCB Financial Group Limited Notes to the Financial Statements September 30, 2020 (expressed in Jamaican dollars unless otherwise indicated)
2. Significant Accounting Policies (Continued)
(a) Basis of preparation (continued)
Standards, interpretations and amendments to existing standards effective during the current year
(continued)
Annual improvements to IFRS 2015-2017 Cycle – Amendments to IFRS 3, (effective for annual periods
beginning on or after January 1, 2019, (October 1, 2019 for the Group)). The amendment to IAS 12, ‘Income
taxes’ clarifies that a group accounts for all income tax consequences of dividend payments in the same
way. The amendment to IAS 23, ‘Borrowing costs’ clarifies that a group treats as part of general borrowings
any borrowing originally made to develop an asset when the asset is ready for its intended use or sale. There
was no significant impact from the adoption of these amendments during the year.
Amendments to IAS 19, ‘Employee benefits’ on plan amendment, curtailment or settlement’, (effective
for annual periods beginning on or after January 1, 2019, (October 1, 2019 for the Group)). These
amendments require an entity to use updated assumptions to determine current service cost and net interest
for the reminder of the period after a plan amendment, curtailment or settlement. The amendment is
recognised in profit or loss as part of past service cost, or a gain or loss on settlement, any reduction in a
surplus, even if that surplus was not previously recognised because of the impact of the asset ceiling. There
was no significant impact from the adoption of these amendments during the year.
IFRIC 23, ‘Uncertainty over income tax treatments’, (effective for annual periods beginning on or after
January 1, 2019, (October 1, 2019 for the Group)). This Interpretation clarifies how to apply the recognition
and measurement requirements in IAS 12 when there is uncertainty over income tax treatments. An
uncertain tax treatment is any tax treatment applied by an entity where there is uncertainty over whether that
treatment will be accepted by the tax authority. For example, a decision to claim a deduction for a specific
expense or not to include a specific item of income in a tax return is an uncertain tax treatment if its
acceptability is uncertain under tax law. IFRIC 23 applies to all aspects of income tax accounting where there
is an uncertainty regarding the treatment of an item, including taxable profit or loss, the tax bases of assets
and liabilities, tax losses and credits and tax rates. There was no significant impact from the adoption of this
interpretation during the year.
Standards, amendments and interpretations to existing standards that are not yet effective and have not been early adopted by the Group
At the date of authorisation of these financial statements, certain new standards, amendments and
interpretations to existing standards have been issued which are not effective at the date of the statement
of financial position, and which the Group has not early adopted.
Amendments to IFRS 3 – definition of a business, (effective for annual periods beginning on or after
January 1, 2020, (October 1, 2020 for the Group)). This amendment revises the definition of a business.
According to feedback received by the IASB, application of the current guidance is commonly thought to
be too complex, and it results in too many transactions qualifying as business combinations.
Amendments to IAS 1 and IAS 8 on the definition of material, (effective for annual periods beginning
on or after 1 January 2020, (1 October 2020 for the Group)). These amendments to IAS 1, ‘Presentation
of financial statements’ and IAS 8, ‘Accounting policies, changes in accounting estimates and errors’, and
consequential amendments to other IFRSs: i) use a consistent definition of materiality throughout IFRSs
and the Conceptual Framework for Financial Reporting; ii) clarify the definition of material; and iii)
incorporate some of the guidance in IAS 1 about material information.
Page 17
NCB Financial Group Limited Notes to the Financial Statements September 30, 2020 (expressed in Jamaican dollars unless otherwise indicated)
2. Significant Accounting Policies (Continued)
(a) Basis of preparation (continued)
Standards, amendments and interpretations to existing standards that are not yet effective and
have not been early adopted by the Group (continued)
Amendments to IFRS 9, IAS 39 and IFRS 7 – interest rate benchmark reform, (effective for annual
periods beginning on or after January 1, 2020, (October 1, 2020 for the Group)). These amendments
provide certain reliefs in connection with interest rate benchmark reform. The reliefs relate to hedge
accounting and have the effect that inter-bank offered rate (IBOR) reform should not generally cause
hedge accounting to terminate. However, any hedge effectiveness should continue to be recorded in the
income statement. Given the pervasive nature of hedges involving IBOR based contracts, the reliefs will
affect all companies.
Amendments to IFRS 16, ‘Leases’ – COVID-19 related rent recession, (effective for annual periods
beginning on or after June 1, 2020). As a result of the coronavirus (COVID-19) pandemic, rent concessions
have been granted to lessees. Such concessions might take a variety of forms, including payment holidays
and deferral of lease payments. On May 28, 2020, the IASB published an amendment to IFRS 16 that
provides an optional practical expedient for lessees from assessing whether a rent concession related to
COVID-19 is a lease modification. Lessees can elect to account for such rent concessions in the same
way as they would if they were not lease modifications. In many cases, this will result in accounting for the
concession as variable lease payments in the period(s) in which the event of condition that triggers the
reduced payment occurs. Amendments to IFRS 17, ‘Insurance contracts’, (effective for annual periods beginning on or after
January 1, 2023). This standard replaces IFRS 4, which currently permits a wide variety of practices in
accounting for insurance contracts. IFRS 17 will fundamentally change the accounting by all entities that
issue insurance contracts and investment contracts with discretionary participation features.
Amendments to IAS 1, Presentation of financial statements on classification of liabilities, (effective
for annual periods beginning on or after January 1, 2022). The narrow-scope amendments to
IAS 1, ‘Presentation of financial statements’, clarify that liabilities are classified as either current or non-
current, depending on the rights that exist at the end of the reporting period. Classification is unaffected
by the expectations of the entity or events after the reporting date (for example, the receipt of a waiver or
a breach of covenant). The amendment also clarifies what IAS 1 means where it refers to the ‘settlement’
of a liability.
Amendments to IFRS 3, IAS 16, IAS 17 and some annual improvements on IFRS 1, IFRS 9, and IFRS
16, (effective for annual periods beginning on or after January 1, 2022). Amendments to IFRS 3, ‘Business
combinations’ update a reference in IFRS 3 to the Conceptual Framework for Financial Reporting without
changing the accounting requirements for business combinations. Amendments to IAS 16, ‘Property, plant
and equipment’ prohibit a company from deducting from the cost of property, plant and equipment amounts
received from selling items produced while the company is preparing the asset for its intended use.
Instead, a company will recognise such sales proceeds and related costs in profit or loss. Amendments to
IAS 37, ‘Provisions, contingent liabilities and contingent assets’ specify which costs a company includes
when assessing whether a contract will be loss-making. Annual improvements make minor amendments
to IFRS 1, ‘First-time Adoption of IFRS’, IFRS 9, ‘Financial instruments’, and the illustrative examples
accompanying IFRS 16, ‘Leases’.

Page 18
NCB Financial Group Limited Notes to the Financial Statements September 30, 2020 (expressed in Jamaican dollars unless otherwise indicated)
2. Significant Accounting Policies (Continued)
(b) Basis of consolidation Subsidiaries Subsidiaries are those entities which the Group controls because the Group (i) has power to direct relevant activities of the entities that significantly affect their returns, (ii) has exposure, or rights, to variable returns from its involvement with the entities, and (iii) has the ability to use its power over the entities to affect the amount of the entities’ returns. The existence and effect of substantive rights, including substantive potential voting rights, are considered when assessing whether the Group has power over another entity. For a right to be substantive the holder must have practical ability to exercise that right when decisions about the direction of the relevant activities of the entities need to be made. The Group may have power over an entity even when it holds no ownership interests in the entity, or when it holds less than a majority of voting power in an entity. In such cases, the Group exercises Judgment and assesses its power to direct the relevant activities of the entity, as well as its voting rights relative to the size and dispersion of holdings of the other vote holders to determine if it has de-facto power over the entity. Protective rights of other investors, such as those that relate to fundamental changes in the entity’s activities or apply only in exceptional circumstances, do not prevent the Group from controlling an entity. Subsidiaries are consolidated from the date on which control is transferred to the Group and are no longer consolidated from the date that control ceases. The Group uses the acquisition method of accounting to account for business combinations. The consideration transferred for the acquisition of a subsidiary is the fair value of the assets transferred, the liabilities incurred and the equity interests issued by the Group. The consideration transferred includes the fair value of any asset or liability resulting from a contingent consideration arrangement. Acquisition-related costs are expensed as incurred. Identifiable assets and liabilities acquired and contingent liabilities assumed in a business combination are measured initially at their fair values at the acquisition date. On an acquisition-by-acquisition basis, the Group recognises any non-controlling interest in the acquiree either at fair value or at the non-controlling interest’s proportionate share of the acquiree’s net assets. The excess of the cost of the acquisition, the non-controlling interest recognised and the fair value of any previously held equity interest in the acquiree, over the fair value of the net identifiable assets acquired is recorded as goodwill. If there is no excess and there is a shortfall, the Group reassesses the net identifiable assets acquired. If after reassessment, a shortfall remains, the acquisition is deemed to be a bargain purchase and the shortfall is recognised in income as a gain on acquisition. Any non- controlling interest balances represent the equity in a subsidiary not attributable to NCBFG’s stockholders. Intercompany transactions, balances and unrealised gains and losses on transactions between Group companies are eliminated. Accounting policies of subsidiaries have been changed, where necessary, to ensure consistency with the policies adopted by the Group. In the Company’s separate financial statements, investments in subsidiaries are accounted for at cost less impairment. Associates Associates are all entities over which the Group has significant influence but not control, generally accompanying a shareholding of between 20% and 50% of the voting rights. The Group’s investments in associates include goodwill identified on acquisition.
Page 19
NCB Financial Group Limited Notes to the Financial Statements September 30, 2020 (expressed in Jamaican dollars unless otherwise indicated)
2. Significant Accounting Policies (Continued)
(b) Basis of consolidation (continued)
Associates (continued) The Group’s share of its associates’ post-acquisition profits or losses is recognised in the consolidated income statement, and its share of post-acquisition movements in reserves is recognised in other comprehensive income. The cumulative post-acquisition movements are adjusted against the carrying amount of the investment. When the Group’s share of losses in an associate equals or exceeds its interest in the associate, including any other unsecured receivables, the Group does not recognise further losses, unless it has incurred obligations or made payments on behalf of the associate. Unrealised gains on transactions between the Group and its associates are eliminated to the extent of the Group’s interest in the associates. Unrealised losses are also eliminated unless the transaction provides evidence of an impairment of the asset transferred. The Group determines at each reporting date whether there is any objective evidence that investments in associates are impaired. If this is the case, the Group recognises an impairment charge in the income statement for the difference between the recoverable amount of the associate and its carrying value. The results of associates with financial reporting year-ends that are different from the Group are determined by using the results for the most recent audited period as well as the period covered by management accounts to ensure that a year’s result is accounted for where applicable. Investments in associates are accounted for using the equity method of accounting (as described above), and are initially recognised at cost. In the Company’s separate financial statements, investments in associates are accounted for at cost less impairment.
(c) Segment reporting An operating segment is a component of the Group that engages in business activities from which it earns revenues and incurs expenses and whose operating results are regularly reviewed by the chief operating decision maker to make decisions about resources to be allocated to the segment. Operating segments are reported in a manner consistent with the internal reporting to the chief operating decision maker. The chief operating decision maker is the President and Group Chief Executive Officer.
Page 20
NCB Financial Group Limited Notes to the Financial Statements September 30, 2020 (expressed in Jamaican dollars unless otherwise indicated)
2. Significant Accounting Policies (Continued)
(d) Foreign currency translation
Functional and presentation currency
Items included in the financial statements of each of the Group’s entities are measured using the currency of the primary economic environment in which the entity operates (“the functional currency”). The financial statements are presented in Jamaican dollars (“the presentation currency”), which is the Company’s functional currency. Transactions and balances Foreign currency transactions are accounted for at the exchange rates prevailing at the dates of the transactions. At the date of the statement of financial position, monetary assets and liabilities denominated in foreign currencies are translated using the closing exchange rate. Exchange differences resulting from the settlement of transactions at rates different from those at the dates of the transactions, and unrealised foreign exchange differences on unsettled foreign currency monetary assets and liabilities are recognised in the income statement. Exchange differences on non-monetary financial assets are a component of the change in their fair value. Depending on the classification of a non-monetary financial asset, exchange differences are either recognised in the income statement (applicable for trading securities), or within other comprehensive income if non-monetary financial assets are classified as FVOCI. In the case of changes in the fair value of monetary assets denominated in foreign currency classified as FVOCI, a distinction is made between translation differences resulting from changes in amortised cost of the security and other changes in the carrying amount of the security. Translation differences related to changes in the amortised cost are recognised in the income statement, and other changes in the carrying amount, except impairment, are recognised in other comprehensive income.
Group companies The results and financial position of all the Group entities (none of which has the currency of a hyperinflationary economy) that have a functional currency different from the presentation currency are translated into the presentation currency as follows:
• Assets and liabilities for each statement of financial position presented are translated at the closing rate at the date of that statement;
• Income and expenses for each income statement are translated at average exchange rates (unless this average is not a reasonable approximation of the cumulative effect of the rates prevailing on the transaction dates, in which case income and expenses are translated at the dates of the transactions); and
• All resulting exchange differences are recognised in other comprehensive income and accumulated as a separate component of equity.
Page 21
NCB Financial Group Limited Notes to the Financial Statements September 30, 2020 (expressed in Jamaican dollars unless otherwise indicated)
2. Significant Accounting Policies (Continued)
(e) Revenue recognition Interest income and expense Interest income and expense are recognised in the income statement for all interest-bearing instruments on an accrual basis using the effective interest method based on the actual purchase price. Interest income includes coupons earned on fixed income investments and accrued discounts on treasury bills and other discounted instruments. The effective interest method is a method of calculating the amortised cost of a financial asset or a financial liability and of allocating the interest income or interest expenses over the relevant period. The effective interest rate is the rate that exactly discounts the estimated future cash payments or receipts through the expected life of the financial instrument or, when appropriate, a shorter period to the net carrying amount of the financial asset or financial liability. When calculating the effective interest rate, the Group estimates cash flows considering the contractual terms of the financial instrument but does not consider future credit losses. The calculation includes all fees paid or received between parties to the contract that are an integral part of the effective interest rate, transaction costs and all other premiums or discounts. The Group accounts for interest income on loans in accordance with Jamaican banking regulations. These regulations stipulate that, where collection of interest is considered doubtful or where the loan is in non-performing status (payment of principal or interest is outstanding for 90 days or more), interest should be taken into account on the cash basis and all previously accrued but uncollected interest be reversed in the period that collection is doubtful or the loan becomes non-performing. IFRS require that when loans are impaired, they are written down to their recoverable amounts and interest income is thereafter recognised by applying the original effective interest rate to the recoverable amount. The difference between the regulatory and IFRS bases of interest recognition was assessed to be immaterial. Fee and commission income Fee and commission income is generally recognised on an accrual basis when the service has been provided. Fees and commissions arising from negotiating or participating in the negotiation of a transaction for a third party are recognised on completion of the underlying transaction. Premium income Premium income is recognised on the accrual basis in accordance with the terms of the underlying contracts as outlined in Note 2(w). Dividend income Dividend income is recognised when the right to receive payment is established. Rental Income Rental income is recognised on an accrual basis. Realised and unrealised investment gains and losses Realised and unrealised gains and losses on investments measured at amortised cost or fair value through profit or loss are recognised in the consolidated income statement in the period in which they arise. Dividend distributions Dividend distributions to the company’s shareholders are recognised as an appropriation in the Group’s consolidated financial statements in the period in which the dividends are approved by the Group’s Board of Directors.
Page 22
NCB Financial Group Limited Notes to the Financial Statements September 30, 2020 (expressed in Jamaican dollars unless otherwise indicated)
2. Significant Accounting Policies (Continued)
(f) Assets under management The Group provides custody and trustee discretionary investment management services to third parties. Such assets under management represent the managed funds administered by the Trust company. Subscriptions, distributions and redemptions on mutual funds portfolio Subscriptions - Units relating to the various pools of mutual funds consolidated in the Group's financial statements could be subscribed based on the net asset value per unit of the underlying funds determined on each business day. Distributions - The net income and net realised capital gains of the various pools of mutual funds are calculated and accrued to the investor daily and distributed monthly. Investors have the option either to receive a cash distribution or to reinvest income distributions into units at the prevailing subscription price as at the date of distribution. Redemptions - Units relating to the various pools of mutual funds consolidated in the Group's financial statements are redeemed at a price per unit based on the net asset value of the underlying funds published on the date that the request is made.
(g) Income taxes
Taxation expense in the income statement comprises current and deferred income tax charges. Current income tax charges are based on taxable profits for the year, which differ from the profit before tax reported because it excludes items that are taxable or deductible in other years, and items that are never taxable or deductible. The Group’s liability for current tax is calculated at tax rates that have been enacted or substantively enacted at the date of the statement of financial position. Deferred income tax is provided in full, using the liability method, on temporary differences arising between the tax bases of assets and liabilities and their carrying amounts in the financial statements. Currently enacted or substantively enacted tax rates are used in the determination of deferred income tax. Deferred tax assets are recognised to the extent that it is probable that future taxable profit will be available against which the temporary differences can be utilised. Deferred income tax is provided on temporary differences arising on investments in subsidiaries and associates, except where the timing of the reversal of the temporary difference can be controlled and it is probable that the temporary difference will not reverse in the foreseeable future. Deferred tax is charged or credited in the income statement, except where it relates to items charged or credited to other comprehensive income or equity, in which case, deferred tax is also dealt with in other comprehensive income or equity.
(h) Cash and cash equivalents
For the purpose of the statement of cash flows, cash and cash equivalents comprise balances with less than 90 days maturity from the date of acquisition including cash and balances at Central Banks (excluding statutory reserves), due from banks, investment securities, reverse repurchase agreements and due to banks.
Page 23
NCB Financial Group Limited Notes to the Financial Statements September 30, 2020 (expressed in Jamaican dollars unless otherwise indicated)
2. Significant Accounting Policies (Continued)
(i) Financial assets
The Group classifies its financial assets in the following measurement categories:
• those to be measured subsequently at fair value (either through OCI or through profit or loss), and
• those to be measured at amortised cost. The classification depends on the entity’s business model for managing the financial assets and the contractual terms of the cash flows. For assets measured at fair value, gains and losses will either be recorded in profit or loss or OCI. For investments in equity instruments that are not held for trading, this will depend on whether the Group has made an irrevocable election at the time of initial recognition to account for the equity investment at FVOCI.
Business model assessment The business models are determined at the level which best reflects how the Group manages portfolios of assets to achieve business objectives. Judgment is used in determining business models, supported by relevant and objective evidence including:
• How the performance and risks of a portfolio of assets are managed, evaluated and reported to key management and how the managers of the portfolio are compensated;
• How the Group intends to generate profits from holding the portfolio of assets;
• The past experience on how the cash flows of the portfolio of assets were collected; and
• The historical and future expectations of asset sales within a portfolio.
The Group reclassifies debt instruments only when its business model for managing those assets changes. The reclassification takes place from the start of the first reporting period following the change. Such changes are expected to be infrequent. Solely payments of principal and interest (“SPPI”) Where the business model is to collect or, to collect and sell a financial instrument’s contractual cash flows, the Group assesses whether those cash flows represent SPPI. In making this assessment, the Group considers whether the contractual cash flows are consistent with a basic lending arrangement. Where the contractual terms introduce exposure to risk or volatility that are inconsistent with a basic lending arrangement, the related financial asset is classified and measured at FVPL. The cash flows of financial assets which contain an embedded derivative are not disaggregated when determining whether their cash flows are solely payments of principal and interest but are considered in their entirety. Principal amounts include par repayments from lending and financing arrangements, and interest primarily relates to basic lending returns, including compensation for credit risk and the time value of money associated with the principal amount outstanding over a period of time. Interest can also include other basic lending risks and costs (for example, liquidity risk, servicing or administrative costs) associated with holding the financial asset for a period of time, and a profit margin.
Equity instruments The Group has elected to measure equity holdings that fall under IFRS 9 at FVPL, unless they form part of a strategic acquisition that is not held for trading purposes. Debt instruments The Group classifies portfolios of debt instruments, including hybrid contracts, based on: (i) the Group’s business model for managing the asset; and (ii) the cash flow characteristics of the asset.
Page 24
NCB Financial Group Limited Notes to the Financial Statements September 30, 2020 (expressed in Jamaican dollars unless otherwise indicated)
2. Significant Accounting Policies (Continued)
(i) Financial assets (continued) Initial recognition Financial assets and liabilities are recognised when the Group becomes party to a contractual provision of the instrument. At initial recognition, regular way purchase of financial assets are recorded at fair value. The carrying value of financial assets at initial recognition includes any directly attributable transaction costs. Purchases of financial assets are recognised on the date on which the Group becomes the beneficial owner of the security.
De-recognition
The Group derecognises a financial asset when the contractual rights to the cash flows from the financial
asset expire, or when it transfers the financial asset in a transaction in which substantially all the risks and
rewards of ownership of the financial asset are transferred, or in which the Group neither transfers nor
retains substantially all the risks and rewards of ownership and it does not retain control of the financial
asset. Any interest in transferred financial assets that qualify for de-recognition that is created or retained
by the Group is recognised as a separate asset or liability in the consolidated statement of financial
position. On de-recognition of a financial asset, the difference between the carrying amount of the asset
(or the carrying amount allocated to the portion of the asset transferred), and the sum of (i) the
consideration received (including any new asset obtained less any new liability assumed) and (ii) any
cumulative gain or loss that had been recognised in other comprehensive income (“OCI”) is recognised in
profit or loss.
The Group derecognises a financial liability when its contractual obligations are discharged, cancelled or expired. Classification of financial assets Financial assets are measured based on the business model and the resulting classification. As
required by IFRS 9, the Group applies a principles-based approach to the classification of financial
assets on its business model and the nature of the cash flows of the asset. Financial instruments are
classified as either:
• FVPL • FVOCI or • amortised cost
Financial assets measured at fair value through profit and loss (FVPL) Financial instruments are classified in this category if they meet one of the criteria set out below and are so designated irrevocably at inception: • this designation removes or significantly reduces an accounting mismatch; or • when a group of financial assets and liabilities or a group of financial liabilities is managed and its
performance is evaluated on a fair value basis, in accordance with a documented risk management or investment strategy, or
• the financial instrument is held for trading purposes. • The financial instrument is a derivative that is not designated as a hedge.
Page 25
NCB Financial Group Limited Notes to the Financial Statements September 30, 2020 (expressed in Jamaican dollars unless otherwise indicated)
2. Significant Accounting Policies (Continued)
(i) Financial assets (continued) Financial assets measured at fair value through other comprehensive income (FVOCI) Financial assets held for a business model that is achieved by both collecting and selling contractual cash flows and that contain contractual terms that give rise on specified dates to cash flows that SPPI are measured at FVOCI. Movements in the carrying amount are taken through OCI, except for the recognition of impairment gains and losses, interest income and foreign exchange gains and losses which are recognised in profit or loss. When the financial asset is derecognised, the cumulative gain or loss previously recognised in OCI is reclassified from equity to profit or loss and recognised in net gains / (losses) on investment securities. Foreign exchange gains or losses are presented in gain on foreign currency and investment activities and impairment losses are presented as a separate line item in the income statement, as credit impairment losses. Financial assets measured at amortised cost Financial assets that are held to collect the contractual cash flows and that contain contractual terms that give rise on specified dates to cash flows that are SPPI are measured at amortised cost. Any gain or loss arising on derecognition is recognised directly in profit or loss together with foreign exchange gains or losses in gain on foreign currency and investment activities. Impairment losses are presented as a separate line item in the income statement, as credit impairment losses.
Impairment of financial assets Under IFRS 9 the Group applies an impairment model that recognises expected credit losses (“ECL”) on financial assets measured at amortised cost and FVOCI and off balance sheet loan commitments and financial guarantees which were previously provided for under IAS 37 Provisions, Contingent Liabilities and Contingent Assets. An allowance (or provision in the case of some loan commitments and financial guarantees) is required for ECL resulting from default events that are possible within the next 12 months (or less, where the remaining life is less than 12 months) (‘12-month ECL’). In the event of a significant increase in credit risk (SICR) an allowance (or provision) is required for ECL resulting from all possible default events over the expected life of the financial instrument (‘lifetime ECL’). Financial assets where 12-month ECL is recognised are considered to be ‘stage 1’; financial assets which are considered to have experienced a significant increase in credit risk are in ‘stage 2’; and financial assets for which there is objective evidence of impairment and are therefore considered to be in default or otherwise credit-impaired are in ‘stage 3’. To determine whether the life-time credit risk has increased significantly since initial recognition, the Group considers reasonable and supportable information that is available, including information from the past as well as forward-looking information. Factors such as whether payments of principal and interest are in delinquency, an adverse change in credit rating of the borrower and adverse changes in the borrower’s industry and economic environment are considered in determining whether there has been a significant increase in the credit risk of the borrower.
Purchased or originated credit-impaired assets (POCI) Financial assets that are purchased or originated at a deep discount that reflects their incurred credit losses, are considered to be already credit-impaired on initial recognition. The Group calculates the credit adjusted effective interest rate, which is based on the originated fair value instead of its gross carrying amount and incorporates the impact of expected credit losses in estimated future cash flows. The ECL of these financial assets is always measured on a life time basis and changes in the ECL are recorded in the Income Statement.
Page 26
NCB Financial Group Limited Notes to the Financial Statements September 30, 2020 (expressed in Jamaican dollars unless otherwise indicated)
2. Significant Accounting Policies (Continued)
(i) Financial assets (continued)
Definition of default The Group determines that a financial instrument is in default, credit-impaired and in stage 3 by considering relevant objective evidence, primarily whether:
• contractual payments of either principal or interest are past due for 90 days or more;
• there are other indications that the borrower is unlikely to pay such as that a concession has been granted to the borrower for economic or legal reasons relating to the borrower’s financial condition; and
• the financial asset is otherwise considered to be in default. If such unlikeliness to pay is not identified at an earlier stage, it is deemed to occur when an exposure is greater than 90 days past due.
Write-offs Financial assets (and the related impairment allowances) are normally written off, either partially or in full, when there is no realistic prospect of recovery. Where loans are secured, write offs generally occur after receipt of any proceeds from the realisation of security. In circumstances where the net realisable value of any collateral has been determined and there is no reasonable expectation of further recovery, write-off may be earlier.
Recognition and Measurement of ECL The general approach to recognising and measuring ECL reflects:
• An unbiased and probability-weighted amount that is determined by evaluating a range of possible outcomes;
• The time value of money; and
• Reasonable and supportable information that is available without undue cost or effort at the reporting date about past events, current conditions and forecasts of future economic conditions.
Expected credit losses are calculated by multiplying the following three main components:
• The probability of default (“PD”)
• The loss given default (“LGD”) and
• The exposure at default (“EAD”), discounted at the original effective interest rate. Management has calculated these inputs based on the estimated forward looking economic and historical experience of the portfolios adjusted for the current point in time. A simplified approach to calculating the ECL is applied to other receivables which do not contain a significant financing component. Generally, these receivables are due within 12 months unless there are extenuating circumstances. Under this approach, an estimate is made of the life-time ECL on initial recognition. For ECL provisions modelled on a collective basis, a grouping of exposures is performed on the basis of shared risk characteristics, such that risk exposures within a group are homogeneous.
The PD, LGD and EAD models which support these determinations are reviewed periodically. Therefore, the underlying models and their calibration, including how they react to forward-looking economic conditions remain subject to review and refinement. This is particularly relevant for lifetime PDs, and for the incorporation of scenarios which have not generally been subject to experience gained through stress testing. The exercise of Judgment in making estimations requires the use of assumptions which are subjective and sensitive to risk factors, in particular to changes in economic and credit conditions across geographical areas. Many of the risk factors have a high degree of interdependency and there is no single factor to which impairment allowances as a whole are sensitive. Therefore, sensitivities are considered in relation to key portfolios which are particularly sensitive to a few factors and these results are not extrapolated to the wider population of financial assets.
Page 27
NCB Financial Group Limited Notes to the Financial Statements September 30, 2020 (expressed in Jamaican dollars unless otherwise indicated)
2. Significant Accounting Policies (Continued)
(i) Financial assets (continued)
The measurement of ECL for each stage and the assessment of significant increases in credit risk consider information about past events and current conditions as well as reasonable and supportable forecasts of future events and economic conditions. For a revolving commitment, the Group includes the current drawn balance plus any further amount that is expected to be drawn up to the current contractual limit by the time of default, should it occur. For credit impaired financial assets, based on management’s assessment of the borrower, a specific provision of expected life-time losses which incorporates collateral and recoveries from other credit-enhancements recoveries is calculated and recorded as the ECL. The resulting ECL is the difference between the carrying amount and the present value of expected cash flows discounted at the original effective interest rate. Forward looking information The estimation and application of forward-looking information requires significant judgment. PD, LGD and EAD inputs used to estimate Stage 1 and Stage 2 credit loss allowances are modelled based on the macroeconomic variables (or changes in macroeconomic variables) that are most closely correlated with credit losses in the relevant portfolio. Each macroeconomic scenario used in the ECL calculation has forecasts of the relevant macroeconomic variables. The estimation of ECL in Stage 1 and Stage 2 is a discounted probability-weighted estimate that considers a minimum of three future macroeconomic scenarios. The base case scenario is based on macroeconomic forecasts that are publicly available. Upside and downside scenarios are set relative to the base case scenario based on reasonably possible alternative macroeconomic conditions. Scenario design, including the identification of additional downside scenarios occurs on at least an annual basis and more frequently if conditions warrant. Scenarios are probability-weighted according to the best estimate of their relative likelihood based on historical frequency and current trends and conditions. Probability weights are updated on an annual basis or more frequently as warranted. The base scenario reflects the most likely outcome and is assigned the highest weighting. The weightings assigned to each economic scenario as at October 1, 2019 and September 30, 2020 vary by jurisdiction and were as follows:
Base Best Case Worst Case Scenarios 85% 5% 10%
ECL on financial assets measured at amortised cost and FVOCI, are recognised in the income statement. For FVOCI financial assets, there is a corresponding adjustment to OCI, while for financial assets measured at amortised cost, the ECL is adjusted against the carrying amount of the asset. Unrealised gains and losses arising from changes in fair value on FVOCI assets are measured in other comprehensive income. For FVOCI assets, when the asset is sold, the cumulative gain or loss in OCI (including ECL there recognised) is reclassified to investment income in determining the gain or loss on disposal.
Page 28
NCB Financial Group Limited Notes to the Financial Statements September 30, 2020 (expressed in Jamaican dollars unless otherwise indicated)
2. Significant Accounting Policies (Continued)
(i) Financial assets (continued)
Modification of loans The Group sometimes renegotiates or otherwise modifies the contractual cash flows of loans to customers and debt instruments. When this happens, the Group assesses whether or not the new terms are substantially different to the original terms. The Group does this by considering, among others, the following factors:
• If the borrower is in financial difficulty, whether the modification merely reduces the contractual cash flow to amounts the borrower is expected to be able to pay.
• Whether any substantial new terms are introduced, such as a profit share/equity-based return that substantially affects the risk profile of the loan.
• Significant extension of the loan term when the borrower is not in financial difficulty.
• Significant change in the interest rate.
• Change in the currency the loan is denominated in.
• Insertion of collateral, other security or credit enhancements that significantly affect the credit risk associated with the loan.
If the terms are substantially different, the Group derecognises the original financial asset and recognises a new asset at fair value and recalculates the new effective interest rate for the asset. The date of negotiation is consequently considered to be the date of initial recognition for impairment calculation purposes and the purpose of determining if there has been a significant increase in credit risk. At this point the Group will assess if the asset is POCI. Acceptance, guarantees, indemnities, letters of credit and undertakings Financial guarantee contracts are contracts that require the issuer to make specified payments to reimburse the holder for a loss it incurs because a specified debtor fails to make payments when due, in accordance with the terms of a debt instrument. Such financial guarantees are given to banks, financial institutions and others on behalf of customers to secure loans, overdrafts and other banking facilities.
Financial guarantee contracts are initially measured at fair value and subsequently measured at the higher of:
• The amount of the loss allowance; and
• The premium received on initial recognition less income recognised in accordance with the principles of IFRS 15
Loan commitments provided by the Group are measured as the amount net of loss allowance for the portfolio. The Group has not provided any commitment to provide loans at a below-market interest rate, or that can be settled net in cash or by delivering or issuing another financial instrument. For loan commitments and financial guarantee contracts, the loss allowance is recognised as a provision. However, for contracts that include both a loan and an undrawn commitment and the Group cannot separately identify the excepted credit losses on the undrawn commitment component from those on the loan component, the expected credit losses on the undrawn commitment are recognised together with the loss allowance for the loan. To the extent that the combined expected credit losses exceed the gross carrying amount of the loan, the ECL is recognised as a provision.
Page 29
NCB Financial Group Limited Notes to the Financial Statements September 30, 2020 (expressed in Jamaican dollars unless otherwise indicated)
2. Significant Accounting Policies (Continued)
(j) Derivative financial instruments Derivatives are financial instruments that derive their value from the price of underlying items such as equities, bonds, interest rates, foreign exchange, credit spreads, commodities or other indices. Derivatives enable users to increase, reduce or alter exposure to credit or market risk. The Group transacts derivatives to manage its own exposure to interest rate and foreign exchange risk. Derivative instruments are initially recognised at fair value on the date a derivative contract is entered into, and subsequently are re-measured at their fair value at the date of each statement of financial position. Fair values are obtained from quoted market prices and discounted cash flow models as appropriate. Derivatives are carried as assets when fair value is positive and as liabilities when fair value is negative. Assets and liabilities are set off where the contracts are with the same counterparty, a legal right of set off exists and the cash flows are intended to be settled on a net basis. Gains and losses from changes in the fair value of derivatives are included in the income statement.
(k) Repurchase and reverse repurchase transactions
Securities sold under agreements to repurchase (repurchase agreements) and securities purchased under agreements to resell (reverse repurchase agreements) are treated as collateralised financing transactions. The difference between the sale/purchase and repurchase/resale price is treated as interest and accrued over the life of the agreements using the effective yield method.
Page 30
NCB Financial Group Limited Notes to the Financial Statements September 30, 2020 (expressed in Jamaican dollars unless otherwise indicated)
2. Significant Accounting Policies (Continued)
(l) Loans and advances and provisions for credit losses Loans and advances are recognised when cash is advanced to borrowers. They are initially recorded at fair value and subsequently measured at amortised cost using the effective interest rate method.
Provision for credit losses determined under the Bank of Jamaica (BOJ) regulatory requirements
The effect of the provision for credit losses determined under the BOJ regulatory requirements is to preserve capital. No amounts are booked to the income statement in respect of regulatory provisions. Provisions calculated based on regulatory requirements that exceed the amounts required under IFRS are transferred from retained earnings to a non-distributable loan loss reserve in stockholders’ equity.
The provision for credit losses determined under the BOJ regulatory requirements comprises a “specific provision” and a “general provision”. The specific is determined based on each specific loan for which problems have been identified. The general provision is considered to be prudential in nature and is established to absorb portfolio losses.
Page 31
NCB Financial Group Limited Notes to the Financial Statements September 30, 2020 (expressed in Jamaican dollars unless otherwise indicated)
2. Significant Accounting Policies (Continued)
(l) Loans and advances and provisions for credit losses (continued)
Provision for credit losses determined under the Bank of Jamaica (BOJ) regulatory requirements (continued)
The specific provision is established for the estimated net loss for all non-performing loans and performing loans that meet specified criteria. Loans are considered to be non-performing where a principal or interest payment is contractually 90 days or more in arrears. At the time of classification as non-performing, any interest that is contractually due but in arrears is reversed from the income statement and interest is thereafter recognised in the income statement on the cash basis only. The estimated net loss is defined as the net exposure remaining after deducting the estimated net realisable value of the collateral (as defined by and determined by the regulations) from the outstanding principal balance of the loan. The regulations quantify the specific provision at ranges from 20% to 100% of each non-performing loan depending on the length of time the loan has been in arrears. In addition, where a non-performing loan is fully secured but the collateral is unrealised for a period of 12 months, a provision of 50% of the amounts outstanding should be made. Where the collateral is unrealised for a further 6 months (with limited exceptions which allow for up to a further 15 months) a full provision is made. The regulations further require that the specific provision for each loan should not be less than 1% of the amounts outstanding.
A general provision is established for all loans (other than loans for which specific provisions were established) at 1% of the amounts outstanding.
(m) Investment securities All purchases and sales of investment securities are recognised at settlement date.
Investment securities are classified into the following categories: investment securities at FVPL, AFS securities and loans and receivables (LAR). Management determines the classification of its investments at initial recognition and re-evaluates this designation at every reporting date. Investment securities at FVPL are those which were either acquired for generating a profit from short-term fluctuations in price or dealer’s margin, or are securities included in a portfolio in which a pattern of short-term profit-taking exists or those financial assets that the entity upon initial recognition, designates as FVPL. They are initially recognised at fair value and transaction costs are expensed in the income statement. They are subsequently carried at fair value. Interest income on investment securities at FVPL is recognised as part of interest income in the income statement. All other realised and unrealised gains and losses are included in gain on foreign currency and investment activities in the income statement. AFS securities are those intended to be held for an indefinite period of time and which may be sold in response to needs for liquidity, changes in interest rates, foreign exchange rates or market prices. They are initially recognised at fair value (including transaction costs), and subsequently remeasured at fair value. Unrealised gains and losses arising from changes in fair value of AFS securities are recognised in OCI. When the securities are disposed of or impaired, the related accumulated unrealised gains or losses included in OCI are transferred to the income statement.
Page 32
NCB Financial Group Limited Notes to the Financial Statements September 30, 2020 (expressed in Jamaican dollars unless otherwise indicated)
2. Significant Accounting Policies (Continued)
(m) Investment securities (continued)
LAR are non-derivative financial assets with fixed or determinable payments that are not quoted in an active market other than: (i) those financial assets that the Group intends to sell immediately or in the short term, which are classified as FVPL, or (ii) those financial assets that the entity upon initial recognition, designates as at FVPL or has designated as AFS. LAR are initially measured at fair value which is the consideration to originate the loan and are subsequently carried at amortised cost using the effective interest method. The fair values of quoted investments in active markets are based on current bid prices. If there is no active market for a financial asset, the Group establishes fair value using valuation techniques. These include the use of recent arm’s length transactions, discounted cash flow analysis and other valuation techniques commonly used by market participants. Financial assets are assessed at each date of the statement of financial position for objective evidence of impairment. A financial asset is considered impaired if its carrying amount exceeds its estimated recoverable amount. The amount of the impairment loss for assets carried at amortised cost is calculated as the difference between the asset’s carrying amount and the present value of expected future cash flows discounted at the original effective interest rate. The recoverable amount of a financial asset carried at fair value is the present value of expected future cash flows discounted at the current market interest rate for a similar financial asset. In the case of equity securities classified as AFS, a significant or prolonged decline in the fair value below cost is considered an indicator of impairment. Significant or prolonged are assessed based on market conditions and other indicators. If any such evidence exists for AFS financial assets, the cumulative loss, measured as the difference between the acquisition cost and the current fair value, less any impairment losses previously recognised in the income statement, is removed from other comprehensive income and recognised in the income statement. Investment securities are derecognised when the contractual rights to receive the cash flows from these assets have ceased to exist or the assets have been transferred and substantially all the risks and rewards of ownership of the assets are also transferred (if substantially all the risks and rewards have not been transferred, the Group tests control to ensure that continuing involvement on the basis of any retained powers of control does not prevent derecognition).
(n) Investment properties
Investment property is held for long-term rental yields and is, therefore, treated as a long-term investment. Investment property is measured initially at cost, including transaction costs, and is subsequently carried at fair value, representing open market value determined annually by the directors or by independent valuators. Changes in fair values are recorded in the income statement.
Page 33
NCB Financial Group Limited Notes to the Financial Statements September 30, 2020 (expressed in Jamaican dollars unless otherwise indicated)
2. Significant Accounting Policies (Continued)
(o) Intangible assets (i) Goodwill
Goodwill arises on the acquisition of subsidiaries or associates and represents the excess of the consideration transferred, the amount of any non-controlling interest in the acquiree and the acquisition-date fair value of any previous equity interest in the acquiree over the fair value of the identifiable net assets acquired. If the total of consideration transferred, non-controlling interest recognised and previously held interest measured at fair value is less than the fair value of the net assets of the subsidiary acquired, negative goodwill, in the case of a bargain purchase, the difference is recognised directly in the income statement. For the purpose of impairment testing, goodwill acquired in a business combination is allocated to each of the Cash Generating Unit (CGUs), or groups of CGUs, that is expected to benefit from the synergies of the combination. Each unit or group of units to which the goodwill is allocated represents the lowest level within the entity at which the goodwill is monitored for internal management purposes. Goodwill is monitored at the operating segment level. Goodwill impairment reviews are undertaken annually or more frequently if events or changes in circumstances indicate a potential impairment. The carrying value of the CGU containing the goodwill is compared to the recoverable amount, which is the higher of value in use and the fair value less costs of disposal. Any impairment is recognised immediately as an expense and is not subsequently reversed.
(ii) Contractual customer and distribution relationships, trade name, mutual fund and renewal
rights These assets are associated with the acquisition of a subsidiary and are measured at fair value as at the date of acquisition. These assets are amortised using the straight line method over their useful lives, not exceeding a period of twenty years.
(iii) Computer software
Acquired computer software licences are capitalised on the basis of the costs incurred to acquire and bring to use the specific software. These costs are amortised over their expected useful life of three years.
Costs that are directly associated with the production of identifiable and unique software products controlled by the Group, and that will probably generate benefits exceeding costs beyond one year, are recognised as intangible assets. Direct costs include the software development team’s employee costs and an appropriate portion of relevant overheads. All other costs associated with developing or maintaining computer software programmes are recognised as an expense as incurred.
Intangible assets with indefinite useful lives are assessed for impairment annually, or more frequently if events changed in circumstances indicate a potential impairment.
Page 34
NCB Financial Group Limited Notes to the Financial Statements September 30, 2020 (expressed in Jamaican dollars unless otherwise indicated)
2. Significant Accounting Policies (Continued)
(p) Property, plant and equipment Land and buildings are shown at deemed cost less impairment losses, and less subsequent depreciation for buildings. All other property, plant and equipment are stated at historical cost less accumulated depreciation and impairment losses. Subsequent costs are included in the asset’s carrying amount or are recognised as a separate asset, as appropriate, only when it is probable that future economic benefits associated with the item will flow to the Group and the cost of the item can be measured reliably. All other repairs and maintenance costs are charged to other operating expenses during the financial period in which they are incurred.
Land is not depreciated. Depreciation on other assets is calculated on the straight-line basis, unless otherwise stated, at annual rates that will write off the carrying value of each asset over the period of its expected useful life. Annual depreciation rates or periods over which depreciation is charged are as follows:
Freehold Buildings & Leasehold improvements 2% & Period of lease
Motor Vehicles, Furniture & Equipment 5% - 33 1/3%
Leased assets Shorter of period of lease or useful life of asset
Gains or losses on disposals are determined by comparing proceeds with carrying amount. These are included in other operating income in the income statement.
(q) Properties for development and re-sale
Properties for sale or under construction that are intended for sale, are classified as properties for development and sale. These balances are carried at the lower of cost and net realisable values. These properties include offices, retail shops and residential units. Net realisable value is the estimated selling price in the ordinary course of business, less estimated costs of completion and estimated selling expenses. An external valuation specialist was engaged in determining the net realisable value for the office and retail shops, and a discounted cash flow model was used as there is a lack of comparable data because of the nature of the properties. For the residential units, data from binding sales transactions are used to assess the net realisable value. Impairment losses on properties for development and sale are recognised in the consolidated statement of income when the net realisable value is lower than cost. Subsequently, where cost is less than the net realisable value, a reversal of any prior impairment losses is recognised in the consolidated statement of income.
(r) Impairment of long lived assets
Property, plant and equipment and intangibles are reviewed for impairment losses whenever events or changes in circumstances indicate that the carrying amount may not be recoverable. An impairment loss is recognised for the amount by which the carrying amount of the assets exceeds its recoverable amount, which is the higher of an asset’s net selling price and value in use. For the purpose of assessing impairment, assets are grouped at the lowest levels for which there are separately identifiable cash flows.
Page 35
NCB Financial Group Limited Notes to the Financial Statements September 30, 2020 (expressed in Jamaican dollars unless otherwise indicated)
2. Significant Accounting Policies (Continued)
(s) Financial liabilities The Group’s financial liabilities comprise primarily amounts due to banks, customer deposits, repurchase agreements, obligations under securitisation arrangements, other borrowed funds, liabilities under annuity and insurance contracts, liabilities under letters of credit and undertaking and other liabilities. The recognition and measurement of liabilities under annuity and insurance contracts is detailed in Note 2(t); short term liabilities FVTPL are measured at fair value and other financial liabilities are measured at amortised cost. Offsetting financial instruments Financial assets and liabilities are offset and the net amount reported in the statement of financial position when there is a legally enforceable right to offset the recognised amounts and there is an intention to settle on a net basis, or realise the assets and settle the liabilities simultaneously.
(t) Borrowings Borrowings, including those arising under securitisation arrangements, are recognised initially at fair value, being their issue proceeds, net of transaction costs incurred. Subsequently, borrowings are stated at amortised cost and any difference between net proceeds and the redemption value is recognised in the income statement over the period of the borrowings using the effective yield method.
(u) Structured products Structured products are recognised initially at the nominal amount when funds are received. Derivatives are separately accounted for at FVPL (Note 19). The non-derivative elements are stated at amortised cost using the effective interest method.
Page 36
NCB Financial Group Limited Notes to the Financial Statements September 30, 2020 (expressed in Jamaican dollars unless otherwise indicated)
2. Significant Accounting Policies (Continued)
(v) Leases The Group has changed its accounting policy for leases where the Group is the lessee. The new policy, and the impact of the change are described in Note 57. Accounting policies applied from October 1, 2019 As lessee The Group leases various buildings and equipment. Rental contracts are typically made for fixed periods of 1-10 years but may have extension options as described below. Contracts may contain both lease and non-lease components. The Group allocates the consideration in the contract to the lease and non-lease components based on their relative stand-alone prices. However, for leases of real estate for which the Group is a lessee, it has elected not to separate lease and non-lease components and instead accounts for these as a single lease component. Lease terms are negotiated on an individual basis and contain a wide range of different terms and conditions. The lease agreements do not impose any covenants other than the security interests in the leased assets that are held by the lessor. Leased assets may not be used as security for borrowing purposes. Until the 2019 financial year, leases of property, plant and equipment were classified as either finance leases or operating leases. From 1 October 2019, leases are recognised as a right-of-use asset and a corresponding liability at the date at which the leased asset is available for use by the Group. Assets and liabilities arising from a lease are initially measured on a present value basis. Lease liabilities include the net present value of the following lease payments:
• fixed payments (including in-substance fixed payments), less any lease incentives receivable
• variable lease payments that are based on an index or a rate, initially measured using the index or rate as at the commencement date
• amounts expected to be payable by the Group under residual value guarantees
• the exercise price of a purchase option if the Group is reasonably certain to exercise that option, and
• payments of penalties for terminating the lease, if the lease term reflects the Group exercising that option.
The right-of-use assets is presented within property, plant and equipment. Right-of-use assets are measured initially at cost comprising the following:
• the amount of the initial measurement of the lease liability;
• any lease payments made at or before the commencement date less any lease incentive received;
• any initial direct costs; and
• restoration costs. Subsequently the right-of-use assets are measured at cost less accumulated depreciation and any accumulated impairment losses are adjusted for remeasurement of the lease liability due to reassessment or lease modifications. The right of use assets is depreciated over the shorter of the asset’s useful life and the lease term on a straight-line basis. The amortisation period for the right-of-use assets is 1 to 10 years.
Page 37
NCB Financial Group Limited Notes to the Financial Statements September 30, 2020 (expressed in Jamaican dollars unless otherwise indicated)
2. Significant Accounting Policies (Continued)
(v) Leases (continued) Lease payments to be made under reasonably certain extension options are also included in the measurement of the liability. The lease payments are discounted using the lessee’s incremental borrowing rates, being the rate that the individual lessee would have to pay to borrow the funds necessary to obtain an asset of similar value to the right-of-use asset in a similar economic environment with similar terms, security and conditions. Short-term leases are leases with a lease term of 12 months or less. Low-value assets comprise computers, tablets, mobile phones and small items of office furniture. Accounting policies applied until September 30, 2019 As lessee Leases of property, plant and equipment where the Group has substantially all the risks and rewards of ownership, are classified as finance leases. Finance leases are recognised at the inception of the leases at the lower of the fair value of the leased asset or the present value of minimum lease payments. Each lease payment is allocated between the liability and interest charges so as to produce a constant rate of charge on the lease obligation. The interest element of the lease payments is charged to the income statement over the lease period.
Leases where a significant portion of the risks and rewards of ownership are retained by the lessor are classified as operating leases. Payments under operating leases are charged in the income statement on a straight-line basis over the period of the lease. When an operating lease is terminated before the lease period has expired, any payment required to be made to the lessor by way of penalty is recognised as an expense in the period in which termination takes place. The Group did not need to make any adjustments to the accounting for assets held as lessor as a result of adopting the new leasing standard. As lessor When assets are leased out under a finance lease, the present value of the lease payments is recognised as a receivable. The difference between the gross receivable and the present value of the receivable is recognised as unearned finance income. Lease income is recognised over the term of the lease in a manner which reflects a constant periodic rate of return on the net investment in the lease. Assets leased out under operating leases are included in property, plant and equipment in the statement of financial position. They are depreciated over their expected useful lives on a basis consistent with similar owned assets. Rental income is recognised on a straight-line basis over the lease term.
Page 38
NCB Financial Group Limited Notes to the Financial Statements September 30, 2020 (expressed in Jamaican dollars unless otherwise indicated)
2. Significant Accounting Policies (Continued)
(w) Insurance and investment contracts – classification, recognition and measurement
Classification The Group issues contracts that transfer insurance risk or financial risk or both. Insurance contracts are those contracts that transfer significant insurance risk. Such contracts may also transfer financial risk. As a general guideline, the Group defines as significant insurance risk the possibility of having to pay benefits on the occurrence of an insured event that are at least 10% more than the benefits payable if the insured event did not occur.
Investment contracts are those contracts that transfer financial risk with no significant insurance risk.
Recognition and measurement Insurance contracts are classified depending on the duration of risk and whether or not the terms and conditions are fixed.
Short duration insurance contracts These contracts are principally property, motor, casualty (employers’ liability, public liability), and group life and health insurance contracts.
Property insurance contracts indemnify the Group’s customers in the event of a loss from a specified insured peril such as fire, windstorm or earthquake (not limited to these perils) up to the insured amount and within the terms of the policy conditions. These contracts are issued for both private and commercial risks. Customers who undertake commercial activities on their premises could also receive compensation for consequential loss/business interruption caused by the insured perils.
Motor insurance contracts indemnify the Group’s customers for their legal requirement under the road traffic legislation in the countries where the Group has issued these contracts. These contracts may be extended for additional coverage such as physical damage, theft and personal accident. Casualty insurance contracts provide coverage for liability exposures that indemnify the Group’s customers against actions from third parties which are subject to the policy limits and conditions. The typical protection offered is designed for employers who become legally liable to pay compensation to injured employees (employers’ liability) and employers who become liable to pay compensation to third parties for bodily harm or property damage (public liability). Marine insurance contracts indemnify the Group’s customers for loss or damage to their insured cargo, commercial hull and pleasure craft vessels. Third party coverage is also provided. Group life contracts protect the Group’s customers from the consequences of events (such as death or critical illness) that would affect the ability of the customer or his/her dependants to maintain his/her current level of income. Health insurance contracts provide for both unexpected and preventative medical treatment and drugs. On these contracts, the benefits paid on occurrence of the specified insurance event are either fixed or linked to the extent of the economic loss suffered by the policyholder. There are no maturity or surrender benefits.
For all these contracts, premiums are recognised as revenue (earned premiums) proportionally over the period of coverage. The portion of premiums received on inforce contracts that relate to unexpired risks at the date of the statement of financial position is reported as an unearned premium liability. Premiums are shown before deduction of commissions payable to agents and brokers and exclude any taxes or duties levied on such premiums. Premium income includes premiums collected by agents and brokers not yet received by the Group.
Page 39
NCB Financial Group Limited Notes to the Financial Statements September 30, 2020 (expressed in Jamaican dollars unless otherwise indicated)
2. Significant Accounting Policies (Continued)
(w) Insurance and investment contracts – classification, recognition and measurement (continued)
Recognition and measurement (continued) Short duration insurance contracts (continued) Unearned premiums represent the portion of premiums written in the current year which relate to periods of insurance subsequent to the date of the statement of financial position calculated principally using the twenty-fourths method. Unearned premiums relating to marine cargo are calculated using 180 days after the first date of sailing. Unearned premiums relating to group life are calculated based on 25% of net premiums written.
Claims and loss adjustment expenses are charged to income as incurred based on the estimated liability for compensation owed to contract holders. They arise from events that have occurred up to the date of the statement of financial position even if they have not yet been reported to the Group. The Group does not discount its liabilities for unpaid claims. Liabilities for unpaid claims are estimated using techniques such as the input of assessments for individual cases reported to the Group and statistical analyses for the claims incurred but not reported (IBNR), and to estimate the expected ultimate cost of more complex claims that may be affected by external factors such as court decisions. Estimates are continually revised as more information becomes available and for the effects of anticipated inflation. Adjustments arising from these revisions are recognised within claims expense in the current year.
Long-term duration insurance contracts These contracts are traditional participating and non-participating policies that insure events associated with human life (death, longevity, critical illnesses etc.) over a long duration and include annuity contracts. The contracts issued by the Group are organised by broad categories according to the features they contain. There are three main categories:
(1) Long-term insurance contracts with fixed and guaranteed terms and with discretionary participation features (DPF),
(2) Long-term insurance contracts with fixed and guaranteed terms and without DPF and (3) Long-term insurance contracts without fixed terms.
These categories can be further segregated into “Unit-linked contracts” and “Interest-sensitive contracts”. The premiums paid for long duration insurance contracts either cover only the insured event, or they may comprise a portion that covers the insured event, and another portion to accumulate cash values available for withdrawal at the option of the policyholder. These cash values are increased by credited interest and decreased by policy administration fees, surrender charges and any withdrawals. Revenue consists of fees deducted for policy administration, mortality and surrenders and interest credited is treated as an expense. Some of these contracts contain guarantees that entitle the holders to a minimum guaranteed crediting rate over the life of the policy. These guarantees are allowed for in the liability calculations. The interest credited to Unit-linked contracts are determined by reference to specific and separately identifiable pools of assets.
Page 40
NCB Financial Group Limited Notes to the Financial Statements September 30, 2020 (expressed in Jamaican dollars unless otherwise indicated)
2. Significant Accounting Policies (Continued)
(w) Insurance and investment contracts – classification, recognition and measurement (continued)
Recognition and measurement (continued) Long-term duration insurance contracts (continued) Long-term insurance contracts with fixed and guaranteed terms and with DPF Insurance contracts may or may not contain DPF, which entitles the policyholder to receive, as a supplement to guaranteed benefits, additional benefits or bonuses: a) That are likely to be a significant portion of the total contractual benefits; b) Whose amount or timing is contractually at the discretion of the Group; and c) That are contractually based on:
(i) The performance of a specified pool of contracts or a specified type of contract; (ii) realised and/or unrealised investment returns on a specified pool of assets held by the Group; or (iii) the profit or loss of the Group, fund or other entity that issues the contract.
The terms and conditions of these contracts set out the basis for the determination of discretionary benefits and within which the Group may exercise its discretion as to the quantum and timing of their payments to contract holders, which will be subject to actuarial advice. Long-term insurance contracts with fixed and guaranteed terms and without DPF These contracts do not contain features that provide additional benefits outside of those guaranteed at inception. Long-term insurance contracts without fixed terms These contracts prescribe no fixed terms or contain variable terms that have a material effect on the amount, timing, and uncertainty of the insurer's future cash flows. Insurance liabilities A liability for policyholders’ benefits that is expected to be incurred in the future is recorded when the premiums are recognised. Typically, the liability is determined as the sum of the expected discounted value of the benefit payments less the expected discounted value of the theoretical premiums that would be required to meet the benefits based on the valuation assumptions used (the valuation premiums). In particular, the liability is based on assumptions as to mortality and investment income. A margin for adverse deviations is included in the assumptions.
Page 41
NCB Financial Group Limited Notes to the Financial Statements September 30, 2020 (expressed in Jamaican dollars unless otherwise indicated)
2. Significant Accounting Policies (Continued)
(w) Insurance and investment contracts – classification, recognition and measurement (continued) Recognition and measurement (continued) Long-term duration insurance contracts (continued) Insurance liabilities (continued) Long duration insurance contract liabilities are calculated by independent actuaries at each statement of financial position date using the varying methods, each prescribed by the regulators in the respective jurisdictions. The change in these liabilities are recognised in the income statement. For the Trinidad and Tobago life insurance subsidiaries, actuarial liabilities are calculated using the Caribbean Policyholder Premium Method (CPPM) outlined in draft regulations issued by the Central Bank of Trinidad and Tobago. The Jamaican life insurance subsidiaries use a very similar Policyholder Premium Method (PPM) as required under the Insurance Act 2001 of Jamaica. For the Dutch Caribbean life insurance subsidiaries, reserves are calculated on a Modified Net Premium Method in accordance with the requirements of the Central Bank of Curacao and St. Maarten and the Central Bank of Aruba. Premiums Premiums are shown before deduction of commission and are recognised as revenue when they become payable by the policyholder except for the following: (a) A Jamaican life insurance subsidiary issues policies classified as Unit-linked long-term contracts with fixed and guaranteed terms without DPF, for which the investment component of the premiums is recognised as liabilities. The insurance component of the premiums is recognised as income. (b) A Jamaican life insurance subsidiary issues policies classified as Interest sensitive long-term contracts without fixed terms, for which the investment component of premiums is recognised as liabilities. The insurance component of the premiums is recognised as income. Investment contracts The Group issues investment contracts including deposit administration contracts. Premiums under these contracts are recognised directly as liabilities. These liabilities are increased by credited interest or change in the unit prices and are decreased by policy administration fees, mortality and surrender charges and any withdrawals. Revenue consists of investment income and interest credited is treated as an expense. Unit Linked Contracts Unit-Linked funds represent funds maintained to meet specific investment objectives of policyholders who bear investment risk. The returns earned by investment of the funds, inclusive of realised and unrealised gains and losses accrue directly to the policyholders. For the unit-linked contracts, the portion of the premium covering the insured risk is recorded as premium income. The portion of the premium which accumulates to cash value for the policyholder is unbundled and recorded as a liability and credited to the account of the policyholder in the respective unit-linked fund to which the contract is linked. The liabilities arising from the unit-linked contracts comprise the liability for the insured risk and the accumulated cash value. The liability for the insurance risk is determined in a manner identical to the liability for contracts with fixed and guaranteed terms and is included in the policyholders’ liability balance while the liability for the accumulated cash value is carried at fair value and is determined by reference to the fair value of the assets which fund the liabilities.
Page 42
NCB Financial Group Limited Notes to the Financial Statements September 30, 2020 (expressed in Jamaican dollars unless otherwise indicated)
2. Significant Accounting Policies (Continued)
(w) Insurance and investment contracts – classification, recognition and measurement (continued) Recognition and measurement (continued Unit Linked Contracts (Continued) The assets and liabilities of the segregated funds are carried at fair values. Deposits and withdrawals are charged or are credited to the segregated fund liabilities. Unit values are determined by dividing the value of the assets in the funds on a valuation date by the number of units in the funds on the valuation date. The Group earns fees for the management of the funds assets, policy administration, as well as for effecting the encashment of units.
Outstanding claims Provision for outstanding claims and the related costs of settlement are based on incidents reported before the end of the financial year and include appropriate provisions for claims incurred but not yet reported. Estimates are continually revised as more information becomes available and for the effects of anticipated inflation. Adjustments arising on these revisions are included with claims expense in the current year. Benefits and claims payable represent the gross cost of all claims notified but not settled on the date of the statement of financial position. Any reinsurance recoverable is shown separately as a receivable.
Policyholders’ benefits Maturities and annuities are accounted for when due. Death and disability claims and surrenders are recognised in the financial statements in the year in which they have been notified. Differences between the estimated claims and subsequent settlements are recognised in the income statement in the year of settlement. Liability adequacy test At the date of the statement of financial position, the Group assesses whether its recognised insurance liabilities are adequate, using current estimates of future cash flows under its insurance contracts. If that assessment shows that the carrying amount of its insurance liabilities is inadequate, the deficiency is recognised in the income statement and the amount of the relevant insurance liabilities is increased. Reinsurance contracts held Contracts entered into by the Group with reinsurers under which the Group is compensated for losses on one or more contracts issued by the Group and that meet the classification requirements for insurance contracts are classified as reinsurance contracts held. Contracts that do not meet these classification requirements are classified as financial assets. The benefits to which the Group is entitled under its reinsurance contracts held are recognised as reinsurance assets. These assets consist of short-term balances due from reinsurers, as well as longer term receivables that are dependent on the expected claims and benefits arising under the related reinsured insurance contracts. Amounts recoverable from or due to reinsurers are measured consistently with the amounts associated with the reinsured insurance contracts and in accordance with the terms of each reinsurance contract. Reinsurance liabilities are primarily premiums payable for reinsurance contracts and are recognised as an expense when due. The Group periodically assesses its reinsurance assets for impairment. If there is objective evidence that a reinsurance asset is impaired, the Group reduces the carrying amount of the reinsurance asset to its recoverable amount and recognises that impairment loss in the consolidated income statement.
Page 43
NCB Financial Group Limited Notes to the Financial Statements September 30, 2020 (expressed in Jamaican dollars unless otherwise indicated)
2. Significant Accounting Policies (Continued)
(w) Insurance and investment contracts – classification, recognition and measurement (continued)
Receivables and payables related to insurance contracts and investment contracts Receivables and payables are recognised when due. These include amounts due to and from agents, brokers and insurance contract holders. If there is objective evidence that the insurance receivable is impaired, the Group reduces the carrying amount of the insurance receivable accordingly and recognises that impairment loss in the consolidated income statement. Salvage and subrogation reimbursements Some insurance contracts permit the Group to sell (usually damaged) property acquired in settling a claim (salvage). The Group may also have the right to pursue third parties for payment of some or all costs (subrogation). The estimated cost of claims includes a deduction for the expected value of salvage and other recoveries.
(x) Provisions
Provisions are recognised when there is a present legal or constructive obligation as a result of past events, it is probable that an outflow of resources will be required to settle the obligation and a reliable estimate of the amount of the obligation can be made.
(y) Post-employment benefits
Pension benefits The Group and its subsidiaries operate a number of retirement plans, the assets of which are generally
held in separate trustee administered funds. The pension plans are funded by payments from employees and by the relevant companies, taking into account the recommendations of independent qualified actuaries. The Group has both defined benefit and defined contribution plans.
Defined benefit pension plans A defined benefit pension plan is a plan that defines an amount of pension benefit that an employee will
receive on retirement, usually dependent on one or more factors, such as age, years of service and compensation.
The amount recognised in the statement of financial position in respect of defined benefit pension plans is
the present value of the defined benefit obligation at the statement of financial position date less the fair value of plan assets. The defined benefit obligation is calculated annually by independent actuaries using the projected unit credit method. The present value of the defined benefit obligation is determined by discounting the estimated future cash outflows using interest rates on sovereign and corporate bonds that are denominated in the currency in which the benefits will be paid and that have terms to maturity approximating to the terms of the related pension obligation.
The current service cost of the defined benefit plan, included in staff costs in the income statement, reflects
the increase in the defined benefit obligation resulting from employee service in the current year, benefit changes, curtailments and settlements.
The net interest cost is calculated by applying the discount rate to the net balance of the defined benefit
obligation and the fair value of plan assets. The cost is included in staff costs in the income statement. Past-service costs are recognised immediately in expenses. Actuarial gains and losses arising from experience adjustments and changes in actuarial assumptions are
charged or credited to equity in other comprehensive income in the period in which they arise.
Page 44
NCB Financial Group Limited Notes to the Financial Statements September 30, 2020 (expressed in Jamaican dollars unless otherwise indicated)
2. Significant Accounting Policies (Continued)
(y) Post-employment benefits (continued)
Pension benefits (continued) Defined contribution pension plans A defined contribution pension plan is a plan under which the Group pays fixed contributions into a
separate fund. The Group has no legal or constructive obligations to pay further contributions. The contributions are charged to the income statement in the period to which they relate.
Other post-employment benefit obligations The Group provides post-employment health care benefits to its retirees. The entitlement to these benefits
is usually conditional on the employee remaining in service up to retirement age and the completion of a minimum service period. The expected costs of these benefits are accrued over the period of employment using an accounting methodology similar to that for defined benefit pension plans. Actuarial gains and losses arising from experience adjustments and changes in actuarial assumptions are charged or credited in other comprehensive income in the period in which they arise. These obligations are valued annually by independent qualified actuaries.
Termination benefits Termination benefits are payable whenever an employee’s employment is terminated before the normal retirement date or whenever an employee accepts voluntary redundancy in exchange for these benefits. The Group recognises termination benefits when it is demonstrably committed to either terminate the employment of current employees according to a detailed formal plan without possibility of withdrawal or to provide termination benefits as a result of an offer made to encourage voluntary redundancy. Benefits falling due more than 12 months after the statement of financial position date are discounted to present value.
(z) Acceptances, guarantees, indemnities, letters of credit and undertakings
Acceptances, guarantees, indemnities and letters of credit and undertakings are various forms of contractual commitments to advance funds to or on behalf of customers and include:
(i) Obligations on the part of the Group to make payments (directly or indirectly) to a designated third
party contingent upon a default by the Group’s customer in the performance of an obligation under the terms of that customer’s contract with the third party; and
(ii) Obligations to guarantee or stand as surety for the benefit of a third party.
Where obligations under acceptances, guarantees, indemnities and letters of credit and undertakings are not considered to be contingent, the amounts are reported as a liability in the statement of financial position. There are equal and offsetting claims against customers in the event of a call on these commitments, which are reported as an asset.
Where obligations are considered to be contingent, the amounts are disclosed in Note 58.
Page 45
NCB Financial Group Limited Notes to the Financial Statements September 30, 2020 (expressed in Jamaican dollars unless otherwise indicated)
2. Significant Accounting Policies (Continued)
(aa) Share capital
Share issue costs Ordinary shares are classified as equity. Incremental costs directly attributable to the issue of new shares are shown in equity as a deduction, net of tax, for the proceeds. Dividends on ordinary shares Dividends on ordinary shares are recognised in equity in the period in which they are declared.
Treasury shares Where the Company, its subsidiaries or consolidated entities acquire the shares of the Company, the consideration paid, including any directly attributable incremental costs (net of taxes) is deducted from equity attributable to the Company’s stockholders until the shares are cancelled, reissued or disposed of. Where the shares are subsequently sold or reissued, any consideration received, net of directly attributable incremental transaction costs and the related income tax effects, are included in equity attributable to the Company’s stockholders. The Company’s outstanding shares exclude treasury shares.
(ab) Fiduciary activities
The Group acts as trustee and in other fiduciary capacities that result in holding or placing of assets on behalf of individuals, trusts, retirement benefit plans and other third parties. These assets and income arising thereon are excluded from these financial statements, as they are not assets of the Group.
Page 46
NCB Financial Group Limited Notes to the Financial Statements September 30, 2020 (expressed in Jamaican dollars unless otherwise indicated)
3. Critical Accounting Estimates and Judgments in Applying Accounting Policies
The Group’s financial statements and its financial results are influenced by accounting policies, assumptions, estimates and management judgment, which necessarily have to be made in the course of preparation of the financial statements.
The Group makes estimates and assumptions that may affect the reported amounts of assets and liabilities within the next financial year. All estimates and assumptions required in conformity with IFRS are best estimates undertaken in accordance with the applicable standard.
Estimates and judgments are continuously evaluated and are based on past experience and other factors, including expectations with regard to future events. Accounting policies and management’s judgments for certain items are especially critical for the Group’s results and financial position due to their materiality.
(a) Business combinations
Business combinations are accounted for using the acquisition method. The Group determines the identifiable assets and liabilities using the purchase price allocation method. Under this method, the Group makes estimates about future cash flows which are derived based on factors such as revenue growth, margins and expense ratios, working capital requirements, attrition rates and discount rates in determining the fair values of the identifiable intangible assets. Where a business combination results in the identification of goodwill, goodwill impairment assessments are done annually. The performance of the goodwill impairment assessments also requires estimating future cash flows which are derived using factors similar to those used in determining the fair values of the other intangibles discussed above. These estimates are particularly sensitive to the determined cash flows and the discount rates.
In performing step acquisitions (moving from an investment in associated company to a subsidiary and obtaining control), the Group is required to premeasure previously held equity interests (PHEI) to fair value as part of determining the purchase consideration in doing the purchase price accounting for the entire controlling stake. For the GHL step acquisition, in determining fair value of its PHEI, the Group determined that neither the share price listed on the Trinidad and Tobago Stock Exchange (TTSE) nor the transaction price for the recently acquired stake were reflective of fair value. The Group considered GHL’s share price traded on the TTSE on or prior to the transaction date. Based on the Group’s analysis, GHL’s shares are thinly traded and therefore do not reflect the fair value. GHL’s share price was also influenced by investor’s knowledge of the potential take-over. The Group also considered the transaction price for the additional shares to achieve control. The purchase price per share was based on a lock-up agreement entered in 2016 and was not reflective of the fair value as at the purchase date. Management therefore commissioned an independent valuation of the PHEI, which valuation used estimates about future cash flows, derived based on factors identical to those described above. These estimates are also particularly sensitive to the determined cash flows and the discount rates.
Page 47
NCB Financial Group Limited Notes to the Financial Statements September 30, 2020 (expressed in Jamaican dollars unless otherwise indicated)
3. Critical Accounting Estimates and Judgments in Applying Accounting Policies (Continued) (b) Income taxes
There are many transactions and calculations for which the ultimate tax determination is uncertain during the ordinary course of business. The Group recognizes liabilities for actual and anticipated tax audit issues based on estimates of whether additional taxes will be due. In determining these estimates, management considers the merit of any tax audit issues raised, based on their interpretation of the taxation laws, and their knowledge of any precedents established by the taxation authorities. Where the final tax outcome of these matters is different from the amounts that were initially recorded, such differences could materially impact the current tax and deferred tax provisions in the period in which such determination is made.
(c) Impairment of financial assets
In determining ECL, management is required to exercise Judgment in defining what is considered a significant increase in credit risk and in making assumptions and estimates to incorporate relevant information about past events, current conditions and forecasts of economic conditions. Further information about the Judgments involved is included in the sections 'Measurement of ECL' and 'Forward-looking information'. Establishing staging The Group establishes staging for different categories of financial assets according to the following criteria: Debt securities and Deposits. The Group uses its internal credit rating model to determine which of the three stages an asset is to be categorized for the purposes of ECL. The Group’s internal credit rating model is a scale which allows for distinctions in risk characteristics and is referenced to the rating scale of international credit rating agencies. The scale is summarised in the following table:
Internal Rating Classification External rating – S&P or equivalent
Low Risk Investment Grade
AAA – BBB
Medium Risk Non-Investment Grade
BB – B
High Risk Non-Investment Grade
CCC - C
Default Default D
For investment securities, once the asset has experienced a significant increase in credit risk the investment will move from Stage 1 to Stage 2. The Group has assumed that the credit risk of a financial instrument has not increased significantly since initial recognition if the financial instrument is determined to have low credit risk at the reporting date. A financial asset that is investment grade is considered low credit risk. Stage 1 instruments are classified as follows:
• investment grade, or
• below investment grade at origination, and have not been downgraded more than 2 notches since origination.
Stage 2 instruments are assets which:
• have been downgraded from investment grade to below investment grade, or
• are rated below investment grade at origination and have been downgraded more than 2 notches since origination.
Page 48
NCB Financial Group Limited Notes to the Financial Statements September 30, 2020 (expressed in Jamaican dollars unless otherwise indicated)
3. Critical Accounting Estimates and Judgments in Applying Accounting Policies (Continued) (c) Impairment of financial assets (continued)
Debt securities and Deposits. (continued) Stage 3 instruments are assets in default where estimated future cash flows have been impacted negatively. Other assets measured at amortised cost include, lease receivables, loan commitments and financial guarantee contracts. The assessment of significant increase in credit risk for these assets requires significant judgment. Movements between Stage 1 and Stage 2 are based on whether an instrument’s credit risk at the reporting date has increased significantly relative to the date it was initially recognised. For the purposes of this assessment, credit risk is based on an instrument’s lifetime PD, not the losses the Bank expects to incur. All loans receive an initial risk rating at origination. The Group has established a credit quality review process involving analysis of the ability of borrowers and other counterparties to meet interest and capital repayment obligations based on factors that include days past due (“DPD”), performance and other known material changes. Ratings of individual loans are based on the following criteria:
• Credit structure and cash flow stability;
• Specific loan and collateral characteristics;
• Guarantees and other credit support;
• Macro-economic factors; and
• Financial and management information for commercial loans. This assessment results in each facility being classified as “low risk”, “medium risk” or “high risk”. The Group considers loans that have missed a full payment cycle, to have experienced a significant increase in credit risk. The Bank assesses loans as having experienced a significant increase in credit risk if any other qualitative indicator is triggered such as, known financial difficulty, credit issue with another account, expected forbearance or restructuring. If any of these factors indicates that a significant increase in credit risk has occurred, the instrument is moved from Stage 1 to Stage 2.
The thresholds for movement between Stage 1 and Stage 2 are symmetrical. After a financial asset has migrated to Stage 2, if its credit risk is no longer considered to have significantly increased relative to its initial recognition, the financial asset will move back to Stage 1.
Forward looking information When management determines the macro-economic factors that impact the portfolios of financial assets, they first determine all readily available information within the relevant market. Portfolios of financial assets are segregated based on product type, historical performance and homogenous country exposures. There is often limited timely macro-economic data for Caribbean markets. Management assesses data sources from local governments, International Monetary Fund and other reliable data sources. A regression analysis is performed to determine which factors are most closely correlated with the credit losses for each portfolio. Where projections are available, these are used to forecast up to three years and subsequently the long term average performance is then used for the remaining life of the product. These projections are reassessed on an annual basis.
(d) Fair value of investment securities
Management uses its judgment in selecting appropriate valuation techniques to determine fair value of investment securities. These techniques are described in Note 51.
Page 49
NCB Financial Group Limited Notes to the Financial Statements September 30, 2020 (expressed in Jamaican dollars unless otherwise indicated)
3. Critical Accounting Estimates and Judgments in Applying Accounting Policies (Continued)
(e) COVID-19
The onslaught of the coronavirus pandemic (COVID 19) caused a contraction in all the economies in which the Group operates. The spread of the virus and stringent exit and entry protocols weighed on global travel and limited tourism demand. In addition, the downturn in global demand has also resulted in depressed oil and gas prices, negatively impacting government revenues for one of the major territories in which we operate. Our monitoring mechanisms ramped up as we kept a close eye on the health crisis and on the economic impact on our major trading partners and the contagion effect on the industries in sovereigns in which we operate. Arising from this exercise, we recognized that our borrowing customers may experience significant fallout which could result in increased credit losses. We saw positive impact from the extension of moratoriums, payment holidays and other accommodative activities on the delinquency levels of the portfolios. Despite the positive trend observed, we did make significant adjustments to our ECLs to recognize the increased credit risk associated with the environment. Our investment portfolios were impacted by the widening of credit spreads and foreign exchange changes which resulted in significant fall-off in asset prices. Our Income would have been negatively impacted by waiver or reduction of fees associated with certain loan facilities and reduction in loan volumes due to contraction in economic activity.
(f) Estimates of future benefit payments and premiums arising from long duration insurance contracts
The determination of the liabilities under insurance contracts represents the liability for future benefits payable by the Group based on contracts for the life assurance business in force at the date of the statement of financial position. These liabilities represent the amount which, together with future premiums and investment returns will, in the opinion of the actuary, be sufficient to pay future benefits relating to contracts of insurance in force, as well as meet the expenses incurred in connection with such contracts. For the Trinidad and Tobago life insurance subsidiaries, actuarial liabilities are calculated using the CPPM. The Jamaican life insurance subsidiaries use PPM. Both the CPPM and PPM valuations are based on assumptions of mortality, persistency, investment income, renewal expenses and other assumptions considered appropriate to be included in the basis for the determination of the liabilities of the Group under the terms of its life insurance policy contracts in force. A margin for risk or uncertainty (adverse deviations) in these assumptions is added to the liability. The assumptions are examined each year in order to determine their validity in light of current best estimates or to reflect emerging trends in the Group’s experience.
For the Dutch Caribbean life insurance subsidiaries, reserves are calculated on a Modified Net Premium Method. The Net Premium Method values liabilities as the present value of future benefits minus the present value of future net premiums. The main source of uncertainty is that epidemics and wide-ranging lifestyle changes, such as in eating, smoking and exercise habits, could result in future mortality being significantly worse than in the past for the age groups in which the Group has significant exposure to mortality risk. However, continuing improvements in medical care and social conditions could result in improvements in longevity in excess of those allowed for in the estimates used to determine the liability for contracts where the Group is exposed for longevity risk. Sensitivity analyses for key estimates used in determining the actuarial liabilities are included in Note 50.

Page 50
NCB Financial Group Limited Notes to the Financial Statements September 30, 2020 (expressed in Jamaican dollars unless otherwise indicated)
3. Critical Accounting Estimates and Judgments in Applying Accounting Policies (Continued)
(g) The ultimate liability arising from claims made under short duration insurance contracts
For the property and casualty insurance business, outstanding claims comprise estimates of the amount of reported losses and loss expenses and a provision for losses incurred but not reported (IBNR) based on the historical experience of the Group and industry data. These claims are analysed separately between those arising from damage to insured property and consequential losses. Claims arising from damage to insured property can be estimated with greater reliability, and the Group’s estimation processes reflect all the factors that influence the amount and timing of cash flows from these contracts. The shorter settlement period for these claims allow the Group to achieve a higher degree of certainty about the estimated cost of claims, and relatively little IBNR is held at year-end. However, the longer time needed to assess the emergence of claims arising from consequential losses makes the estimation process more uncertain for these claims. Significant delays may occur in the notification of claims and a substantial measure of experience and judgment is involved in assessing outstanding liabilities, the ultimate cost of which cannot be known with certainty as at the reporting date. The reserve for claims outstanding is determined on the basis of information currently available; however, it is inherent in the nature of the business written that the ultimate liabilities may vary as a result of subsequent developments.
Sensitivity analyses for key estimates used in determining the actuarial liabilities are included in Note 50
(h) Future obligations for post-employment benefits
The cost of these benefits and the present value of the future obligations depend on a number of factors that are determined by actuaries using a number of assumptions. The assumptions used in determining the net periodic cost or income for retirement benefits include the expected long-term rate of return on the relevant plan assets, the discount rate and, in the case of health benefits, the expected rate of increase in health costs. Any changes in these assumptions will impact the net periodic cost or income recorded for retirement benefits and may affect planned funding of the pension plans. The expected return on plan assets assumption is determined on a uniform basis, considering long-term historical returns, asset allocation and future estimates of long-term investment returns. The Group determines the appropriate discount rate at the end of each year, which represents the interest rate that should be used to determine the present value of estimated future cash outflows expected to be required to settle the retirement benefit obligations. In determining the appropriate discount rate, the Group considered interest rate on government bonds that are denominated in the currency in which the benefits will be paid, and have terms to maturity approximating the terms of the related obligations. The expected rate of increase of health costs has been determined by comparing the historical relationship of the actual health cost increases with the rate of inflation. Other key assumptions for the retirement benefits are based on current market conditions.
(i) Interests in structured entities
Unit Trust Scheme A subsidiary of the Group manages a Unit Trust Scheme comprising seven portfolios – the JMD Money Market Portfolio, the JMD High Yield Portfolio, the High Yield Asset and Loans Portfolio, the Caribbean Equity Portfolio, the USD Money Market Portfolio, the USD Indexed Bond Portfolio and the USD Bond Portfolio. The Unit Trust has an independent trustee. A subsidiary of the Group is the investment manager of the Unit Trust. Determining whether the Group controls the Unit Trust requires Judgment. This would include a consideration of the investors’ rights to remove the investment manager and an assessment of the exposure to variability arising from the aggregate economic interests of the Group in the Trust. One of the Group’s subsidiaries, as investment manager, earns income from preliminary charges ranging from 0-4% and management fees ranging from 1.5-1.75% on these Unit Trust portfolios. The Group owns 43% (2019 - 0.40%) of the units in the Unit Trust at September 30, 2020.
Page 51
NCB Financial Group Limited Notes to the Financial Statements September 30, 2020 (expressed in Jamaican dollars unless otherwise indicated)
3. Critical Accounting Estimates and Judgments in Applying Accounting Policies (Continued) (i) Interests in structured entities (continued)
Unit Trust Scheme (continued) In addition, pending the availability of investments consistent with the investment objective of each portfolio, a significant portion of the Unit Trust funds are invested in cash equivalent instruments issued by the Group. These are short-term fixed rate instruments with maturities of 90 days or less, collateralised by Government of Jamaica securities, that face an insignificant risk of changes in fair value. The interest margin earned by the Group on these instruments is immaterial to the results of its operations.
Management has concluded that, although the contractual terms provide the Group with power over the Unit Trust, the Group is acting as an agent for the investors in the Unit Trust as management does not consider the Group’s aggregate economic exposure and interest in the Unit Trust to be significant. Management does not believe that the investment of Unit Trust funds in cash equivalent instruments issued by the Group changes this conclusion as (i) this investment is intended to be temporary and not representative of the Unit Trust's purpose or investment objective (ii) the investment is in cash equivalent instruments subject to an insignificant risk of changes in fair value that bear interest at market rates and (iii) the investment does not expose the Group to any additional variability of returns from the Unit Trust beyond its insignificant aggregate interest through fees and unit holdings. The Unit Trust has therefore not been consolidated.
Mutual Funds The Group manages a series of mutual funds through its trust and asset management subsidiaries, Guardian Group Trust Limited and Guardian Asset Management and Investment Services Limited. These funds invest mainly in equity securities, debt securities and cash and cash equivalents. As at the consolidated statement of financial position date, the Group has determined that it controls specific funds by virtue of an entrenched management contract. Similar to the Group’s consolidation of its subsidiaries, the assets and liabilities of these funds have been consolidated in the financial statements on a line-by-line basis. The carrying value of the total investments and cash held by the funds are recorded as investment securities of mutual fund unit holders and cash and cash equivalents of mutual fund unit holders respectively on the consolidated statement of financial position. Interests held by external parties in the funds that are consolidated are recorded as third party interest in mutual funds measured at net assets value on the consolidated statement of financial position.
4. Responsibilities of the Appointed Actuaries and External Auditors
The Boards of Directors of the insurance subsidiaries, pursuant to the legislation in the various jurisdictions where the Group operates, appoint the Actuaries. Their responsibility is to carry out an annual valuation of the Group’s policyholders’ liabilities in accordance with accepted actuarial practice and regulatory requirements and report thereon to the policyholders and shareholders. In performing the valuations for life insurance policies and annuities, the Actuaries make assumptions as to the future rates of interest, asset defaults, mortality, morbidity, claims experience, policy termination, inflation, reinsurance recoveries, expenses and other contingencies, taking into consideration the circumstances of the Group and the insurance policies in force. In performing valuations for the general insurance companies assumptions are also made in relation to loss ratios, earned income ratios, loss development factors etc. The shareholders pursuant to the legislation in the various jurisdictions where the Group operates appoint the external auditors. Their responsibility is to conduct an independent and objective audit of the financial statements in accordance with International Standards on Auditing and report thereon to the shareholders. In carrying out their audit, the auditors also make use of the work of the Appointed Actuaries and their reports on the policyholders’ liabilities.
Page 52
NCB Financial Group Limited Notes to the Financial Statements September 30, 2020 (expressed in Jamaican dollars unless otherwise indicated)
5. Segment Reporting The Group is organised into the following business segments:
(a) Consumer & SME banking – This incorporates the provision of banking services to individual and small and
medium business clients.
(b) Payment services – This incorporates the provision of card related services.
(c) Corporate & commercial banking – This incorporates the provision of banking services to large corporate clients.
(d) Treasury & correspondent banking – This incorporates the Group’s liquidity and investment management
function, management of correspondent bank relationships, and relationships with other financial institutions as well as foreign currency dealing activities.
(e) Wealth, asset management & investment banking – This incorporates stock brokerage, securities trading,
investment management and other financial services provided by certain overseas subsidiaries.
(f) Life and health insurance & pension fund management – This incorporates life insurance, health insurance, pension and investment management services.
(g) General insurance – This incorporates property and casualty insurance services.
The Group’s trustee services and the outstanding transactions and balances of certain inactive subsidiaries are classified as unallocated for segment reporting. Unallocated assets and liabilities Unallocated assets and liabilities comprise current income tax payable and recoverable, deferred income tax assets and liabilities and assets and liabilities of support units of the Group that are not allocated to the banking segments. Direct allocated costs and unallocated corporate expenses Costs incurred by the support units of National Commercial Bank Jamaica Limited (“NCBJ”) are allocated to the business segments based on certain criteria determined by management. These criteria include staff complement, square footage and time spent providing the service to the business segment. The expenses that are allocated are mainly staff costs, depreciation and amortisation and other operating expenses and are treated as direct allocated costs. Costs allocated to the banking segments are reported directly by those segments to the President & Group Chief Executive Officer and Board of Directors. Costs allocated to the non-banking segments are not included in the individual internal reports presented by those segments and are treated as unallocated corporate expenses. Eliminations Eliminations comprise inter-segment transactions.
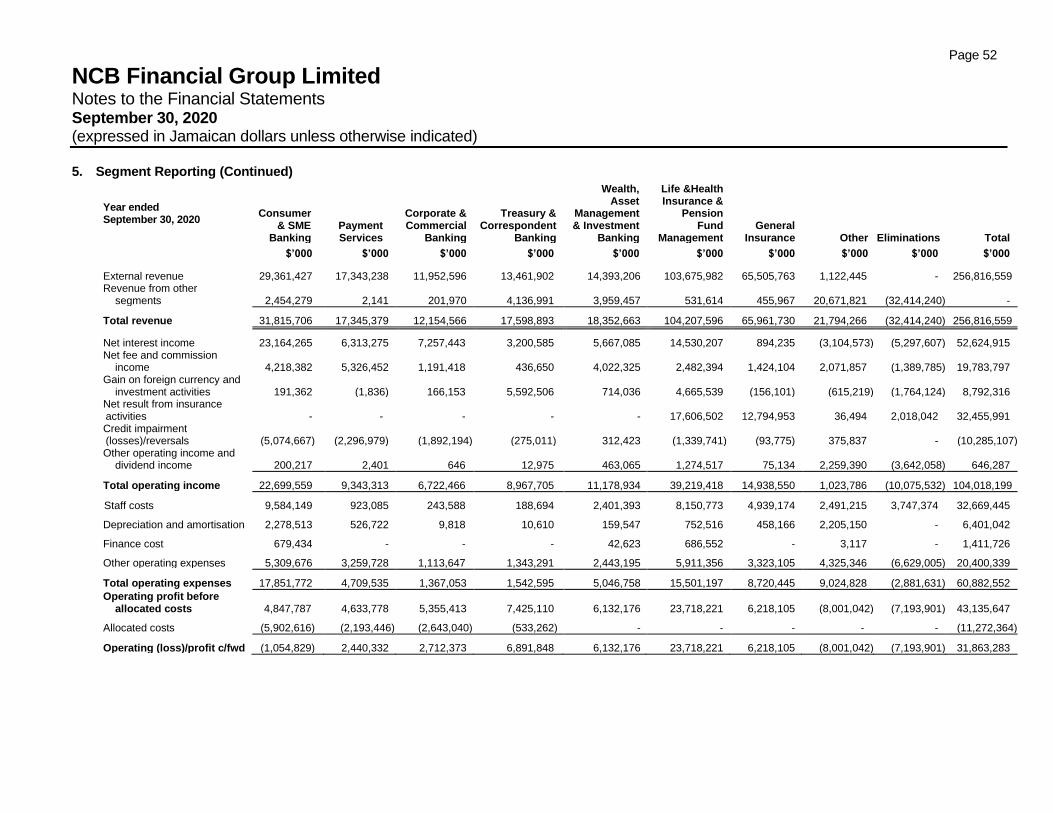
Page 52
NCB Financial Group Limited Notes to the Financial Statements September 30, 2020 (expressed in Jamaican dollars unless otherwise indicated)
5. Segment Reporting (Continued)
Year ended September 30, 2020
Consumer & SME
Banking Payment Services
Corporate & Commercial
Banking
Treasury & Correspondent
Banking
Wealth, Asset
Management & Investment
Banking
Life &Health Insurance &
Pension Fund
Management General
Insurance Other Eliminations Total
$’000 $’000 $’000 $’000 $’000 $’000 $’000 $’000 $’000 $’000
External revenue 29,361,427 17,343,238 11,952,596 13,461,902 14,393,206 103,675,982 65,505,763 1,122,445 - 256,816,559 Revenue from other
segments 2,454,279 2,141 201,970 4,136,991 3,959,457 531,614 455,967 20,671,821 (32,414,240) -
Total revenue 31,815,706 17,345,379 12,154,566 17,598,893 18,352,663 104,207,596 65,961,730 21,794,266 (32,414,240) 256,816,559
Net interest income 23,164,265 6,313,275 7,257,443 3,200,585 5,667,085 14,530,207 894,235 (3,104,573) (5,297,607) 52,624,915 Net fee and commission
income 4,218,382 5,326,452 1,191,418 436,650 4,022,325 2,482,394 1,424,104 2,071,857 (1,389,785) 19,783,797 Gain on foreign currency and
investment activities 191,362 (1,836) 166,153 5,592,506 714,036 4,665,539 (156,101) (615,219) (1,764,124) 8,792,316 Net result from insurance activities - - - - - 17,606,502 12,794,953 36,494 2,018,042 32,455,991 Credit impairment (losses)/reversals (5,074,667) (2,296,979) (1,892,194) (275,011) 312,423 (1,339,741) (93,775) 375,837 - (10,285,107) Other operating income and
dividend income 200,217 2,401 646 12,975 463,065 1,274,517 75,134 2,259,390 (3,642,058) 646,287
Total operating income 22,699,559 9,343,313 6,722,466 8,967,705 11,178,934 39,219,418 14,938,550 1,023,786 (10,075,532) 104,018,199
Staff costs 9,584,149 923,085 243,588 188,694 2,401,393 8,150,773 4,939,174 2,491,215 3,747,374 32,669,445
Depreciation and amortisation 2,278,513 526,722 9,818 10,610 159,547 752,516 458,166 2,205,150 - 6,401,042
Finance cost 679,434 - - - 42,623 686,552 - 3,117 - 1,411,726
Other operating expenses 5,309,676 3,259,728 1,113,647 1,343,291 2,443,195 5,911,356 3,323,105 4,325,346 (6,629,005) 20,400,339
Total operating expenses 17,851,772 4,709,535 1,367,053 1,542,595 5,046,758 15,501,197 8,720,445 9,024,828 (2,881,631) 60,882,552
Operating profit before allocated costs 4,847,787 4,633,778 5,355,413 7,425,110 6,132,176 23,718,221 6,218,105 (8,001,042) (7,193,901) 43,135,647
Allocated costs (5,902,616) (2,193,446) (2,643,040) (533,262) - - - - - (11,272,364)
Operating (loss)/profit c/fwd (1,054,829) 2,440,332 2,712,373 6,891,848 6,132,176 23,718,221 6,218,105 (8,001,042) (7,193,901) 31,863,283
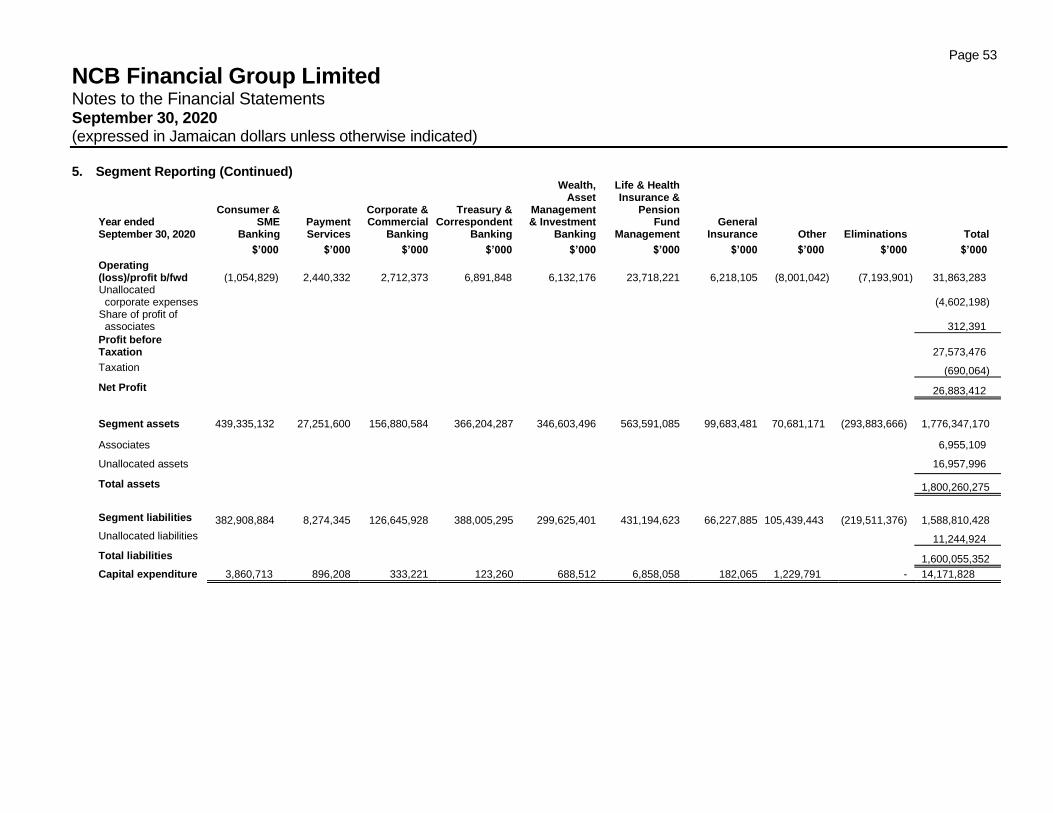
Page 53
NCB Financial Group Limited Notes to the Financial Statements September 30, 2020 (expressed in Jamaican dollars unless otherwise indicated)
5. Segment Reporting (Continued)
Year ended September 30, 2020
Corporate & Commercial
Banking
Treasury & Correspondent
Banking
Wealth, Asset
Management & Investment
Banking
Life & Health Insurance &
Pension Fund
Management General
Insurance Other Eliminations Total
Consumer & SME
Banking Payment Services
$’000 $’000 $’000 $’000 $’000 $’000 $’000 $’000 $’000 $’000
Operating (loss)/profit b/fwd (1,054,829) 2,440,332 2,712,373 6,891,848 6,132,176 23,718,221 6,218,105 (8,001,042) (7,193,901) 31,863,283 Unallocated corporate expenses (4,602,198)
Share of profit of associates 312,391
Profit before Taxation 27,573,476
Taxation (690,064)
Net Profit 26,883,412
Segment assets 439,335,132 27,251,600 156,880,584 366,204,287 346,603,496 563,591,085 99,683,481 70,681,171 (293,883,666) 1,776,347,170
Associates 6,955,109
Unallocated assets 16,957,996
Total assets 1,800,260,275
Segment liabilities 382,908,884 8,274,345 126,645,928 388,005,295 299,625,401 431,194,623 66,227,885 105,439,443 (219,511,376) 1,588,810,428
Unallocated liabilities 11,244,924
Total liabilities 1,600,055,352
Capital expenditure 3,860,713 896,208 333,221 123,260 688,512 6,858,058 182,065 1,229,791 - 14,171,828
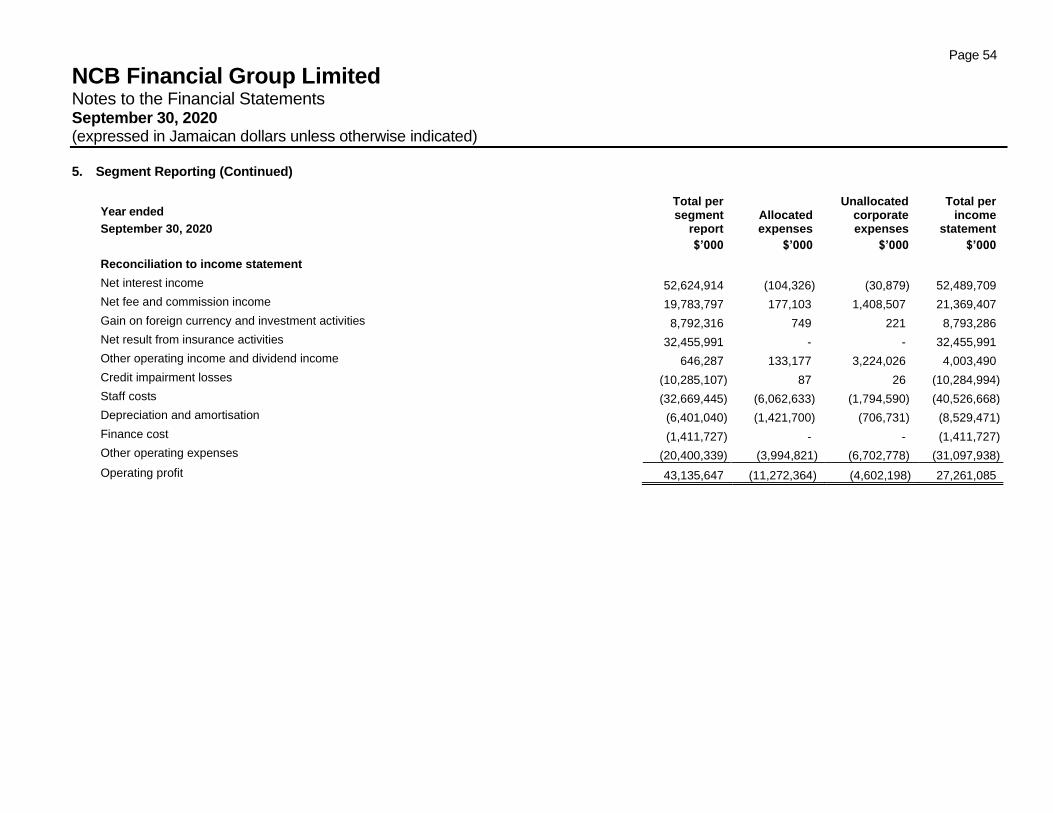
Page 54
NCB Financial Group Limited Notes to the Financial Statements September 30, 2020 (expressed in Jamaican dollars unless otherwise indicated)
5. Segment Reporting (Continued)
Year ended
September 30, 2020
Total per segment
report Allocated expenses
Unallocated corporate expenses
Total per income
statement
$’000 $’000 $’000 $’000
Reconciliation to income statement
Net interest income 52,624,914 (104,326) (30,879) 52,489,709
Net fee and commission income 19,783,797 177,103 1,408,507 21,369,407
Gain on foreign currency and investment activities 8,792,316 749 221 8,793,286
Net result from insurance activities 32,455,991 - - 32,455,991
Other operating income and dividend income 646,287 133,177 3,224,026 4,003,490
Credit impairment losses (10,285,107) 87 26 (10,284,994)
Staff costs (32,669,445) (6,062,633) (1,794,590) (40,526,668)
Depreciation and amortisation (6,401,040) (1,421,700) (706,731) (8,529,471)
Finance cost (1,411,727) - - (1,411,727)
Other operating expenses (20,400,339) (3,994,821) (6,702,778) (31,097,938)
Operating profit 43,135,647 (11,272,364) (4,602,198) 27,261,085
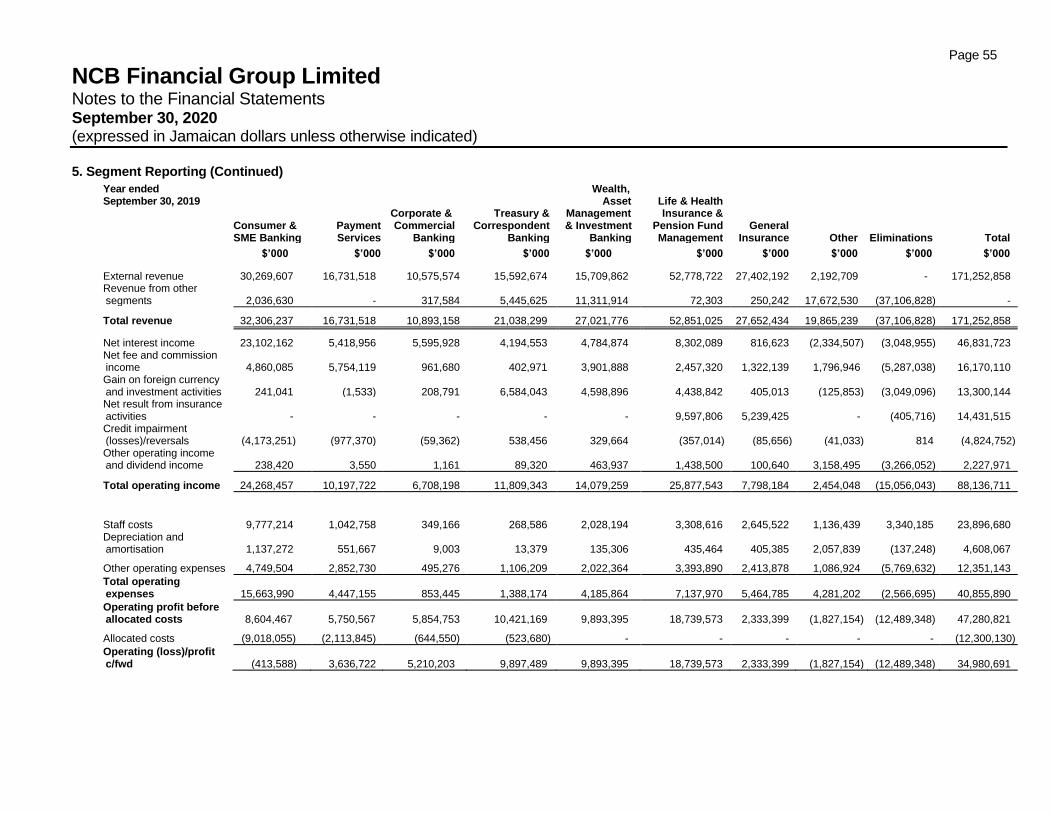
Page 55
NCB Financial Group Limited Notes to the Financial Statements September 30, 2020 (expressed in Jamaican dollars unless otherwise indicated)
5. Segment Reporting (Continued)
Year ended September 30, 2019
Corporate & Commercial
Banking
Treasury & Correspondent
Banking
Wealth, Asset
Management & Investment
Banking
Life & Health Insurance &
Pension Fund Management
General Insurance Other Eliminations Total
Consumer & SME Banking
Payment Services
$’000 $’000 $’000 $’000 $’000 $’000 $’000 $’000 $’000 $’000
External revenue 30,269,607 16,731,518 10,575,574 15,592,674 15,709,862 52,778,722 27,402,192 2,192,709 - 171,252,858 Revenue from other segments 2,036,630 - 317,584 5,445,625 11,311,914 72,303 250,242 17,672,530 (37,106,828) -
Total revenue 32,306,237 16,731,518 10,893,158 21,038,299 27,021,776 52,851,025 27,652,434 19,865,239 (37,106,828) 171,252,858
Net interest income 23,102,162 5,418,956 5,595,928 4,194,553 4,784,874 8,302,089 816,623 (2,334,507) (3,048,955) 46,831,723 Net fee and commission income 4,860,085 5,754,119 961,680 402,971 3,901,888 2,457,320 1,322,139 1,796,946 (5,287,038) 16,170,110 Gain on foreign currency and investment activities 241,041 (1,533) 208,791 6,584,043 4,598,896 4,438,842 405,013 (125,853) (3,049,096) 13,300,144 Net result from insurance activities - - - - - 9,597,806 5,239,425 - (405,716) 14,431,515 Credit impairment (losses)/reversals (4,173,251) (977,370) (59,362) 538,456 329,664 (357,014) (85,656) (41,033) 814 (4,824,752) Other operating income and dividend income 238,420 3,550 1,161 89,320 463,937 1,438,500 100,640 3,158,495 (3,266,052) 2,227,971
Total operating income 24,268,457 10,197,722 6,708,198 11,809,343 14,079,259 25,877,543 7,798,184 2,454,048 (15,056,043) 88,136,711
Staff costs 9,777,214 1,042,758 349,166 268,586 2,028,194 3,308,616 2,645,522 1,136,439 3,340,185 23,896,680 Depreciation and amortisation 1,137,272 551,667 9,003 13,379 135,306 435,464 405,385 2,057,839 (137,248) 4,608,067
Other operating expenses 4,749,504 2,852,730 495,276 1,106,209 2,022,364 3,393,890 2,413,878 1,086,924 (5,769,632) 12,351,143
Total operating expenses 15,663,990 4,447,155 853,445 1,388,174 4,185,864 7,137,970 5,464,785 4,281,202 (2,566,695) 40,855,890
Operating profit before allocated costs 8,604,467 5,750,567 5,854,753 10,421,169 9,893,395 18,739,573 2,333,399 (1,827,154) (12,489,348) 47,280,821
Allocated costs (9,018,055) (2,113,845) (644,550) (523,680) - - - - - (12,300,130)
Operating (loss)/profit c/fwd (413,588) 3,636,722 5,210,203 9,897,489 9,893,395 18,739,573 2,333,399 (1,827,154) (12,489,348) 34,980,691
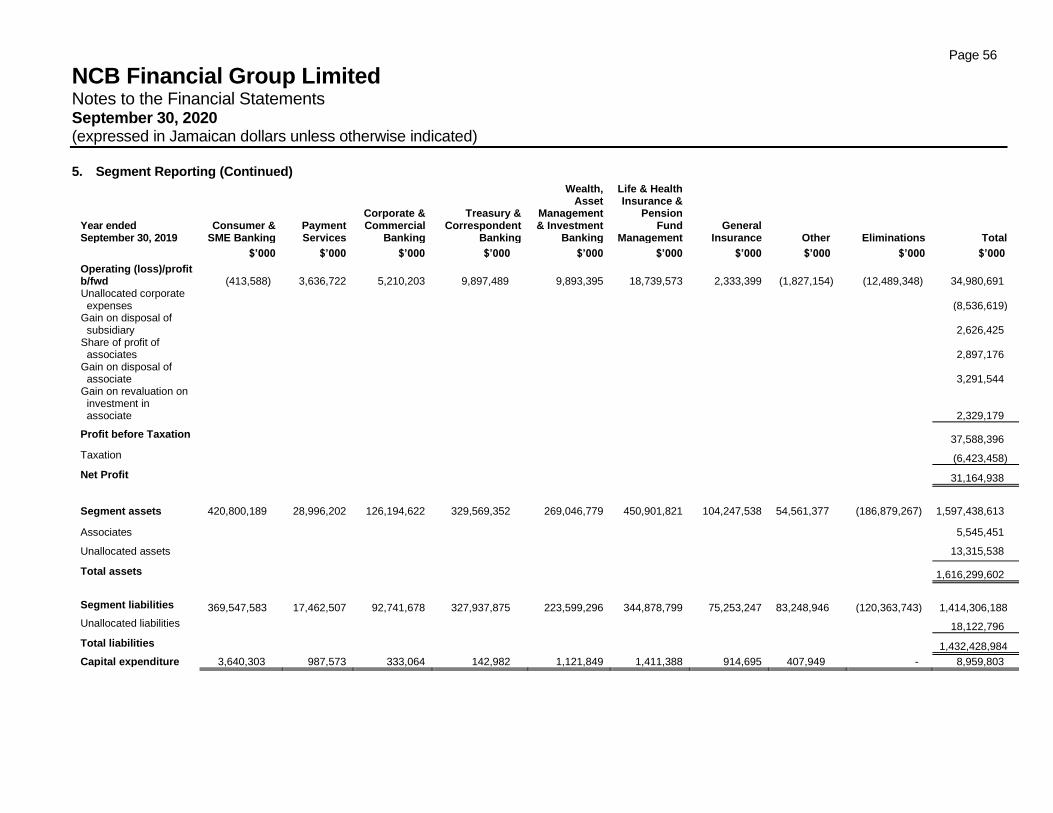
Page 56
NCB Financial Group Limited Notes to the Financial Statements September 30, 2020 (expressed in Jamaican dollars unless otherwise indicated)
5. Segment Reporting (Continued)
Year ended September 30, 2019
Corporate & Commercial
Banking
Treasury & Correspondent
Banking
Wealth, Asset
Management & Investment
Banking
Life & Health Insurance &
Pension Fund
Management General
Insurance Other Eliminations Total Consumer &
SME Banking Payment Services
$’000 $’000 $’000 $’000 $’000 $’000 $’000 $’000 $’000 $’000
Operating (loss)/profit b/fwd (413,588) 3,636,722 5,210,203 9,897,489 9,893,395 18,739,573 2,333,399 (1,827,154) (12,489,348) 34,980,691 Unallocated corporate expenses (8,536,619)
Gain on disposal of subsidiary 2,626,425
Share of profit of associates 2,897,176
Gain on disposal of associate 3,291,544
Gain on revaluation on investment in associate 2,329,179
Profit before Taxation 37,588,396
Taxation (6,423,458)
Net Profit 31,164,938
Segment assets 420,800,189 28,996,202 126,194,622 329,569,352 269,046,779 450,901,821 104,247,538 54,561,377 (186,879,267) 1,597,438,613
Associates 5,545,451
Unallocated assets 13,315,538
Total assets 1,616,299,602
Segment liabilities 369,547,583 17,462,507 92,741,678 327,937,875 223,599,296 344,878,799 75,253,247 83,248,946 (120,363,743) 1,414,306,188
Unallocated liabilities 18,122,796
Total liabilities 1,432,428,984
Capital expenditure 3,640,303 987,573 333,064 142,982 1,121,849 1,411,388 914,695 407,949 - 8,959,803
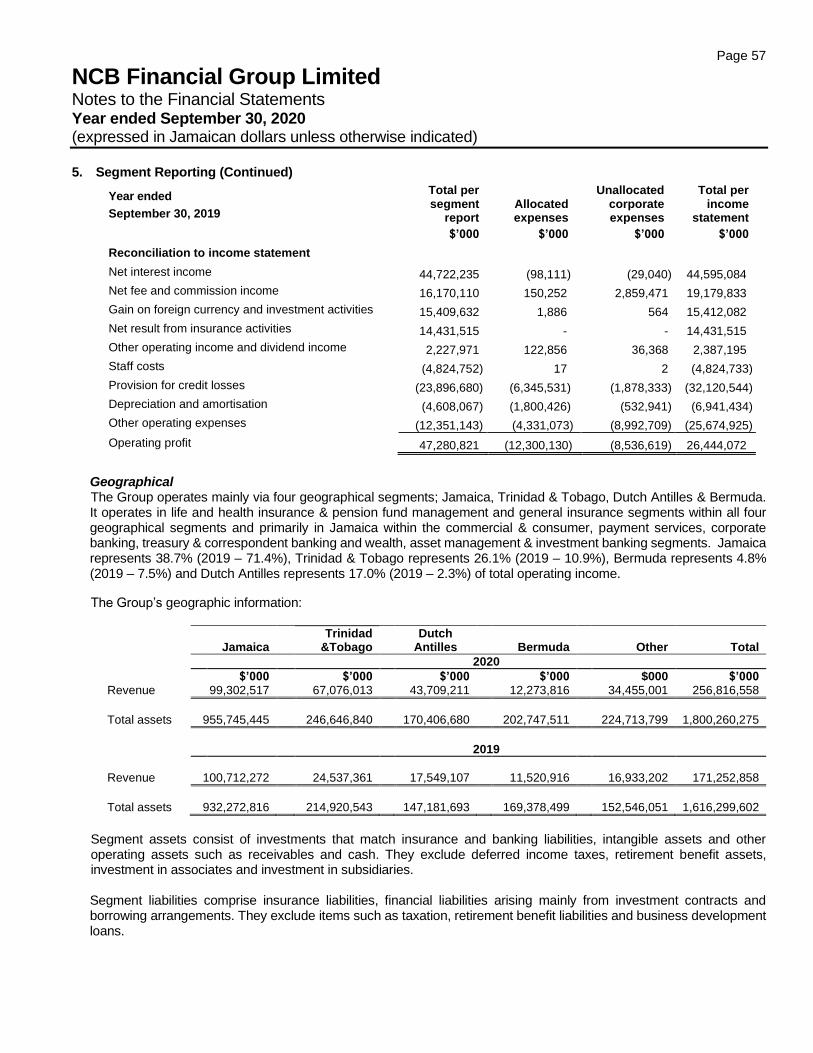
Page 57
NCB Financial Group Limited Notes to the Financial Statements Year ended September 30, 2020 (expressed in Jamaican dollars unless otherwise indicated)
5. Segment Reporting (Continued)
Year ended
September 30, 2019
Total per segment
report Allocated expenses
Unallocated corporate expenses
Total per income
statement
$’000 $’000 $’000 $’000
Reconciliation to income statement
Net interest income 44,722,235 (98,111) (29,040) 44,595,084
Net fee and commission income 16,170,110 150,252 2,859,471 19,179,833
Gain on foreign currency and investment activities 15,409,632 1,886 564 15,412,082
Net result from insurance activities 14,431,515 - - 14,431,515
Other operating income and dividend income 2,227,971 122,856 36,368 2,387,195
Staff costs (4,824,752) 17 2 (4,824,733)
Provision for credit losses (23,896,680) (6,345,531) (1,878,333) (32,120,544)
Depreciation and amortisation (4,608,067) (1,800,426) (532,941) (6,941,434)
Other operating expenses (12,351,143) (4,331,073) (8,992,709) (25,674,925)
Operating profit 47,280,821 (12,300,130) (8,536,619) 26,444,072
Geographical The Group operates mainly via four geographical segments; Jamaica, Trinidad & Tobago, Dutch Antilles & Bermuda. It operates in life and health insurance & pension fund management and general insurance segments within all four geographical segments and primarily in Jamaica within the commercial & consumer, payment services, corporate banking, treasury & correspondent banking and wealth, asset management & investment banking segments. Jamaica represents 38.7% (2019 – 71.4%), Trinidad & Tobago represents 26.1% (2019 – 10.9%), Bermuda represents 4.8% (2019 – 7.5%) and Dutch Antilles represents 17.0% (2019 – 2.3%) of total operating income.
The Group’s geographic information:
Jamaica Trinidad
&Tobago Dutch
Antilles
Bermuda
Other Total
2020
$’000 $’000 $’000 $’000 $000 $’000 Revenue 99,302,517 67,076,013 43,709,211 12,273,816 34,455,001 256,816,558
Total assets 955,745,445 246,646,840 170,406,680 202,747,511 224,713,799 1,800,260,275
2019
Revenue 100,712,272 24,537,361 17,549,107 11,520,916 16,933,202 171,252,858
Total assets 932,272,816 214,920,543 147,181,693 169,378,499 152,546,051 1,616,299,602
Segment assets consist of investments that match insurance and banking liabilities, intangible assets and other operating assets such as receivables and cash. They exclude deferred income taxes, retirement benefit assets, investment in associates and investment in subsidiaries. Segment liabilities comprise insurance liabilities, financial liabilities arising mainly from investment contracts and borrowing arrangements. They exclude items such as taxation, retirement benefit liabilities and business development loans.
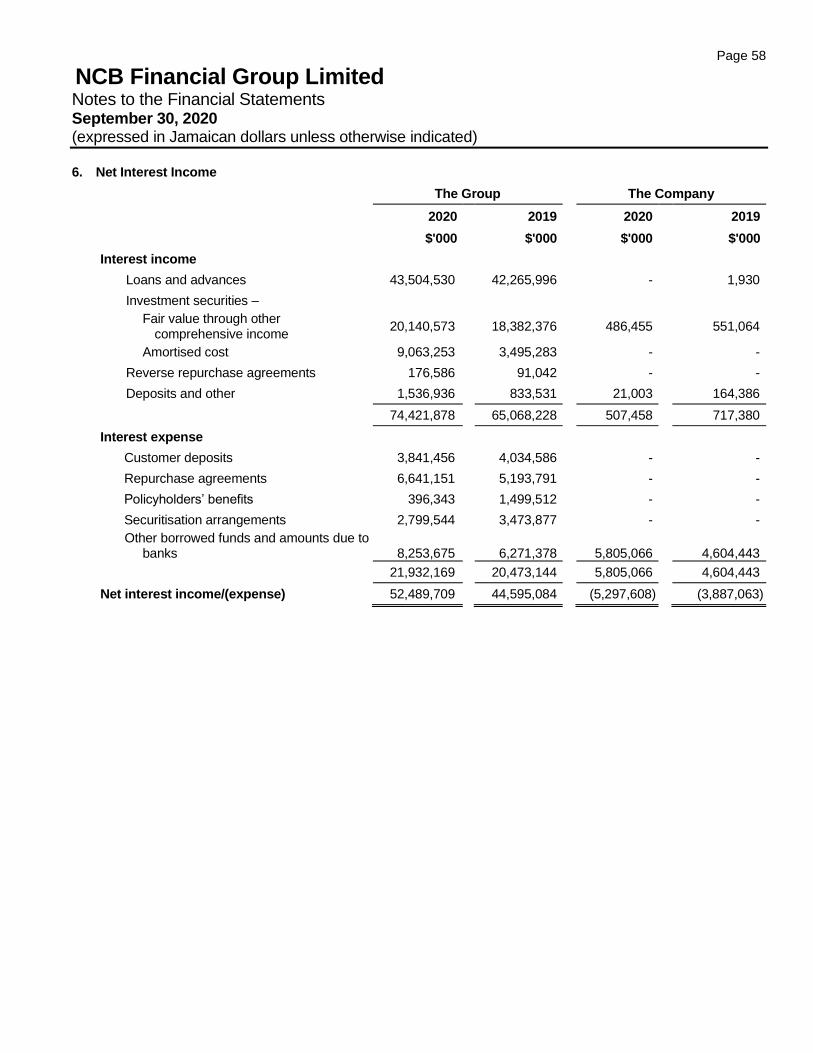
Page 58
NCB Financial Group Limited Notes to the Financial Statements September 30, 2020 (expressed in Jamaican dollars unless otherwise indicated)
6. Net Interest Income
The Group The Company
2020 2019 2020 2019
$'000 $'000 $'000 $'000
Interest income
Loans and advances 43,504,530 42,265,996 - 1,930
Investment securities –
Fair value through other comprehensive income
20,140,573 18,382,376 486,455 551,064
Amortised cost 9,063,253 3,495,283 - -
Reverse repurchase agreements 176,586 91,042 - -
Deposits and other 1,536,936 833,531 21,003 164,386
74,421,878 65,068,228 507,458 717,380
Interest expense
Customer deposits 3,841,456 4,034,586 - -
Repurchase agreements 6,641,151 5,193,791 - -
Policyholders’ benefits 396,343 1,499,512 - -
Securitisation arrangements 2,799,544 3,473,877 - -
Other borrowed funds and amounts due to banks 8,253,675
6,271,378
5,805,066
4,604,443
21,932,169 20,473,144 5,805,066 4,604,443
Net interest income/(expense) 52,489,709 44,595,084 (5,297,608) (3,887,063)
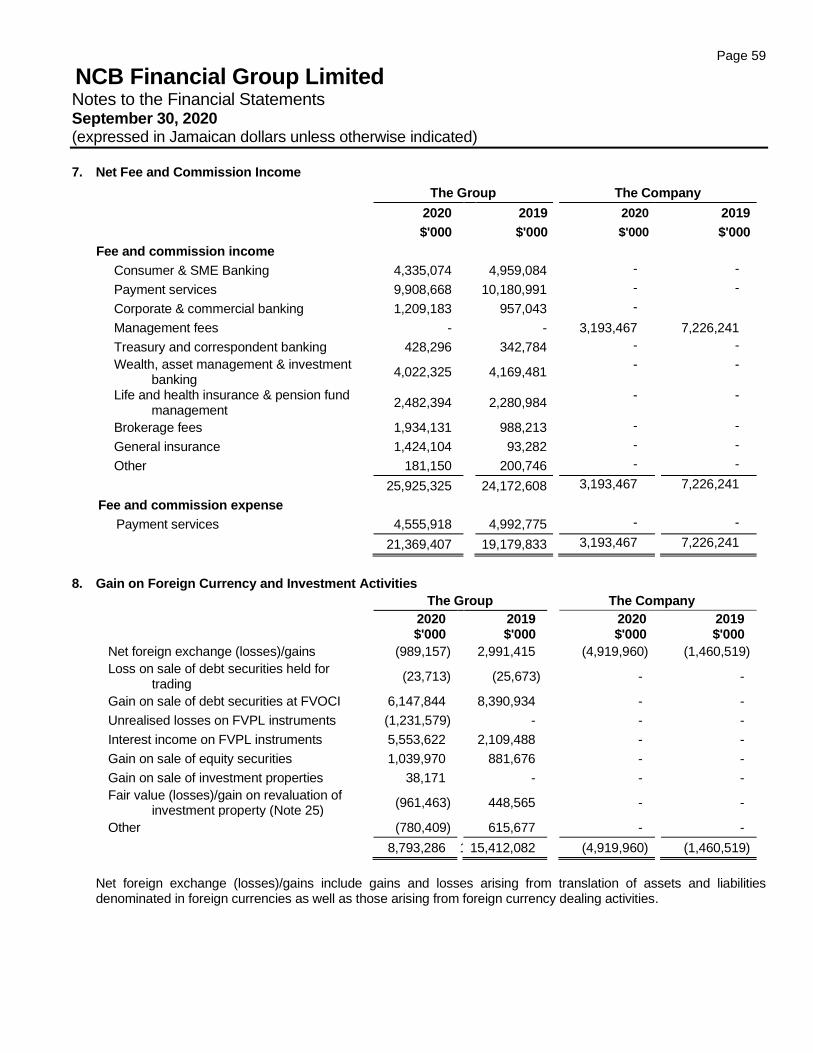
Page 59
NCB Financial Group Limited Notes to the Financial Statements September 30, 2020 (expressed in Jamaican dollars unless otherwise indicated)
7. Net Fee and Commission Income
The Group The Company
2020 2019 2020 2019
$'000 $'000 $'000 $'000
Fee and commission income
Consumer & SME Banking 4,335,074 4,959,084 - -
Payment services 9,908,668 10,180,991 - -
Corporate & commercial banking 1,209,183 957,043 -
Management fees - - 3,193,467 7,226,241
Treasury and correspondent banking 428,296 342,784 - -
Wealth, asset management & investment banking
4,022,325 4,169,481 - -
Life and health insurance & pension fund management
2,482,394 2,280,984 - -
Brokerage fees 1,934,131 988,213 - -
General insurance 1,424,104 93,282 - -
Other 181,150 200,746 - -
25,925,325 24,172,608 3,193,467 7,226,241
Fee and commission expense
Payment services 4,555,918 4,992,775 - -
21,369,407 19,179,833 3,193,467 7,226,241
8. Gain on Foreign Currency and Investment Activities
The Group The Company
2020 2019 2020 2019 $'000 $'000 $'000 $'000
Net foreign exchange (losses)/gains (989,157) 2,991,415 (4,919,960) (1,460,519)
Loss on sale of debt securities held for trading
(23,713) (25,673) -
-
Gain on sale of debt securities at FVOCI 6,147,844 8,390,934 - -
Unrealised losses on FVPL instruments (1,231,579) - - -
Interest income on FVPL instruments 5,553,622 2,109,488 - -
Gain on sale of equity securities 1,039,970 881,676 - -
Gain on sale of investment properties 38,171 - - -
Fair value (losses)/gain on revaluation of investment property (Note 25)
(961,463) 448,565 -
-
Other (780,409) 615,677 - -
8,793,286 1 15,412,082 (4,919,960) (1,460,519)
Net foreign exchange (losses)/gains include gains and losses arising from translation of assets and liabilities denominated in foreign currencies as well as those arising from foreign currency dealing activities.
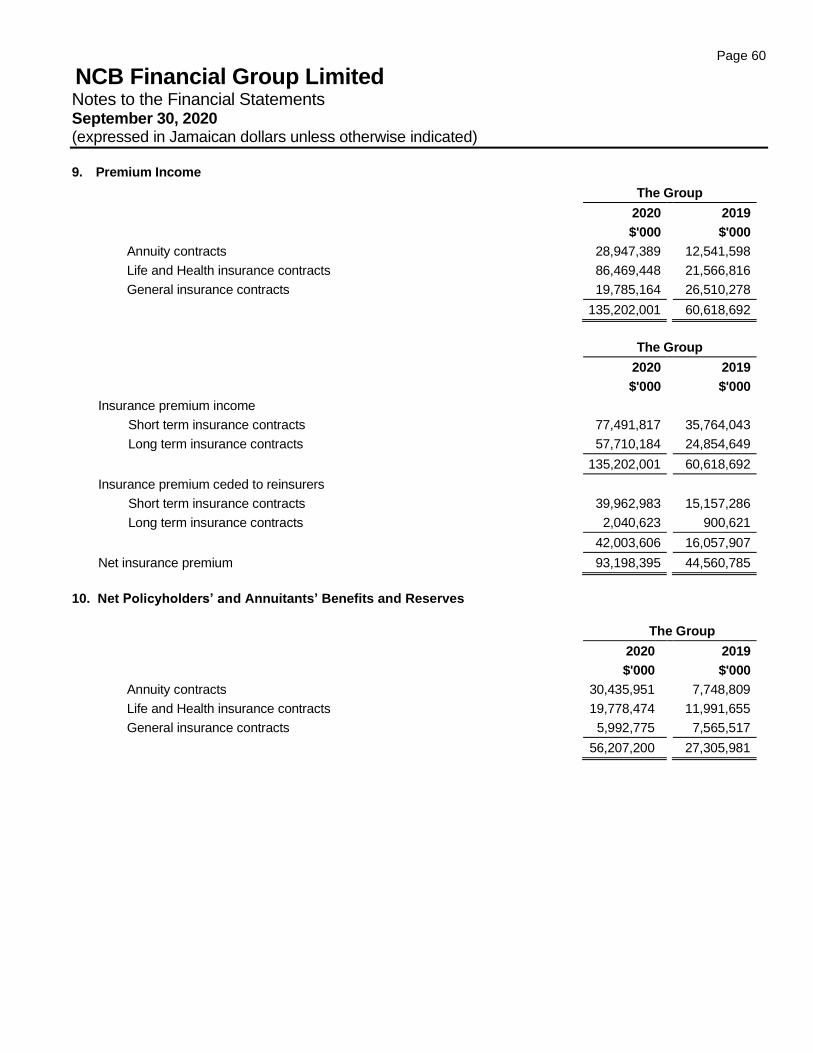
Page 60
NCB Financial Group Limited Notes to the Financial Statements September 30, 2020 (expressed in Jamaican dollars unless otherwise indicated)
9. Premium Income
The Group
2020 2019
$'000 $'000
Annuity contracts 28,947,389 12,541,598
Life and Health insurance contracts 86,469,448 21,566,816
General insurance contracts 19,785,164 26,510,278
135,202,001 60,618,692
The Group
2020 2019
$'000 $'000
Insurance premium income
Short term insurance contracts 77,491,817 35,764,043
Long term insurance contracts 57,710,184 24,854,649
135,202,001 60,618,692
Insurance premium ceded to reinsurers
Short term insurance contracts 39,962,983 15,157,286
Long term insurance contracts 2,040,623 900,621
42,003,606 16,057,907
Net insurance premium 93,198,395 44,560,785
10. Net Policyholders’ and Annuitants’ Benefits and Reserves
The Group
2020 2019
$'000 $'000
Annuity contracts 30,435,951 7,748,809
Life and Health insurance contracts 19,778,474 11,991,655
General insurance contracts 5,992,775 7,565,517
56,207,200 27,305,981
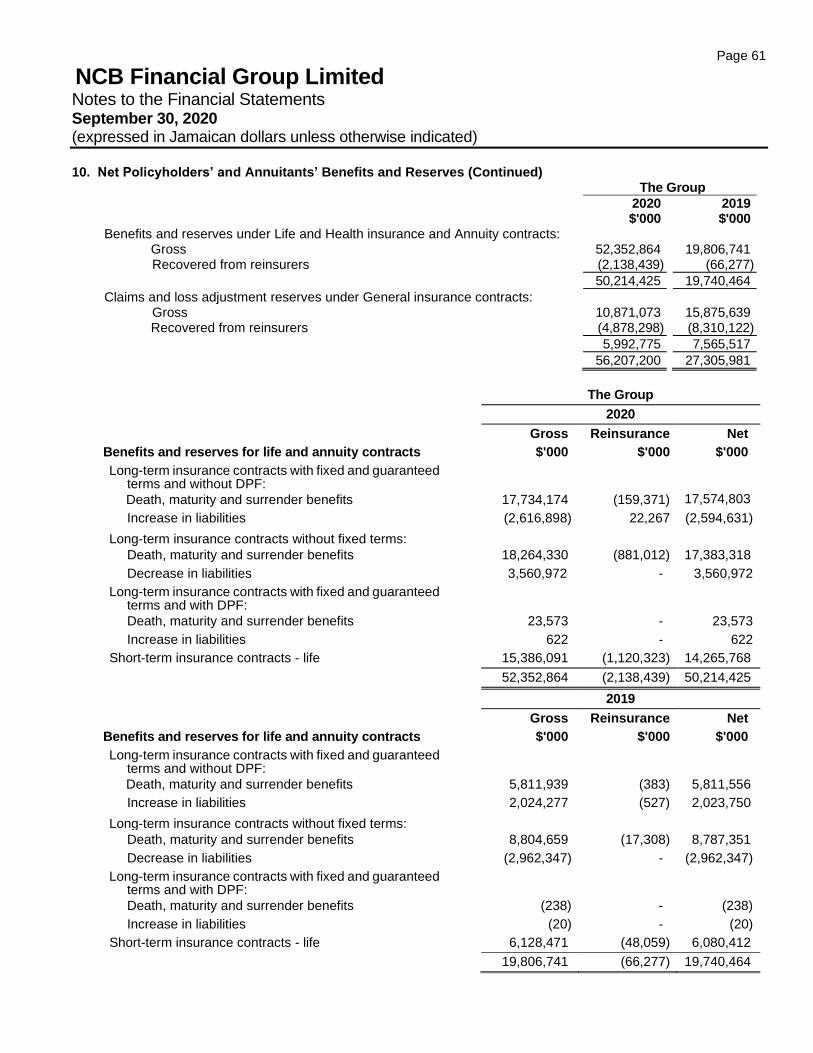
Page 61
NCB Financial Group Limited Notes to the Financial Statements September 30, 2020 (expressed in Jamaican dollars unless otherwise indicated)
10. Net Policyholders’ and Annuitants’ Benefits and Reserves (Continued) The Group
2020 2019 $'000 $'000
Benefits and reserves under Life and Health insurance and Annuity contracts: Gross 52,352,864 19,806,741 Recovered from reinsurers (2,138,439) (66,277)
50,214,425 19,740,464
Claims and loss adjustment reserves under General insurance contracts: Gross 10,871,073 15,875,639 Recovered from reinsurers (4,878,298) (8,310,122)
5,992,775 7,565,517
56,207,200 27,305,981
The Group
2020
Gross Reinsurance Net
Benefits and reserves for life and annuity contracts $'000 $'000 $'000
Long-term insurance contracts with fixed and guaranteed terms and without DPF:
Death, maturity and surrender benefits 17,734,174 (159,371) 17,574,803
Increase in liabilities (2,616,898) 22,267 (2,594,631)
Long-term insurance contracts without fixed terms:
Death, maturity and surrender benefits 18,264,330 (881,012) 17,383,318
Decrease in liabilities 3,560,972 - 3,560,972
Long-term insurance contracts with fixed and guaranteed terms and with DPF:
Death, maturity and surrender benefits 23,573 - 23,573
Increase in liabilities 622 - 622
Short-term insurance contracts - life 15,386,091 (1,120,323) 14,265,768
52,352,864 (2,138,439) 50,214,425
2019
Gross Reinsurance Net
Benefits and reserves for life and annuity contracts $'000 $'000 $'000
Long-term insurance contracts with fixed and guaranteed terms and without DPF:
Death, maturity and surrender benefits 5,811,939 (383) 5,811,556
Increase in liabilities 2,024,277 (527) 2,023,750
Long-term insurance contracts without fixed terms:
Death, maturity and surrender benefits 8,804,659 (17,308) 8,787,351
Decrease in liabilities (2,962,347) - (2,962,347)
Long-term insurance contracts with fixed and guaranteed terms and with DPF:
Death, maturity and surrender benefits (238) - (238)
Increase in liabilities (20) - (20)
Short-term insurance contracts - life 6,128,471 (48,059) 6,080,412
19,806,741 (66,277) 19,740,464
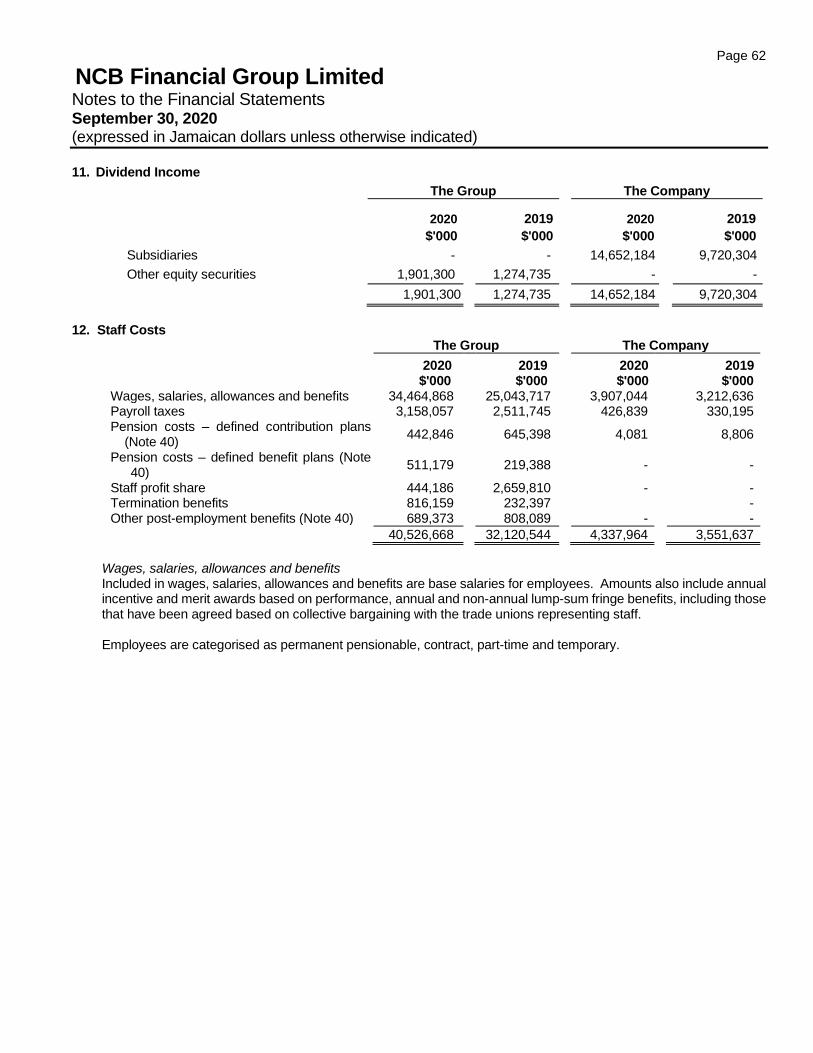
Page 62
NCB Financial Group Limited Notes to the Financial Statements September 30, 2020 (expressed in Jamaican dollars unless otherwise indicated)
11. Dividend Income
The Group The Company
2020 2019 2020 2019
$'000 $'000 $'000 $'000
Subsidiaries - - 14,652,184 9,720,304
Other equity securities 1,901,300 1,274,735 - -
1,901,300 1,274,735 14,652,184 9,720,304
12. Staff Costs The Group The Company
2020 2019 2020 2019 $'000 $'000 $'000 $'000
Wages, salaries, allowances and benefits 34,464,868 25,043,717 3,907,044 3,212,636 Payroll taxes 3,158,057 2,511,745 426,839 330,195 Pension costs – defined contribution plans
(Note 40) 442,846 645,398 4,081 8,806
Pension costs – defined benefit plans (Note 40)
511,179 219,388 - -
Staff profit share 444,186 2,659,810 - - Termination benefits 816,159 232,397 - Other post-employment benefits (Note 40) 689,373 808,089 - -
40,526,668 32,120,544 4,337,964 3,551,637
Wages, salaries, allowances and benefits Included in wages, salaries, allowances and benefits are base salaries for employees. Amounts also include annual incentive and merit awards based on performance, annual and non-annual lump-sum fringe benefits, including those that have been agreed based on collective bargaining with the trade unions representing staff. Employees are categorised as permanent pensionable, contract, part-time and temporary.
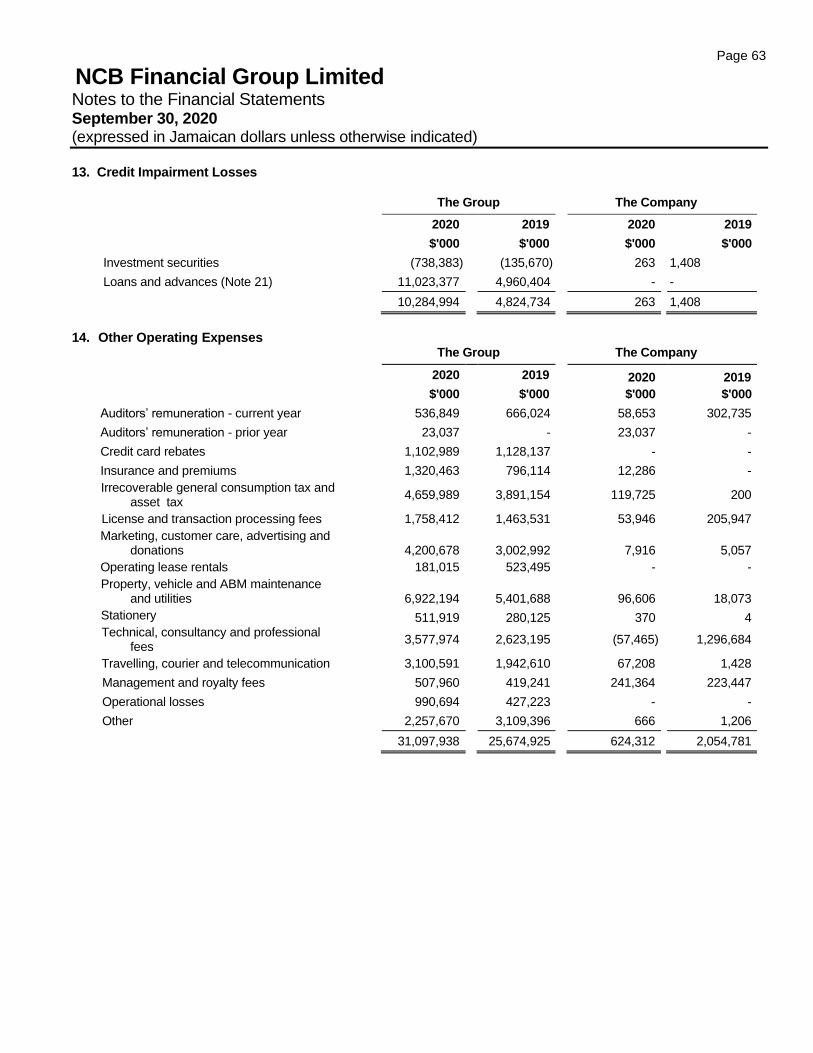
Page 63
NCB Financial Group Limited Notes to the Financial Statements September 30, 2020 (expressed in Jamaican dollars unless otherwise indicated)
13. Credit Impairment Losses
The Group The Company
2020 2019 2020 2019
$'000 $'000 $'000 $'000
Investment securities (738,383) (135,670) 263 1,408
Loans and advances (Note 21) 11,023,377 4,960,404 - -
10,284,994 4,824,734 263 1,408
14. Other Operating Expenses
The Group The Company
2020 2019 2020 2019
$'000 $'000 $'000 $'000
Auditors’ remuneration - current year 536,849 666,024 58,653 302,735
Auditors’ remuneration - prior year 23,037 - 23,037 -
Credit card rebates 1,102,989 1,128,137 - -
Insurance and premiums 1,320,463 796,114 12,286 -
Irrecoverable general consumption tax and asset tax
4,659,989
3,891,154 119,725 200
License and transaction processing fees 1,758,412 1,463,531 53,946 205,947
Marketing, customer care, advertising and donations 4,200,678
3,002,992 7,916
5,057
Operating lease rentals 181,015 523,495 - -
Property, vehicle and ABM maintenance and utilities 6,922,194
5,401,688 96,606 18,073
Stationery 511,919 280,125 370 4 Technical, consultancy and professional
fees 3,577,974
2,623,195 (57,465) 1,296,684
Travelling, courier and telecommunication 3,100,591 1,942,610 67,208 1,428
Management and royalty fees 507,960 419,241 241,364 223,447
Operational losses 990,694 427,223 - -
Other 2,257,670 3,109,396 666 1,206
31,097,938 25,674,925 624,312 2,054,781
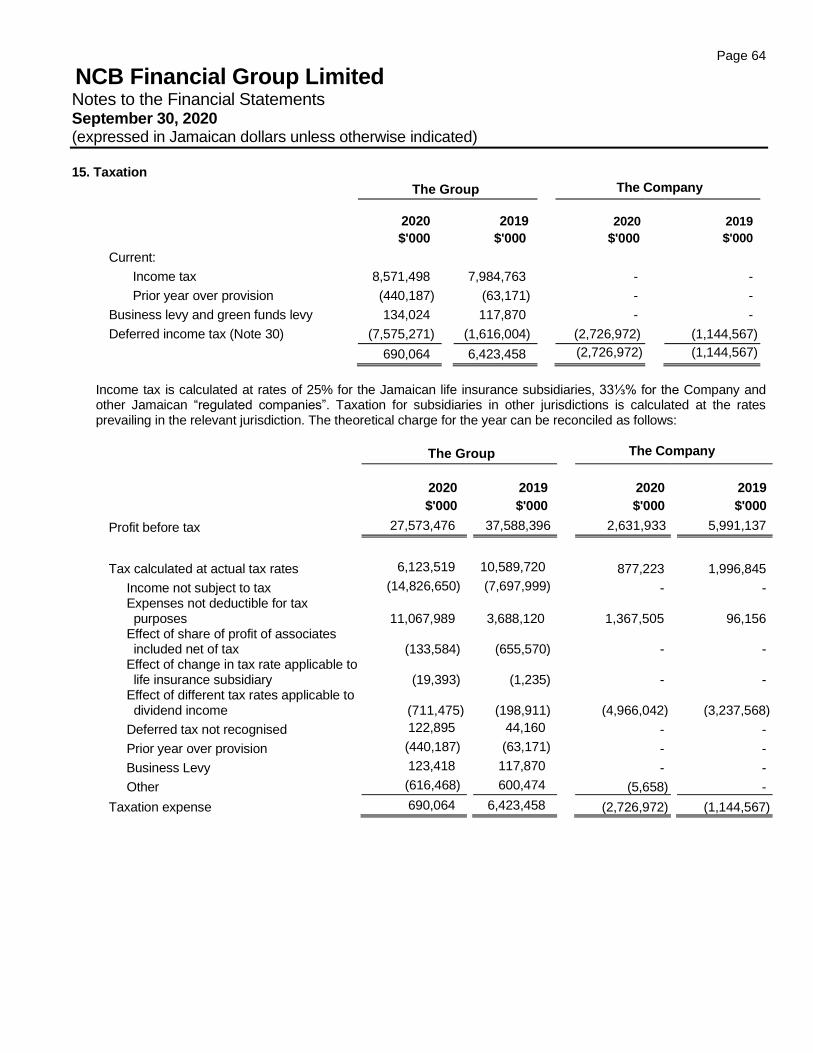
Page 64
NCB Financial Group Limited Notes to the Financial Statements September 30, 2020 (expressed in Jamaican dollars unless otherwise indicated)
15. Taxation
The Group The Company
2020
2019
2020 2019
$'000 $'000 $'000 $'000
Current:
Income tax 8,571,498 7,984,763 - -
Prior year over provision (440,187) (63,171) - -
Business levy and green funds levy 134,024 117,870 - -
Deferred income tax (Note 30) (7,575,271) (1,616,004) (2,726,972) (1,144,567)
690,064 6,423,458 (2,726,972) (1,144,567)
Income tax is calculated at rates of 25% for the Jamaican life insurance subsidiaries, 33⅓% for the Company and other Jamaican “regulated companies”. Taxation for subsidiaries in other jurisdictions is calculated at the rates prevailing in the relevant jurisdiction. The theoretical charge for the year can be reconciled as follows:
The Group The Company
2020
2019
2020
2019
$'000 $'000 $'000 $'000
Profit before tax 27,573,476 37,588,396 2,631,933 5,991,137
Tax calculated at actual tax rates 6,123,519 10,589,720 877,223 1,996,845
Income not subject to tax (14,826,650) (7,697,999) - - Expenses not deductible for tax
purposes
11,067,989
3,688,120 1,367,505 96,156
Effect of share of profit of associates included net of tax
(133,584)
(655,570) - - Effect of change in tax rate applicable to
life insurance subsidiary
(19,393)
(1,235) - -
Effect of different tax rates applicable to dividend income
(711,475)
(198,911) (4,966,042) (3,237,568)
Deferred tax not recognised 122,895 44,160 - -
Prior year over provision (440,187) (63,171) - -
Business Levy 123,418 117,870 - -
Other (616,468) 600,474 (5,658) -
Taxation expense 690,064 6,423,458 (2,726,972) (1,144,567)
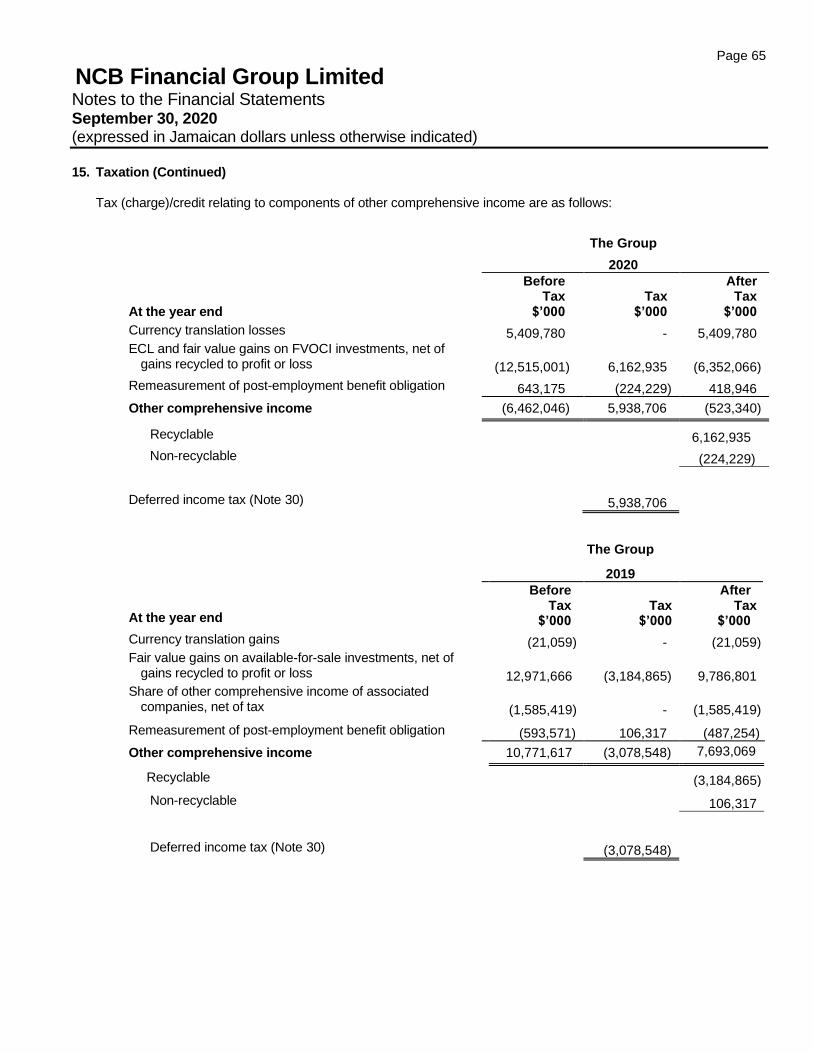
Page 65
NCB Financial Group Limited Notes to the Financial Statements September 30, 2020 (expressed in Jamaican dollars unless otherwise indicated)
15. Taxation (Continued)
Tax (charge)/credit relating to components of other comprehensive income are as follows:
The Group
2020
At the year end
Before Tax
$’000 Tax
$’000
After Tax
$’000
Currency translation losses 5,409,780 - 5,409,780 ECL and fair value gains on FVOCI investments, net of
gains recycled to profit or loss (12,515,001) 6,162,935 (6,352,066)
Remeasurement of post-employment benefit obligation 643,175 (224,229) 418,946
Other comprehensive income (6,462,046) 5,938,706 (523,340)
Recyclable 6,162,935
Non-recyclable (224,229)
Deferred income tax (Note 30) 5,938,706
The Group
2019
At the year end
Before Tax
$’000 Tax
$’000
After Tax
$’000
Currency translation gains (21,059) - (21,059) Fair value gains on available-for-sale investments, net of
gains recycled to profit or loss 12,971,666 (3,184,865) 9,786,801 Share of other comprehensive income of associated
companies, net of tax (1,585,419) - (1,585,419)
Remeasurement of post-employment benefit obligation (593,571) 106,317 (487,254)
Other comprehensive income 10,771,617 (3,078,548) 7,693,069
Recyclable (3,184,865)
Non-recyclable 106,317
Deferred income tax (Note 30) (3,078,548)
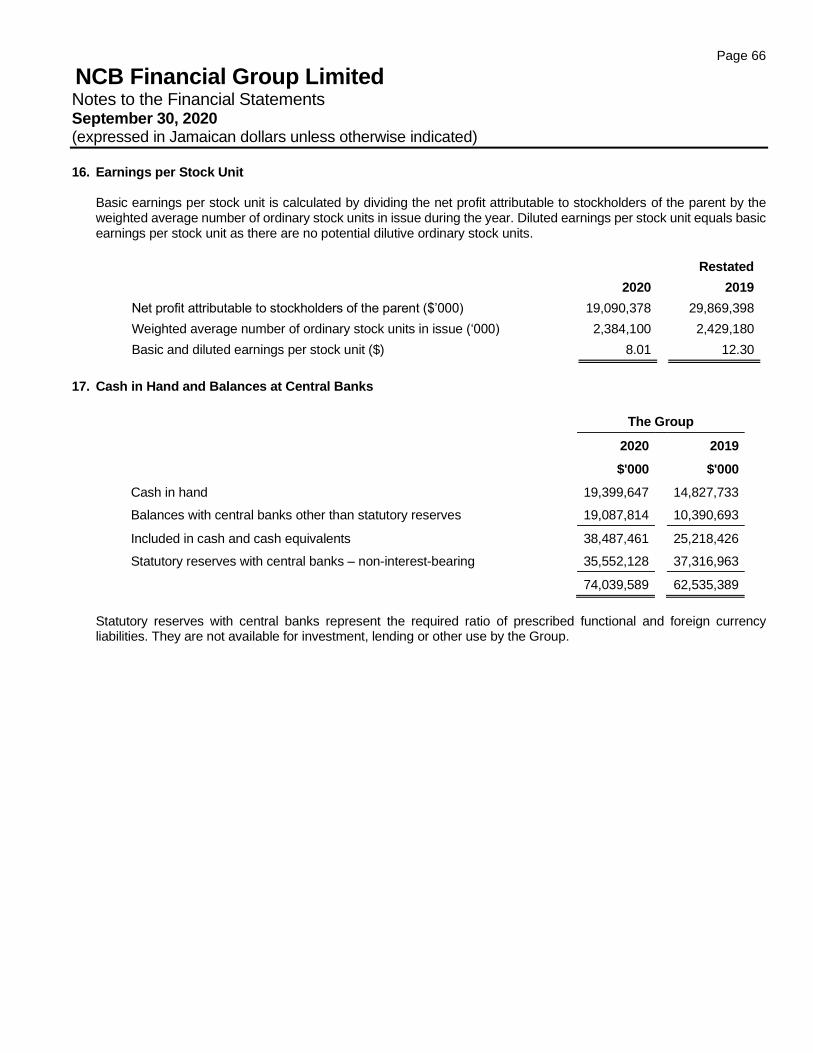
Page 66
NCB Financial Group Limited Notes to the Financial Statements September 30, 2020 (expressed in Jamaican dollars unless otherwise indicated)
16. Earnings per Stock Unit
Basic earnings per stock unit is calculated by dividing the net profit attributable to stockholders of the parent by the weighted average number of ordinary stock units in issue during the year. Diluted earnings per stock unit equals basic earnings per stock unit as there are no potential dilutive ordinary stock units.
Restated
2020 2019
Net profit attributable to stockholders of the parent ($’000) 19,090,378 29,869,398
Weighted average number of ordinary stock units in issue (‘000) 2,384,100 2,429,180
Basic and diluted earnings per stock unit ($) 8.01 12.30
17. Cash in Hand and Balances at Central Banks
The Group
2020 2019
$'000 $'000
Cash in hand 19,399,647 14,827,733
Balances with central banks other than statutory reserves 19,087,814 10,390,693
Included in cash and cash equivalents 38,487,461 25,218,426
Statutory reserves with central banks – non-interest-bearing 35,552,128 37,316,963
74,039,589 62,535,389
Statutory reserves with central banks represent the required ratio of prescribed functional and foreign currency liabilities. They are not available for investment, lending or other use by the Group.
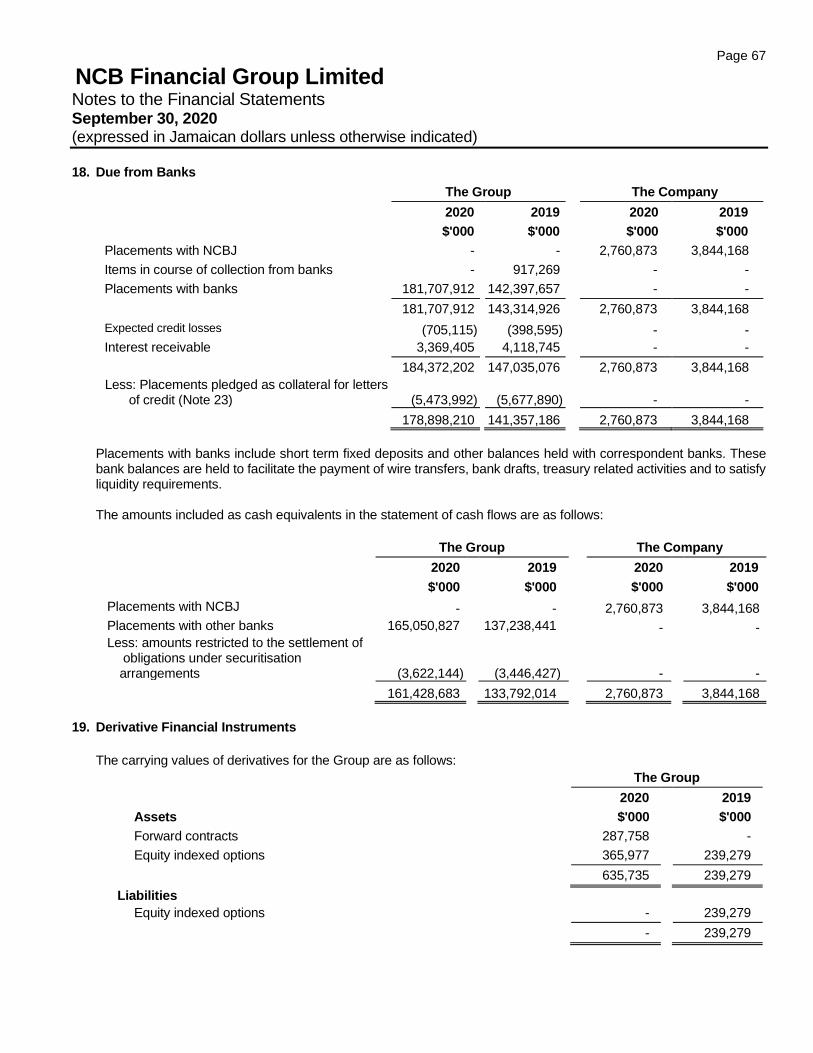
Page 67
NCB Financial Group Limited Notes to the Financial Statements September 30, 2020 (expressed in Jamaican dollars unless otherwise indicated)
18. Due from Banks
The Group The Company
2020 2019 2020 2019
$'000 $'000 $'000 $'000
Placements with NCBJ - - 2,760,873 3,844,168
Items in course of collection from banks - 917,269 - -
Placements with banks 181,707,912 142,397,657 - -
181,707,912 143,314,926 2,760,873 3,844,168
Expected credit losses (705,115) (398,595) - -
Interest receivable 3,369,405 4,118,745 - -
184,372,202 147,035,076 2,760,873 3,844,168
Less: Placements pledged as collateral for letters of credit (Note 23) (5,473,992)
(5,677,890)
- -
178,898,210 141,357,186 2,760,873 3,844,168
Placements with banks include short term fixed deposits and other balances held with correspondent banks. These bank balances are held to facilitate the payment of wire transfers, bank drafts, treasury related activities and to satisfy liquidity requirements. The amounts included as cash equivalents in the statement of cash flows are as follows:
The Group The Company
2020 2019 2020 2019
$'000 $'000 $'000 $'000
Placements with NCBJ - - 2,760,873 3,844,168
Placements with other banks 165,050,827 137,238,441 - - Less: amounts restricted to the settlement of
obligations under securitisation arrangements (3,622,144)
(3,446,427)
-
-
161,428,683 133,792,014 2,760,873 3,844,168
19. Derivative Financial Instruments
The carrying values of derivatives for the Group are as follows:
The Group
2020 2019
Assets $'000 $'000
Forward contracts 287,758 -
Equity indexed options 365,977 239,279
635,735 239,279
Liabilities
Equity indexed options - 239,279
- 239,279
Page 68
NCB Financial Group Limited Notes to the Financial Statements September 30, 2020 (expressed in Jamaican dollars unless otherwise indicated)
19. Derivative Financial Instruments (Continued)
Derivatives are carried at fair value and carried in the statement of financial position as separate assets and liabilities. Asset values represent the cost to the Group of replacing all transactions with a fair value in the Group’s favour assuming that all relevant counterparties default at the same time, and that transactions can be replaced instantaneously. Liability values represent the cost to the Group counterparties of replacing all their transactions with the Group with a fair value in their favour if the Group was to default. Derivative assets and liabilities on different transactions are only set off if the transactions are with the same counterparty, a legal right of set-off exists and the cash flows are intended to be settled on a net basis. Equity indexed options The derivative liability represents the equity index option element of principal protected notes issued by the Group (Note 3(d)) and is carried at fair value.
The embedded derivative asset represents equity index options purchased by the Group to match the liability. The terms of the purchased options are identical to those included in the principal protected notes issued by the Group. The Group is exposed to credit risk on purchased options to the extent of the carrying amount, which is their fair value.
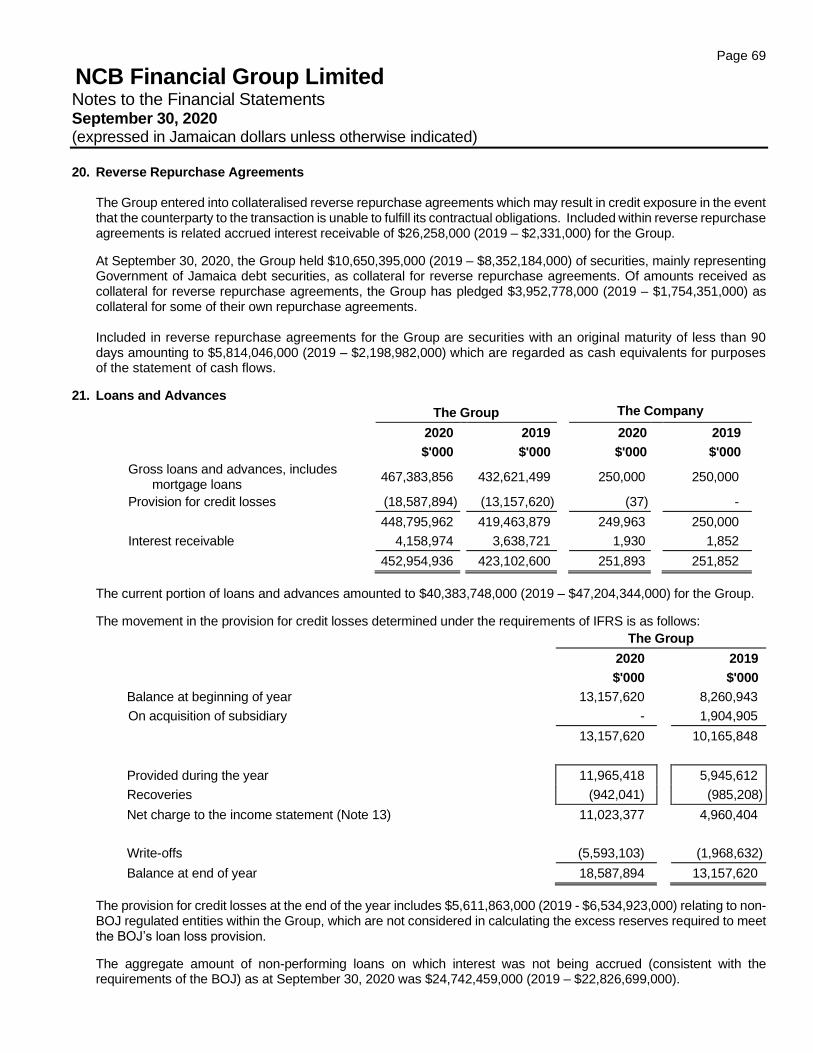
Page 69
NCB Financial Group Limited Notes to the Financial Statements September 30, 2020 (expressed in Jamaican dollars unless otherwise indicated)
20. Reverse Repurchase Agreements
The Group entered into collateralised reverse repurchase agreements which may result in credit exposure in the event that the counterparty to the transaction is unable to fulfill its contractual obligations. Included within reverse repurchase agreements is related accrued interest receivable of $26,258,000 (2019 – $2,331,000) for the Group.
At September 30, 2020, the Group held $10,650,395,000 (2019 – $8,352,184,000) of securities, mainly representing Government of Jamaica debt securities, as collateral for reverse repurchase agreements. Of amounts received as collateral for reverse repurchase agreements, the Group has pledged $3,952,778,000 (2019 – $1,754,351,000) as collateral for some of their own repurchase agreements. Included in reverse repurchase agreements for the Group are securities with an original maturity of less than 90 days amounting to $5,814,046,000 (2019 – $2,198,982,000) which are regarded as cash equivalents for purposes of the statement of cash flows.
21. Loans and Advances
The Group The Company
2020 2019 2020 2019
$'000 $'000 $'000 $'000
Gross loans and advances, includes mortgage loans
467,383,856 432,621,499
250,000
250,000
Provision for credit losses (18,587,894) (13,157,620) (37) -
448,795,962 419,463,879 249,963 250,000
Interest receivable 4,158,974 3,638,721 1,930 1,852
452,954,936 423,102,600 251,893 251,852
The current portion of loans and advances amounted to $40,383,748,000 (2019 – $47,204,344,000) for the Group.
The movement in the provision for credit losses determined under the requirements of IFRS is as follows:
The Group
2020 2019
$'000 $'000
Balance at beginning of year 13,157,620 8,260,943
On acquisition of subsidiary - 1,904,905
13,157,620 10,165,848
Provided during the year 11,965,418 5,945,612
Recoveries (942,041) (985,208)
Net charge to the income statement (Note 13) 11,023,377 4,960,404
Write-offs (5,593,103) (1,968,632)
Balance at end of year 18,587,894 13,157,620
The provision for credit losses at the end of the year includes $5,611,863,000 (2019 - $6,534,923,000) relating to non-BOJ regulated entities within the Group, which are not considered in calculating the excess reserves required to meet the BOJ’s loan loss provision.
The aggregate amount of non-performing loans on which interest was not being accrued (consistent with the requirements of the BOJ) as at September 30, 2020 was $24,742,459,000 (2019 – $22,826,699,000).
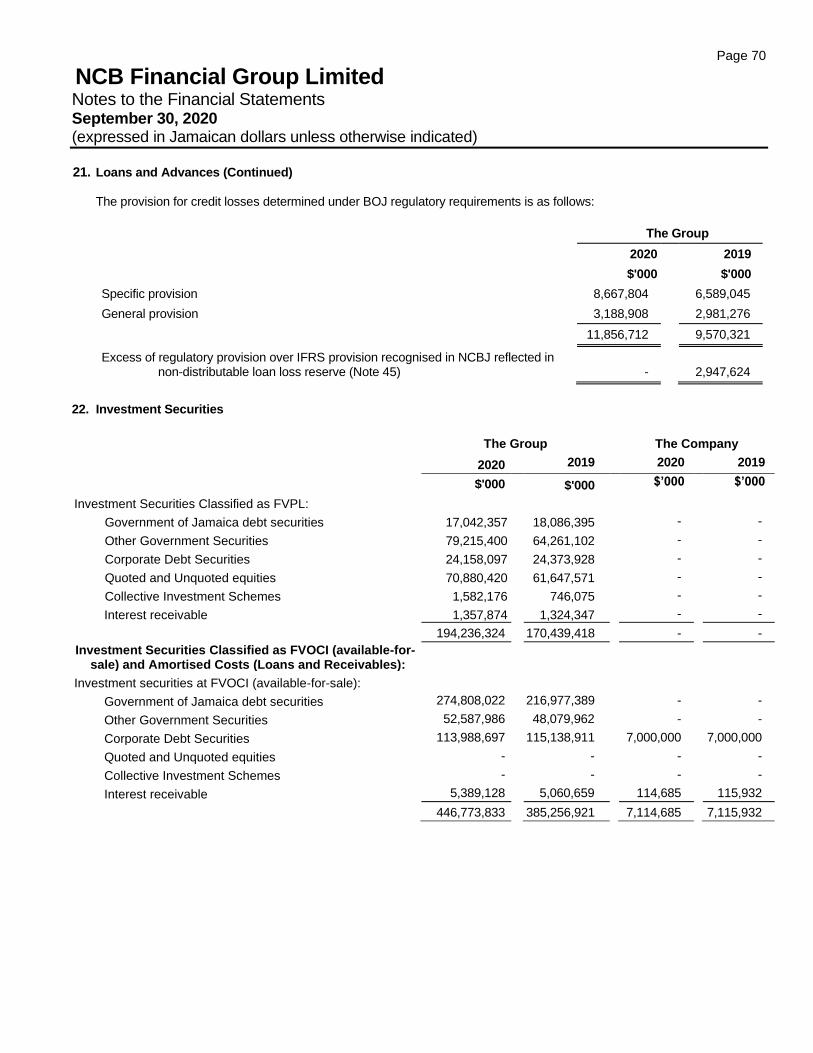
Page 70
NCB Financial Group Limited Notes to the Financial Statements September 30, 2020 (expressed in Jamaican dollars unless otherwise indicated)
21. Loans and Advances (Continued)
The provision for credit losses determined under BOJ regulatory requirements is as follows:
The Group
2020 2019
$'000 $'000
Specific provision 8,667,804 6,589,045
General provision 3,188,908 2,981,276
11,856,712 9,570,321
Excess of regulatory provision over IFRS provision recognised in NCBJ reflected in non-distributable loan loss reserve (Note 45)
- 2,947,624
22. Investment Securities
The Group The Company
2020 2019 2020 2019
$'000 $'000 $’000 $’000
Investment Securities Classified as FVPL:
Government of Jamaica debt securities 17,042,357 18,086,395 - -
Other Government Securities 79,215,400 64,261,102 - -
Corporate Debt Securities 24,158,097 24,373,928 - -
Quoted and Unquoted equities 70,880,420 61,647,571 - -
Collective Investment Schemes 1,582,176 746,075 - -
Interest receivable 1,357,874 1,324,347 - -
194,236,324 170,439,418 - -
Investment Securities Classified as FVOCI (available-for-sale) and Amortised Costs (Loans and Receivables):
Investment securities at FVOCI (available-for-sale):
Government of Jamaica debt securities 274,808,022 216,977,389 - -
Other Government Securities 52,587,986 48,079,962 - -
Corporate Debt Securities 113,988,697 115,138,911 7,000,000 7,000,000
Quoted and Unquoted equities - - - -
Collective Investment Schemes - - - -
Interest receivable 5,389,128 5,060,659 114,685 115,932
446,773,833 385,256,921 7,114,685 7,115,932
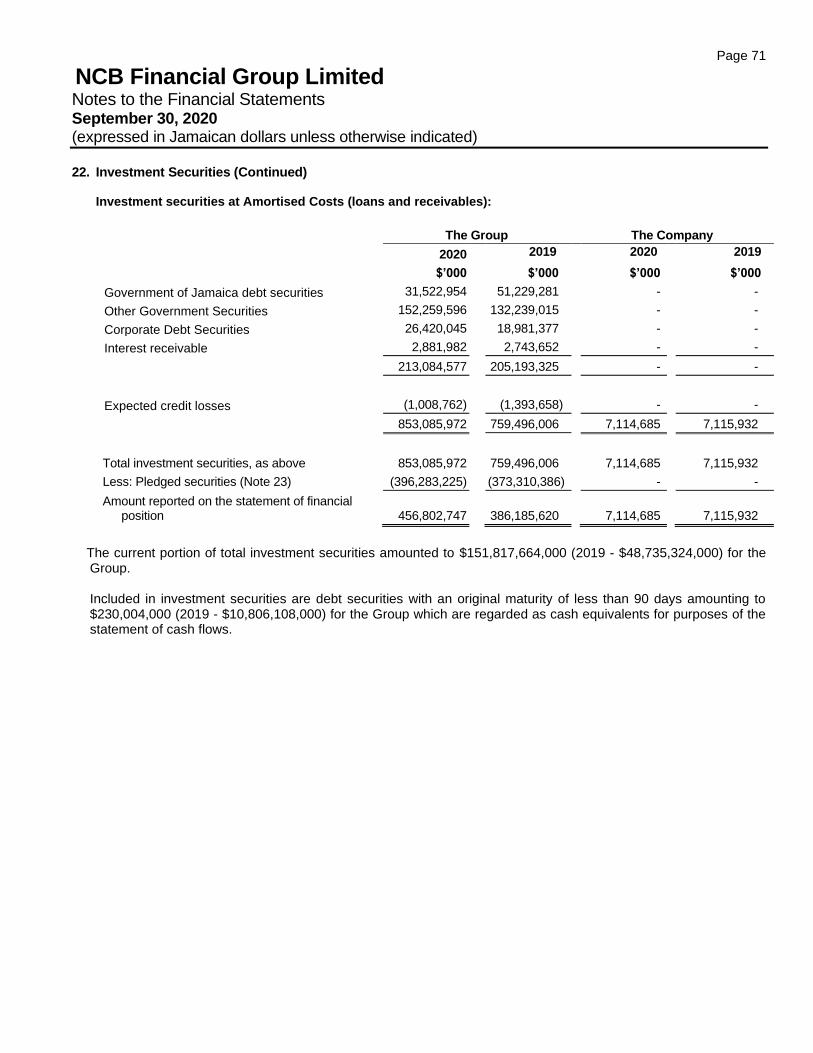
Page 71
NCB Financial Group Limited Notes to the Financial Statements September 30, 2020 (expressed in Jamaican dollars unless otherwise indicated)
22. Investment Securities (Continued)
Investment securities at Amortised Costs (loans and receivables):
The Group The Company
2020 2019 2020 2019
$’000 $’000 $’000 $’000
Government of Jamaica debt securities 31,522,954 51,229,281 - -
Other Government Securities 152,259,596 132,239,015 - -
Corporate Debt Securities 26,420,045 18,981,377 - -
Interest receivable 2,881,982 2,743,652 - -
213,084,577 205,193,325 - -
Expected credit losses (1,008,762) (1,393,658) - -
853,085,972 759,496,006 7,114,685 7,115,932
Total investment securities, as above 853,085,972 759,496,006 7,114,685 7,115,932
Less: Pledged securities (Note 23) (396,283,225) (373,310,386) - -
Amount reported on the statement of financial position 456,802,747 386,185,620
7,114,685 7,115,932
The current portion of total investment securities amounted to $151,817,664,000 (2019 - $48,735,324,000) for the Group.
Included in investment securities are debt securities with an original maturity of less than 90 days amounting to $230,004,000 (2019 - $10,806,108,000) for the Group which are regarded as cash equivalents for purposes of the statement of cash flows.
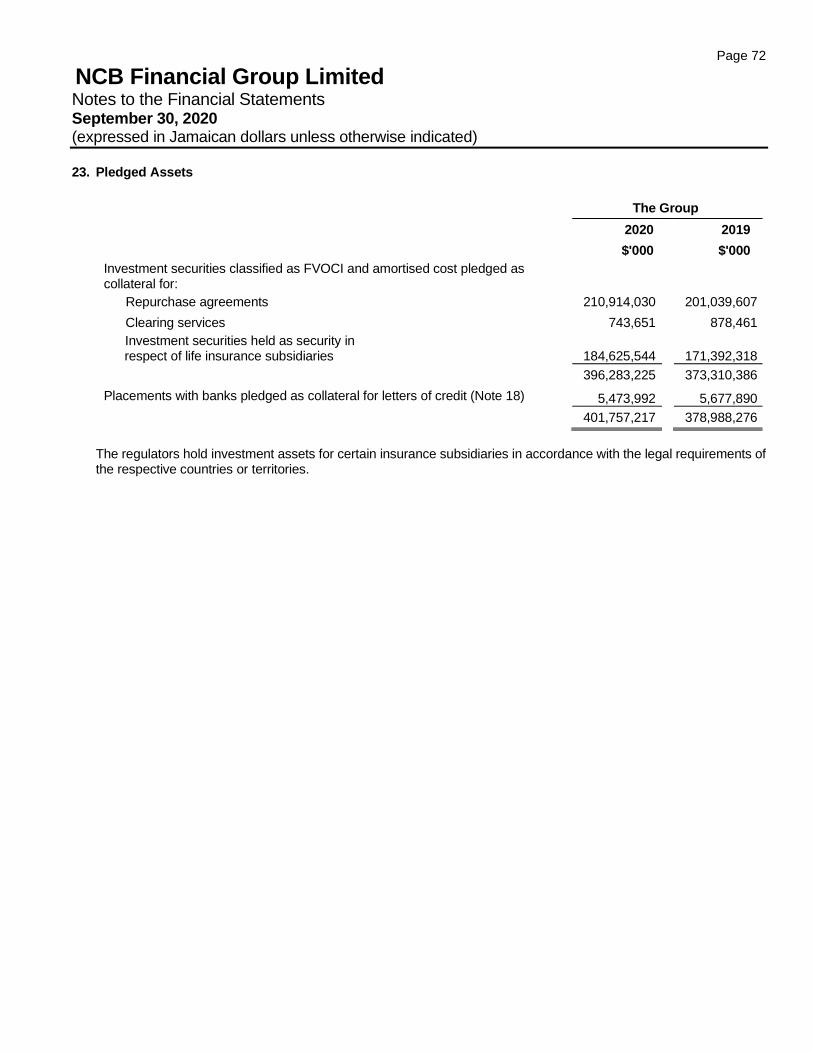
Page 72
NCB Financial Group Limited Notes to the Financial Statements September 30, 2020 (expressed in Jamaican dollars unless otherwise indicated)
23. Pledged Assets
The Group
2020 2019
$'000 $'000
Investment securities classified as FVOCI and amortised cost pledged as collateral for:
Repurchase agreements 210,914,030 201,039,607
Clearing services 743,651 878,461
Investment securities held as security in respect of life insurance subsidiaries 184,625,544
171,392,318
396,283,225 373,310,386
Placements with banks pledged as collateral for letters of credit (Note 18) 5,473,992 5,677,890
401,757,217 378,988,276
The regulators hold investment assets for certain insurance subsidiaries in accordance with the legal requirements of the respective countries or territories.
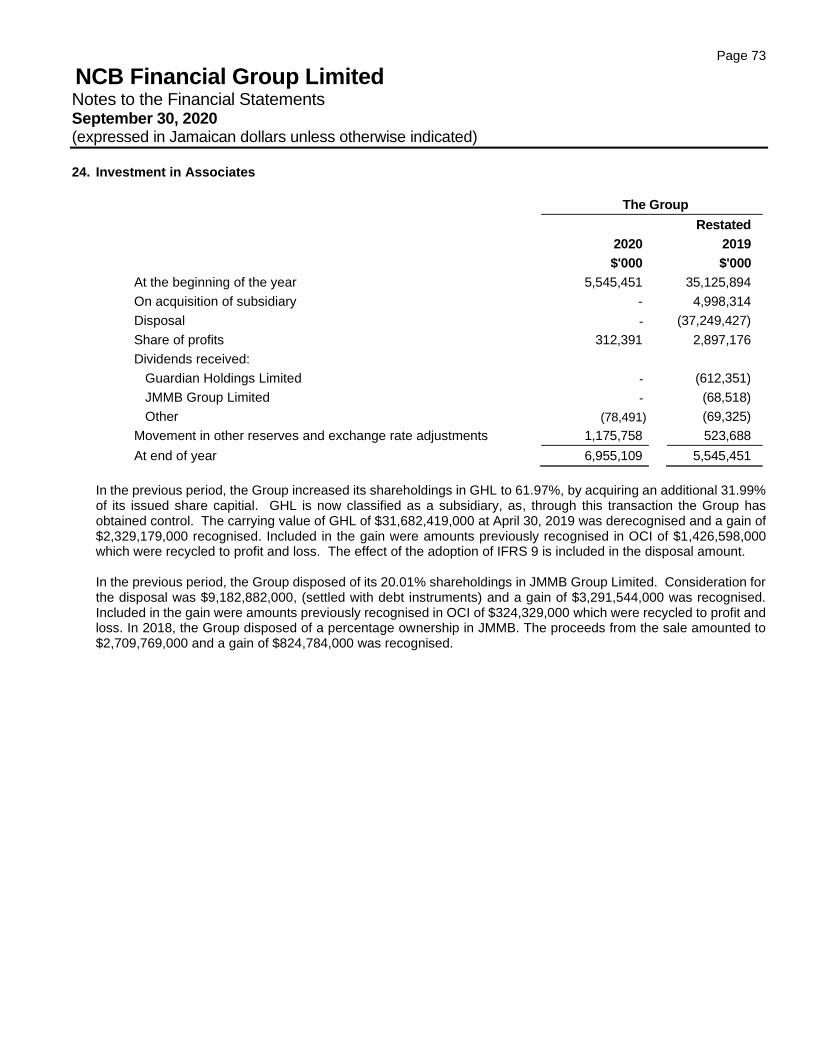
Page 73
NCB Financial Group Limited Notes to the Financial Statements September 30, 2020 (expressed in Jamaican dollars unless otherwise indicated)
24. Investment in Associates
The Group
Restated
2020 2019
$'000 $'000
At the beginning of the year 5,545,451 35,125,894
On acquisition of subsidiary - 4,998,314
Disposal - (37,249,427)
Share of profits 312,391 2,897,176
Dividends received:
Guardian Holdings Limited - (612,351)
JMMB Group Limited - (68,518)
Other (78,491) (69,325)
Movement in other reserves and exchange rate adjustments 1,175,758 523,688
At end of year 6,955,109 5,545,451
In the previous period, the Group increased its shareholdings in GHL to 61.97%, by acquiring an additional 31.99% of its issued share capitial. GHL is now classified as a subsidiary, as, through this transaction the Group has obtained control. The carrying value of GHL of $31,682,419,000 at April 30, 2019 was derecognised and a gain of $2,329,179,000 recognised. Included in the gain were amounts previously recognised in OCI of $1,426,598,000 which were recycled to profit and loss. The effect of the adoption of IFRS 9 is included in the disposal amount. In the previous period, the Group disposed of its 20.01% shareholdings in JMMB Group Limited. Consideration for the disposal was $9,182,882,000, (settled with debt instruments) and a gain of $3,291,544,000 was recognised. Included in the gain were amounts previously recognised in OCI of $324,329,000 which were recycled to profit and loss. In 2018, the Group disposed of a percentage ownership in JMMB. The proceeds from the sale amounted to $2,709,769,000 and a gain of $824,784,000 was recognised.
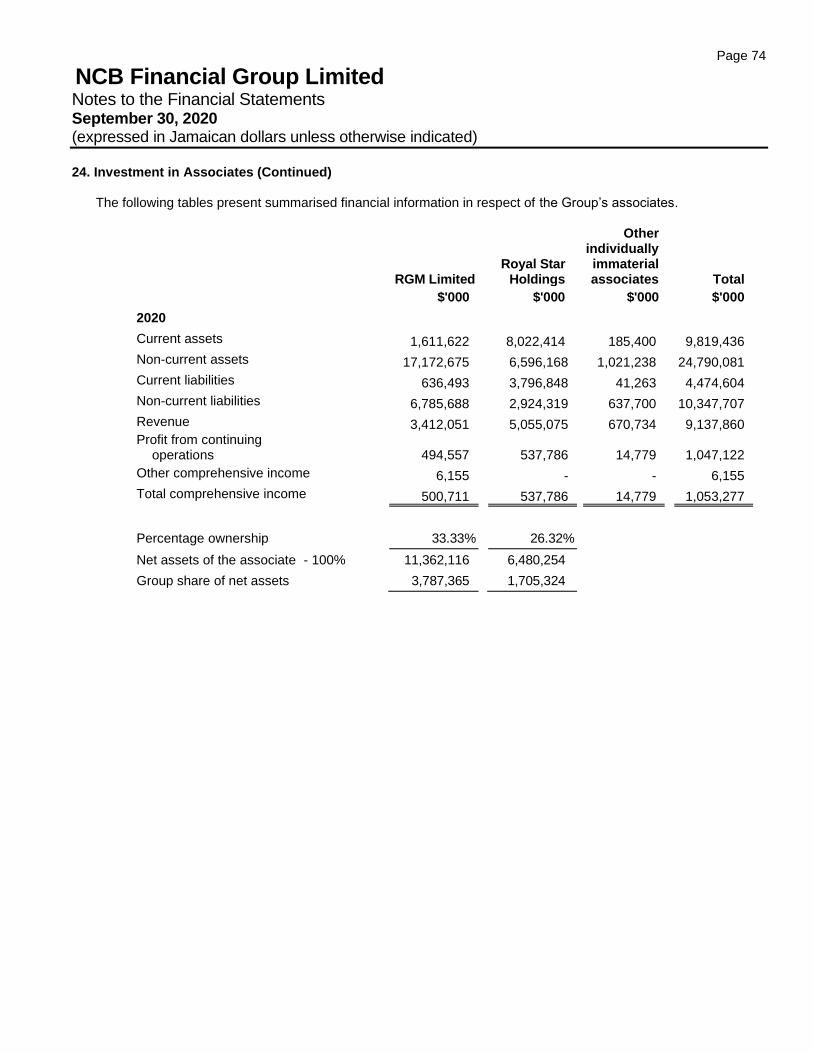
Page 74
NCB Financial Group Limited Notes to the Financial Statements September 30, 2020 (expressed in Jamaican dollars unless otherwise indicated)
24. Investment in Associates (Continued)
The following tables present summarised financial information in respect of the Group’s associates.
RGM Limited
Royal Star
Holdings
Other individually immaterial associates
Total
$'000 $'000 $'000 $'000
2020
Current assets 1,611,622 8,022,414 185,400 9,819,436
Non-current assets 17,172,675 6,596,168 1,021,238 24,790,081
Current liabilities 636,493 3,796,848 41,263 4,474,604
Non-current liabilities 6,785,688 2,924,319 637,700 10,347,707
Revenue 3,412,051 5,055,075 670,734 9,137,860 Profit from continuing
operations
494,557
537,786
14,779
1,047,122
Other comprehensive income 6,155 - - 6,155
Total comprehensive income 500,711 537,786 14,779 1,053,277
Percentage ownership 33.33% 26.32%
Net assets of the associate - 100% 11,362,116 6,480,254
Group share of net assets 3,787,365 1,705,324
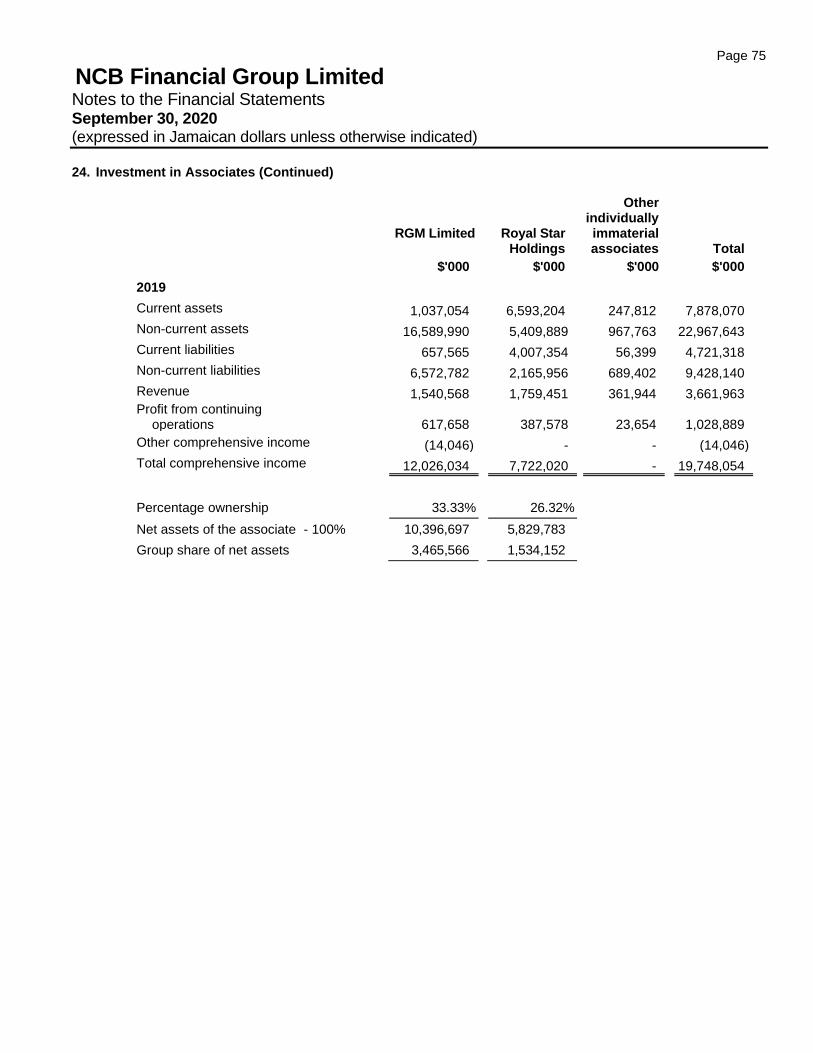
Page 75
NCB Financial Group Limited Notes to the Financial Statements September 30, 2020 (expressed in Jamaican dollars unless otherwise indicated)
24. Investment in Associates (Continued)
RGM Limited
Royal Star Holdings
Other individually immaterial associates
Total
$'000 $'000 $'000 $'000
2019
Current assets 1,037,054 6,593,204 247,812 7,878,070
Non-current assets 16,589,990 5,409,889 967,763 22,967,643
Current liabilities 657,565 4,007,354 56,399 4,721,318
Non-current liabilities 6,572,782 2,165,956 689,402 9,428,140
Revenue 1,540,568 1,759,451 361,944 3,661,963 Profit from continuing
operations
617,658
387,578
23,654
1,028,889
Other comprehensive income (14,046) - - (14,046)
Total comprehensive income 12,026,034 7,722,020 - 19,748,054
Percentage ownership 33.33% 26.32%
Net assets of the associate - 100% 10,396,697 5,829,783
Group share of net assets 3,465,566 1,534,152
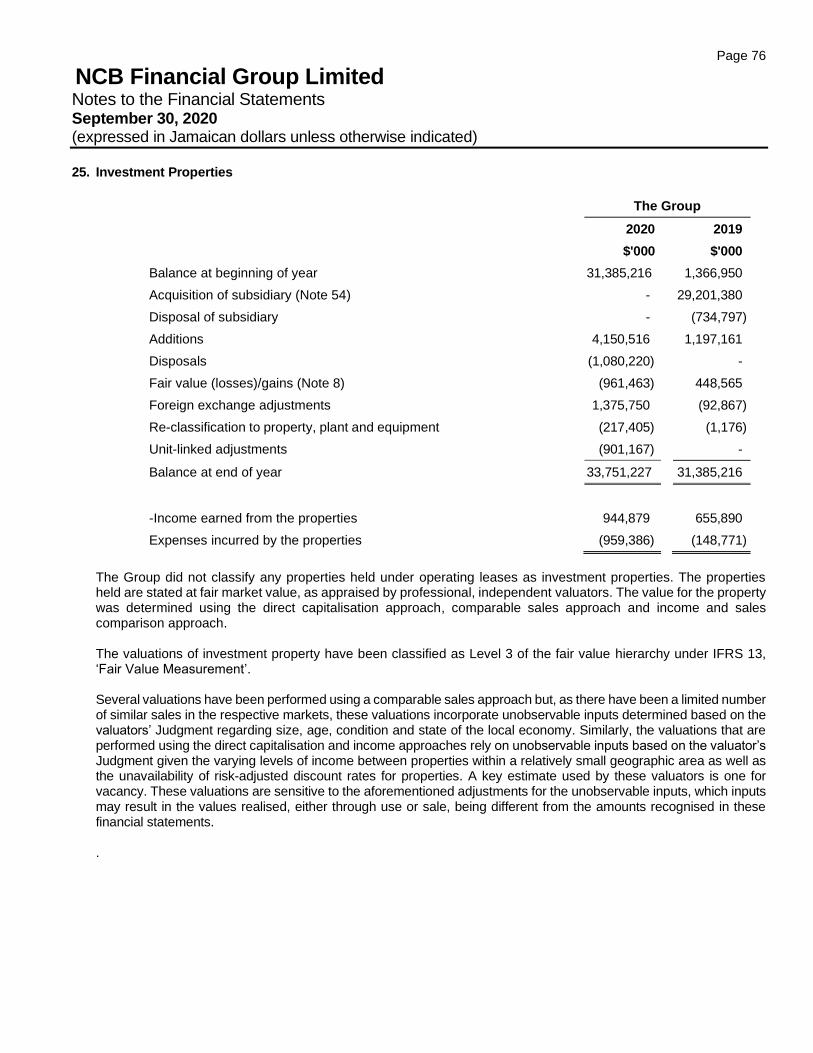
Page 76
NCB Financial Group Limited Notes to the Financial Statements September 30, 2020 (expressed in Jamaican dollars unless otherwise indicated)
25. Investment Properties
The Group
2020 2019
$'000 $'000
Balance at beginning of year 31,385,216 1,366,950
Acquisition of subsidiary (Note 54) - 29,201,380
Disposal of subsidiary - (734,797)
Additions 4,150,516 1,197,161
Disposals (1,080,220) -
Fair value (losses)/gains (Note 8) (961,463) 448,565
Foreign exchange adjustments 1,375,750 (92,867)
Re-classification to property, plant and equipment (217,405) (1,176)
Unit-linked adjustments (901,167) -
Balance at end of year 33,751,227 31,385,216
-Income earned from the properties 944,879 655,890
Expenses incurred by the properties (959,386) (148,771)
The Group did not classify any properties held under operating leases as investment properties. The properties held are stated at fair market value, as appraised by professional, independent valuators. The value for the property was determined using the direct capitalisation approach, comparable sales approach and income and sales comparison approach. The valuations of investment property have been classified as Level 3 of the fair value hierarchy under IFRS 13, ‘Fair Value Measurement’. Several valuations have been performed using a comparable sales approach but, as there have been a limited number of similar sales in the respective markets, these valuations incorporate unobservable inputs determined based on the valuators’ Judgment regarding size, age, condition and state of the local economy. Similarly, the valuations that are performed using the direct capitalisation and income approaches rely on unobservable inputs based on the valuator’s Judgment given the varying levels of income between properties within a relatively small geographic area as well as the unavailability of risk-adjusted discount rates for properties. A key estimate used by these valuators is one for vacancy. These valuations are sensitive to the aforementioned adjustments for the unobservable inputs, which inputs may result in the values realised, either through use or sale, being different from the amounts recognised in these financial statements. .
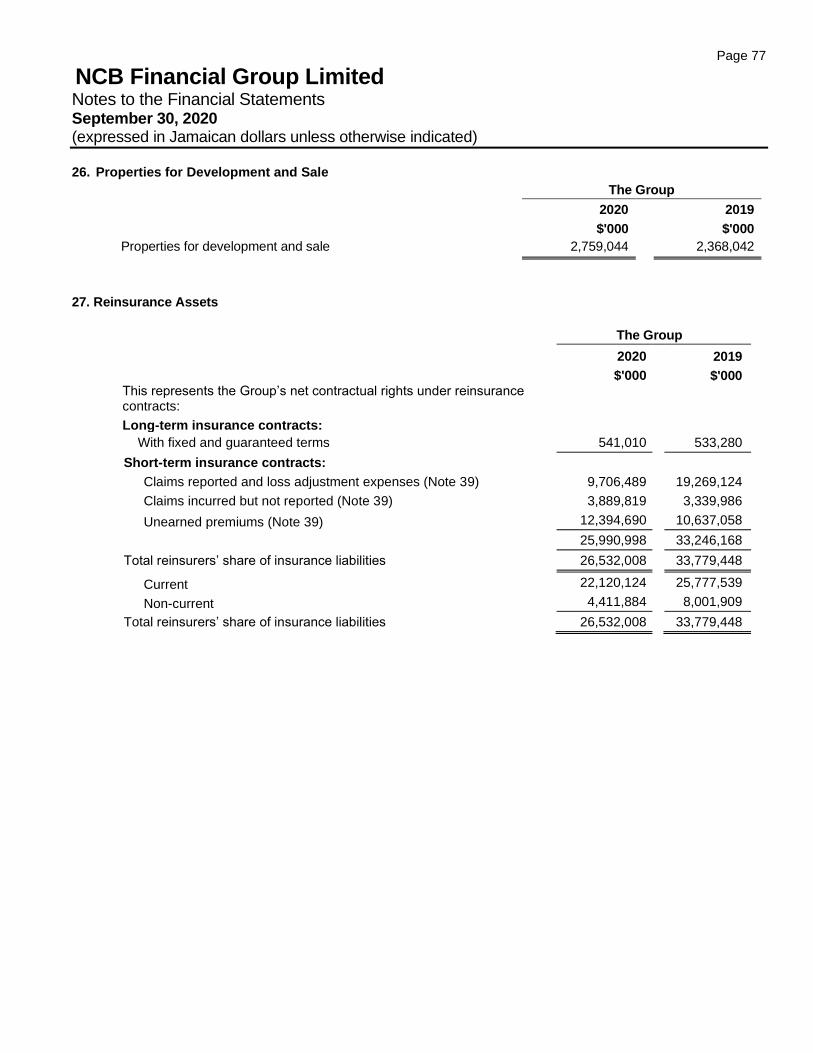
Page 77
NCB Financial Group Limited Notes to the Financial Statements September 30, 2020 (expressed in Jamaican dollars unless otherwise indicated)
26. Properties for Development and Sale
The Group
2020 2019
$'000 $'000
Properties for development and sale 2,759,044 2,368,042
27. Reinsurance Assets
The Group
2020 2019
$'000 $'000 This represents the Group’s net contractual rights under reinsurance contracts:
Long-term insurance contracts:
With fixed and guaranteed terms 541,010 533,280
Short-term insurance contracts:
Claims reported and loss adjustment expenses (Note 39) 9,706,489 19,269,124
Claims incurred but not reported (Note 39) 3,889,819 3,339,986
Unearned premiums (Note 39) 12,394,690 10,637,058
25,990,998 33,246,168
Total reinsurers’ share of insurance liabilities 26,532,008 33,779,448
Current 22,120,124 25,777,539
Non-current 4,411,884 8,001,909
Total reinsurers’ share of insurance liabilities 26,532,008 33,779,448
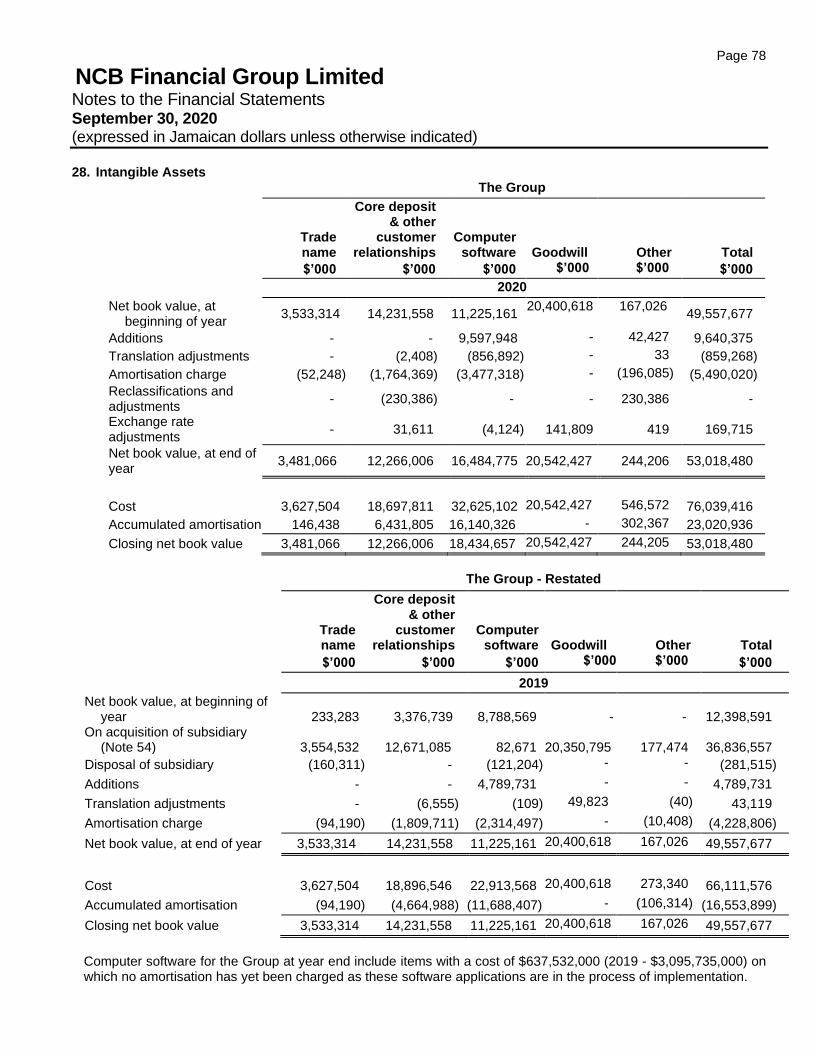
Page 78
NCB Financial Group Limited Notes to the Financial Statements September 30, 2020 (expressed in Jamaican dollars unless otherwise indicated)
28. Intangible Assets
The Group
Trade name
Core deposit & other
customer relationships
Computer software
Goodwill
Other Total
$’000 $’000 $’000 $’000 $’000 $’000
2020
Net book value, at beginning of year
3,533,314 14,231,558 11,225,161 20,400,618 167,026
49,557,677
Additions - - 9,597,948 - 42,427 9,640,375
Translation adjustments - (2,408) (856,892) - 33 (859,268)
Amortisation charge (52,248) (1,764,369) (3,477,318) - (196,085) (5,490,020)
Reclassifications and adjustments
- (230,386) - - 230,386 -
Exchange rate adjustments
- 31,611 (4,124) 141,809 419 169,715
Net book value, at end of year
3,481,066 12,266,006 16,484,775 20,542,427 244,206 53,018,480
Cost 3,627,504 18,697,811 32,625,102 20,542,427 546,572 76,039,416
Accumulated amortisation 146,438 6,431,805 16,140,326 - 302,367 23,020,936
Closing net book value 3,481,066 12,266,006 18,434,657 20,542,427 244,205 53,018,480
The Group - Restated
Trade name
Core deposit & other
customer relationships
Computer software
Goodwill
Other Total
$’000 $’000 $’000 $’000 $’000 $’000
2019
Net book value, at beginning of year 233,283 3,376,739 8,788,569 - - 12,398,591
On acquisition of subsidiary (Note 54)
3,554,532
12,671,085
82,671
20,350,795
177,474
36,836,557
Disposal of subsidiary (160,311) - (121,204) - - (281,515)
Additions - - 4,789,731 - - 4,789,731
Translation adjustments - (6,555) (109) 49,823 (40) 43,119
Amortisation charge (94,190) (1,809,711) (2,314,497) - (10,408) (4,228,806)
Net book value, at end of year 3,533,314 14,231,558 11,225,161 20,400,618 167,026 49,557,677
Cost 3,627,504 18,896,546 22,913,568 20,400,618 273,340 66,111,576
Accumulated amortisation (94,190) (4,664,988) (11,688,407) - (106,314) (16,553,899)
Closing net book value 3,533,314 14,231,558 11,225,161 20,400,618 167,026 49,557,677
Computer software for the Group at year end include items with a cost of $637,532,000 (2019 - $3,095,735,000) on which no amortisation has yet been charged as these software applications are in the process of implementation.
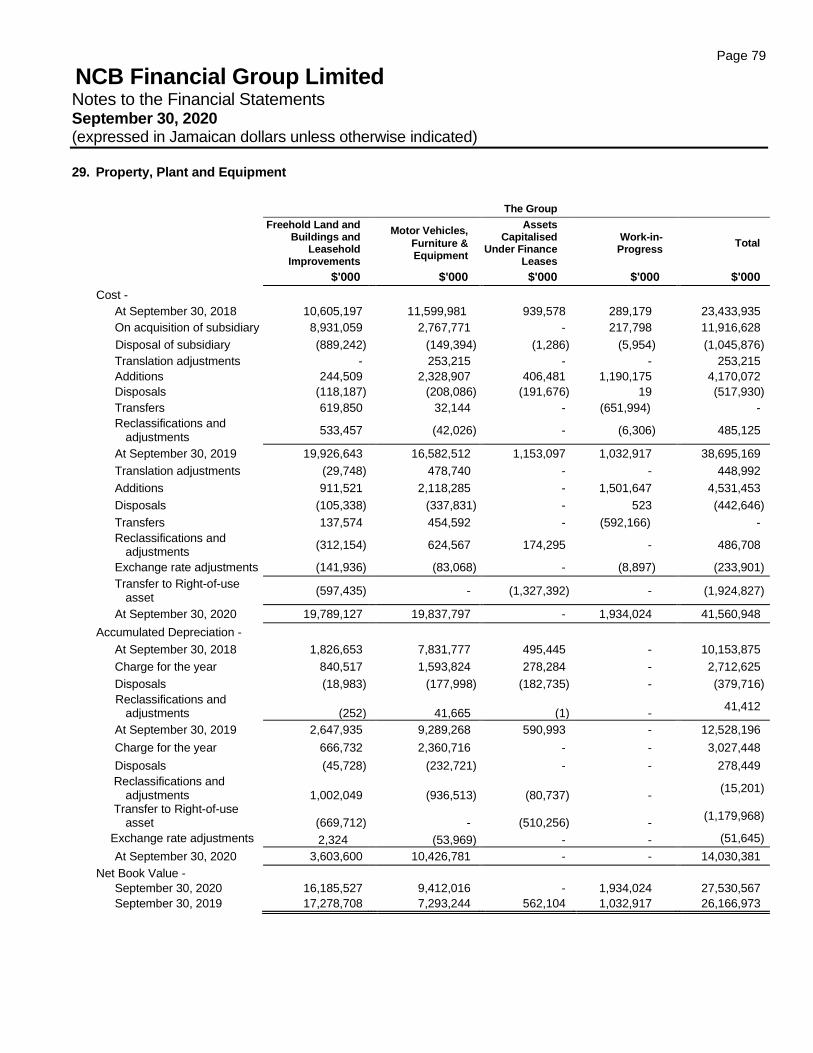
Page 79
NCB Financial Group Limited Notes to the Financial Statements September 30, 2020 (expressed in Jamaican dollars unless otherwise indicated)
29. Property, Plant and Equipment
The Group
Freehold Land and Buildings and
Leasehold Improvements
Motor Vehicles,
Furniture & Equipment
Assets Capitalised
Under Finance Leases
Work-in- Progress
Total
$'000 $'000 $'000 $'000 $'000
Cost -
At September 30, 2018 10,605,197 11,599,981 939,578 289,179 23,433,935
On acquisition of subsidiary 8,931,059 2,767,771 - 217,798 11,916,628
Disposal of subsidiary (889,242) (149,394) (1,286) (5,954) (1,045,876)
Translation adjustments - 253,215 - - 253,215
Additions 244,509 2,328,907 406,481 1,190,175 4,170,072
Disposals (118,187) (208,086) (191,676) 19 (517,930)
Transfers 619,850 32,144 - (651,994) -
Reclassifications and adjustments
533,457 (42,026) - (6,306) 485,125
At September 30, 2019 19,926,643 16,582,512 1,153,097 1,032,917 38,695,169
Translation adjustments (29,748) 478,740 - - 448,992
Additions 911,521 2,118,285 - 1,501,647 4,531,453
Disposals (105,338) (337,831) - 523 (442,646)
Transfers 137,574 454,592 - (592,166) -
Reclassifications and adjustments
(312,154) 624,567 174,295 - 486,708
Exchange rate adjustments (141,936) (83,068) - (8,897) (233,901)
Transfer to Right-of-use asset
(597,435) - (1,327,392) - (1,924,827)
At September 30, 2020 19,789,127 19,837,797 - 1,934,024 41,560,948
Accumulated Depreciation -
At September 30, 2018 1,826,653 7,831,777 495,445 - 10,153,875
Charge for the year 840,517 1,593,824 278,284 - 2,712,625
Disposals (18,983) (177,998) (182,735) - (379,716)
Reclassifications and adjustments (252) 41,665 (1) -
41,412
At September 30, 2019 2,647,935 9,289,268 590,993 - 12,528,196
Charge for the year 666,732 2,360,716 - - 3,027,448
Disposals (45,728) (232,721) - - 278,449
Reclassifications and adjustments 1,002,049 (936,513) (80,737) -
(15,201)
Transfer to Right-of-use asset (669,712) - (510,256) -
(1,179,968)
Exchange rate adjustments 2,324 (53,969) - - (51,645)
At September 30, 2020 3,603,600 10,426,781 - - 14,030,381
Net Book Value -
September 30, 2020 16,185,527 9,412,016 - 1,934,024 27,530,567
September 30, 2019 17,278,708 7,293,244 562,104 1,032,917 26,166,973
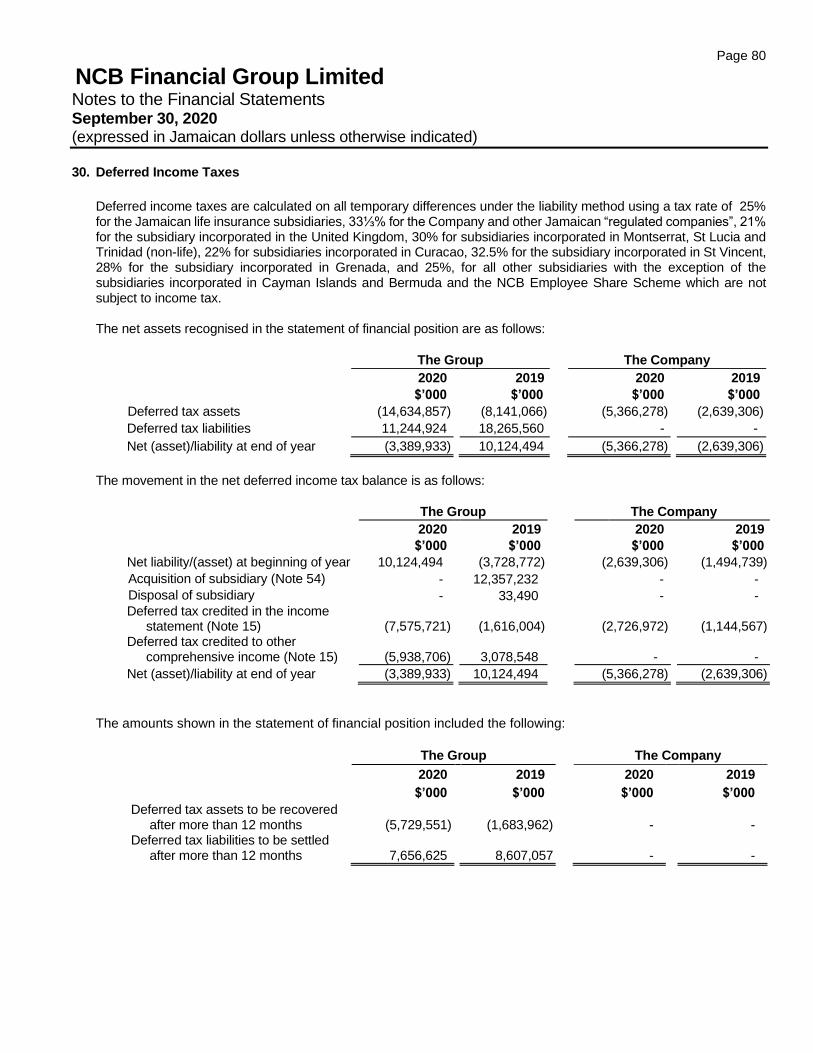
Page 80
NCB Financial Group Limited Notes to the Financial Statements September 30, 2020 (expressed in Jamaican dollars unless otherwise indicated)
30. Deferred Income Taxes
Deferred income taxes are calculated on all temporary differences under the liability method using a tax rate of 25% for the Jamaican life insurance subsidiaries, 33⅓% for the Company and other Jamaican “regulated companies”, 21% for the subsidiary incorporated in the United Kingdom, 30% for subsidiaries incorporated in Montserrat, St Lucia and Trinidad (non-life), 22% for subsidiaries incorporated in Curacao, 32.5% for the subsidiary incorporated in St Vincent, 28% for the subsidiary incorporated in Grenada, and 25%, for all other subsidiaries with the exception of the subsidiaries incorporated in Cayman Islands and Bermuda and the NCB Employee Share Scheme which are not subject to income tax. The net assets recognised in the statement of financial position are as follows:
The Group The Company
2020 2019 2020 2019
$’000 $’000 $’000 $’000
Deferred tax assets (14,634,857) (8,141,066) (5,366,278) (2,639,306)
Deferred tax liabilities 11,244,924 18,265,560 - -
Net (asset)/liability at end of year (3,389,933) 10,124,494 (5,366,278) (2,639,306)
The movement in the net deferred income tax balance is as follows:
The Group The Company
2020 2019 2020 2019
$’000 $’000 $’000 $’000
Net liability/(asset) at beginning of year 10,124,494 (3,728,772) (2,639,306) (1,494,739)
Acquisition of subsidiary (Note 54) - 12,357,232 - -
Disposal of subsidiary - 33,490 - - Deferred tax credited in the income
statement (Note 15) (7,575,721) (1,616,004)
(2,726,972)
(1,144,567) Deferred tax credited to other
comprehensive income (Note 15) (5,938,706) 3,078,548
-
-
Net (asset)/liability at end of year (3,389,933) 10,124,494 (5,366,278) (2,639,306)
The amounts shown in the statement of financial position included the following:
The Group The Company
2020 2019 2020 2019
$’000 $’000 $’000 $’000
Deferred tax assets to be recovered after more than 12 months (5,729,551)
(1,683,962)
-
-
Deferred tax liabilities to be settled after more than 12 months 7,656,625
8,607,057
-
-
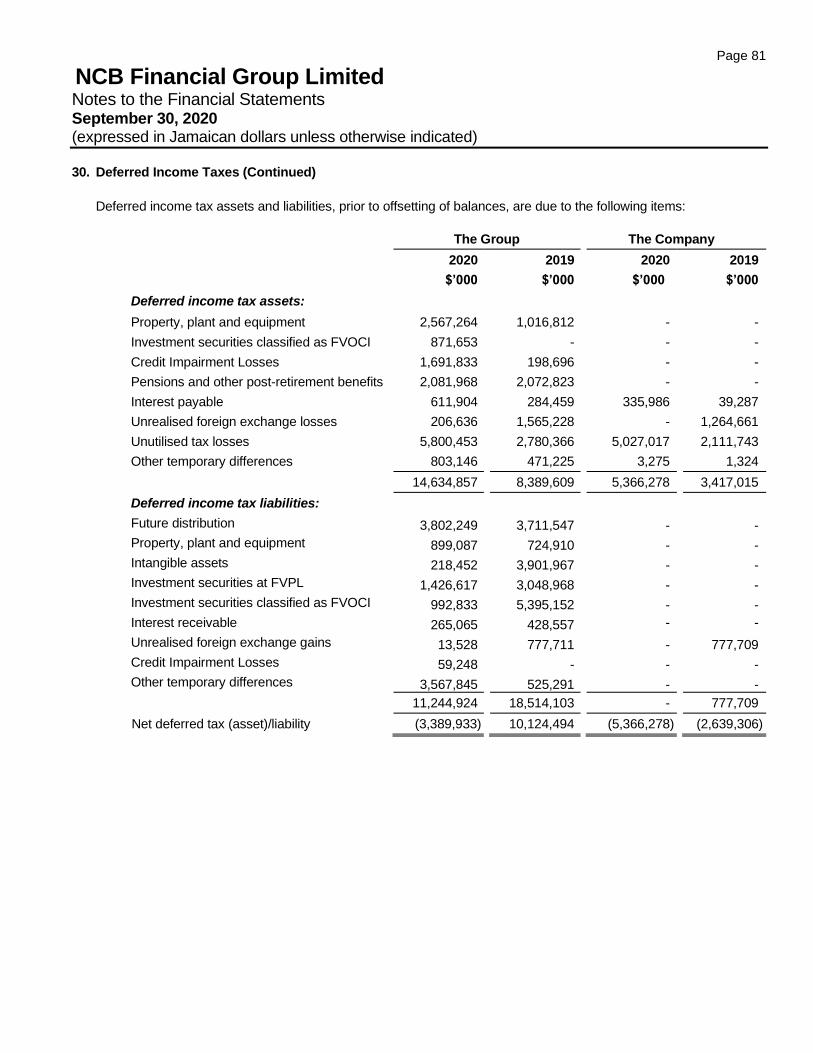
Page 81
NCB Financial Group Limited Notes to the Financial Statements September 30, 2020 (expressed in Jamaican dollars unless otherwise indicated)
30. Deferred Income Taxes (Continued)
Deferred income tax assets and liabilities, prior to offsetting of balances, are due to the following items:
The Group The Company
2020 2019 2020 2019
$’000 $’000 $’000 $’000
Deferred income tax assets:
Property, plant and equipment 2,567,264 1,016,812 - -
Investment securities classified as FVOCI 871,653 - - -
Credit Impairment Losses 1,691,833 198,696 - -
Pensions and other post-retirement benefits 2,081,968 2,072,823 - -
Interest payable 611,904 284,459 335,986 39,287
Unrealised foreign exchange losses 206,636 1,565,228 - 1,264,661
Unutilised tax losses 5,800,453 2,780,366 5,027,017 2,111,743
Other temporary differences 803,146 471,225 3,275 1,324
14,634,857 8,389,609 5,366,278 3,417,015
Deferred income tax liabilities:
Future distribution 3,802,249 3,711,547 - -
Property, plant and equipment 899,087 724,910 - -
Intangible assets 218,452 3,901,967 - -
Investment securities at FVPL 1,426,617 3,048,968 - -
Investment securities classified as FVOCI 992,833 5,395,152 - -
Interest receivable 265,065 428,557 - -
Unrealised foreign exchange gains 13,528 777,711 - 777,709
Credit Impairment Losses 59,248 - - -
Other temporary differences 3,567,845 525,291 - -
11,244,924 18,514,103 - 777,709
Net deferred tax (asset)/liability (3,389,933) 10,124,494 (5,366,278) (2,639,306)
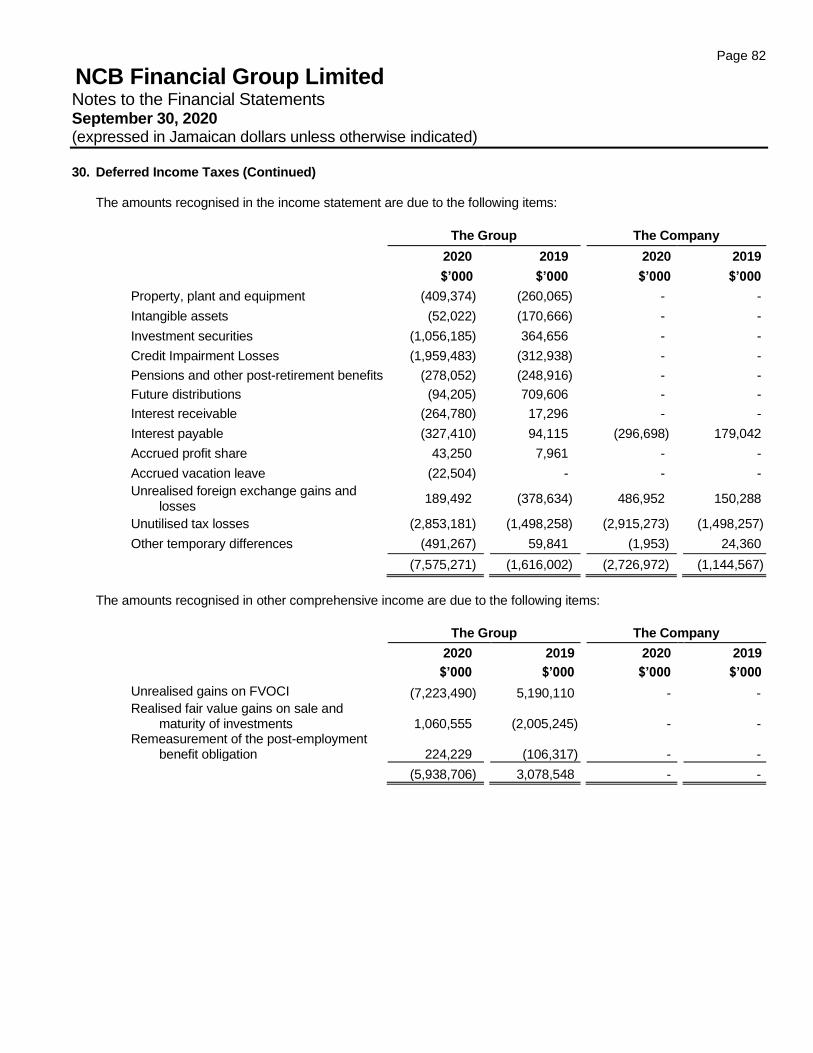
Page 82
NCB Financial Group Limited Notes to the Financial Statements September 30, 2020 (expressed in Jamaican dollars unless otherwise indicated)
30. Deferred Income Taxes (Continued)
The amounts recognised in the income statement are due to the following items:
The Group The Company
2020 2019 2020 2019
$’000 $’000 $’000 $’000
Property, plant and equipment (409,374) (260,065) - -
Intangible assets (52,022) (170,666) - -
Investment securities (1,056,185) 364,656 - -
Credit Impairment Losses (1,959,483) (312,938) - -
Pensions and other post-retirement benefits (278,052) (248,916) - -
Future distributions (94,205) 709,606 - -
Interest receivable (264,780) 17,296 - -
Interest payable (327,410) 94,115 (296,698) 179,042
Accrued profit share 43,250 7,961 - -
Accrued vacation leave (22,504) - - -
Unrealised foreign exchange gains and losses
189,492 (378,634)
486,952
150,288
Unutilised tax losses (2,853,181) (1,498,258) (2,915,273) (1,498,257)
Other temporary differences (491,267) 59,841 (1,953) 24,360
(7,575,271) (1,616,002) (2,726,972) (1,144,567)
The amounts recognised in other comprehensive income are due to the following items:
The Group The Company
2020 2019 2020 2019
$’000 $’000 $’000 $’000
Unrealised gains on FVOCI (7,223,490) 5,190,110 - - Realised fair value gains on sale and
maturity of investments 1,060,555
(2,005,245)
-
- Remeasurement of the post-employment
benefit obligation 224,229
(106,317)
-
-
(5,938,706) 3,078,548 - -
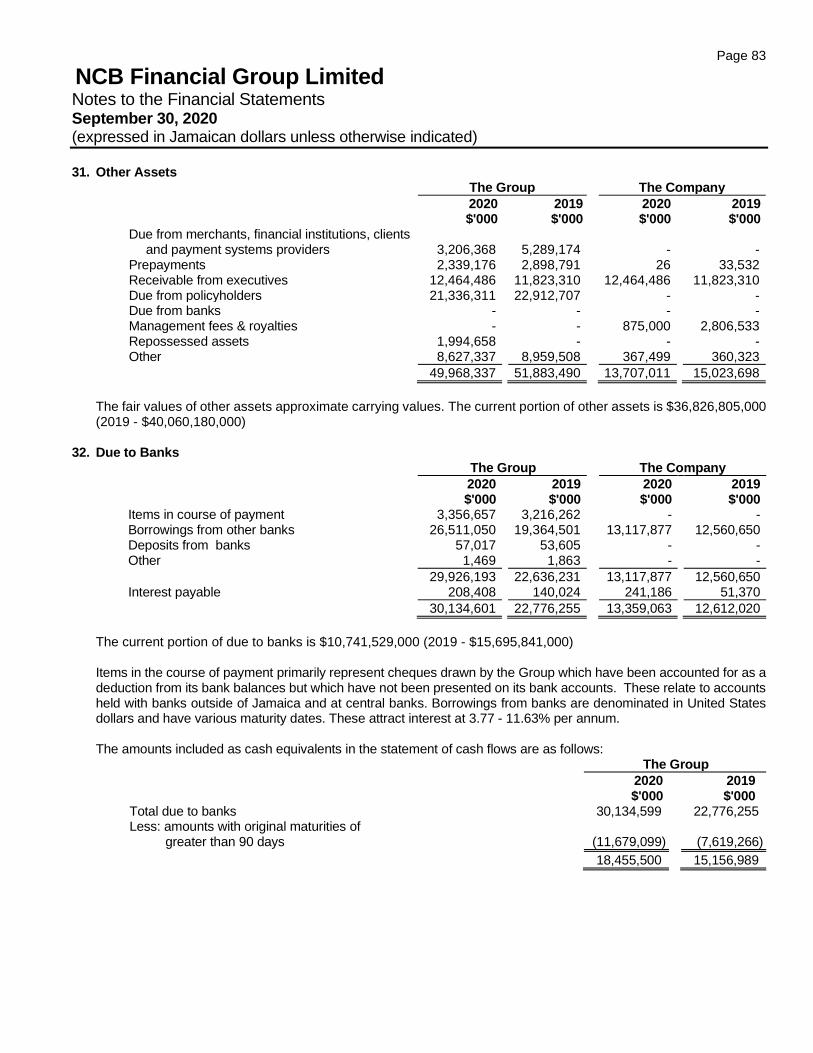
Page 83
NCB Financial Group Limited Notes to the Financial Statements September 30, 2020 (expressed in Jamaican dollars unless otherwise indicated)
31. Other Assets The Group The Company
2020 2019 2020 2019 $'000 $'000 $'000 $'000
Due from merchants, financial institutions, clients and payment systems providers 3,206,368
5,289,174
-
-
Prepayments 2,339,176 2,898,791 26 33,532 Receivable from executives 12,464,486 11,823,310 12,464,486 11,823,310 Due from policyholders 21,336,311 22,912,707 - - Due from banks - - - - Management fees & royalties - - 875,000 2,806,533 Repossessed assets 1,994,658 - - - Other 8,627,337 8,959,508 367,499 360,323
49,968,337 51,883,490 13,707,011 15,023,698
The fair values of other assets approximate carrying values. The current portion of other assets is $36,826,805,000 (2019 - $40,060,180,000)
32. Due to Banks The Group The Company
2020 2019 2020 2019 $'000 $'000 $'000 $'000
Items in course of payment 3,356,657 3,216,262 - - Borrowings from other banks 26,511,050 19,364,501 13,117,877 12,560,650 Deposits from banks 57,017 53,605 - - Other 1,469 1,863 - -
29,926,193 22,636,231 13,117,877 12,560,650 Interest payable 208,408 140,024 241,186 51,370
30,134,601 22,776,255 13,359,063 12,612,020
The current portion of due to banks is $10,741,529,000 (2019 - $15,695,841,000) Items in the course of payment primarily represent cheques drawn by the Group which have been accounted for as a deduction from its bank balances but which have not been presented on its bank accounts. These relate to accounts held with banks outside of Jamaica and at central banks. Borrowings from banks are denominated in United States dollars and have various maturity dates. These attract interest at 3.77 - 11.63% per annum.
The amounts included as cash equivalents in the statement of cash flows are as follows:
The Group
2020 2019 $'000 $'000
Total due to banks 30,134,599 22,776,255 Less: amounts with original maturities of
greater than 90 days (11,679,099) (7,619,266)
18,455,500 15,156,989
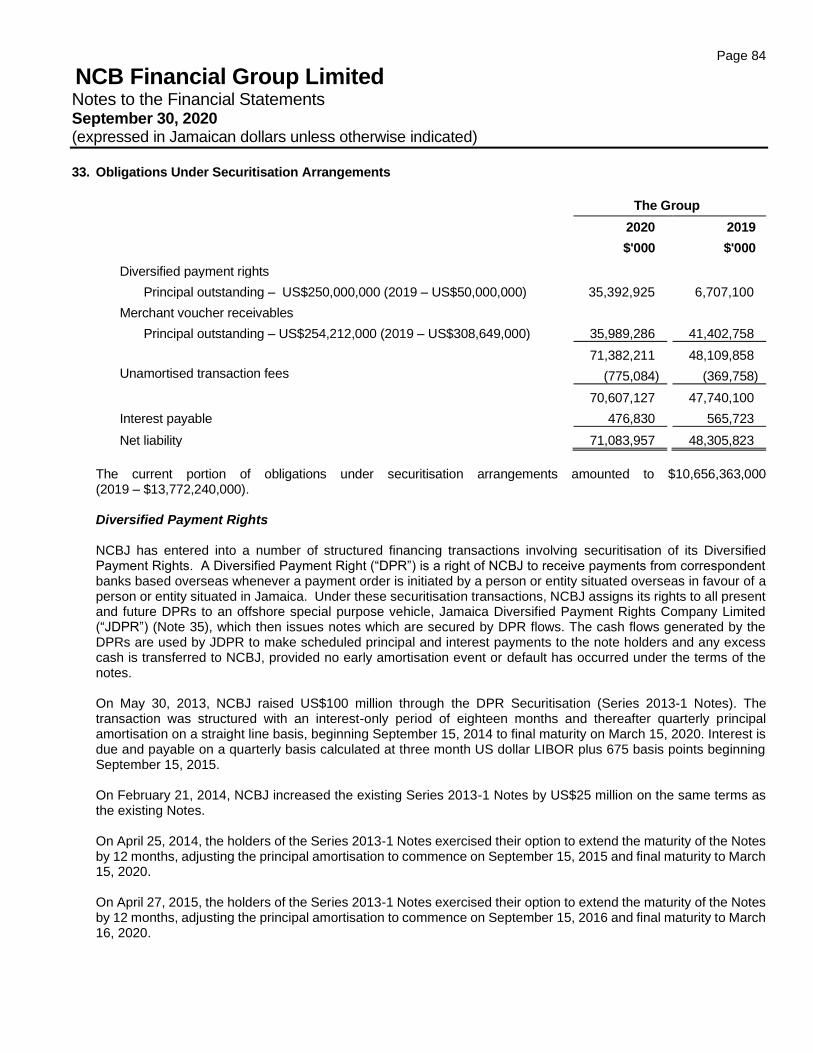
Page 84
NCB Financial Group Limited Notes to the Financial Statements September 30, 2020 (expressed in Jamaican dollars unless otherwise indicated)
33. Obligations Under Securitisation Arrangements
The Group
2020 2019
$'000 $'000
Diversified payment rights
Principal outstanding – US$250,000,000 (2019 – US$50,000,000) 35,392,925 6,707,100
Merchant voucher receivables
Principal outstanding – US$254,212,000 (2019 – US$308,649,000) 35,989,286 41,402,758
71,382,211 48,109,858
Unamortised transaction fees (775,084) (369,758)
70,607,127 47,740,100
Interest payable 476,830 565,723
Net liability 71,083,957 48,305,823
The current portion of obligations under securitisation arrangements amounted to $10,656,363,000 (2019 – $13,772,240,000). Diversified Payment Rights NCBJ has entered into a number of structured financing transactions involving securitisation of its Diversified Payment Rights. A Diversified Payment Right (“DPR”) is a right of NCBJ to receive payments from correspondent banks based overseas whenever a payment order is initiated by a person or entity situated overseas in favour of a person or entity situated in Jamaica. Under these securitisation transactions, NCBJ assigns its rights to all present and future DPRs to an offshore special purpose vehicle, Jamaica Diversified Payment Rights Company Limited (“JDPR”) (Note 35), which then issues notes which are secured by DPR flows. The cash flows generated by the DPRs are used by JDPR to make scheduled principal and interest payments to the note holders and any excess cash is transferred to NCBJ, provided no early amortisation event or default has occurred under the terms of the notes. On May 30, 2013, NCBJ raised US$100 million through the DPR Securitisation (Series 2013-1 Notes). The transaction was structured with an interest-only period of eighteen months and thereafter quarterly principal amortisation on a straight line basis, beginning September 15, 2014 to final maturity on March 15, 2020. Interest is due and payable on a quarterly basis calculated at three month US dollar LIBOR plus 675 basis points beginning September 15, 2015. On February 21, 2014, NCBJ increased the existing Series 2013-1 Notes by US$25 million on the same terms as the existing Notes. On April 25, 2014, the holders of the Series 2013-1 Notes exercised their option to extend the maturity of the Notes by 12 months, adjusting the principal amortisation to commence on September 15, 2015 and final maturity to March 15, 2020. On April 27, 2015, the holders of the Series 2013-1 Notes exercised their option to extend the maturity of the Notes by 12 months, adjusting the principal amortisation to commence on September 15, 2016 and final maturity to March 16, 2020.
Page 85
NCB Financial Group Limited Notes to the Financial Statements September 30, 2020 (expressed in Jamaican dollars unless otherwise indicated)
33. Obligations Under Securitisation Arrangements (Continued) Diversified Payment Rights (continued) On March 28, 2016, the holders of the Series 2013-1 Notes exercised their third and final option to extend the maturity of the Notes by 12 months, adjusting the principal amortisation to commence on September 15, 2019 and final maturity to March 15, 2021. On September 30, 2020, NCBJ raised US$250 million through the DPR Securitisation (Series 2020-1 Notes). The transaction was structured with an interest-only period of 3.25-year (13 quarters) and thereafter quarterly principal amortisation on a straight line basis, beginning March 15, 2024 to final maturity on September 15, 2030. Interest is due and payable on a quarterly basis calculated at a rate of 5.25% beginning December 15, 2020. Part proceeds were used to retire the Series 2013-1 Notes. Merchant Voucher Receivables
NCBJ has entered into a structured financing transaction involving securitisation of its Merchant Voucher Receivables (MVR). This arrangement involves the sale of future flows due from Visa International Service Association (Visa) and MasterCard International Incorporated (MasterCard) related to international merchant vouchers acquired by NCBJ in Jamaica.
A merchant voucher is created when an international Visa or MasterCard cardholder pays for goods or services at
a NCB merchant. NCB approves the charge, pays the merchant under contractual terms, and submits the merchant voucher information to Visa or MasterCard for settlement. Upon approval and receipt of the charge information, Visa or MasterCard is obligated to pay the amounts due, and this represents a receivable under the transaction.
Arising from this arrangement, NCBJ transferred its rights to all future receivables to an off-shore special purpose
company (SPC), Jamaica Merchant Voucher Receivables Limited (“JMVR”), which then issues notes which are secured by the MVR flows. The cash flows generated by the MVR are used by JMVR to make scheduled principal and interest payments to the note holders and any excess cash is transferred to NCBJ, provided no early amortisation event or default has occurred under the terms of the notes.
On May 18, 2015, NCBJ raised US$250 million through the MVR securitisation transaction. The transaction was
structured on a mortgage-style amortisation basis with an interest-only period of twenty-eight months and thereafter quarterly principal amortisation, beginning October 6, 2019 to final maturity on July 8, 2022. Interest is due and payable on a quarterly basis calculated at a rate of 5.875% beginning July 7, 2015.
On November 21, 2016, NCBJ raised an additional US$150 million through the MVR securitisation transaction. The
transaction was structured on a mortgage-style amortisation basis with an interest-only period of forty-one months and thereafter quarterly principal amortisation, beginning July 7, 2020 to final maturity on January 8, 2027. Interest is due and payable on a quarterly basis calculated at a rate of 5.625% beginning January 9, 2019.
Page 86
NCB Financial Group Limited Notes to the Financial Statements September 30, 2020 (expressed in Jamaican dollars unless otherwise indicated)
34. Other Borrowed Funds
The Group The Company
2020 2019 2020 2019
$'000 $'000 $'000 $'000
(a) Development Bank of Jamaica 4,479,957 4,529,782 - -
(b) Corporate notes 109,626,283 110,547,093 68,485,344 69,373,113
(c) Principal protected notes - 173,527 - -
(d) National Housing Trust 3,202,888 1,604,295 - -
(e) Other 6,517,876 6,871,058 6,370,726 6,036,391
(f) Finance lease obligations - 558,866 - -
123,827,004 124,284,621 74,856,070 75,409,504
Unamortised transaction fees (183,866) (302,207) (178,327) (280,563)
Interest payable 1,423,198 970,687 884,307 1,098,529
125,066,336 124,953,101 75,562,050 76,227,470
The current portion of other borrowed funds amounted to $32,427,928,000 (2019 – $26,501,308,000) for the Group and nil for the Company.
(a) The loans from Development Bank of Jamaica are granted in both Jamaican and US dollars and are utilised by
the Group to finance customers with viable ventures in agricultural, agro-industrial, construction, manufacturing, mining and tourism sectors of the economy. These loans are for terms up to 12 years and at rates ranging from 3.5% - 7%.
(b) Corporate notes are both unsecured and secured variable and fixed rate notes issued in a combination of
Jamaican dollars and United States dollars. The notes are repayable between 2020 and 2023. The fixed rate notes attract interest between 4.25% and 9.75% and the variable rate notes attract interest based on weighted average treasury bill yield plus 2.25% - 2.5% per annum.
(c) The Group has issued principal protected notes which entitle the holders to participate in positive returns on the
Euro Stoxx 50 or S&P 500 indices while providing a principal protection feature with or without an annual coupon interest payment. If the return on the index is negative, the holder will obtain the principal invested for the notes. Both the principal and interest payments are indexed to the US dollar. These notes are structured products and comprise a fixed income element accounted for at amortised cost (disclosed above) and a derivative (equity indexed option) element disclosed in Note 19.
(d) The loans from National Housing Trust (NHT) are granted as part of the Joint Financing Mortgage Programme.
Under the partnership agreement, NHT contributors are able to access their NHT loans directly from NCBJ at the prevailing interest rate offered by NHT. These loans are for the terms up to 40 years at rates ranging from 0% - 6%.
(e) On May 17, 2019, NCB Global Holdings Limited extended a loan of US$45 million to NCB Financial Group
Limited. The loan is secured by a pledge of Guardian Holdings Limited shares. Interest is due and payable on a quarterly basis calculated at rate of 7.65% per annum beginning August 17, 2019. Principal is due and payable at maturity on May 17, 2022.
Page 87
NCB Financial Group Limited Notes to the Financial Statements September 30, 2020 (expressed in Jamaican dollars unless otherwise indicated)
34. Other Borrowed Funds (Continued)
(f) The finance lease obligations are as follows:
The Group
2020 2019
$'000 $'000
Minimum lease payments under finance leases:
Not later than 1 year - 321,090
Later than 1 year and not later than 5 years - 279,897
- 600,987
Future finance charges - (42,121)
Present value of finance lease obligations - 558,866
The present value of finance lease obligations is as follows:
The Group
2020 2019
$'000 $'000
Not later than 1 year - 292,368
Later than 1 year and not later than 5 years - 266,498
- 558,866
Page 88
NCB Financial Group Limited Notes to the Financial Statements September 30, 2020 (expressed in Jamaican dollars unless otherwise indicated)
35. Interests in Structured Entities A structured entity is an entity in which voting or similar rights are not the dominant factor in deciding control. Structured entities are generally created to achieve a narrow and well defined objective with restrictions around their on-going activities. An interest in a structured entity is any form of contractual or non-contractual involvement which creates variability in returns arising from the performance of the entity for the Group. Such interests include holdings of debt or equity securities and investment management agreements. Structured entities are assessed for consolidation in accordance with the accounting policy set out in Note 2(f). Consolidated Structured Entities Securitisation Vehicles NCBJ uses securitisation as a source of financing and a means of risk transfer. Securitisation of its DPR and MVR (Note 33) is conducted through structured entities, JDPR and JMVR, exempted limited liability companies incorporated under the laws of the Cayman Islands. The relationship between the transferred rights and the associated liabilities is that holders of Notes may only look to cash flows from the securitised assets for payments of principal and interest due to them under the terms of their Notes. Mutual Funds
The Group manages a series of mutual funds through its trust and asset management subsidiaries, Guardian Group Trust Limited and Guardian Asset Management and Investment Services Limited. The funds comprise four Caribbean investment based funds and six International investment based funds. These funds invest mainly in equity securities, debt securities and cash and cash equivalents. Guardian Asset Management is the Trustee, Income and Paying Agent, Registrar and Fund Administrator of these Mutual Funds. Guardian Life of the Caribbean acts in the capacity of Portfolio Manager. As at the consolidated statement of financial position date, the Group has determined that it controls these mutual funds, as defined in note 3, specific funds. Management has concluded that the contractual terms provide the Group with power over the Mutual Funds and the Group’s aggregate interest in the Mutual Funds is significant. Unconsolidated Structured Entity The Group manages a Unit Trust Scheme comprising seven portfolios – the JMD Money Market Portfolio, the JMD High Yield Portfolio, the High Yield Asset and Loans Portfolio, the Caribbean Equity Portfolio, the USD Money Market Portfolio, the USD Indexed Bond Portfolio and the USD Bond Portfolio.
The Unit Trust has an independent trustee. The Group is the investment manager of the Unit Trust and is entitled to receive management fees based on the assets under management. The Group also holds units in the Unit Trust.
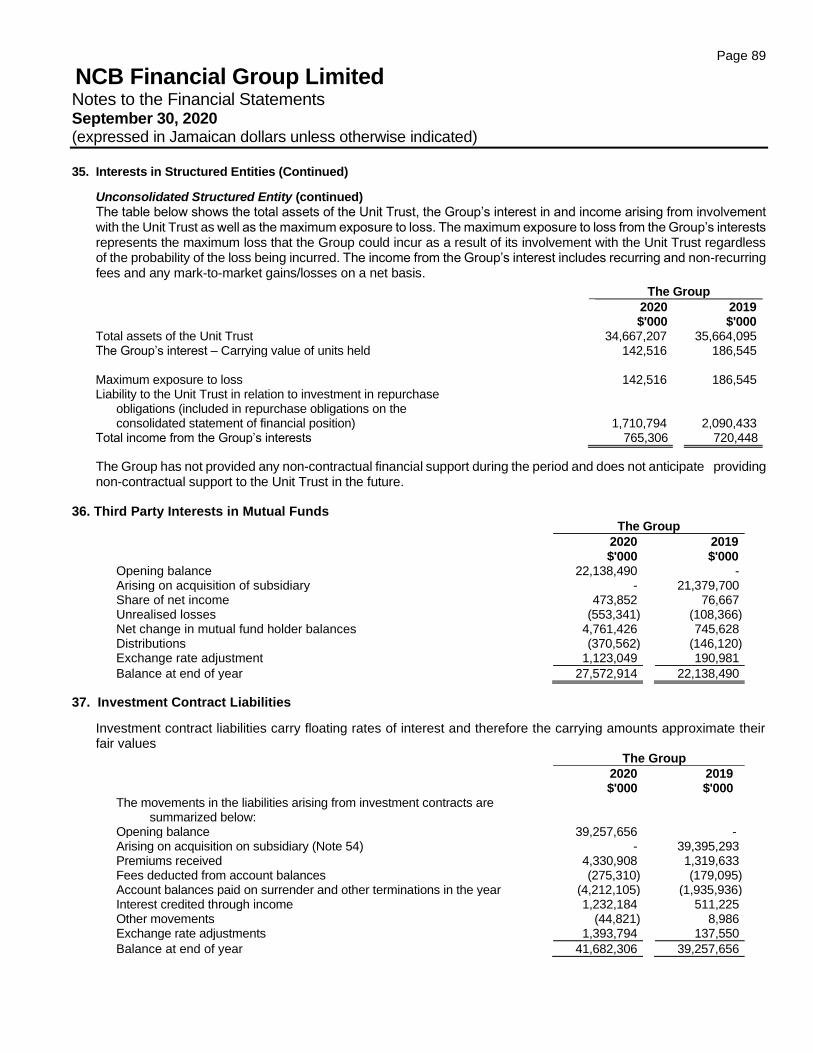
Page 89
NCB Financial Group Limited Notes to the Financial Statements September 30, 2020 (expressed in Jamaican dollars unless otherwise indicated)
35. Interests in Structured Entities (Continued)
Unconsolidated Structured Entity (continued)
The table below shows the total assets of the Unit Trust, the Group’s interest in and income arising from involvement with the Unit Trust as well as the maximum exposure to loss. The maximum exposure to loss from the Group’s interests represents the maximum loss that the Group could incur as a result of its involvement with the Unit Trust regardless of the probability of the loss being incurred. The income from the Group’s interest includes recurring and non-recurring fees and any mark-to-market gains/losses on a net basis.
The Group
2020 2019 $'000 $'000
Total assets of the Unit Trust 34,667,207 35,664,095 The Group’s interest – Carrying value of units held 142,516 186,545
Maximum exposure to loss 142,516 186,545 Liability to the Unit Trust in relation to investment in repurchase
obligations (included in repurchase obligations on the consolidated statement of financial position)
1,710,794
2,090,433 Total income from the Group’s interests 765,306 720,448
The Group has not provided any non-contractual financial support during the period and does not anticipate providing non-contractual support to the Unit Trust in the future.
36. Third Party Interests in Mutual Funds The Group
2020 2019 $'000 $'000
Opening balance 22,138,490 - Arising on acquisition of subsidiary - 21,379,700 Share of net income 473,852 76,667 Unrealised losses (553,341) (108,366) Net change in mutual fund holder balances 4,761,426 745,628 Distributions (370,562) (146,120) Exchange rate adjustment 1,123,049 190,981
Balance at end of year 27,572,914 22,138,490
37. Investment Contract Liabilities
Investment contract liabilities carry floating rates of interest and therefore the carrying amounts approximate their fair values
The Group
2020 2019 $'000 $'000
The movements in the liabilities arising from investment contracts are summarized below:
Opening balance 39,257,656 - Arising on acquisition on subsidiary (Note 54) - 39,395,293 Premiums received 4,330,908 1,319,633 Fees deducted from account balances (275,310) (179,095) Account balances paid on surrender and other terminations in the year (4,212,105) (1,935,936) Interest credited through income 1,232,184 511,225 Other movements (44,821) 8,986 Exchange rate adjustments 1,393,794 137,550
Balance at end of year 41,682,306 39,257,656
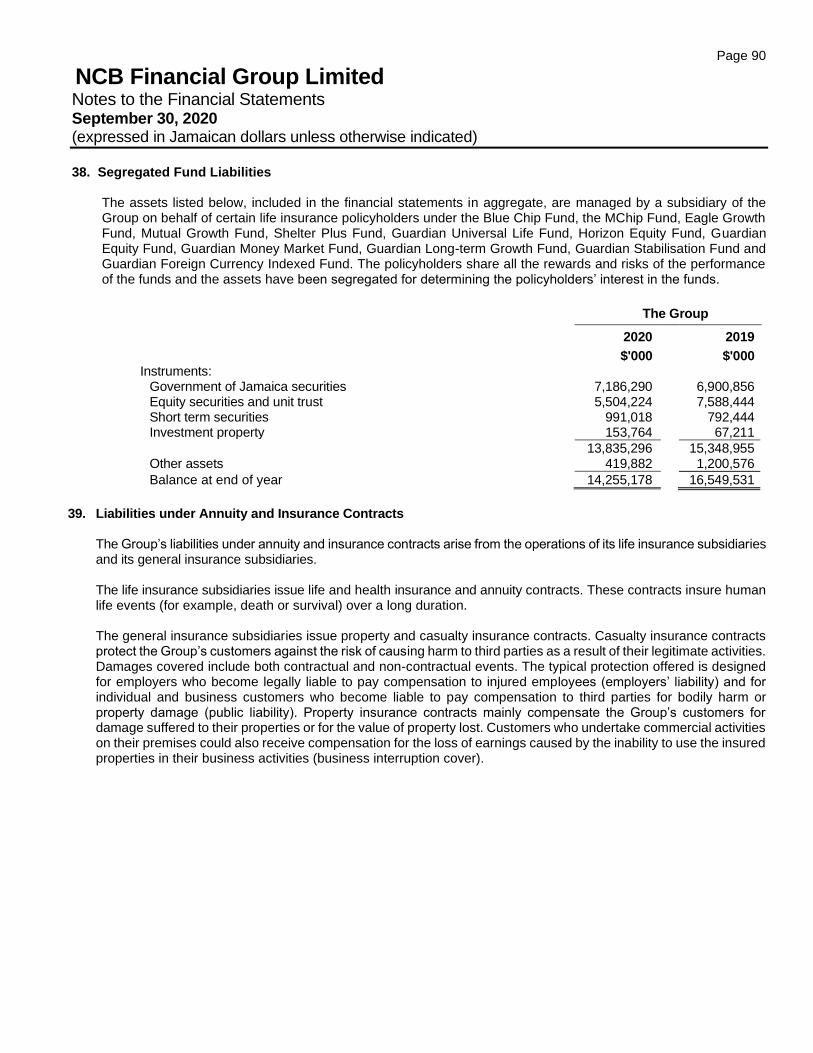
Page 90
NCB Financial Group Limited Notes to the Financial Statements September 30, 2020 (expressed in Jamaican dollars unless otherwise indicated)
38. Segregated Fund Liabilities
The assets listed below, included in the financial statements in aggregate, are managed by a subsidiary of the Group on behalf of certain life insurance policyholders under the Blue Chip Fund, the MChip Fund, Eagle Growth Fund, Mutual Growth Fund, Shelter Plus Fund, Guardian Universal Life Fund, Horizon Equity Fund, Guardian Equity Fund, Guardian Money Market Fund, Guardian Long-term Growth Fund, Guardian Stabilisation Fund and Guardian Foreign Currency Indexed Fund. The policyholders share all the rewards and risks of the performance of the funds and the assets have been segregated for determining the policyholders’ interest in the funds.
The Group
2020 2019
$'000 $'000 Instruments:
Government of Jamaica securities 7,186,290 6,900,856 Equity securities and unit trust 5,504,224 7,588,444 Short term securities 991,018 792,444 Investment property 153,764 67,211
13,835,296 15,348,955 Other assets 419,882 1,200,576
Balance at end of year 14,255,178 16,549,531
39. Liabilities under Annuity and Insurance Contracts
The Group’s liabilities under annuity and insurance contracts arise from the operations of its life insurance subsidiaries and its general insurance subsidiaries. The life insurance subsidiaries issue life and health insurance and annuity contracts. These contracts insure human life events (for example, death or survival) over a long duration.
The general insurance subsidiaries issue property and casualty insurance contracts. Casualty insurance contracts protect the Group’s customers against the risk of causing harm to third parties as a result of their legitimate activities. Damages covered include both contractual and non-contractual events. The typical protection offered is designed for employers who become legally liable to pay compensation to injured employees (employers’ liability) and for individual and business customers who become liable to pay compensation to third parties for bodily harm or property damage (public liability). Property insurance contracts mainly compensate the Group’s customers for damage suffered to their properties or for the value of property lost. Customers who undertake commercial activities on their premises could also receive compensation for the loss of earnings caused by the inability to use the insured properties in their business activities (business interruption cover).
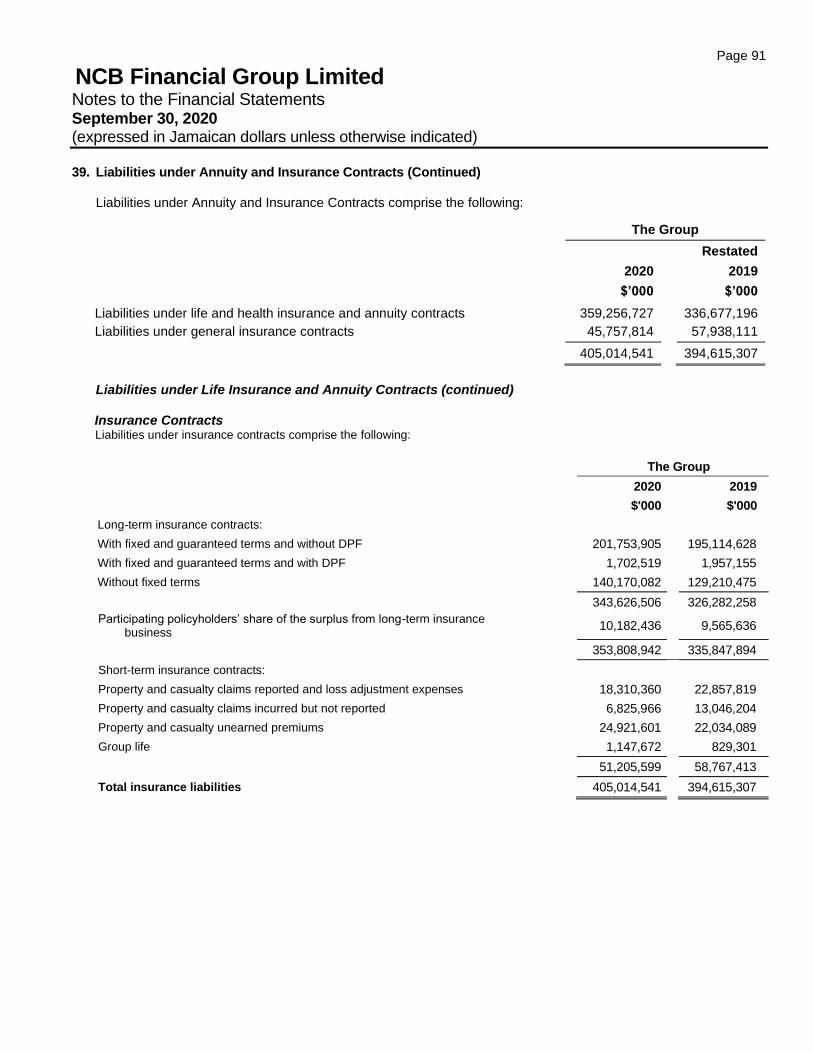
Page 91
NCB Financial Group Limited Notes to the Financial Statements September 30, 2020 (expressed in Jamaican dollars unless otherwise indicated)
39. Liabilities under Annuity and Insurance Contracts (Continued) Liabilities under Annuity and Insurance Contracts comprise the following:
Liabilities under Life Insurance and Annuity Contracts (continued)
Insurance Contracts
Liabilities under insurance contracts comprise the following:
The Group
2020 2019
$'000 $'000
Long-term insurance contracts:
With fixed and guaranteed terms and without DPF 201,753,905 195,114,628
With fixed and guaranteed terms and with DPF 1,702,519 1,957,155
Without fixed terms 140,170,082 129,210,475
343,626,506 326,282,258
Participating policyholders’ share of the surplus from long-term insurance business
10,182,436 9,565,636
353,808,942 335,847,894
Short-term insurance contracts:
Property and casualty claims reported and loss adjustment expenses 18,310,360 22,857,819
Property and casualty claims incurred but not reported 6,825,966 13,046,204
Property and casualty unearned premiums 24,921,601 22,034,089
Group life 1,147,672 829,301
51,205,599 58,767,413
Total insurance liabilities 405,014,541 394,615,307
The Group
Restated
2020
2019
$’000 $’000
Liabilities under life and health insurance and annuity contracts 359,256,727
336,677,196
Liabilities under general insurance contracts 45,757,814 57,938,111
405,014,541 394,615,307
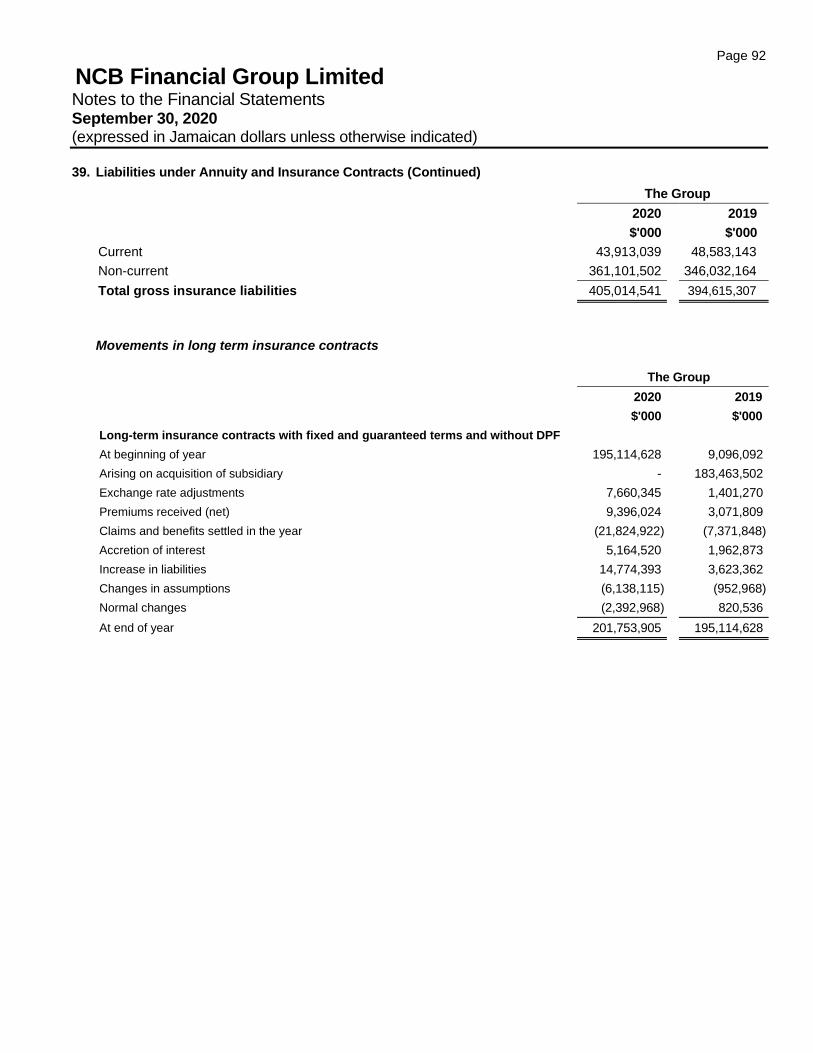
Page 92
NCB Financial Group Limited Notes to the Financial Statements September 30, 2020 (expressed in Jamaican dollars unless otherwise indicated)
39. Liabilities under Annuity and Insurance Contracts (Continued)
Movements in long term insurance contracts
The Group
2020 2019
$'000 $'000
Long-term insurance contracts with fixed and guaranteed terms and without DPF
At beginning of year 195,114,628 9,096,092
Arising on acquisition of subsidiary - 183,463,502
Exchange rate adjustments 7,660,345 1,401,270
Premiums received (net) 9,396,024 3,071,809
Claims and benefits settled in the year (21,824,922) (7,371,848)
Accretion of interest 5,164,520 1,962,873
Increase in liabilities 14,774,393 3,623,362
Changes in assumptions (6,138,115) (952,968)
Normal changes (2,392,968) 820,536
At end of year 201,753,905 195,114,628
The Group
2020 2019
$'000 $'000
Current 43,913,039 48,583,143
Non-current 361,101,502 346,032,164
Total gross insurance liabilities 405,014,541 394,615,307
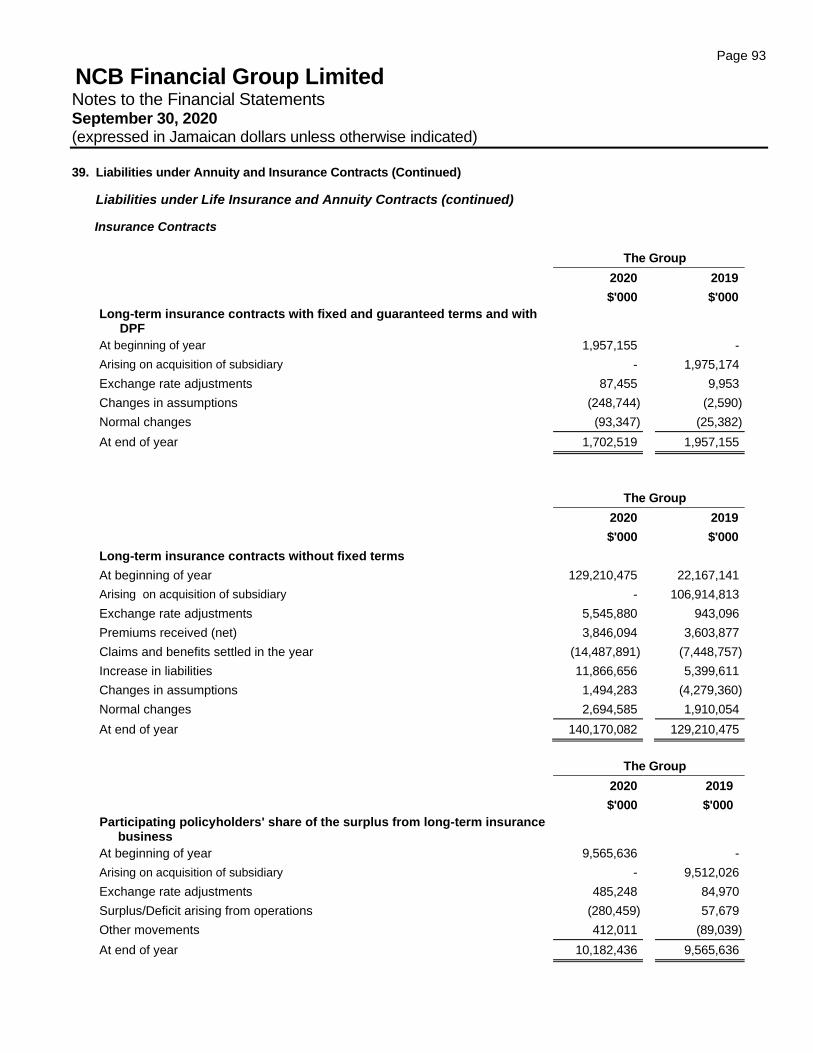
Page 93
NCB Financial Group Limited Notes to the Financial Statements September 30, 2020 (expressed in Jamaican dollars unless otherwise indicated)
39. Liabilities under Annuity and Insurance Contracts (Continued)
Liabilities under Life Insurance and Annuity Contracts (continued)
Insurance Contracts
The Group
2020 2019
$'000 $'000
Long-term insurance contracts with fixed and guaranteed terms and with DPF
At beginning of year 1,957,155 -
Arising on acquisition of subsidiary - 1,975,174
Exchange rate adjustments 87,455 9,953
Changes in assumptions (248,744) (2,590)
Normal changes (93,347) (25,382)
At end of year 1,702,519 1,957,155
The Group
2020 2019
$'000 $'000
Long-term insurance contracts without fixed terms
At beginning of year 129,210,475 22,167,141
Arising on acquisition of subsidiary - 106,914,813
Exchange rate adjustments 5,545,880 943,096
Premiums received (net) 3,846,094 3,603,877
Claims and benefits settled in the year (14,487,891) (7,448,757)
Increase in liabilities 11,866,656 5,399,611
Changes in assumptions 1,494,283 (4,279,360)
Normal changes 2,694,585 1,910,054
At end of year 140,170,082 129,210,475
The Group
2020 2019
$'000 $'000
Participating policyholders' share of the surplus from long-term insurance business
At beginning of year 9,565,636 -
Arising on acquisition of subsidiary - 9,512,026
Exchange rate adjustments 485,248 84,970
Surplus/Deficit arising from operations (280,459) 57,679
Other movements 412,011 (89,039)
At end of year 10,182,436 9,565,636
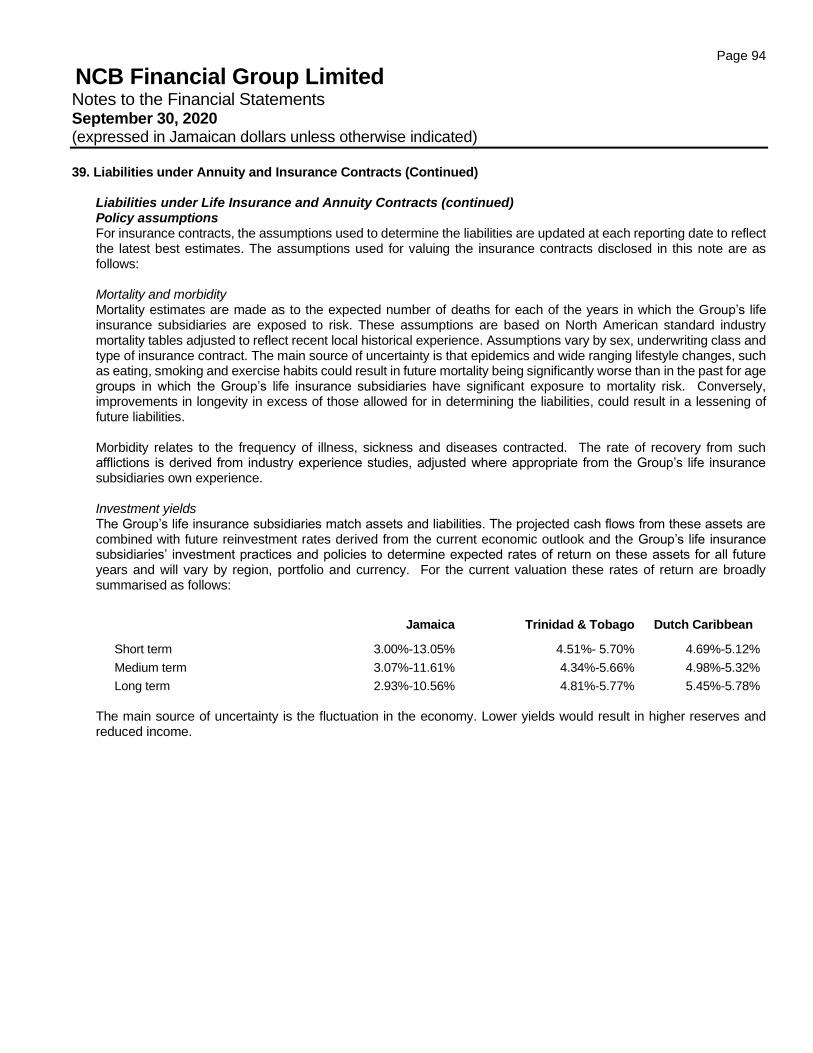
Page 94
NCB Financial Group Limited Notes to the Financial Statements September 30, 2020 (expressed in Jamaican dollars unless otherwise indicated)
39. Liabilities under Annuity and Insurance Contracts (Continued)
Liabilities under Life Insurance and Annuity Contracts (continued) Policy assumptions For insurance contracts, the assumptions used to determine the liabilities are updated at each reporting date to reflect the latest best estimates. The assumptions used for valuing the insurance contracts disclosed in this note are as follows: Mortality and morbidity Mortality estimates are made as to the expected number of deaths for each of the years in which the Group’s life insurance subsidiaries are exposed to risk. These assumptions are based on North American standard industry mortality tables adjusted to reflect recent local historical experience. Assumptions vary by sex, underwriting class and type of insurance contract. The main source of uncertainty is that epidemics and wide ranging lifestyle changes, such as eating, smoking and exercise habits could result in future mortality being significantly worse than in the past for age groups in which the Group’s life insurance subsidiaries have significant exposure to mortality risk. Conversely, improvements in longevity in excess of those allowed for in determining the liabilities, could result in a lessening of future liabilities. Morbidity relates to the frequency of illness, sickness and diseases contracted. The rate of recovery from such afflictions is derived from industry experience studies, adjusted where appropriate from the Group’s life insurance subsidiaries own experience. Investment yields The Group’s life insurance subsidiaries match assets and liabilities. The projected cash flows from these assets are combined with future reinvestment rates derived from the current economic outlook and the Group’s life insurance subsidiaries’ investment practices and policies to determine expected rates of return on these assets for all future years and will vary by region, portfolio and currency. For the current valuation these rates of return are broadly summarised as follows:
Jamaica Trinidad & Tobago Dutch Caribbean
Short term 3.00%-13.05% 4.51%- 5.70% 4.69%-5.12%
Medium term 3.07%-11.61% 4.34%-5.66% 4.98%-5.32%
Long term 2.93%-10.56% 4.81%-5.77% 5.45%-5.78%
The main source of uncertainty is the fluctuation in the economy. Lower yields would result in higher reserves and reduced income.
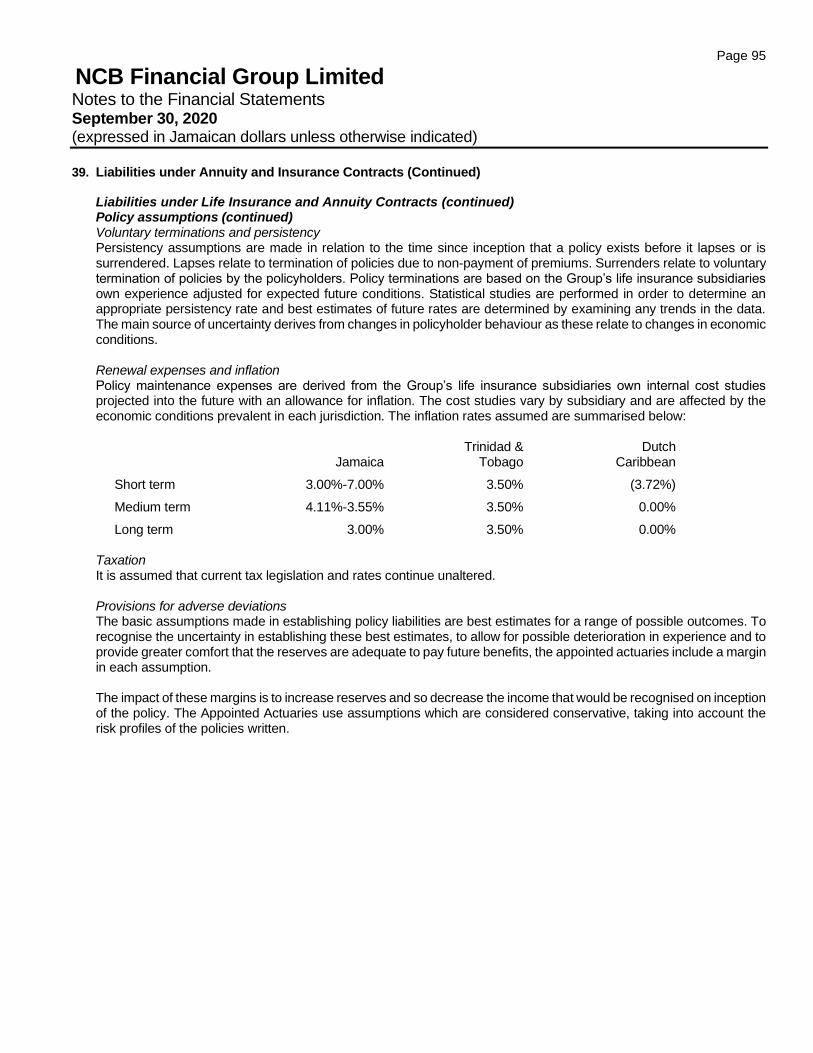
Page 95
NCB Financial Group Limited Notes to the Financial Statements September 30, 2020 (expressed in Jamaican dollars unless otherwise indicated)
39. Liabilities under Annuity and Insurance Contracts (Continued)
Liabilities under Life Insurance and Annuity Contracts (continued) Policy assumptions (continued) Voluntary terminations and persistency Persistency assumptions are made in relation to the time since inception that a policy exists before it lapses or is surrendered. Lapses relate to termination of policies due to non-payment of premiums. Surrenders relate to voluntary termination of policies by the policyholders. Policy terminations are based on the Group’s life insurance subsidiaries own experience adjusted for expected future conditions. Statistical studies are performed in order to determine an appropriate persistency rate and best estimates of future rates are determined by examining any trends in the data. The main source of uncertainty derives from changes in policyholder behaviour as these relate to changes in economic conditions. Renewal expenses and inflation Policy maintenance expenses are derived from the Group’s life insurance subsidiaries own internal cost studies projected into the future with an allowance for inflation. The cost studies vary by subsidiary and are affected by the economic conditions prevalent in each jurisdiction. The inflation rates assumed are summarised below:
Jamaica Trinidad &
Tobago Dutch
Caribbean
Short term 3.00%-7.00% 3.50% (3.72%)
Medium term 4.11%-3.55% 3.50% 0.00%
Long term 3.00% 3.50% 0.00% Taxation It is assumed that current tax legislation and rates continue unaltered. Provisions for adverse deviations The basic assumptions made in establishing policy liabilities are best estimates for a range of possible outcomes. To recognise the uncertainty in establishing these best estimates, to allow for possible deterioration in experience and to provide greater comfort that the reserves are adequate to pay future benefits, the appointed actuaries include a margin in each assumption. The impact of these margins is to increase reserves and so decrease the income that would be recognised on inception of the policy. The Appointed Actuaries use assumptions which are considered conservative, taking into account the risk profiles of the policies written.
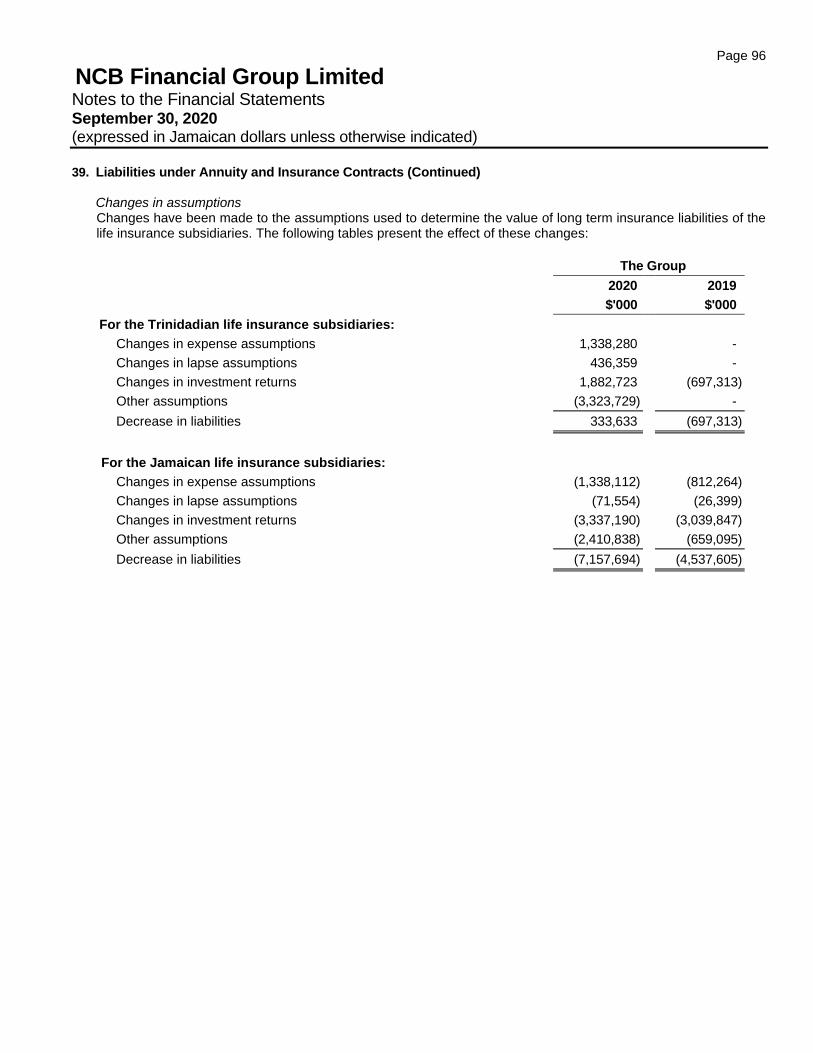
Page 96
NCB Financial Group Limited Notes to the Financial Statements September 30, 2020 (expressed in Jamaican dollars unless otherwise indicated)
39. Liabilities under Annuity and Insurance Contracts (Continued) Changes in assumptions Changes have been made to the assumptions used to determine the value of long term insurance liabilities of the life insurance subsidiaries. The following tables present the effect of these changes:
The Group
2020 2019
$'000 $'000
For the Trinidadian life insurance subsidiaries:
Changes in expense assumptions 1,338,280 -
Changes in lapse assumptions 436,359 -
Changes in investment returns 1,882,723 (697,313)
Other assumptions (3,323,729) -
Decrease in liabilities 333,633 (697,313)
For the Jamaican life insurance subsidiaries:
Changes in expense assumptions (1,338,112) (812,264)
Changes in lapse assumptions (71,554) (26,399)
Changes in investment returns (3,337,190) (3,039,847)
Other assumptions (2,410,838) (659,095)
Decrease in liabilities (7,157,694) (4,537,605)
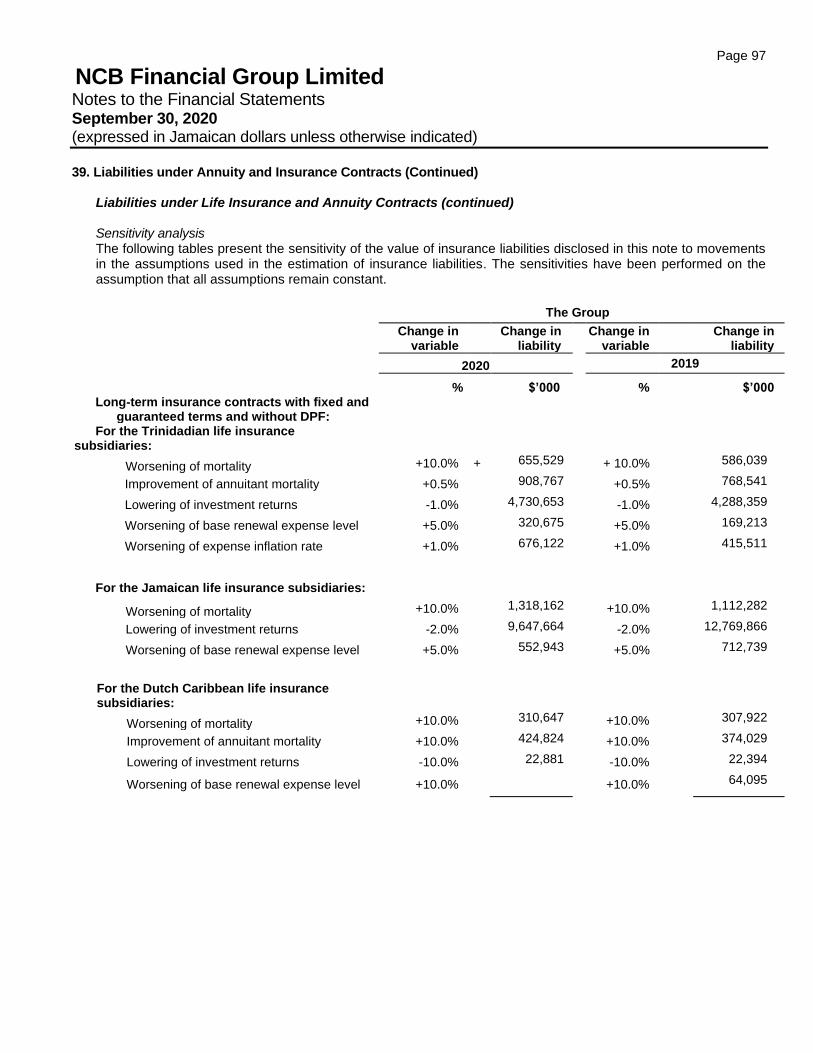
Page 97
NCB Financial Group Limited Notes to the Financial Statements September 30, 2020 (expressed in Jamaican dollars unless otherwise indicated)
39. Liabilities under Annuity and Insurance Contracts (Continued)
Liabilities under Life Insurance and Annuity Contracts (continued)
Sensitivity analysis The following tables present the sensitivity of the value of insurance liabilities disclosed in this note to movements in the assumptions used in the estimation of insurance liabilities. The sensitivities have been performed on the assumption that all assumptions remain constant.
The Group
Change in
variable
Change in liability
Change in variable
Change in liability
2020 2019
% $’000
% $’000 Long-term insurance contracts with fixed and
guaranteed terms and without DPF:
For the Trinidadian life insurance subsidiaries:
Worsening of mortality +10.0% + 655,529 + 10.0% 586,039
Improvement of annuitant mortality +0.5% 908,767 +0.5% 768,541
Lowering of investment returns -1.0% 4,730,653 -1.0% 4,288,359
Worsening of base renewal expense level +5.0% 320,675 +5.0% 169,213
Worsening of expense inflation rate +1.0% 676,122 +1.0% 415,511
For the Jamaican life insurance subsidiaries:
Worsening of mortality +10.0% 1,318,162 +10.0% 1,112,282
Lowering of investment returns -2.0% 9,647,664 -2.0% 12,769,866
Worsening of base renewal expense level +5.0% 552,943 +5.0% 712,739
For the Dutch Caribbean life insurance subsidiaries:
Worsening of mortality +10.0% 310,647 +10.0% 307,922
Improvement of annuitant mortality +10.0% 424,824 +10.0% 374,029
Lowering of investment returns -10.0% 22,881 -10.0% 22,394
Worsening of base renewal expense level +10.0% +10.0% 64,095
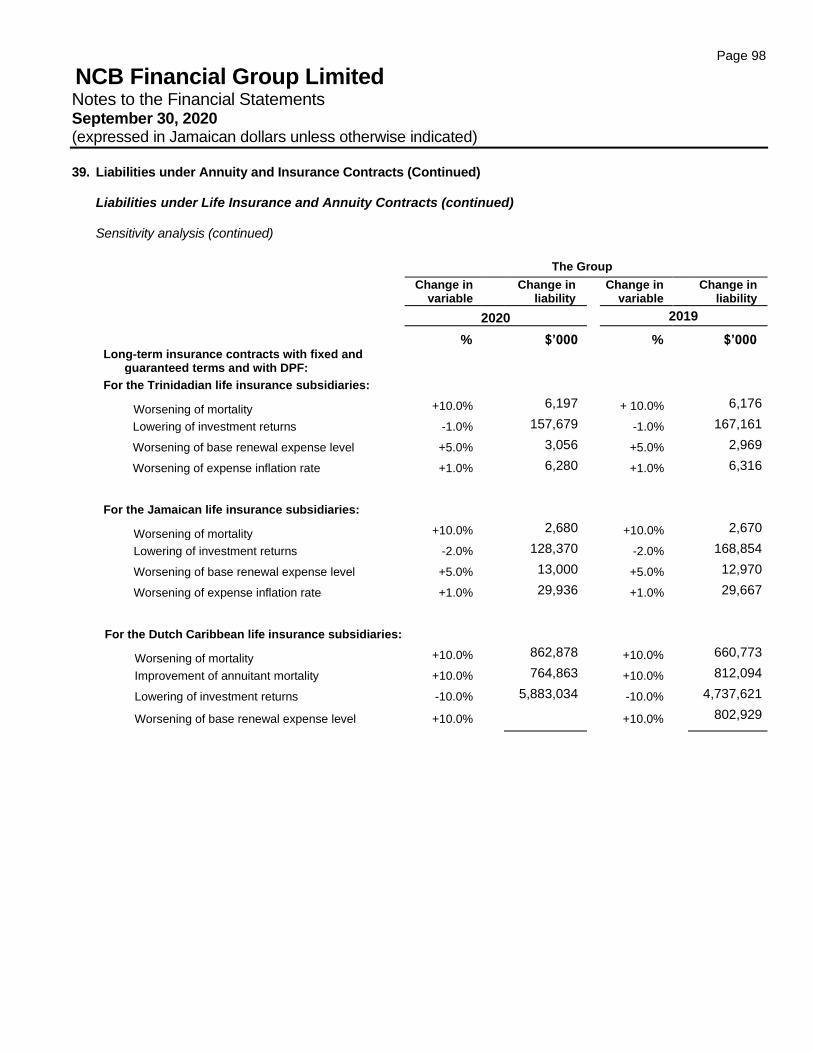
Page 98
NCB Financial Group Limited Notes to the Financial Statements September 30, 2020 (expressed in Jamaican dollars unless otherwise indicated)
39. Liabilities under Annuity and Insurance Contracts (Continued)
Liabilities under Life Insurance and Annuity Contracts (continued)
Sensitivity analysis (continued)
The Group
Change in
variable
Change in liability
Change in variable
Change in liability
2020 2019
% $’000 % $’000 Long-term insurance contracts with fixed and
guaranteed terms and with DPF:
For the Trinidadian life insurance subsidiaries:
Worsening of mortality +10.0% 6,197 + 10.0% 6,176
Lowering of investment returns -1.0% 157,679 -1.0% 167,161
Worsening of base renewal expense level +5.0% 3,056 +5.0% 2,969
Worsening of expense inflation rate +1.0% 6,280 +1.0% 6,316
For the Jamaican life insurance subsidiaries:
Worsening of mortality +10.0% 2,680 +10.0% 2,670
Lowering of investment returns -2.0% 128,370 -2.0% 168,854
Worsening of base renewal expense level +5.0% 13,000 +5.0% 12,970
Worsening of expense inflation rate +1.0% 29,936 +1.0% 29,667
For the Dutch Caribbean life insurance subsidiaries:
Worsening of mortality +10.0% 862,878 +10.0% 660,773
Improvement of annuitant mortality +10.0% 764,863 +10.0% 812,094
Lowering of investment returns -10.0% 5,883,034 -10.0% 4,737,621
Worsening of base renewal expense level +10.0% +10.0% 802,929
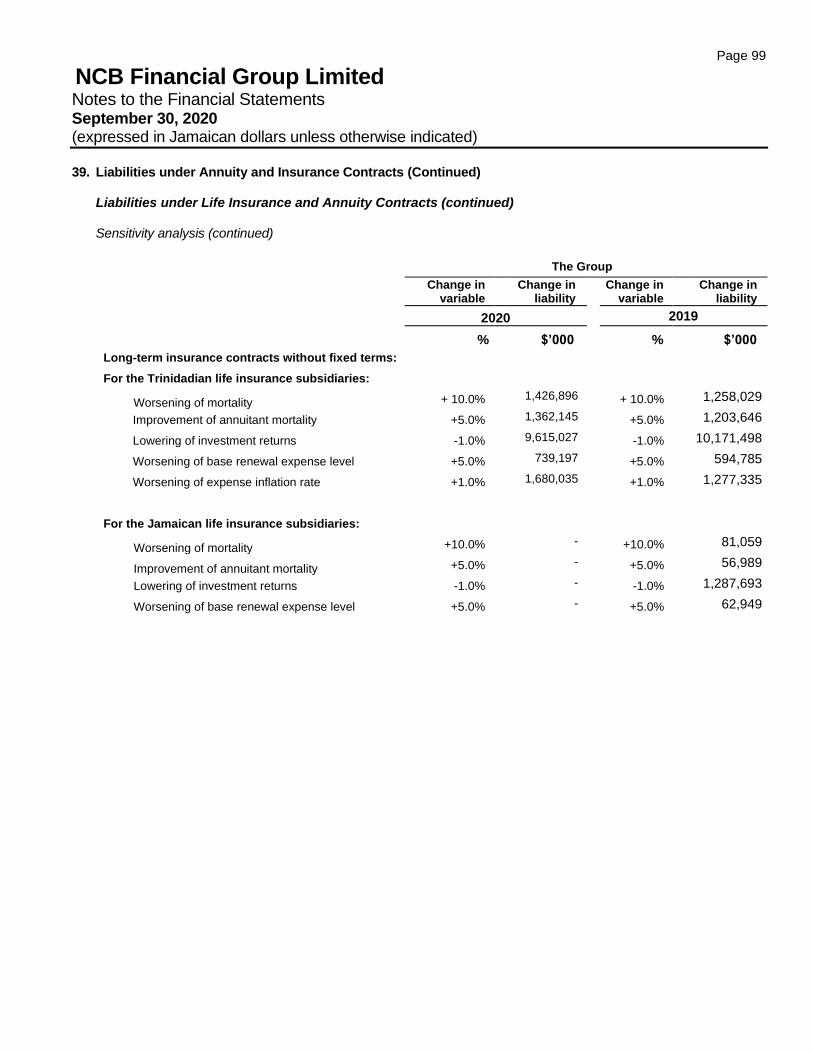
Page 99
NCB Financial Group Limited Notes to the Financial Statements September 30, 2020 (expressed in Jamaican dollars unless otherwise indicated)
39. Liabilities under Annuity and Insurance Contracts (Continued)
Liabilities under Life Insurance and Annuity Contracts (continued)
Sensitivity analysis (continued)
The Group
Change in
variable
Change in liability
Change in variable
Change in liability
2020 2019
% $’000 % $’000
Long-term insurance contracts without fixed terms:
For the Trinidadian life insurance subsidiaries:
Worsening of mortality + 10.0% 1,426,896 + 10.0% 1,258,029
Improvement of annuitant mortality +5.0% 1,362,145 +5.0% 1,203,646
Lowering of investment returns -1.0% 9,615,027 -1.0% 10,171,498
Worsening of base renewal expense level +5.0% 739,197 +5.0% 594,785
Worsening of expense inflation rate +1.0% 1,680,035 +1.0% 1,277,335
For the Jamaican life insurance subsidiaries:
Worsening of mortality +10.0% - +10.0% 81,059
Improvement of annuitant mortality +5.0% - +5.0% 56,989
Lowering of investment returns -1.0% - -1.0% 1,287,693
Worsening of base renewal expense level +5.0% - +5.0% 62,949
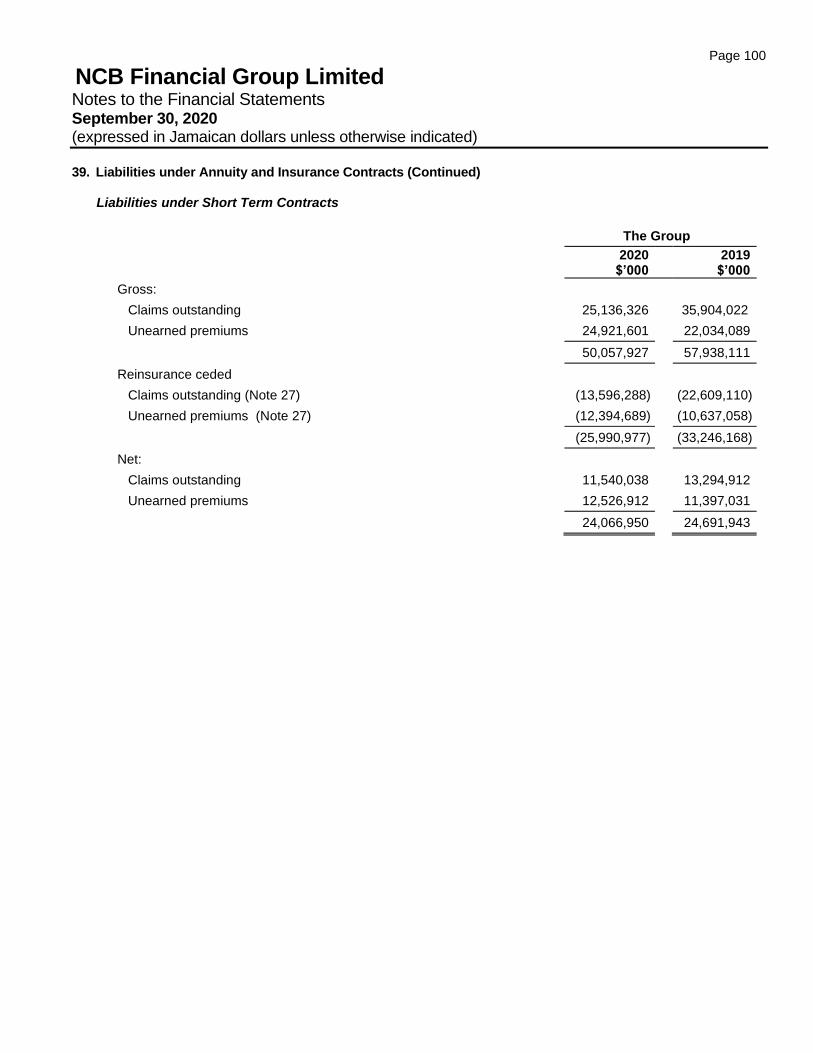
Page 100
NCB Financial Group Limited Notes to the Financial Statements September 30, 2020 (expressed in Jamaican dollars unless otherwise indicated)
39. Liabilities under Annuity and Insurance Contracts (Continued)
Liabilities under Short Term Contracts
The Group
2020 $’000
2019
$’000
Gross:
Claims outstanding 25,136,326 35,904,022
Unearned premiums 24,921,601 22,034,089
50,057,927 57,938,111
Reinsurance ceded
Claims outstanding (Note 27) (13,596,288) (22,609,110)
Unearned premiums (Note 27) (12,394,689) (10,637,058)
(25,990,977) (33,246,168)
Net:
Claims outstanding 11,540,038 13,294,912
Unearned premiums 12,526,912 11,397,031
24,066,950 24,691,943
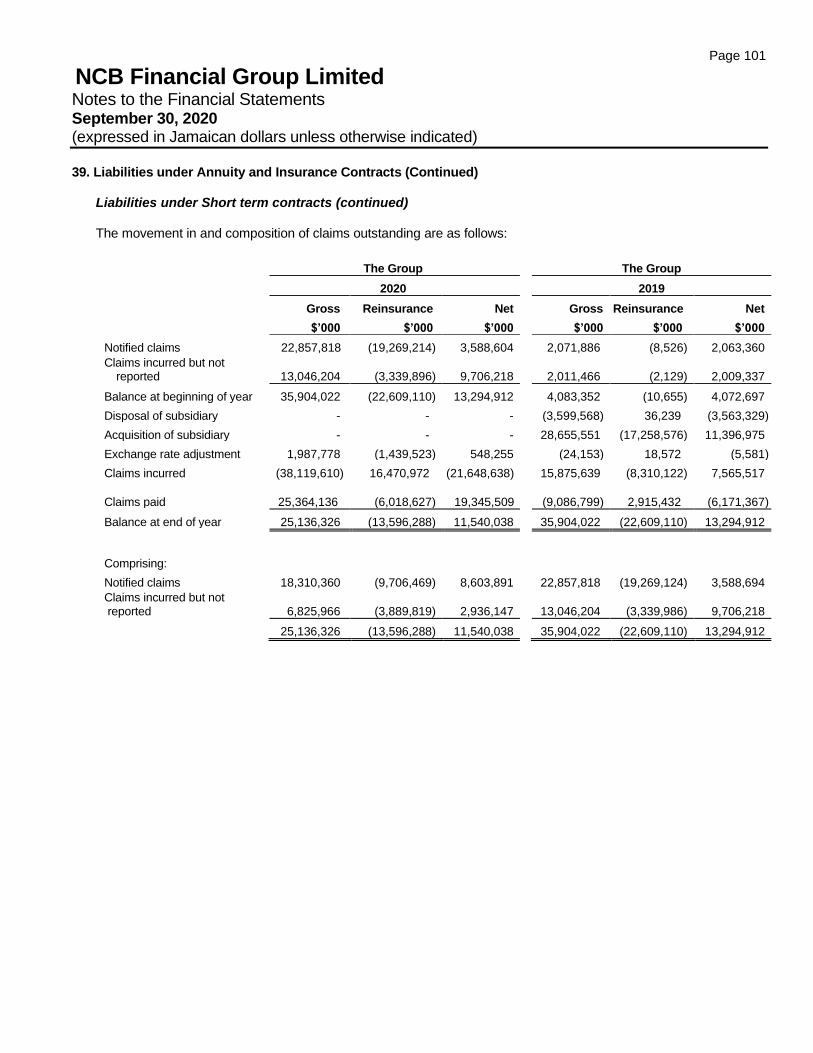
Page 101
NCB Financial Group Limited Notes to the Financial Statements September 30, 2020 (expressed in Jamaican dollars unless otherwise indicated)
39. Liabilities under Annuity and Insurance Contracts (Continued)
Liabilities under Short term contracts (continued)
The movement in and composition of claims outstanding are as follows:
The Group The Group
2020 2019
Gross Reinsurance Net Gross Reinsurance Net
$’000 $’000 $’000 $’000 $’000 $’000
Notified claims 22,857,818 (19,269,214) 3,588,604 2,071,886 (8,526) 2,063,360
Claims incurred but not reported 13,046,204 (3,339,896) 9,706,218 2,011,466 (2,129) 2,009,337
Balance at beginning of year 35,904,022 (22,609,110) 13,294,912 4,083,352 (10,655) 4,072,697
Disposal of subsidiary - - - (3,599,568) 36,239 (3,563,329)
Acquisition of subsidiary - - - 28,655,551 (17,258,576) 11,396,975
Exchange rate adjustment 1,987,778 (1,439,523) 548,255 (24,153) 18,572 (5,581)
Claims incurred (38,119,610) 16,470,972 (21,648,638) 15,875,639 (8,310,122) 7,565,517
Claims paid 25,364,136 (6,018,627) 19,345,509 (9,086,799) 2,915,432 (6,171,367)
Balance at end of year 25,136,326 (13,596,288) 11,540,038 35,904,022 (22,609,110) 13,294,912
Comprising:
Notified claims 18,310,360 (9,706,469) 8,603,891 22,857,818 (19,269,124) 3,588,694
Claims incurred but not reported 6,825,966 (3,889,819) 2,936,147 13,046,204 (3,339,986) 9,706,218
25,136,326 (13,596,288) 11,540,038 35,904,022 (22,609,110) 13,294,912
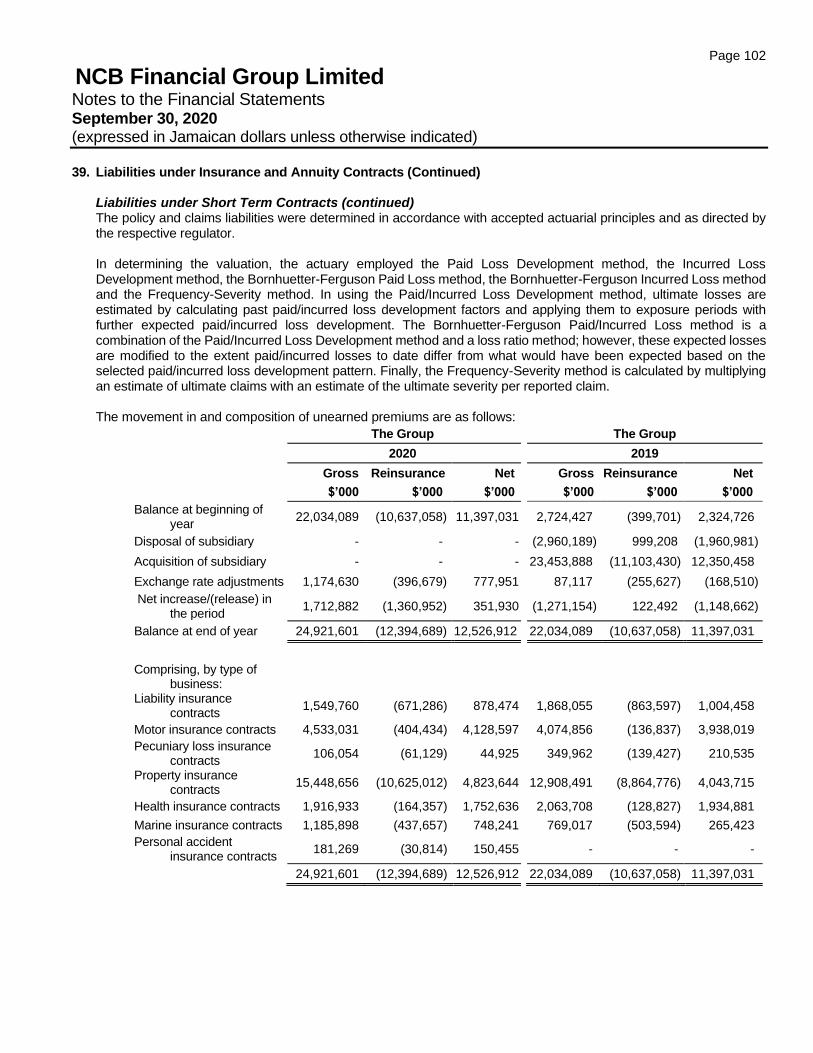
Page 102
NCB Financial Group Limited Notes to the Financial Statements September 30, 2020 (expressed in Jamaican dollars unless otherwise indicated)
39. Liabilities under Insurance and Annuity Contracts (Continued) Liabilities under Short Term Contracts (continued) The policy and claims liabilities were determined in accordance with accepted actuarial principles and as directed by the respective regulator. In determining the valuation, the actuary employed the Paid Loss Development method, the Incurred Loss Development method, the Bornhuetter-Ferguson Paid Loss method, the Bornhuetter-Ferguson Incurred Loss method and the Frequency-Severity method. In using the Paid/Incurred Loss Development method, ultimate losses are estimated by calculating past paid/incurred loss development factors and applying them to exposure periods with further expected paid/incurred loss development. The Bornhuetter-Ferguson Paid/Incurred Loss method is a combination of the Paid/Incurred Loss Development method and a loss ratio method; however, these expected losses are modified to the extent paid/incurred losses to date differ from what would have been expected based on the selected paid/incurred loss development pattern. Finally, the Frequency-Severity method is calculated by multiplying an estimate of ultimate claims with an estimate of the ultimate severity per reported claim. The movement in and composition of unearned premiums are as follows:
The Group The Group
2020 2019
Gross Reinsurance Net Gross Reinsurance Net
$’000 $’000 $’000 $’000 $’000 $’000
Balance at beginning of year
22,034,089 (10,637,058) 11,397,031 2,724,427 (399,701) 2,324,726
Disposal of subsidiary - - - (2,960,189) 999,208 (1,960,981)
Acquisition of subsidiary - - - 23,453,888 (11,103,430) 12,350,458
Exchange rate adjustments 1,174,630 (396,679) 777,951 87,117 (255,627) (168,510)
Net increase/(release) in the period
1,712,882 (1,360,952) 351,930 (1,271,154) 122,492 (1,148,662)
Balance at end of year 24,921,601 (12,394,689) 12,526,912 22,034,089 (10,637,058) 11,397,031
Comprising, by type of business:
Liability insurance contracts
1,549,760 (671,286) 878,474 1,868,055 (863,597) 1,004,458
Motor insurance contracts 4,533,031 (404,434) 4,128,597 4,074,856 (136,837) 3,938,019
Pecuniary loss insurance contracts
106,054 (61,129) 44,925 349,962 (139,427) 210,535
Property insurance contracts
15,448,656 (10,625,012) 4,823,644 12,908,491 (8,864,776) 4,043,715
Health insurance contracts 1,916,933 (164,357) 1,752,636 2,063,708 (128,827) 1,934,881
Marine insurance contracts 1,185,898 (437,657) 748,241 769,017 (503,594) 265,423
Personal accident insurance contracts
181,269 (30,814) 150,455 - - -
24,921,601 (12,394,689) 12,526,912 22,034,089 (10,637,058) 11,397,031
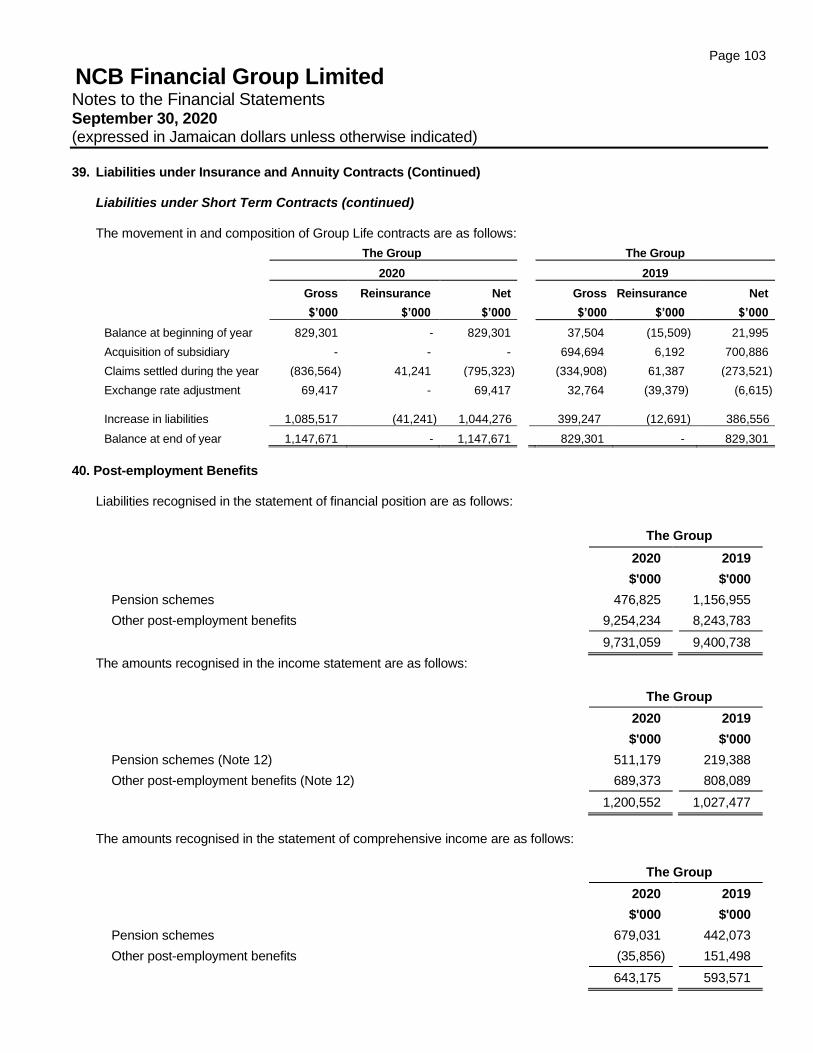
Page 103
NCB Financial Group Limited Notes to the Financial Statements September 30, 2020 (expressed in Jamaican dollars unless otherwise indicated)
39. Liabilities under Insurance and Annuity Contracts (Continued)
Liabilities under Short Term Contracts (continued) The movement in and composition of Group Life contracts are as follows:
The Group The Group
2020 2019
Gross Reinsurance Net Gross Reinsurance Net
$’000 $’000 $’000 $’000 $’000 $’000
Balance at beginning of year 829,301 - 829,301 37,504 (15,509) 21,995
Acquisition of subsidiary - - - 694,694 6,192 700,886
Claims settled during the year (836,564) 41,241 (795,323) (334,908) 61,387 (273,521)
Exchange rate adjustment 69,417 - 69,417 32,764 (39,379) (6,615)
Increase in liabilities 1,085,517 (41,241) 1,044,276
399,247 (12,691) 386,556
Balance at end of year 1,147,671 - 1,147,671 829,301 - 829,301
40. Post-employment Benefits
Liabilities recognised in the statement of financial position are as follows:
The Group
2020 2019
$'000 $'000
Pension schemes 476,825 1,156,955
Other post-employment benefits 9,254,234 8,243,783
9,731,059 9,400,738
The amounts recognised in the income statement are as follows:
The Group
2020 2019
$'000 $'000
Pension schemes (Note 12) 511,179 219,388
Other post-employment benefits (Note 12) 689,373 808,089
1,200,552 1,027,477
The amounts recognised in the statement of comprehensive income are as follows:
The Group
2020 2019
$'000 $'000
Pension schemes 679,031 442,073
Other post-employment benefits (35,856) 151,498
643,175 593,571
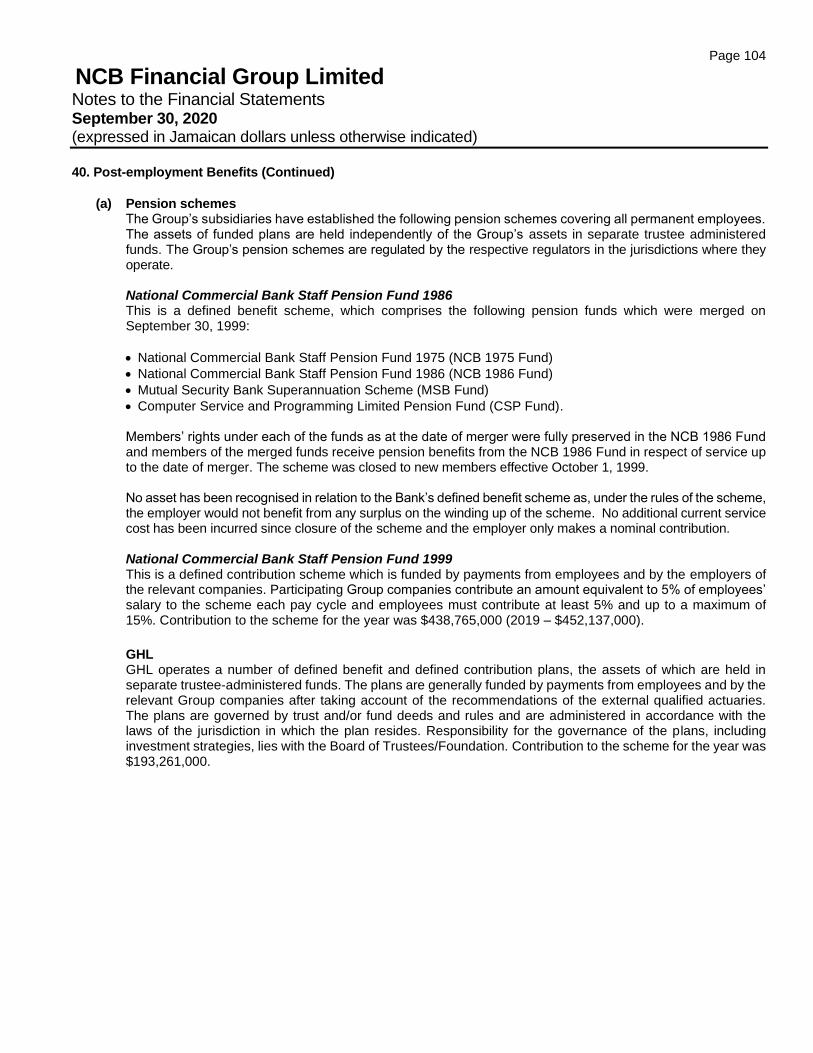
Page 104
NCB Financial Group Limited Notes to the Financial Statements September 30, 2020 (expressed in Jamaican dollars unless otherwise indicated)
40. Post-employment Benefits (Continued)
(a) Pension schemes The Group’s subsidiaries have established the following pension schemes covering all permanent employees. The assets of funded plans are held independently of the Group’s assets in separate trustee administered funds. The Group’s pension schemes are regulated by the respective regulators in the jurisdictions where they operate. National Commercial Bank Staff Pension Fund 1986 This is a defined benefit scheme, which comprises the following pension funds which were merged on September 30, 1999:
• National Commercial Bank Staff Pension Fund 1975 (NCB 1975 Fund)
• National Commercial Bank Staff Pension Fund 1986 (NCB 1986 Fund)
• Mutual Security Bank Superannuation Scheme (MSB Fund)
• Computer Service and Programming Limited Pension Fund (CSP Fund).
Members’ rights under each of the funds as at the date of merger were fully preserved in the NCB 1986 Fund and members of the merged funds receive pension benefits from the NCB 1986 Fund in respect of service up to the date of merger. The scheme was closed to new members effective October 1, 1999. No asset has been recognised in relation to the Bank’s defined benefit scheme as, under the rules of the scheme, the employer would not benefit from any surplus on the winding up of the scheme. No additional current service cost has been incurred since closure of the scheme and the employer only makes a nominal contribution. National Commercial Bank Staff Pension Fund 1999 This is a defined contribution scheme which is funded by payments from employees and by the employers of the relevant companies. Participating Group companies contribute an amount equivalent to 5% of employees’ salary to the scheme each pay cycle and employees must contribute at least 5% and up to a maximum of 15%. Contribution to the scheme for the year was $438,765,000 (2019 – $452,137,000).
GHL GHL operates a number of defined benefit and defined contribution plans, the assets of which are held in separate trustee-administered funds. The plans are generally funded by payments from employees and by the relevant Group companies after taking account of the recommendations of the external qualified actuaries. The plans are governed by trust and/or fund deeds and rules and are administered in accordance with the laws of the jurisdiction in which the plan resides. Responsibility for the governance of the plans, including investment strategies, lies with the Board of Trustees/Foundation. Contribution to the scheme for the year was $193,261,000.
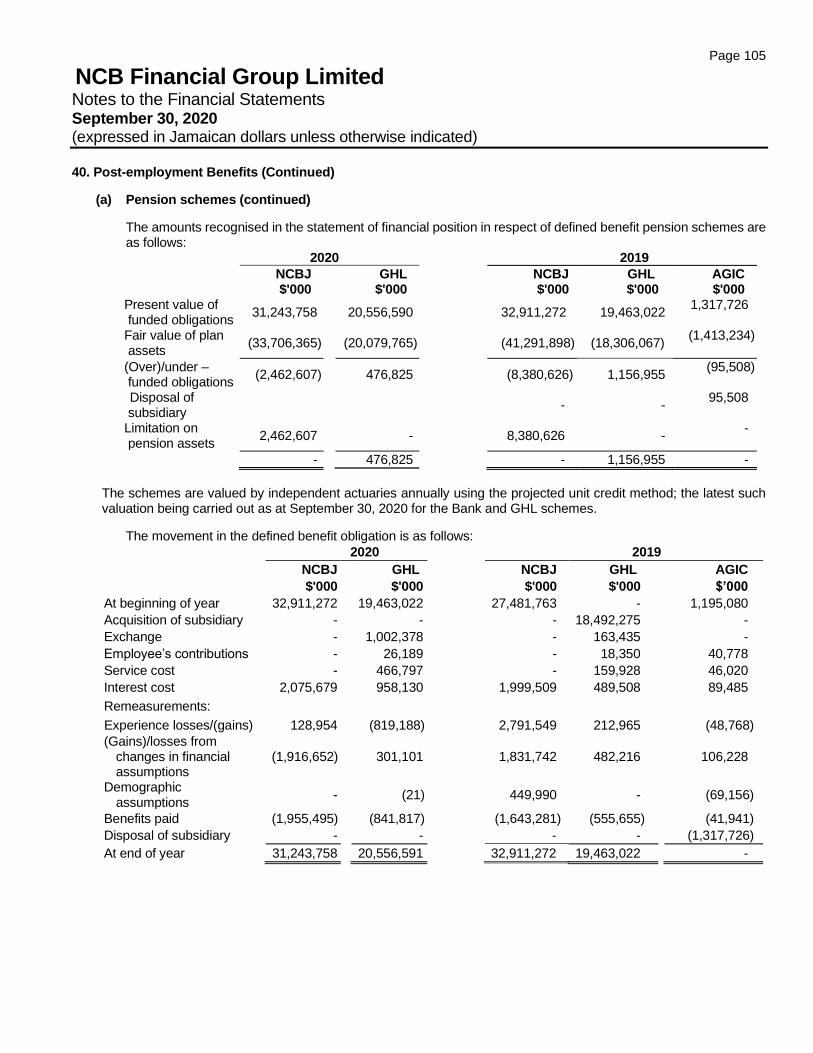
Page 105
NCB Financial Group Limited Notes to the Financial Statements September 30, 2020 (expressed in Jamaican dollars unless otherwise indicated)
40. Post-employment Benefits (Continued)
(a) Pension schemes (continued)
The amounts recognised in the statement of financial position in respect of defined benefit pension schemes are as follows:
2020 2019
NCBJ GHL NCBJ GHL AGIC $'000 $'000 $'000 $'000 $'000
Present value of funded obligations
31,243,758 20,556,590 32,911,272 19,463,022 1,317,726
Fair value of plan assets
(33,706,365) (20,079,765) (41,291,898) (18,306,067) (1,413,234)
(Over)/under – funded obligations
(2,462,607) 476,825 (8,380,626) 1,156,955 (95,508)
Disposal of subsidiary
- - 95,508
Limitation on pension assets
2,462,607 - 8,380,626 - -
- 476,825 - 1,156,955 -
The schemes are valued by independent actuaries annually using the projected unit credit method; the latest such valuation being carried out as at September 30, 2020 for the Bank and GHL schemes.
The movement in the defined benefit obligation is as follows:
2020 2019
NCBJ GHL NCBJ GHL AGIC
$'000 $'000 $'000 $'000 $’000
At beginning of year 32,911,272 19,463,022 27,481,763 - 1,195,080
Acquisition of subsidiary - - - 18,492,275 -
Exchange - 1,002,378 - 163,435 -
Employee’s contributions - 26,189 - 18,350 40,778
Service cost - 466,797 - 159,928 46,020
Interest cost 2,075,679 958,130 1,999,509 489,508 89,485
Remeasurements:
Experience losses/(gains) 128,954 (819,188) 2,791,549 212,965 (48,768)
(Gains)/losses from changes in financial assumptions
(1,916,652) 301,101
1,831,742 482,216 106,228
Demographic assumptions
- (21)
449,990 - (69,156)
Benefits paid (1,955,495) (841,817) (1,643,281) (555,655) (41,941)
Disposal of subsidiary - - - - (1,317,726)
At end of year 31,243,758 20,556,591 32,911,272 19,463,022 -

Page 106
NCB Financial Group Limited Notes to the Financial Statements September 30, 2020 (expressed in Jamaican dollars unless otherwise indicated)
40. Post-employment Benefits (Continued)
(a) Pension schemes (continued)
The movement in the fair value of plan assets is as follows:
2020 2019
NCBJ GHL NCBJ GHL AGIC
$'000 $’000 $'000 $'000 $'000
At beginning of year 41,291,898 18,306,067 32,837,947 - 1,148,632
Acquisition of subsidiary
- -
-
17,865,374 -
Exchange - 935,648
-
152,117 -
Interest on plan assets 2,620,420
923,337
2,401,223
363,430 87,032
Remeasurement - return on plan assets, excluding amounts included in interest on plan assets (8,250,458)
160,924
7,696,009
90,056
151,355
Contributions - 606,326 - 266,720 77,229
Administration fees - (9,588) - 124,026 (9,073)
Benefits paid (1,955,495) (842,949) (1,643,281) (555,656) (41,941)
Disposal of subsidiary - - - - (1,413,234)
At end of year 33,706,365 20,079,765 41,291,898 18,306,067 -
The amounts recognised in the income statement are as follows:
2020 2019
NCBJ GHL NCBJ GHL AGIC
$'000 $'000 $'000 $'000 $'000
Current service cost - 466,797 - 159,928 46,020
Administration fees - 9,588 - - 9,073
Net interest expense - 34,794 - 1,913 2,454
Total, included in staff costs - 511,179 - 161,841 57,547
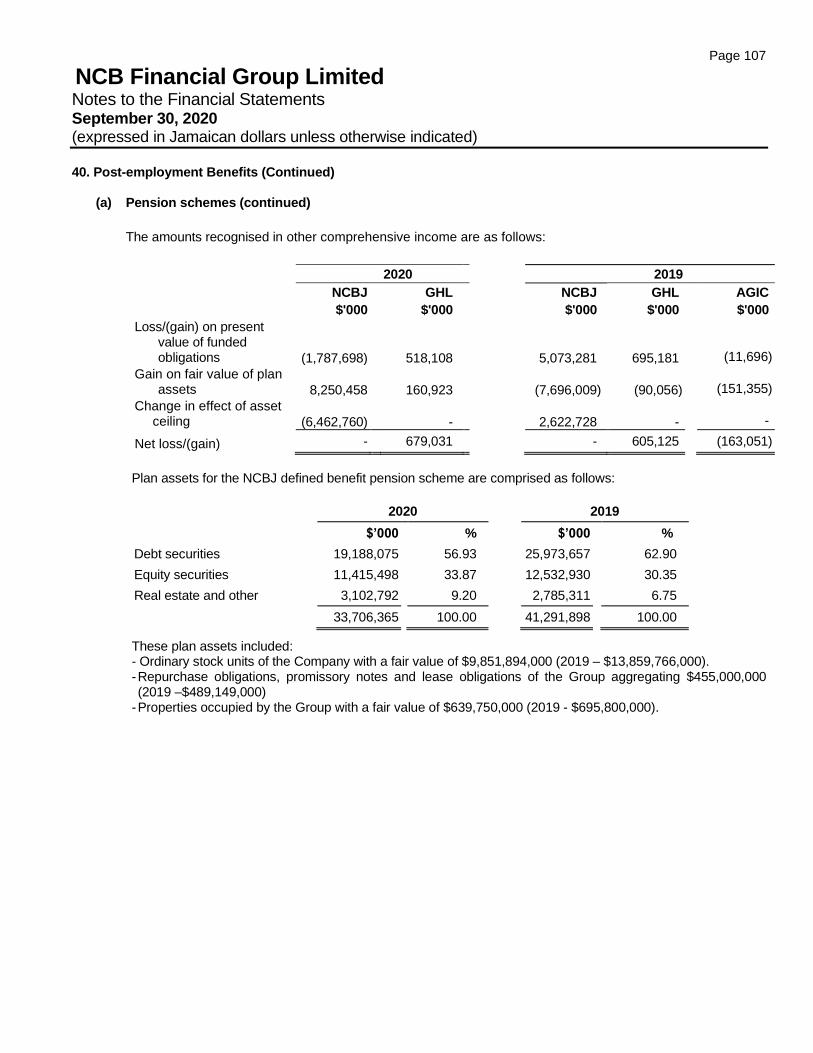
Page 107
NCB Financial Group Limited Notes to the Financial Statements September 30, 2020 (expressed in Jamaican dollars unless otherwise indicated)
40. Post-employment Benefits (Continued)
(a) Pension schemes (continued)
The amounts recognised in other comprehensive income are as follows:
2020 2019
NCBJ GHL NCBJ GHL AGIC
$'000 $'000 $'000 $'000 $'000
Loss/(gain) on present value of funded obligations
(1,787,698)
518,108
5,073,281 695,181
(11,696)
Gain on fair value of plan assets
8,250,458
160,923
(7,696,009) (90,056)
(151,355)
Change in effect of asset ceiling
(6,462,760)
-
2,622,728 -
-
Net loss/(gain) - 679,031 - 605,125 (163,051)
Plan assets for the NCBJ defined benefit pension scheme are comprised as follows:
2020 2019
$’000 % $’000 %
Debt securities 19,188,075 56.93 25,973,657 62.90
Equity securities 11,415,498 33.87 12,532,930 30.35
Real estate and other 3,102,792 9.20 2,785,311 6.75
33,706,365 100.00 41,291,898 100.00
These plan assets included: - Ordinary stock units of the Company with a fair value of $9,851,894,000 (2019 – $13,859,766,000). - Repurchase obligations, promissory notes and lease obligations of the Group aggregating $455,000,000 (2019 –$489,149,000)
- Properties occupied by the Group with a fair value of $639,750,000 (2019 - $695,800,000).
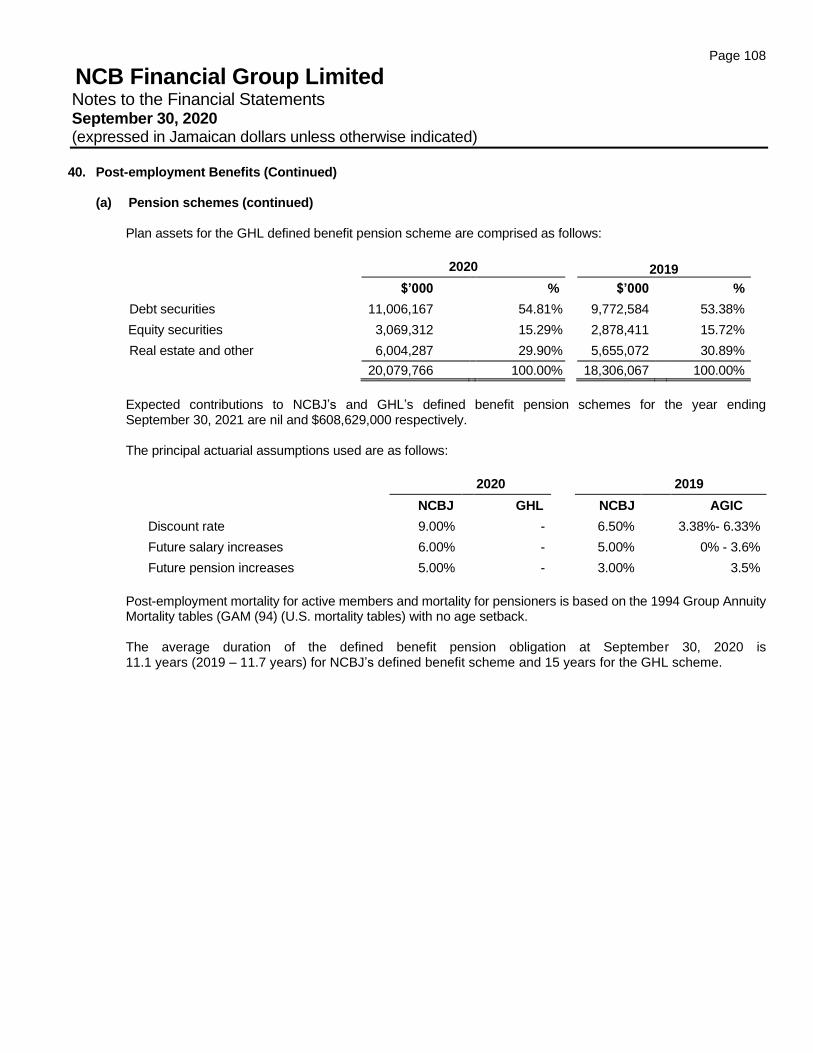
Page 108
NCB Financial Group Limited Notes to the Financial Statements September 30, 2020 (expressed in Jamaican dollars unless otherwise indicated)
40. Post-employment Benefits (Continued)
(a) Pension schemes (continued)
Plan assets for the GHL defined benefit pension scheme are comprised as follows:
2020 2019
$’000 % $’000 %
Debt securities 11,006,167 54.81% 9,772,584 53.38%
Equity securities 3,069,312 15.29% 2,878,411 15.72%
Real estate and other 6,004,287 29.90% 5,655,072 30.89%
20,079,766 100.00% 18,306,067 100.00%
Expected contributions to NCBJ’s and GHL’s defined benefit pension schemes for the year ending September 30, 2021 are nil and $608,629,000 respectively. The principal actuarial assumptions used are as follows:
2020 2019
NCBJ GHL NCBJ AGIC
Discount rate 9.00% - 6.50% 3.38%- 6.33%
Future salary increases 6.00% - 5.00% 0% - 3.6%
Future pension increases 5.00% - 3.00% 3.5%
Post-employment mortality for active members and mortality for pensioners is based on the 1994 Group Annuity Mortality tables (GAM (94) (U.S. mortality tables) with no age setback. The average duration of the defined benefit pension obligation at September 30, 2020 is 11.1 years (2019 – 11.7 years) for NCBJ’s defined benefit scheme and 15 years for the GHL scheme.
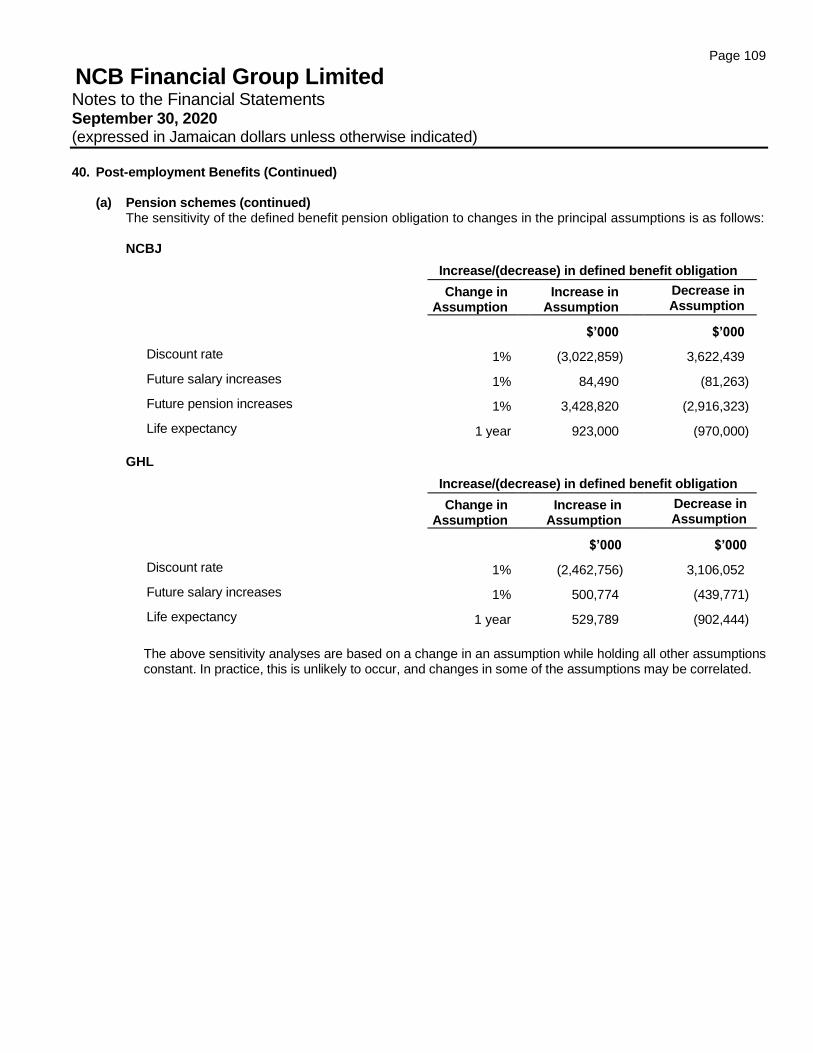
Page 109
NCB Financial Group Limited Notes to the Financial Statements September 30, 2020 (expressed in Jamaican dollars unless otherwise indicated)
40. Post-employment Benefits (Continued)
(a) Pension schemes (continued) The sensitivity of the defined benefit pension obligation to changes in the principal assumptions is as follows:
NCBJ
Increase/(decrease) in defined benefit obligation
Change in
Assumption Increase in
Assumption
Decrease in Assumption
$’000 $’000
Discount rate 1% (3,022,859) 3,622,439
Future salary increases 1% 84,490 (81,263)
Future pension increases 1% 3,428,820 (2,916,323)
Life expectancy 1 year 923,000 (970,000)
GHL
Increase/(decrease) in defined benefit obligation
Change in
Assumption Increase in
Assumption
Decrease in Assumption
$’000 $’000
Discount rate 1% (2,462,756) 3,106,052
Future salary increases 1% 500,774 (439,771)
Life expectancy 1 year 529,789 (902,444)
The above sensitivity analyses are based on a change in an assumption while holding all other assumptions constant. In practice, this is unlikely to occur, and changes in some of the assumptions may be correlated.
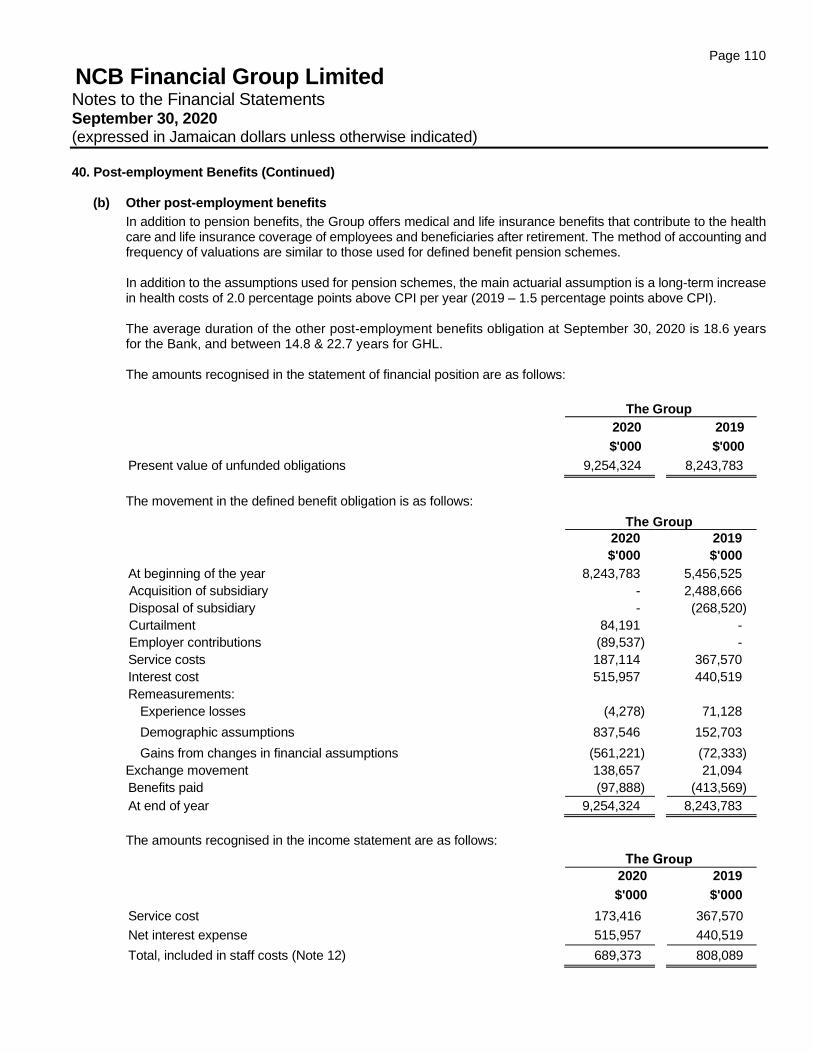
Page 110
NCB Financial Group Limited Notes to the Financial Statements September 30, 2020 (expressed in Jamaican dollars unless otherwise indicated)
40. Post-employment Benefits (Continued)
(b) Other post-employment benefits
In addition to pension benefits, the Group offers medical and life insurance benefits that contribute to the health care and life insurance coverage of employees and beneficiaries after retirement. The method of accounting and frequency of valuations are similar to those used for defined benefit pension schemes. In addition to the assumptions used for pension schemes, the main actuarial assumption is a long-term increase in health costs of 2.0 percentage points above CPI per year (2019 – 1.5 percentage points above CPI). The average duration of the other post-employment benefits obligation at September 30, 2020 is 18.6 years for the Bank, and between 14.8 & 22.7 years for GHL.
The amounts recognised in the statement of financial position are as follows:
The Group
2020 2019
$'000 $'000
Present value of unfunded obligations 9,254,324 8,243,783
The movement in the defined benefit obligation is as follows:
The Group
2020 2019
$'000 $'000
At beginning of the year 8,243,783 5,456,525
Acquisition of subsidiary - 2,488,666
Disposal of subsidiary - (268,520)
Curtailment 84,191 -
Employer contributions (89,537) -
Service costs 187,114 367,570
Interest cost 515,957 440,519
Remeasurements:
Experience losses (4,278) 71,128
Demographic assumptions 837,546 152,703
Gains from changes in financial assumptions (561,221) (72,333)
Exchange movement 138,657 21,094
Benefits paid (97,888) (413,569)
At end of year 9,254,324 8,243,783
The amounts recognised in the income statement are as follows:
The Group
2020 2019
$'000 $'000
Service cost 173,416 367,570
Net interest expense 515,957 440,519
Total, included in staff costs (Note 12) 689,373 808,089
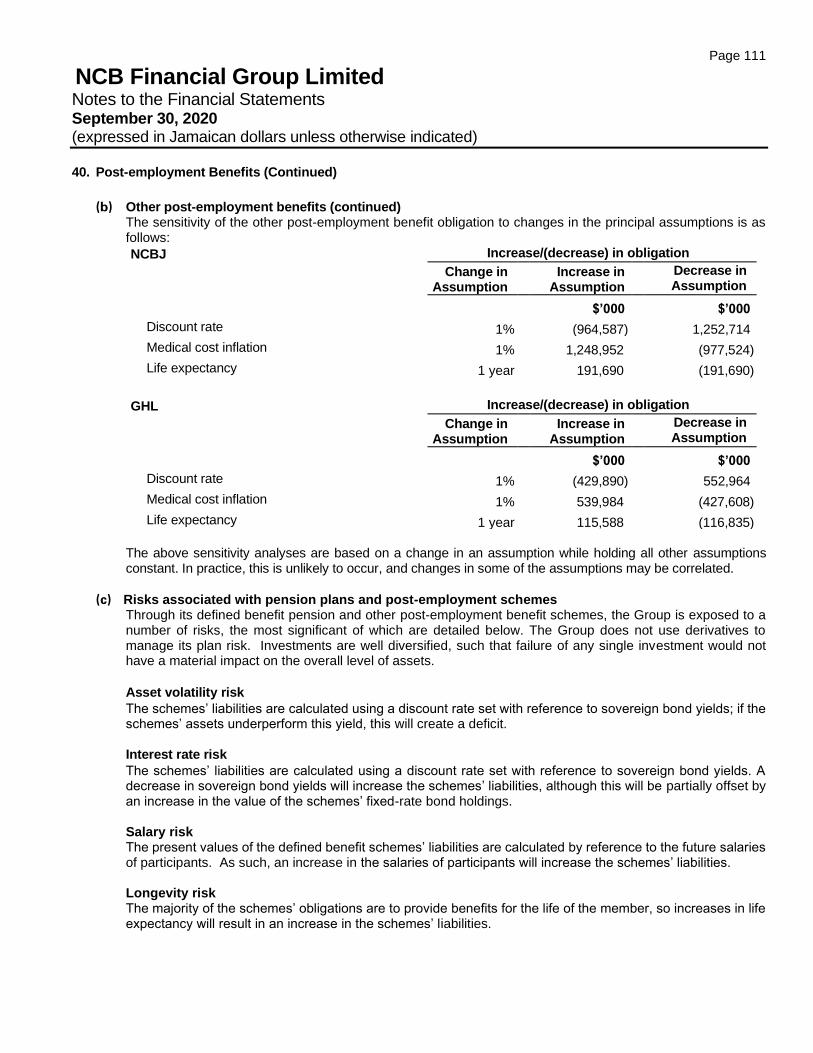
Page 111
NCB Financial Group Limited Notes to the Financial Statements September 30, 2020 (expressed in Jamaican dollars unless otherwise indicated)
40. Post-employment Benefits (Continued)
(b) Other post-employment benefits (continued) The sensitivity of the other post-employment benefit obligation to changes in the principal assumptions is as follows:
NCBJ Increase/(decrease) in obligation
Change in
Assumption Increase in
Assumption
Decrease in Assumption
$’000 $’000
Discount rate 1% (964,587) 1,252,714
Medical cost inflation 1% 1,248,952 (977,524)
Life expectancy 1 year 191,690 (191,690)
GHL Increase/(decrease) in obligation
Change in
Assumption Increase in
Assumption
Decrease in Assumption
$’000 $’000
Discount rate 1% (429,890) 552,964
Medical cost inflation 1% 539,984 (427,608)
Life expectancy 1 year 115,588 (116,835)
The above sensitivity analyses are based on a change in an assumption while holding all other assumptions constant. In practice, this is unlikely to occur, and changes in some of the assumptions may be correlated.
(c) Risks associated with pension plans and post-employment schemes Through its defined benefit pension and other post-employment benefit schemes, the Group is exposed to a number of risks, the most significant of which are detailed below. The Group does not use derivatives to manage its plan risk. Investments are well diversified, such that failure of any single investment would not have a material impact on the overall level of assets.
Asset volatility risk
The schemes’ liabilities are calculated using a discount rate set with reference to sovereign bond yields; if the schemes’ assets underperform this yield, this will create a deficit. Interest rate risk
The schemes’ liabilities are calculated using a discount rate set with reference to sovereign bond yields. A decrease in sovereign bond yields will increase the schemes’ liabilities, although this will be partially offset by an increase in the value of the schemes’ fixed-rate bond holdings. Salary risk The present values of the defined benefit schemes’ liabilities are calculated by reference to the future salaries of participants. As such, an increase in the salaries of participants will increase the schemes’ liabilities. Longevity risk The majority of the schemes’ obligations are to provide benefits for the life of the member, so increases in life expectancy will result in an increase in the schemes’ liabilities.
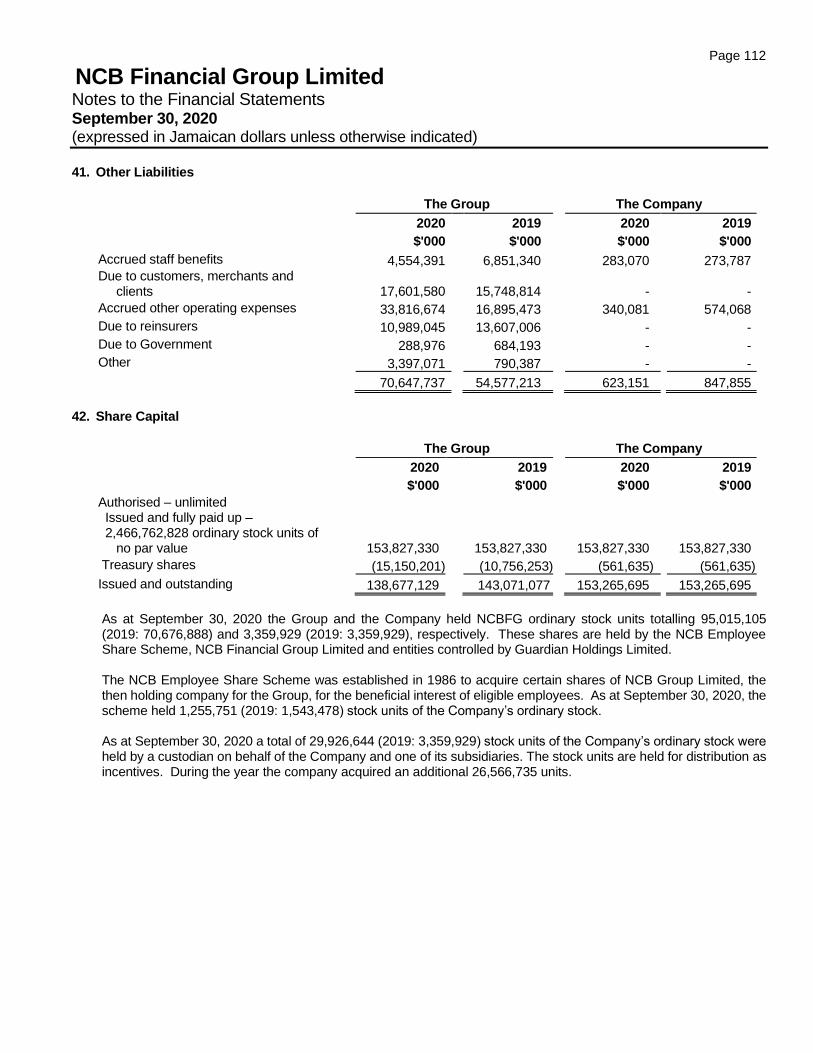
Page 112
NCB Financial Group Limited Notes to the Financial Statements September 30, 2020 (expressed in Jamaican dollars unless otherwise indicated)
41. Other Liabilities
The Group The Company
2020 2019 2020 2019
$'000 $'000 $'000 $'000
Accrued staff benefits 4,554,391 6,851,340 283,070 273,787 Due to customers, merchants and
clients
17,601,580
15,748,814
-
-
Accrued other operating expenses 33,816,674 16,895,473 340,081 574,068
Due to reinsurers 10,989,045 13,607,006 - -
Due to Government 288,976 684,193 - -
Other 3,397,071 790,387 - -
70,647,737 54,577,213 623,151 847,855
42. Share Capital
The Group The Company
2020 2019 2020 2019
$'000 $'000 $'000 $'000
Authorised – unlimited Issued and fully paid up – 2,466,762,828 ordinary stock units of
no par value
153,827,330
153,827,330
153,827,330
153,827,330
Treasury shares (15,150,201) (10,756,253) (561,635) (561,635)
Issued and outstanding 138,677,129 143,071,077 153,265,695 153,265,695
As at September 30, 2020 the Group and the Company held NCBFG ordinary stock units totalling 95,015,105 (2019: 70,676,888) and 3,359,929 (2019: 3,359,929), respectively. These shares are held by the NCB Employee Share Scheme, NCB Financial Group Limited and entities controlled by Guardian Holdings Limited. The NCB Employee Share Scheme was established in 1986 to acquire certain shares of NCB Group Limited, the then holding company for the Group, for the beneficial interest of eligible employees. As at September 30, 2020, the scheme held 1,255,751 (2019: 1,543,478) stock units of the Company’s ordinary stock. As at September 30, 2020 a total of 29,926,644 (2019: 3,359,929) stock units of the Company’s ordinary stock were held by a custodian on behalf of the Company and one of its subsidiaries. The stock units are held for distribution as incentives. During the year the company acquired an additional 26,566,735 units.
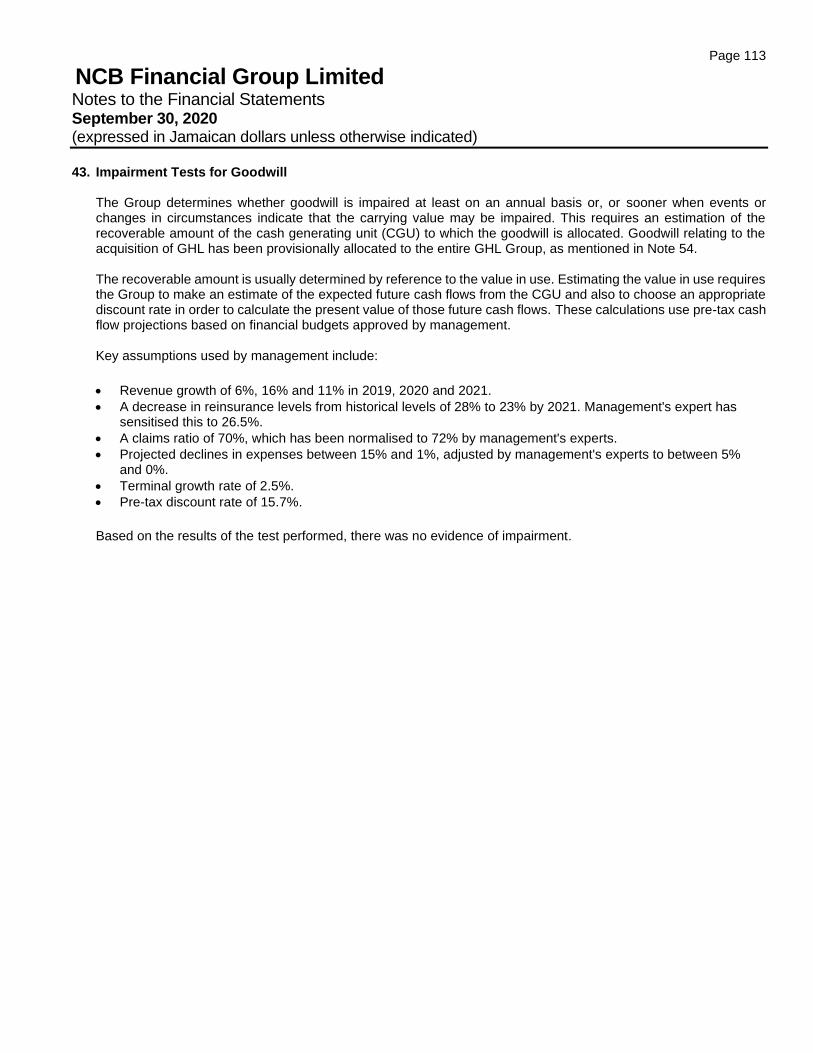
Page 113
NCB Financial Group Limited Notes to the Financial Statements September 30, 2020 (expressed in Jamaican dollars unless otherwise indicated)
43. Impairment Tests for Goodwill
The Group determines whether goodwill is impaired at least on an annual basis or, or sooner when events or changes in circumstances indicate that the carrying value may be impaired. This requires an estimation of the recoverable amount of the cash generating unit (CGU) to which the goodwill is allocated. Goodwill relating to the acquisition of GHL has been provisionally allocated to the entire GHL Group, as mentioned in Note 54. The recoverable amount is usually determined by reference to the value in use. Estimating the value in use requires the Group to make an estimate of the expected future cash flows from the CGU and also to choose an appropriate discount rate in order to calculate the present value of those future cash flows. These calculations use pre-tax cash flow projections based on financial budgets approved by management. Key assumptions used by management include:
• Revenue growth of 6%, 16% and 11% in 2019, 2020 and 2021.
• A decrease in reinsurance levels from historical levels of 28% to 23% by 2021. Management's expert has sensitised this to 26.5%.
• A claims ratio of 70%, which has been normalised to 72% by management's experts.
• Projected declines in expenses between 15% and 1%, adjusted by management's experts to between 5% and 0%.
• Terminal growth rate of 2.5%.
• Pre-tax discount rate of 15.7%.
Based on the results of the test performed, there was no evidence of impairment.
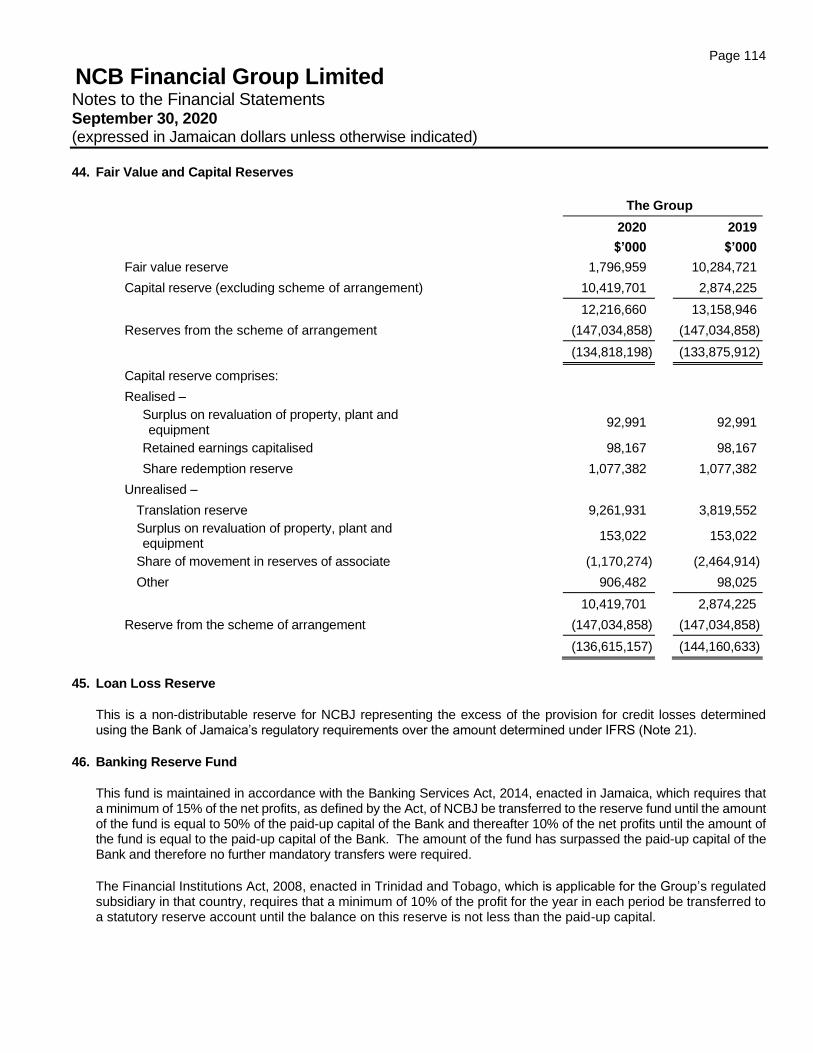
Page 114
NCB Financial Group Limited Notes to the Financial Statements September 30, 2020 (expressed in Jamaican dollars unless otherwise indicated)
44. Fair Value and Capital Reserves
The Group
2020 2019
$’000 $’000
Fair value reserve 1,796,959 10,284,721
Capital reserve (excluding scheme of arrangement) 10,419,701 2,874,225
12,216,660 13,158,946
Reserves from the scheme of arrangement (147,034,858) (147,034,858)
(134,818,198) (133,875,912)
Capital reserve comprises:
Realised –
Surplus on revaluation of property, plant and equipment
92,991 92,991
Retained earnings capitalised 98,167 98,167
Share redemption reserve 1,077,382 1,077,382
Unrealised –
Translation reserve 9,261,931 3,819,552
Surplus on revaluation of property, plant and equipment
153,022 153,022
Share of movement in reserves of associate (1,170,274) (2,464,914)
Other 906,482 98,025
10,419,701 2,874,225
Reserve from the scheme of arrangement (147,034,858) (147,034,858)
(136,615,157) (144,160,633)
45. Loan Loss Reserve
This is a non-distributable reserve for NCBJ representing the excess of the provision for credit losses determined using the Bank of Jamaica’s regulatory requirements over the amount determined under IFRS (Note 21).
46. Banking Reserve Fund
This fund is maintained in accordance with the Banking Services Act, 2014, enacted in Jamaica, which requires that a minimum of 15% of the net profits, as defined by the Act, of NCBJ be transferred to the reserve fund until the amount of the fund is equal to 50% of the paid-up capital of the Bank and thereafter 10% of the net profits until the amount of the fund is equal to the paid-up capital of the Bank. The amount of the fund has surpassed the paid-up capital of the Bank and therefore no further mandatory transfers were required.
The Financial Institutions Act, 2008, enacted in Trinidad and Tobago, which is applicable for the Group’s regulated subsidiary in that country, requires that a minimum of 10% of the profit for the year in each period be transferred to a statutory reserve account until the balance on this reserve is not less than the paid-up capital.
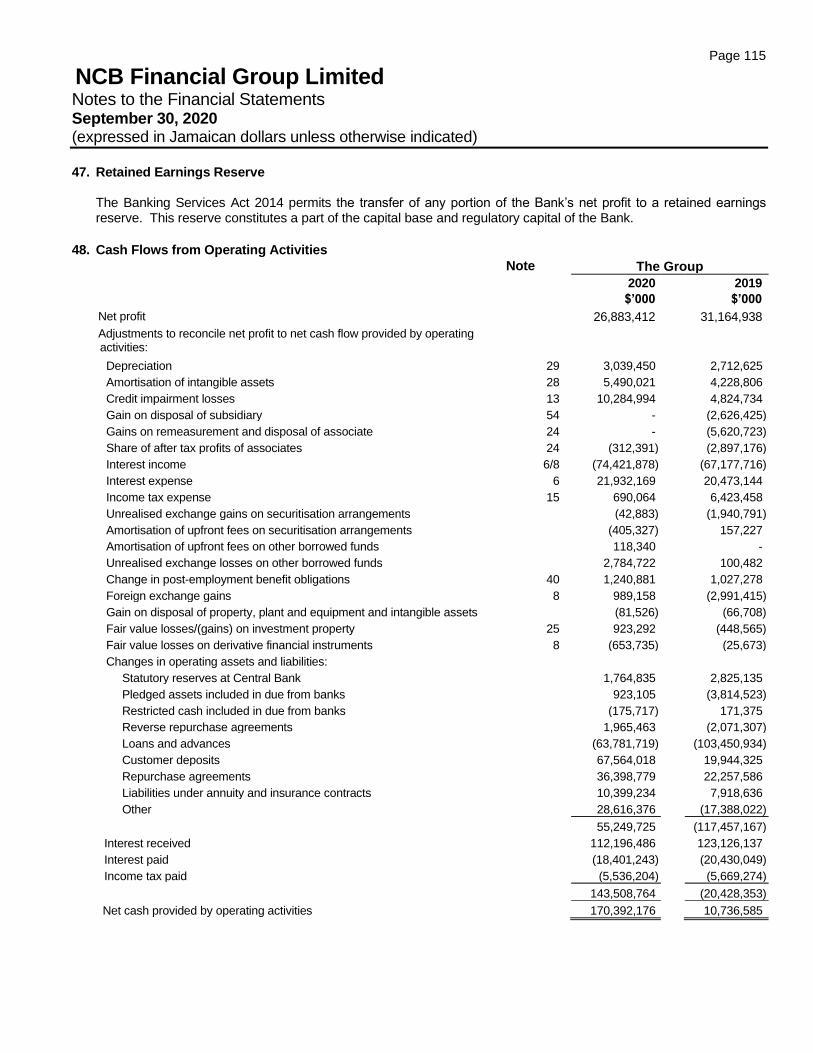
Page 115
NCB Financial Group Limited Notes to the Financial Statements September 30, 2020 (expressed in Jamaican dollars unless otherwise indicated)
47. Retained Earnings Reserve
The Banking Services Act 2014 permits the transfer of any portion of the Bank’s net profit to a retained earnings reserve. This reserve constitutes a part of the capital base and regulatory capital of the Bank.
48. Cash Flows from Operating Activities
Note The Group
2020 2019
$’000 $’000
Net profit 26,883,412 31,164,938
Adjustments to reconcile net profit to net cash flow provided by operating activities:
Depreciation 29 3,039,450 2,712,625
Amortisation of intangible assets 28 5,490,021 4,228,806
Credit impairment losses 13 10,284,994 4,824,734
Gain on disposal of subsidiary 54 - (2,626,425)
Gains on remeasurement and disposal of associate 24 - (5,620,723)
Share of after tax profits of associates 24 (312,391) (2,897,176)
Interest income 6/8 (74,421,878) (67,177,716)
Interest expense 6 21,932,169 20,473,144
Income tax expense 15 690,064 6,423,458
Unrealised exchange gains on securitisation arrangements (42,883) (1,940,791)
Amortisation of upfront fees on securitisation arrangements (405,327) 157,227
Amortisation of upfront fees on other borrowed funds 118,340 -
Unrealised exchange losses on other borrowed funds 2,784,722 100,482
Change in post-employment benefit obligations 40 1,240,881 1,027,278
Foreign exchange gains 8 989,158 (2,991,415)
Gain on disposal of property, plant and equipment and intangible assets (81,526) (66,708)
Fair value losses/(gains) on investment property 25 923,292 (448,565)
Fair value losses on derivative financial instruments 8 (653,735) (25,673)
Changes in operating assets and liabilities:
Statutory reserves at Central Bank 1,764,835 2,825,135
Pledged assets included in due from banks 923,105 (3,814,523)
Restricted cash included in due from banks (175,717) 171,375
Reverse repurchase agreements 1,965,463 (2,071,307)
Loans and advances (63,781,719) (103,450,934)
Customer deposits 67,564,018 19,944,325
Repurchase agreements 36,398,779 22,257,586
Liabilities under annuity and insurance contracts 10,399,234 7,918,636
Other 28,616,376 (17,388,022)
55,249,725 (117,457,167)
Interest received 112,196,486 123,126,137
Interest paid (18,401,243) (20,430,049)
Income tax paid (5,536,204) (5,669,274)
143,508,764 (20,428,353)
Net cash provided by operating activities 170,392,176 10,736,585
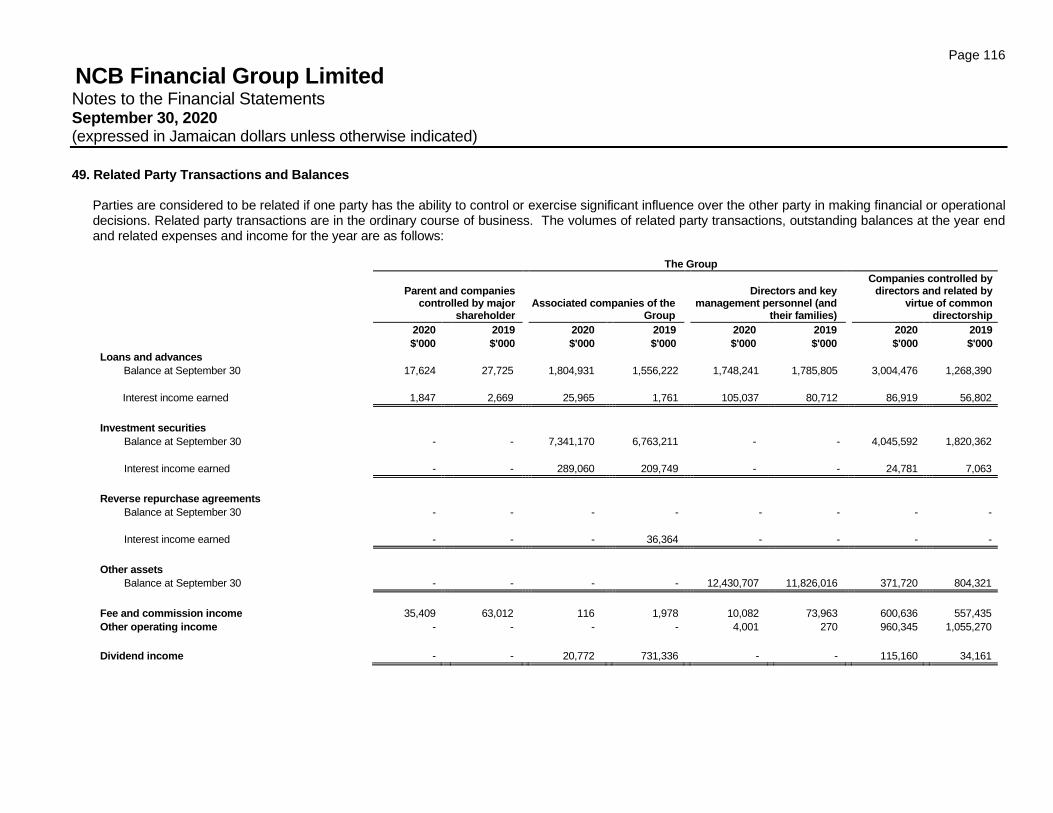
Page 116
NCB Financial Group Limited Notes to the Financial Statements September 30, 2020 (expressed in Jamaican dollars unless otherwise indicated)
49. Related Party Transactions and Balances
Parties are considered to be related if one party has the ability to control or exercise significant influence over the other party in making financial or operational decisions. Related party transactions are in the ordinary course of business. The volumes of related party transactions, outstanding balances at the year end and related expenses and income for the year are as follows:
The Group
Parent and companies controlled by major
shareholder Associated companies of the
Group
Directors and key
management personnel (and their families)
Companies controlled by directors and related by
virtue of common directorship
2020 2019 2020 2019 2020 2019 2020 2019
$'000 $'000 $'000 $'000 $'000 $'000 $'000 $'000
Loans and advances
Balance at September 30 17,624 27,725 1,804,931 1,556,222 1,748,241 1,785,805 3,004,476 1,268,390
Interest income earned 1,847 2,669 25,965 1,761 105,037 80,712 86,919 56,802
Investment securities
Balance at September 30 - - 7,341,170 6,763,211 - - 4,045,592 1,820,362
Interest income earned - - 289,060 209,749 - - 24,781 7,063
Reverse repurchase agreements
Balance at September 30 - - - - - - - -
Interest income earned - - - 36,364 - - - -
Other assets
Balance at September 30 - - - - 12,430,707 11,826,016 371,720 804,321
Fee and commission income 35,409 63,012 116 1,978 10,082 73,963 600,636 557,435
Other operating income - - - - 4,001 270 960,345 1,055,270
Dividend income - - 20,772 731,336 - - 115,160 34,161
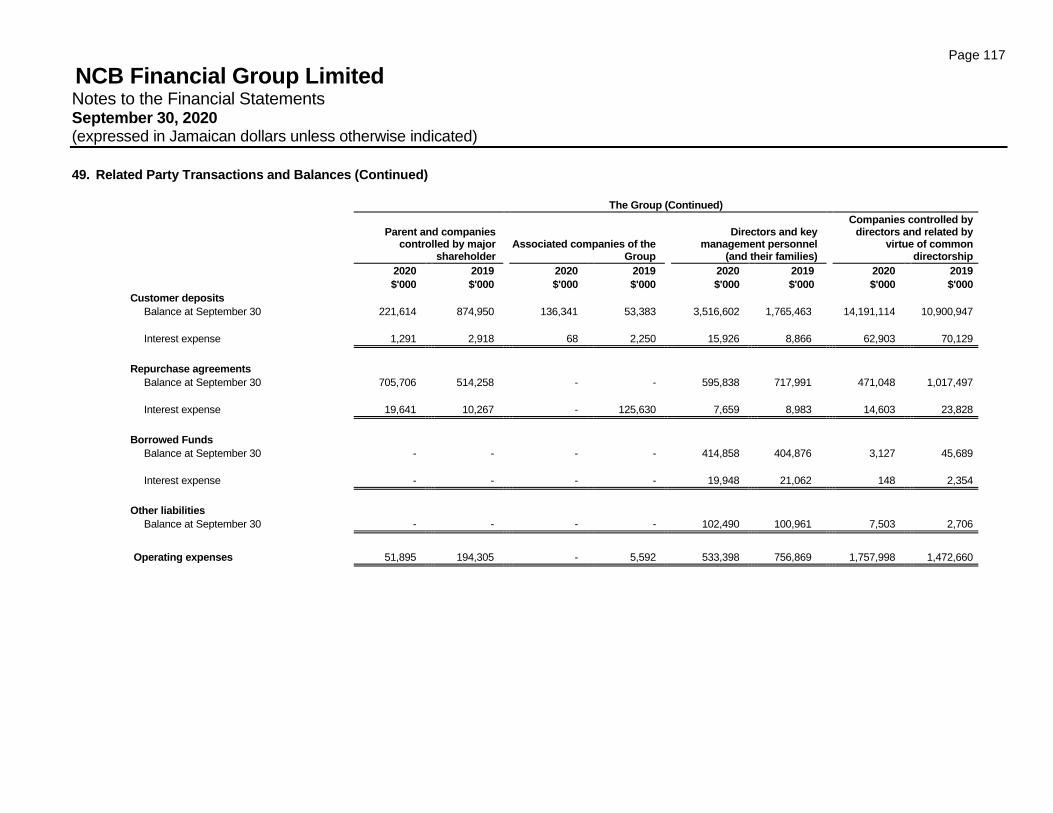
Page 117
NCB Financial Group Limited Notes to the Financial Statements September 30, 2020 (expressed in Jamaican dollars unless otherwise indicated)
49. Related Party Transactions and Balances (Continued)
The Group (Continued)
Parent and companies controlled by major
shareholder Associated companies of the
Group
Directors and key
management personnel (and their families)
Companies controlled by directors and related by
virtue of common directorship
2020 2019 2020 2019 2020 2019 2020 2019
$'000 $'000 $'000 $'000 $'000 $'000 $'000 $'000
Customer deposits
Balance at September 30 221,614 874,950 136,341 53,383 3,516,602 1,765,463 14,191,114 10,900,947
Interest expense 1,291 2,918 68 2,250 15,926 8,866 62,903 70,129
Repurchase agreements
Balance at September 30 705,706 514,258 - - 595,838 717,991 471,048 1,017,497
Interest expense 19,641 10,267 - 125,630 7,659 8,983 14,603 23,828
- - - -
414,858
404,876
3,127 45,689
Borrowed Funds
Balance at September 30
Interest expense - - - - 19,948 21,062 148 2,354
Other liabilities
Balance at September 30 - - - - 102,490 100,961 7,503 2,706
Operating expenses 51,895 194,305 - 5,592 533,398 756,869 1,757,998 1,472,660
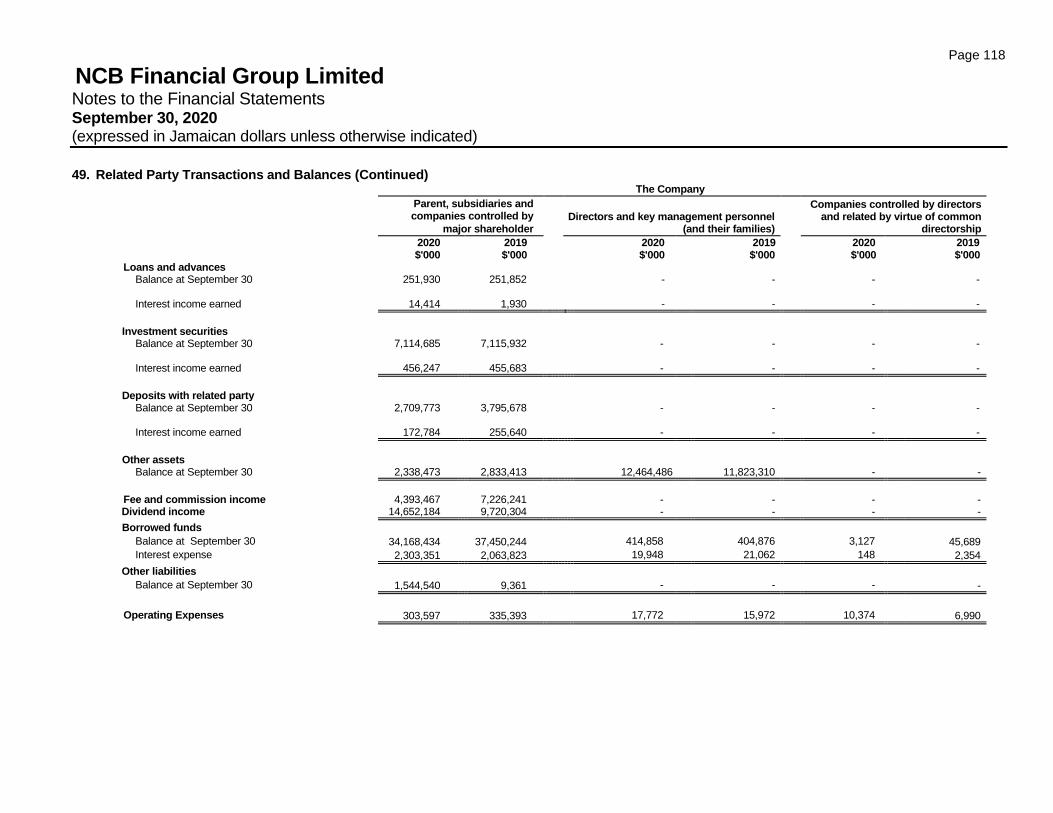
Page 118
NCB Financial Group Limited Notes to the Financial Statements September 30, 2020 (expressed in Jamaican dollars unless otherwise indicated)
49. Related Party Transactions and Balances (Continued) The Company
Parent, subsidiaries and companies controlled by
major shareholder
Directors and key management personnel (and their families)
Companies controlled by directors and related by virtue of common
directorship
2020 2019 2020 2019 2020 2019 $'000 $'000 $'000 $'000 $'000 $'000
Loans and advances Balance at September 30 251,930 251,852 - - - - Interest income earned 14,414 1,930 - - - -
Investment securities
Balance at September 30 7,114,685 7,115,932 - - - - Interest income earned 456,247 455,683 - - - -
Deposits with related party
Balance at September 30 2,709,773 3,795,678 - - - - Interest income earned 172,784 255,640 - - - -
Other assets
Balance at September 30 2,338,473 2,833,413 12,464,486 11,823,310 - -
Fee and commission income 4,393,467 7,226,241 - - - -
Dividend income 14,652,184 9,720,304 - - - -
Borrowed funds
Balance at September 30 34,168,434 37,450,244 414,858 404,876 3,127 45,689
Interest expense 2,303,351 2,063,823 19,948 21,062 148 2,354
Other liabilities
Balance at September 30 1,544,540 9,361 - - - -
Operating Expenses 303,597 335,393 17,772 15,972 10,374 6,990
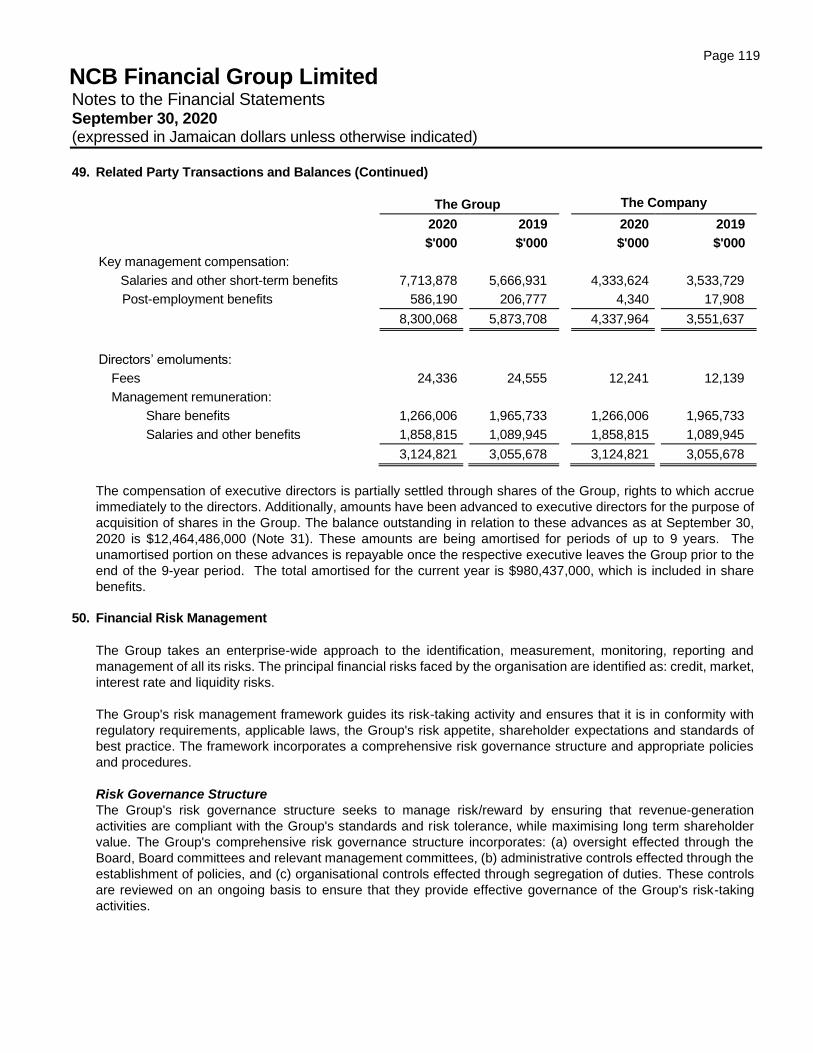
Page 119
NCB Financial Group Limited Notes to the Financial Statements September 30, 2020 (expressed in Jamaican dollars unless otherwise indicated)
49. Related Party Transactions and Balances (Continued)
The Group The Company
2020 2019 2020 2019
$'000 $'000 $'000 $'000
Key management compensation:
Salaries and other short-term benefits 7,713,878 5,666,931 4,333,624 3,533,729
Post-employment benefits 586,190 206,777 4,340 17,908
8,300,068 5,873,708 4,337,964 3,551,637
Directors’ emoluments:
Fees 24,336 24,555 12,241 12,139
Management remuneration:
Share benefits 1,266,006 1,965,733 1,266,006 1,965,733
Salaries and other benefits 1,858,815 1,089,945 1,858,815 1,089,945
3,124,821 3,055,678 3,124,821 3,055,678
The compensation of executive directors is partially settled through shares of the Group, rights to which accrue
immediately to the directors. Additionally, amounts have been advanced to executive directors for the purpose of
acquisition of shares in the Group. The balance outstanding in relation to these advances as at September 30,
2020 is $12,464,486,000 (Note 31). These amounts are being amortised for periods of up to 9 years. The
unamortised portion on these advances is repayable once the respective executive leaves the Group prior to the
end of the 9-year period. The total amortised for the current year is $980,437,000, which is included in share
benefits.
50. Financial Risk Management
The Group takes an enterprise-wide approach to the identification, measurement, monitoring, reporting and
management of all its risks. The principal financial risks faced by the organisation are identified as: credit, market,
interest rate and liquidity risks.
The Group's risk management framework guides its risk-taking activity and ensures that it is in conformity with
regulatory requirements, applicable laws, the Group's risk appetite, shareholder expectations and standards of
best practice. The framework incorporates a comprehensive risk governance structure and appropriate policies
and procedures.
Risk Governance Structure
The Group's risk governance structure seeks to manage risk/reward by ensuring that revenue-generation
activities are compliant with the Group's standards and risk tolerance, while maximising long term shareholder
value. The Group's comprehensive risk governance structure incorporates: (a) oversight effected through the
Board, Board committees and relevant management committees, (b) administrative controls effected through the
establishment of policies, and (c) organisational controls effected through segregation of duties. These controls
are reviewed on an ongoing basis to ensure that they provide effective governance of the Group's risk-taking
activities.
Page 120
NCB Financial Group Limited Notes to the Financial Statements September 30, 2020 (expressed in Jamaican dollars unless otherwise indicated)
50. Financial Risk Management (Continued)
Risk limits and benchmarks are integral to the risk management process, as they characterise the Group's risk
tolerance and conform to regulatory requirements. Limits are established for:
(i) Credit and Counterparty risk - exposures to individuals, groups, counterparty, country;
(ii) Market risk - rate gap exposure, currency exposure, market value exposure; and
(iii) Liquidity risk - liquidity gaps, funding exposures/liability diversification and liquid assets levels.
Limits and benchmarks are monitored on an ongoing basis and reported to the relevant governance committees.
Policies & Procedures
Rigorous policies and operational procedures are established throughout the organisation and are approved by
the relevant management personnel and/or governance committees.
These policies and procedures incorporate requirements for compliance monitoring, maintenance of contingency
plans and the provision of reports to management and the relevant governance committees and/ or the Board of
Directors.
Covid-19 The onslaught of the coronavirus pandemic (COVID 19) caused a contraction in all the economies in which the
Group operates. The spread of the virus and stringent exit and entry protocols weighed on global travel and limited
tourism demand. In addition, the downturn in global demand has also resulted in depressed oil and gas prices.
The confluence of factors would have impacted to varying degrees, government revenue for the major territories.
Our monitoring mechanisms were ramped up maintaining close surveillance of the health crisis, the economic
impact on our major trading partners and the contagion effects.
Our investment portfolios were impacted by the widening of credit spreads and foreign exchange changes which
resulted in significant fall-off in asset prices.
Our Income would have been negatively impacted by waiver or reduction of fees associated with certain loan
facilities and reduction in loan volumes due to contraction in economic activity.
(a) Credit risk
This is defined as potential for loss to the organisation arising from failure of a borrower, guarantor or counterparty to honour their contractual obligations to the Group.
The Group incurs credit and counterparty risk primarily in its loan business, reverse repurchase arrangements, and certain investment activities. There is also credit risk in off-statement of financial position financial instruments, such as loan commitments. Credit risk management is facilitated by a cadre of loans officers and credit risk personnel, who together operate within a control framework which employs a hierarchical level of authorisations for transactions that expose the organisation to credit risk. Operating practices include the establishment of limits, ongoing monitoring of credit risk exposures, a disciplined approach to provisioning and loan loss evaluation in addition to ongoing reporting of portfolio exposures to the relevant governance committees and the regulators. Credit risk arising from derivative financial instruments is, at any time, limited to those with positive fair values, as recorded in the statement of financial position.
Page 121
NCB Financial Group Limited Notes to the Financial Statements September 30, 2020 (expressed in Jamaican dollars unless otherwise indicated)
50. Financial Risk Management (Continued)
(a) Credit risk (continued) Credit-related commitment risks arise from guarantees which may require payment on behalf of customers. Such payments are collected from customers based on the terms of the letters of credit. They expose the Group to risks similar to loans and these are mitigated by the same control policies and processes.
Covid-19 Arising from our surveillance, we recognized that our borrowing customers would have experienced
significant fallout which could result in increased credit losses for the Group. To assist our customers, there
were extensions of moratoriums, payment deferrals and other accommodative activities which impacted
approximately twenty-five percent of the Group’s loan portfolio and this had a positive impact on the
delinquency levels of our credit portfolios. Despite the positive trends observed, we did make significant
adjustments to our ECLs to recognize the increased credit risk associated with the environments. Increased
ECLS were also effected for our investment portfolios, which are heavily comprised of sovereign debt.
Credit review process The Group has established a credit quality review process involving regular analysis of the ability of borrowers and other counterparties to meet interest and capital repayment obligations. The Group employs the following classifications in assessing its exposures to its borrowing customers. The classifications are in line with the Jamaican Central Bank regulations.
Standard
Special Mention
Sub-Standard
Doubtful
Loss Exposure to credit risk is mitigated by the taking of financial or physical assets.
Collateral and other credit enhancements The amount and type of collateral required depend on an assessment of the credit risk of the counterparty. Guidelines are implemented regarding the acceptability of different types of collateral.
The main types of collateral obtained are as follows:
(i) Loans - mortgages over residential properties, charges over business assets such as premises,
inventory and accounts receivable and charges over financial instruments such as debt securities.
(ii) Securities lending and reverse repurchase transactions – cash or securities.
The Group may also obtain guarantees from parent companies for loans to their subsidiaries.
Collateral values are monitored with a view to requesting additional collateral where market values are compromised or the terms in the loan agreements dictate. The Group closely monitors collateral held for financial assets considered to be credit-impaired, as it becomes more likely that the Group will take possession of collateral to mitigate potential credit losses. Financial assets that are credit-impaired and related collateral held in order to mitigate potential losses are shown below.
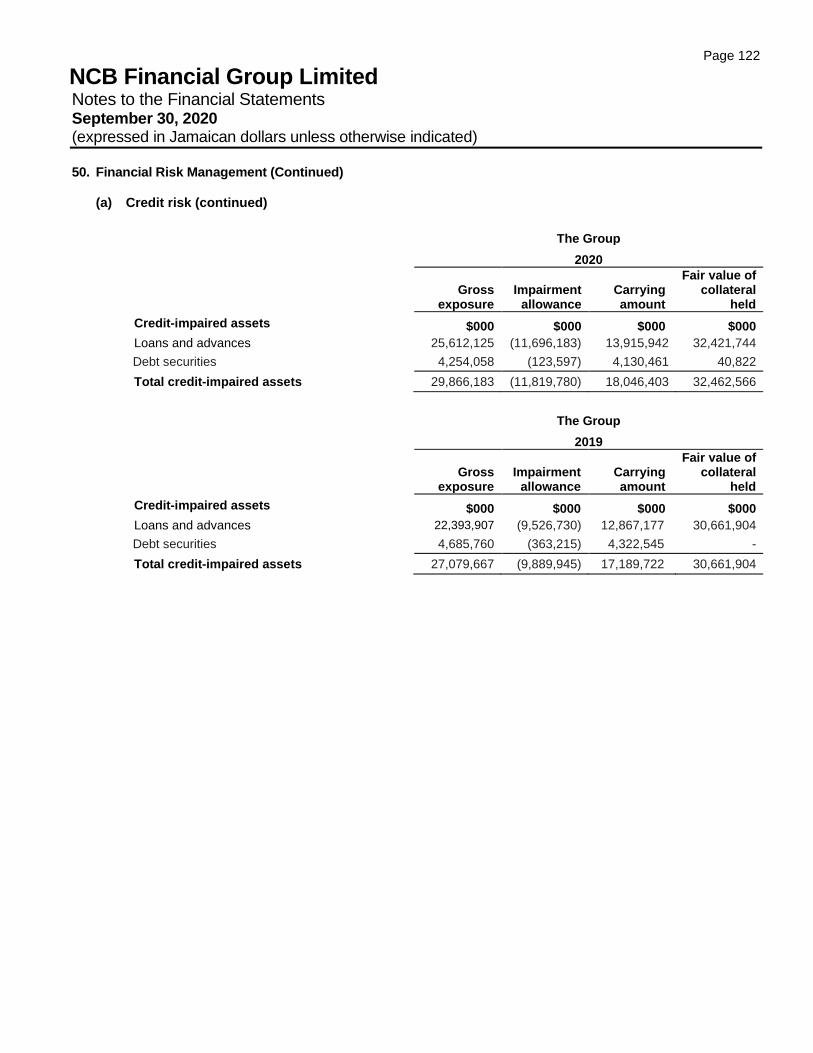
Page 122
NCB Financial Group Limited Notes to the Financial Statements September 30, 2020 (expressed in Jamaican dollars unless otherwise indicated)
50. Financial Risk Management (Continued)
(a) Credit risk (continued)
The Group
2020
Gross
exposure Impairment
allowance Carrying amount
Fair value of collateral
held
Credit-impaired assets $000 $000 $000 $000
Loans and advances 25,612,125 (11,696,183) 13,915,942 32,421,744
Debt securities 4,254,058 (123,597) 4,130,461 40,822
Total credit-impaired assets 29,866,183 (11,819,780) 18,046,403 32,462,566
The Group
2019
Gross
exposure Impairment
allowance Carrying amount
Fair value of collateral
held
Credit-impaired assets $000 $000 $000 $000
Loans and advances 22,393,907 (9,526,730) 12,867,177 30,661,904
Debt securities 4,685,760 (363,215) 4,322,545 -
Total credit-impaired assets 27,079,667 (9,889,945) 17,189,722 30,661,904
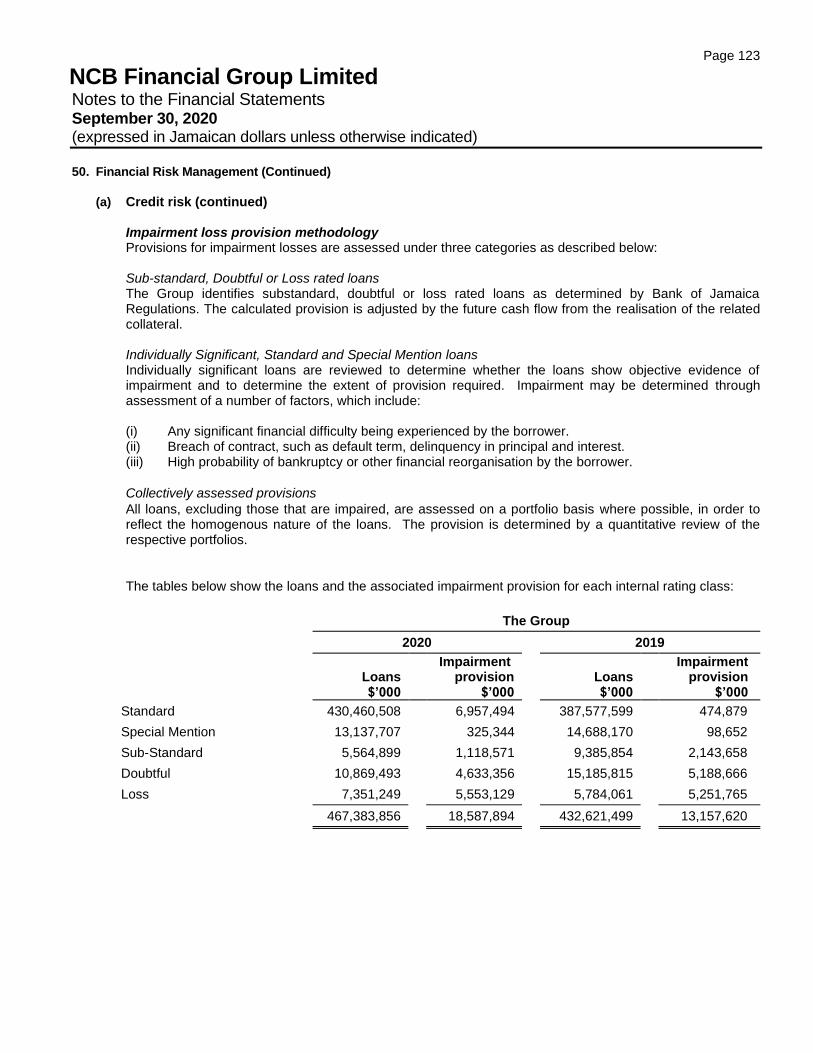
Page 123
NCB Financial Group Limited Notes to the Financial Statements September 30, 2020 (expressed in Jamaican dollars unless otherwise indicated)
50. Financial Risk Management (Continued)
(a) Credit risk (continued) Impairment loss provision methodology Provisions for impairment losses are assessed under three categories as described below: Sub-standard, Doubtful or Loss rated loans The Group identifies substandard, doubtful or loss rated loans as determined by Bank of Jamaica Regulations. The calculated provision is adjusted by the future cash flow from the realisation of the related collateral. Individually Significant, Standard and Special Mention loans Individually significant loans are reviewed to determine whether the loans show objective evidence of impairment and to determine the extent of provision required. Impairment may be determined through assessment of a number of factors, which include: (i) Any significant financial difficulty being experienced by the borrower. (ii) Breach of contract, such as default term, delinquency in principal and interest. (iii) High probability of bankruptcy or other financial reorganisation by the borrower.
Collectively assessed provisions
All loans, excluding those that are impaired, are assessed on a portfolio basis where possible, in order to reflect the homogenous nature of the loans. The provision is determined by a quantitative review of the respective portfolios.
The tables below show the loans and the associated impairment provision for each internal rating class:
The Group
2020 2019
Loans $’000
Impairment
provision $’000
Loans $’000
Impairment
provision $’000
Standard 430,460,508 6,957,494 387,577,599 474,879
Special Mention 13,137,707 325,344 14,688,170 98,652
Sub-Standard 5,564,899 1,118,571 9,385,854 2,143,658
Doubtful 10,869,493 4,633,356 15,185,815 5,188,666
Loss 7,351,249 5,553,129 5,784,061 5,251,765
467,383,856 18,587,894 432,621,499 13,157,620
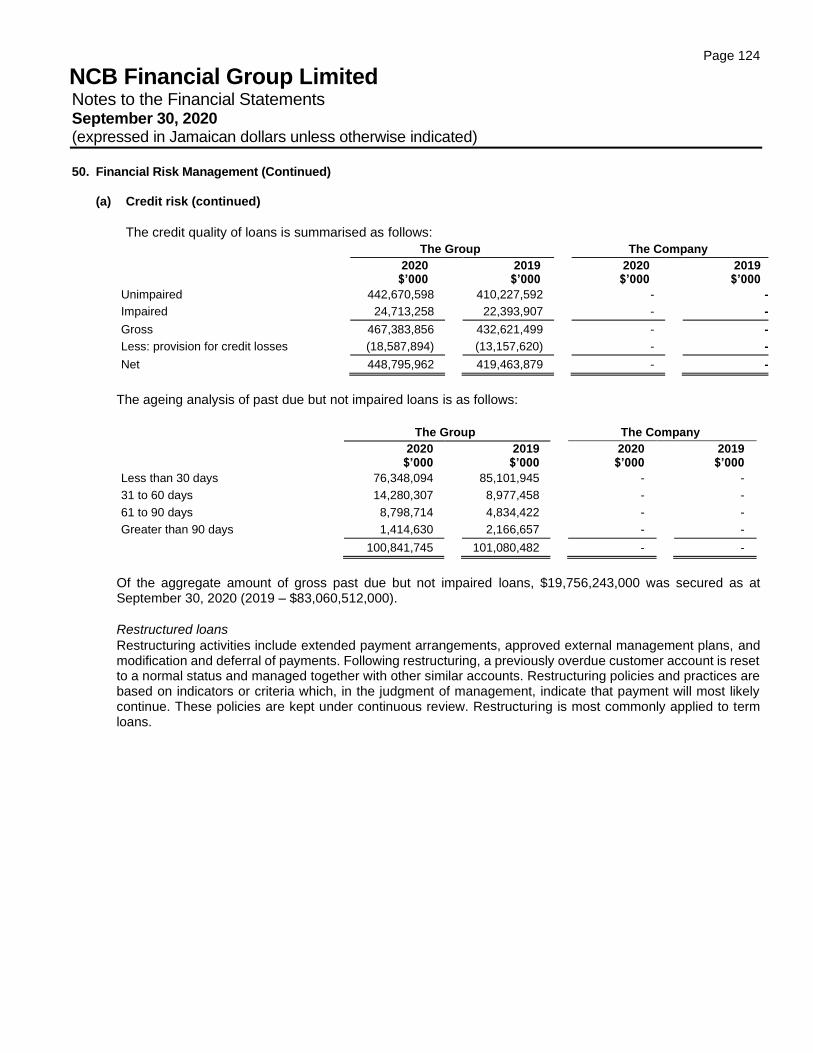
Page 124
NCB Financial Group Limited Notes to the Financial Statements September 30, 2020 (expressed in Jamaican dollars unless otherwise indicated)
50. Financial Risk Management (Continued)
(a) Credit risk (continued)
The credit quality of loans is summarised as follows:
The Group The Company
2020
$’000
2019 $’000
2020
$’000 2019
$’000
Unimpaired 442,670,598 410,227,592 - -
Impaired 24,713,258 22,393,907 - -
Gross 467,383,856 432,621,499 - -
Less: provision for credit losses (18,587,894) (13,157,620) - -
Net 448,795,962 419,463,879 - -
The ageing analysis of past due but not impaired loans is as follows:
The Group The Company
2020
$’000
2019 $’000
2020
$’000 2019
$’000
Less than 30 days 76,348,094 85,101,945 - -
31 to 60 days 14,280,307 8,977,458 - -
61 to 90 days 8,798,714 4,834,422 - -
Greater than 90 days 1,414,630 2,166,657 - -
100,841,745 101,080,482 - -
Of the aggregate amount of gross past due but not impaired loans, $19,756,243,000 was secured as at September 30, 2020 (2019 – $83,060,512,000).
Restructured loans
Restructuring activities include extended payment arrangements, approved external management plans, and modification and deferral of payments. Following restructuring, a previously overdue customer account is reset to a normal status and managed together with other similar accounts. Restructuring policies and practices are based on indicators or criteria which, in the judgment of management, indicate that payment will most likely continue. These policies are kept under continuous review. Restructuring is most commonly applied to term loans.
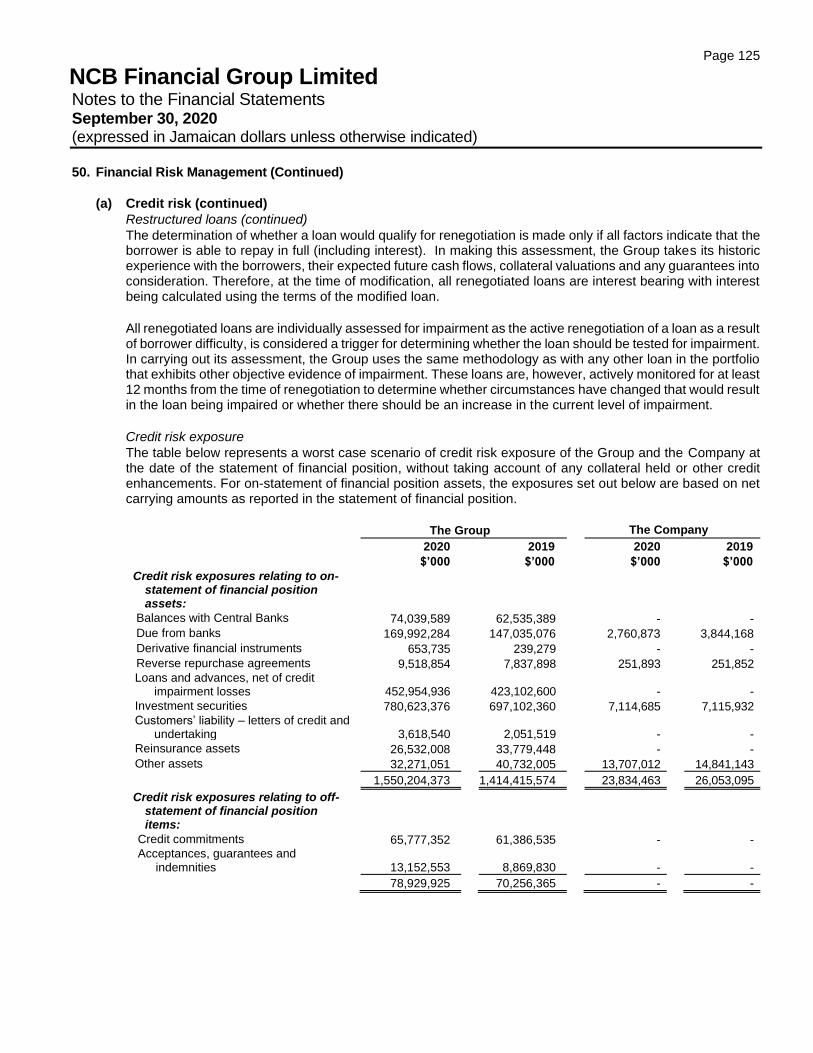
Page 125
NCB Financial Group Limited Notes to the Financial Statements September 30, 2020 (expressed in Jamaican dollars unless otherwise indicated)
50. Financial Risk Management (Continued)
(a) Credit risk (continued)
Restructured loans (continued)
The determination of whether a loan would qualify for renegotiation is made only if all factors indicate that the borrower is able to repay in full (including interest). In making this assessment, the Group takes its historic experience with the borrowers, their expected future cash flows, collateral valuations and any guarantees into consideration. Therefore, at the time of modification, all renegotiated loans are interest bearing with interest being calculated using the terms of the modified loan.
All renegotiated loans are individually assessed for impairment as the active renegotiation of a loan as a result of borrower difficulty, is considered a trigger for determining whether the loan should be tested for impairment. In carrying out its assessment, the Group uses the same methodology as with any other loan in the portfolio that exhibits other objective evidence of impairment. These loans are, however, actively monitored for at least 12 months from the time of renegotiation to determine whether circumstances have changed that would result in the loan being impaired or whether there should be an increase in the current level of impairment.
Credit risk exposure
The table below represents a worst case scenario of credit risk exposure of the Group and the Company at the date of the statement of financial position, without taking account of any collateral held or other credit enhancements. For on-statement of financial position assets, the exposures set out below are based on net carrying amounts as reported in the statement of financial position.
The Group The Company
2020 2019 2020 2019
$’000 $’000 $’000 $’000
Credit risk exposures relating to on- statement of financial position assets:
Balances with Central Banks 74,039,589 62,535,389 - -
Due from banks 169,992,284 147,035,076 2,760,873 3,844,168
Derivative financial instruments 653,735 239,279 - -
Reverse repurchase agreements 9,518,854 7,837,898 251,893 251,852 Loans and advances, net of credit
impairment losses 452,954,936
423,102,600
-
-
Investment securities 780,623,376 697,102,360 7,114,685 7,115,932 Customers’ liability – letters of credit and
undertaking 3,618,540
2,051,519
-
-
Reinsurance assets 26,532,008 33,779,448 - -
Other assets 32,271,051 40,732,005 13,707,012 14,841,143
1,550,204,373 1,414,415,574 23,834,463 26,053,095
Credit risk exposures relating to off- statement of financial position items:
Credit commitments 65,777,352 61,386,535 - - Acceptances, guarantees and
indemnities 13,152,553
8,869,830
-
-
78,929,925 70,256,365 - -
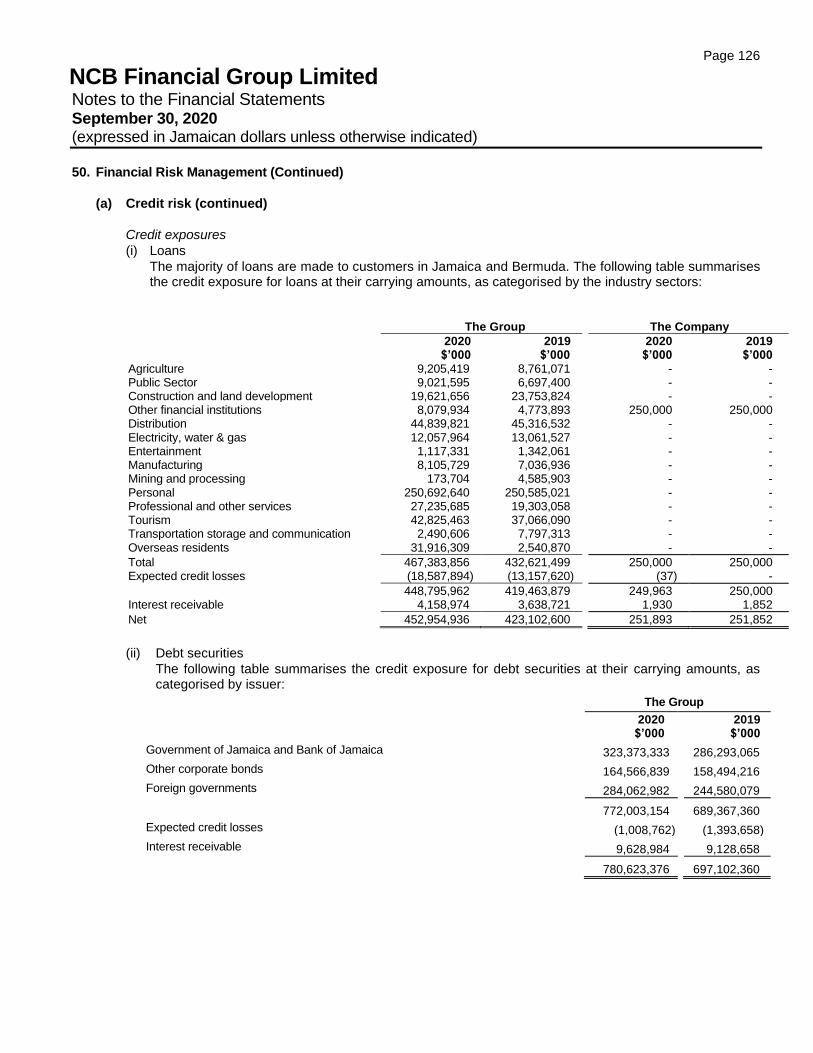
Page 126
NCB Financial Group Limited Notes to the Financial Statements September 30, 2020 (expressed in Jamaican dollars unless otherwise indicated)
50. Financial Risk Management (Continued)
(a) Credit risk (continued)
Credit exposures
(i) Loans
The majority of loans are made to customers in Jamaica and Bermuda. The following table summarises the credit exposure for loans at their carrying amounts, as categorised by the industry sectors:
The Group The Company
2020
$’000 2019
$’000 2020
$’000 2019
$’000 Agriculture 9,205,419 8,761,071 - - Public Sector 9,021,595 6,697,400 - - Construction and land development 19,621,656 23,753,824 - - Other financial institutions 8,079,934 4,773,893 250,000 250,000 Distribution 44,839,821 45,316,532 - - Electricity, water & gas 12,057,964 13,061,527 - - Entertainment 1,117,331 1,342,061 - - Manufacturing 8,105,729 7,036,936 - - Mining and processing 173,704 4,585,903 - - Personal 250,692,640 250,585,021 - - Professional and other services 27,235,685 19,303,058 - - Tourism 42,825,463 37,066,090 - - Transportation storage and communication 2,490,606 7,797,313 - - Overseas residents 31,916,309 2,540,870 - -
Total 467,383,856 432,621,499 250,000 250,000 Expected credit losses (18,587,894) (13,157,620) (37) -
448,795,962 419,463,879 249,963 250,000 Interest receivable 4,158,974 3,638,721 1,930 1,852
Net 452,954,936 423,102,600 251,893 251,852
(ii) Debt securities
The following table summarises the credit exposure for debt securities at their carrying amounts, as categorised by issuer:
The Group
2020
$’000
2019 $’000
Government of Jamaica and Bank of Jamaica 323,373,333 286,293,065
Other corporate bonds 164,566,839 158,494,216
Foreign governments 284,062,982 244,580,079
772,003,154 689,367,360
Expected credit losses (1,008,762) (1,393,658)
Interest receivable 9,628,984 9,128,658
780,623,376 697,102,360
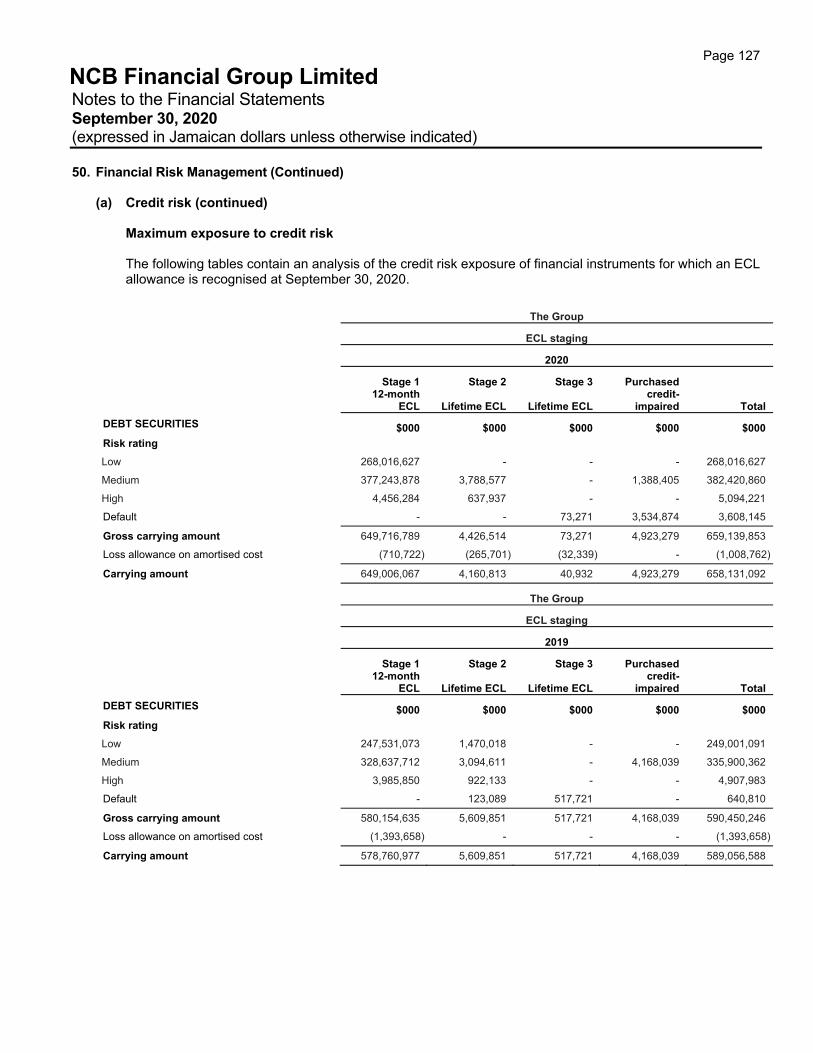
Page 127
NCB Financial Group Limited Notes to the Financial Statements September 30, 2020 (expressed in Jamaican dollars unless otherwise indicated)
50. Financial Risk Management (Continued)
(a) Credit risk (continued)
Maximum exposure to credit risk The following tables contain an analysis of the credit risk exposure of financial instruments for which an ECL allowance is recognised at September 30, 2020.
The Group
ECL staging
2020
Stage 1 Stage 2 Stage 3 Purchased 12-month
ECL Lifetime ECL Lifetime ECL credit-
impaired Total
DEBT SECURITIES $000 $000 $000 $000 $000
Risk rating
Low 268,016,627 - - - 268,016,627
Medium 377,243,878 3,788,577 - 1,388,405 382,420,860
High 4,456,284 637,937 - - 5,094,221
Default - - 73,271 3,534,874 3,608,145
Gross carrying amount 649,716,789 4,426,514 73,271 4,923,279 659,139,853
Loss allowance on amortised cost (710,722) (265,701) (32,339) - (1,008,762)
Carrying amount 649,006,067 4,160,813 40,932 4,923,279 658,131,092
The Group
ECL staging
2019
Stage 1 Stage 2 Stage 3 Purchased 12-month
ECL Lifetime ECL Lifetime ECL credit-
impaired Total
DEBT SECURITIES $000 $000 $000 $000 $000
Risk rating
Low 247,531,073 1,470,018 - - 249,001,091
Medium 328,637,712 3,094,611 - 4,168,039 335,900,362
High 3,985,850 922,133 - - 4,907,983
Default - 123,089 517,721 - 640,810
Gross carrying amount 580,154,635 5,609,851 517,721 4,168,039 590,450,246
Loss allowance on amortised cost (1,393,658) - - - (1,393,658)
Carrying amount 578,760,977 5,609,851 517,721 4,168,039 589,056,588
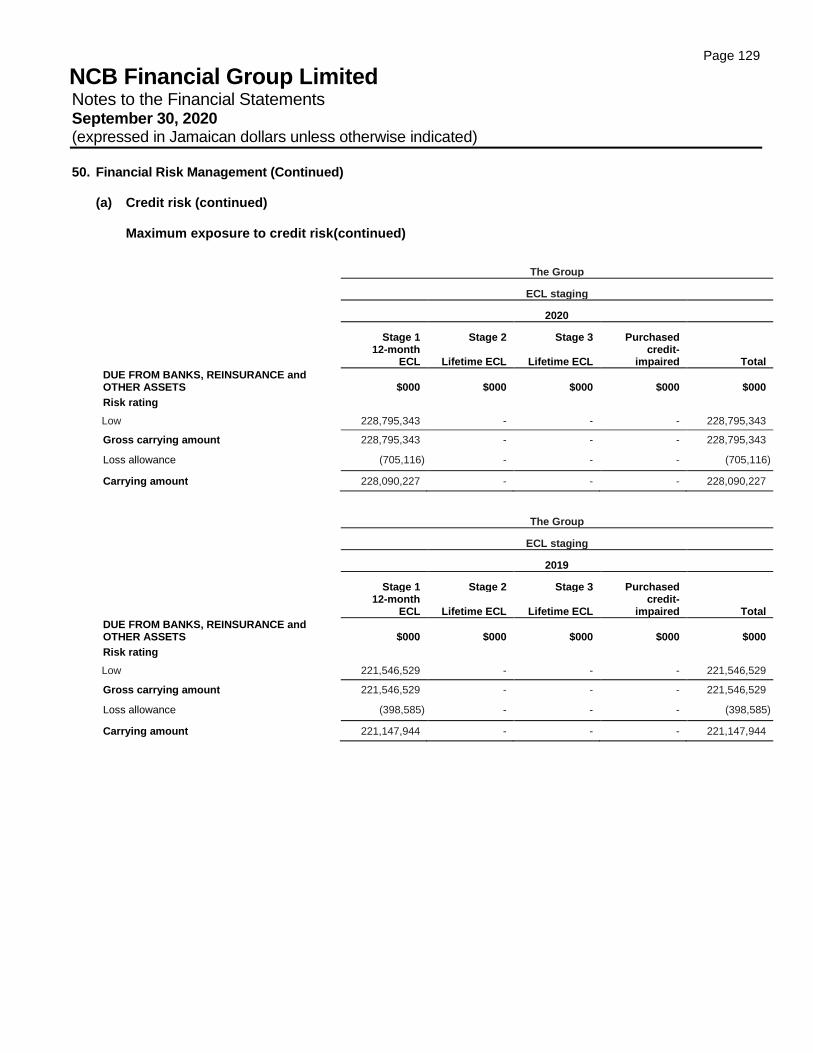
Page 129
NCB Financial Group Limited Notes to the Financial Statements September 30, 2020 (expressed in Jamaican dollars unless otherwise indicated)
50. Financial Risk Management (Continued) (a) Credit risk (continued)
Maximum exposure to credit risk(continued)
The Group
ECL staging
2020
Stage 1 Stage 2 Stage 3 Purchased 12-month
ECL Lifetime ECL Lifetime ECL credit-
impaired Total
DUE FROM BANKS, REINSURANCE and OTHER ASSETS $000 $000 $000 $000 $000
Risk rating
Low 228,795,343 - - - 228,795,343
Gross carrying amount 228,795,343 - - - 228,795,343
Loss allowance (705,116) - - - (705,116)
Carrying amount 228,090,227 - - - 228,090,227
The Group
ECL staging
2019
Stage 1 Stage 2 Stage 3 Purchased 12-month
ECL Lifetime ECL Lifetime ECL credit-
impaired Total
DUE FROM BANKS, REINSURANCE and OTHER ASSETS $000 $000 $000 $000 $000
Risk rating
Low 221,546,529 - - - 221,546,529
Gross carrying amount 221,546,529 - - - 221,546,529
Loss allowance (398,585) - - - (398,585)
Carrying amount 221,147,944 - - - 221,147,944
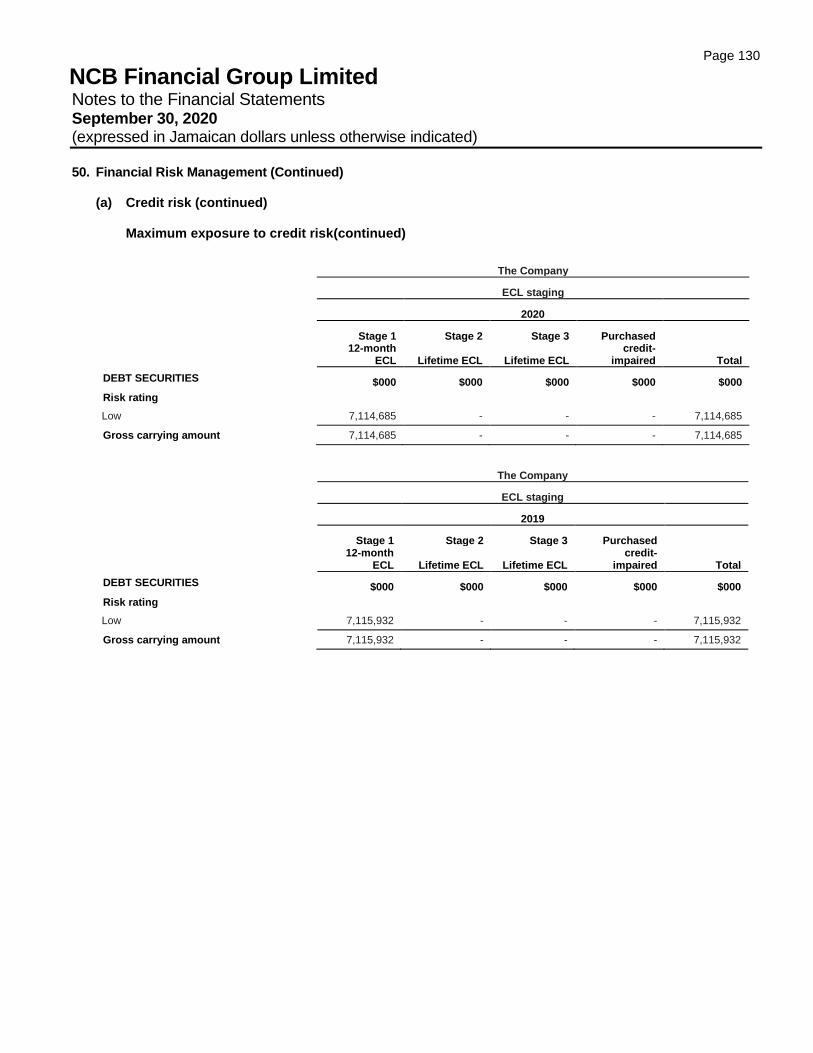
Page 130
NCB Financial Group Limited Notes to the Financial Statements September 30, 2020 (expressed in Jamaican dollars unless otherwise indicated)
50. Financial Risk Management (Continued) (a) Credit risk (continued)
Maximum exposure to credit risk(continued)
The Company
ECL staging
2020
Stage 1 Stage 2 Stage 3 Purchased 12-month
ECL Lifetime ECL Lifetime ECL credit-
impaired Total
DEBT SECURITIES $000 $000 $000 $000 $000
Risk rating
Low 7,114,685 - - - 7,114,685
Gross carrying amount 7,114,685 - - - 7,114,685
The Company
ECL staging
2019
Stage 1 Stage 2 Stage 3 Purchased 12-month
ECL Lifetime ECL Lifetime ECL credit-
impaired Total
DEBT SECURITIES $000 $000 $000 $000 $000
Risk rating
Low 7,115,932 - - - 7,115,932
Gross carrying amount 7,115,932 - - - 7,115,932
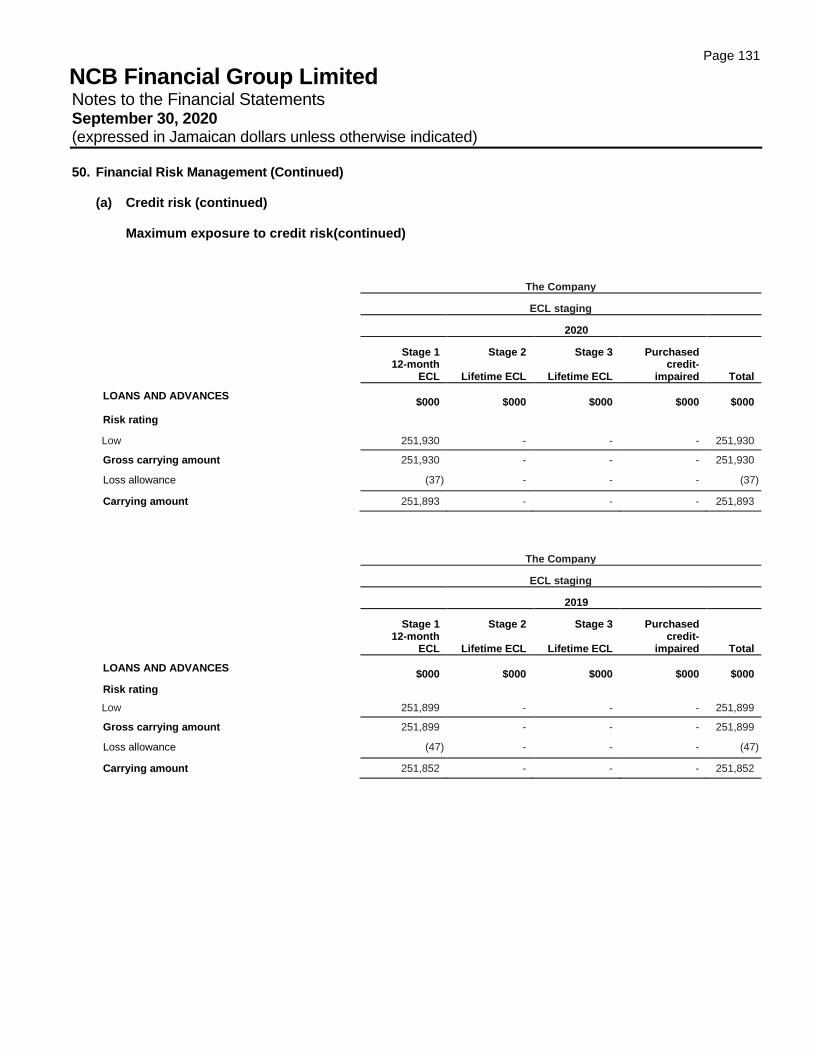
Page 131
NCB Financial Group Limited Notes to the Financial Statements September 30, 2020 (expressed in Jamaican dollars unless otherwise indicated)
50. Financial Risk Management (Continued) (a) Credit risk (continued)
Maximum exposure to credit risk(continued)
The Company
ECL staging
2020
Stage 1 Stage 2 Stage 3 Purchased 12-month
ECL Lifetime ECL Lifetime ECL credit-
impaired Total
LOANS AND ADVANCES $000 $000 $000 $000
$000
Risk rating
Low 251,930 - - - 251,930
Gross carrying amount 251,930 - - - 251,930
Loss allowance (37) - - - (37)
Carrying amount 251,893 - - - 251,893
The Company
ECL staging
2019
Stage 1 Stage 2 Stage 3 Purchased 12-month
ECL Lifetime ECL Lifetime ECL credit-
impaired Total
LOANS AND ADVANCES $000 $000 $000 $000
$000
Risk rating
Low 251,899 - - - 251,899
Gross carrying amount 251,899 - - - 251,899
Loss allowance (47) - - - (47)
Carrying amount 251,852 - - - 251,852

Page 132
NCB Financial Group Limited Notes to the Financial Statements September 30, 2020 (expressed in Jamaican dollars unless otherwise indicated)
50. Financial Risk Management (Continued) (a) Credit risk (continued)
Maximum exposure to credit risk(continued)
The Company
ECL staging
2020
Stage 1 Stage 2 Stage 3 Purchased 12-month
ECL Lifetime ECL Lifetime ECL credit-
impaired Total
DUE FROM BANKS, REINSURANCE and OTHER ASSETS $000 $000 $000 $000 $000
Risk rating
Low 16,467,884 - - - 16,467,884
Gross carrying amount 16,467,884 - - - 16,467,884
Loss allowance - - - - -
Carrying amount 16,467,884 - - - 16,467,884
The Company
ECL staging
2019
Stage 1 Stage 2 Stage 3 Purchased 12-month
ECL Lifetime ECL Lifetime ECL credit-
impaired Total
DUE FROM BANKS, REINSURANCE and OTHER ASSETS $000 $000 $000 $000 $000
Risk rating
Low 18,685,340 - - - 18,685,340
Gross carrying amount 18,685,340 - - - 18,685,340
Loss allowance (29) - - - (29)
Carrying amount 18,685,311 - - - 18,685,311
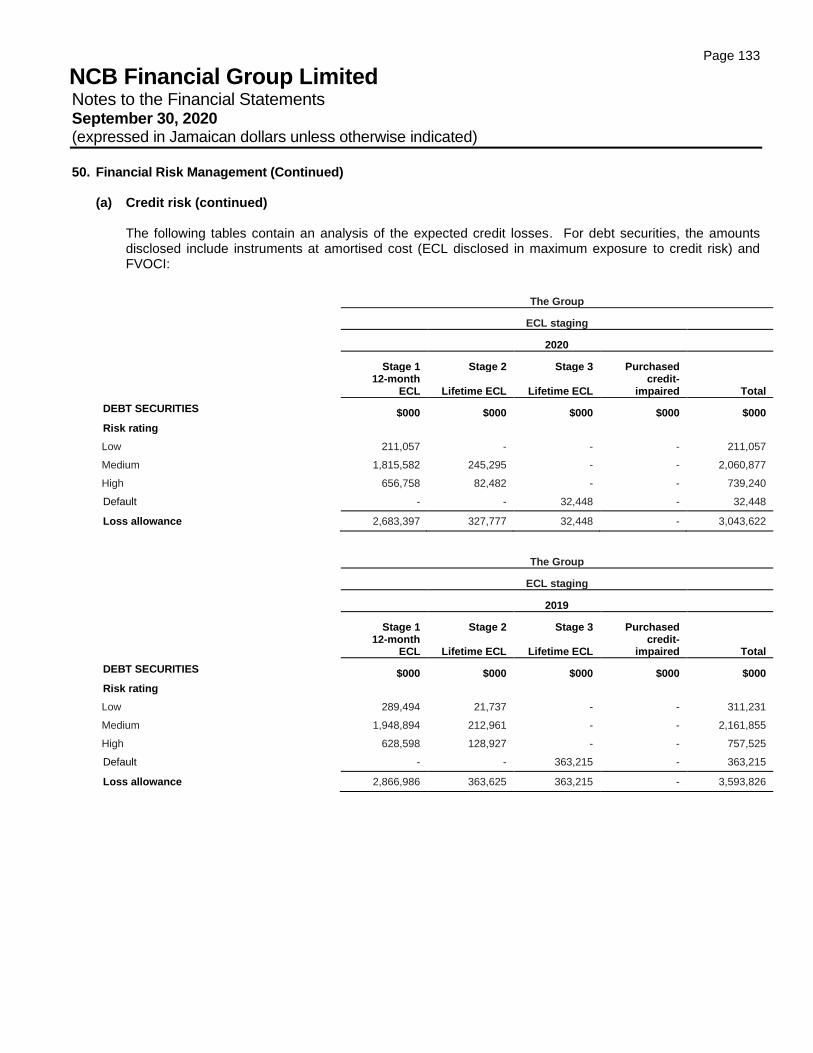
Page 133
NCB Financial Group Limited Notes to the Financial Statements September 30, 2020 (expressed in Jamaican dollars unless otherwise indicated)
50. Financial Risk Management (Continued) (a) Credit risk (continued)
The following tables contain an analysis of the expected credit losses. For debt securities, the amounts disclosed include instruments at amortised cost (ECL disclosed in maximum exposure to credit risk) and FVOCI:
The Group
ECL staging
2020
Stage 1 Stage 2 Stage 3 Purchased 12-month
ECL Lifetime ECL Lifetime ECL credit-
impaired Total
DEBT SECURITIES $000 $000 $000 $000 $000
Risk rating
Low 211,057 - - - 211,057
Medium 1,815,582 245,295 - - 2,060,877
High 656,758 82,482 - - 739,240
Default - - 32,448 - 32,448
Loss allowance 2,683,397 327,777 32,448 - 3,043,622
The Group
ECL staging
2019
Stage 1 Stage 2 Stage 3 Purchased 12-month
ECL Lifetime ECL Lifetime ECL credit-
impaired Total
DEBT SECURITIES $000 $000 $000 $000 $000
Risk rating
Low 289,494 21,737 - - 311,231
Medium 1,948,894 212,961 - - 2,161,855
High 628,598 128,927 - - 757,525
Default - - 363,215 - 363,215
Loss allowance 2,866,986 363,625 363,215 - 3,593,826
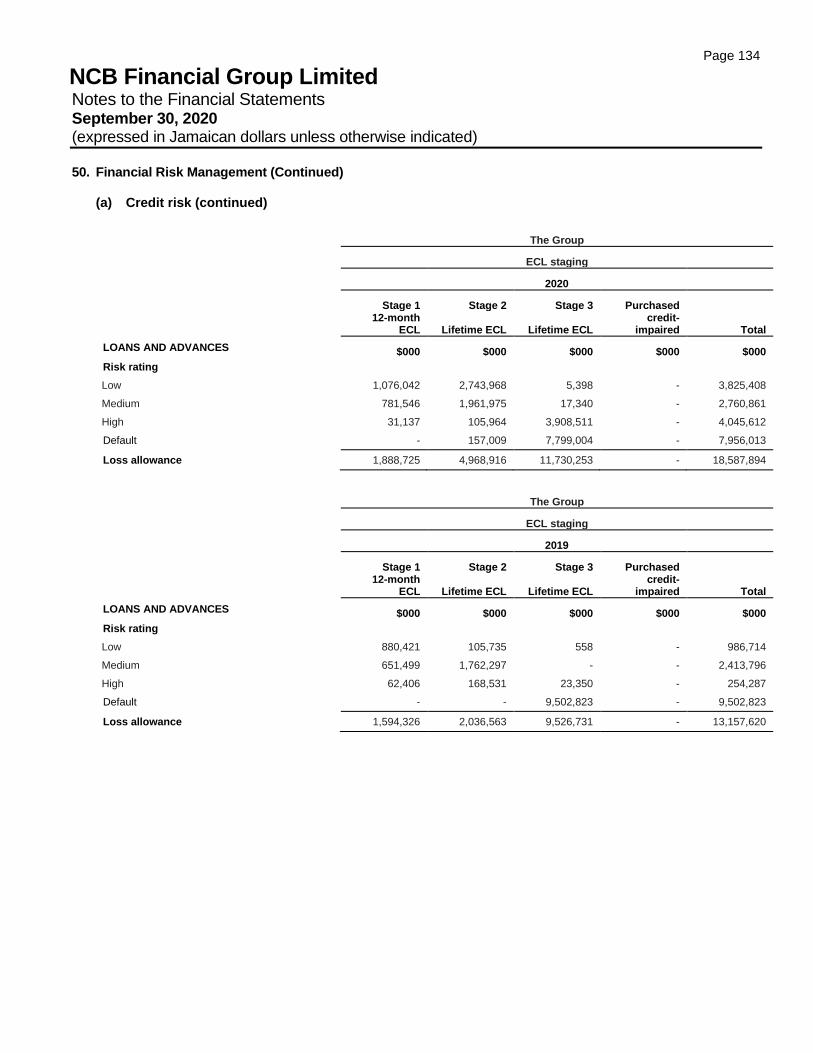
Page 134
NCB Financial Group Limited Notes to the Financial Statements September 30, 2020 (expressed in Jamaican dollars unless otherwise indicated)
50. Financial Risk Management (Continued)
(a) Credit risk (continued)
The Group
ECL staging
2020
Stage 1 Stage 2 Stage 3 Purchased 12-month
ECL Lifetime ECL Lifetime ECL credit-
impaired Total
LOANS AND ADVANCES $000 $000 $000 $000 $000
Risk rating
Low 1,076,042 2,743,968 5,398 - 3,825,408
Medium 781,546 1,961,975 17,340 - 2,760,861
High 31,137 105,964 3,908,511 - 4,045,612
Default - 157,009 7,799,004 - 7,956,013
Loss allowance 1,888,725 4,968,916 11,730,253 - 18,587,894
The Group
ECL staging
2019
Stage 1 Stage 2 Stage 3 Purchased 12-month
ECL Lifetime ECL Lifetime ECL credit-
impaired Total
LOANS AND ADVANCES $000 $000 $000 $000 $000
Risk rating
Low 880,421 105,735 558 - 986,714
Medium 651,499 1,762,297 - - 2,413,796
High 62,406 168,531 23,350 - 254,287
Default - - 9,502,823 - 9,502,823
Loss allowance 1,594,326 2,036,563 9,526,731 - 13,157,620
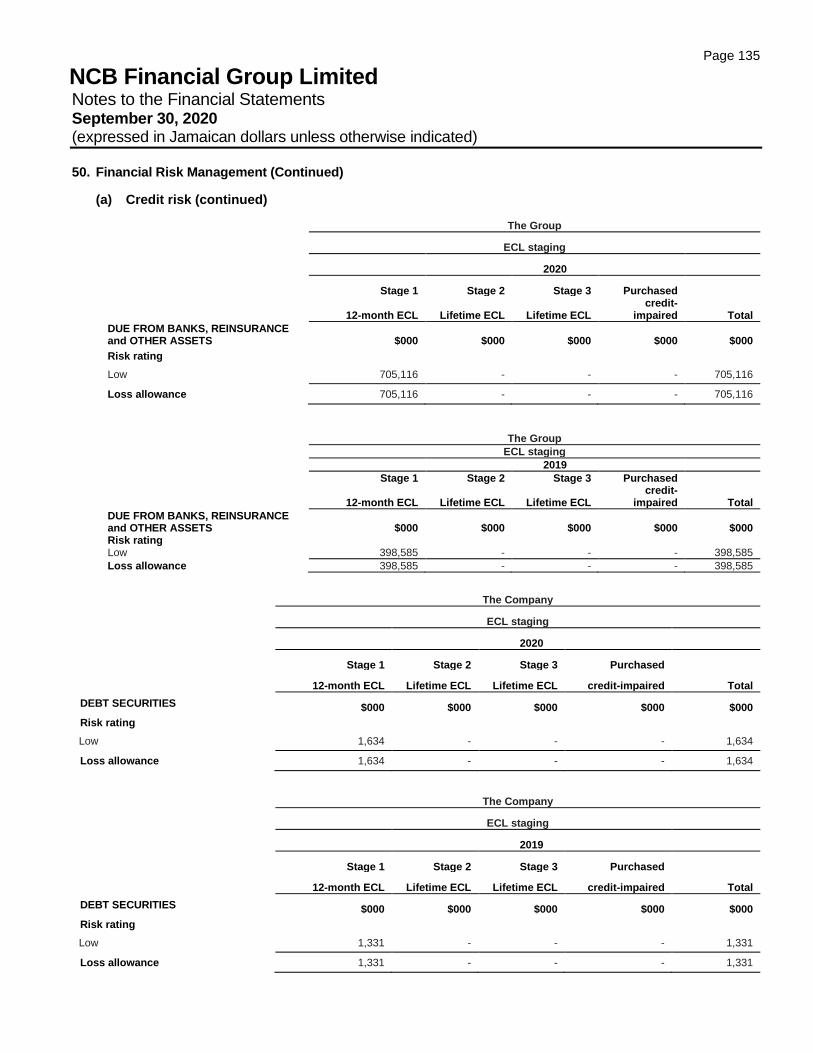
Page 135
NCB Financial Group Limited Notes to the Financial Statements September 30, 2020 (expressed in Jamaican dollars unless otherwise indicated)
50. Financial Risk Management (Continued)
(a) Credit risk (continued)
The Group
ECL staging
2020
Stage 1 Stage 2 Stage 3 Purchased
12-month ECL Lifetime ECL Lifetime ECL
credit-impaired Total
DUE FROM BANKS, REINSURANCE and OTHER ASSETS $000 $000 $000 $000 $000
Risk rating
Low 705,116 - - - 705,116
Loss allowance 705,116 - - - 705,116
The Group
ECL staging
2019
Stage 1 Stage 2 Stage 3 Purchased
12-month ECL Lifetime ECL Lifetime ECL credit-
impaired Total
DUE FROM BANKS, REINSURANCE and OTHER ASSETS $000 $000 $000 $000 $000 Risk rating Low 398,585 - - - 398,585
Loss allowance 398,585 - - - 398,585
The Company
ECL staging
2020
Stage 1 Stage 2 Stage 3 Purchased
12-month ECL Lifetime ECL Lifetime ECL credit-impaired Total
DEBT SECURITIES $000 $000 $000 $000 $000
Risk rating
Low 1,634 - - - 1,634
Loss allowance 1,634 - - - 1,634
The Company
ECL staging
2019
Stage 1 Stage 2 Stage 3 Purchased
12-month ECL Lifetime ECL Lifetime ECL credit-impaired Total
DEBT SECURITIES $000 $000 $000 $000 $000
Risk rating
Low 1,331 - - - 1,331
Loss allowance 1,331 - - - 1,331
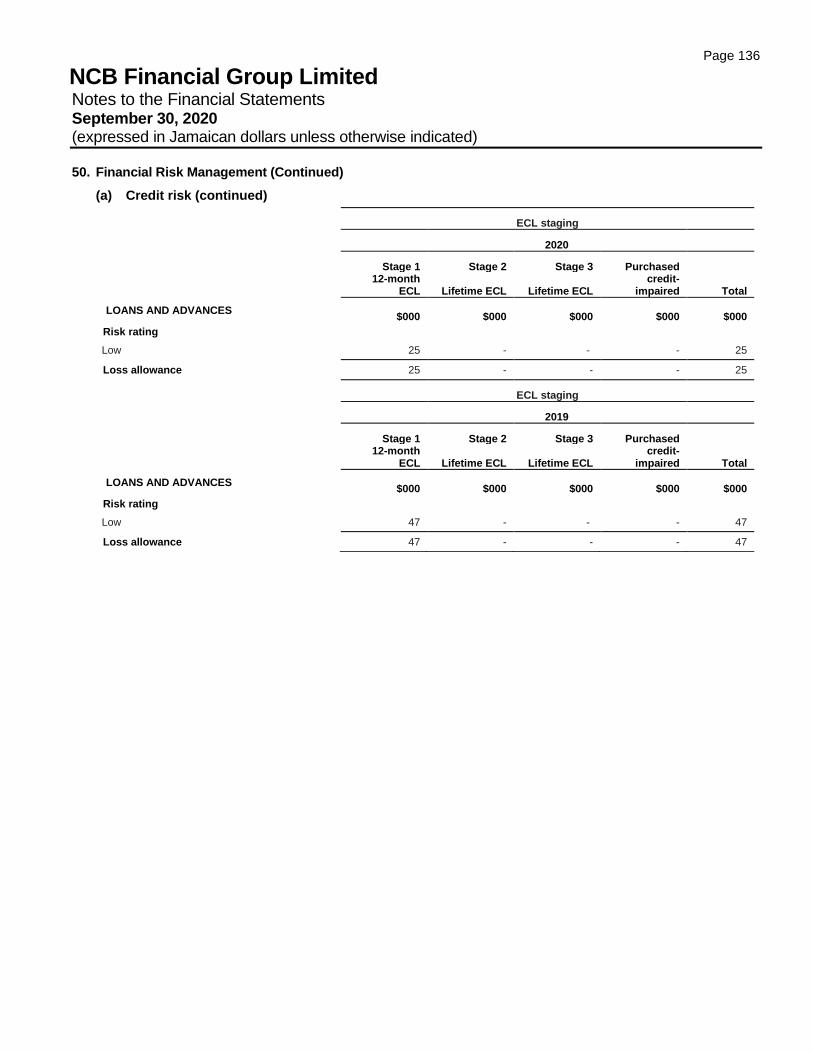
Page 136
NCB Financial Group Limited Notes to the Financial Statements September 30, 2020 (expressed in Jamaican dollars unless otherwise indicated)
50. Financial Risk Management (Continued)
(a) Credit risk (continued)
ECL staging
2020
Stage 1 Stage 2 Stage 3 Purchased 12-month
ECL Lifetime ECL Lifetime ECL credit-
impaired Total
LOANS AND ADVANCES $000 $000 $000 $000
$000
Risk rating
Low 25 - - - 25
Loss allowance 25 - - - 25
ECL staging
2019
Stage 1 Stage 2 Stage 3 Purchased 12-month
ECL Lifetime ECL Lifetime ECL credit-
impaired Total
LOANS AND ADVANCES $000 $000 $000 $000
$000
Risk rating
Low 47 - - - 47
Loss allowance 47 - - - 47
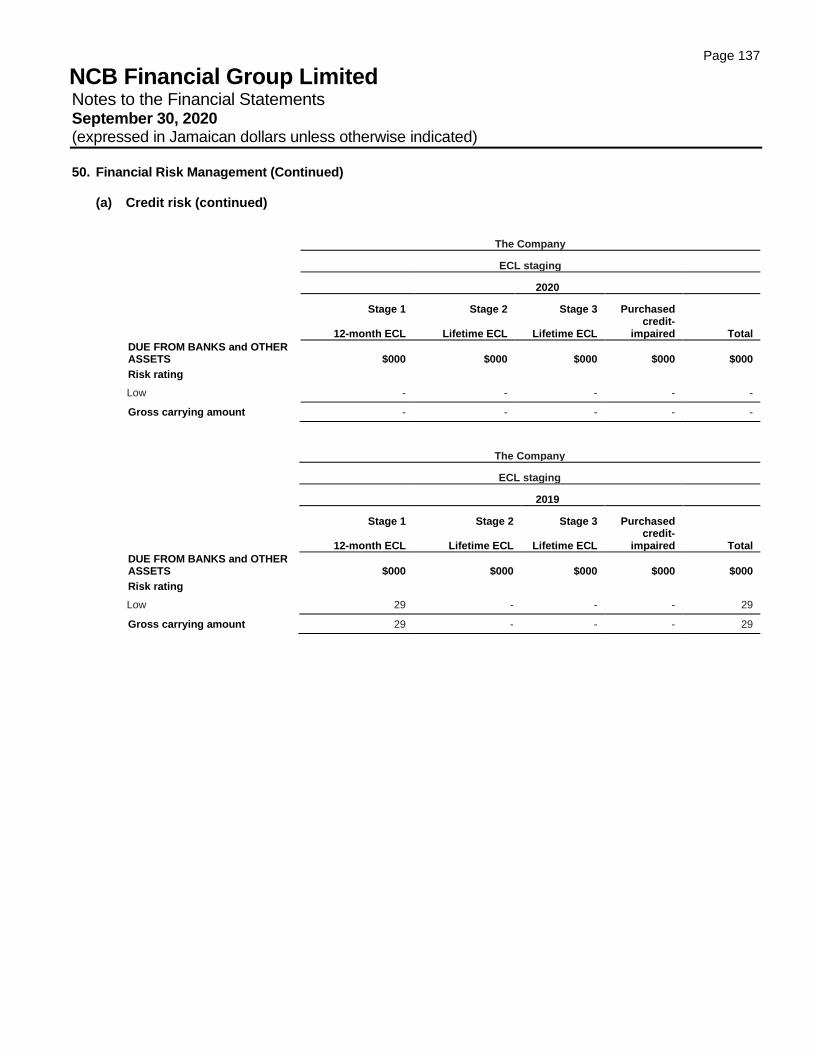
Page 137
NCB Financial Group Limited Notes to the Financial Statements September 30, 2020 (expressed in Jamaican dollars unless otherwise indicated)
50. Financial Risk Management (Continued) (a) Credit risk (continued)
The Company
ECL staging
2020
Stage 1 Stage 2 Stage 3 Purchased
12-month ECL Lifetime ECL Lifetime ECL credit-
impaired Total
DUE FROM BANKS and OTHER ASSETS $000 $000 $000 $000 $000
Risk rating
Low - - - - -
Gross carrying amount - - - - -
The Company
ECL staging
2019
Stage 1 Stage 2 Stage 3 Purchased
12-month ECL Lifetime ECL Lifetime ECL credit-
impaired Total
DUE FROM BANKS and OTHER ASSETS $000 $000 $000 $000 $000
Risk rating
Low 29 - - - 29
Gross carrying amount 29 - - - 29
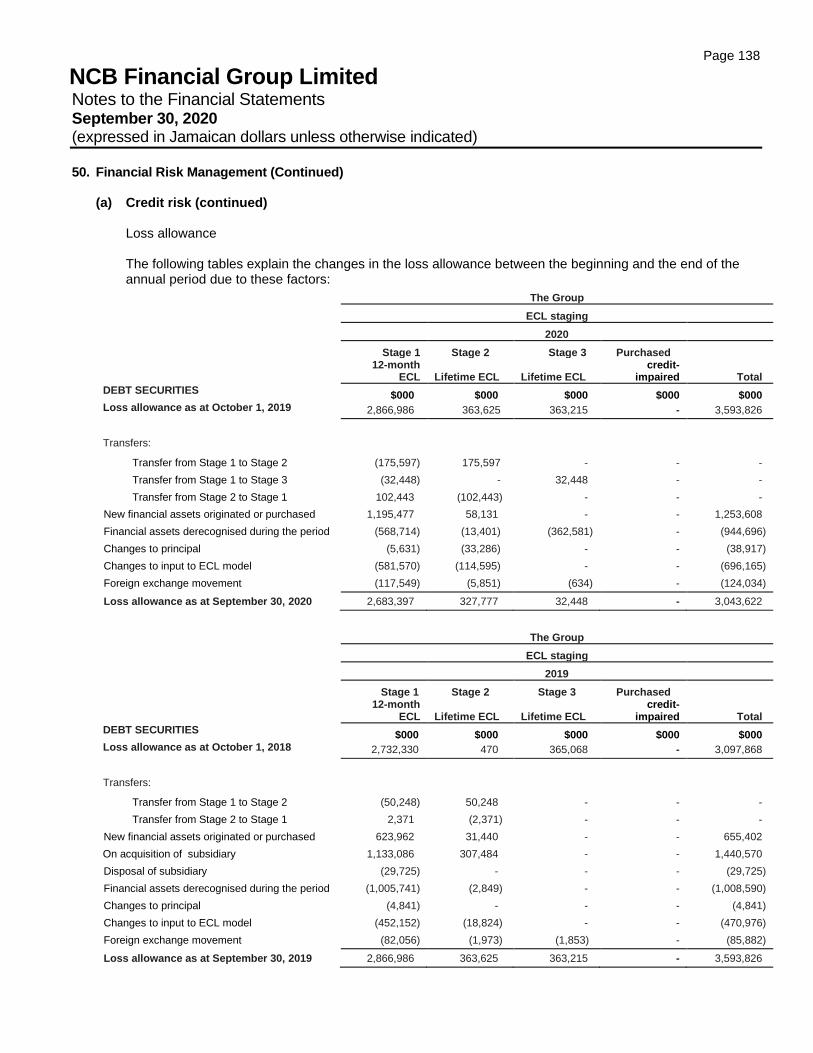
Page 138
NCB Financial Group Limited Notes to the Financial Statements September 30, 2020 (expressed in Jamaican dollars unless otherwise indicated)
50. Financial Risk Management (Continued) (a) Credit risk (continued)
Loss allowance The following tables explain the changes in the loss allowance between the beginning and the end of the annual period due to these factors:
The Group
ECL staging
2020
Stage 1 Stage 2 Stage 3 Purchased
12-month ECL Lifetime ECL Lifetime ECL
credit-impaired Total
DEBT SECURITIES $000 $000 $000 $000 $000 Loss allowance as at October 1, 2019 2,866,986 363,625 363,215 - 3,593,826
Transfers:
Transfer from Stage 1 to Stage 2 (175,597) 175,597 - - -
Transfer from Stage 1 to Stage 3 (32,448) - 32,448 - -
Transfer from Stage 2 to Stage 1 102,443 (102,443) - - -
New financial assets originated or purchased 1,195,477 58,131 - - 1,253,608
Financial assets derecognised during the period (568,714) (13,401) (362,581) - (944,696)
Changes to principal (5,631) (33,286) - - (38,917)
Changes to input to ECL model (581,570) (114,595) - - (696,165)
Foreign exchange movement (117,549) (5,851) (634) - (124,034)
Loss allowance as at September 30, 2020 2,683,397 327,777 32,448 - 3,043,622
The Group
ECL staging
2019
Stage 1 Stage 2 Stage 3 Purchased
12-month ECL Lifetime ECL Lifetime ECL
credit-impaired Total
DEBT SECURITIES $000 $000 $000 $000 $000 Loss allowance as at October 1, 2018 2,732,330 470 365,068 - 3,097,868
Transfers:
Transfer from Stage 1 to Stage 2 (50,248) 50,248 - - -
Transfer from Stage 2 to Stage 1 2,371 (2,371) - - -
New financial assets originated or purchased 623,962 31,440 - - 655,402
On acquisition of subsidiary 1,133,086 307,484 - - 1,440,570
Disposal of subsidiary (29,725) - - - (29,725)
Financial assets derecognised during the period (1,005,741) (2,849) - - (1,008,590)
Changes to principal (4,841) - - - (4,841)
Changes to input to ECL model (452,152) (18,824) - - (470,976)
Foreign exchange movement (82,056) (1,973) (1,853) - (85,882)
Loss allowance as at September 30, 2019 2,866,986 363,625 363,215 - 3,593,826
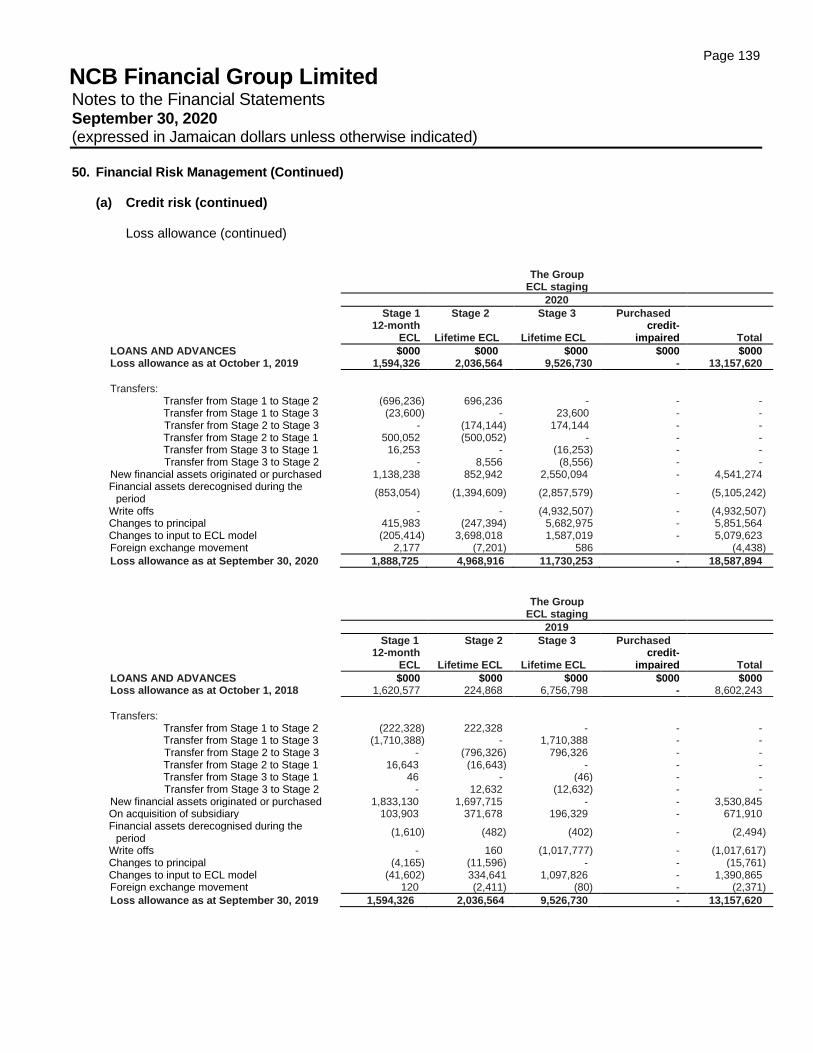
Page 139
NCB Financial Group Limited Notes to the Financial Statements September 30, 2020 (expressed in Jamaican dollars unless otherwise indicated)
50. Financial Risk Management (Continued)
(a) Credit risk (continued)
Loss allowance (continued)
The Group
ECL staging
2020 Stage 1 Stage 2 Stage 3 Purchased
12-month ECL Lifetime ECL Lifetime ECL
credit-impaired Total
LOANS AND ADVANCES $000 $000 $000 $000 $000 Loss allowance as at October 1, 2019 1,594,326 2,036,564 9,526,730 - 13,157,620
Transfers: Transfer from Stage 1 to Stage 2 (696,236) 696,236 - - - Transfer from Stage 1 to Stage 3 (23,600) - 23,600 - -
Transfer from Stage 2 to Stage 3 - (174,144) 174,144 - - Transfer from Stage 2 to Stage 1 500,052 (500,052) - - - Transfer from Stage 3 to Stage 1 16,253 - (16,253) - -
Transfer from Stage 3 to Stage 2 - 8,556 (8,556) - - New financial assets originated or purchased 1,138,238 852,942 2,550,094 - 4,541,274 Financial assets derecognised during the
period (853,054) (1,394,609) (2,857,579) - (5,105,242)
Write offs - - (4,932,507) - (4,932,507) Changes to principal 415,983 (247,394) 5,682,975 - 5,851,564 Changes to input to ECL model (205,414) 3,698,018 1,587,019 - 5,079,623 Foreign exchange movement 2,177 (7,201) 586 (4,438)
Loss allowance as at September 30, 2020 1,888,725 4,968,916 11,730,253 - 18,587,894
The Group ECL staging
2019 Stage 1 Stage 2 Stage 3 Purchased
12-month ECL Lifetime ECL Lifetime ECL
credit-impaired Total
LOANS AND ADVANCES $000 $000 $000 $000 $000 Loss allowance as at October 1, 2018 1,620,577 224,868 6,756,798 - 8,602,243
Transfers: Transfer from Stage 1 to Stage 2 (222,328) 222,328 - - - Transfer from Stage 1 to Stage 3 (1,710,388) - 1,710,388 - -
Transfer from Stage 2 to Stage 3 - (796,326) 796,326 - - Transfer from Stage 2 to Stage 1 16,643 (16,643) - - - Transfer from Stage 3 to Stage 1 46 - (46) - -
Transfer from Stage 3 to Stage 2 - 12,632 (12,632) - - New financial assets originated or purchased 1,833,130 1,697,715 - - 3,530,845 On acquisition of subsidiary 103,903 371,678 196,329 - 671,910 Financial assets derecognised during the
period (1,610) (482) (402) - (2,494)
Write offs - 160 (1,017,777) - (1,017,617) Changes to principal (4,165) (11,596) - - (15,761) Changes to input to ECL model (41,602) 334,641 1,097,826 - 1,390,865 Foreign exchange movement 120 (2,411) (80) - (2,371)
Loss allowance as at September 30, 2019 1,594,326 2,036,564 9,526,730 - 13,157,620
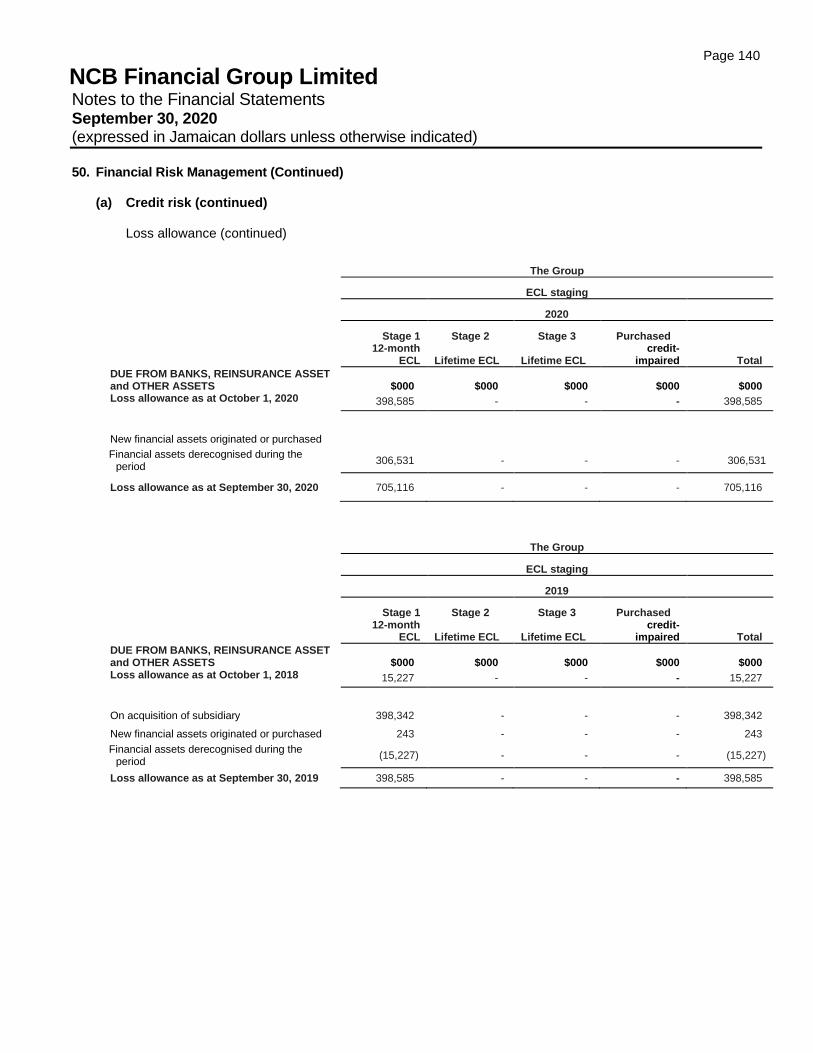
Page 140
NCB Financial Group Limited Notes to the Financial Statements September 30, 2020 (expressed in Jamaican dollars unless otherwise indicated)
50. Financial Risk Management (Continued) (a) Credit risk (continued)
Loss allowance (continued)
The Group
ECL staging
2020
Stage 1 Stage 2 Stage 3 Purchased
12-month
ECL Lifetime ECL Lifetime ECL credit-
impaired Total
DUE FROM BANKS, REINSURANCE ASSET and OTHER ASSETS $000 $000 $000 $000 $000 Loss allowance as at October 1, 2020 398,585 - - - 398,585
New financial assets originated or purchased
Financial assets derecognised during the period
306,531 - - - 306,531
Loss allowance as at September 30, 2020 705,116 - - - 705,116
The Group
ECL staging
2019
Stage 1 Stage 2 Stage 3 Purchased
12-month
ECL Lifetime ECL Lifetime ECL credit-
impaired Total
DUE FROM BANKS, REINSURANCE ASSET and OTHER ASSETS $000 $000 $000 $000 $000 Loss allowance as at October 1, 2018 15,227 - - - 15,227
On acquisition of subsidiary 398,342 - - - 398,342
New financial assets originated or purchased 243 - - - 243
Financial assets derecognised during the period
(15,227) - - - (15,227)
Loss allowance as at September 30, 2019 398,585 - - - 398,585
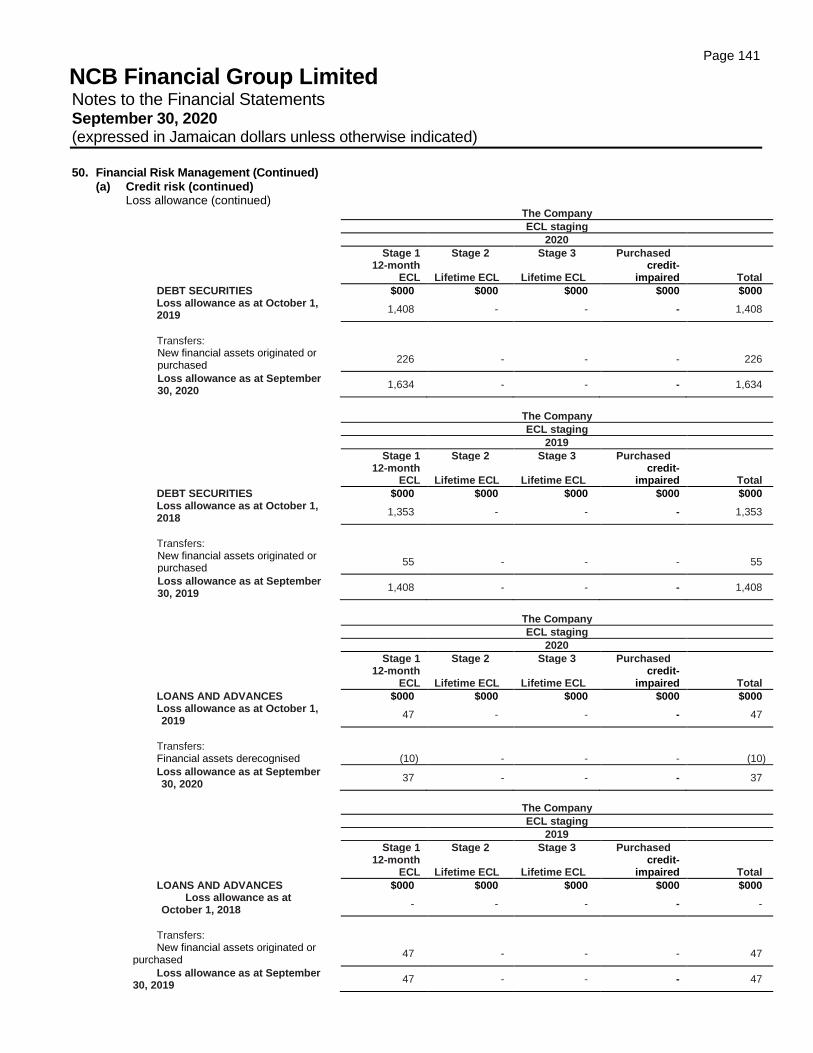
Page 141
NCB Financial Group Limited Notes to the Financial Statements September 30, 2020 (expressed in Jamaican dollars unless otherwise indicated)
50. Financial Risk Management (Continued)
(a) Credit risk (continued) Loss allowance (continued)
The Company ECL staging
2020 Stage 1 Stage 2 Stage 3 Purchased
12-month ECL Lifetime ECL Lifetime ECL
credit-impaired Total
DEBT SECURITIES $000 $000 $000 $000 $000 Loss allowance as at October 1, 2019
1,408 - - - 1,408
Transfers: New financial assets originated or purchased
226 - - - 226
Loss allowance as at September 30, 2020
1,634 - - - 1,634
The Company
ECL staging
2019 Stage 1 Stage 2 Stage 3 Purchased
12-month ECL Lifetime ECL Lifetime ECL
credit-impaired Total
DEBT SECURITIES $000 $000 $000 $000 $000 Loss allowance as at October 1, 2018
1,353 - - - 1,353
Transfers: New financial assets originated or purchased
55 - - - 55
Loss allowance as at September 30, 2019
1,408 - - - 1,408
The Company ECL staging
2020 Stage 1 Stage 2 Stage 3 Purchased
12-month ECL Lifetime ECL Lifetime ECL
credit-impaired Total
LOANS AND ADVANCES $000 $000 $000 $000 $000 Loss allowance as at October 1, 2019
47 - - - 47
Transfers: Financial assets derecognised (10) - - - (10)
Loss allowance as at September 30, 2020
37 - - - 37
The Company ECL staging
2019 Stage 1 Stage 2 Stage 3 Purchased
12-month ECL Lifetime ECL Lifetime ECL
credit-impaired Total
LOANS AND ADVANCES $000 $000 $000 $000 $000 Loss allowance as at
October 1, 2018 - - - - -
Transfers: New financial assets originated or
purchased 47 - - - 47
Loss allowance as at September 30, 2019
47 - - - 47
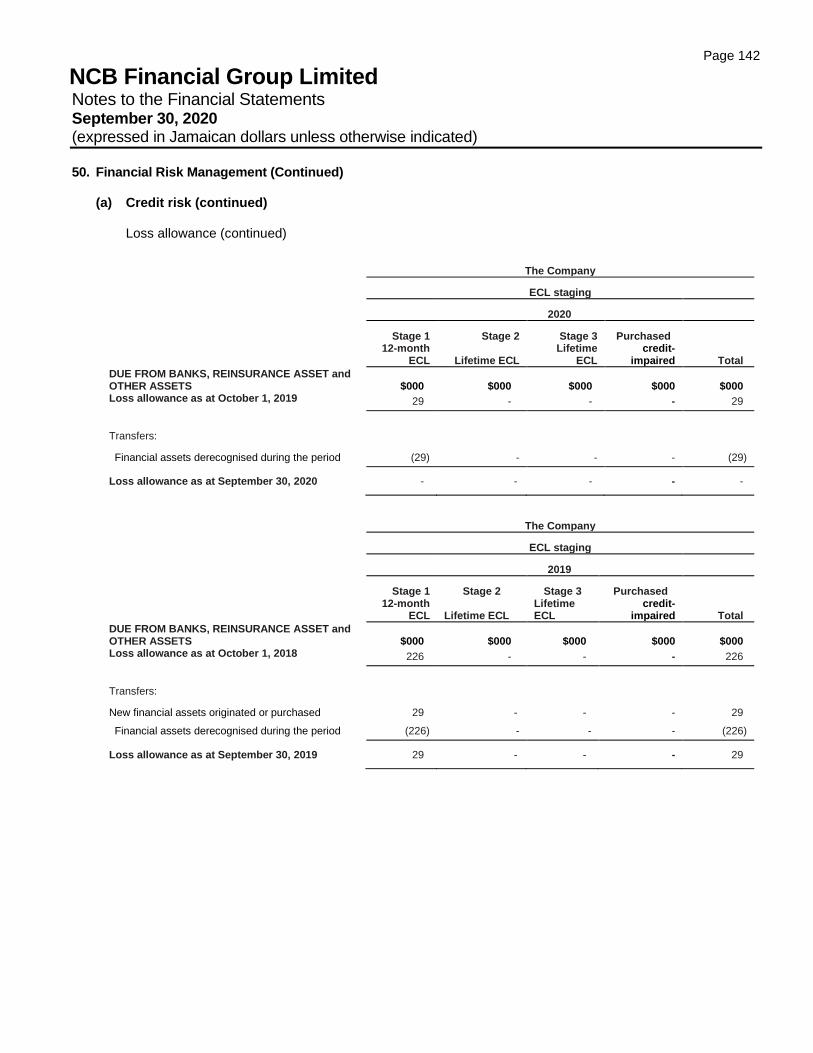
Page 142
NCB Financial Group Limited Notes to the Financial Statements September 30, 2020 (expressed in Jamaican dollars unless otherwise indicated)
50. Financial Risk Management (Continued) (a) Credit risk (continued)
Loss allowance (continued)
The Company
ECL staging
2020
Stage 1 Stage 2 Stage 3 Purchased
12-month
ECL Lifetime ECL Lifetime
ECL credit-
impaired Total
DUE FROM BANKS, REINSURANCE ASSET and OTHER ASSETS $000 $000 $000 $000 $000 Loss allowance as at October 1, 2019 29 - - - 29
Transfers:
Financial assets derecognised during the period (29) - - - (29)
Loss allowance as at September 30, 2020 - - - - -
The Company
ECL staging
2019
Stage 1 Stage 2 Stage 3 Purchased
12-month
ECL Lifetime ECL Lifetime ECL
credit-impaired Total
DUE FROM BANKS, REINSURANCE ASSET and OTHER ASSETS $000 $000 $000 $000 $000 Loss allowance as at October 1, 2018 226 - - - 226
Transfers:
New financial assets originated or purchased 29 - - - 29
Financial assets derecognised during the period (226) - - - (226)
Loss allowance as at September 30, 2019 29 - - - 29
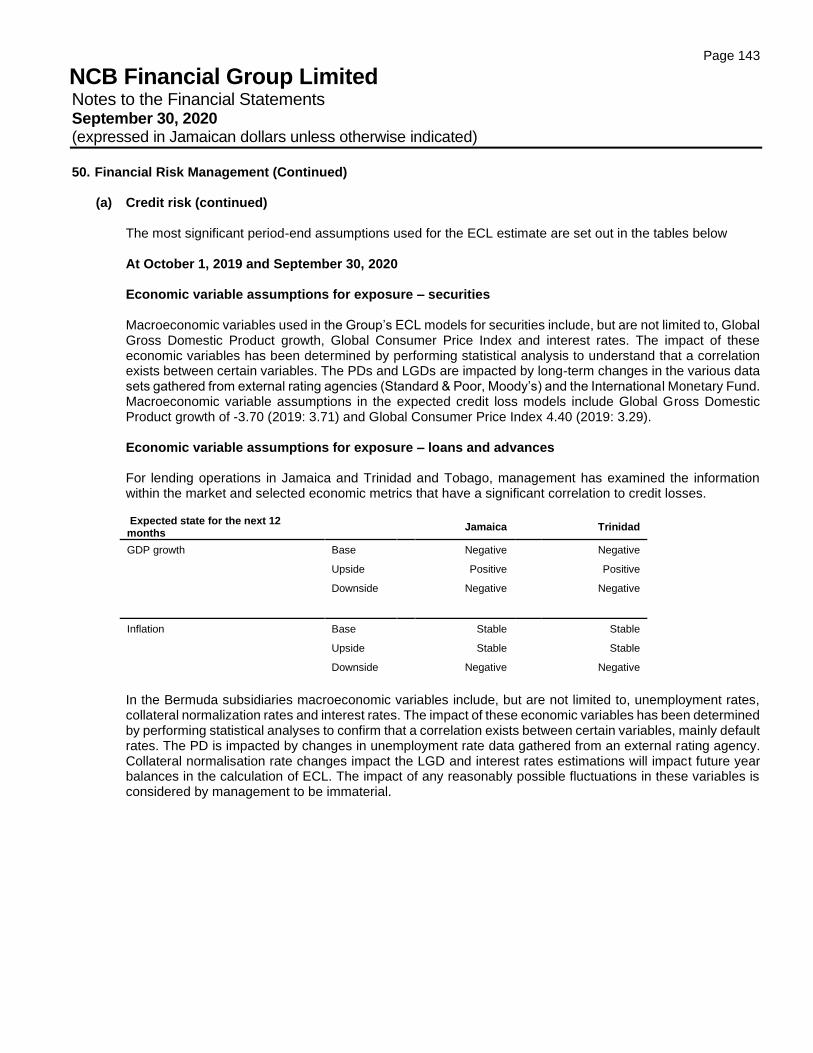
Page 143
NCB Financial Group Limited Notes to the Financial Statements September 30, 2020 (expressed in Jamaican dollars unless otherwise indicated)
50. Financial Risk Management (Continued) (a) Credit risk (continued)
The most significant period-end assumptions used for the ECL estimate are set out in the tables below At October 1, 2019 and September 30, 2020 Economic variable assumptions for exposure – securities Macroeconomic variables used in the Group’s ECL models for securities include, but are not limited to, Global Gross Domestic Product growth, Global Consumer Price Index and interest rates. The impact of these economic variables has been determined by performing statistical analysis to understand that a correlation exists between certain variables. The PDs and LGDs are impacted by long-term changes in the various data sets gathered from external rating agencies (Standard & Poor, Moody’s) and the International Monetary Fund. Macroeconomic variable assumptions in the expected credit loss models include Global Gross Domestic Product growth of -3.70 (2019: 3.71) and Global Consumer Price Index 4.40 (2019: 3.29).
Economic variable assumptions for exposure – loans and advances For lending operations in Jamaica and Trinidad and Tobago, management has examined the information within the market and selected economic metrics that have a significant correlation to credit losses.
Expected state for the next 12 months
Jamaica
Trinidad
GDP growth Base Negative Negative
Upside Positive Positive
Downside Negative Negative
Inflation Base Stable Stable
Upside Stable Stable
Downside Negative Negative
In the Bermuda subsidiaries macroeconomic variables include, but are not limited to, unemployment rates, collateral normalization rates and interest rates. The impact of these economic variables has been determined by performing statistical analyses to confirm that a correlation exists between certain variables, mainly default rates. The PD is impacted by changes in unemployment rate data gathered from an external rating agency. Collateral normalisation rate changes impact the LGD and interest rates estimations will impact future year balances in the calculation of ECL. The impact of any reasonably possible fluctuations in these variables is considered by management to be immaterial.
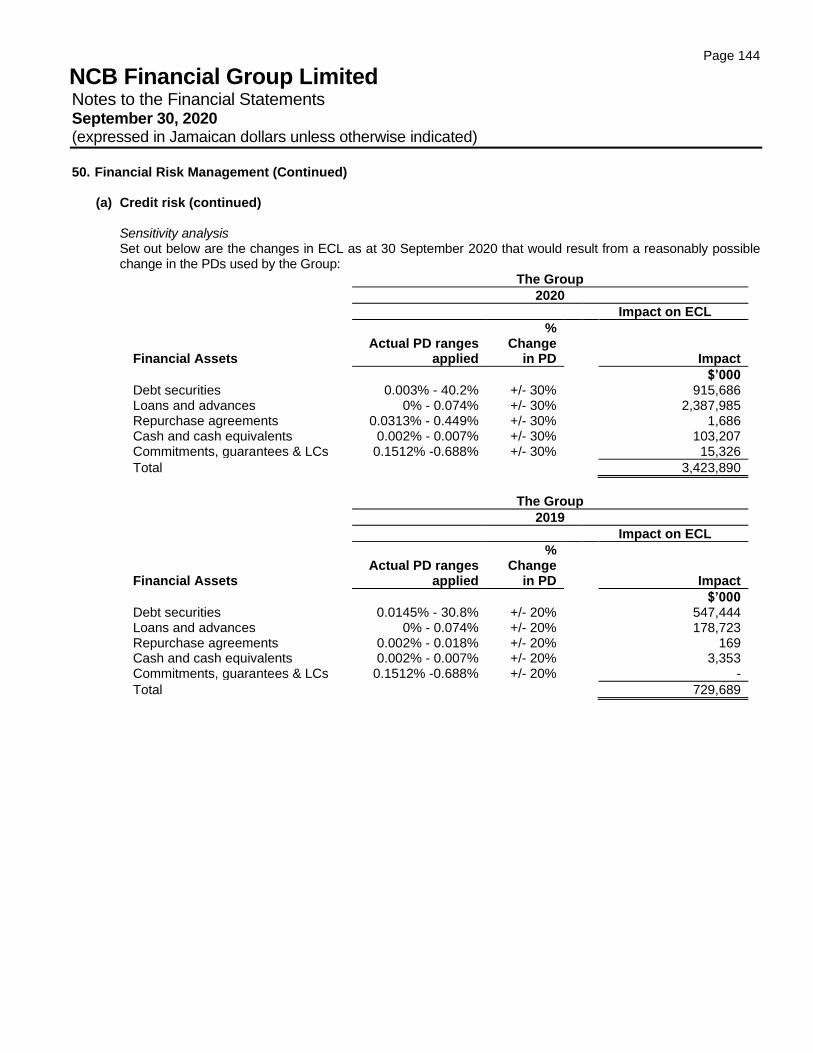
Page 144
NCB Financial Group Limited Notes to the Financial Statements September 30, 2020 (expressed in Jamaican dollars unless otherwise indicated)
50. Financial Risk Management (Continued) (a) Credit risk (continued)
Sensitivity analysis Set out below are the changes in ECL as at 30 September 2020 that would result from a reasonably possible change in the PDs used by the Group:
The Group
2020
Impact on ECL
Financial Assets Actual PD ranges
applied
% Change
in PD Impact
$’000 Debt securities 0.003% - 40.2% +/- 30% 915,686 Loans and advances 0% - 0.074% +/- 30% 2,387,985 Repurchase agreements 0.0313% - 0.449% +/- 30% 1,686 Cash and cash equivalents 0.002% - 0.007% +/- 30% 103,207 Commitments, guarantees & LCs 0.1512% -0.688% +/- 30% 15,326
Total 3,423,890
The Group
2019
Impact on ECL
Financial Assets Actual PD ranges
applied
% Change
in PD Impact
$’000 Debt securities 0.0145% - 30.8% +/- 20% 547,444 Loans and advances 0% - 0.074% +/- 20% 178,723 Repurchase agreements 0.002% - 0.018% +/- 20% 169 Cash and cash equivalents 0.002% - 0.007% +/- 20% 3,353 Commitments, guarantees & LCs 0.1512% -0.688% +/- 20% -
Total 729,689
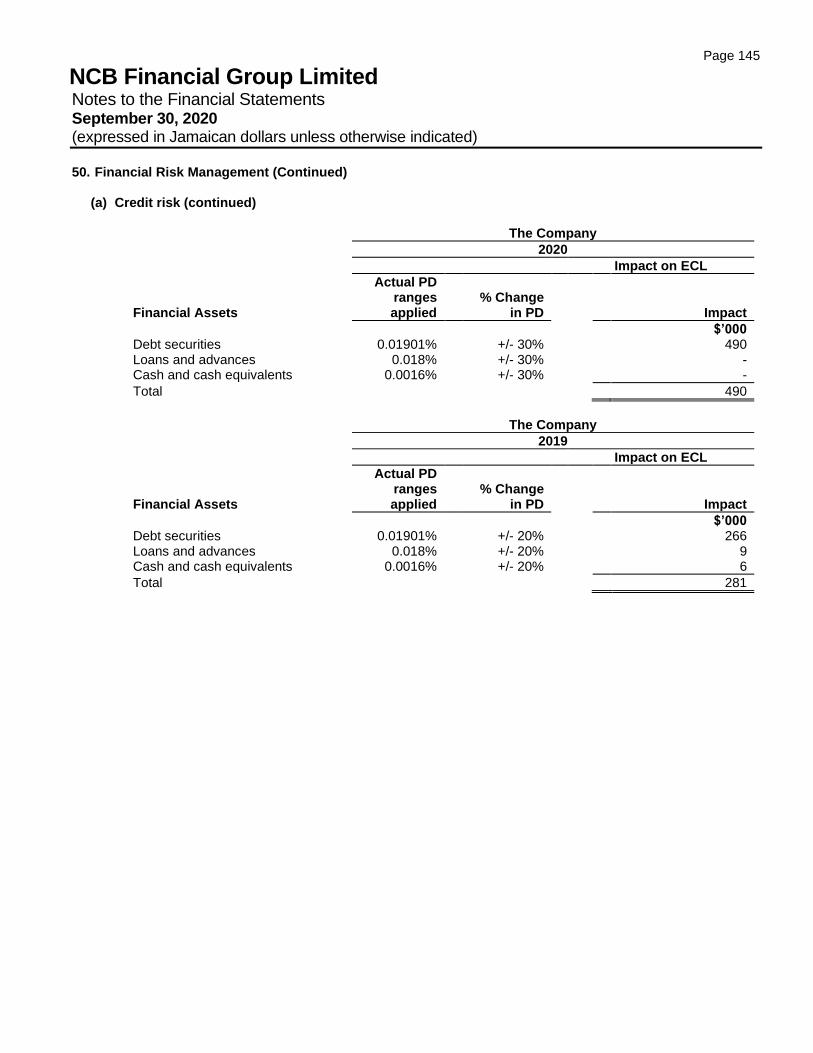
Page 145
NCB Financial Group Limited Notes to the Financial Statements September 30, 2020 (expressed in Jamaican dollars unless otherwise indicated)
50. Financial Risk Management (Continued) (a) Credit risk (continued)
The Company
2020
Impact on ECL
Financial Assets
Actual PD ranges applied
% Change
in PD
Impact
$’000 Debt securities 0.01901% +/- 30% 490 Loans and advances 0.018% +/- 30% - Cash and cash equivalents 0.0016% +/- 30% -
Total 490
The Company
2019
Impact on ECL
Financial Assets
Actual PD ranges applied
% Change
in PD
Impact
$’000 Debt securities 0.01901% +/- 20% 266 Loans and advances 0.018% +/- 20% 9 Cash and cash equivalents 0.0016% +/- 20% 6
Total 281
Page 146
NCB Financial Group Limited Notes to the Financial Statements September 30, 2020 (expressed in Jamaican dollars unless otherwise indicated)
50. Financial Risk Management (Continued) (b) Liquidity risk
The Group’s liquidity risk policy is designed to ensure that it can meet cash obligations when they fall due
and take advantage of unanticipated earnings enhancement opportunities.
Liquidity management within the Group, which incorporates funding risk management, ensures that there is
a sufficient level of liquid assets available in addition to stable funding lines to meet on-going cash
commitments even during periods of stress. The management of liquidity risk is executed within a framework
which comprises:
(i) Oversight by relevant governance committees;
(ii) Daily management of liquidity by the relevant treasury/investment units within each Group company;
(iii) Use of tools to measure the Group’s exposures;
(iv) Establishment and monitoring of limits/benchmarks for maturity mismatches and funding concentrations;
(v) Diversification of funding sources;
(vi) Maintenance of committed lines of credits; and
(vii) Monitoring of adherence to regulatory ratios.
Monitoring and reporting take the form of cash flow measurement and projections for the next day, week and month, respectively, as these are key periods for liquidity management. The starting point for those projections is an analysis of the contractual maturity of the financial liabilities and the expected collection date of the financial assets.
The matching of the maturities and interest rates of assets and liabilities is fundamental to the management of the Group’s liquidity exposure. It is unusual for companies to be completely matched since business transacted is often of uncertain term and of different types. An unmatched position potentially enhances profitability, but can also increase the risk of loss.
The maturities of assets and liabilities and the ability to replace, at an acceptable cost, interest-bearing liabilities as they mature, are important factors in assessing the liquidity of the Group and its exposure to changes in interest rates and exchange rates.
COVID 19 would have resulted in increased liability run-offs, albeit moderate. Our liquidity positioning was sufficient, thereby enabling the Group meet its contractual and regulatory obligations. It was also further bolstered by USD fund raising activities in the international markets.
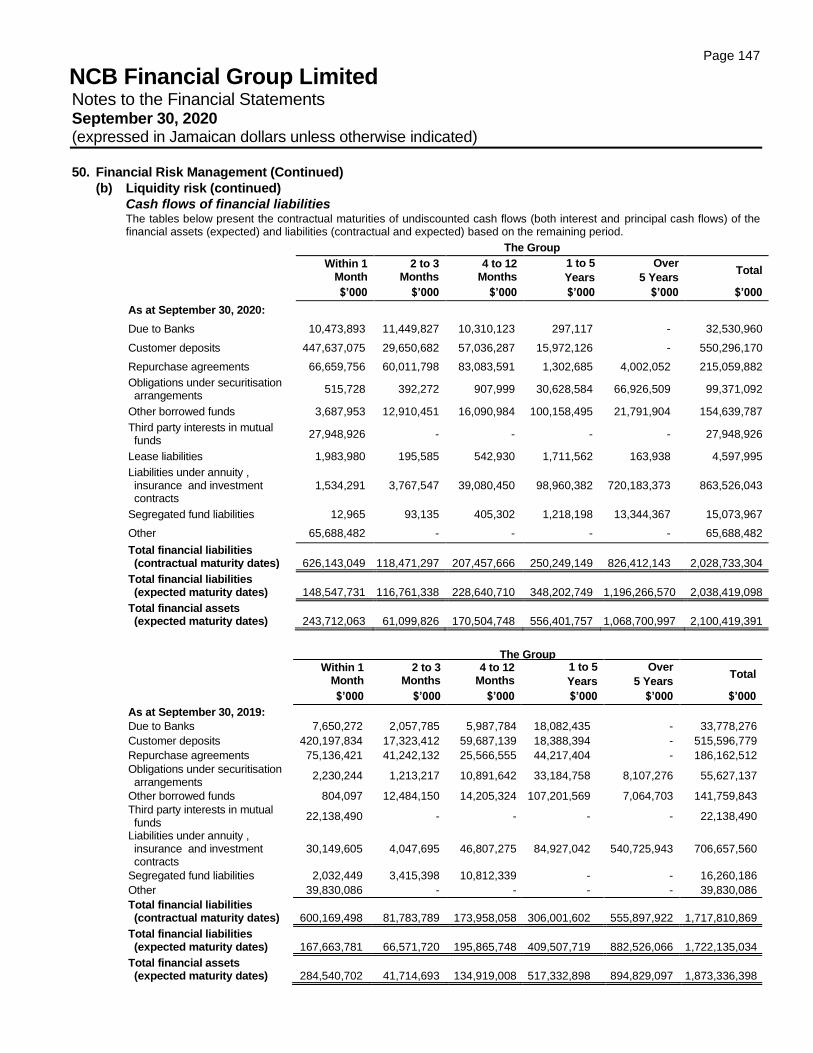
Page 147
NCB Financial Group Limited Notes to the Financial Statements September 30, 2020 (expressed in Jamaican dollars unless otherwise indicated)
50. Financial Risk Management (Continued)
(b) Liquidity risk (continued)
Cash flows of financial liabilities The tables below present the contractual maturities of undiscounted cash flows (both interest and principal cash flows) of the financial assets (expected) and liabilities (contractual and expected) based on the remaining period.
The Group
Within 1
Month 2 to 3
Months 4 to 12 Months
1 to 5
Years
Over
5 Years Total
$’000 $’000 $’000 $’000 $’000 $’000
As at September 30, 2020:
Due to Banks 10,473,893 11,449,827 10,310,123 297,117 - 32,530,960
Customer deposits 447,637,075 29,650,682 57,036,287 15,972,126 - 550,296,170
Repurchase agreements 66,659,756 60,011,798 83,083,591 1,302,685 4,002,052 215,059,882
Obligations under securitisation arrangements
515,728 392,272 907,999 30,628,584 66,926,509 99,371,092
Other borrowed funds 3,687,953 12,910,451 16,090,984 100,158,495 21,791,904 154,639,787
Third party interests in mutual funds
27,948,926 - - - - 27,948,926
Lease liabilities 1,983,980 195,585 542,930 1,711,562 163,938 4,597,995
Liabilities under annuity , insurance and investment contracts
1,534,291 3,767,547 39,080,450 98,960,382 720,183,373 863,526,043
Segregated fund liabilities 12,965 93,135 405,302 1,218,198 13,344,367 15,073,967
Other 65,688,482 - - - - 65,688,482
Total financial liabilities (contractual maturity dates) 626,143,049 118,471,297 207,457,666 250,249,149 826,412,143 2,028,733,304
Total financial liabilities (expected maturity dates) 148,547,731 116,761,338 228,640,710 348,202,749 1,196,266,570 2,038,419,098
Total financial assets (expected maturity dates) 243,712,063 61,099,826 170,504,748 556,401,757 1,068,700,997 2,100,419,391
The Group
Within 1
Month 2 to 3
Months 4 to 12 Months
1 to 5
Years
Over
5 Years Total
$’000 $’000 $’000 $’000 $’000 $’000
As at September 30, 2019:
Due to Banks 7,650,272 2,057,785 5,987,784 18,082,435 - 33,778,276
Customer deposits 420,197,834 17,323,412 59,687,139 18,388,394 - 515,596,779
Repurchase agreements 75,136,421 41,242,132 25,566,555 44,217,404 - 186,162,512
Obligations under securitisation arrangements
2,230,244 1,213,217 10,891,642 33,184,758 8,107,276 55,627,137
Other borrowed funds 804,097 12,484,150 14,205,324 107,201,569 7,064,703 141,759,843
Third party interests in mutual funds
22,138,490 - - - - 22,138,490
Liabilities under annuity , insurance and investment contracts
30,149,605 4,047,695 46,807,275 84,927,042 540,725,943 706,657,560
Segregated fund liabilities 2,032,449 3,415,398 10,812,339 - - 16,260,186
Other 39,830,086 - - - - 39,830,086
Total financial liabilities (contractual maturity dates) 600,169,498 81,783,789 173,958,058 306,001,602 555,897,922 1,717,810,869
Total financial liabilities (expected maturity dates) 167,663,781 66,571,720 195,865,748 409,507,719 882,526,066 1,722,135,034
Total financial assets (expected maturity dates) 284,540,702 41,714,693 134,919,008 517,332,898 894,829,097 1,873,336,398
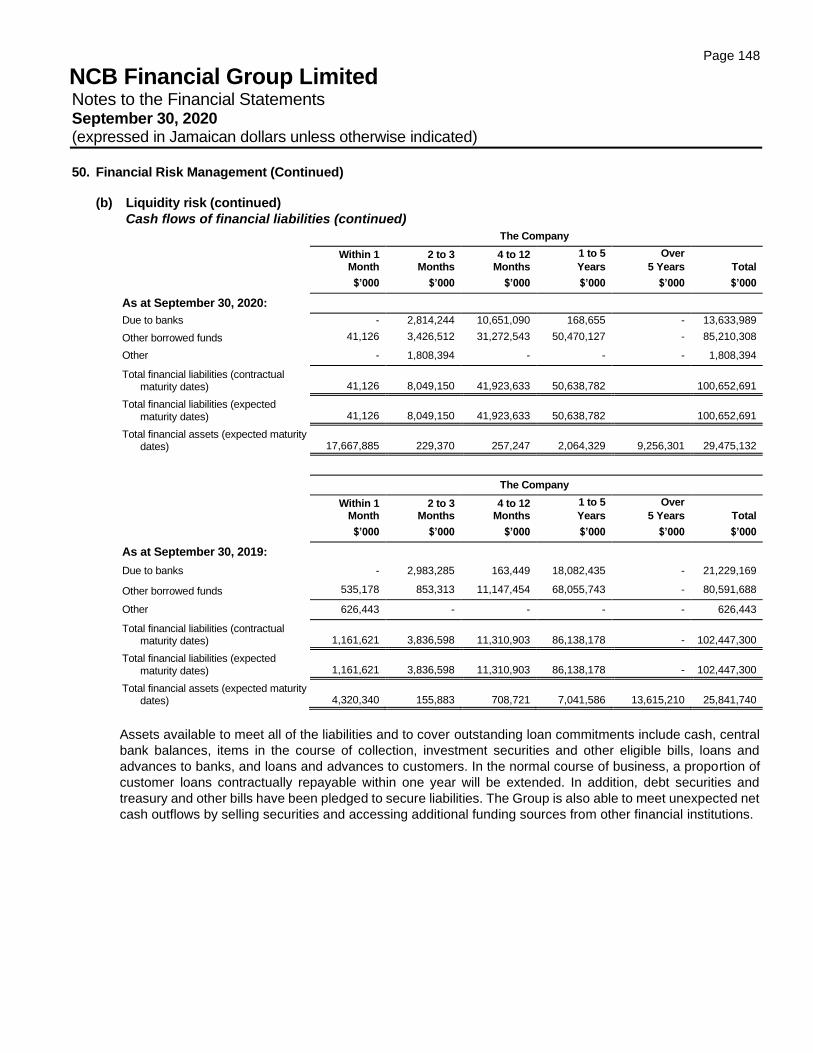
Page 148
NCB Financial Group Limited Notes to the Financial Statements September 30, 2020 (expressed in Jamaican dollars unless otherwise indicated)
50. Financial Risk Management (Continued)
(b) Liquidity risk (continued)
Cash flows of financial liabilities (continued)
The Company
Within 1
Month 2 to 3
Months 4 to 12 Months
1 to 5
Years
Over
5 Years Total
$’000 $’000 $’000 $’000 $’000 $’000
As at September 30, 2020:
Due to banks - 2,814,244 10,651,090 168,655 - 13,633,989
Other borrowed funds 41,126 3,426,512 31,272,543 50,470,127 - 85,210,308
Other - 1,808,394 - - - 1,808,394
Total financial liabilities (contractual maturity dates) 41,126 8,049,150 41,923,633 50,638,782 100,652,691
Total financial liabilities (expected maturity dates) 41,126 8,049,150 41,923,633 50,638,782 100,652,691
Total financial assets (expected maturity dates) 17,667,885 229,370 257,247 2,064,329 9,256,301 29,475,132
The Company
Within 1
Month 2 to 3
Months 4 to 12 Months
1 to 5
Years
Over
5 Years Total
$’000 $’000 $’000 $’000 $’000 $’000
As at September 30, 2019:
Due to banks - 2,983,285 163,449 18,082,435 - 21,229,169
Other borrowed funds 535,178 853,313 11,147,454 68,055,743 - 80,591,688
Other 626,443 - - - - 626,443
Total financial liabilities (contractual maturity dates) 1,161,621 3,836,598 11,310,903 86,138,178 - 102,447,300
Total financial liabilities (expected maturity dates) 1,161,621 3,836,598 11,310,903 86,138,178 - 102,447,300
Total financial assets (expected maturity dates) 4,320,340 155,883 708,721 7,041,586 13,615,210 25,841,740
Assets available to meet all of the liabilities and to cover outstanding loan commitments include cash, central
bank balances, items in the course of collection, investment securities and other eligible bills, loans and
advances to banks, and loans and advances to customers. In the normal course of business, a proportion of
customer loans contractually repayable within one year will be extended. In addition, debt securities and
treasury and other bills have been pledged to secure liabilities. The Group is also able to meet unexpected net
cash outflows by selling securities and accessing additional funding sources from other financial institutions.
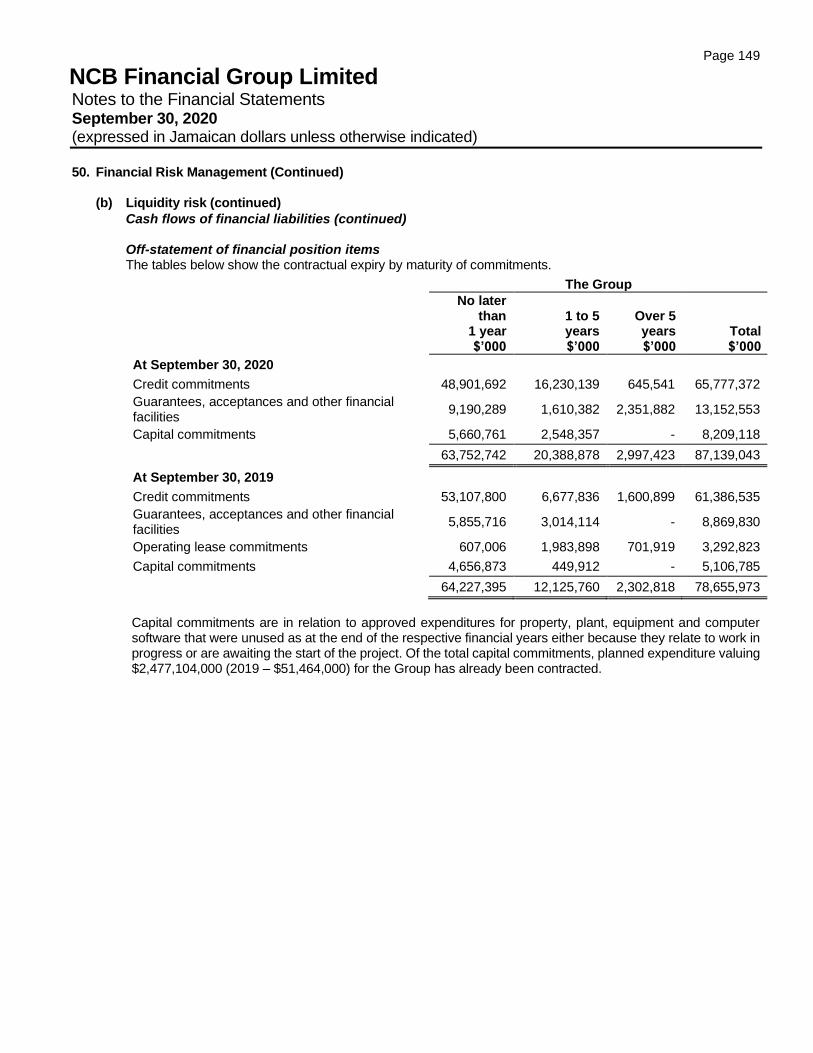
Page 149
NCB Financial Group Limited Notes to the Financial Statements September 30, 2020 (expressed in Jamaican dollars unless otherwise indicated)
50. Financial Risk Management (Continued)
(b) Liquidity risk (continued)
Cash flows of financial liabilities (continued)
Off-statement of financial position items The tables below show the contractual expiry by maturity of commitments.
The Group
No later than
1 year $’000
1 to 5 years $’000
Over 5 years $’000
Total $’000
At September 30, 2020
Credit commitments 48,901,692 16,230,139 645,541 65,777,372
Guarantees, acceptances and other financial facilities
9,190,289 1,610,382 2,351,882 13,152,553
Capital commitments 5,660,761 2,548,357 - 8,209,118
63,752,742 20,388,878 2,997,423 87,139,043
At September 30, 2019
Credit commitments 53,107,800 6,677,836 1,600,899 61,386,535
Guarantees, acceptances and other financial facilities
5,855,716 3,014,114 - 8,869,830
Operating lease commitments 607,006 1,983,898 701,919 3,292,823
Capital commitments 4,656,873 449,912 - 5,106,785
64,227,395 12,125,760 2,302,818 78,655,973
Capital commitments are in relation to approved expenditures for property, plant, equipment and computer software that were unused as at the end of the respective financial years either because they relate to work in progress or are awaiting the start of the project. Of the total capital commitments, planned expenditure valuing $2,477,104,000 (2019 – $51,464,000) for the Group has already been contracted.
Page 150
NCB Financial Group Limited Notes to the Financial Statements September 30, 2020 (expressed in Jamaican dollars unless otherwise indicated)
50. Financial Risk Management (Continued) (c) Market risk
The Group takes on exposure to market risk, which is defined as the potential for loss arising from changes in the market value of the organisation’s financial instruments due to changes in certain market variables, such as interest rates, foreign exchange rates, equity prices, market liquidity and credit spreads.
The Group incurs market risk primarily in treasury, trading and structural banking activities. The Group takes a comprehensive governance approach in accordance with the enterprise-wide risk management framework. This includes:
• Oversight provided by the relevant governance committees.
• An independent market risk oversight function.
• The utilisation of tools and models to measure market risk exposure.
• Limit setting mechanisms and a monitoring process.
• The utilisation of scenario analysis and of stress testing for worst case events.
COVID-19 Our investment portfolios were impacted by the widening of credit spreads resulted in significant fall-off
in asset prices. We maintained surveillance of the portfolio to determine if any action would have been
required to protect the Group’s balance sheet. Post June 2020, we observed improvements across the
financial asset classes, albeit not at pre-covid levels.
(i) Currency risk Currency risk is the risk that the fair value of future cash flows of a financial instrument will fluctuate
because of changes in foreign exchange rates. Foreign exchange risk occurs when the Group takes an open position in a currency. To control this
exchange risk, the Group has approved limits for net open positions in each currency for both intra-day and overnight.
The Group also has transactional currency exposure. Such exposure arises from having financial
assets in currencies other than those in which financial liabilities are expected to be settled. The Group ensures that its net exposure is kept to an acceptable level by buying or selling foreign assets to address short term imbalances.
COVID 19 The tourism sector is a significant foreign currency generator for most of the countries in which we operate. The cessation in travel severely impacted foreign currency inflows which resulted in increased foreign currency volatility. This necessitated aggressive management of our currency exposures to ensure that there were no significant losses generated during the period.
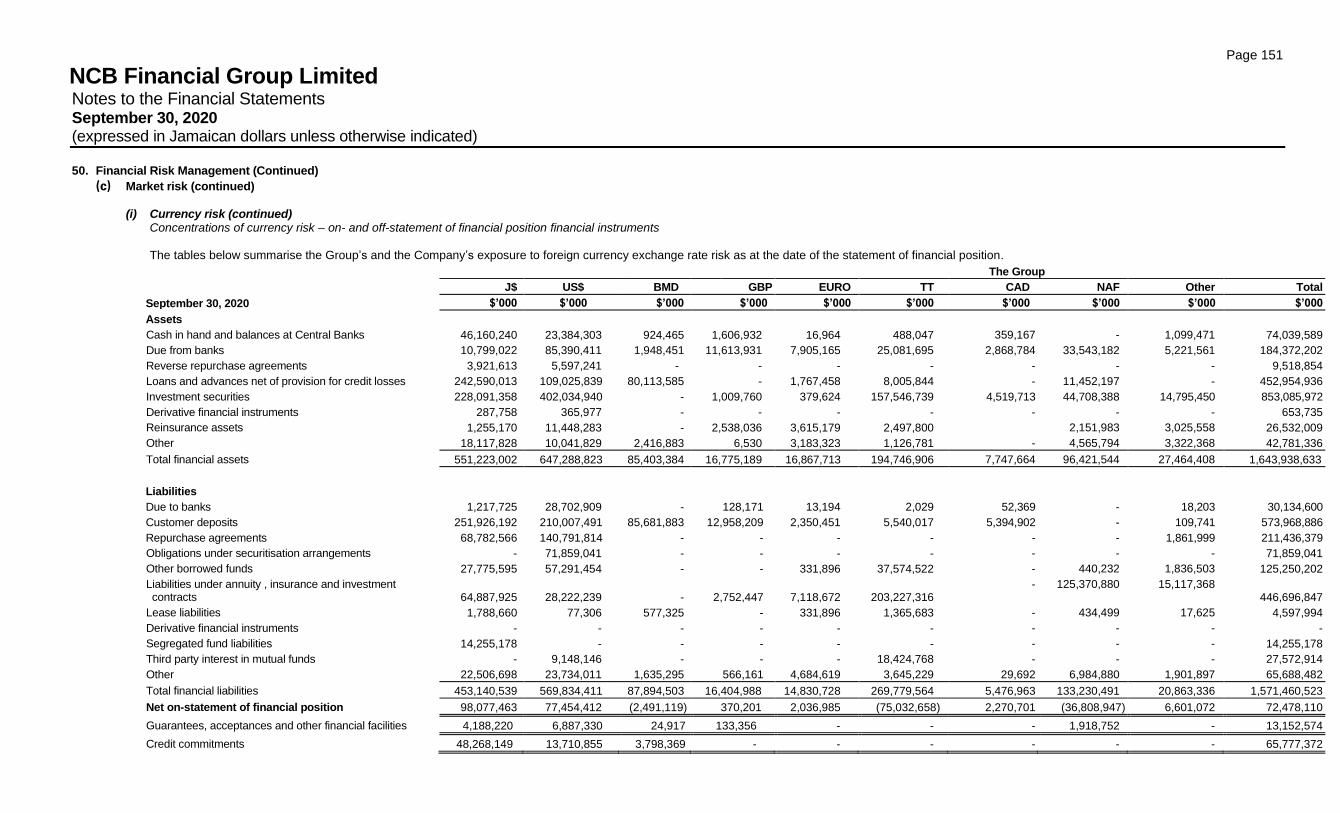
Page 151
NCB Financial Group Limited Notes to the Financial Statements September 30, 2020 (expressed in Jamaican dollars unless otherwise indicated)
50. Financial Risk Management (Continued)
(c) Market risk (continued) (i) Currency risk (continued)
Concentrations of currency risk – on- and off-statement of financial position financial instruments
The tables below summarise the Group’s and the Company’s exposure to foreign currency exchange rate risk as at the date of the statement of financial position.
The Group
J$ US$ BMD GBP EURO TT CAD NAF Other Total
September 30, 2020 $’000 $’000 $’000 $’000 $’000 $’000 $’000 $’000 $’000 $’000
Assets
Cash in hand and balances at Central Banks 46,160,240 23,384,303 924,465 1,606,932 16,964 488,047 359,167 - 1,099,471 74,039,589
Due from banks 10,799,022 85,390,411 1,948,451 11,613,931 7,905,165 25,081,695 2,868,784 33,543,182 5,221,561 184,372,202
Reverse repurchase agreements 3,921,613 5,597,241 - - - - - - - 9,518,854
Loans and advances net of provision for credit losses 242,590,013 109,025,839 80,113,585 - 1,767,458 8,005,844 - 11,452,197 - 452,954,936
Investment securities 228,091,358 402,034,940 - 1,009,760 379,624 157,546,739 4,519,713 44,708,388 14,795,450 853,085,972
Derivative financial instruments 287,758 365,977 - - - - - - - 653,735
Reinsurance assets 1,255,170 11,448,283 - 2,538,036 3,615,179 2,497,800 2,151,983 3,025,558 26,532,009
Other 18,117,828 10,041,829 2,416,883 6,530 3,183,323 1,126,781 - 4,565,794 3,322,368 42,781,336
Total financial assets 551,223,002 647,288,823 85,403,384 16,775,189 16,867,713 194,746,906 7,747,664 96,421,544 27,464,408 1,643,938,633
Liabilities
Due to banks 1,217,725 28,702,909 - 128,171 13,194 2,029 52,369 - 18,203 30,134,600
Customer deposits 251,926,192 210,007,491 85,681,883 12,958,209 2,350,451 5,540,017 5,394,902 - 109,741 573,968,886
Repurchase agreements 68,782,566 140,791,814 - - - - - - 1,861,999 211,436,379
Obligations under securitisation arrangements - 71,859,041 - - - - - - - 71,859,041
Other borrowed funds 27,775,595 57,291,454 - - 331,896 37,574,522 - 440,232 1,836,503 125,250,202
Liabilities under annuity , insurance and investment contracts 64,887,925 28,222,239 - 2,752,447 7,118,672 203,227,316
- 125,370,880 15,117,368 446,696,847
Lease liabilities 1,788,660 77,306 577,325 - 331,896 1,365,683 - 434,499 17,625 4,597,994
Derivative financial instruments - - - - - - - - - -
Segregated fund liabilities 14,255,178 - - - - - - - - 14,255,178
Third party interest in mutual funds - 9,148,146 - - - 18,424,768 - - - 27,572,914
Other 22,506,698 23,734,011 1,635,295 566,161 4,684,619 3,645,229 29,692 6,984,880 1,901,897 65,688,482
Total financial liabilities 453,140,539 569,834,411 87,894,503 16,404,988 14,830,728 269,779,564 5,476,963 133,230,491 20,863,336 1,571,460,523
Net on-statement of financial position 98,077,463 77,454,412 (2,491,119) 370,201 2,036,985 (75,032,658) 2,270,701 (36,808,947) 6,601,072 72,478,110
Guarantees, acceptances and other financial facilities 4,188,220 6,887,330 24,917 133,356 - - - 1,918,752 - 13,152,574
Credit commitments 48,268,149 13,710,855 3,798,369 - - - - - - 65,777,372
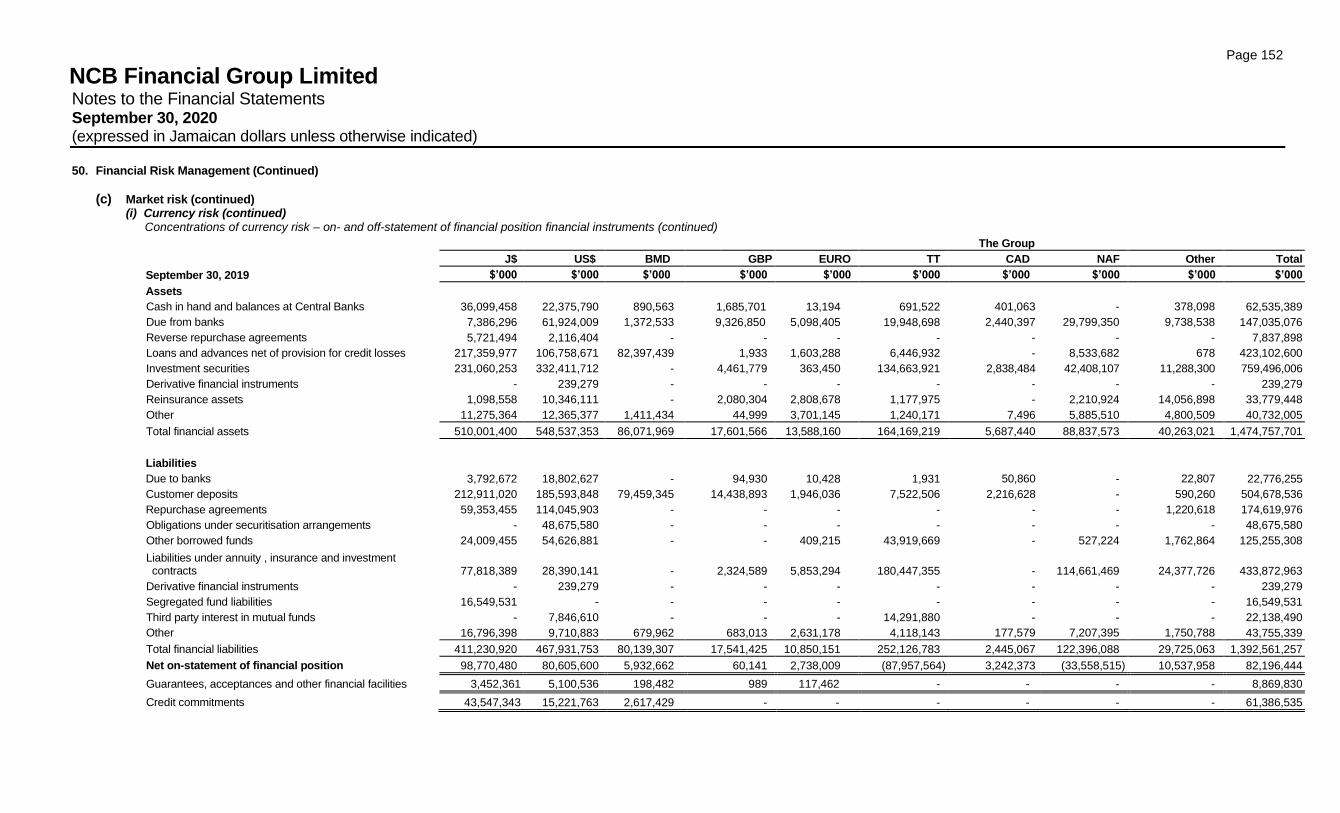
Page 152
NCB Financial Group Limited Notes to the Financial Statements September 30, 2020 (expressed in Jamaican dollars unless otherwise indicated)
50. Financial Risk Management (Continued)
(c) Market risk (continued) (i) Currency risk (continued)
Concentrations of currency risk – on- and off-statement of financial position financial instruments (continued)
The Group
J$ US$ BMD GBP EURO TT CAD NAF Other Total
September 30, 2019 $’000 $’000 $’000 $’000 $’000 $’000 $’000 $’000 $’000 $’000
Assets
Cash in hand and balances at Central Banks 36,099,458 22,375,790 890,563 1,685,701 13,194 691,522 401,063 - 378,098 62,535,389
Due from banks 7,386,296 61,924,009 1,372,533 9,326,850 5,098,405 19,948,698 2,440,397 29,799,350 9,738,538 147,035,076
Reverse repurchase agreements 5,721,494 2,116,404 - - - - - - - 7,837,898
Loans and advances net of provision for credit losses 217,359,977 106,758,671 82,397,439 1,933 1,603,288 6,446,932 - 8,533,682 678 423,102,600
Investment securities 231,060,253 332,411,712 - 4,461,779 363,450 134,663,921 2,838,484 42,408,107 11,288,300 759,496,006
Derivative financial instruments - 239,279 - - - - - - - 239,279
Reinsurance assets 1,098,558 10,346,111 - 2,080,304 2,808,678 1,177,975 - 2,210,924 14,056,898 33,779,448
Other 11,275,364 12,365,377 1,411,434 44,999 3,701,145 1,240,171 7,496 5,885,510 4,800,509 40,732,005
Total financial assets 510,001,400 548,537,353 86,071,969 17,601,566 13,588,160 164,169,219 5,687,440 88,837,573 40,263,021 1,474,757,701
Liabilities
Due to banks 3,792,672 18,802,627 - 94,930 10,428 1,931 50,860 - 22,807 22,776,255
Customer deposits 212,911,020 185,593,848 79,459,345 14,438,893 1,946,036 7,522,506 2,216,628 - 590,260 504,678,536
Repurchase agreements 59,353,455 114,045,903 - - - - - - 1,220,618 174,619,976
Obligations under securitisation arrangements - 48,675,580 - - - - - - - 48,675,580
Other borrowed funds 24,009,455 54,626,881 - - 409,215 43,919,669 - 527,224 1,762,864 125,255,308
Liabilities under annuity , insurance and investment contracts 77,818,389 28,390,141 - 2,324,589 5,853,294 180,447,355
-
114,661,469
24,377,726 433,872,963
Derivative financial instruments - 239,279 - - - - - - - 239,279
Segregated fund liabilities 16,549,531 - - - - - - - - 16,549,531
Third party interest in mutual funds - 7,846,610 - - - 14,291,880 - - - 22,138,490
Other 16,796,398 9,710,883 679,962 683,013 2,631,178 4,118,143 177,579 7,207,395 1,750,788 43,755,339
Total financial liabilities 411,230,920 467,931,753 80,139,307 17,541,425 10,850,151 252,126,783 2,445,067 122,396,088 29,725,063 1,392,561,257
Net on-statement of financial position 98,770,480 80,605,600 5,932,662 60,141 2,738,009 (87,957,564) 3,242,373 (33,558,515) 10,537,958 82,196,444
Guarantees, acceptances and other financial facilities 3,452,361 5,100,536 198,482 989 117,462 - - - - 8,869,830
Credit commitments 43,547,343 15,221,763 2,617,429 - - - - - - 61,386,535
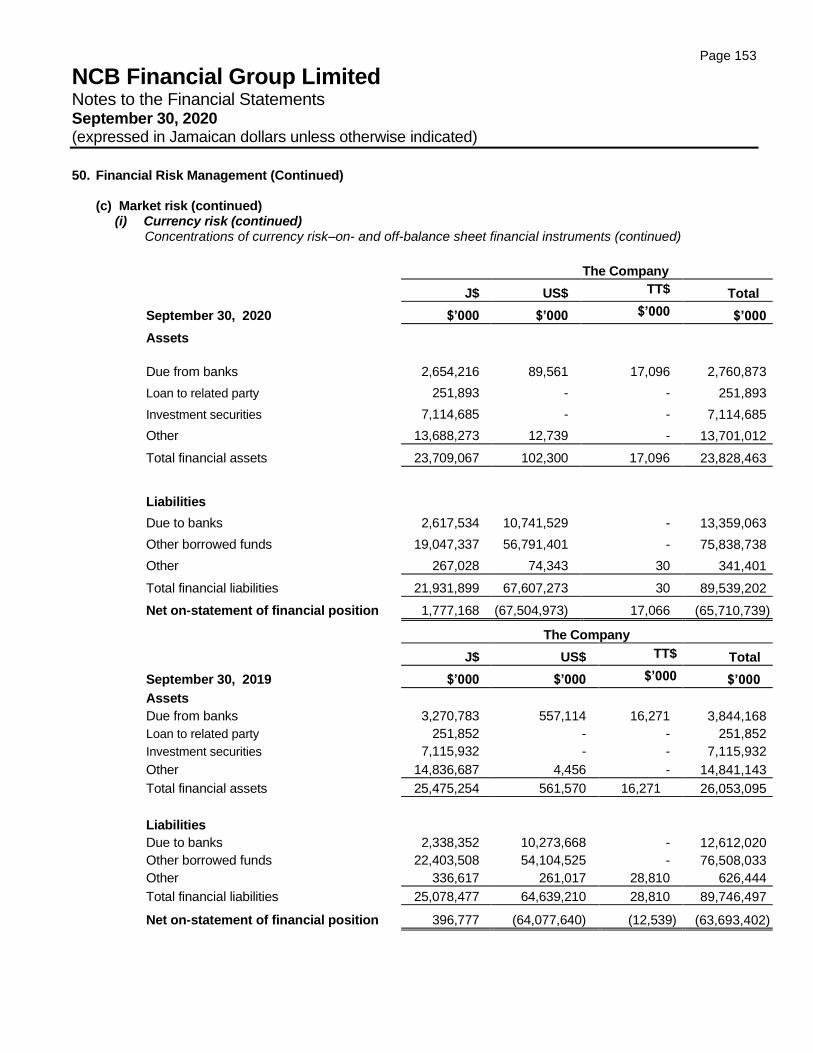
Page 153
NCB Financial Group Limited Notes to the Financial Statements September 30, 2020 (expressed in Jamaican dollars unless otherwise indicated)
50. Financial Risk Management (Continued)
(c) Market risk (continued) (i) Currency risk (continued)
Concentrations of currency risk–on- and off-balance sheet financial instruments (continued)
The Company
J$ US$ TT$ Total
September 30, 2020 $’000 $’000 $’000 $’000
Assets
Due from banks 2,654,216 89,561
17,096 2,760,873
Loan to related party 251,893 - - 251,893
Investment securities 7,114,685 - - 7,114,685
Other 13,688,273 12,739 - 13,701,012
Total financial assets 23,709,067 102,300 17,096 23,828,463
Liabilities
Due to banks 2,617,534 10,741,529 - 13,359,063
Other borrowed funds 19,047,337 56,791,401 - 75,838,738
Other 267,028 74,343 30 341,401
Total financial liabilities 21,931,899 67,607,273 30 89,539,202
Net on-statement of financial position 1,777,168 (67,504,973) 17,066 (65,710,739)
The Company
J$ US$ TT$ Total
September 30, 2019 $’000 $’000 $’000 $’000
Assets
Due from banks 3,270,783 557,114 16,271 3,844,168
Loan to related party 251,852 - - 251,852
Investment securities 7,115,932 - - 7,115,932
Other 14,836,687 4,456 - 14,841,143
Total financial assets 25,475,254 561,570 16,271 26,053,095
Liabilities
Due to banks 2,338,352 10,273,668 - 12,612,020
Other borrowed funds 22,403,508 54,104,525 - 76,508,033
Other 336,617 261,017 28,810 626,444
Total financial liabilities 25,078,477 64,639,210 28,810 89,746,497
Net on-statement of financial position 396,777 (64,077,640) (12,539) (63,693,402)
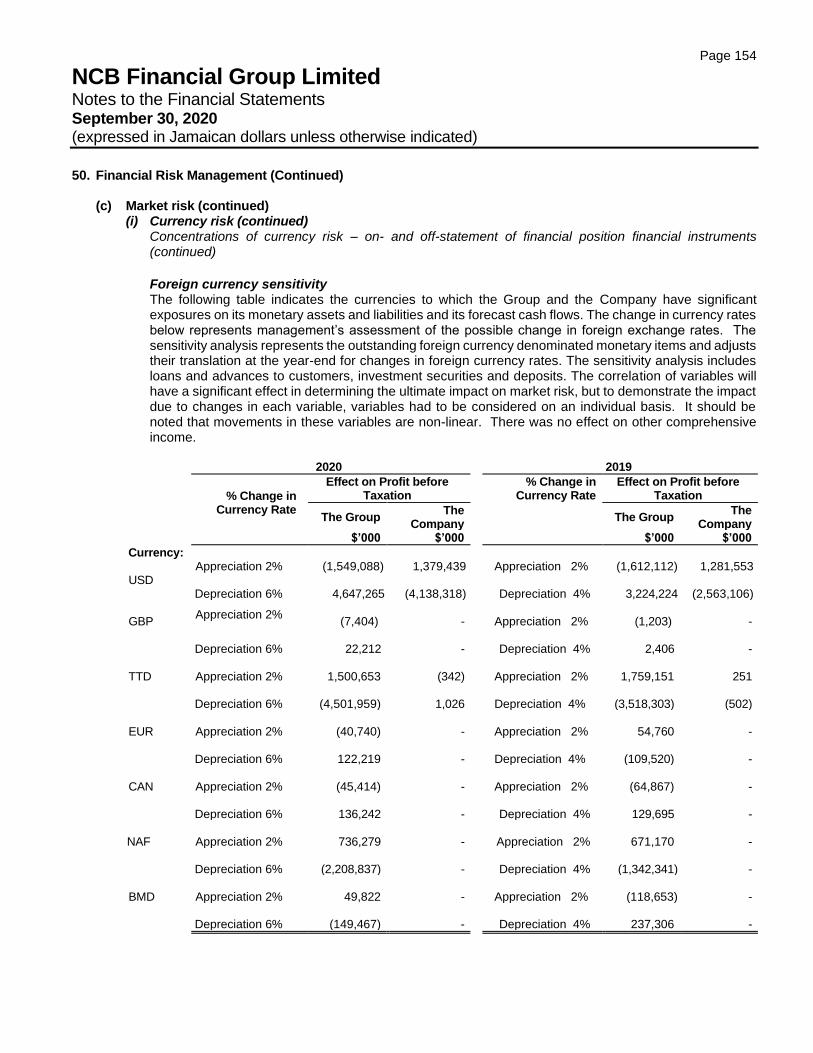
Page 154
NCB Financial Group Limited Notes to the Financial Statements September 30, 2020 (expressed in Jamaican dollars unless otherwise indicated)
50. Financial Risk Management (Continued)
(c) Market risk (continued) (i) Currency risk (continued)
Concentrations of currency risk – on- and off-statement of financial position financial instruments (continued)
Foreign currency sensitivity The following table indicates the currencies to which the Group and the Company have significant exposures on its monetary assets and liabilities and its forecast cash flows. The change in currency rates below represents management’s assessment of the possible change in foreign exchange rates. The sensitivity analysis represents the outstanding foreign currency denominated monetary items and adjusts their translation at the year-end for changes in foreign currency rates. The sensitivity analysis includes loans and advances to customers, investment securities and deposits. The correlation of variables will have a significant effect in determining the ultimate impact on market risk, but to demonstrate the impact due to changes in each variable, variables had to be considered on an individual basis. It should be noted that movements in these variables are non-linear. There was no effect on other comprehensive income.
2020 2019
% Change in
Currency Rate
Effect on Profit before Taxation
% Change in Currency Rate
Effect on Profit before Taxation
The Group The
Company
The Group The
Company $’000 $’000 $’000 $’000
Currency: USD
Appreciation 2% (1,549,088) 1,379,439 Appreciation 2% (1,612,112) 1,281,553
Depreciation 6% 4,647,265 (4,138,318)
Depreciation 4% 3,224,224 (2,563,106) GBP
Appreciation 2% (7,404) -
Appreciation 2% (1,203) -
Depreciation 6% 22,212 -
Depreciation 4% 2,406 - TTD Appreciation 2% 1,500,653 (342)
Appreciation 2% 1,759,151 251
Depreciation 6% (4,501,959) 1,026
Depreciation 4% (3,518,303) (502)
EUR Appreciation 2% (40,740) -
Appreciation 2% 54,760 -
Depreciation 6% 122,219 -
Depreciation 4% (109,520) -
CAN Appreciation 2% (45,414) -
Appreciation 2% (64,867) -
Depreciation 6% 136,242 -
Depreciation 4% 129,695 - NAF Appreciation 2% 736,279 -
Appreciation 2% 671,170 -
Depreciation 6% (2,208,837) -
Depreciation 4% (1,342,341) -
BMD Appreciation 2% 49,822 -
Appreciation 2% (118,653) -
Depreciation 6% (149,467) -
Depreciation 4% 237,306 -
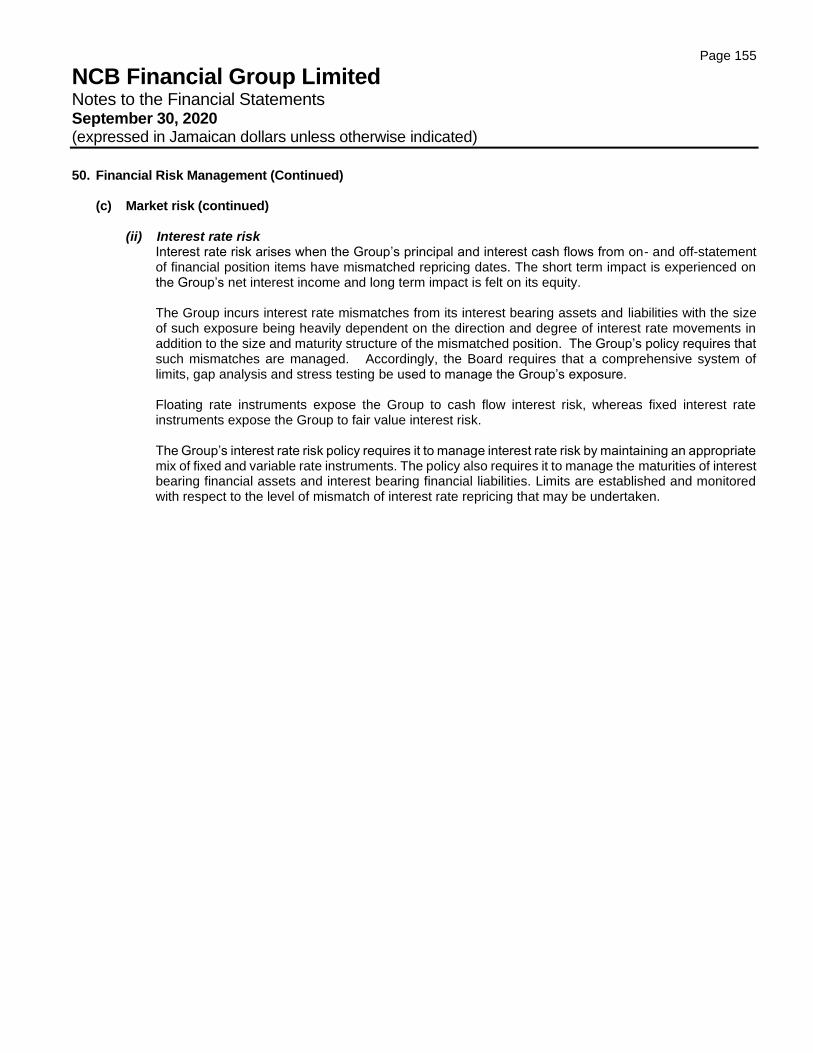
Page 155
NCB Financial Group Limited Notes to the Financial Statements September 30, 2020 (expressed in Jamaican dollars unless otherwise indicated)
50. Financial Risk Management (Continued)
(c) Market risk (continued) (ii) Interest rate risk
Interest rate risk arises when the Group’s principal and interest cash flows from on- and off-statement of financial position items have mismatched repricing dates. The short term impact is experienced on the Group’s net interest income and long term impact is felt on its equity. The Group incurs interest rate mismatches from its interest bearing assets and liabilities with the size of such exposure being heavily dependent on the direction and degree of interest rate movements in addition to the size and maturity structure of the mismatched position. The Group’s policy requires that such mismatches are managed. Accordingly, the Board requires that a comprehensive system of limits, gap analysis and stress testing be used to manage the Group’s exposure. Floating rate instruments expose the Group to cash flow interest risk, whereas fixed interest rate instruments expose the Group to fair value interest risk.
The Group’s interest rate risk policy requires it to manage interest rate risk by maintaining an appropriate mix of fixed and variable rate instruments. The policy also requires it to manage the maturities of interest bearing financial assets and interest bearing financial liabilities. Limits are established and monitored with respect to the level of mismatch of interest rate repricing that may be undertaken.
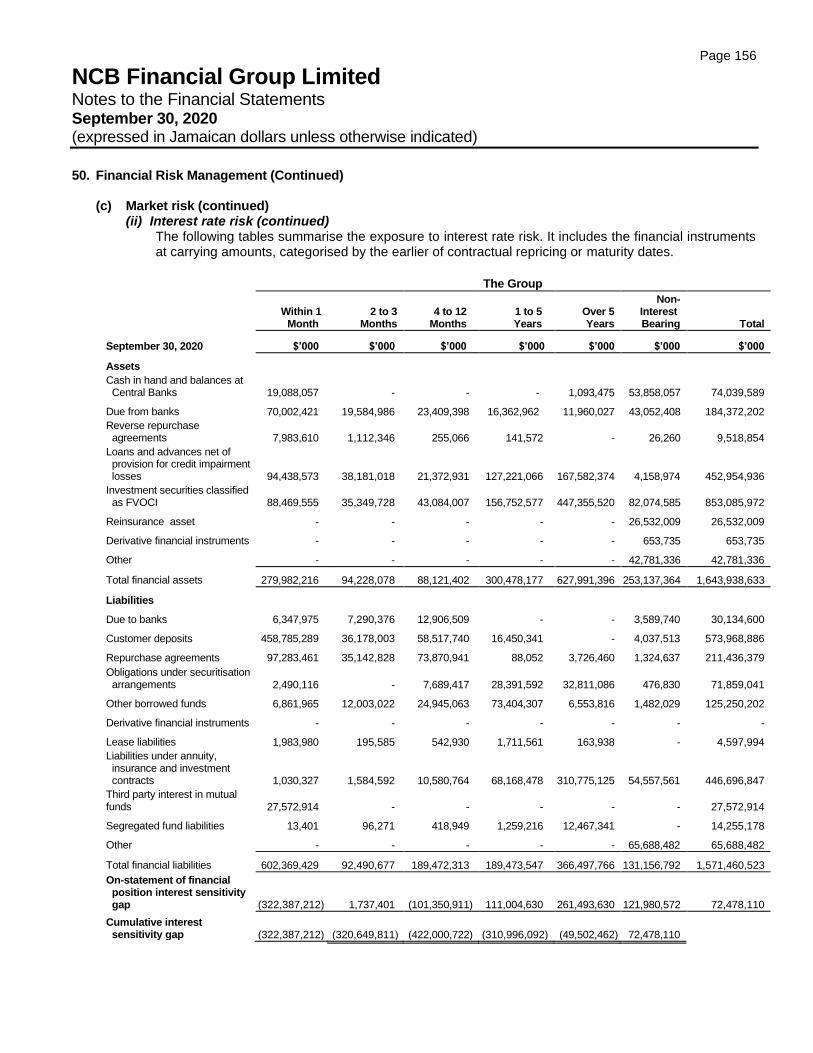
Page 156
NCB Financial Group Limited Notes to the Financial Statements September 30, 2020 (expressed in Jamaican dollars unless otherwise indicated)
50. Financial Risk Management (Continued)
(c) Market risk (continued) (ii) Interest rate risk (continued)
The following tables summarise the exposure to interest rate risk. It includes the financial instruments at carrying amounts, categorised by the earlier of contractual repricing or maturity dates.
The Group
Within 1
Month 2 to 3
Months 4 to 12
Months 1 to 5
Years Over 5 Years
Non-Interest Bearing Total
September 30, 2020 $’000 $’000 $’000 $’000 $’000 $’000 $’000
Assets
Cash in hand and balances at Central Banks 19,088,057 - - - 1,093,475 53,858,057 74,039,589
Due from banks 70,002,421 19,584,986 23,409,398 16,362,962 11,960,027 43,052,408 184,372,202
Reverse repurchase agreements 7,983,610 1,112,346 255,066 141,572 - 26,260 9,518,854
Loans and advances net of provision for credit impairment losses 94,438,573 38,181,018 21,372,931 127,221,066 167,582,374 4,158,974 452,954,936
Investment securities classified as FVOCI 88,469,555 35,349,728 43,084,007 156,752,577 447,355,520 82,074,585 853,085,972
Reinsurance asset - - - - - 26,532,009 26,532,009
Derivative financial instruments - - - - - 653,735 653,735
Other - - - - - 42,781,336 42,781,336
Total financial assets 279,982,216 94,228,078 88,121,402 300,478,177 627,991,396 253,137,364 1,643,938,633
Liabilities
Due to banks 6,347,975 7,290,376 12,906,509 - - 3,589,740 30,134,600
Customer deposits 458,785,289 36,178,003 58,517,740 16,450,341 - 4,037,513 573,968,886
Repurchase agreements 97,283,461 35,142,828 73,870,941 88,052 3,726,460 1,324,637 211,436,379
Obligations under securitisation arrangements 2,490,116 - 7,689,417 28,391,592 32,811,086 476,830 71,859,041
Other borrowed funds 6,861,965 12,003,022 24,945,063 73,404,307 6,553,816 1,482,029 125,250,202
Derivative financial instruments - - - - - - -
Lease liabilities 1,983,980 195,585 542,930 1,711,561 163,938 - 4,597,994
Liabilities under annuity, insurance and investment contracts 1,030,327 1,584,592 10,580,764 68,168,478 310,775,125 54,557,561 446,696,847
Third party interest in mutual funds 27,572,914 - - - - - 27,572,914
Segregated fund liabilities 13,401 96,271 418,949 1,259,216 12,467,341 - 14,255,178
Other - - - - - 65,688,482 65,688,482
Total financial liabilities 602,369,429 92,490,677 189,472,313 189,473,547 366,497,766 131,156,792 1,571,460,523
On-statement of financial position interest sensitivity gap (322,387,212) 1,737,401 (101,350,911) 111,004,630 261,493,630 121,980,572 72,478,110
Cumulative interest sensitivity gap (322,387,212) (320,649,811) (422,000,722) (310,996,092) (49,502,462) 72,478,110
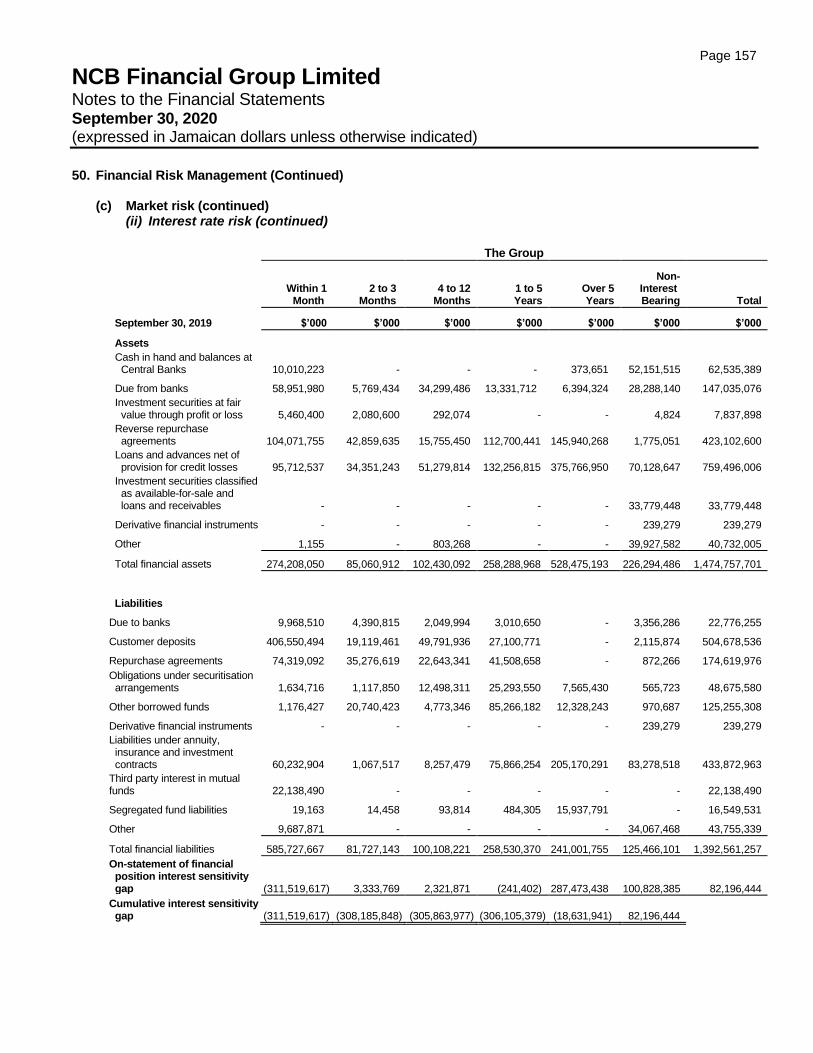
Page 157
NCB Financial Group Limited Notes to the Financial Statements September 30, 2020 (expressed in Jamaican dollars unless otherwise indicated)
50. Financial Risk Management (Continued)
(c) Market risk (continued) (ii) Interest rate risk (continued)
The Group
Within 1
Month 2 to 3
Months 4 to 12
Months 1 to 5
Years Over 5 Years
Non- Interest Bearing Total
September 30, 2019 $’000 $’000 $’000 $’000 $’000 $’000 $’000
Assets
Cash in hand and balances at Central Banks 10,010,223 - - - 373,651 52,151,515 62,535,389
Due from banks 58,951,980 5,769,434 34,299,486 13,331,712 6,394,324 28,288,140 147,035,076
Investment securities at fair value through profit or loss 5,460,400 2,080,600 292,074 - - 4,824 7,837,898
Reverse repurchase agreements 104,071,755 42,859,635 15,755,450 112,700,441 145,940,268 1,775,051 423,102,600
Loans and advances net of provision for credit losses 95,712,537 34,351,243 51,279,814 132,256,815 375,766,950 70,128,647 759,496,006
Investment securities classified as available-for-sale and loans and receivables - - - - - 33,779,448 33,779,448
Derivative financial instruments - - - - - 239,279 239,279
Other 1,155 - 803,268 - - 39,927,582 40,732,005
Total financial assets 274,208,050 85,060,912 102,430,092 258,288,968 528,475,193 226,294,486 1,474,757,701
Liabilities
Due to banks 9,968,510 4,390,815 2,049,994 3,010,650 - 3,356,286 22,776,255
Customer deposits 406,550,494 19,119,461 49,791,936 27,100,771 - 2,115,874 504,678,536
Repurchase agreements 74,319,092 35,276,619 22,643,341 41,508,658 - 872,266 174,619,976
Obligations under securitisation arrangements 1,634,716 1,117,850 12,498,311 25,293,550 7,565,430 565,723 48,675,580
Other borrowed funds 1,176,427 20,740,423 4,773,346 85,266,182 12,328,243 970,687 125,255,308
Derivative financial instruments - - - - - 239,279 239,279
Liabilities under annuity, insurance and investment contracts 60,232,904 1,067,517 8,257,479 75,866,254 205,170,291 83,278,518 433,872,963
Third party interest in mutual funds 22,138,490 - - - - - 22,138,490
Segregated fund liabilities 19,163 14,458 93,814 484,305 15,937,791 - 16,549,531
Other 9,687,871 - - - - 34,067,468 43,755,339
Total financial liabilities 585,727,667 81,727,143 100,108,221 258,530,370 241,001,755 125,466,101 1,392,561,257
On-statement of financial position interest sensitivity gap (311,519,617) 3,333,769 2,321,871 (241,402) 287,473,438 100,828,385 82,196,444
Cumulative interest sensitivity gap (311,519,617) (308,185,848) (305,863,977) (306,105,379) (18,631,941) 82,196,444
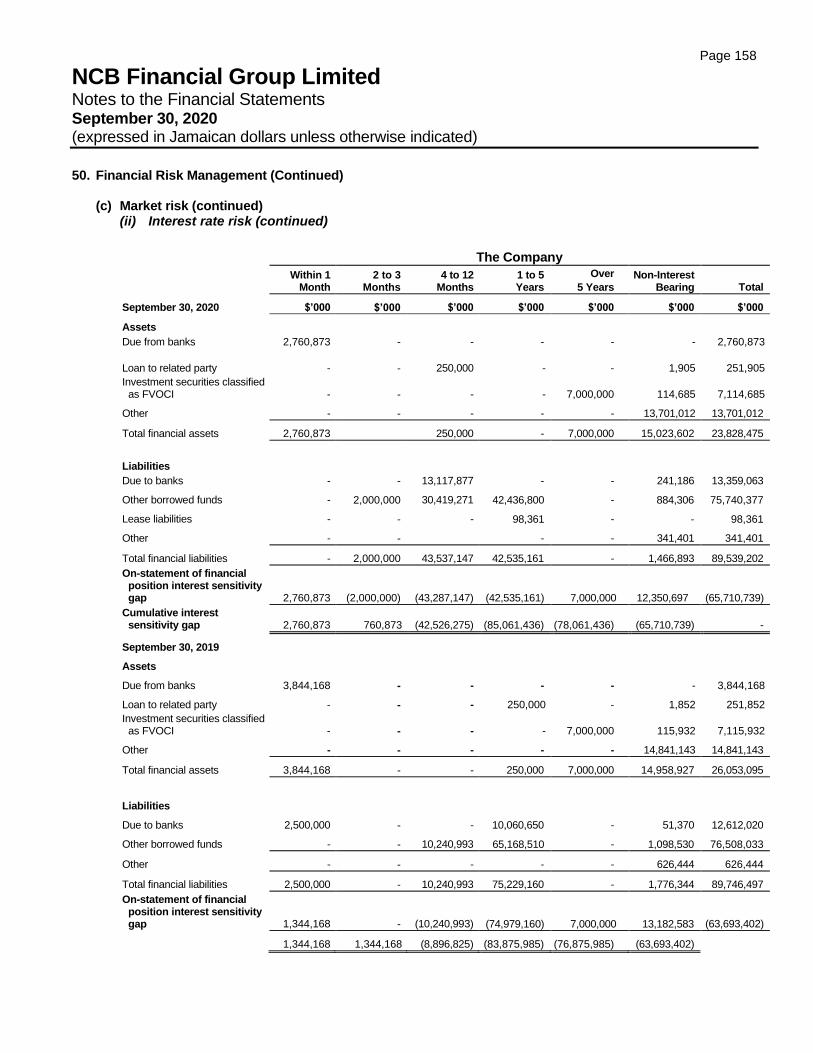
Page 158
NCB Financial Group Limited Notes to the Financial Statements September 30, 2020 (expressed in Jamaican dollars unless otherwise indicated)
50. Financial Risk Management (Continued)
(c) Market risk (continued) (ii) Interest rate risk (continued)
The Company
Within 1
Month 2 to 3
Months 4 to 12
Months 1 to 5
Years Over
5 Years Non-Interest
Bearing Total
September 30, 2020 $’000 $’000 $’000 $’000 $’000 $’000 $’000
Assets
Due from banks 2,760,873 - - - - - 2,760,873
Loan to related party - -
250,000 - - 1,905 251,905
Investment securities classified as FVOCI - - - - 7,000,000 114,685 7,114,685
Other - - - - - 13,701,012 13,701,012
Total financial assets 2,760,873 250,000 - 7,000,000 15,023,602 23,828,475
Liabilities
Due to banks - - 13,117,877 - - 241,186 13,359,063
Other borrowed funds - 2,000,000 30,419,271 42,436,800 - 884,306 75,740,377
Lease liabilities - - - 98,361 - - 98,361
Other - - - - 341,401 341,401
Total financial liabilities - 2,000,000 43,537,147 42,535,161 - 1,466,893 89,539,202
On-statement of financial position interest sensitivity gap 2,760,873 (2,000,000) (43,287,147) (42,535,161) 7,000,000 12,350,697 (65,710,739)
Cumulative interest sensitivity gap 2,760,873 760,873 (42,526,275) (85,061,436) (78,061,436) (65,710,739) -
September 30, 2019
Assets
Due from banks 3,844,168 - - - - - 3,844,168
Loan to related party - - - 250,000 - 1,852 251,852
Investment securities classified as FVOCI - - - - 7,000,000 115,932 7,115,932
Other - - - - - 14,841,143 14,841,143
Total financial assets 3,844,168 - - 250,000 7,000,000 14,958,927 26,053,095
Liabilities
Due to banks 2,500,000 - - 10,060,650 - 51,370 12,612,020
Other borrowed funds - - 10,240,993 65,168,510 - 1,098,530 76,508,033
Other - - - - - 626,444 626,444
Total financial liabilities 2,500,000 - 10,240,993 75,229,160 - 1,776,344 89,746,497
On-statement of financial position interest sensitivity gap 1,344,168 - (10,240,993) (74,979,160) 7,000,000 13,182,583 (63,693,402)
1,344,168 1,344,168 (8,896,825) (83,875,985) (76,875,985) (63,693,402)
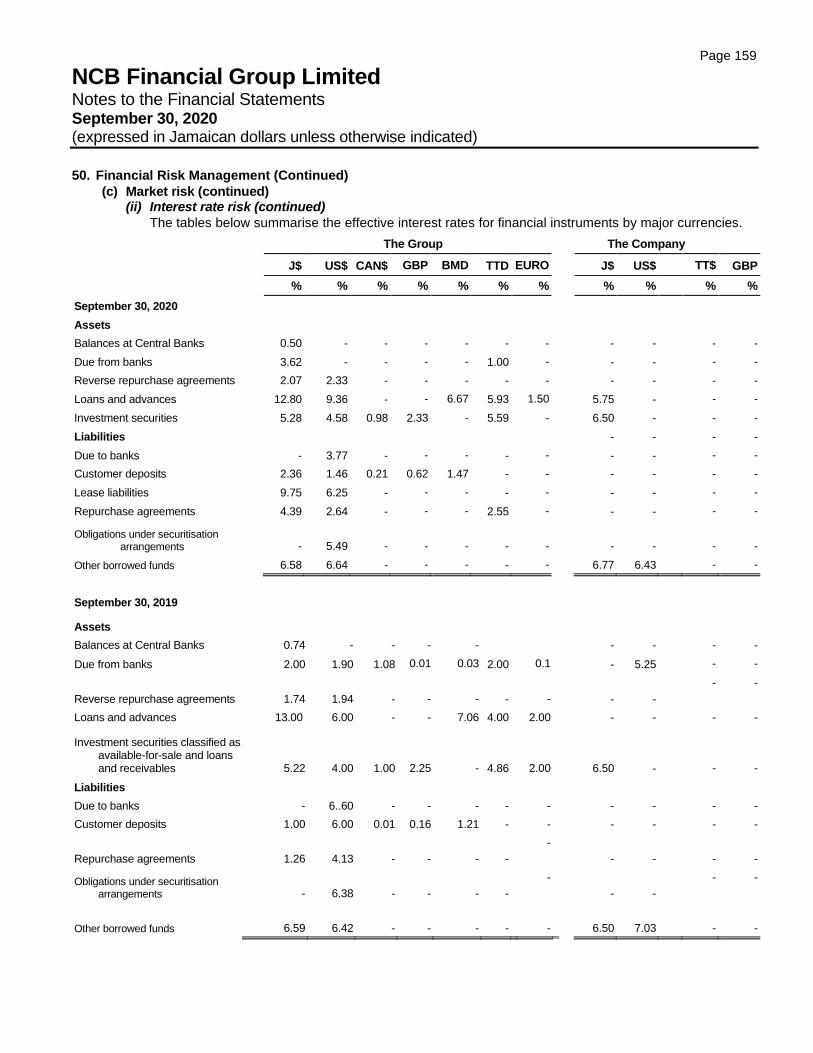
Page 159
NCB Financial Group Limited Notes to the Financial Statements September 30, 2020 (expressed in Jamaican dollars unless otherwise indicated)
50. Financial Risk Management (Continued)
(c) Market risk (continued) (ii) Interest rate risk (continued)
The tables below summarise the effective interest rates for financial instruments by major currencies.
The Group The Company
J$ US$ CAN$ GBP BMD TTD EURO J$ US$ TT$ GBP
% % % % % % % % % % %
September 30, 2020
Assets
Balances at Central Banks 0.50 - - - - - - - - - -
Due from banks 3.62 - - - - 1.00 - - - - -
Reverse repurchase agreements 2.07 2.33 - - - - - - - - -
Loans and advances 12.80 9.36 - - 6.67 5.93 1.50 5.75 - - -
Investment securities 5.28 4.58 0.98 2.33 - 5.59 - 6.50 - - -
Liabilities - - - -
Due to banks - 3.77 - - - - - - - - -
Customer deposits 2.36 1.46 0.21 0.62 1.47 - - - - - -
Lease liabilities 9.75 6.25 - - - - - - - - -
Repurchase agreements 4.39 2.64 - - - 2.55 - - - - -
Obligations under securitisation arrangements - 5.49 -
-
- -
-
- - - -
Other borrowed funds 6.58 6.64 - - - - - 6.77 6.43 - -
September 30, 2019
Assets
Balances at Central Banks 0.74 - - - - - - - -
Due from banks 2.00 1.90 1.08 0.01 0.03 2.00 0.1 - 5.25 - -
Reverse repurchase agreements 1.74 1.94 -
-
- -
-
- -
- -
Loans and advances 13.00 6.00 - - 7.06 4.00 2.00 - - - -
Investment securities classified as available-for-sale and loans and receivables 5.22 4.00 1.00
2.25
- 4.86
2.00
6.50 -
-
-
Liabilities
Due to banks - 6..60 - - - - - - - - -
Customer deposits 1.00 6.00 0.01 0.16 1.21 - - - - - -
Repurchase agreements 1.26 4.13 -
-
- -
-
- - - -
Obligations under securitisation arrangements - 6.38 -
-
- -
-
- -
- -
Other borrowed funds 6.59 6.42 -
-
- -
-
6.50 7.03
-
-

Page 160
NCB Financial Group Limited Notes to the Financial Statements September 30, 2020 (expressed in Jamaican dollars unless otherwise indicated)
50. Financial Risk Management (Continued)
(c) Market risk (continued)
(ii) Interest rate risk (continued)
Interest rate sensitivity The following table indicates the sensitivity to a reasonable possible change in interest rates, with all other variables held constant, on the income statement and stockholders’ equity. The sensitivity of the profit or loss is the effect of the assumed changes in interest rates on net income based on the floating rate of non-trading financial assets and financial liabilities. The sensitivity of other comprehensive income is calculated by revaluing fixed rate FVOCI (2019 - available-for-sale) financial assets for the effects of the assumed changes in interest rates.
The Group
Effect on Net Profit
Before Tax
Effect on
Other Comprehensive
Income
2020
$’000
2020
$’000
Change in basis points:
Decrease - JMD -100 and USD -100 (491,066) 11,987,113
Increase - JMD +100 and USD +100 213,260 (12,065,855)
Effect on Net Profit
Before Tax
Effect on
Other Comprehensive
Income
2019
$’000
2019
$’000
Change in basis points:
Decrease - JMD -100 and USD -50 (557,195) 16,694,783
Increase - JMD +100 and USD +50 489,608 (14,886,152)
The financial instruments of the Company attract a fixed rate of interest and are not subject to fair value interest rate risk.
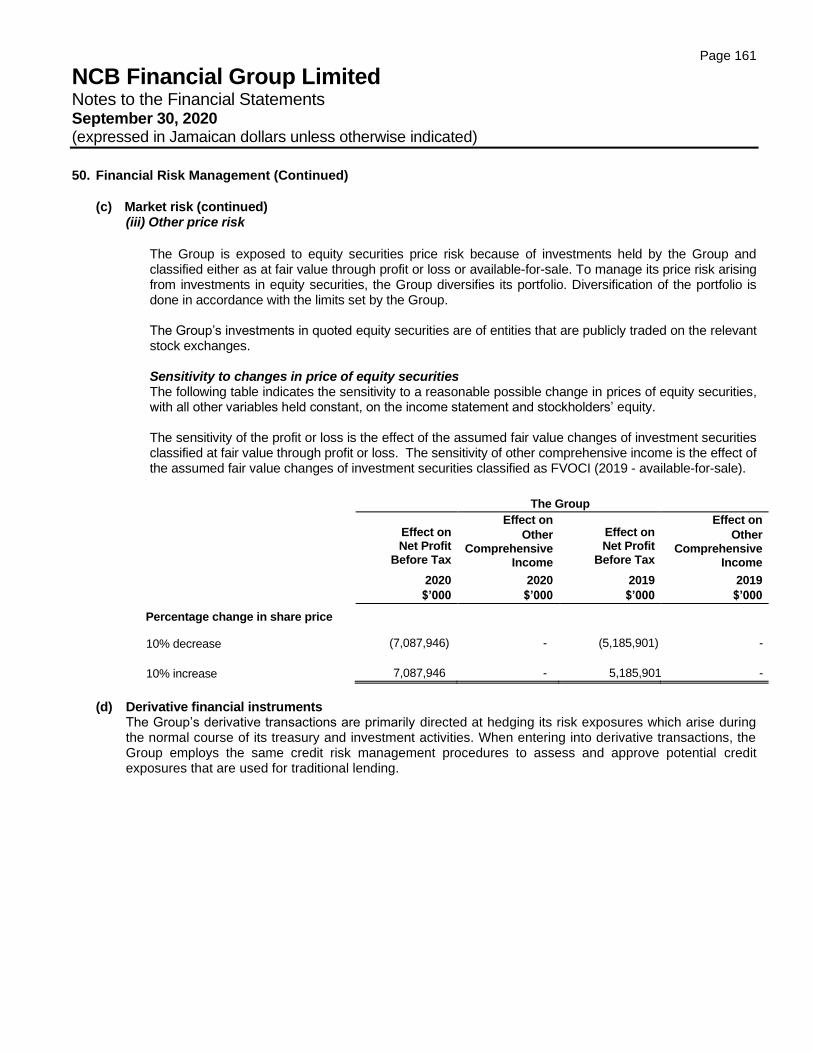
Page 161
NCB Financial Group Limited Notes to the Financial Statements September 30, 2020 (expressed in Jamaican dollars unless otherwise indicated)
50. Financial Risk Management (Continued)
(c) Market risk (continued)
(iii) Other price risk
The Group is exposed to equity securities price risk because of investments held by the Group and classified either as at fair value through profit or loss or available-for-sale. To manage its price risk arising from investments in equity securities, the Group diversifies its portfolio. Diversification of the portfolio is done in accordance with the limits set by the Group.
The Group’s investments in quoted equity securities are of entities that are publicly traded on the relevant stock exchanges. Sensitivity to changes in price of equity securities The following table indicates the sensitivity to a reasonable possible change in prices of equity securities, with all other variables held constant, on the income statement and stockholders’ equity. The sensitivity of the profit or loss is the effect of the assumed fair value changes of investment securities classified at fair value through profit or loss. The sensitivity of other comprehensive income is the effect of the assumed fair value changes of investment securities classified as FVOCI (2019 - available-for-sale).
The Group
Effect on Net Profit
Before Tax
Effect on
Other Comprehensive
Income
Effect on Net Profit
Before Tax
Effect on
Other Comprehensive
Income
2020
$’000
2020
$’000
2019
$’000
2019
$’000
Percentage change in share price
10% decrease (7,087,946) - (5,185,901) -
10% increase 7,087,946 - 5,185,901 -
(d) Derivative financial instruments
The Group’s derivative transactions are primarily directed at hedging its risk exposures which arise during the normal course of its treasury and investment activities. When entering into derivative transactions, the Group employs the same credit risk management procedures to assess and approve potential credit exposures that are used for traditional lending.
Page 162
NCB Financial Group Limited Notes to the Financial Statements September 30, 2020 (expressed in Jamaican dollars unless otherwise indicated)
50. Financial Risk Management (Continued)
(e) Insurance risk The Group issues contracts that transfer insurance risk or financial risk or both.
The risk under any one insurance contract is the possibility that the insured event occurs and the uncertainty of the amount of the resulting claim. By the very nature of an insurance contract this risk is random and therefore unpredictable. Experience shows that the larger the portfolio of similar insurance contracts, the smaller will be the relative variability about the expected outcome. In addition, a more diversified portfolio is less likely to be affected across the board by a change in any subset of the portfolio. For a portfolio of insurance contracts where the theory of probability is applied to pricing and provisioning, the principal risk that the Group faces under insurance contracts is that the actual claims and benefit payments exceed the carrying amount of the insurance liabilities. This could occur because the frequency of or severity of claims and benefits will vary from year to year from the estimate established using statistical techniques.
Life insurance risk The Group issues contracts that have a maximum period determined by the remaining life of the insured. In addition to the estimated benefits which may be payable under the contract, the Group has to assess the cash flows which may be attributable to the contract. The process of underwriting may also be undertaken and may include specific medical tests and other enquiries which affect the Group’s assessment of the risk. Frequency and severity of claims For contracts where death is the insured risk, the most significant factors that could increase the overall frequency and severity of claims are epidemics and wide-ranging lifestyle changes, such as in eating, smoking and exercise habits, resulting in earlier or more claims than expected. For contracts where survival is the insured risk, the most significant factor is continued improvement in medical science and social conditions that would increase longevity. At present, these risks do not vary significantly in relation to the location of the risk insured by the Group. However, undue concentration could have an impact on the severity of benefit payments on a portfolio basis. For contracts with fixed and guaranteed terms, there are no mitigating terms and conditions that reduce the insurance risk accepted. For contracts without fixed terms, a significant portion of the insurance risk is shared with the insured party. The Group charges for mortality risk on a monthly basis for most life and critical insurance contracts without fixed terms. It has the right to alter these charges based on its mortality experience and hence minimise its exposure to mortality risk. The Group charges for mortality risks on a monthly basis for insurance contracts with investment options and has the right to alter these charges based on mortality experience and hence to minimise its exposure to mortality risk on these contracts. Delays in implementing increases in mortality charges, and contractual, market or regulatory restraints over the extent of any increases, may reduce this mitigating effect. The Group also manages mortality risks on its contracts through its underwriting strategy and reinsurance arrangements. The underwriting strategy is intended to minimise the risk of anti-selection. The Group’s underwriting strategy has a twofold approach:
a) products that are subject to traditional methods of application and assessment are controlled by
traditional underwriting methods including medical and financial selection with benefits being limited to reflect the health and/or financial condition of applicants and by the application of retention limits on any single life insured.
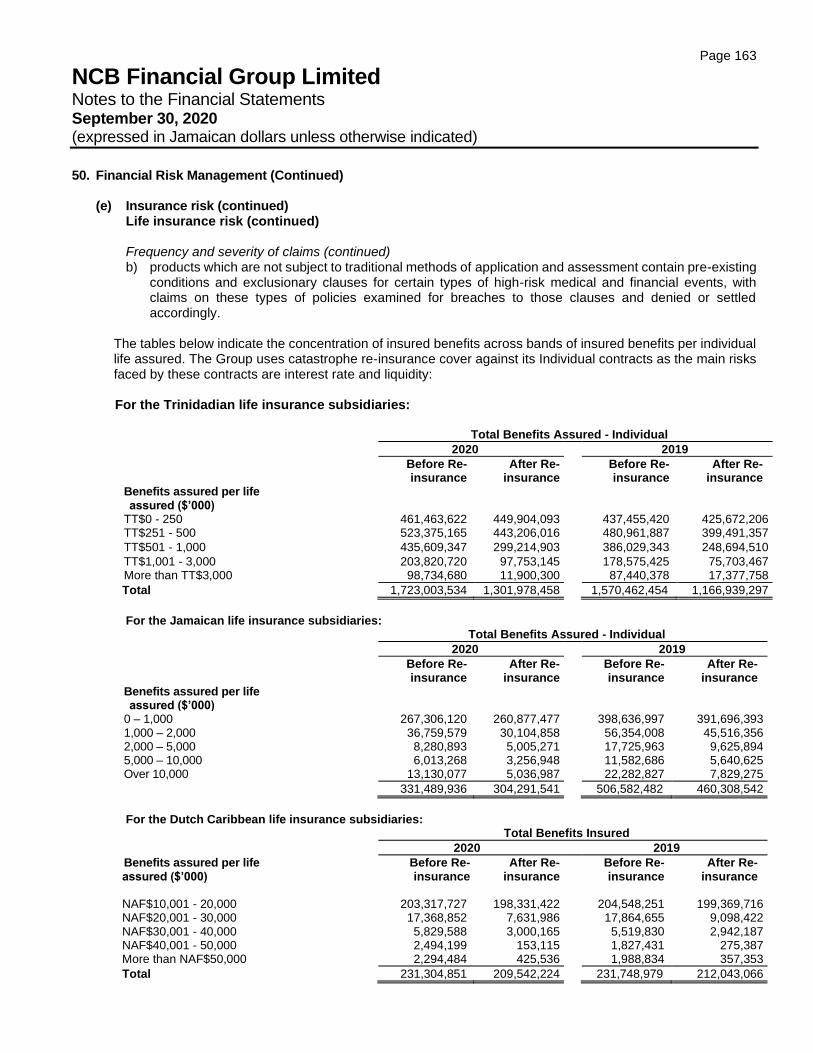
Page 163
NCB Financial Group Limited Notes to the Financial Statements September 30, 2020 (expressed in Jamaican dollars unless otherwise indicated)
50. Financial Risk Management (Continued)
(e) Insurance risk (continued) Life insurance risk (continued)
Frequency and severity of claims (continued) b) products which are not subject to traditional methods of application and assessment contain pre-existing
conditions and exclusionary clauses for certain types of high-risk medical and financial events, with claims on these types of policies examined for breaches to those clauses and denied or settled accordingly.
The tables below indicate the concentration of insured benefits across bands of insured benefits per individual life assured. The Group uses catastrophe re-insurance cover against its Individual contracts as the main risks faced by these contracts are interest rate and liquidity: For the Trinidadian life insurance subsidiaries:
Total Benefits Assured - Individual
2020 2019
Before Re-insurance
After Re-insurance
Before Re-insurance
After Re-insurance
Benefits assured per life assured ($’000)
TT$0 - 250 461,463,622 449,904,093 437,455,420 425,672,206 TT$251 - 500 523,375,165 443,206,016 480,961,887 399,491,357
TT$501 - 1,000 435,609,347 299,214,903 386,029,343 248,694,510
TT$1,001 - 3,000 203,820,720 97,753,145 178,575,425 75,703,467 More than TT$3,000 98,734,680 11,900,300 87,440,378 17,377,758
Total 1,723,003,534 1,301,978,458 1,570,462,454 1,166,939,297
For the Jamaican life insurance subsidiaries:
Total Benefits Assured - Individual
2020 2019
Before Re-insurance
After Re-insurance
Before Re-insurance
After Re-insurance
Benefits assured per life assured ($’000)
0 – 1,000 267,306,120 260,877,477 398,636,997 391,696,393 1,000 – 2,000 36,759,579 30,104,858 56,354,008 45,516,356 2,000 – 5,000 8,280,893 5,005,271 17,725,963 9,625,894 5,000 – 10,000 6,013,268 3,256,948 11,582,686 5,640,625 Over 10,000 13,130,077 5,036,987 22,282,827 7,829,275
331,489,936 304,291,541 506,582,482 460,308,542
For the Dutch Caribbean life insurance subsidiaries:
Total Benefits Insured
2020 2019
Benefits assured per life assured ($’000)
Before Re-insurance
After Re-insurance
Before Re-insurance
After Re-insurance
NAF$10,001 - 20,000 203,317,727 198,331,422 204,548,251 199,369,716 NAF$20,001 - 30,000 17,368,852 7,631,986 17,864,655 9,098,422 NAF$30,001 - 40,000 5,829,588 3,000,165 5,519,830 2,942,187 NAF$40,001 - 50,000 2,494,199 153,115 1,827,431 275,387 More than NAF$50,000 2,294,484 425,536 1,988,834 357,353
Total 231,304,851 209,542,224 231,748,979 212,043,066

Page 164
NCB Financial Group Limited Notes to the Financial Statements September 30, 2020 (expressed in Jamaican dollars unless otherwise indicated)
THIS PAGE WAS INTENTIONALLY LEFT BLANK
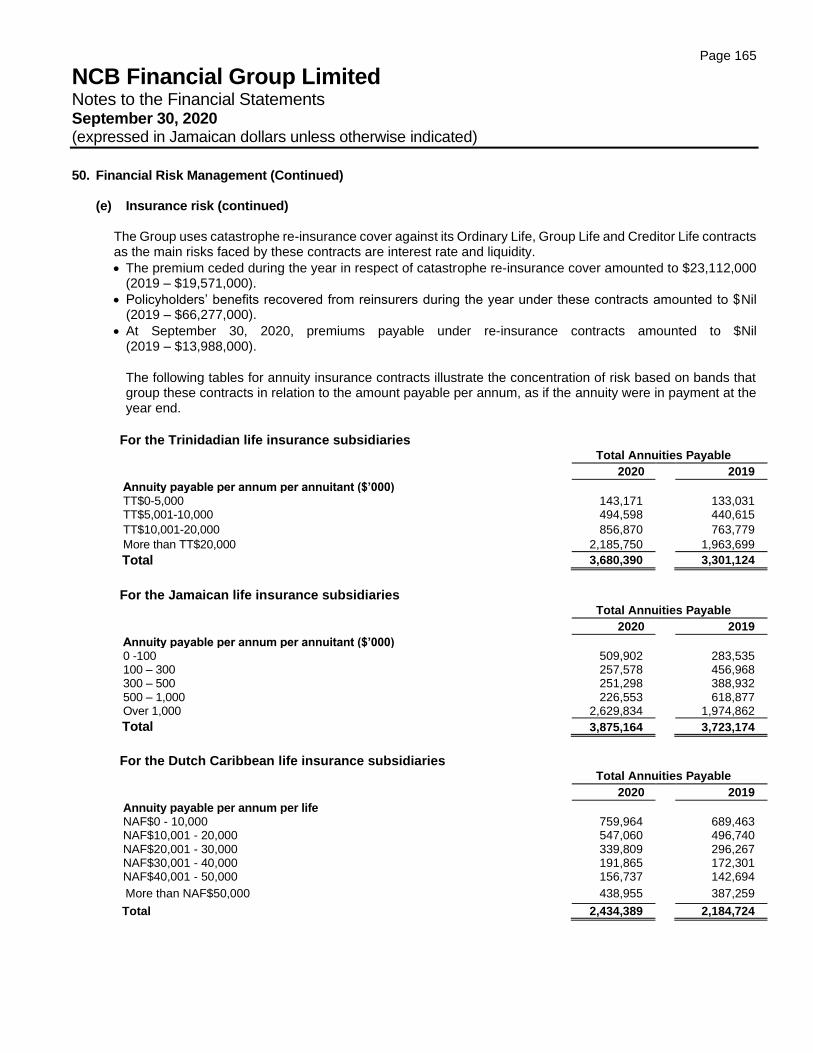
Page 165
NCB Financial Group Limited Notes to the Financial Statements September 30, 2020 (expressed in Jamaican dollars unless otherwise indicated)
50. Financial Risk Management (Continued)
(e) Insurance risk (continued) The Group uses catastrophe re-insurance cover against its Ordinary Life, Group Life and Creditor Life contracts as the main risks faced by these contracts are interest rate and liquidity.
• The premium ceded during the year in respect of catastrophe re-insurance cover amounted to $23,112,000 (2019 – $19,571,000).
• Policyholders’ benefits recovered from reinsurers during the year under these contracts amounted to $Nil (2019 – $66,277,000).
• At September 30, 2020, premiums payable under re-insurance contracts amounted to $Nil (2019 – $13,988,000).
The following tables for annuity insurance contracts illustrate the concentration of risk based on bands that group these contracts in relation to the amount payable per annum, as if the annuity were in payment at the year end.
For the Trinidadian life insurance subsidiaries Total Annuities Payable
2020 2019
Annuity payable per annum per annuitant ($’000) TT$0-5,000 143,171 133,031 TT$5,001-10,000 494,598 440,615
TT$10,001-20,000 856,870 763,779
More than TT$20,000 2,185,750 1,963,699
Total 3,680,390 3,301,124
For the Jamaican life insurance subsidiaries Total Annuities Payable
2020 2019
Annuity payable per annum per annuitant ($’000) 0 -100 509,902 283,535 100 – 300 257,578 456,968 300 – 500 251,298 388,932 500 – 1,000 226,553 618,877 Over 1,000 2,629,834 1,974,862
Total 3,875,164 3,723,174
For the Dutch Caribbean life insurance subsidiaries Total Annuities Payable
2020 2019
Annuity payable per annum per life NAF$0 - 10,000 759,964 689,463 NAF$10,001 - 20,000 547,060 496,740 NAF$20,001 - 30,000 339,809 296,267 NAF$30,001 - 40,000 191,865 172,301 NAF$40,001 - 50,000 156,737 142,694
More than NAF$50,000 438,955 387,259
Total 2,434,389 2,184,724
Page 166
NCB Financial Group Limited Notes to the Financial Statements September 30, 2020 (expressed in Jamaican dollars unless otherwise indicated)
50. Financial Risk Management (Continued)
(e) Insurance risk (continued)
Life insurance risk (continued)
Apart from the catastrophe cover, the Group does not hold any re-insurance against the liabilities in these
contracts.
Insurance risk for contracts disclosed in this note is also affected by the contract holders’ right to pay reduced
or no future premiums, or to terminate the contract completely. As a result, the amount of insurance risk is
also subject to contract holders’ behaviour. The Group has factored the impact of contract holders’ behaviour
into the assumptions used to measure these liabilities.
Sources of uncertainty in the estimation of future benefit payments and premium payments
Uncertainty in the estimation of future benefit payments and premium receipts for long term insurance
contracts arises from the unpredictability of long term changes in overall levels of mortality and morbidity
and the variability in policyholder behaviour.
The Group uses appropriate base tables of standard mortality and morbidity according to the type of contract
being written. An investigation as to the actual experience of the Group is carried out by the Appointed
Actuaries, and a comparison of the actual rates with expected rates is performed. Where data are
insufficient to be statistically credible, the best estimates of future mortality and morbidity are based on
standard industry tables adjusted for the Group’s overall experience. For contracts that insure survival, an
adjustment is made for future mortality and morbidity improvements based on trends identified in the
continuous mortality and morbidity investigations performed by independent actuarial bodies. The Group
maintains voluntary termination statistics to investigate the deviation of actual termination experience
against assumptions. Statistical methods are used to determine appropriate termination rates to be used
for the best estimate assumption.
Page 167
NCB Financial Group Limited Notes to the Financial Statements September 30, 2020 (expressed in Jamaican dollars unless otherwise indicated)
50. Financial Risk Management (Continued)
(e) Insurance risk (continued)
Life insurance risk (continued)
Process used in deriving assumptions
The assumptions for insurance contracts and the process used in deriving these assumptions have remained
substantially unchanged since the previous year.
Estimates are made in two stages:
(i) At inception of the contract, the Group determines assumptions in relation to future deaths, voluntary
terminations, investment returns and administration expenses. These assumptions are used as the base
assumptions for calculating the liabilities; and
(ii) Subsequently, new estimates are developed at each reporting date and the assumptions are altered to
reflect the latest current estimates or experience.
Assumptions are considered to be ‘best estimate’ if, on average, the results are expected to be worse than
the assumptions in 50% of possible scenarios and better in the other 50%. In the case of Jamaica and
Trinidad and Tobago, the assumptions are best estimate assumptions with appropriate provisions for
adverse deviations, consistent with the use of a Policy Premium Method valuation. For other territories, the
assumptions used are those appropriate for traditional net premium valuation methods. See Note 39 for
details on policy assumptions.
Reinsurance risk Reinsurance risk is the risk that a reinsurer will default and not honour obligations arising from claims. The
Group limits the probable loss in the event of individual deaths and any single catastrophic accident
occurrence by reinsuring its insurance risk above certain limits with other insurers. Reinsurance ceded does
not discharge the Group’s liability as the primary insurer. The Group manages reinsurance risk by selecting
reinsurers with high credit ratings and monitoring these on an ongoing basis. The Group arranges its
reinsurance by type of insurance coverage:
• Individual life – This business is covered by excess of loss and quota share reinsurance arrangements.
The method of reinsurance varies for different products with the majority being reinsured on a Yearly
Renewable Term (YRT) basis and others being co-insured.
• Group life – The group life portfolio is reinsured on an excess reinsurance arrangement with Swiss Re.
Separate treaties exist for group life (including critical illness and accidental death and dismemberment)
and group mortgage.
• Catastrophe cover – This cover has been secured for individual life and group life portfolio. It is renewable
annually and is held with Sirius International, RGA and Swiss Re.
Retention limits represent the level of risk retained by the insurer. Coverage in excess of these limits is ceded
to reinsurers up to the treaty limit.
Page 168
NCB Financial Group Limited Notes to the Financial Statements September 30, 2020 (expressed in Jamaican dollars unless otherwise indicated)
50. Financial Risk Management (Continued)
(e) Insurance risk (continued) Property and casualty insurance risk
The Group manages its property and casualty insurance risk through its underwriting policy that includes
inter alia, authority limits, approval procedures for transactions that exceed set limits, pricing guidelines and
the centralised management of reinsurance. The Group actively monitors insurance risk exposures both for
individual and portfolio types of risks. These methods include internal risk measurement, portfolio modelling
and scenario analyses.
Underwriting strategy
The Group manages the risks arising from its underwriting of property and casualty insurance contracts
through policies which provide guidance on how to determine the insurability of risks and exposure to large
claims. The Group follows detailed, uniform underwriting practices and procedures designed to properly
assess and quantify risks before issuing coverage. The Group’s underwriting guidelines also outline
acceptance limits and the appropriate levels of authority for acceptance of risks.
Reinsurance strategy
A detailed analysis of the Group’s exposures, reinsurance needs and quality of reinsurance securities is
conducted by the Board and Senior Management. The Group’s exposures are continually evaluated by
Management to ensure that its reinsurance arrangements remain adequate and mechanisms are in place
to continually monitor the reinsurance counterparties to ensure that they maintain ratings in keeping with the
Board approved Reinsurance Risk Management Policy.
Page 169
NCB Financial Group Limited Notes to the Financial Statements September 30, 2020 (expressed in Jamaican dollars unless otherwise indicated)
50. Financial Risk Management (Continued)
(e) Insurance risk (continued)
Property and casualty insurance risk (continued)
Motor insurance
Motor insurance contracts provide cover in respect of policyholders’ motor vehicles and their liability to third
parties in respect of damage to property and injury. The exposure on motor insurance contracts is normally
limited to the replacement value of the vehicle and a policy limit in respect of third party damage. In general,
claims reporting lags are minor and claims complexity is relatively low.
The risks relating to motor contracts are managed primarily through the pricing and selection process. The
Group monitors and reacts to changes in trends of injury awards, litigation and the frequency of claims
appeals.
Property insurance
Property insurance indemnifies, subject to any limits or excesses, the policyholder against the loss or
damage to their own material property and business interruption arising from this damage. The risk on any
policy varies according to many factors such as location, safety measures in place and the age of the
property. The event giving rise to a claim for damage to buildings or contents usually occurs suddenly (as
for fire and burglary) and the cause is easily determinable. Therefore, claims are generally notified promptly
and can be settled without delay. Property business is therefore classified as “short-tailed” and expense
deterioration and investment return is of less importance in estimating provisions. The cost of repairing or
rebuilding assets, of replacement or indemnity for contents and the time taken to restart or resume
operations to original levels for business interruption losses are the key factors influencing the level of claims
under these policies.
The risks relating to property contracts are managed primarily through the pricing and selection process.
The Group uses strict underwriting criteria to ensure that the risk of losses is acceptable. Furthermore, the
Group accepts property insurance risks for one year so that each contract can be re-priced on renewal to
reflect the continually evolving risk profile.
Liability insurance
Under these contracts, compensation is paid for injury suffered by individuals, including employees or
members of the public. The main liability exposure is in relation to bodily injury. The timing of claim reporting
and settlement is a function of factors such as the nature of the coverage and the policy provisions. Although
bodily injury claims have a relatively long tail, the majority of bodily injury claims are settled in full within three
to four years. In general, these contracts involve higher estimation uncertainty.
Risks arising from liability insurance are managed primarily through pricing, product design, risk selection,
adopting an appropriate investment strategy, rating and reinsurance. The Group monitors and reacts to
changes in the general economic and commercial environment in which it operates to ensure that only
liability risks which meet its criteria for profitability are underwritten. In pricing contracts, the Group makes
assumptions that costs will increase in line with the latest available research.
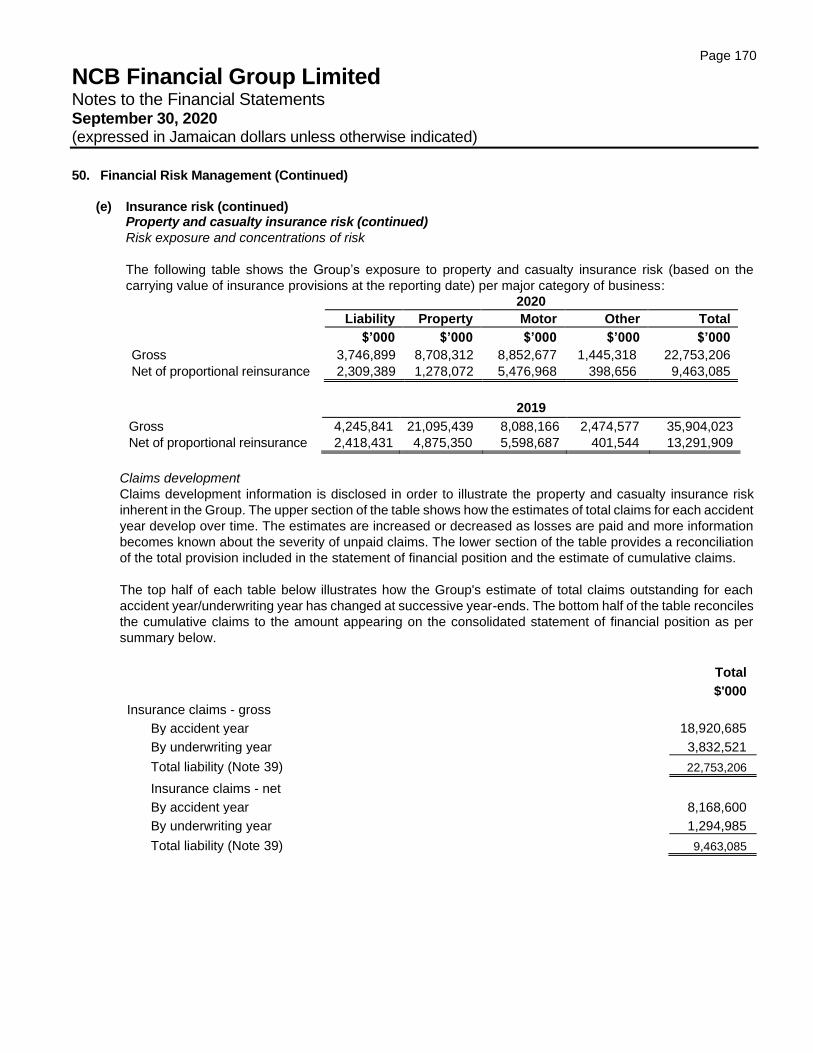
Page 170
NCB Financial Group Limited Notes to the Financial Statements September 30, 2020 (expressed in Jamaican dollars unless otherwise indicated)
50. Financial Risk Management (Continued)
(e) Insurance risk (continued)
Property and casualty insurance risk (continued)
Risk exposure and concentrations of risk
The following table shows the Group’s exposure to property and casualty insurance risk (based on the
carrying value of insurance provisions at the reporting date) per major category of business:
2020
Liability Property Motor Other Total
$’000 $’000 $’000 $’000 $’000
Gross 3,746,899 8,708,312 8,852,677 1,445,318 22,753,206
Net of proportional reinsurance 2,309,389 1,278,072 5,476,968 398,656 9,463,085
2019
Gross 4,245,841 21,095,439 8,088,166 2,474,577 35,904,023
Net of proportional reinsurance 2,418,431 4,875,350 5,598,687 401,544 13,291,909
Claims development
Claims development information is disclosed in order to illustrate the property and casualty insurance risk
inherent in the Group. The upper section of the table shows how the estimates of total claims for each accident
year develop over time. The estimates are increased or decreased as losses are paid and more information
becomes known about the severity of unpaid claims. The lower section of the table provides a reconciliation
of the total provision included in the statement of financial position and the estimate of cumulative claims.
The top half of each table below illustrates how the Group's estimate of total claims outstanding for each
accident year/underwriting year has changed at successive year-ends. The bottom half of the table reconciles
the cumulative claims to the amount appearing on the consolidated statement of financial position as per
summary below.
Total
$'000
Insurance claims - gross
By accident year 18,920,685
By underwriting year 3,832,521
Total liability (Note 39) 22,753,206
Insurance claims - net
By accident year 8,168,600
By underwriting year 1,294,985
Total liability (Note 39) 9,463,085

Page 171
NCB Financial Group Limited Notes to the Financial Statements September 30, 2020 (expressed in Jamaican dollars unless otherwise indicated)
50. Financial Risk Management (Continued)
(e) Insurance risk (continued) Property and casualty insurance risk (continued)
Risk exposure and concentrations of risk(continued)
2013 2014 2015 2016 2017 2018 2019 2020 Total
Insurance claims – gross $’000 $’000 $’000 $’000 $’000 $’000 $’000 $’000 $’000
Accident year
Estimate of cumulative claims costs:
Claims at end of accident year 10,258,031 10,595,055 12,220,012 14,784,153 55,463,927 14,012,089 22,704,679 12,427,996 -
One year later 9,308,672 9,636,716 10,751,855 13,576,295 59,783,049 10,883,553 22,717,429 - -
Two years later 9,567,297 10,141,090 11,053,918 13,297,804 52,656,883 10,220,642 - - -
Three years later 9,162,779 10,132,235 10,862,075 13,298,160 51,040,321 - - - -
Four years later 9,009,623 9,912,758 10,649,003 11,974,178 - - - - -
Five years later 8,921,823 9,785,251 9,121,476 - - - - - -
Six years later 8,878,552 8,699,499 - - - - - - -
Seven years later 7,654,239 - - - - - - - -
Current estimate of cumulative claims
7,654,239 8,699,499 9,121,476 11,974,178 51,040,321 10,220,642 22,717,429 12,427,996 133,855,779
Cumulative payments to date 7,429,173 8,226,610 8,365,049 11,130,790 49,649,265 8,770,802 18,969,818 3,914,957 116,356,463
Liability recognised in the consolidated statement of financial position
225,067 472,889 756,426 843,388 1,391,056
1,449,840
3,747,610
8,613,039
17,499,316
Liability in respect of prior years - - - - - - - - 1,421,369
Total liability - - - - - - - - 18,920,685
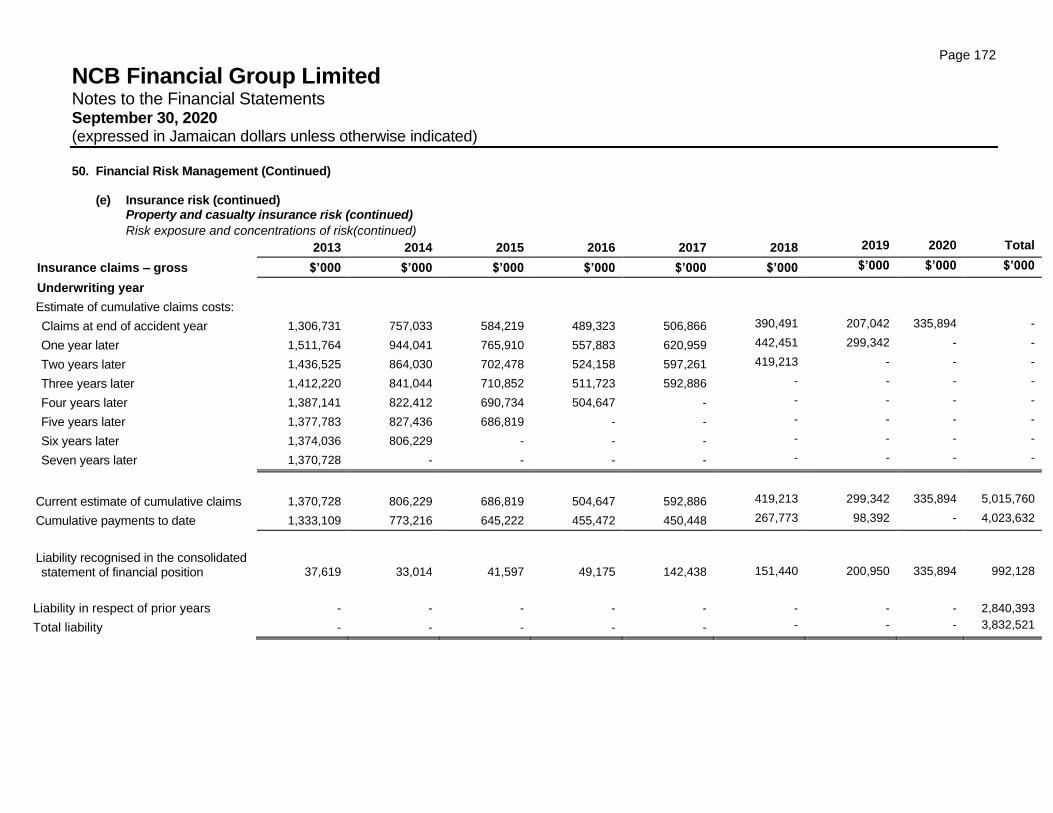
Page 172
NCB Financial Group Limited Notes to the Financial Statements September 30, 2020 (expressed in Jamaican dollars unless otherwise indicated)
50. Financial Risk Management (Continued)
(e) Insurance risk (continued) Property and casualty insurance risk (continued)
Risk exposure and concentrations of risk(continued)
2013 2014 2015 2016 2017 2018 2019 2020 Total
Insurance claims – gross $’000 $’000 $’000 $’000 $’000 $’000 $’000 $’000 $’000
Underwriting year
Estimate of cumulative claims costs:
Claims at end of accident year 1,306,731 757,033 584,219 489,323 506,866 390,491 207,042 335,894 -
One year later 1,511,764 944,041 765,910 557,883 620,959 442,451 299,342 - -
Two years later 1,436,525 864,030 702,478 524,158 597,261 419,213 - - -
Three years later 1,412,220 841,044 710,852 511,723 592,886 - - - -
Four years later 1,387,141 822,412 690,734 504,647 - - - - -
Five years later 1,377,783 827,436 686,819 - - - - - -
Six years later 1,374,036 806,229 - - - - - - -
Seven years later 1,370,728 - - - - - - - -
Current estimate of cumulative claims 1,370,728 806,229 686,819 504,647 592,886 419,213 299,342 335,894 5,015,760
Cumulative payments to date 1,333,109 773,216 645,222 455,472 450,448 267,773 98,392 - 4,023,632
Liability recognised in the consolidated statement of financial position
37,619
33,014
41,597
49,175
142,438
151,440
200,950
335,894
992,128
Liability in respect of prior years - - - - - - - - 2,840,393
Total liability - - - - - - - - 3,832,521
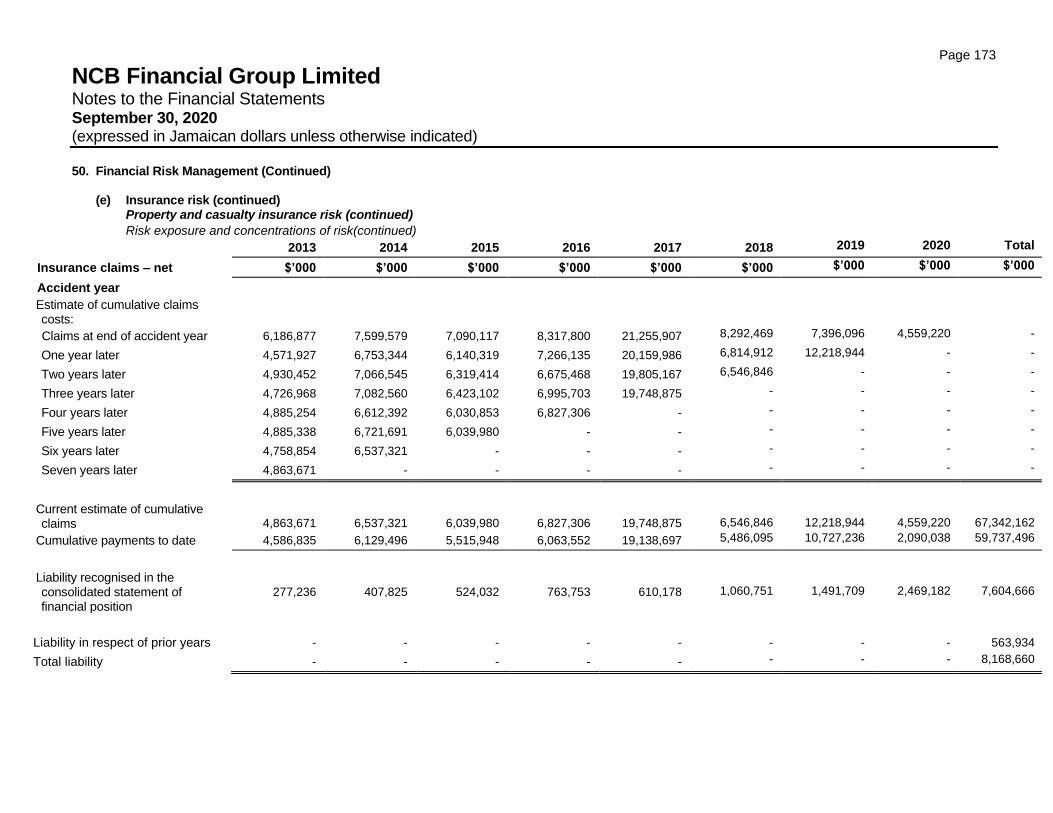
Page 173
NCB Financial Group Limited Notes to the Financial Statements September 30, 2020 (expressed in Jamaican dollars unless otherwise indicated)
50. Financial Risk Management (Continued)
(e) Insurance risk (continued) Property and casualty insurance risk (continued)
Risk exposure and concentrations of risk(continued)
2013 2014 2015 2016 2017 2018 2019 2020 Total
Insurance claims – net $’000 $’000 $’000 $’000 $’000 $’000 $’000 $’000 $’000
Accident year
Estimate of cumulative claims costs:
Claims at end of accident year 6,186,877 7,599,579 7,090,117 8,317,800 21,255,907 8,292,469 7,396,096 4,559,220 -
One year later 4,571,927 6,753,344 6,140,319 7,266,135 20,159,986 6,814,912 12,218,944 - -
Two years later 4,930,452 7,066,545 6,319,414 6,675,468 19,805,167 6,546,846 - - -
Three years later 4,726,968 7,082,560 6,423,102 6,995,703 19,748,875 - - - -
Four years later 4,885,254 6,612,392 6,030,853 6,827,306 - - - - -
Five years later 4,885,338 6,721,691 6,039,980 - - - - - -
Six years later 4,758,854 6,537,321 - - - - - - -
Seven years later 4,863,671 - - - - - - - -
Current estimate of cumulative claims
4,863,671
6,537,321
6,039,980
6,827,306
19,748,875
6,546,846
12,218,944
4,559,220
67,342,162
Cumulative payments to date 4,586,835 6,129,496 5,515,948 6,063,552 19,138,697 5,486,095 10,727,236 2,090,038 59,737,496
Liability recognised in the consolidated statement of financial position
277,236 407,825 524,032 763,753 610,178
1,060,751
1,491,709
2,469,182
7,604,666
Liability in respect of prior years - - - - - - - - 563,934
Total liability - - - - - - - - 8,168,660
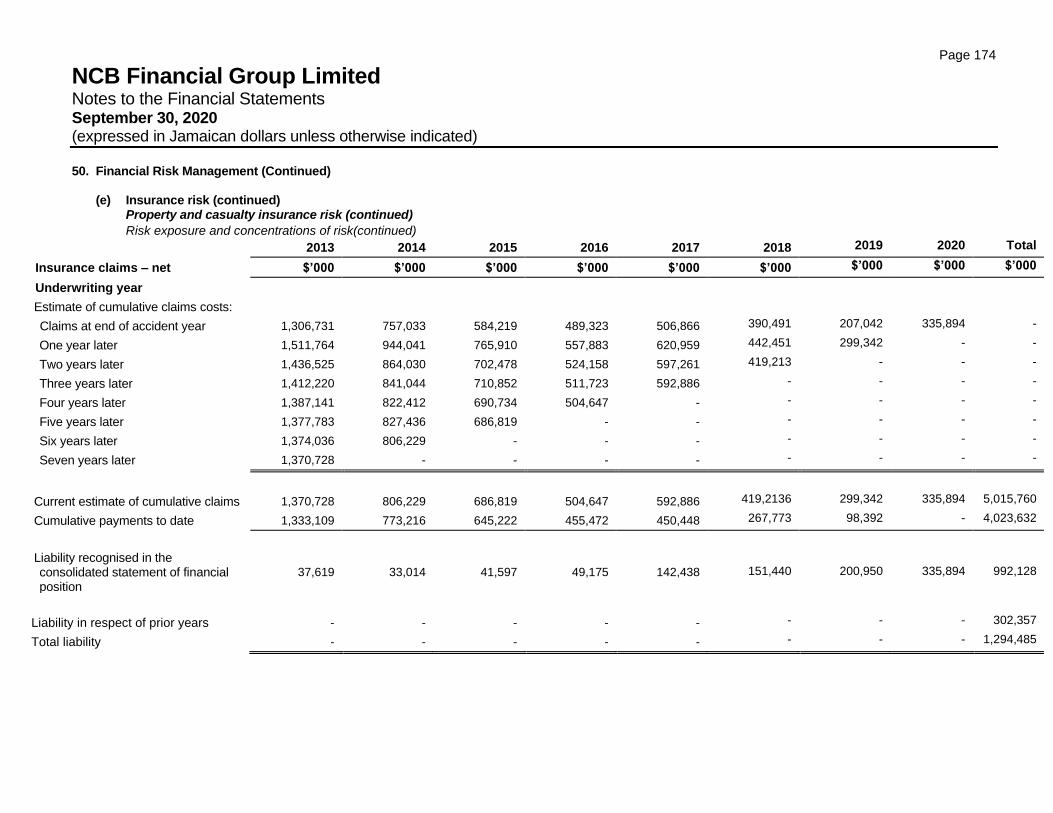
Page 174
NCB Financial Group Limited Notes to the Financial Statements September 30, 2020 (expressed in Jamaican dollars unless otherwise indicated)
50. Financial Risk Management (Continued)
(e) Insurance risk (continued) Property and casualty insurance risk (continued)
Risk exposure and concentrations of risk(continued)
2013 2014 2015 2016 2017 2018 2019 2020 Total
Insurance claims – net $’000 $’000 $’000 $’000 $’000 $’000 $’000 $’000 $’000
Underwriting year
Estimate of cumulative claims costs:
Claims at end of accident year 1,306,731 757,033 584,219 489,323 506,866 390,491 207,042 335,894 -
One year later 1,511,764 944,041 765,910 557,883 620,959 442,451 299,342 - -
Two years later 1,436,525 864,030 702,478 524,158 597,261 419,213 - - -
Three years later 1,412,220 841,044 710,852 511,723 592,886 - - - -
Four years later 1,387,141 822,412 690,734 504,647 - - - - -
Five years later 1,377,783 827,436 686,819 - - - - - -
Six years later 1,374,036 806,229 - - - - - - -
Seven years later 1,370,728 - - - - - - - -
Current estimate of cumulative claims 1,370,728 806,229 686,819 504,647 592,886 419,2136 299,342 335,894 5,015,760
Cumulative payments to date 1,333,109 773,216 645,222 455,472 450,448 267,773 98,392 - 4,023,632
Liability recognised in the consolidated statement of financial position
37,619 33,014 41,597 49,175 142,438
151,440
200,950
335,894
992,128
Liability in respect of prior years - - - - - - - - 302,357
Total liability - - - - - - - - 1,294,485
Page 175
NCB Financial Group Limited Notes to the Financial Statements September 30, 2020 (expressed in Jamaican dollars unless otherwise indicated)
45. 50. Financial Risk Management (Continued)
(f) Capital management
The Group’s objectives when managing capital, which is a broader concept than the ‘equity’ on the face of
the statement of financial position, are:
• To comply with the capital requirements set by the regulators of the financial markets where the entities
within the Group operate;
• To safeguard the Group’s ability to continue as a going concern so that it can continue to provide returns
for stockholders and benefits for other stakeholders; and
• To maintain a strong capital base to support the development of its business.
All of the Group’s significant subsidiaries and associates are individually regulated by the relevant regulator
in their jurisdiction or other regulators. The regulatory requirements to which the subsidiaries are subject,
include minimum capital and liquidity requirements which may limit their ability to extract capital or funds for
other uses. The Group’s subsidiaries and associates are also subject to statutory requirements to restrict
distributions of capital and generally to maintain solvency. In most cases, the regulatory restrictions are
more onerous than the statutory restrictions. Certain Group subsidiaries also raise finance using their
financial assets as collateral. Encumbered assets are not available for transfer around the Group. The
assets typically affected are disclosed in Note 23.
(i) National Commercial Bank Jamaica Limited
Capital adequacy and the use of regulatory capital are monitored daily by the Bank’s management,
employing techniques based on the guidelines developed by the Bank of Jamaica (BOJ/Central Bank),
and the relevant management committees. The required information is filed with the regulator at the
stipulated intervals.
The Central Bank requires the Bank to:
• Hold a specified level of the regulatory capital, and
• Maintain a ratio of total regulatory capital to the risk-weighted assets.
The Bank's regulatory capital is divided into two tiers:
Tier 1 capital: ordinary share capital, non-redeemable non-cumulative preference shares, statutory
reserve fund and retained earnings reserves. Goodwill, other intangibles and any net loss arising from
the aggregate of: current year profit or loss, undistributed profits or accumulated losses for prior financial
years any loss positions on revaluation reserves arising from fair value accounting, are deducted in
arriving at Tier 1 capital; and
Tier 2 capital: non-redeemable cumulative preference shares, redeemable preference shares having an
original term to maturity of five years or more, qualifying subordinated debt and general provisions for
loss.
Equity investments in unconsolidated subsidiaries, substantial investment in any other unconsolidated
entities or companies and share of accumulated losses of any unconsolidated entities are deducted from
Tier 1 and Tier 2 capital to arrive at the regulatory capital. The risk-weighted assets are measured by
means of a hierarchy of four risk weights classified according to the nature of and reflecting an estimate
of credit, market and other risks associated with each asset and counterparty, taking into account any
eligible collateral or guarantees. A similar treatment is adopted for off-statement of financial position
exposure, with some adjustments to reflect the more contingent nature of the potential losses.
The Bank met all the regulatory capital requirements as at September 30, 2020.
Page 176
NCB Financial Group Limited Notes to the Financial Statements September 30, 2020 (expressed in Jamaican dollars unless otherwise indicated)
50. Financial Risk Management (Continued)
(f) Capital management (continued)
(ii) NCB Insurance Agency & Fund Management Limited (formerly NCBIC)
NCBIAFM maintains a capital structure consisting mainly of shareholders’ funds consistent with its profile and the regulatory and market requirements. The company is subject to a number of regulatory capital tests and also employs scenario testing on an annual basis to assess the adequacy of capital. The company has met all of these requirements during the year. Capital adequacy is managed at the operational level.
In reporting financial strength, capital and solvency is measured using the regulations prescribed by the Financial Services Commission (FSC) in Jamaica. These regulatory capital tests are based upon required levels of solvency capital and a series of prudent assumptions in respect of the type of business written by the company.
The relevant capital requirement is the Minimum Continuing Capital Surplus Ratio (MCCSR) determined in accordance with the FSC regulations. This ratio is calculated by the Appointed Actuary and reviewed by executive management, the Audit Committee and the Board of Directors. This measure is a risk-based formula that compares available capital and surplus to a minimum requirement set by the FSC in regard to the asset and liability profile of the company. The company met all FSC regulatory capital requirements as at September 30, 2020.
The company’s capital position is sensitive to changes in market conditions, due to both changes in the value of assets and the effect that changes in investment conditions may have on the value of the liabilities. The most significant sensitivities arise from changes in interest rates and expenses. The company’s capital position is also sensitive to assumptions and experience relating to mortality and persistency.
Page 177
NCB Financial Group Limited Notes to the Financial Statements September 30, 2020 (expressed in Jamaican dollars unless otherwise indicated)
50. Financial Risk Management (Continued) (f) Capital management (continued)
(iii) NCB Capital Markets Limited (NCBCM)
The company is regulated by the FSC and is subject to regulatory capital tests employed by the regulator. Under the FSC regulations, the level of capital adequacy determines the maximum amount of liabilities including repurchase agreements NCBCM is able to offer to clients. In addition to the requirements of the FSC, NCBCM also engages in periodic internal testing which is reviewed by the Risk Management Committee. Capital adequacy is managed at the operational level of NCBCM.
The regulatory capital of the company is divided into two tiers: (i) Tier 1 capital: share capital, retained earnings and reserves created from appropriations of retained
earnings. (ii) Tier 2 capital: qualifying subordinated debt or loan capital, qualifying capital reserves and
unrealised gains derived from the fair valuation of equity instruments classified as FVOCI.
The FSC requires that the company maintains a capital base comprising at least 50% of Tier 1 capital.
In addition, the FSC employs certain ratios to test capital adequacy and solvency. The results of these ratios are included in a mandatory quarterly report submitted to the FSC. Two of the critical early warning ratios relating to the test for capital adequacy are ‘Capital over Total Assets’ and the ‘Capital Base over Risk Weighted Assets (RWA)’.
There was no change in relation to how the company manages its capital during the financial year.
NCBCM met all the FSC regulatory capital requirements as at September 30, 2020.
(iv) Clarien Bank Limited
Capital is held to provide a cushion for unexpected losses. The Board sets the internal level of capital with the aim of ensuring minimum regulatory capital levels are always exceeded whilst allowing for growth in the business. Basel III superseded Basel II and took effect on January 1, 2015 with transitional arrangements until full implementation in 2020. The three pillar framework of Basel II is unchanged but there have been changes to the detailed requirements within each pillar. Pillar 3 has more detailed disclosure requirements and will adopt generic templates over the course of the transition to allow improved comparability and transparency between institutions covered by Basel accords.
Page 178
NCB Financial Group Limited Notes to the Financial Statements September 30, 2020 (expressed in Jamaican dollars unless otherwise indicated)
50. Financial Risk Management (Continued) (f) Capital management (continued)
(iv) Clarien Bank Limited (continued)
The key elements of Basel III changes to capital requirements are as follows:
• Changes to the definition of capital and the introduction of common equity Tier 1 (CET1). Over the transition period there will be changes and additions to capital deductions from CET1 and Tier 2 capital, including the FVOCI reserve.
• Higher thresholds for all forms of capital will be required with an increased focus on CET1. A capital conservation buffer of 2.5% will be introduced and phased in over the implementation period. Additionally, a capital surcharge for Domestic Systemically Important Banks ranging between 0.5% and 3.0% for all Bermuda Banks has also been implemented.
• Introduction of a non-risk based Leverage Ratio, being a measure of Tier 1 capital held against total assets, including certain off-statement of financial position financial commitments.
Clarien has complied with all externally imposed minimum capital requirements throughout the current year. The new Basel rules also address areas of liquidity. The authority has adopted a Liquidity Coverage Ratio (‘LCR’) with phased-in implementation consistent with that published by the Basel Committee. The LCR aims to ensure Banks have sufficient stock of unencumbered highly liquid assets to survive a high liquidity stressed scenario lasting 30 days. The Bank reports its regulatory capital position to the Bermuda Monetary Authority (BMA) on a consolidated legal entity basis each calendar quarter.
Page 179
NCB Financial Group Limited Notes to the Financial Statements September 30, 2020 (expressed in Jamaican dollars unless otherwise indicated)
50. Financial Risk Management (Continued) (f) Capital management (continued)
(v) Guardian Holdings Limited
In each country in which the Group operates, the local insurance regulator indicates the required minimum amount and type of capital that must be held by each of the subsidiaries in addition to their insurance liabilities. The Group is also subject to insurance solvency regulations in all the territories in which it issues insurance and investment contracts. The minimum required capital must be maintained at all times throughout the year. The Group monitors these requirements throughout the year to ensure compliance. The Group has complied with these minimum capital requirements. The Trinidadian trust services subsidiary holds a license under the Financial Institutions Act 2008 and the Securities Industries Act 2012. Under the Financial Institutions Act, the subsidiary is required to have a minimum paid up share capital of $15 million and to transfer a minimum of 10% of its profit after tax to a Statutory Reserve Fund until the balance in the Fund is not less than the paid up capital of the subsidiary as well as the subsidiary's qualifying capital shall be no less than 8% of its risk adjusted assets. Under the Securities Industries Act 2012, the subsidiary is required to have minimum capital of $6 million, of which at least $3 million shall be regulatory capital. The subsidiary has complied with these requirements. The Trinidadian asset management subsidiary holds a license under the Securities Industries Act 2012, and as such, the subsidiary is required to have a minimum capital of $6 million, of which at least $3 million shall be regulatory capital. The subsidiary has complied with this requirement.
Page 180
NCB Financial Group Limited Notes to the Financial Statements September 30, 2020 (expressed in Jamaican dollars unless otherwise indicated)
51. Fair Values of Financial Instruments
The Group measures fair values using the following fair value hierarchy which reflects the significance of the inputs used in making the measurements:
• Level 1 – inputs that are quoted market prices (unadjusted) in active markets for identical instruments.
• Level 2 – inputs other than quoted market prices included within level 1 that are observable, either directly (i.e., as prices) or indirectly (i.e., derived from prices).
• Level 3 – inputs that are unobservable. The objective of valuation techniques is to arrive at a fair value measurement that reflects the price that would be received to sell the asset or paid to transfer the liability in an orderly transaction between market participants at the measurement date. The fair value of financial instruments traded in active markets is based on quoted market prices at the date of the statement of financial position. A market is regarded as active if quoted prices are readily and regularly available from an exchange, dealer, broker, industry group, pricing service or regulatory agency, and those prices represent actual and regularly occurring market transactions on an arm’s length basis. The quoted market price used for financial assets is the current bid price. These instruments are grouped in Level 1 and comprise most equity securities that are quoted on the Jamaica Stock Exchange.
The fair value of financial instruments not traded in an active market is determined by using valuation techniques. These valuation techniques maximise the use of observable market data where it is available and rely as little as possible on entity specific estimates. If all significant inputs required to fair value an instrument are observable, the instrument is included in Level 2. This category includes government bonds, certificates of deposit, commercial paper and most liquid corporate bonds. Indicative prices or yields of these instruments are obtained from regular, publicly available quotes by reputable pricing services, dealers and brokers, such as Bloomberg and Oppenheimer. The Group’s derivatives are also included in Level 2. The embedded put option is valued using a discounted cash flow model representing the difference between the present values of future cash flows with and without exercise of the put option using observable market yields for government bonds of similar tenure. Equity-linked options are valued using standard option pricing models using observable market data from Bloomberg. If one or more of the significant inputs is not based on observable market data, the instrument is included in Level 3.
Unquoted equities are carried at cost as the fair value cannot be reliably determined. These securities are classified at level 3.
Page 181
NCB Financial Group Limited Notes to the Financial Statements September 30, 2020 (expressed in Jamaican dollars unless otherwise indicated)
51. Fair Values of Financial Instruments (Continued) The following tables provide an analysis of financial instruments held as at the date of the statement of financial position that, subsequent to initial recognition, are measured at fair value. The financial instruments are classified in the fair value hierarchy into which the fair value measurement is categorised:
The Group
Level 1 Level 2 Level 3 Total
$’000 $’000 $’000 $’000
At September 30, 2020
Financial assets
Investment securities classified as FVOCI
Government of Jamaica debt securities - 272,393,802 2,414,221 274,808,023
Other Government Securities 9,849,223 36,521,799 2,206,283 48,577,305
Corporate Debt Securities 4,653,910 47,132,535 66,212,932 117,999,377
14,503,133 356,048,136 70,833,436 441,384,705
Investment securities at fair value through profit or loss
Government of Jamaica debt securities - 17,042,357 - 17,042,357
Government of Jamaica guaranteed corporate bonds
- - - -
Other Government Securities 11,632,631 67,582,769 - 79,215,400
Corporate Debt Securities 3,210,926 15,783,137 5,164,034 24,158,097
Quoted & Unquoted equity securities 61,330,073 3,932,621 5,617,726 70,880,421
Other securities 235,708 1,181,881 164,587 1,582,176
76,409,338 105,522,765 10,946,347 192,878,450
Derivative financial instruments - 653,735 - 653,735
90,912,471 462,224,636 81,779,783 634,916,890
Financial liabilities
Derivative financial instruments
Liabilities under annuity and insurance contracts - - 405,014,541 405,014,541
- - 405,014,541 405,014,541
Page 182
NCB Financial Group Limited Notes to the Financial Statements September 30, 2020 (expressed in Jamaican dollars unless otherwise indicated)
51. Fair Values of Financial Instruments (Continued)
The Group - Restated
Level 1 Level 2 Level 3 Total $’000 $’000 $’000 $’000
At September 30, 2019 Financial assets Investment securities classified as FVOCI Government of Jamaica debt securities - 215,038,729 1,938,660 216,977,389 Other Government Securities 5,447,804 40,633,915 1,998,243 48,079,962 Corporate Debt Securities 5,383,349 25,009,885 84,745,677 115,138,911
10,831,153 280,682,529 88,682,580 380,196,262
Investment securities at fair value through profit or loss
Government of Jamaica guaranteed corporate bonds
- 18,086,395 - 18,086,395
Other Government Securities 9,757,657 54,503,445 - 64,261,102 Corporate Debt Securities 3,557,027 15,804,120 5,012,781 24,373,928 Quoted & Unquoted equity securities 56,035,269 1,328,997 4,283,305 61,647,571 Other securities 245,084 351,284 149,707 746,075
69,595,037 90,074,241 9,445,793 169,115,071
Derivative financial instruments - 239,279 - 239,279 80,426,190 370,996,049 98,128,374 549,550,612
Financial liabilities Derivative financial instruments - 239,279 - 239,279 Liabilities under annuity and insurance contracts - - 394,615,307 394,615,307
- 239,279 394,615,307 394,854,586
The movement in the Group’s financial assets classified as Level 3 during the year is as follows:
The Group
2020 $'000
2019 $'000
At start of year 98,128,374 3,067,916
On acquisition of GHL - 3,265,687
Transfer between levels based on adoption of IFRS 9 1,815,795 59,709,796
Acquisitions 39,226,448 35,728,198
Disposals (56,476,747) (4,786,108)
Fair value gains (914,087) 1,137,885
At end of year 81,779,783 98,128,374
The movement in liabilities under annuity and insurance contracts is disclosed in Note 39.
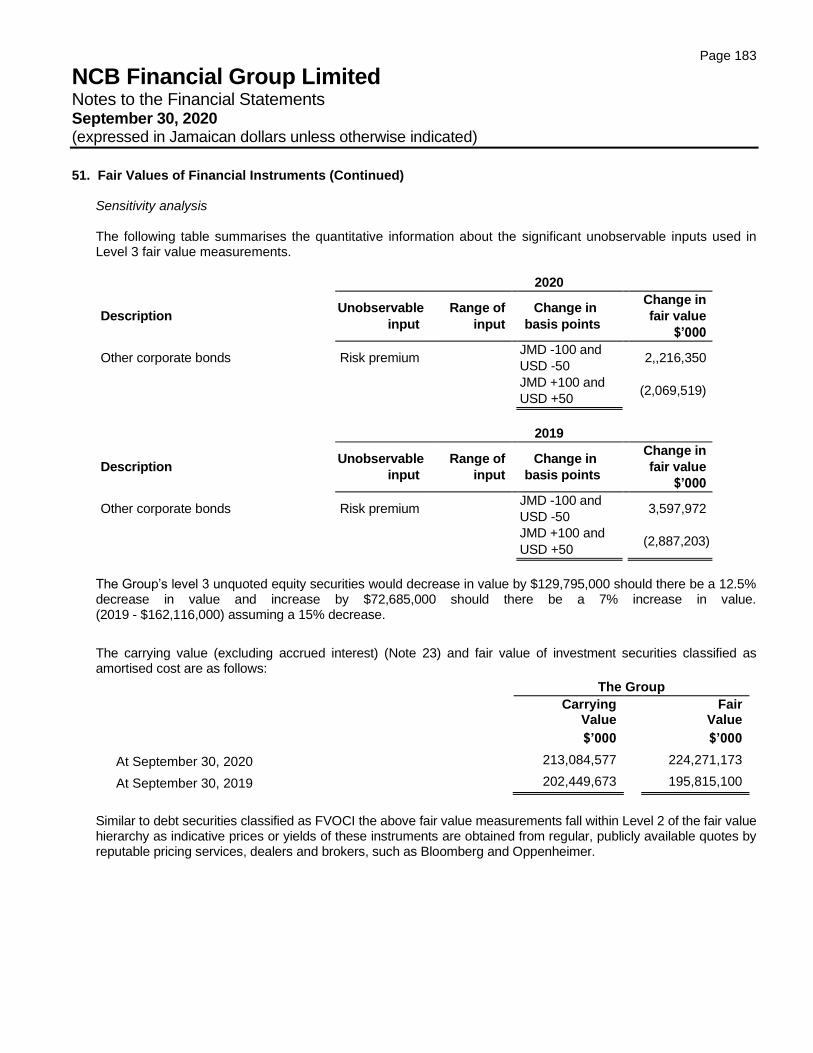
Page 183
NCB Financial Group Limited Notes to the Financial Statements September 30, 2020 (expressed in Jamaican dollars unless otherwise indicated)
51. Fair Values of Financial Instruments (Continued)
Sensitivity analysis The following table summarises the quantitative information about the significant unobservable inputs used in Level 3 fair value measurements.
2020
Description Unobservable
input
Range of
input
Change in
basis points
Change in
fair value
$’000
Other corporate bonds Risk premium JMD -100 and
USD -50 2,,216,350
JMD +100 and
USD +50 (2,069,519)
2019
Description Unobservable
input
Range of
input
Change in
basis points
Change in
fair value
$’000
Other corporate bonds Risk premium JMD -100 and
USD -50 3,597,972
JMD +100 and
USD +50 (2,887,203)
The Group’s level 3 unquoted equity securities would decrease in value by $129,795,000 should there be a 12.5% decrease in value and increase by $72,685,000 should there be a 7% increase in value. (2019 - $162,116,000) assuming a 15% decrease.
The carrying value (excluding accrued interest) (Note 23) and fair value of investment securities classified as amortised cost are as follows:
The Group
Carrying
Value Fair
Value
$’000 $’000
At September 30, 2020 213,084,577 224,271,173
At September 30, 2019 202,449,673 195,815,100
Similar to debt securities classified as FVOCI the above fair value measurements fall within Level 2 of the fair value hierarchy as indicative prices or yields of these instruments are obtained from regular, publicly available quotes by reputable pricing services, dealers and brokers, such as Bloomberg and Oppenheimer.
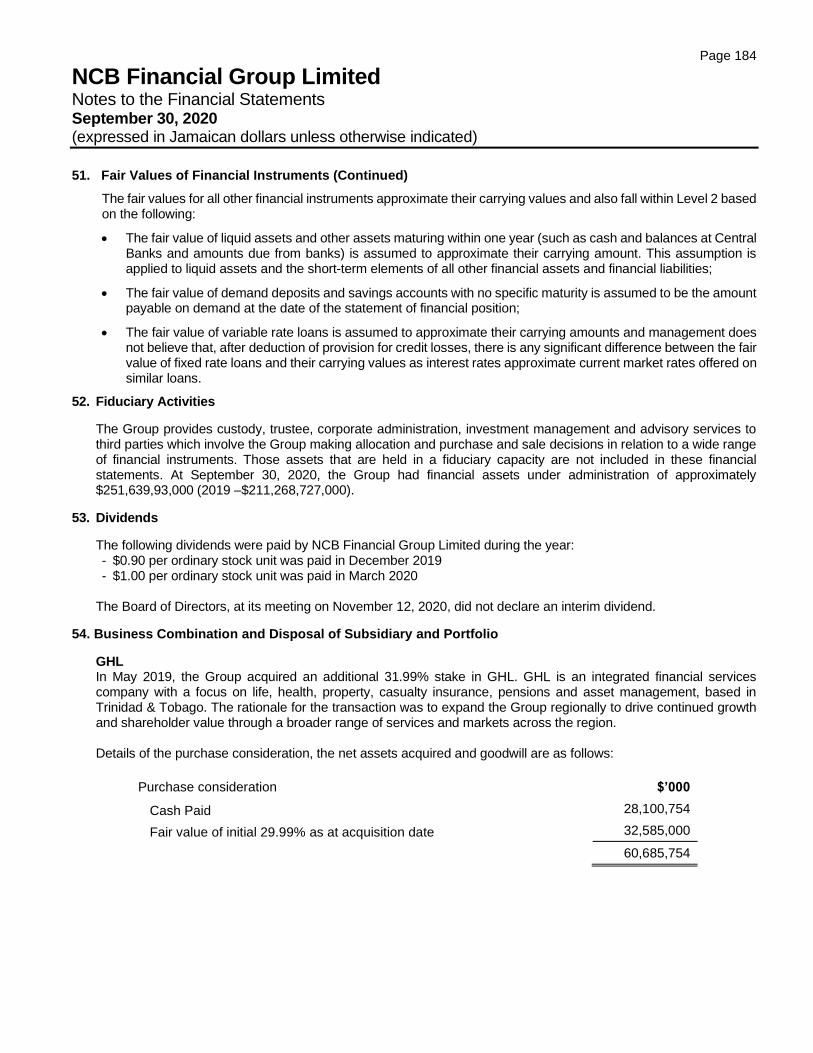
Page 184
NCB Financial Group Limited Notes to the Financial Statements September 30, 2020 (expressed in Jamaican dollars unless otherwise indicated)
51. Fair Values of Financial Instruments (Continued)
The fair values for all other financial instruments approximate their carrying values and also fall within Level 2 based on the following:
• The fair value of liquid assets and other assets maturing within one year (such as cash and balances at Central Banks and amounts due from banks) is assumed to approximate their carrying amount. This assumption is applied to liquid assets and the short-term elements of all other financial assets and financial liabilities;
• The fair value of demand deposits and savings accounts with no specific maturity is assumed to be the amount payable on demand at the date of the statement of financial position;
• The fair value of variable rate loans is assumed to approximate their carrying amounts and management does not believe that, after deduction of provision for credit losses, there is any significant difference between the fair value of fixed rate loans and their carrying values as interest rates approximate current market rates offered on similar loans.
52. Fiduciary Activities
The Group provides custody, trustee, corporate administration, investment management and advisory services to third parties which involve the Group making allocation and purchase and sale decisions in relation to a wide range of financial instruments. Those assets that are held in a fiduciary capacity are not included in these financial statements. At September 30, 2020, the Group had financial assets under administration of approximately $251,639,93,000 (2019 –$211,268,727,000).
53. Dividends
The following dividends were paid by NCB Financial Group Limited during the year: - $0.90 per ordinary stock unit was paid in December 2019 - $1.00 per ordinary stock unit was paid in March 2020
The Board of Directors, at its meeting on November 12, 2020, did not declare an interim dividend.
54. Business Combination and Disposal of Subsidiary and Portfolio
GHL In May 2019, the Group acquired an additional 31.99% stake in GHL. GHL is an integrated financial services company with a focus on life, health, property, casualty insurance, pensions and asset management, based in Trinidad & Tobago. The rationale for the transaction was to expand the Group regionally to drive continued growth and shareholder value through a broader range of services and markets across the region. Details of the purchase consideration, the net assets acquired and goodwill are as follows:
Purchase consideration $’000
Cash Paid 28,100,754
Fair value of initial 29.99% as at acquisition date 32,585,000
60,685,754
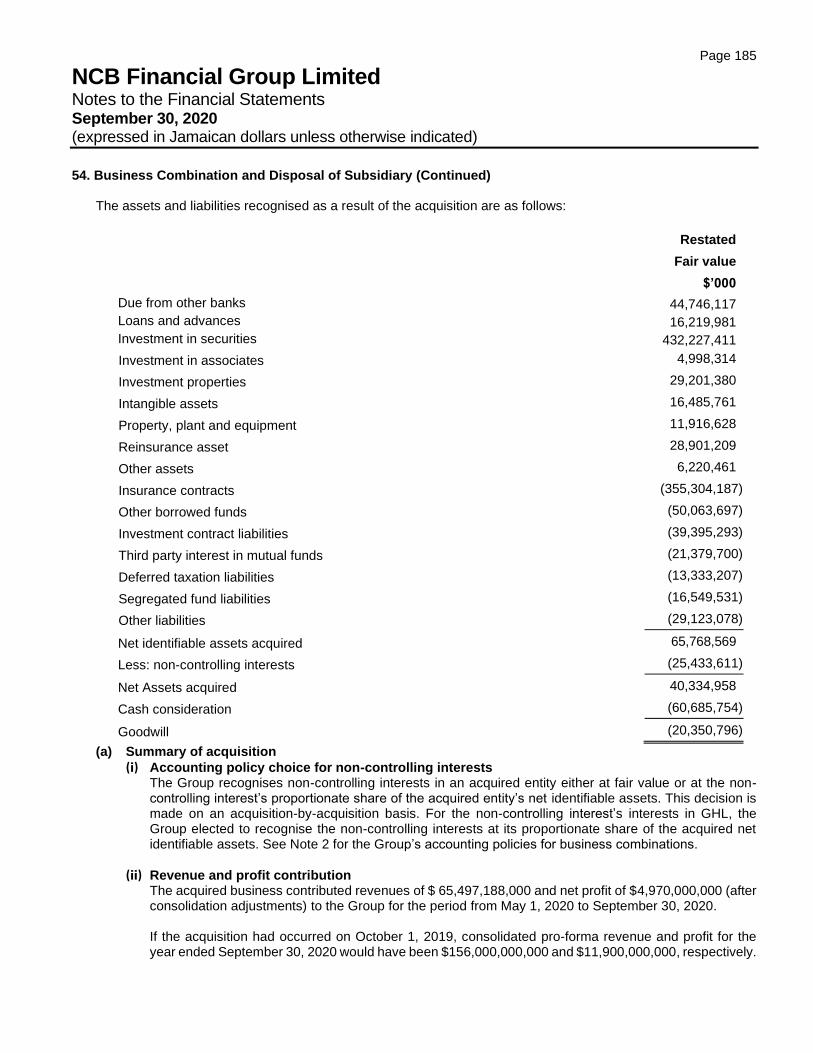
Page 185
NCB Financial Group Limited Notes to the Financial Statements September 30, 2020 (expressed in Jamaican dollars unless otherwise indicated)
54. Business Combination and Disposal of Subsidiary (Continued)
The assets and liabilities recognised as a result of the acquisition are as follows:
Restated
Fair value
$’000
Due from other banks 44,746,117
Loans and advances 16,219,981
Investment in securities 432,227,411
Investment in associates 4,998,314
Investment properties 29,201,380
Intangible assets 16,485,761
Property, plant and equipment 11,916,628
Reinsurance asset 28,901,209
Other assets 6,220,461
Insurance contracts (355,304,187)
Other borrowed funds (50,063,697)
Investment contract liabilities (39,395,293)
Third party interest in mutual funds (21,379,700)
Deferred taxation liabilities (13,333,207)
Segregated fund liabilities (16,549,531)
Other liabilities (29,123,078)
Net identifiable assets acquired 65,768,569
Less: non-controlling interests (25,433,611)
Net Assets acquired 40,334,958
Cash consideration (60,685,754)
Goodwill (20,350,796)
(a) Summary of acquisition
(i) Accounting policy choice for non-controlling interests The Group recognises non-controlling interests in an acquired entity either at fair value or at the non- controlling interest’s proportionate share of the acquired entity’s net identifiable assets. This decision is made on an acquisition-by-acquisition basis. For the non-controlling interest’s interests in GHL, the Group elected to recognise the non-controlling interests at its proportionate share of the acquired net identifiable assets. See Note 2 for the Group’s accounting policies for business combinations.
(ii) Revenue and profit contribution The acquired business contributed revenues of $ 65,497,188,000 and net profit of $4,970,000,000 (after consolidation adjustments) to the Group for the period from May 1, 2020 to September 30, 2020.
If the acquisition had occurred on October 1, 2019, consolidated pro-forma revenue and profit for the year ended September 30, 2020 would have been $156,000,000,000 and $11,900,000,000, respectively.
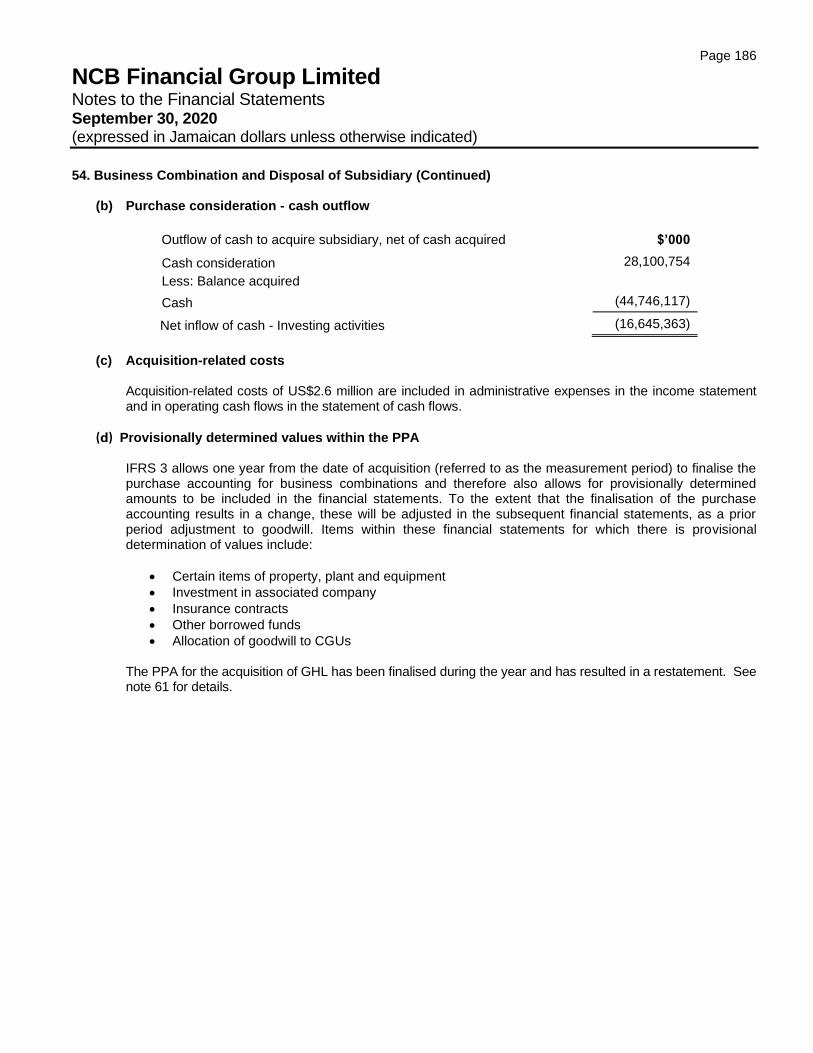
Page 186
NCB Financial Group Limited Notes to the Financial Statements September 30, 2020 (expressed in Jamaican dollars unless otherwise indicated)
54. Business Combination and Disposal of Subsidiary (Continued)
(b) Purchase consideration - cash outflow
Outflow of cash to acquire subsidiary, net of cash acquired $’000
Cash consideration 28,100,754
Less: Balance acquired
Cash (44,746,117)
Net inflow of cash - Investing activities (16,645,363)
(c) Acquisition-related costs
Acquisition-related costs of US$2.6 million are included in administrative expenses in the income statement and in operating cash flows in the statement of cash flows.
(d) Provisionally determined values within the PPA IFRS 3 allows one year from the date of acquisition (referred to as the measurement period) to finalise the purchase accounting for business combinations and therefore also allows for provisionally determined amounts to be included in the financial statements. To the extent that the finalisation of the purchase accounting results in a change, these will be adjusted in the subsequent financial statements, as a prior period adjustment to goodwill. Items within these financial statements for which there is provisional determination of values include:
• Certain items of property, plant and equipment
• Investment in associated company
• Insurance contracts
• Other borrowed funds
• Allocation of goodwill to CGUs The PPA for the acquisition of GHL has been finalised during the year and has resulted in a restatement. See note 61 for details.
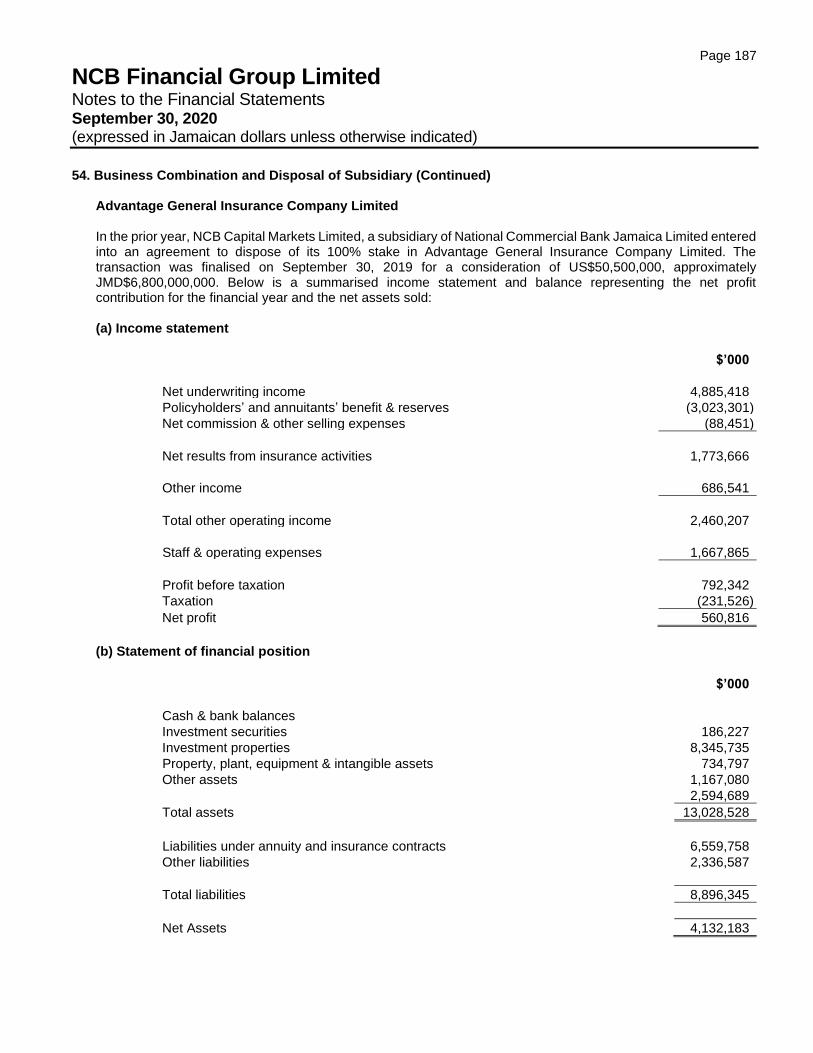
Page 187
NCB Financial Group Limited Notes to the Financial Statements September 30, 2020 (expressed in Jamaican dollars unless otherwise indicated)
54. Business Combination and Disposal of Subsidiary (Continued)
Advantage General Insurance Company Limited In the prior year, NCB Capital Markets Limited, a subsidiary of National Commercial Bank Jamaica Limited entered into an agreement to dispose of its 100% stake in Advantage General Insurance Company Limited. The transaction was finalised on September 30, 2019 for a consideration of US$50,500,000, approximately JMD$6,800,000,000. Below is a summarised income statement and balance representing the net profit contribution for the financial year and the net assets sold:
(a) Income statement
$’000
Net underwriting income 4,885,418
Policyholders’ and annuitants’ benefit & reserves (3,023,301)
Net commission & other selling expenses (88,451)
Net results from insurance activities 1,773,666
Other income 686,541
Total other operating income 2,460,207
Staff & operating expenses 1,667,865
Profit before taxation 792,342
Taxation (231,526)
Net profit 560,816
(b) Statement of financial position
$’000
Cash & bank balances
Investment securities 186,227
Investment properties 8,345,735
Property, plant, equipment & intangible assets 734,797
Other assets 1,167,080
2,594,689
Total assets 13,028,528
Liabilities under annuity and insurance contracts 6,559,758
Other liabilities 2,336,587
Total liabilities 8,896,345
Net Assets 4,132,183
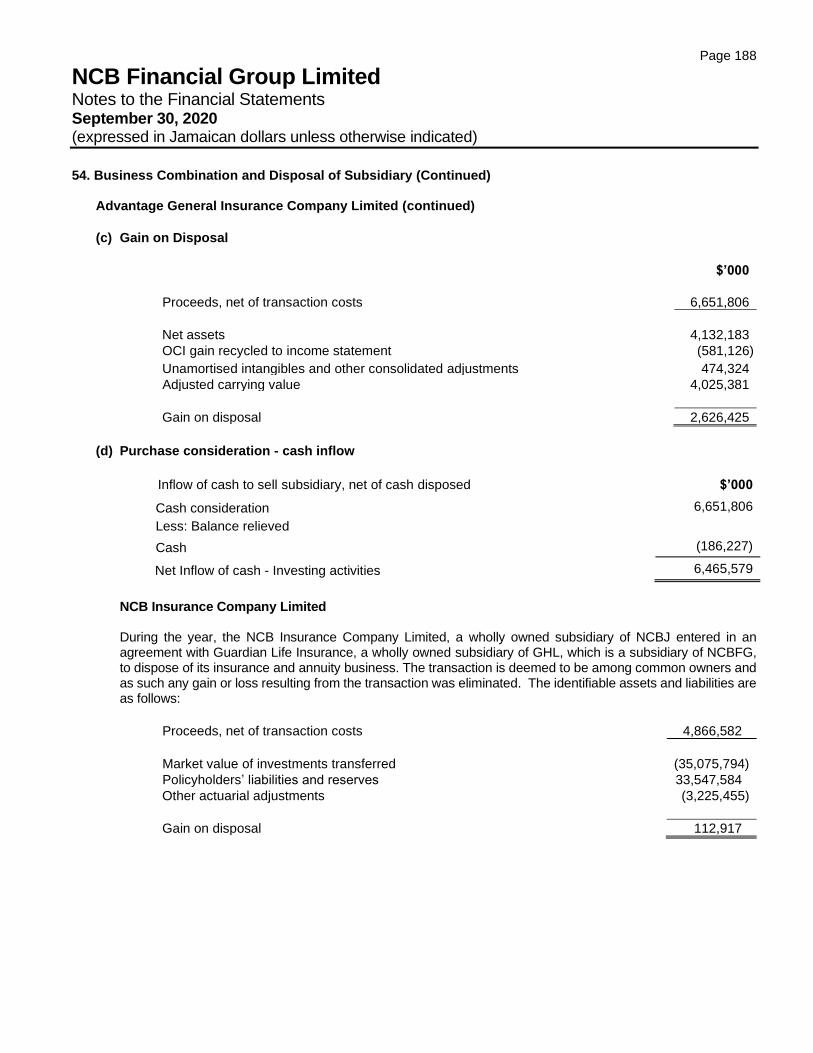
Page 188
NCB Financial Group Limited Notes to the Financial Statements September 30, 2020 (expressed in Jamaican dollars unless otherwise indicated)
54. Business Combination and Disposal of Subsidiary (Continued)
Advantage General Insurance Company Limited (continued)
(c) Gain on Disposal
$’000
Proceeds, net of transaction costs 6,651,806
Net assets 4,132,183
OCI gain recycled to income statement (581,126)
Unamortised intangibles and other consolidated adjustments 474,324
Adjusted carrying value 4,025,381
Gain on disposal 2,626,425
(d) Purchase consideration - cash inflow
Inflow of cash to sell subsidiary, net of cash disposed $’000
Cash consideration 6,651,806
Less: Balance relieved
Cash (186,227)
Net Inflow of cash - Investing activities 6,465,579
NCB Insurance Company Limited During the year, the NCB Insurance Company Limited, a wholly owned subsidiary of NCBJ entered in an agreement with Guardian Life Insurance, a wholly owned subsidiary of GHL, which is a subsidiary of NCBFG, to dispose of its insurance and annuity business. The transaction is deemed to be among common owners and as such any gain or loss resulting from the transaction was eliminated. The identifiable assets and liabilities are as follows:
Proceeds, net of transaction costs 4,866,582
Market value of investments transferred (35,075,794)
Policyholders’ liabilities and reserves 33,547,584
Other actuarial adjustments (3,225,455)
Gain on disposal 112,917
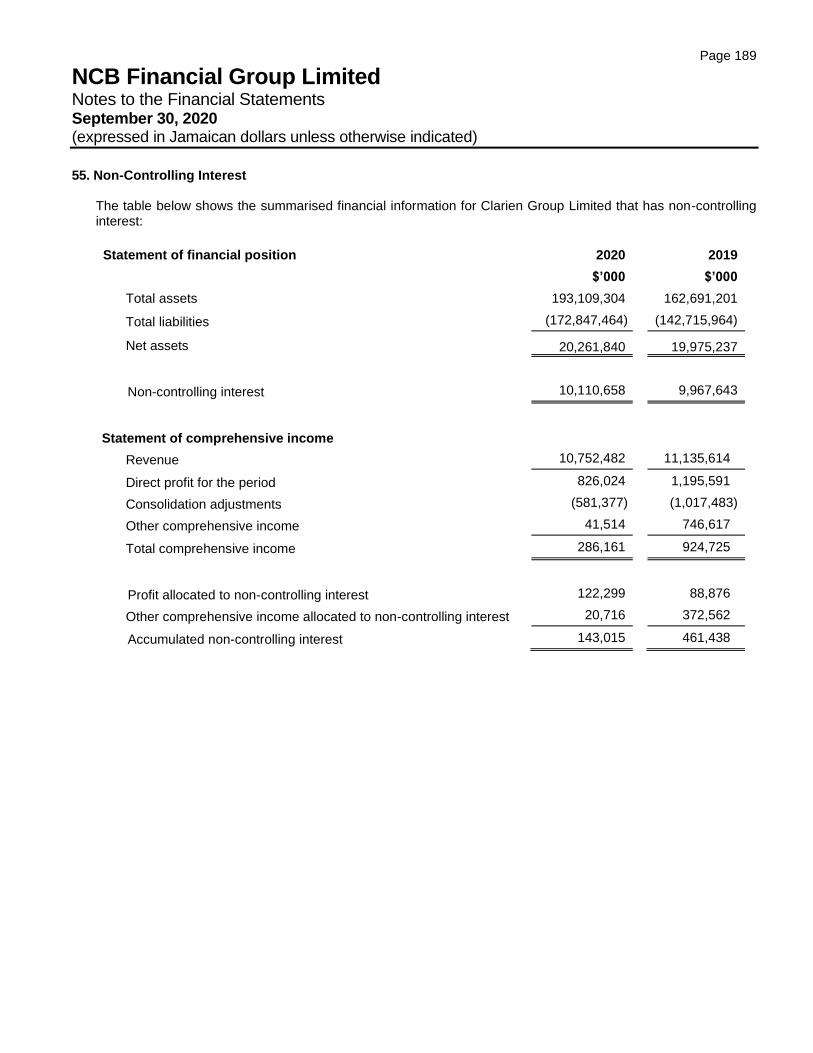
Page 189
NCB Financial Group Limited Notes to the Financial Statements September 30, 2020 (expressed in Jamaican dollars unless otherwise indicated)
55. Non-Controlling Interest
The table below shows the summarised financial information for Clarien Group Limited that has non-controlling interest:
Statement of financial position 2020 2019
$’000 $’000
Total assets 193,109,304 162,691,201
Total liabilities (172,847,464) (142,715,964)
Net assets 20,261,840 19,975,237
Non-controlling interest 10,110,658 9,967,643
Statement of comprehensive income
Revenue 10,752,482 11,135,614
Direct profit for the period 826,024 1,195,591
Consolidation adjustments (581,377) (1,017,483)
Other comprehensive income 41,514 746,617
Total comprehensive income 286,161 924,725
Profit allocated to non-controlling interest 122,299 88,876
Other comprehensive income allocated to non-controlling interest 20,716 372,562
Accumulated non-controlling interest 143,015 461,438
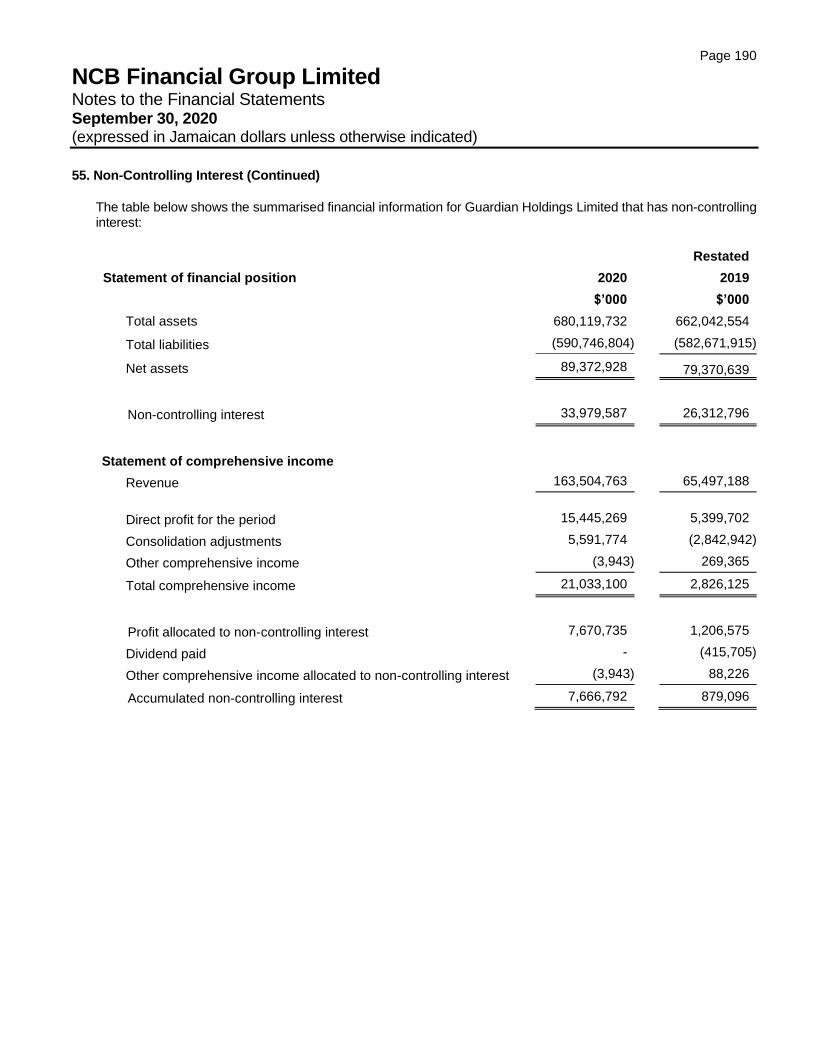
Page 190
NCB Financial Group Limited Notes to the Financial Statements September 30, 2020 (expressed in Jamaican dollars unless otherwise indicated)
55. Non-Controlling Interest (Continued)
The table below shows the summarised financial information for Guardian Holdings Limited that has non-controlling interest:
Restated
Statement of financial position 2020 2019
$’000 $’000
Total assets 680,119,732 662,042,554
Total liabilities (590,746,804) (582,671,915)
Net assets 89,372,928 79,370,639
Non-controlling interest 33,979,587 26,312,796
Statement of comprehensive income
Revenue 163,504,763 65,497,188
Direct profit for the period 15,445,269
5,399,702
Consolidation adjustments 5,591,774 (2,842,942)
Other comprehensive income (3,943) 269,365
Total comprehensive income 21,033,100 2,826,125
Profit allocated to non-controlling interest 7,670,735 1,206,575
Dividend paid - (415,705)
Other comprehensive income allocated to non-controlling interest (3,943) 88,226
Accumulated non-controlling interest 7,666,792 879,096
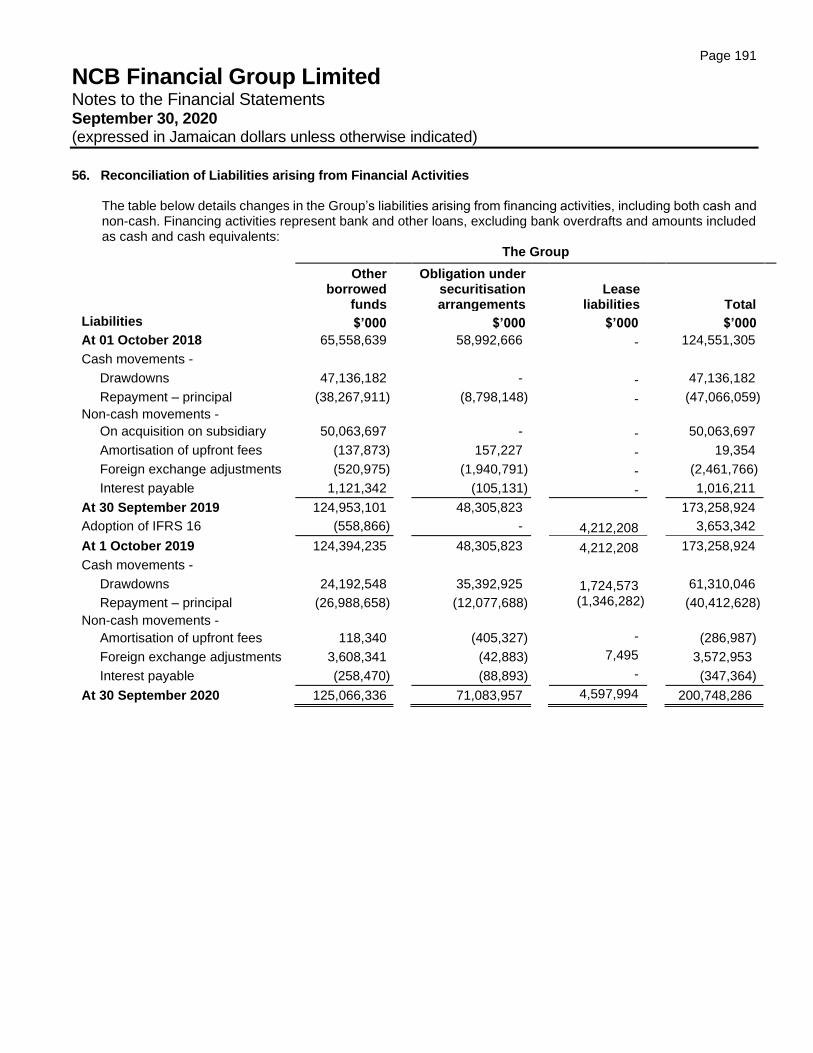
Page 191
NCB Financial Group Limited Notes to the Financial Statements September 30, 2020 (expressed in Jamaican dollars unless otherwise indicated)
56. Reconciliation of Liabilities arising from Financial Activities The table below details changes in the Group’s liabilities arising from financing activities, including both cash and non-cash. Financing activities represent bank and other loans, excluding bank overdrafts and amounts included as cash and cash equivalents:
The Group
Other borrowed
funds
Obligation under securitisation arrangements
Lease liabilities
Total
Liabilities $’000 $’000 $’000 $’000
At 01 October 2018 65,558,639 58,992,666 - 124,551,305
Cash movements -
Drawdowns 47,136,182 - - 47,136,182
Repayment – principal (38,267,911) (8,798,148) - (47,066,059)
Non-cash movements -
On acquisition on subsidiary 50,063,697 - - 50,063,697
Amortisation of upfront fees (137,873) 157,227 - 19,354
Foreign exchange adjustments (520,975) (1,940,791) - (2,461,766)
Interest payable 1,121,342 (105,131) - 1,016,211
At 30 September 2019 124,953,101 48,305,823 173,258,924
Adoption of IFRS 16 (558,866) - 4,212,208 3,653,342
At 1 October 2019 124,394,235 48,305,823 4,212,208 173,258,924
Cash movements -
Drawdowns 24,192,548 35,392,925 1,724,573 61,310,046
Repayment – principal (26,988,658) (12,077,688) (1,346,282) (40,412,628)
Non-cash movements -
Amortisation of upfront fees 118,340 (405,327) - (286,987)
Foreign exchange adjustments 3,608,341 (42,883) 7,495 3,572,953
Interest payable (258,470) (88,893) - (347,364)
At 30 September 2020 125,066,336 71,083,957 4,597,994 200,748,286
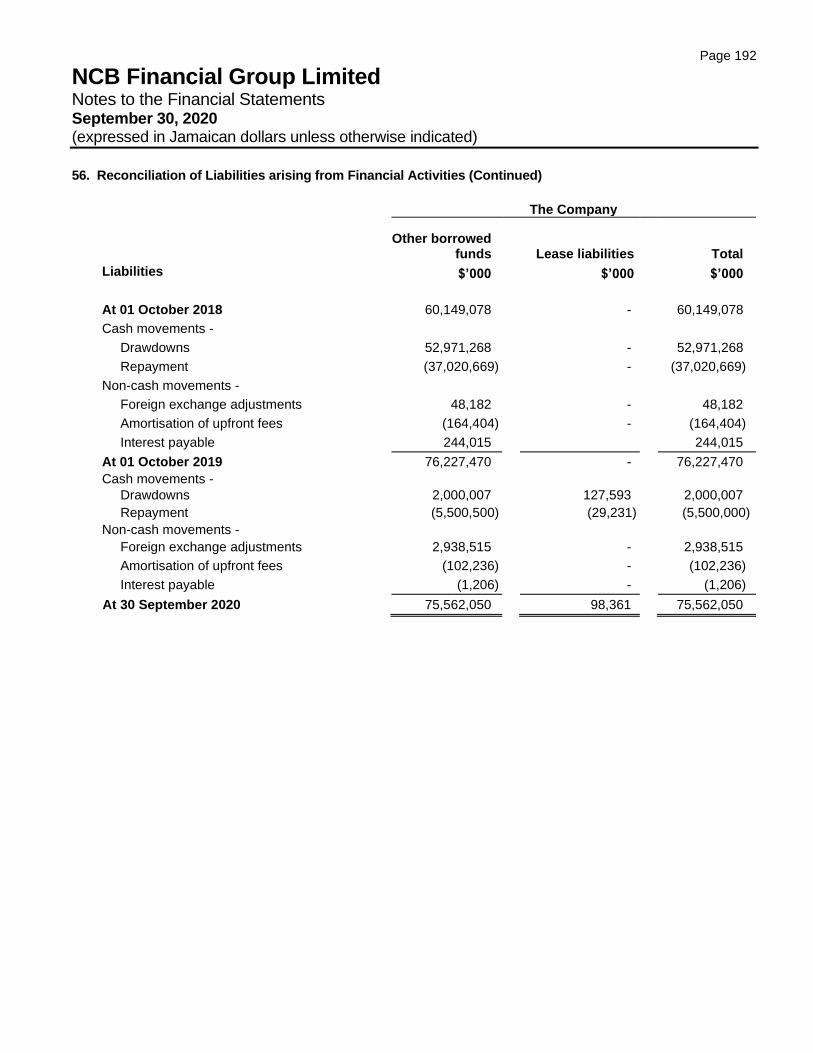
Page 192
NCB Financial Group Limited Notes to the Financial Statements September 30, 2020 (expressed in Jamaican dollars unless otherwise indicated)
56. Reconciliation of Liabilities arising from Financial Activities (Continued)
The Company
Other borrowed
funds
Lease liabilities Total
Liabilities $’000 $’000 $’000
At 01 October 2018 60,149,078 - 60,149,078
Cash movements -
Drawdowns 52,971,268 - 52,971,268
Repayment (37,020,669) - (37,020,669)
Non-cash movements -
Foreign exchange adjustments 48,182 - 48,182
Amortisation of upfront fees (164,404) - (164,404)
Interest payable 244,015 244,015
At 01 October 2019 76,227,470 - 76,227,470
Cash movements -
Drawdowns 2,000,007 127,593 2,000,007
Repayment (5,500,500) (29,231) (5,500,000)
Non-cash movements -
Foreign exchange adjustments 2,938,515 - 2,938,515
Amortisation of upfront fees (102,236) - (102,236)
Interest payable (1,206) - (1,206)
At 30 September 2020 75,562,050 98,361 75,562,050
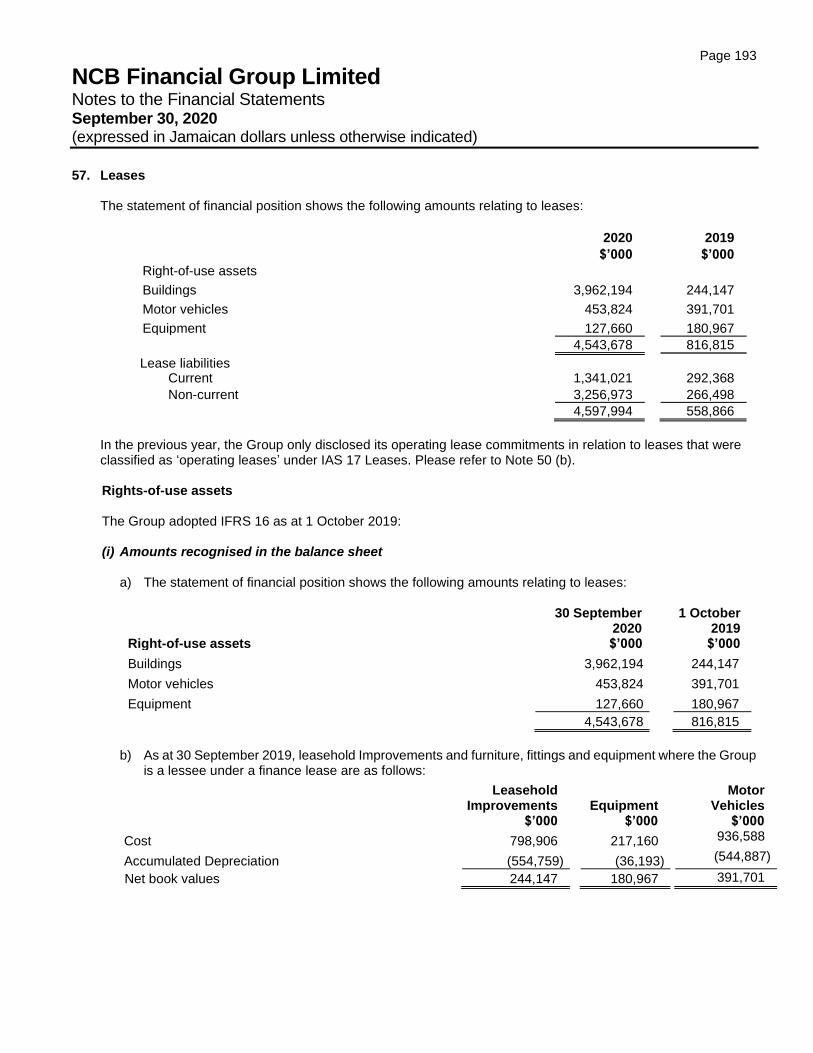
Page 193
NCB Financial Group Limited Notes to the Financial Statements September 30, 2020 (expressed in Jamaican dollars unless otherwise indicated)
57. Leases The statement of financial position shows the following amounts relating to leases:
2020 2019
$’000 $’000
Right-of-use assets
Buildings 3,962,194 244,147
Motor vehicles 453,824 391,701
Equipment 127,660 180,967
4,543,678 816,815
Lease liabilities Current 1,341,021 292,368
Non-current 3,256,973 266,498
4,597,994 558,866
In the previous year, the Group only disclosed its operating lease commitments in relation to leases that were classified as ‘operating leases’ under IAS 17 Leases. Please refer to Note 50 (b).
Rights-of-use assets The Group adopted IFRS 16 as at 1 October 2019:
(i) Amounts recognised in the balance sheet
a) The statement of financial position shows the following amounts relating to leases:
Right-of-use assets
30 September 2020
$’000
1 October 2019
$’000
Buildings 3,962,194 244,147
Motor vehicles 453,824 391,701
Equipment 127,660 180,967
4,543,678 816,815
b) As at 30 September 2019, leasehold Improvements and furniture, fittings and equipment where the Group
is a lessee under a finance lease are as follows:
Leasehold Improvements
$’000
Equipment
$’000
Motor Vehicles
$’000
Cost 798,906 217,160 936,588
Accumulated Depreciation (554,759) (36,193) (544,887)
Net book values 244,147 180,967 391,701
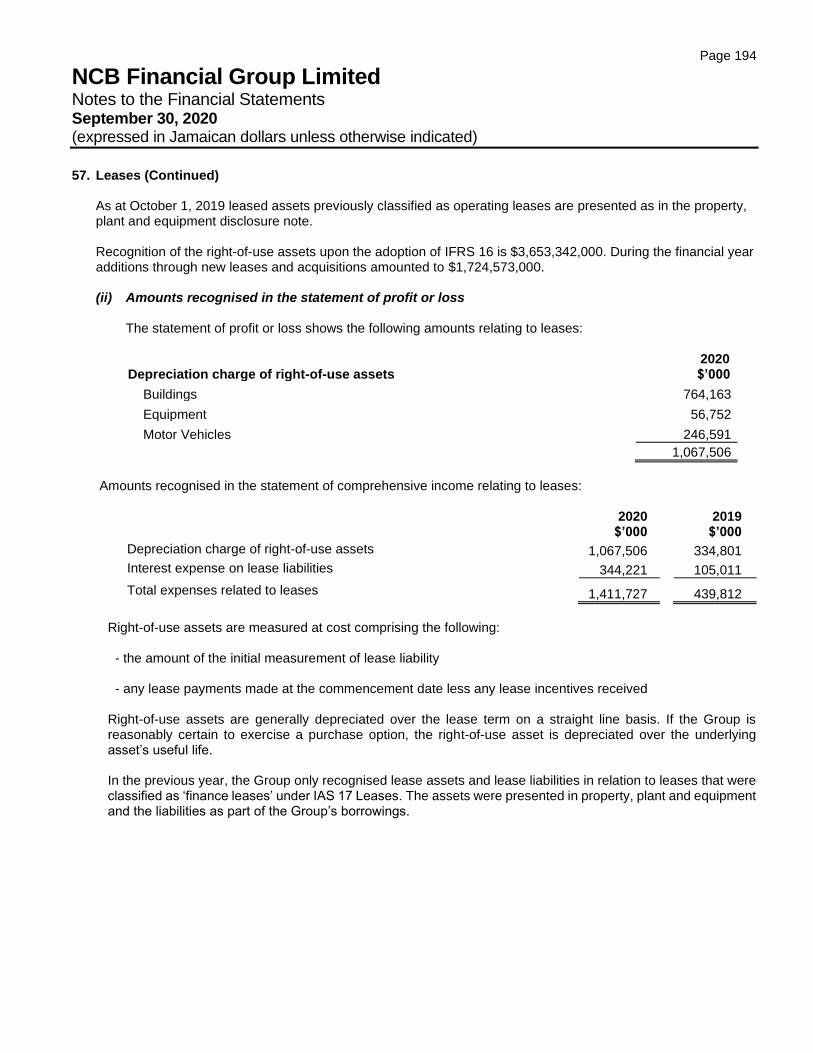
Page 194
NCB Financial Group Limited Notes to the Financial Statements September 30, 2020 (expressed in Jamaican dollars unless otherwise indicated)
57. Leases (Continued)
As at October 1, 2019 leased assets previously classified as operating leases are presented as in the property, plant and equipment disclosure note. Recognition of the right-of-use assets upon the adoption of IFRS 16 is $3,653,342,000. During the financial year additions through new leases and acquisitions amounted to $1,724,573,000.
(ii) Amounts recognised in the statement of profit or loss
The statement of profit or loss shows the following amounts relating to leases:
Depreciation charge of right-of-use assets
2020 $’000
Buildings 764,163
Equipment 56,752
Motor Vehicles 246,591
1,067,506
Amounts recognised in the statement of comprehensive income relating to leases:
2020
$’000
2019 $’000
Depreciation charge of right-of-use assets 1,067,506 334,801
Interest expense on lease liabilities 344,221 105,011
Total expenses related to leases 1,411,727 439,812
Right-of-use assets are measured at cost comprising the following: - the amount of the initial measurement of lease liability - any lease payments made at the commencement date less any lease incentives received
Right-of-use assets are generally depreciated over the lease term on a straight line basis. If the Group is reasonably certain to exercise a purchase option, the right-of-use asset is depreciated over the underlying asset’s useful life.
In the previous year, the Group only recognised lease assets and lease liabilities in relation to leases that were classified as ‘finance leases’ under IAS 17 Leases. The assets were presented in property, plant and equipment and the liabilities as part of the Group’s borrowings.
Page 195
NCB Financial Group Limited Notes to the Financial Statements September 30, 2020 (expressed in Jamaican dollars unless otherwise indicated)
57. Leases (Continued)
The Group’s leasing activities
The Group leases various buildings to facilitate: execution of banking services at branches and ABMs, general business operations and housing for employees. Rental contracts are typically made for fixed periods of 1 to 10 years. Leases are negotiated on an individual basis and contain a wide range of different terms and conditions (including termination and renewal rights). Extension and termination options are used to maximise operational flexibility in terms of managing the assets used in the Group’s operations. The extension and termination options held are exercisable by both the Group and the respective lessor. Contracts may contain both lease and non-lease components. Where these exist, the Group allocates the consideration in the contract to the lease and non-lease components based on their relative stand-alone prices. However, for leases of real estate for which the Group is a lessee, it has elected not to separate lease and non-lease components and instead accounts for these as a single lease component. The lease agreements do not impose any covenants other than the security interests in the leased assets that are held by the lessor. Leased assets may not be used as security for borrowing purposes. Until the 2019 financial year, leases of property, plant and equipment were classified as operating leases. From 1 October 2019, leases are recognised as a right-of-use asset and a corresponding liability at the date at which the leased asset is available for use by the Group.
To determine the incremental borrowing rate, the Group:
• where possible, uses recent third-party financing received by the individual lessee as a starting point, adjusted to reflect changes in financing conditions since third party financing was received;
• uses a build-up approach that starts with a risk-free interest rate adjusted for credit risk for leases held by the Group, which do not have recent third party financing; and,
• makes adjustments specific to the lease, e.g. term, country, currency and security. Lease payments are allocated between principal and finance cost. The finance cost is charged to profit or loss over the lease period so as to produce a constant periodic rate of interest on the remaining balance of the liability for each period.
Right-of-use assets are measured at cost comprising the following:
• the amount of the initial measurement of lease liability;
• any lease payments made at or before the commencement date less any lease incentives received;
• any initial direct costs; and
• restoration costs. Right-of-use assets are generally depreciated over the shorter of the asset's useful life and the lease term on a straight-line basis. If the Group is reasonably certain to exercise a purchase option, the right-of-use asset is depreciated over the underlying asset’s useful life. While the Group revalues its land and buildings that are presented within property, plant and equipment, it has chosen not to do so for the right-of-use buildings held by the Group. Payments associated with short-term leases of equipment and vehicles and all leases of low-value assets are recognised on a straight-line basis as an expense in profit or loss. Short-term leases are leases with a lease term of 12 months or less. Low value assets comprise IT equipment and small items of office furniture.
Page 196
NCB Financial Group Limited Notes to the Financial Statements September 30, 2020 (expressed in Jamaican dollars unless otherwise indicated)
57. Leases (Continued) Extension and termination options are included in a number of property and equipment leases across the Group. In determining the lease term, management considers all facts and circumstances that create an economic incentive to exercise an extension option, or not exercise a termination option. Extension options (or periods after termination options) are only included in the lease term if the lease is reasonably certain to be extended (or not terminated). For leases of land and buildings, management has included various extension options in the lease liability, as relocating would from existing locations would be onerous.
Assets and liabilities arising from a lease are initially measured on a present value basis. Lease liabilities include the net present value of the following lease payments:
• fixed payments (including in-substance fixed payments), less any lease incentives receivable;
• variable lease payment that are based on an index or a rate, initially measured using the index or rate as at the commencement date;
• amounts expected to be payable by the Group under residual value guarantees;
• the exercise price of a purchase option if the Group is reasonably certain to exercise that option; and,
• payments of penalties for terminating the lease, if the lease term reflects the Group exercising that option The lease term is reassessed if an option is actually exercised (or not exercised) or the Group becomes obliged to exercise (or not exercise) it. The assessment of reasonable certainty is only revised if a significant event or a significant change in circumstances occurs, which affects this assessment, and that is within the control of the lessee. During the current financial year, the financial effect of revising lease terms to reflect the effect of exercising extension and termination options was an increase in recognised lease liabilities and right-of-use assets of $684,249,000.
58. Litigation and Contingent Liabilities
The Group is subject to various claims, disputes and legal proceedings, as part of the normal course of business. Provision is made for such matters when, in the opinion of management and its professional advisors, it is probable that a payment will be made by the Group, and the amount can be reasonably estimated. In respect of claims asserted against the Group for which, according to the principles outlined above, no provision has been made, management is of the opinion that such claims are without merit and can be successfully defended. Significant matters are as follows, all relating to National Commercial Bank Jamaica Limited:
(a) Suit has been filed by the NCB Staff Association against the Bank seeking various declarations regarding the Bank’s profit sharing scheme, in particular as it relates to the financial year ended September 30, 2002. The Association has not quantified the claim. In 2017, the Supreme Court decided in favor of the NCB Staff Association. The Bank filed an appeal against the judgment. The appeal was heard for 3 days in June 2020 at the end of which the Court of Appeal reserved its judgment. In July, 2020 the Court of Appeal handed down its
Judgment dismissing the Bank’s Appeal and affirming the decision of the Supreme Court. The Bank
subsequently filed a Motion for Conditional Leave to have an appeal heard by the Judicial Committee
of the Privy Council. Provision for the claim has been made in the financial statements.
Page 197
NCB Financial Group Limited Notes to the Financial Statements September 30, 2020 (expressed in Jamaican dollars unless otherwise indicated)
58. Litigation and Contingent Liabilities (Continued)
(b) Suit has been filed by a customer against the Bank for breach of contract, breach of trust and negligence and damages. The claim for damages includes a sum equivalent to the profit of the business foregone as a result of an inability to access a loan approved by the Bank and the cost of interim financing. No provision was made in these financial statements for this claim as the Bank’s attorneys were of the view that the suit against the Bank was unlikely to succeed. The Court subsequently ordered that the customer’s claim be struck out. The customer has appealed that decision.
(c) Suit has been filed by a customer against the Bank for damages suffered as a result of the Bank’s alleged
negligence in relation to the sale of property. The proper value of the property, which had been owned by the customer, is in issue, along with the amount properly to be applied to the customer’s loan balance. Based on the advice of the Bank’s attorneys, no provision has been made in the financial statements in respect of this claim.
(d) Suit has been filed by a customer against the Bank for unlawful, wrongful and/or improper use of power in the
appointment of a Receiver and manager of the customer’s business property and assets. Damages, interest and costs have been claimed against the Bank. No provision has been made in the financial statements for this claim as the Bank’s attorneys are of the opinion that the claim is unlikely to succeed.
(e) Suit was filed by a claimant seeking specific performance, damages for breach of contract, interest and costs.
At the time of trial, the claim against the Bank was quantified by the claimant at approximately $31.4 billion plus interest and costs. The Supreme Court issued judgment in the Bank’s favor, with the Court ordering a company (placed by the Bank into receivership) to pay the claimant $5 million plus interest. The claimant has appealed and the defendants (including the Bank) have cross-appealed that portion of the judgment in which the company in receivership was ordered to pay the claimant $5 million plus interest. However, in the light of a recent decision of the Court of Appeal, the claimant has applied to vacate the judgment of the Supreme Court as the Judge who delivered the judgment did so after he retired from the Supreme Court. Having heard the claimant’s application, the Court of Appeal ordered that the matter be referred to the Supreme Court where a re-trial has been scheduled. No provision has been made for this claim as the Bank’s attorneys are of the view that the suit against the Bank is unlikely to succeed.
A number of other suits have been filed by customers of the Group. In some instances, counter claims have been filed by the Group. Provision has been made in the financial statements for certain of these claims. No provision has been made where the Group’s attorneys are of the view that the Group has a good defence against these claims.

Page 198
NCB Financial Group Limited Notes to the Financial Statements September 30, 2020 (expressed in Jamaican dollars unless otherwise indicated)
59. Changes in Accounting Policies
(a) Impact on financial statements
This note explains the impact of the adoption of IFRS 16 Leases on the Group’s financial statements. As indicated in Note 2, the Group has adopted IFRS 16 Leases retrospectively from 1 October 2019 but has not restated comparatives for the 2019 reporting period, as permitted under the specific transition provisions in the standard. The reclassifications and the adjustments arising from the new leasing rules are therefore recognised in the opening balance sheet on 1 October 2019. The new accounting policies are disclosed in Note 57. On adoption of IFRS 16, the Group recognised lease liabilities in relation to leases which had previously been classified as ‘operating leases’ under the principles of IAS 17 Leases. These liabilities were measured at the present value of the remaining lease payments, discounted using the lessee’s incremental borrowing rate as of 1 October 2019. The weighted average lessee’s incremental borrowing rate applied to the lease liabilities on 1 October 2019 was 9.75%. (a) Practical expedients applied
In applying IFRS 16 for the first time, the Group has used the following practical expedients permitted by the standard:
• applying a single discount rate to a portfolio of leases with reasonably similar characteristics;
• relying on previous assessments on whether leases are onerous as an alternative to performing an
• impairment review;
• – there were no onerous contracts as at 1 October 2019;
• accounting for operating leases with a remaining lease term of less than 12 months as at 1 January 2019
• as short-term leases;
• excluding initial direct costs for the measurement of the right-of-use asset at the date of initial application; and,
• using hindsight in determining the lease term where the contract contains options to extend or terminate the lease.
The Group has also elected not to reassess whether a contract is, or contains a lease at the date of initial application. Instead, for contracts entered into before the transition date the Group relied on its assessment made applying IAS 17 and Interpretation 4 Determining whether an Arrangement contains a Lease.
(b) Measurement of lease liabilities
Page 199
NCB Financial Group Limited Notes to the Financial Statements September 30, 2020 (expressed in Jamaican dollars unless otherwise indicated)
59. Changes in Accounting Policies (Continued)
The lease liabilities as at 1 October 2019 can be reconciled to the operating lease commitments as of 30 September 2019, as follows:
$’000
Operating lease commitments disclosed as at 30 September 2019 3,292,823
Discounted using the lessee’s incremental borrowing rate as at
30 September 2019 (568,332)
Discounted operating lease commitments as at 1 October 2019 2,724,491
(Less): short-term leases not recognised as a liability (213,699)
(Less): low-value leases not recognised as a liability -
Contract reassessed as operating lease 41,877
Add: adjustments as a result of a different treatments of extension and
termination options 1,082,032
Lease liabilities as at 1 October 2019 3,634,701
(c) Measurement of right-of-use assets
The associated right-of-use assets for property leases were measured on a retrospective basis as if the new rules had always been applied. Other right-of use assets were measured at the amount equal to the lease liability, adjusted by the amount of any prepaid or accrued lease payments relating to that lease recognised in the balance sheet as at 30 September 2019.
(d) Adjustments recognized in the balance sheet on 1 October 2019
The change in accounting policy affected the following items in the balance sheet on 1 October 2019:
• right-of-use assets – increase by $3,634,699,000
• lease liabilities – increase by $3,634,699,000 (e) The Income statement impact
For the year 2020 increased charges of $41,328,000 was recorded in the income statement.
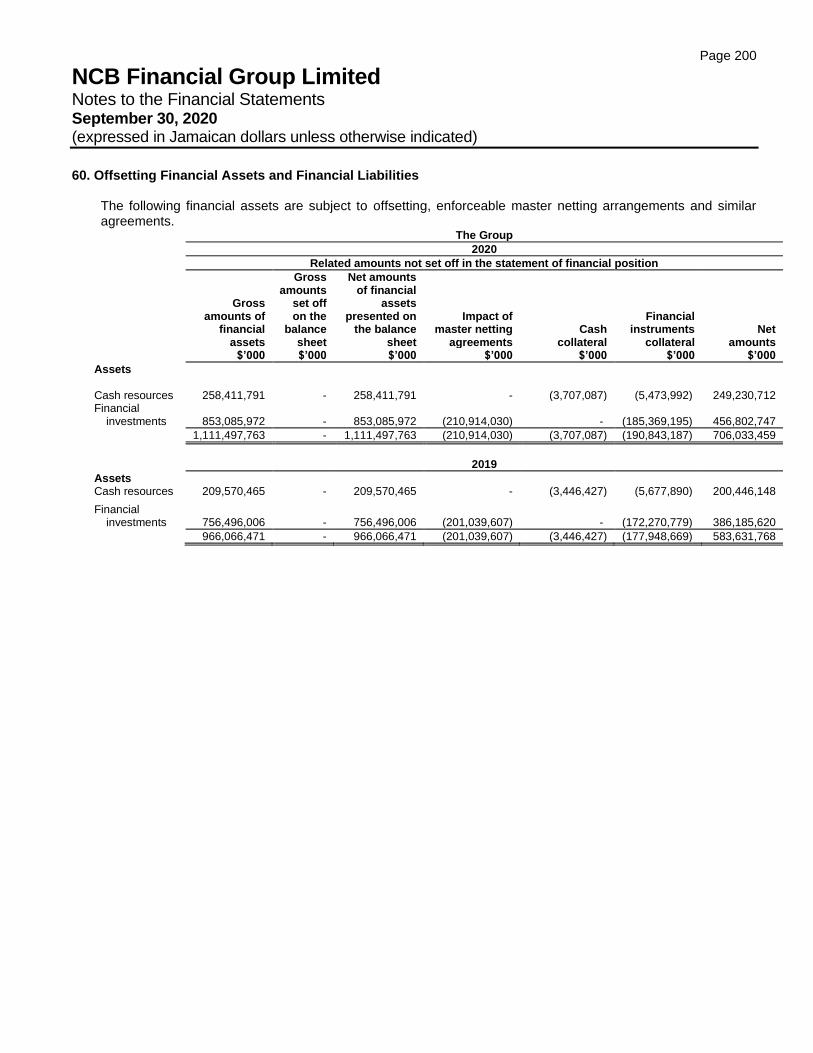
Page 200
NCB Financial Group Limited Notes to the Financial Statements September 30, 2020 (expressed in Jamaican dollars unless otherwise indicated)
60. Offsetting Financial Assets and Financial Liabilities
The following financial assets are subject to offsetting, enforceable master netting arrangements and similar agreements.
The Group
2020
Related amounts not set off in the statement of financial position
Gross amounts of
financial assets
Gross amounts
set off on the
balance sheet
Net amounts of financial
assets presented on
the balance sheet
Impact of master netting
agreements Cash
collateral
Financial instruments
collateral Net
amounts $’000 $’000 $’000 $’000 $’000 $’000 $’000
Assets
Cash resources 258,411,791
- 258,411,791 - (3,707,087) (5,473,992) 249,230,712 Financial
investments 853,085,972
- 853,085,972 (210,914,030) - (185,369,195) 456,802,747
1,111,497,763 - 1,111,497,763 (210,914,030) (3,707,087) (190,843,187) 706,033,459
2019
Assets Cash resources 209,570,465 - 209,570,465 - (3,446,427) (5,677,890) 200,446,148
Financial investments 756,496,006 - 756,496,006 (201,039,607) - (172,270,779) 386,185,620
966,066,471 - 966,066,471 (201,039,607) (3,446,427) (177,948,669) 583,631,768
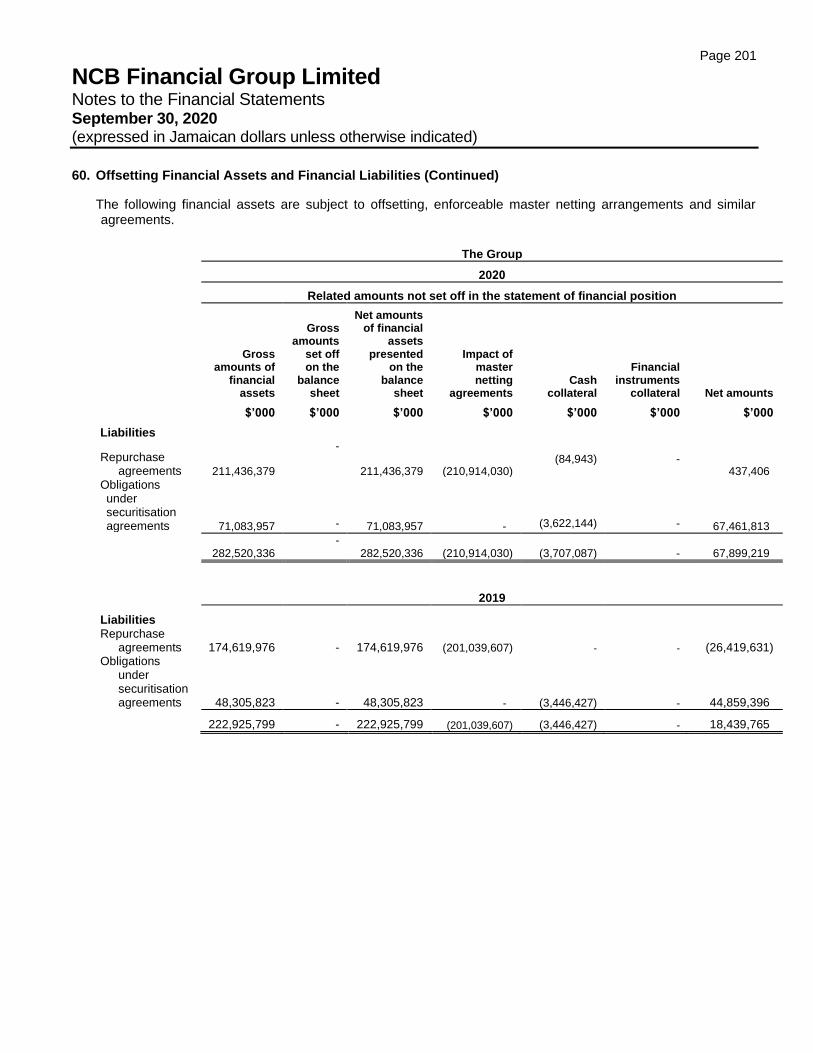
Page 201
NCB Financial Group Limited Notes to the Financial Statements September 30, 2020 (expressed in Jamaican dollars unless otherwise indicated)
60. Offsetting Financial Assets and Financial Liabilities (Continued)
The following financial assets are subject to offsetting, enforceable master netting arrangements and similar agreements.
The Group
2020
Related amounts not set off in the statement of financial position
Gross amounts of
financial assets
Gross amounts
set off on the
balance sheet
Net amounts of financial
assets presented
on the balance
sheet
Impact of master netting
agreements Cash
collateral
Financial instruments
collateral Net amounts
$’000 $’000 $’000 $’000 $’000 $’000 $’000
Liabilities
Repurchase agreements 211,436,379
-
211,436,379 (210,914,030) (84,943) -
437,406
Obligations under securitisation agreements 71,083,957 - 71,083,957 - (3,622,144) - 67,461,813
282,520,336 -
282,520,336 (210,914,030) (3,707,087) - 67,899,219
2019
Liabilities Repurchase
agreements 174,619,976 - 174,619,976 (201,039,607) - - (26,419,631) Obligations
under securitisation agreements 48,305,823 - 48,305,823 - (3,446,427) - 44,859,396
222,925,799 - 222,925,799 (201,039,607) (3,446,427) - 18,439,765
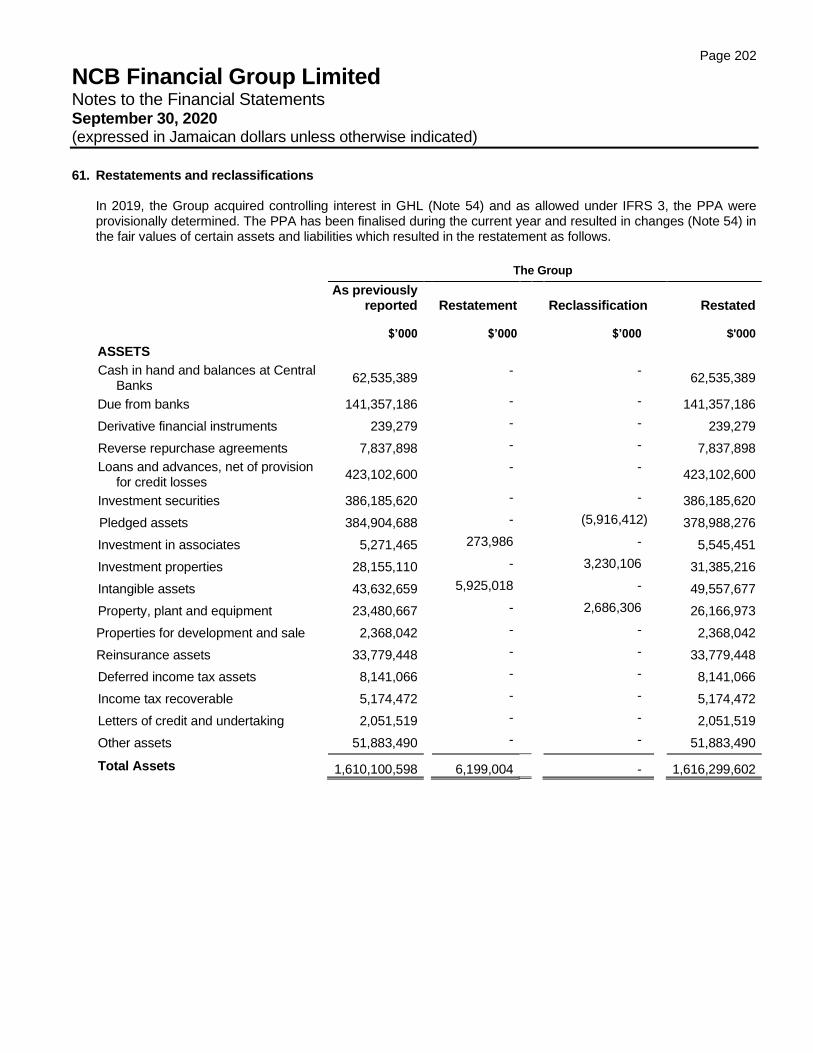
Page 202
NCB Financial Group Limited Notes to the Financial Statements September 30, 2020 (expressed in Jamaican dollars unless otherwise indicated)
61. Restatements and reclassifications
In 2019, the Group acquired controlling interest in GHL (Note 54) and as allowed under IFRS 3, the PPA were provisionally determined. The PPA has been finalised during the current year and resulted in changes (Note 54) in the fair values of certain assets and liabilities which resulted in the restatement as follows.
The Group
As previously
reported
Restatement
Reclassification
Restated
$’000 $’000
$’000
$'000
ASSETS
Cash in hand and balances at Central Banks
62,535,389 -
-
62,535,389
Due from banks 141,357,186 - - 141,357,186
Derivative financial instruments 239,279 - - 239,279
Reverse repurchase agreements 7,837,898 - - 7,837,898
Loans and advances, net of provision for credit losses
423,102,600 -
-
423,102,600
Investment securities 386,185,620 - - 386,185,620
Pledged assets 384,904,688 - (5,916,412) 378,988,276
Investment in associates 5,271,465 273,986 - 5,545,451
Investment properties 28,155,110 - 3,230,106 31,385,216
Intangible assets 43,632,659 5,925,018 - 49,557,677
Property, plant and equipment 23,480,667 - 2,686,306 26,166,973
Properties for development and sale 2,368,042 - - 2,368,042
Reinsurance assets 33,779,448 - - 33,779,448
Deferred income tax assets 8,141,066 - - 8,141,066
Income tax recoverable 5,174,472 - - 5,174,472
Letters of credit and undertaking 2,051,519 - - 2,051,519
Other assets 51,883,490 - - 51,883,490
Total Assets 1,610,100,598
6,199,004 -
1,616,299,602
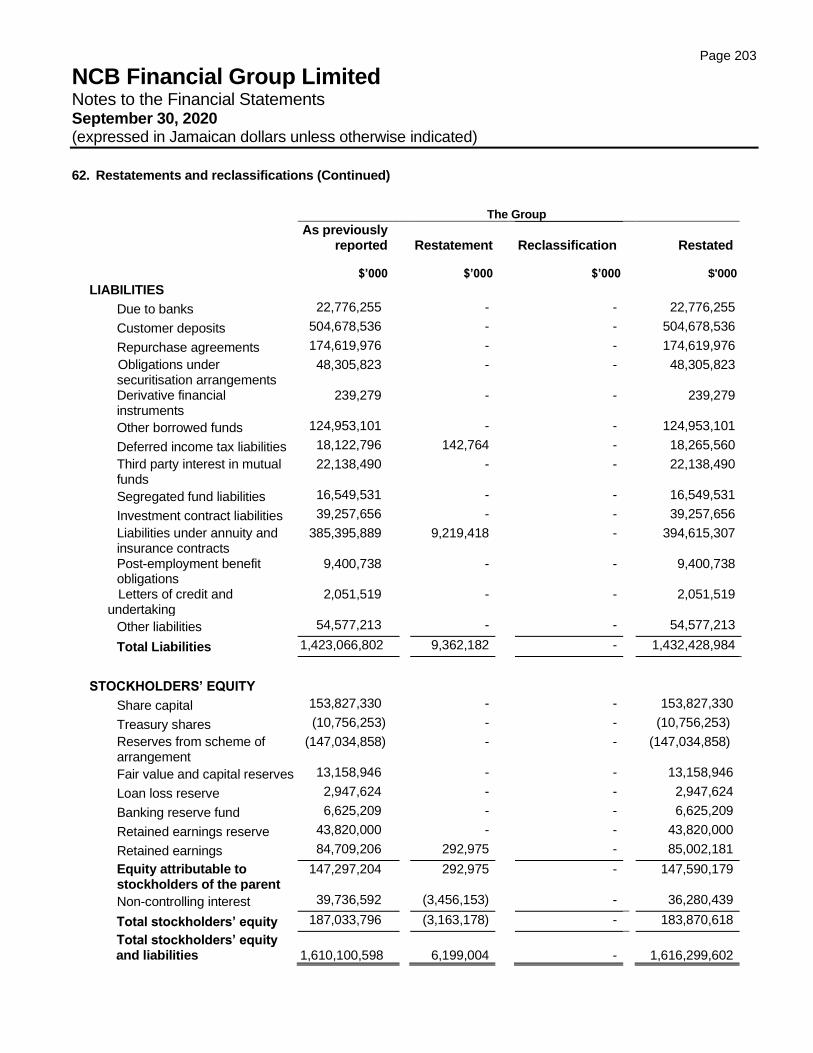
Page 203
NCB Financial Group Limited Notes to the Financial Statements September 30, 2020 (expressed in Jamaican dollars unless otherwise indicated)
62. Restatements and reclassifications (Continued)
The Group
As previously
reported Restatement
Reclassification
Restated
$’000 $’000
$’000
$'000
LIABILITIES
Due to banks 22,776,255 - - 22,776,255
Customer deposits 504,678,536 - - 504,678,536
Repurchase agreements 174,619,976 - - 174,619,976
Obligations under securitisation arrangements
48,305,823
-
- 48,305,823
Derivative financial instruments
239,279
-
- 239,279
Other borrowed funds 124,953,101 - - 124,953,101
Deferred income tax liabilities 18,122,796 142,764 - 18,265,560
Third party interest in mutual funds
22,138,490
-
- 22,138,490
Segregated fund liabilities 16,549,531 - - 16,549,531
Investment contract liabilities 39,257,656 - - 39,257,656
Liabilities under annuity and insurance contracts
385,395,889
9,219,418
- 394,615,307
Post-employment benefit obligations
9,400,738
-
- 9,400,738
Letters of credit and undertaking
2,051,519
-
- 2,051,519
Other liabilities 54,577,213 - - 54,577,213
Total Liabilities 1,423,066,802 9,362,182 - 1,432,428,984
STOCKHOLDERS’ EQUITY
Share capital 153,827,330 - - 153,827,330
Treasury shares (10,756,253) - - (10,756,253)
Reserves from scheme of arrangement
(147,034,858)
-
- (147,034,858)
Fair value and capital reserves 13,158,946 - - 13,158,946
Loan loss reserve 2,947,624 - - 2,947,624
Banking reserve fund 6,625,209 - - 6,625,209
Retained earnings reserve 43,820,000 - - 43,820,000
Retained earnings 84,709,206 292,975 - 85,002,181
Equity attributable to stockholders of the parent
147,297,204
292,975
- 147,590,179
Non-controlling interest 39,736,592 (3,456,153) - 36,280,439
Total stockholders’ equity 187,033,796 (3,163,178) - 183,870,618
Total stockholders’ equity and liabilities
1,610,100,598
6,199,004
-
1,616,299,602