nc-sara 2018 enrollment report...institutions are enrolling online students and where those students...
TRANSCRIPT

z1
NC-SARA 2018 ENROLLMENT REPORT
Prepared for NC-SARA by
Terri Taylor Straut
October 15, 2018
NC-SARA 2018 Enrollment Report 1 October 15, 2018
Preface
NC-SARA and Its Regional Partners
In 2013, the National Council for State Authorization Agreements (NC-SARA) became a nationwide
coordinating entity, in partnership with the country’s four regional education compacts (NEBHE, MHEC,
SREB, and WICHE) to establish uniform standards and procedures for state oversight of postsecondary
distance education delivered across state lines. States participating in SARA through any one compact
are recognized as reciprocal partners with states participating in SARA through any other regional
compact. And institutions are assured that their participation in one region’s SARA initiative will carry
full value in any other SARA state, from any other region.
SARA institutions’ distance education data
Distance education enrollment data collected by NC-SARA provide a significant advance in the national
collection and reporting of such information. NC-SARA’s data provide greater transparency about which
institutions are enrolling online students and where those students are located. Unlike the U.S.
Department of Education’s Integrated Postsecondary Education Data System (IPEDS), in NC-SARA
reporting, student enrollment data are disaggregated by state, delivering clarity as to where distance
education activity takes place. The adoption of SARA by the states and the participation of institutions
within them provides a new and more reliable source of information about distance education offerings
in the U.S. than previously available.
Overall growth
Since the 2017 NC-SARA enrollment data collection in the spring of 2017, two states (Florida and
Massachusetts) and Puerto Rico have joined SARA. SARA members now include 49 states (all but
California), the District of Columbia, Puerto Rico and the U.S. Virgin Islands.
The path ahead
NC-SARA will convene, for the fourth year, a committee to assess and review NC-SARA’s data reporting
policies and procedures to maximize the knowledge that has been gained from the annual data
collection cycle.
NC-SARA’s commitment to transparency in distance education data collection continues to set a
collaborative tone that may help establish a new norm for institutions. Continued improvement in the
processes, systems and communication related to the annual NC-SARA data collection will improve the
process and give all who use these data a renewed confidence in what they tell us about distance
education.
Marshall A. Hill
Executive Director, NC-SARA

NC-SARA 2018 Enrollment Report 2 October 15, 2018
Table of Contents Preface .......................................................................................................................................................... 1
Executive Summary ....................................................................................................................................... 4
Institutions Reporting ............................................................................................................................... 4
Reported Distance Education Enrollment................................................................................................. 5
Highly Concentrated Distance Education Enrollment............................................................................... 6
Reporting Challenges ................................................................................................................................ 7
Continued Progress Towards Transparency ............................................................................................. 8
Introduction .................................................................................................................................................. 9
Background ................................................................................................................................................... 9
About NC-SARA ......................................................................................................................................... 9
About SARA ............................................................................................................................................... 9
Out-of-State Learning Placements .......................................................................................................... 10
Methodology ............................................................................................................................................... 10
NC-SARA and IPEDS Reporting ................................................................................................................ 10
Unique Features of NC-SARA Enrollment Reporting .............................................................................. 11
Reporting Institutions by Sector ............................................................................................................. 12
Distance Education Enrollment ................................................................................................................... 13
Total Reported Distance Education Enrollment ..................................................................................... 13
Reported Enrollment by Sector .............................................................................................................. 14
2018 State Summary Data .......................................................................................................................... 16
In-State Enrollment ................................................................................................................................. 16
State-Level Enrollment Reporting ........................................................................................................... 16
Top Ten Institutions by Size of Reported Enrollment ............................................................................. 18
Data Trends: Spring 2016 through Spring 2018 .......................................................................................... 24
Number of SARA Member States ............................................................................................................ 24
Number of Institutions Reporting ........................................................................................................... 25
SARA and Non-SARA Reported Enrollment ............................................................................................ 25
Changes in Enrollment by Sector ............................................................................................................ 27
Reporting Challenges .................................................................................................................................. 29
Recommendations to Improve Reporting .................................................................................................. 31
Continued Progress Towards Transparency ............................................................................................... 32
Appendix A: Technical Notes ...................................................................................................................... 33

NC-SARA 2018 Enrollment Report 3 October 15, 2018
Definitions ............................................................................................................................................... 33
Acknowledgment of Prior IPEDS Distance Education Analysis ............................................................... 33
SARA Institutions Reporting In-State Enrollment ................................................................................... 34
Appendix B: Instructions and Survey .......................................................................................................... 35
Appendix C: About the Author .................................................................................................................... 38
Appendix D: Acknowledgments .................................................................................................................. 38
Appendix E: References .............................................................................................................................. 39

NC-SARA 2018 Enrollment Report 4 October 15, 2018
Executive Summary The 2018 NC-SARA Enrollment Report summarizes 2018 institutional reporting to the National Council as
outlined in the State Authorization Reciprocity Agreement (SARA). Distance Education enrollment data
are reported annually each fall by institutions in the Fall Enrollment (EF) component of their submissions
to the federal Integrated Postsecondary Education Data System (IPEDS). IPEDS data collection is
required by the federal government for all institutions that participate in federal student financial
assistance programs. Distance education data for 2017 were reported to IPEDS in the fall of 2017; those
same data, disaggregated by state, were submitted to NC-SARA in the spring of 2018. Similarly, distance
education data for 2016 were reported to IPEDS in the fall of 2016 and to NC-SARA in the spring of 2017.
NC-SARA now has three years of reported data.
This report summarizes the 2018 data reported and provides comparisons to the 2016 and 2017 data
reported to NC-SARA. The process of states joining SARA and institutions within them applying to
operate under SARA is ongoing. Therefore, the annual reporting provides a snapshot of the distance
education data as of each year’s fall IPEDS reporting.
Institutions Reporting In May 2018 NC-SARA sent requests via email with a link to report fall 2017 distance education
enrollments to the institutional contacts at 1,804 institutions then operating under SARA. NC-SARA
received responses from 1,791 institutions during the annual reporting window in the spring of 2018.
The response rate was 99.3% (non-reporting institutions have provided assurances that they will report
in future years). The number of institutions operating under SARA increased 20.8% from 1,494 in 2017
to 1,804 in 2018. During this reporting period two states (Florida and Massachusetts) and Puerto Rico
were approved to operate under SARA. However, of these new members only institutions in Florida had
an opportunity to apply before the reporting period began on May 21, 2018. Sixty-six Florida institutions
began operating under SARA this year. These Florida institutions combined reported 37,814 distance
education enrollments, or 69.6% of the reported growth. Institutions in Massachusetts and Puerto Rico
are currently in the process of applying to participate in SARA, but none of those distance education
enrollments were counted in the current year.
Year
Number of Institutions Operating
Under SARA
Number of Institutions
Reporting to NC-SARA
Number of Institutions
Reporting Distance Education
Enrollments
2017 1,494 1,477 1,394
2018 1,804 1,791 1,778
Increase 310 314 384 Table 1. Institutions Reporting
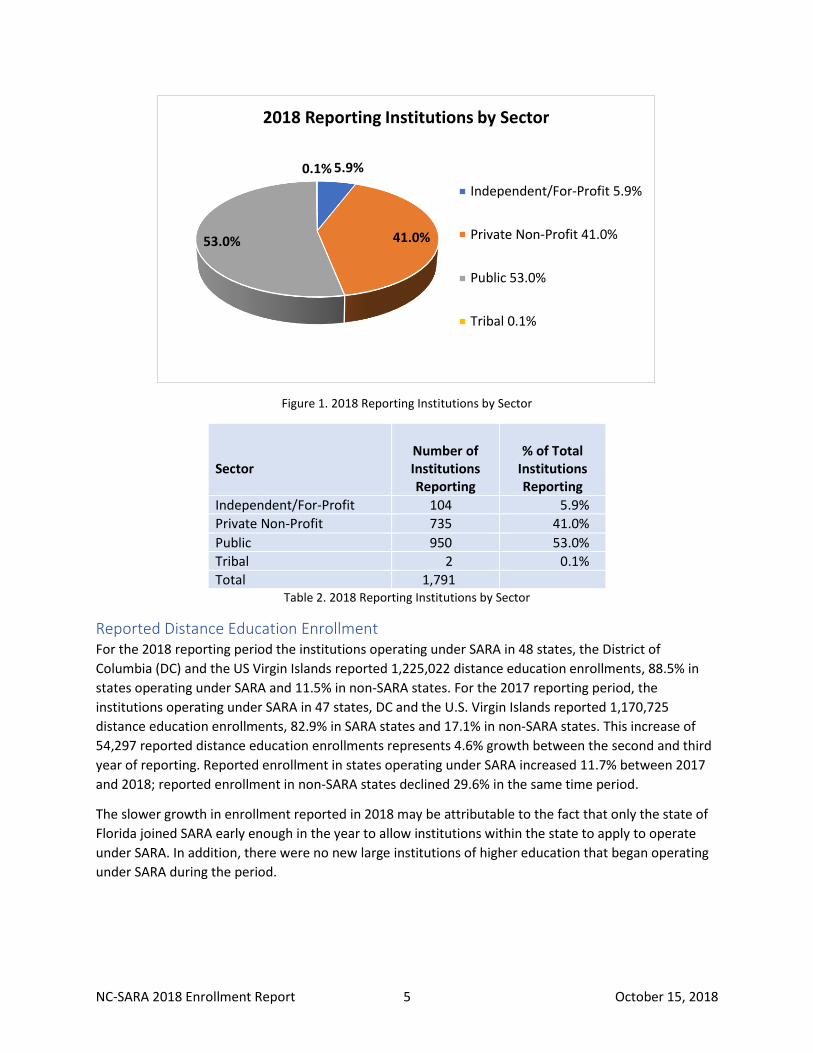
Reporting Institutions by Sector Public institutions made up just over half (53.0%) of all institutions reporting enrollment to NC-SARA in
2018. Private non-profit institutions represent 41.0% and independent for-profit institutions account for
5.9% of reporting institutions operating under SARA and reporting in 2018. In addition, two Tribal
institutions reported to NC-SARA in 2018, representing 0.1% of the total. The relative size of the sectors
remained consistent between the 2017 and 2018 reporting.
NC-SARA 2018 Enrollment Report 5 October 15, 2018
Figure 1. 2018 Reporting Institutions by Sector
Sector
Number of Institutions Reporting
% of Total
Institutions Reporting
Independent/For-Profit 104 5.9%
Private Non-Profit 735 41.0%
Public 950 53.0%
Tribal 2 0.1%
Total 1,791 Table 2. 2018 Reporting Institutions by Sector
Reported Distance Education Enrollment For the 2018 reporting period the institutions operating under SARA in 48 states, the District of
Columbia (DC) and the US Virgin Islands reported 1,225,022 distance education enrollments, 88.5% in
states operating under SARA and 11.5% in non-SARA states. For the 2017 reporting period, the
institutions operating under SARA in 47 states, DC and the U.S. Virgin Islands reported 1,170,725
distance education enrollments, 82.9% in SARA states and 17.1% in non-SARA states. This increase of
54,297 reported distance education enrollments represents 4.6% growth between the second and third
year of reporting. Reported enrollment in states operating under SARA increased 11.7% between 2017
and 2018; reported enrollment in non-SARA states declined 29.6% in the same time period.
The slower growth in enrollment reported in 2018 may be attributable to the fact that only the state of
Florida joined SARA early enough in the year to allow institutions within the state to apply to operate
under SARA. In addition, there were no new large institutions of higher education that began operating
under SARA during the period.
5.9%
41.0%53.0%
0.1%
2018 Reporting Institutions by Sector
Independent/For-Profit 5.9%
Private Non-Profit 41.0%
Public 53.0%
Tribal 0.1%

NC-SARA 2018 Enrollment Report 6 October 15, 2018
SARA State Reported
Enrollments
Non-SARA State
Reported Enrollments
Total Reported Enrollments
2017 970,548 200,177 1,170,725
2018 1,084,008 141,014 1,225,022
Change in Reported Enrollment
113,460
-59,163
54,297
% Change 11.7% -29.6% 4.6% Table 3. 2018 Reported Enrollments by Sector
Highly Concentrated Distance Education Enrollment As reported last year1, enrollment data reported to NC-SARA supports prior independent analyses of the
distance education industry. This research affirms that distance education enrollments are highly
concentrated. According to the Grade Increase: Tracking Distance Education in the United States,
“Students enrolled in distance education remain highly concentrated in a relatively small number of
institutions. Almost half of distance education students are accounted for in just 5% of institutions: the
235 institutions that represent only 5.0% of the higher education universe command 46.9% (2,985,347)
of the student distance enrollments.”2 These data are based on 2016 IPEDS reporting.
The 2018 NC-SARA reporting reveals that the three institutions reporting the largest distance education
enrollments together represent 21.9% (267,767) of all distance education enrollments reported to
NC-SARA. The ten institutions with the largest reported enrollment combined represent 46.0% (563,323)
of distance education enrollments reported to NC-SARA.
In-State Distance Education Enrollment is Significant NC-SARA focuses specifically on out-of-state distance education enrollments. While this focus aligns with
the mission of SARA, it does not completely reflect the distance education enrollment patterns for U.S.
institutions of higher education. For example, public institutions of higher education are primarily
charged to serve students in their own state. Since in-state enrollment has historically not been
reported to NC-SARA, the reported NC-SARA data reflects enrollment patterns across state lines, but not
within a given state. The lack of in-state enrollment data reported provides a skewed picture of public
institution distance education activity.
An analysis of 2016 IPEDS data submitted by 951 public institutions operating under SARA during the
2018 reporting period reveals that 83.9% (931,374) of their exclusively distance education enrollments
were in-state, while 16.1% (179,088) were in another state. These data support the assertion that public
institutions primarily serve in-state students, even when those students are studying exclusively through
distance education.
1 Straut, T. (2017) NC-SARA 2017 Enrollment Report, p. 8. http://ncsara.org/files/docs/2017%20Enrollment%20Data%20Report%20Publish%201.pdf 2 Allen, I.E., Seaman, J. and Seaman, J. (2018) Grade Increase: Tracking Distance Education in the United States, 2018, p. 22. https://onlinelearningsurvey.com/reports/gradeincrease.pdf

NC-SARA 2018 Enrollment Report 7 October 15, 2018
These proportions remained remarkably consistent to those reported in 2017. Last year, 83.7%
(737,977) of public institutions’ exclusively distance education enrollments were in-state, while 16.3%
(144,241) were in another state.
Figure 2. Reported 2016 IPEDS Enrollment In-state & Other States
2016 Reported
IPEDS Enrollments in
Same State
2016
Reported IPEDS Enrollments in Other States
2016 Reported Total
Enrollments
Reported Enrollments 931,374 179,088 1,110,462
Enrollment % 83.9% 16.1% Table 4. Reported 2016 IPEDS Enrollment In-state & Other States
Given the magnitude of in-state distance education enrollments, the NC-SARA Board has approved
adding the reporting of these enrollments to NC-SARA beginning with the 2019 reporting period.
Institutions already collect and report that data in their normal IPEDS reporting. All institutions
operating under SARA have been alerted to this change in policy and procedures.
Reporting Challenges As reported in 2017, in an attempt to standardize reporting requirements for institutions, SARA relies on
IPEDS definitions, schedules, etc. Unfortunately, it is clear from the comments submitted again this year
that confusion persists. Many institutions continued to struggle to understand how they should report
to IPEDS; even though the 2018 Data Reporting Guide was edited in response to the questions and
comments provided in 2017 and all institutions were given access to the guide in preparation for 2018
reporting. And, since NC-SARA’s basic instructions are stated in The NC-SARA Enrollment Data Reporting
Guide, “The required data reporting is based on the enrollment data your institution reports to IPEDS
83.9%
16.1%
2016 IPEDS Public Institutions' Exclusively Distance Education Enrollment
IPEDS ReportedEnrollment Same State83.9%
IPEDS ReportedEnrollment OtherStates 16.1%

NC-SARA 2018 Enrollment Report 8 October 15, 2018
each year; NC-SARA asks you to disaggregate some of that data”,3 those misunderstandings affect NC-
SARA reporting. Over half (55.4.7%) of comments provided in the Comment field of 2018 survey
specifically mentioned lack of clarity about what data to report, confusion about IPEDS definitions and
concerns with how to report military students and those in U.S. territories. This finding is consistent with
2017, when 51.7% of comments also were related to these issues.
Continued Progress Towards Transparency The reporting process and mechanisms to receive the data worked well for the third NC-SARA reporting
period; no systemic issues were reported. Improvements to the survey and instructions for 2018
facilitated the participation of the growing number of institutions reporting to NC-SARA. Continued
improvement in the processes, systems and communication related to the annual NC-SARA data
collection will improve the process and give all who use these data a renewed confidence in what they
communicate about distance education adoption and use across state lines in the U.S.
Starting in 2019, the data collected from institutions will include in-state distance education
enrollments, providing a more comprehensive picture of distance education in the U.S. NC-SARA’s
commitment to transparency in distance education data collection and reporting is setting a
collaborative tone that may help establish a new norm for institutions of higher education.
3 The NC-SARA Enrollment Data Reporting Guide, p. 2. http://www.nc-sara.org/files/docs/NC-SARA_Spring_2018_DataReportingGuide_FINAL.pdf (Retrieved September 17, 2018).
NC-SARA 2018 Enrollment Report 9 October 15, 2018
Introduction The National Council for State Authorization Reciprocity Agreements (NC-SARA) has completed three
years of distance education enrollment data collection. The purpose of this report is to provide a
summary and analysis of the fall 2017 enrollment data collected by NC-SARA in the spring of 2018.
Comparisons to the enrollment data collected in the spring of 2017 and 2016 are included on key points
of interest to SARA stakeholders. In addition, data reporting challenges and recommendations to
improve spring 2019 reporting are included.
Background
About NC-SARA NC-SARA is a nationwide coordinating entity established to ensure that the SARA initiative provides a
national solution to the challenges of state authorization of distance education. NC-SARA works with the
country’s four regional compacts to establish and implement uniform standards and procedures for
accepting and monitoring states participating in each of their respective regions: New England Board of
Higher Education (NEBHE), Midwestern Higher Education Compact (MHEC), Southern Regional
Education Board (SREB), and Western Interstate Commission for Higher Education (WICHE). States
participating in SARA through any one compact are recognized as reciprocal partners with states
participating in SARA through any other regional compact. And institutions are assured that their
participation in one region’s SARA initiative will carry full value in any other SARA state, from any other
region.
About SARA The State Authorization Reciprocity Agreement (SARA) is a voluntary agreement among its member
states and U.S. districts and territories that establishes national standards for interstate offering of
postsecondary distance education courses and programs. It is intended to make it easier for students to
take online courses offered by postsecondary institutions based in another state and provide them
certain assurances of quality and additional means to resolve problem that may occur. SARA is a
voluntary process of state oversight of distance education that assures consistent consumer protection
and relieves the burden of meeting individual state authorization requirements for participating
institutions of higher education.4
As of May 2018, all U.S. states except California were SARA member states. Neither Guam, American
Samoa, nor the Commonwealth of the Northern Mariana Islands (CNMI) are members of SARA. Since
Massachusetts (MA) and Puerto Rico (PR) were accepted as SARA members after the start of the spring
reporting period, enrollments reported in MA and PR are still counted as non-SARA for the 2018 report.
The map below shows SARA states and territories in green.
4 NC-SARA, About SARA. (n.d) Retrieved from NC-SARA Website. http://www.nc-sara.org/about (Retrieved July 18, 2018).

NC-SARA 2018 Enrollment Report 10 October 15, 2018
Figure 3. Map of SARA States, Districts and Territories
Out-of-State Learning Placements During the development of SARA, commitments were made to the state regulator community about
assessing the number of learning placements occurring in their states. The goal of this reporting is to
help institutions better attend to and meet professional licensure obligations in the states in which they
enroll students, and for compliance with federal regulations affecting institutions’ abilities to participate
in federal Title IV student assistance programs. This spring, NC-SARA invited institutions operating under
SARA to voluntarily report their learning placements in all states, territories and districts other than their
own. The results of the 2018 pilot are shared in the 2018 NC-SARA Out-of-State Learning Placement
Report on the NC-SARA website. The NC-SARA Board has made such reporting mandatory for spring
2019. A separate survey link will be provided for institutions to provide their learning placement data
and the results will be reported in a separate publication annually.
Methodology
NC-SARA and IPEDS Reporting NC-SARA relies on the existing definitions and reporting schedules required by the federal government’s
Integrated Postsecondary Education Data System (IPEDS). IPEDS data collection is managed by the U.S.

NC-SARA 2018 Enrollment Report 11 October 15, 2018
Department of Education through the National Center for Education Statistics (NCES) and reporting is
required of all institutions of higher education that offer federal financial aid in the U.S. states and
territories. NCES has been requiring institutions to report distance education data since the IPEDS Fall
Enrollment (EF) reporting in 2012. Additional information about prior IPEDS Distance Education analysis
is available in Appendix A: Technical Notes.
NC-SARA Reporting Schedule Distance education enrollment data are reported by institutions annually, each fall in the Fall Enrollment
(EF) component of their submission to the federal IPEDS data collection. Distance education data for
2017 were reported to IPEDS in the fall of 2017 and to NC-SARA in the spring of 2018. Similarly, distance
education data for previous years were reported to IPEDS in the fall and to NC-SARA in the spring of the
following year. NC-SARA now has three years of data reported. The figure below illustrates when
institutions report distance education enrollments to IPEDS and to NC-SARA.
Timeline of Reporting Students Enrolled in Distance Education Activity
Fall 2015 Student Enrollment Report to IPEDS
Spring 2016 Report to NC-SARA
Fall 2016 Student Enrollment Report to IPEDS
Spring 2017 Report to NC-SARA
Fall 2017 Student Enrollment Report to IPEDS
Spring 2018 Report to NC-SARA Figure 4. Timeline of Reporting Students Enrolled in Distance Education Activity
IPEDS defines a Distance Education Course as “a course in which the instructional content is delivered
exclusively via distance education. Requirements for coming to campus for orientation, testing, or
academic support services do not exclude a course from being classified as distance education.”5
Institutions participating in SARA annually report the number of students enrolled in the institution via
distance education delivered outside the home state of the institution. The data are disaggregated by
the state, territory, or district where the learning takes place. SARA enrollment data are reported in
May-June of each year. The data are reported to NC-SARA annually in the spring following the due date
for institutions to make their fall enrollment reports to IPEDS.
Unique Features of NC-SARA Enrollment Reporting While NC-SARA reporting relies on the existing IPEDS reporting schedules and definitions, there are
some unique features of NC-SARA reporting. These include:
• Historically, institutions do not report distance education enrollments in their own state to
NC-SARA. If an institution does report their in-state enrollments, NC-SARA removes that data
from the totals reported. In future years, this in-state data will be reported to more accurately
reflect total distance education enrollments.
5 U.S. Department of Education, NCES National Center for Education Statistics, IPEDS Glossary for 2018-2019 Data
Collection System https://surveys.nces.ed.gov/ipeds/Downloads/Forms/IPEDSGlossary.pdf

NC-SARA 2018 Enrollment Report 12 October 15, 2018
• Non-SARA state and territory enrollments are not published individually. Each institution’s non-
SARA state enrollments are combined by NC-SARA and reported in one field as non-SARA
enrollments.
• For the first reporting year, 2016, institutions were instructed not to report enrollment in a state
if there were fewer than 10 students because of concerns about student privacy. For
subsequent reporting periods (2017 and 2018) that restriction was removed; however, some
institutions still did not report enrollment under 10 for a state. The result is an enrollment
undercount, though the extent of the undercount is not known.
• The process of states joining SARA and institutions within them applying to operate under SARA
is ongoing; year to year comparisons of enrollment are affected by that fact. Therefore, the
annual reporting provides a snapshot of the distance education data as of each year’s fall IPEDS
reporting.
• The NC-SARA website (www.nc-sara.org) publishes detailed reporting of these data by
institution name.
• The spring 2018 data discussed in this report are available for download from the NC-SARA
website.
Screenshots of the 2018 instructions and survey are in Appendix B.
Reporting Institutions by Sector Public institutions made up just over half (53.0%) of all institutions reporting enrollment to NC-SARA in
2018. Private non-profit institutions represent 41.0% and independent for-profit institutions account for
5.9% of reporting institutions operating under SARA and reporting in 2018. In addition, two Tribal
institutions reported to NC-SARA in 2018, representing 0.1% of the total. The relative size of the sectors
remained consistent between the 2017 and 2018 reporting.
Figure 5. 2018 Reporting Institutions by Sector
5.9%
41.0%53.0%
0.1%
2018 Reporting Institutions by Sector
Independent/For-Profit 5.9%
Private Non-Profit 41.0%
Public 53.0%
Tribal 0.1%

NC-SARA 2018 Enrollment Report 13 October 15, 2018
Sector
Number of Institutions Reporting
% of Total
Institutions Reporting
Independent/For-Profit 104 5.9%
Private Non-Profit
735
41.0%
Public 950 53.0%
Tribal 2 0.1%
Total 1,791 100.0% Table 5. 2018 Reporting Institutions by Sector
Distance Education Enrollment In May 2018 NC-SARA sent requests via email with a link to report fall 2017 enrollment to the
institutional contacts at 1,804 institutions operating under SARA. NC-SARA received responses from
1,791 institutions during the annual reporting window in the spring of 2018. The response rate was
99.3%, up from 98.9% in 2017. Annual reporting to NC-SARA is a mandatory part of participation. This
fact contributes to the consistently high response rate. The 13 non-reporting institutions have provided
assurances that they will report next year.
Total Reported Distance Education Enrollment Of the 1,791 responses received, 165 or 9.2% reported no distance education enrollment. While some
institutions may participate in SARA in anticipation of future distance education offerings, others have
existing distance education offerings but remain challenged regarding identifying their students’
locations, and still others join for the ability to offer out-of-state learning placements to their students.
Institutions operating under SARA reported 1,225,022 distance education enrollments, 88.5% in SARA
states and 11.5% in non-SARA states. The graphic and table below present the enrollment data for 2018.
Figure 6. Reported SARA vs. Non-SARA Enrollment
1,084,008 , 88.5%
141,014 , 11.5%
Reported SARA Enrollment
Reported SARA Total88.5%
Reported Non-SARATotal 11.5%

NC-SARA 2018 Enrollment Report 14 October 15, 2018
Reported
Enrollment in SARA States
Reported
Enrollment in Non-SARA States
Total Reported Enrollment
2018 Reported Enrollment 1,084,008 141,014 1,225,022
Enrollment % 88.5% 11.5% 100.0% Table 6. Reported SARA vs. Non-SARA Enrollment
Florida, Massachusetts and Puerto Rico became members of SARA during the period between 2017 and
2018 data reporting. However, Massachusetts and Puerto Rico were approved to participate in SARA
after the beginning of the data collection period in May 2018, so those enrollments are categorized as
non-SARA in 2018. As of September 2018, California is the only state that is not a member of SARA.
The U.S. Virgin Islands, through affiliation with SREB, has joined SARA. Guam, American Samoa and the
Commonwealth of the Northern Mariana Islands (CMNI) are members of WICHE, but they are not at
present members of SARA.
Reported Enrollment by Sector Private non-profit institutions represent 41.4% of reported enrollment in 2018. Independent for-profit
institutions represent the second largest sector by enrollment with 36.1% of reported enrollment. Public
institutions reported 22.5% of all distance education enrollment reported to NC-SARA in 2018.
Additionally, two Tribal institutions reported to NC-SARA in 2018, but their combined reported
enrollment made little impact on the totals.
Figure 7. Reported Enrollment by Sector
36.1%
41.4%
22.5%
0.0%
Reported Enrollment by Sector
Independent/For-Profit36.1%
Private Non-Profit41.4%
Public 22.5%
Tribal 0.0%

NC-SARA 2018 Enrollment Report 15 October 15, 2018
Sector
Reported SARA
State Enrollment
Reported Non-
SARA State Enrollment
Total
Reported Enrollment
% of Total Reported
Enrollment
Independent/For-Profit 391,802 50,387 442,189 36.1%
Private Non-Profit 456,102 51,297 507,309 41.4%
Public 236,188 39,330 275,518 22.5%
Tribal 6 - 6 0.0%
Total 1,084,008 141,014 1,225,022 100.0% Table 7. Reported Enrollment by Sector

NC-SARA 2018 Enrollment Report 16 October 15, 2018
2018 State Summary Data Institutions operating under SARA report their distance education enrollments by state. The enrollment
data are available on the NC-SARA website. Historically, NC-SARA has asked institutions not to report in-
state enrollment since SARA addresses enrollment across state lines. When institutions report in-state
enrollment, NC-SARA removes that data from the totals. The data tables presented in this report have
been adjusted to remove reported in-state enrollment.
In-State Enrollment In-state enrollment represents a large proportion of the data reported to IPEDS for most institutions
operating under SARA since the mission of many institutions is to serve their local community, even with
courses that are delivered exclusively by distance education. For this reason, the NC-SARA Data
Committee recommended that NC-SARA collect and report in-state enrollment beginning with the 2019
data collection. These data will provide a more comprehensive view of distance education enrollment
among institutions operating under SARA.
State-Level Enrollment Reporting The following table compiles SARA and non-SARA state enrollment for institutions in each SARA state
and territory reporting in 2018. For example, Alaska’s institutions participating in SARA reported
enrolling 430 students in other SARA states and 78 students in non-SARA states, for a total of 508 out-
of-state students reported. This answers the question, “Where are my state’s institutions enrolling
students?” In addition, 5,918 student enrollments were reported in Alaska by SARA institutions located
in other SARA states or territories. This answers the question, “Who’s enrolling students in my state?”
Essentially, these are two different ways of looking at the reported data.
State/ District
Total Reported
Enrollment in SARA States
Total Reported
Enrollment in Non-SARA
States
Total Enrollment Reported
Enrollment in State Reported
by SARA Institutions from Other SARA States
AK 430 78 508 5,918
AL 42,397 3,506 45,903 19,883
AR 3,627 140 3,767 10,754
AZ 181,768 51,062 232,830 19,011
CO 51,903 6,158 58,061 22,606
CT 7,543 972 8,515 12,781
DC 44,694 1,407 46,101 3,700
DE 3,559 70 3,629 4,184
FL 33,836 3,978 37,814 73,287
GA 45,816 4,823 50,639 65,365
HI 300 374 674 8,677
IA 8,519 522 9,041 9,090
ID 20,659 3,986 24,645 8,326
IL 19,915 1,842 21,757 42,113

NC-SARA 2018 Enrollment Report 17 October 15, 2018
State/ District
Total Reported
Enrollment in SARA States
Total Reported
Enrollment in Non-SARA
States
Total Enrollment Reported
Enrollment in State Reported
by SARA Institutions from Other SARA States
IN 50,365 3,477 53,842 20,921
KS 19,033 1,266 20,299 9,795
KY 12,176 1,010 13,186 15,319
LA 4,834 400 5,234 19,410
MD 12,979 1,743 14,722 32,061
ME 3,983 904 4,887 4,523
MI 6,747 706 7,453 27,430
MN 44,539 3,638 48,177 14,847
MO 21,724 2,267 23,991 21,877
MS 3,746 204 3,950 14,210
MT 926 179 1,105 5,104
NC 4,465 423 4,888 57,508
ND 4,245 416 4,661 4,036
NE 8,301 760 9,061 5,065
NH 64,875 13,152 78,027 3,468
NJ 8,005 1,196 9,201 31,643
NM 3,915 609 4,524 9,483
NV 579 631 1,210 16,339
NY 34,596 3,389 37,985 43,229
OH 21,522 2,386 23,908 39,855
OK 3,302 296 3,598 13,259
OR 9,049 2,313 11,362 13,018
PA 26,162 3,278 29,440 42,841
RI 1,201 370 1,571 3,493
SC 2,301 526 2,827 30,564
SD 3,587 254 3,841 3,303
TN 4,607 216 4,823 31,746
TX 14,518 2,857 17,375 103,319
UT 92,770 11,623 104,393 14,310
VA 59,297 3,979 63,276 53,166
VI 1 2 3 639
VT 3,622 657 4,279 2,276
WA 3,496 1,303 4,799 42,085
WI 6,570 475 7,045 17,131
WV 43,351 4,007 47,358 6,578
WY 533 41 574 4,462
Totals 1,084,008 141,014 1,225,022 1,084,008 Table 8. State Level Enrollment Reported

NC-SARA 2018 Enrollment Report 18 October 15, 2018
States with institutions that have large distance education operations report much higher out-of-state
enrollment than states that do not have such institutions. The three states with the largest reported
out-of-state enrollment are Arizona, Utah and New Hampshire, each of which has at least one major
distance education provider.
Highly Concentrated Distance Education Enrollment The NC-SARA enrollment reporting supports prior independent analysis of the distance education
industry, affirming that distance education enrollments are highly concentrated. According to the Grade
Increase: Tracking Distance Education in the United States, “Students enrolled in distance education
remain highly concentrated in a relatively small number of institutions. Almost half of distance
education students are accounted for in just 5% of institutions: the 235 institutions that represent only
5.0% of the higher education universe command 46.9% (2,985,347) of the student distance
enrollments.”6 These data are based on 2016 IPEDS reporting.
Top Ten Institutions by Size of Reported Enrollment The institutions that reported the largest enrollment are University of Phoenix, located in Arizona;
Western Governors University, located in Utah, and Southern New Hampshire University, located in
New Hampshire. These three institutions together represent 21.9% (267,767) of all distance education
enrollments reported to NC-SARA in 2018. The ten institutions with the largest reported enrollment
combined represent 46.0% (563,323) of all distance education enrollments reported to NC-SARA. These
ten institutions are reported in the table below. None is a public institution.
6 Allen, I.E., Seaman, J. and Seaman, J. (2018) Grade Increase: Tracking Distance Education in the United States, 2018, p. 22. https://onlinelearningsurvey.com/reports/gradeincrease.pdf

NC-SARA 2018 Enrollment Report 19 October 15, 2018
Institution Name
State
Sector
Reported
SARA State Enrollment
Reported Non-SARA
State Enrollment
Total
Reported Enrollment
University of Phoenix AZ
Independent/for-profit 84,547 15,899 100,446
Western Governors University UT Private/non-profit 81,455 10,098 91,553
Southern New Hampshire University NH Private/non-profit 63,229 12,539 75,768
Liberty University VA Private/non-profit 49,668 3,011 52,679
Grand Canyon University AZ Private/non-profit 43,226 8,673 51,899
American Public
University System WV
Independent/for-profit 39,492 3,567 43,059
Ashworth College GA
Independent/for-profit 38,551 3,753 42,304
Strayer University DC
Independent/for-profit 36,848 529 37,377
Capella University MN
Independent/for-profit 31,813 2,856 34,669
Penn Foster College AZ
Independent/for-profit 30,286 3,283 33,569
Table 9. Top Ten Institutions by Size of Reported Enrollment
Top Ten Private For-Profit Institutions Private for-profit institutions represent six of the top ten institutions that reported out-of-state
enrollment to NC-SARA in 2018. The table below provides details for the ten private for-profit
institutions that reported the largest distance education enrollment in 2018.
Institution Name
State
Reported
SARA State Enrollment
Reported Non-SARA
State Enrollment
Total
Reported Enrollment
University of Phoenix AZ 84,547 15,899 100,446
American Public University System WV 39,492 3,567 43,059
Ashworth College GA 38,551 3,753 42,304
Strayer University DC 36,848 529 37,377
Capella University MN 31,813 2,856 34,669

NC-SARA 2018 Enrollment Report 20 October 15, 2018
Institution Name
State
Reported
SARA State Enrollment
Reported Non-SARA
State Enrollment
Total
Reported Enrollment
Penn Foster College AZ 30,286 3,283 33,569
Columbia Southern University AL 29,931 2,932 32,863
Colorado Technical University CO 21,169 954 22,123
Full Sail University FL 9,797 989 10,786
College for Financial Planning CO 8,753 1,394 10,147
Table 10. Top Ten Private For-Profit Institutions
Top Ten Private Non-Profit Institutions Private non-profit institutions represent four of the top ten institutions that reported out-of-state
distance education enrollments to NC-SARA in 2018. The table below provides details for the ten private
non-profit institutions that reported the largest enrollment in 2018. The top three institutions
maintained the same ranking, based on enrollment reported in 2017 and 2018. Grand Canyon University
was an independent for-profit institution during the 2017 reporting period.
Institution Name
State
Reported
SARA State Enrollment
Reported Non-SARA
State Enrollment
Total
Reported Enrollment
Western Governors University UT 81,455 10,098 91,553
Southern New Hampshire University NH 63,229 12,539 75,768
Liberty University VA 49,668 3,011 52,679
Grand Canyon University AZ 43,226 8,673 51,899
Excelsior College NY 25,641 2,017 27,658
Brigham Young University - Idaho ID 18,050 3,486 21,536
Embry-Riddle Aeronautical University - Daytona Beach FL 8,635 1,405 10,040
American College PA 7,467 874 8,341
Park University MO 4,741 519 5,260
Johns Hopkins University MD 4,488 908 5,396
Table 11. Top Ten Private Non-Profit Institutions

NC-SARA 2018 Enrollment Report 21 October 15, 2018
Top Ten Public Institutions There are many public institutions that reported significant out-of-state distance education enrollments
to NC-SARA in 2018. The public institutions ranked by the highest reported enrollment are found in the
table that follows. It is important to note the Purdue University, Global, Inc. is a new public institution
created when Purdue acquired Kaplan University7. Kaplan was a for-profit institution during the 2017
reporting period, reporting 35,889 total distance education enrollments to NC-SARA last year.
Institution Name
State
Reported
SARA State Enrollment
Reported Non-SARA
State Enrollment
Total Reported
Enrollment
Arizona State University AZ 27,405 12,233 39,638
Purdue University Global, Inc. IN 29,896 1,935 31,831
Pennsylvania State University PA 6,750 1,257 8,007
University of Maryland - University College MD 6,736 710 7,446
Colorado State University-Global Campus CO 5,796 1,531 7,327
Thomas Edison State University NJ 5,591 1,003 6,594
Eastern Gateway Community College OH 4,118 465 4,583
Oregon State University OR 2,858 883 3,741
Georgia Institute of Technology - Main Campus GA 2,876 794 3,670
The University of Texas at Arlington TX 2,325 1,158 3,483
Table 12. Top Ten Public Institutions
Public Institutions Largely Serve In-State Students Public institutions of higher education are primarily charged to serve students in their own state. The
data support this fact. An analysis of 2016 IPEDS data submitted by the 951 public institutions that were
operating under SARA during the 2018 reporting period reveals that 83.9% (931,374) of their reported
exclusively distance education enrollments were in-state, while 16.1% (179,088) were in another state.
7 Purdue Officially Launches Purdue University Global, WLFI.com, http://www.wlfi.com/content/news/Purdue-officially-launches-Purdue-Global-478542633.html

NC-SARA 2018 Enrollment Report 22 October 15, 2018
Figure 8. 2016 IPEDS Public Institutions’ Exclusively Distance Education Enrollment
Reported
IPEDS Enrollment in
Same State
Reported IPEDS Enrollment in Other States
Total Reported Enrollment
Reported Enrollments 931,374 179,088 1,110,462
Enrollment % 83.9% 16.1% Table 13. 2016 IPEDS Public Institutions’ Exclusively Distance Education Enrollment
These proportions remained remarkably consistent to those reported in 2017. Last year, 83.7%
(737,977) of public institutions exclusively distance education enrollments were in-state, while 16.3%
(144,241) were in another state.
National IPEDS distance education data also confirm that public institutions continue to primarily serve
in-state students, even with their distance education courses. According to a recent Babson Research
Group study, “Enrollment patterns reveal that public institutions are much more likely to design their
programs and recruiting efforts to serve local students. The vast majority (84.2%) of students taking
exclusively distance courses enrolled at public institutions are located in the same state as the
institution. This compares to slightly more than a third (35.5%) for private not-for-profit institutions, and
only 16.5% for private for-profit institutions.”8 Historically, NC-SARA has not collected or reported in-
state enrollment data. This results in distance education enrollments reported for public institutions far
below their actual enrollment total.
8 Allen, I.E., Seaman, J. and Seaman, J. (2018) Grade Increase: Tracking Distance Education in the United States, 2018, p. 17. https://onlinelearningsurvey.com/reports/gradeincrease.pdf
83.9%
16.1%
2016 IPEDS Public Institutions' Exclusively Distance Education Enrollment
IPEDS ReportedEnrollment Same State83.9%
IPEDS ReportedEnrollment OtherStates 16.1%
NC-SARA 2018 Enrollment Report 23 October 15, 2018
To provide a more accurate picture of institutions’ distance education activity, beginning in 2019
NC-SARA will collect in-state distance enrollments in addition to out-of-state distance education
enrollments from SARA institutions. This information will facilitate more accurate institution
comparisons by sector. This reporting will take the place of the current process that pulls IPEDS data for
institutions operating under SARA from the previous year’s reports. In-state enrollment reporting will be
required of all institutions operating under SARA.

NC-SARA 2018 Enrollment Report 24 October 15, 2018
Data Trends: Spring 2016 through Spring 2018 NC-SARA has been collecting and reporting enrollment data since 2016. This section reports enrollment
trends over the three years of data collection. The data reflect annual growth in states/territories joining
SARA as well as enrollment growth as institutions apply to participate under SARA. These trends reflect
the fact that states and territories must first take action to join SARA through an application to a
regional compact. Once the state (territory or district) is approved to operate under SARA, institutions in
that state may apply to participate in SARA.
Number of SARA Member States At the time of the 2016 reporting, there were 36 SARA states; by 2017 that number had increased by
30.6% to 47. In 2018, two states (Florida and Massachusetts) and the territory of Puerto Rico became
members. However, since Massachusetts and Puerto Rico were approved after the beginning of the
2018 reporting cycle, reported distance education enrollments are still counted as non-SARA this year.
Figure 9. Number of SARA States/Territories 2016-2018
Number of Member
States/Territories
% Increase from Prior
Year
2016 36
2017 47 30.6%
2018 51 8.5% Table 14. Number of SARA States/Territories 2016-2018
51
47
36
0 10 20 30 40 50 60
2018
2017
2016
Number of SARA Member States/Territories During Reporting Period
NC-SARA 2018 Enrollment Report 25 October 15, 2018
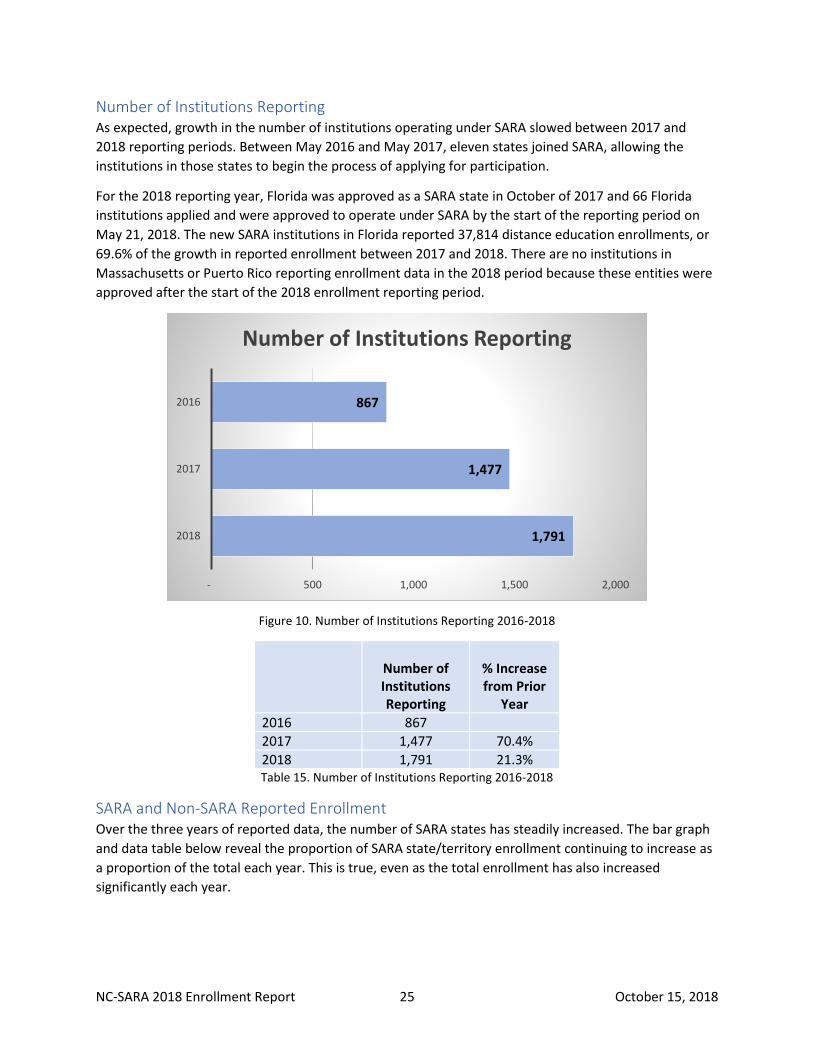
Number of Institutions Reporting As expected, growth in the number of institutions operating under SARA slowed between 2017 and
2018 reporting periods. Between May 2016 and May 2017, eleven states joined SARA, allowing the
institutions in those states to begin the process of applying for participation.
For the 2018 reporting year, Florida was approved as a SARA state in October of 2017 and 66 Florida
institutions applied and were approved to operate under SARA by the start of the reporting period on
May 21, 2018. The new SARA institutions in Florida reported 37,814 distance education enrollments, or
69.6% of the growth in reported enrollment between 2017 and 2018. There are no institutions in
Massachusetts or Puerto Rico reporting enrollment data in the 2018 period because these entities were
approved after the start of the 2018 enrollment reporting period.
Figure 10. Number of Institutions Reporting 2016-2018
Number of Institutions Reporting
% Increase from Prior
Year
2016 867
2017 1,477 70.4%
2018 1,791 21.3% Table 15. Number of Institutions Reporting 2016-2018
SARA and Non-SARA Reported Enrollment Over the three years of reported data, the number of SARA states has steadily increased. The bar graph
and data table below reveal the proportion of SARA state/territory enrollment continuing to increase as
a proportion of the total each year. This is true, even as the total enrollment has also increased
significantly each year.
1,791
1,477
867
- 500 1,000 1,500 2,000
2018
2017
2016
Number of Institutions Reporting

NC-SARA 2018 Enrollment Report 26 October 15, 2018
Figure 11. Reported SARA Enrollments 2016-2018
Reported SARA
Enrollment
Reported Non-
SARA Enrollment
Reported Total
Enrollment
% Change from Prior Year Total
Enrollment
2016 697,618 159,685 857,303
2017 970,548 200,177 1,170,725 36.6%
2018 1,084,008 141,014 1,225,022 4.6% Table 16. Reported SARA Enrollments 2016-2018
As the number of states/territories and institutions operating under SARA increases each year, so does
the proportion of reported distance education enrollments that are in SARA states/territories. Those
proportions are reported below.
Figure 12. Reported Proportion of SARA Enrollments 2016-2018
1,084,008
970,548
697,618
141,014
200,177
159,685
- 200,000 400,000 600,000 800,000 1,000,000 1,200,000
2018
2017
2016
Reported SARA Enrollments 2016-2018
Reported Non-SARA Enrollment Reported SARA Enrollment
88.5%
82.9%
81.4%
11.5%
17.1%
18.6%
2018
2017
2016
Reported Proportion of SARA Enrollments 2016-2018
Reported SARA Enrollment Reported Non-SARA Enrollment
NC-SARA 2018 Enrollment Report 27 October 15, 2018
Reported SARA Enrollment
% Reported SARA
Enrollment
Reported Non-SARA Enrollment
%
Reported Non-SARA Enrollment
Reported Total Enrollment
2016 697,618 81.4% 159,685 18.6% 857,303
2017 970,548 82.9% 200,177 17.1% 1,170,725
2018 1,084,008 88.5% 141,014 11.5% 1,225,022 Table 17. Reported Proportion of SARA Enrollment 2016-2018
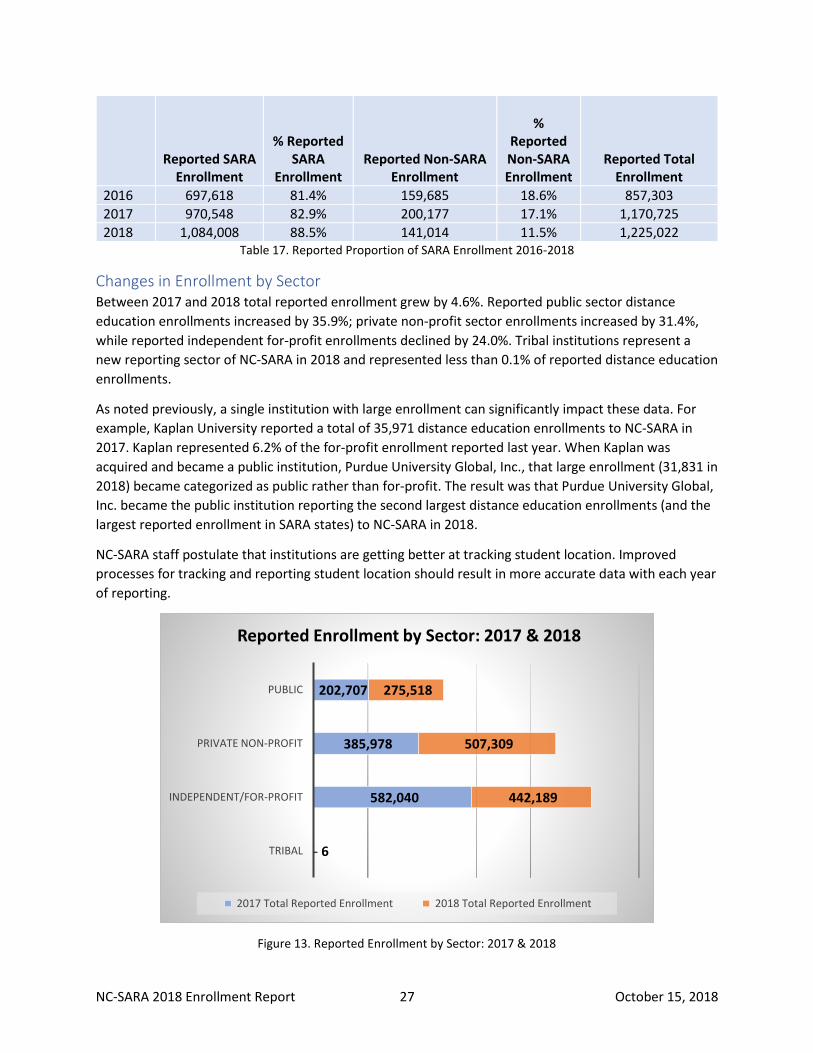
Changes in Enrollment by Sector Between 2017 and 2018 total reported enrollment grew by 4.6%. Reported public sector distance
education enrollments increased by 35.9%; private non-profit sector enrollments increased by 31.4%,
while reported independent for-profit enrollments declined by 24.0%. Tribal institutions represent a
new reporting sector of NC-SARA in 2018 and represented less than 0.1% of reported distance education
enrollments.
As noted previously, a single institution with large enrollment can significantly impact these data. For
example, Kaplan University reported a total of 35,971 distance education enrollments to NC-SARA in
2017. Kaplan represented 6.2% of the for-profit enrollment reported last year. When Kaplan was
acquired and became a public institution, Purdue University Global, Inc., that large enrollment (31,831 in
2018) became categorized as public rather than for-profit. The result was that Purdue University Global,
Inc. became the public institution reporting the second largest distance education enrollments (and the
largest reported enrollment in SARA states) to NC-SARA in 2018.
NC-SARA staff postulate that institutions are getting better at tracking student location. Improved
processes for tracking and reporting student location should result in more accurate data with each year
of reporting.
Figure 13. Reported Enrollment by Sector: 2017 & 2018
-
582,040
385,978
202,707
6
442,189
507,309
275,518
TRIBAL
INDEPENDENT/FOR-PROFIT
PRIVATE NON-PROFIT
PUBLIC
Reported Enrollment by Sector: 2017 & 2018
2017 Total Reported Enrollment 2018 Total Reported Enrollment

NC-SARA 2018 Enrollment Report 28 October 15, 2018
Sector
2017 Total Reported
Enrollment
2018 Total Reported
Enrollment
Change in Enrollment
% Change in Enrollment
Public 202,707 275,518 72,811 35.9%
Private Non-Profit 385,978 507,309 121,331 31.4%
Independent/For-Profit 582,040 442,189
(139,851)
-24.0%
Tribal 0 6 6
Totals 1,170,725 1,225,022 54,297 4.6% Table 18. Reported Enrollment by Sector: 2017 & 2018
During the 2017 reporting cycle, some institutions reported that they applied to operate under SARA in
preparation for distance education programs that are in the planning stages; many mentioned similar
plans in the Comments field of the 2018 survey as well. This dynamic could partially account for the fact
that the composition of reported enrollment by sector shifted significantly in this past year. As
previously noted, the data reported to NC-SARA are merely a snapshot at a point in time. Programs
planned in 2016 were launched in 2017 and reported to NC-SARA in spring of 2018.
It may also be true that it takes public institutions longer to gain the internal approvals and set up the
necessary systems to seek approval to operate under SARA. If that is the case, growth in public sector
enrollment for the next few years may increase as institutions in newer SARA states continue the work
toward the goal of participating in SARA. For a variety of reasons, total enrollments (whether on-campus
or distance education) in the for-profit sector have been dropping for the past several years.9 This trend
is evident in the reported NC-SARA data as well.
There were several comments in the 2018 survey that suggest that institutions continue to apply to
participate in SARA in preparation for new programs and offerings. This information is anecdotal,
therefore, not quantifiable.
9 Lederman, D. (2016) For-Profit College Sector Continues to Shrink, Inside Higher Education, https://www.insidehighered.com/quicktakes/2016/07/15/profit-college-sector-continues-shrink

NC-SARA 2018 Enrollment Report 29 October 15, 2018
Reporting Challenges It is clear from the comments submitted again this year that even with the additional instructional
information provided by NC-SARA, many institutions struggle with reporting because of their confusion
about how they should report to IPEDS. Over half (55.4.7%) of comments provided in the Comment field
of 2018 survey specifically mentioned lack of clarity about what data to report, confusion about IPEDS
definitions and concerns with how to report military students and those in U.S. territories. This finding is
consistent with 2017, when 51.7% of comments also were related to these issues. It is important to
note that some of the comments and questions NC-SARA received regarding reporting issues were, in
fact, answered in the 2018 NC-SARA Data Reporting Guide (e.g., how to report military students).
SARA member institutions continue to describe enrollment reporting issues related to IPEDS protocols.
These include:
• Conflict between IPEDS and institutional definitions of distance education course. IPEDS’
definition of a “Distance Education Course” as one delivered exclusively via distance education is
a source of confusion as reported by many providing the enrollment data for their institutions.
Some institutions have their own definitions, usually less narrow, that they use to generate
distance education reports. It is a burden to the institutions to have to maintain data using
different definitions.
• Confusion about instructions to report in-state (home state) enrollments. In-state enrollment
was not reported by NC-SARA in 2018. Reporting of in-state enrollment will be mandatory in
2019 and it will be included in the 2019 Enrollment Report. These data will provide a more
complete picture of distance education enrollment in institutions operating under SARA.
• Confusion about how to report military students (APO, etc.). Many survey respondents provided
details about their military students in the Comments field.
• Confusion about how to report enrollment in the U.S. territories. Comments reveal uncertainty
about which territories to report and where to report that enrollment in the survey. Neither
Guam, American Samoa, nor the Commonwealth of the Northern Mariana Islands (CNMI) are
members of SARA. But CMNI has a data entry field in the form, while the other non-member
territories do not. There is a field for Other Territories, but the instructions were not clear about
which territories to report there. Adding to the confusion is the fact that no territories are
included in the IPEDS Distance Education reporting.
• Inconsistent use of the “Other Location” field in the current NC-SARA survey. This field was used
by many respondents to report enrollment in the categories that they couldn’t find an
appropriate field to capture. Some also used this field to report international students.
In addition to reporting challenges related to IPEDs protocols, other reporting concerns related to
SARA requirements and unique institutional challenges were also reported.
These include:
• Difficulty completing the NC-SARA survey accurately due to inconsistency in how data is
displayed. The NC-SARA survey alphabetizes states and territories by their complete name
rather than by the state abbreviation. Many institutions’ reports alphabetize by state/territory
abbreviation. This means that the data are out of order during data input into the NC-SARA
survey, increasing the possibility of reporting enrollment incorrectly.

NC-SARA 2018 Enrollment Report 30 October 15, 2018
• Variation in institutions’ enrollment patterns. A small number of institutions reported that they
have continuous enrollment throughout the year, so the IPEDS “Fall Enrollment” date has little
meaning for them. Some institutions report the full year of enrollment, others use the IPEDS
date as a cut off, knowing the result is under-reporting enrollment.
• Inability to capture summer enrollments. A small number of institutions reported that the only
time they offer online courses is in the summer, therefore, their only online enrollments are not
counted since the Fall Enrollment report is the basis for reporting. This also results in an under-
reporting of enrollment.
• Some institutions deviate from the requested reporting strategy. A small number of institutions
indicated that they did not report state enrollment totals less than ten because of continuing
concerns about student privacy. Most mentioned that they are not reporting small enrollment
on advice of legal counsel. NC-SARA has obtained a legal opinion on the issue regarding cell size
limit.10
In addition, institutional changes that either merge previous IPEDS Unit IDs or separate units that
previously reported together into individual campus IDs remain a problem for the institutions affected
and those comparing institutional data over time. The IPEDS Unit ID is a unique numeric identification
number assigned to an institution by IPEDS. To assist with these comparisons, NC-SARA added a field in
the 2018 survey that requires each reporting institution to provide their IPEDS number.
10 Steven Y. Winnick to Marshall A. Hill, March 16, 2017, Reporting Small Cell Size Data to NC-SARA. http://www.nc-sara.org/files/docs/NC-SARA-Memo-EdCouncil_2017.pdf

NC-SARA 2018 Enrollment Report 31 October 15, 2018
Recommendations to Improve Reporting Based on a review of the comments provided by those reporting distance education data to NC-SARA in
the spring of 2018 and interviews with NC-SARA staff, the following recommendations should be
considered as NC-SARA continues to refine the data reporting process:
• Ensure there are fields for all five U.S. territories in the enrollment survey. These include: U.S.
Virgin Islands, Puerto Rico, CNMI, American Samoa, and Guam. This would require adding
American Samoa and Guam, or if they will not participate in SARA, provide clear instructions for
where those territory enrollments should be reported.
• Consider deleting the “Other Location” field in the survey. Or clarify what that field should be
used to document in the instructions and the Reporting Guide.
• Ensure that all instructions consistently include the requirement that in-state enrollment is
required beginning with the 2019 reporting period. Clarity about this requirement is necessary
so that in-state data are accurate and can be reported next year.
• Incorporate a review of communications and instructions related to the 2019 reporting period by
non-NC-SARA staff. An independent review would be an addition to the quality assurance
process.
• Add contact fields. These might include: Name, Title, Email, and Phone Number of the person
completing the report.
• Add instructions that explain that the data reported to IPEDS and NC-SARA will not necessarily
match. SARA requires institutions to report enrollment in member territories, IPEDS does not.
IPEDS has fields that are not relevant to SARA data collection, those include: “Student in U.S.,
Location Unknown”, “Student Located Outside the U.S.” and “Student Location Unknown”.
• Keep the Comments field. Those reporting in 2018 continued to use this field to explain
discrepancies from IPEDS data, inform NC-SARA of changes in IPEDS Unit number, provide their
contact information, and report issues that were confusing to them. It is a useful addition to the
data survey since it allows NC-SARA to identify trends and areas for improvement.
• Consider adding state abbreviations next to state name in the survey. Institutions’ system
queries often return reports by two letter state abbreviations. Alphabetic listings of state names
and state abbreviations return the states in different order. Including the abbreviation in the
label of the survey for each state should improve the reliability of the data reported. Survey
responders mentioned this discrepancy in the Comments field.
• Standardize the display of data by state to be consistent between tables, both in the surveys and
in data tables on the NC-SARA website. Alphabetize either by state name or abbreviation
consistently.
• Consider adding a Total field that automatically totals submissions, if not technically
burdensome. This request continues to be recommended by survey responders in the
Comments field. It would assist those filling out the survey to ensure that their reporting
matches their IPEDS reporting, as appropriate.
• There were also comments about not being able to save the data and come back in to complete
the survey. NC-SARA staff confirm that this capability exists, so better communication about the
functionality and how to use it should be added to the instructions.

NC-SARA 2018 Enrollment Report 32 October 15, 2018
• Communicate with NCES regarding the confusion about IPEDS terms and processes. Confusion
about IPEDS terms and processes continue to be communicated to NC-SARA by survey
respondents.
Continued Progress Towards Transparency The reporting process and mechanisms to receive the data worked well for the third NC-SARA reporting
period, no systemic issues were reported. Improvements to the survey and instructions for 2018
facilitated the participation of the growing number of institutions reporting to NC-SARA. Continued
improvement in the processes, systems and communication related to the annual NC-SARA data
collection will improve the process and give all who use these data a renewed confidence in what they
tell us about distance education adoption and use across state lines in the U.S.
Starting in 2019, the data will include in-state enrollment, providing a more comprehensive picture of
distance education in the U.S. NC-SARA’s commitment to transparency in distance education data
collection and reporting is setting a collaborative tone that may help establish a new norm for
institutions of higher education.

NC-SARA 2018 Enrollment Report 33 October 15, 2018
Appendix A: Technical Notes
Definitions The following definitions are provided by The Department of Education National Center for Educational
Statistics (NCES)11.
Distance Education - Education that uses one or more technologies to deliver instruction to students
who are separated from the instructor and to support regular and substantive interaction between the
students and the instructor synchronously or asynchronously. Technologies used for instruction may
include the following: Internet; one-way and two-way transmissions through open broadcasts, closed
circuit, cable, microwave, broadband lines, fiber optics, satellite or wireless communication devices;
audio conferencing; and video cassette, DVDs, and CD-ROMs, if the cassette, DVDs, and CD-ROMs are
used in a course in conjunction with the technologies listed above.
Distance Education Course - a course in which the instructional content is delivered exclusively via
distance education. Requirements for coming to campus for orientation, testing, or academic support
services do not exclude a course from being classified as distance education.
Distance Education Program – A program for which all the required coursework for program completion
is able to be completed via distance education courses.
The historic use of definitions:
The IPEDS Fall Enrollment report asks institutions to separate students into three categories:
• Enrolled Exclusively in Distance Education Courses
• Enrolled in Some (But Not All) Distance Education Course
• Not Enrolled in Any Distance Education Courses
To approximate the historic distance education surveys conducted by the Babson Survey Research
Group (BSRG) that used a definition of approximately 80% of the course online, the WICHE Cooperative
for Educational Technologies (WCET) and others have combined the IPEDS reporting for Exclusively in
Distance Education courses and Some But Not All Distance Education course. This combination of
reporting has been referred to as “Enrolled in At Least One” Distance Education Course. Reporting of
IPEDS distance education data often utilizes this category.
Additional SARA-specific definitions are available in the current version of the State Authorization
Reciprocity Agreements Manual.12
Acknowledgment of Prior IPEDS Distance Education Analysis. Prior to the 2012 IPEDS reporting, the
Babson Survey Research Group (BSRG) collected data on online enrollments annually, beginning in the
11 U.S. Department of Education, NCES National Center for Education Statistics, IPEDS Glossary for 2018-2019 Data Collection System https://surveys.nces.ed.gov/ipeds/Downloads/Forms/IPEDSGlossary.pdf 12 NC-SARA, State Authorization Reciprocity Agreements Manual (2018). Version 18.2, May 11, 2018, http://www.nc-sara.org/files/docs/NC-SARA_Manual.pdf
NC-SARA 2018 Enrollment Report 34 October 15, 2018
Appendix A: Technical Notes-Continued
fall 2002 period.13 BSRG used the distance education definition of 80% of the content delivered online.
The BSRG survey is a sampling, not a reporting of the entire population of institutions of higher
education. Analysis by the WICHE Cooperative for Educational Technology (WCET) provides greater
detail about methodology of historic distance education reports and the differences in the data and
definitions used.14 NC-SARA thanks the professionals who developed and shared the methodology used
to create the IPEDS comparisons in this report.
SARA Institutions Reporting In-State Enrollment The NC-SARA Manual outlines data submission requirements for participating institutions. The
instructions say, “Institutions participating in the State Authorization Reciprocity Agreements (SARA)
shall annually report to the National Council for State Authorization Reciprocity Agreements the number
of students enrolled in the institution via distance education delivered outside the home state of the
institution, disaggregated by state, territory, or district in which the students reside.”15
In addition, the 2018 email instruction indicate, “Enter 0 for your home state.”
For the first three reporting years, 2016-2018, NC-SARA returns in-state enrollment reported by
institutions to zero to ensure accurate reporting at the state in and institutional level, in alignment with
the historic SARA guidelines.
Beginning with the 2019 reporting, institutions will be required to report their in-state enrollment and
all Guides and instructions will be edited to reflect this change in policy approved by the Board in May
2018.
13 Allen, I.E. and Seaman J., (2003). Sizing the Opportunity: The Quality and Extent of Online Education in the United States, Babson Survey Research Group. 14 Poulin, R. and Straut, T. (2016). WCET Distance Education Enrollment Report 2016. http://wcet.wiche.edu/initiatives/research/WCET-Distance-Education-Enrollment-Report-2016 15 NC-SARA, State Authorization Reciprocity Agreements Manual (2018). Version 18.2, May 11, 2018, http://www.nc-sara.org/files/docs/NC-SARA_Manual.pdf

NC-SARA 2018 Enrollment Report 35 October 15, 2018
Appendix B: Instructions and Survey Below are screenshots of the instructions and the survey screens that institutions completed for the
2018 NC-SARA enrollment data collection.

NC-SARA 2018 Enrollment Report 36 October 15, 2018
Appendix B: Instructions and Survey-Continued

NC-SARA 2018 Enrollment Report 37 October 15, 2018
Appendix B: Instructions and Survey-Continued

NC-SARA 2018 Enrollment Report 38 October 15, 2018
Appendix C: About the Author Terri Taylor Straut, CEO and Solution Architect at Ascension Consulting Group is an independent
consultant and an experienced researcher, project manager, and higher education administrator. As the
founding director of CU Online (for the University of Colorado) and a member of the founding
management team of the Western Governors University (WGU), Terri has been part of the distance
learning industry since its infancy in the mid-1990s. Terri has significant experience implementing
distance education projects in corporations as well as non-profit organizations. She is very familiar with
IPEDS distance education reporting through her work on the annual distance education IPEDS reporting
for the WICHE Cooperative for Education Technologies’ (WCET) Policy and Analysis unit. Terri earned her
Master of Business Administration from Northeastern University and her Bachelor of Arts from the
University of Delaware. ([email protected])
Appendix D: Acknowledgments The author appreciates and wishes to thank NC-SARA staff for their assistance in providing the data set,
serving as a sounding board for the topics to explore, and in the final editing and distribution of this
report. The NC-SARA staff assisting in this project include:
• Kris Biesigner, Ph.D., retired Associate Vice Chancellor for Instructional Technology Services for
the University System of Georgia and Senior Advisor to SREB for SARA, provided editorial
comments and recommendations on final drafts of the report.
• Marianne Boeke, Ph.D., Associate Director for Policy Research and State Support, collaborated
on the topics to explore, facilitated internal operations and communication, and edited multiple
drafts of the report.
• Victoria Brieske, Executive Assistant, provided support in report creation, production and
distribution.
• Marshall A. Hill, Ph.D., Executive Director, provided a guiding vision and edited drafts of the
report.
• Jennifer Shanika, Assistant Director for Technical Operations, provided numerous data reports
and insights to assist with data validation and presentation.

NC-SARA 2018 Enrollment Report 39 October 15, 2018
Appendix E: References
Allen, I.E. and Seaman, J., (2017). Digital Learning Compass: Distance Education Enrollment Report, http://digitallearningcompass.org/ Allen, I.E. and Seaman J., (2003). Sizing the Opportunity: The Quality and Extent of Online Education in the United States, Babson Survey Research Group.
Allen, I.E., Seaman, J. and Seaman, J. (2018) Grade Increase: Tracking Distance Education in the United States, 2018, p. 17. https://onlinelearningsurvey.com/reports/gradeincrease.pdf Lederman, D. (2016) For-Profit College Sector Continues to Shrink, Inside Higher Education, https://www.insidehighered.com/quicktakes/2016/07/15/profit-college-sector-continues-shrink
Lederman, Doug (2018) Price Matters but Doesn’t Rule, Inside Higher Ed, June 13, 2018, https://www.insidehighered.com/digital-learning/article/2018/06/13/online-students-price-matters-doesnt-dictate-choice
NC-SARA, About SARA (n.d.) Retrieved from NC-SARA Website. http://www.nc-sara.org/about (Retrieved July 30, 2018). NC-SARA, State Authorization Reciprocity Agreements Manual (2018). Version 18.2, May 11, 2018, http://www.nc-sara.org/files/docs/NC-SARA_Manual.pdf Poulin R. and Straut, T. IPEDS Fall 2013: Higher Ed Sectors Vary Greatly in Distance Ed Enrollments. WCET Frontiers. March 2015. http://wcet.wiche.edu/initiatives/research/WCET-Distance-Education-Enrollment-Report-2016
Poulin, R. and Straut, T. (2016). WCET Distance Education Enrollment Report 2016. http://wcet.wiche.edu/initiatives/research/WCET-Distance-Education-Enrollment-Report-2016 Purdue Officially Launches Purdue University Global, WLFI.com, http://www.wlfi.com/content/news/Purdue-officially-launches-Purdue-Global-478542633.html Straut, T. (2017) NC-SARA 2017 Enrollment Report, p. 8. http://nc-sara.org/files/docs/2017%20Enrollment%20Data%20Report%20Publish%201.pdf U.S. Department of Education, NCES National Center for Education Statistics, IPEDS Glossary for 2018-
2019 Data Collection System https://surveys.nces.ed.gov/ipeds/Downloads/Forms/IPEDSGlossary.pdf
Winnick, Steven Y. Steven Y. Winnick to Marshall A. Hill, March 16, 2017, Reporting Small Cell Size Data
to NC-SARA. http://www.nc-sara.org/files/docs/NC-SARA-Memo-EdCouncil_2017.pdf