nc community college system - north carolina general assembly€¦ · nc community college system:...
TRANSCRIPT

NC Community College System: Overview
Presentation to Joint Appropriations Subcommittee on Education
Brett Altman
Mark Bondo
Fiscal Research Division
March 18, 2015
Presentation Agenda
1. NCCCS Background
2. Enrollment
3. Budget Overview
4. State Aid Allocation
5. Questions
3/18/15 2

NCCCS Background
3/18/15 3

Locations
• 58 colleges, 3rd most in the nation.
• 33 additional campuses
3/18/15 4

Governance
State Board of Community
Colleges
Serves as the governing authority for NCCCS
21 members – 18 are appointed by Governor (10), House(4), and Senate (4); 3 serve ex-officio
Elects the System President and sets system policies and regulations
Local Boards of Trustees
Serve as the governing
authority for 58 colleges
At least 13 members – 12
appointed by local Board of
Ed, county commissioners,
and Governor; 1 ex-officio
Elect college presidents
3/18/15 5

Faculty 6,929 43%
Senior Administration
311 2% Service
Maintenance 1,078
7%
Staff 3,777 24%
Support 1,622 10%
Technical Paraprofessional
2,330 14%
Full-Time College Staff: FY 2014-15
3/18/15
College Faculty and Staff
Total: 16,047 FT Staff
Note: This does not include positions in the NCCCS System Office; Source: FY 2014-15 NCCCS Statistical Report
6

Full-Time 44%
Part-Time 56%
Curriculum
3/18/15
College Faculty and Staff
Note: This does not include positions in the NCCCS System Office; Source: FY 2014-15 NCCCS Statistical Report
Full-Time versus Part-Time Faculty, FY2014-15
Full-Time 8%
Part-Time 92%
Continuing Education
7

Enrollment
3/18/15 8

797,341 801,676
809,091 829,146
859,419 847,165 844,692
826,471 824,945
780,146
700,000
720,000
740,000
760,000
780,000
800,000
820,000
840,000
860,000
880,000
900,000
2004-05 2005-06 2006-07 2007-08 2008-09 2009-10 2010-11 2011-12 2012-13 2013-14
3/18/15
Headcount: FY 2005-2014
Source: NCCCS Statistical Reports for FY 2002-03 to FY 2011-12
Headcount = # of students that enroll and take at least 1 course
9

244,508 268,433 272,244 287,215
310,985 334,879 338,431 329,713 326,171 321,158
569,172 576,259 578,545 584,064 595,051 560,434 552,554 540,669 540,854
497,732
0
100,000
200,000
300,000
400,000
500,000
600,000
700,000
2004-05 2005-06 2006-07 2007-08 2008-09 2009-10 2010-11 2011-12 2012-13 2013-14
Curriculum Non-Curriculum
Curriculum and Non-Curriculum Headcount
FY 2005-2014
Source: NCCCS Statistical Reports for FY 2004-05 to FY 2013-14
3/18/15 10

194,235
196,211 198,759
205,804
221,096
250,096
253,286
244,068
241,513
233,300
150,000
170,000
190,000
210,000
230,000
250,000
270,000
2004-05 2005-06 2006-07 2007-08 2008-09 2009-10 2010-11 2011-12 2012-13 2013-14
Actual FTE: FY 2005-2014
Source: NCCCS Statistical Reports for FY 2004-05 to FY 2013-14
FTE = # of full-time equivalent students
3/18/15 11

Curriculum 79%
Continuing Education
12%
Basic Skills 8%
Other* 1%
Actual FTE by Program Area
FY 2013-14
Total FTE: 233,300
Source: NCCCS 2013-14 Statistical Report
*“Other” includes Customized Training FTE, Small Business Center FTE, self-supporting continuing education FTE, and other non-budget FTE.
3/18/15 12

3/18/15
FTE & Budget Allocations
• Funds are allotted on a full-time equivalent
(FTE) basis
• Based on prior year enrollment numbers – not
projections
• A college’s budgeted FTE is determined by the
Modified Budget Stability Formula
– Calculates the higher of
• the prior year; or
• the average of the two previous years’ enrollment.
13
Budget Overview
3/18/15 14

State G.S. 115D-31
• Operating costs for
instruction,
administration, and
support services
Local G.S. 115D-32
• Operation and
maintenance of plant
Financial Support of Institutions
Per G.S. 115D-32, capital construction is the legal responsibility
of the county. However, G.S. 115D-31 authorizes the State to
provide capital funding to local institutions, provided that it is
matched on a dollar-for-dollar basis.
3/18/15 15

FY 2014-15 Sources of Funding
State Appropriation
$1,050,054,665 61%
Tuition and Fees $357,932,547
21%
Local $230,872,309
13%
Federal $36,704,406
2%
Carryforward from Prior Year
27,029,133 2%
Other Receipts and Transfers 22,523,179
1%
Sources: FY 2014-14 Certified Budget as of Dec. 2014, DCC 2-1 Summary
Total: $1.73 billion
3/18/15 16

NCCCS General Fund Appropriations
$828
$936
$981
$924 $945
$1,014
$1,002
$1,036
$1,016
$1,050
$500
$600
$700
$800
$900
$1,000
$1,100
$1,200
3/18/15
Sources: June 30 Actual Appropriations (BD 701) FY 2005-2014, Sept 30 Certified Budget FY 2014-15
17

Tuition: FY 2014-15
$72
$264
$70
$125
$180
$0
$50
$100
$150
$200
$250
$300
In-state Out-of-State 0-24 hours 25-50 hours 51+ hours
Max. $2,304 per year
Max. $8,448 per year
Curriculum Tuition per Credit Hour Continuing Education Fees
3/18/15 18

$1,136 $1,216 $1,264 $1,264
$1,344 $1,344
$1,600
$1,808
$2,128 $2,304
$0
$500
$1,000
$1,500
$2,000
$2,500
05-06 06-07 07-08 08-09 09-10 10-11 11-12 12-13 13-14 14-15
Tuition: Maximum Curriculum Tuition
3/18/15 19
$2
,24
4
$2
,28
1
$2
,34
1
$2
,74
0
$2
,91
1
$3
,07
2
$3
,07
4
$3
,12
0
$3
,15
4
$3
,18
8
$3
,24
2
$3
,58
1
$3
,68
3
$3
,73
5
$3
,74
0
$3
,77
6
$4
,14
0
$4
,20
0
$0
$500
$1,000
$1,500
$2,000
$2,500
$3,000
$3,500
$4,000
$4,500
$5,000
MS NC TX AR LA SREBmedian
FL WV USmedian*
OK DE GA TN VA SC MD AL KY
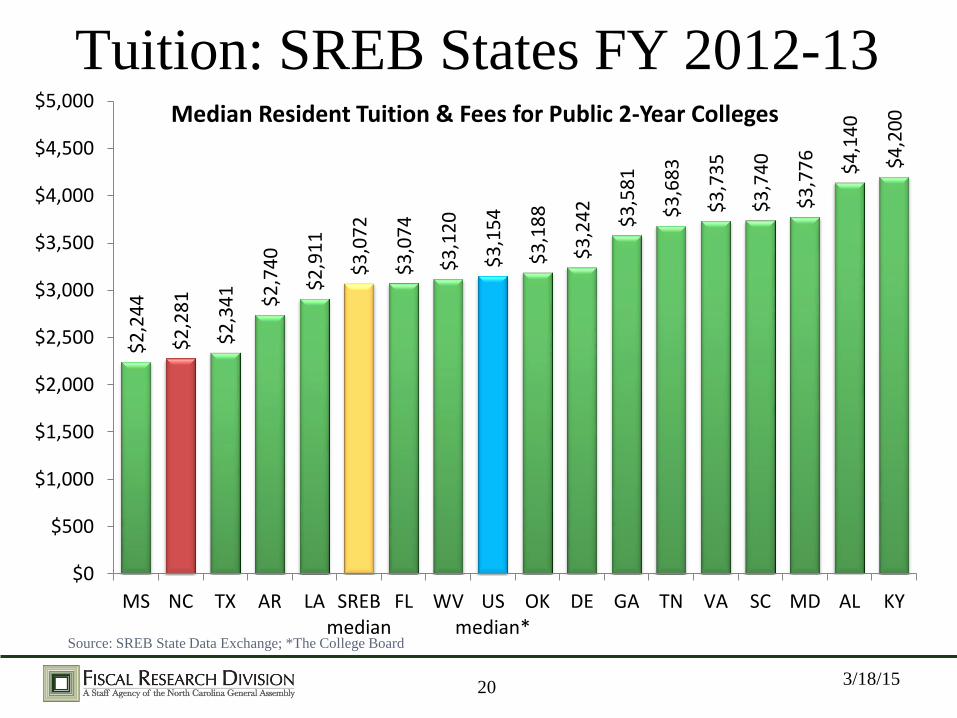
Median Resident Tuition & Fees for Public 2-Year Colleges
Tuition: SREB States FY 2012-13
Source: SREB State Data Exchange; *The College Board
3/18/15 20

State Aid Allocation
3/18/15 21
22
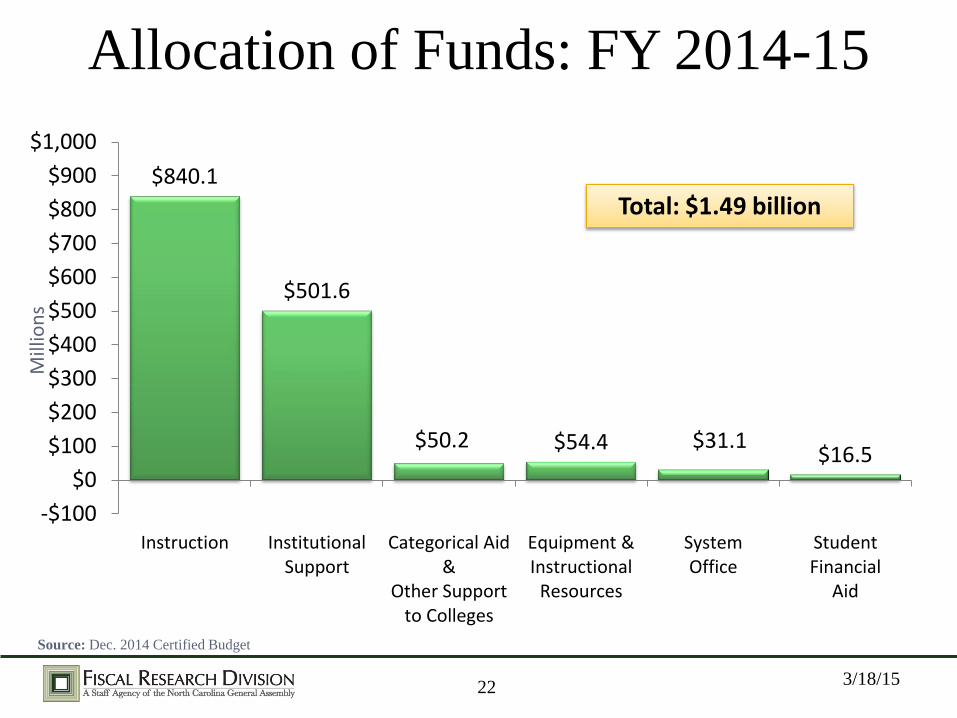
Allocation of Funds: FY 2014-15
$840.1
$501.6
$50.2 $54.4 $31.1 $16.5
-$100
$0
$100
$200
$300
$400
$500
$600
$700
$800
$900
$1,000
Instruction InstitutionalSupport
Categorical Aid&
Other Supportto Colleges
Equipment &Instructional
Resources
SystemOffice
StudentFinancial
Aid
Source: Dec. 2014 Certified Budget
Total: $1.49 billion
Mill
ion
s
3/18/15

23
Funding Flexibility • The General Assembly has allowed colleges to
have flexibility in order to meet individual college needs.
• Formulas are for allocation purposes only.
• Colleges can spend the formula allocations however they choose, except:
– Basic Skills funding may only be used for basic skills programs.
3/18/15
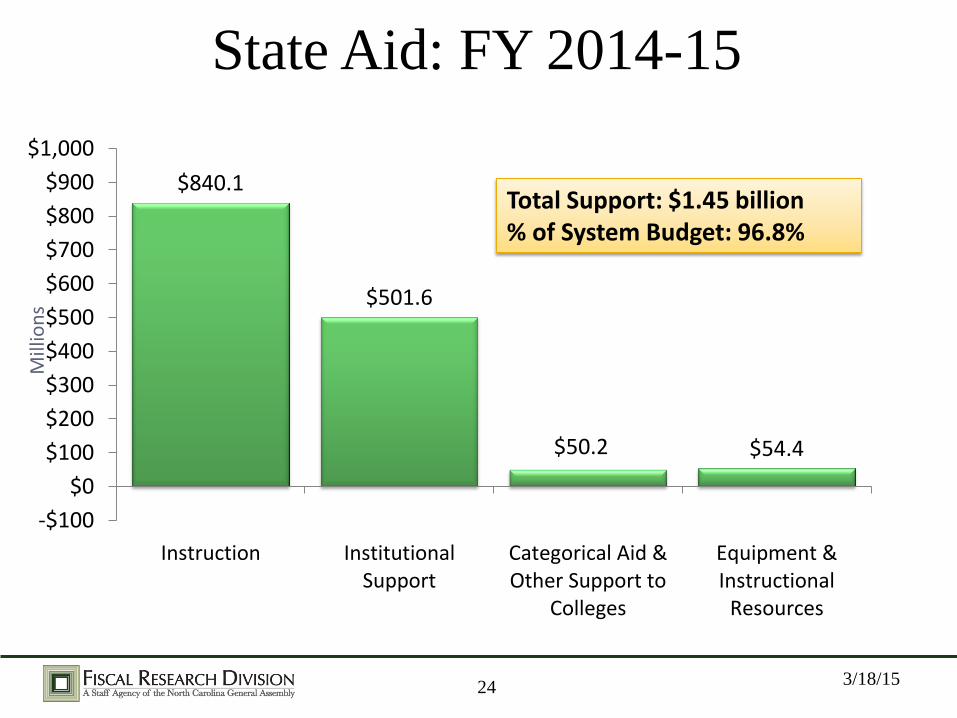
$840.1
$501.6
$50.2 $54.4
-$100
$0
$100
$200
$300
$400
$500
$600
$700
$800
$900
$1,000
Instruction InstitutionalSupport
Categorical Aid &Other Support to
Colleges
Equipment &Instructional
Resources
24
State Aid: FY 2014-15
Total Support: $1.45 billion % of System Budget: 96.8%
Mill
ion
s
3/18/15

Instruction: Base Funding
• Each college receives a base funding amount
through the curriculum and continuing
education formulas.
• Curriculum = $393,005 (equivalent to 6 full-
time faculty members)
• Continuing Education = $65,501 (equivalent
to 1 full-time faculty member).
3/18/15 25

Instruction: Legislative Changes
• S.L. 2011-145 directed the Community
Colleges to allocated funding on a formula
weighted basis
– Implemented by allocating funds on a Three Tier
Basis, primarily by program delivery cost
• S.L. 2014-100 authorized the creation of a
Fourth Tier under the “Closing the Skills Gap”
plan
3/18/15 26
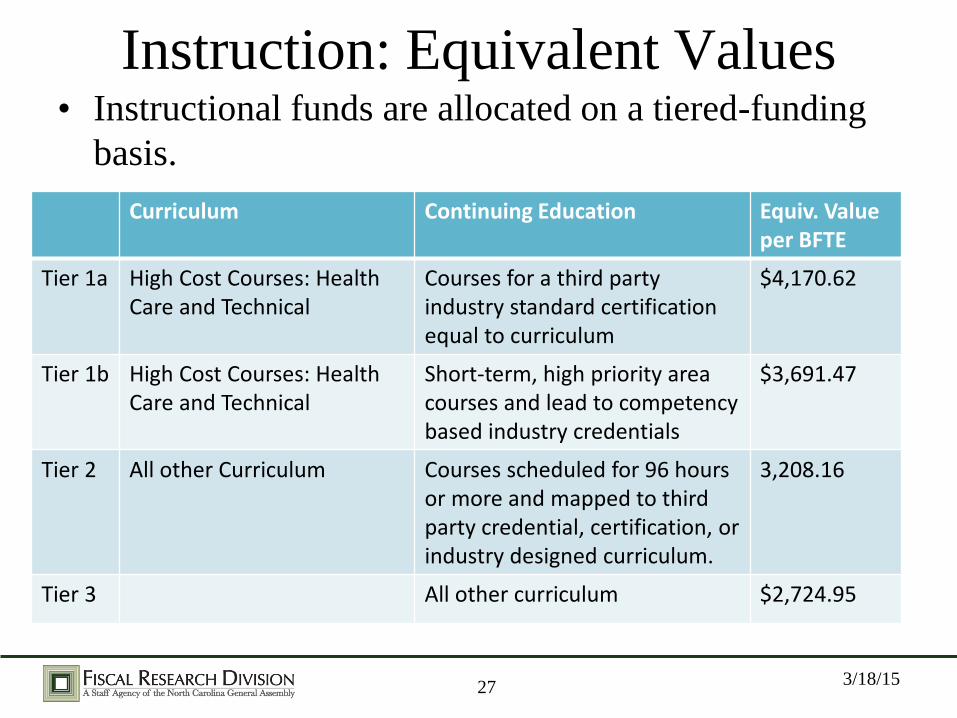
Instruction: Equivalent Values • Instructional funds are allocated on a tiered-funding
basis.
3/18/15 27
Curriculum Continuing Education Equiv. Value per BFTE
Tier 1a High Cost Courses: Health Care and Technical
Courses for a third party industry standard certification equal to curriculum
$4,170.62
Tier 1b High Cost Courses: Health Care and Technical
Short-term, high priority area courses and lead to competency based industry credentials
$3,691.47
Tier 2 All other Curriculum Courses scheduled for 96 hours or more and mapped to third party credential, certification, or industry designed curriculum.
3,208.16
Tier 3 All other curriculum $2,724.95
28
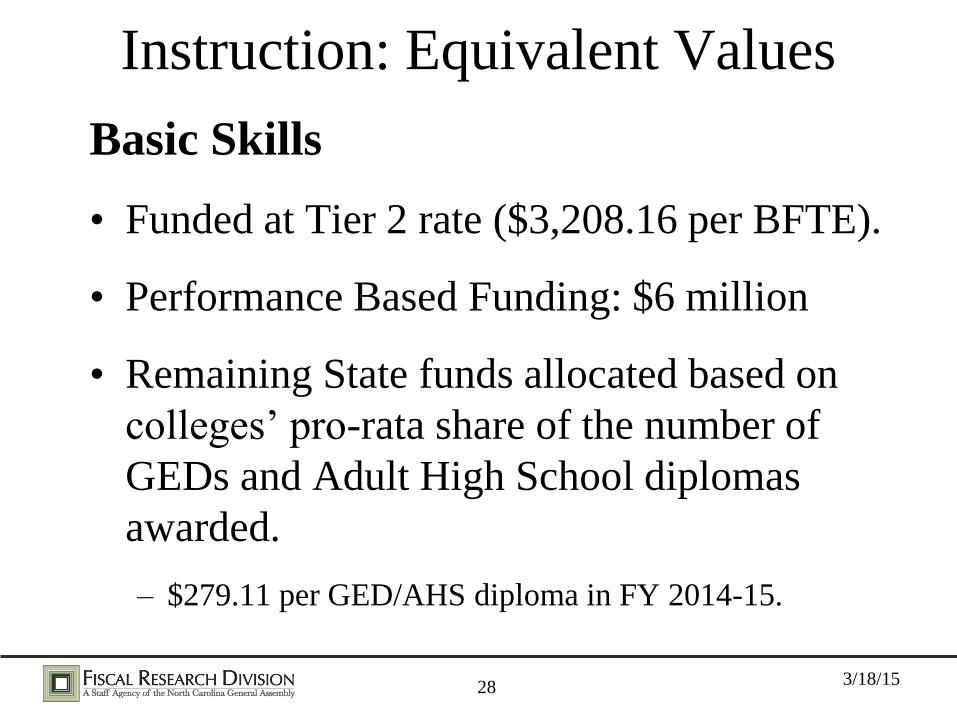
Instruction: Equivalent Values
Basic Skills
• Funded at Tier 2 rate ($3,208.16 per BFTE).
• Performance Based Funding: $6 million
• Remaining State funds allocated based on
colleges’ pro-rata share of the number of
GEDs and Adult High School diplomas
awarded.
– $279.11 per GED/AHS diploma in FY 2014-15.
3/18/15

Instruction: Performance Based
Funding
• S.L. 2013-360 directed the Community
Colleges to develop a performance measure
system and begin allocating funds based on it
• Community College allocates funds based on
six factors
– Considers “Quality” and “Impact”
• Appropriated $24 million in FY 2014-15, of
which $12 million was reallocated from other
sources
3/18/15 29

$840.1
$501.6
$50.2 $54.4
-$100$0
$100$200$300$400$500$600$700$800$900
$1,000
Instruction Institutional Support Categorical Aid &Other Support to
Colleges
Equipment &Instructional
Resources
30
Institutional & Academic Support
What it is:
• Academic & Student Support
• General College Administration
• Multi-campus college (MCC) funding
What it pays for:
• President & Senior Administrators
• Guidance Counselors & Financial Aid
Officers
• Librarians & IT Staff
• Paraprofessionals & Clerical Staff
• Salary and Benefit related items
35 % of Total Support
Mill
ion
s
3/18/15
31
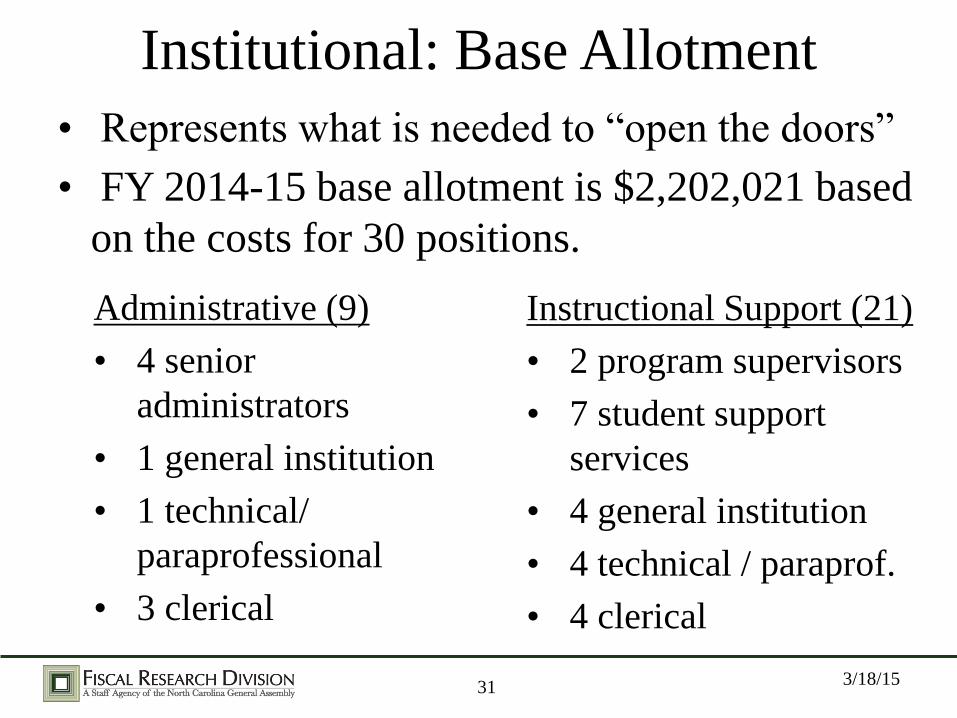
• Represents what is needed to “open the doors”
• FY 2014-15 base allotment is $2,202,021 based
on the costs for 30 positions.
Institutional: Base Allotment
Administrative (9)
• 4 senior
administrators
• 1 general institution
• 1 technical/
paraprofessional
• 3 clerical
Instructional Support (21)
• 2 program supervisors
• 7 student support
services
• 4 general institution
• 4 technical / paraprof.
• 4 clerical
3/18/15

• Provides funding for colleges with multi-
campus centers (MCC), self-contained satellite
campuses.
• MCCs offer all student services – financial aid,
registration, guidance counselors, and libraries.
• To be classified as an MCC, a campus must
offer at least one Associate Degree obtainable
entirely at that campus and have an enrollment
of at least 300 FTE.
32
Institutional: Multi-Campus Allotment
3/18/15

• Two levels of MCC funding:
33
Institutional: Multi-Campus Allotment
FTE Allotment Campuses
Level 1 < 1,500 $512,706 28
Level 2 > 1,500 $858,341 5
3/18/15
34
• Provides additional funding for each
FTE over 750.
• FY 2014-15 enrollment allotment:
$1,699 per FTE.
Institutional: FTE Enrollment Allotment
3/18/15

$840.1
$501.6
$50.2 $54.4
-$100$0
$100$200$300$400$500$600$700$800$900
$1,000
Instruction Institutional Support Categorical Aid &Other Support to
Colleges
Equipment &Instructional
Resources
35
Categorical Aid & Other Support to Colleges
What it is:
• Funding provided to colleges outside
the regular allotments
What it pays for:
• Items outside of Instruction, Institutional
Support, Equipment, and other formula
driven items
• Specific campus initiatives
• Specific programs
3.5% of Total Support
Mill
ion
s
3/18/15
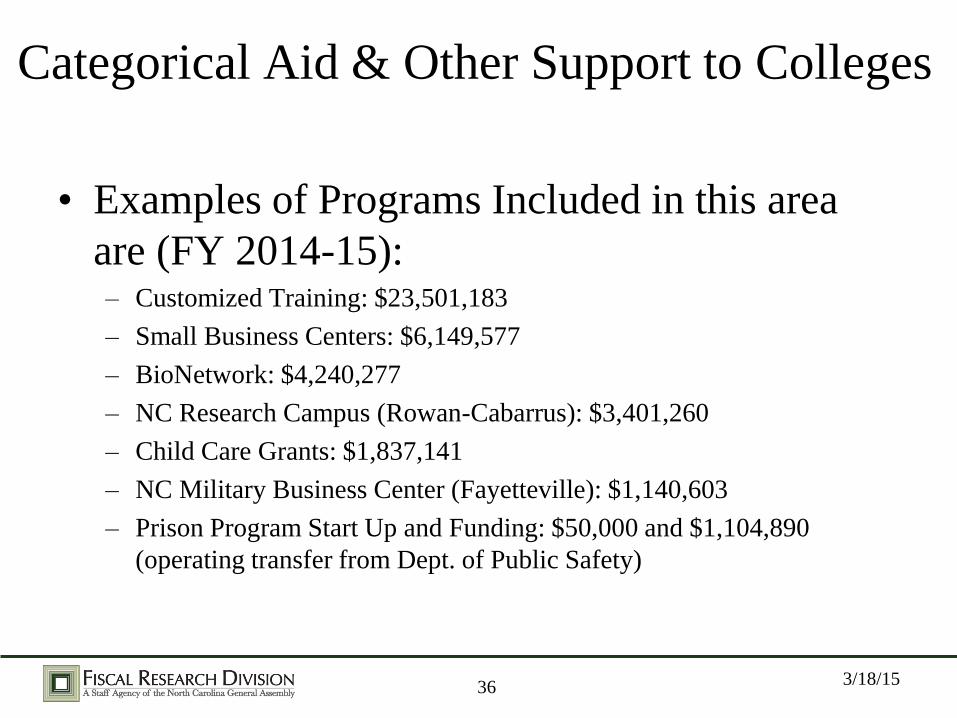
Categorical Aid & Other Support to Colleges
• Examples of Programs Included in this area
are (FY 2014-15): – Customized Training: $23,501,183
– Small Business Centers: $6,149,577
– BioNetwork: $4,240,277
– NC Research Campus (Rowan-Cabarrus): $3,401,260
– Child Care Grants: $1,837,141
– NC Military Business Center (Fayetteville): $1,140,603
– Prison Program Start Up and Funding: $50,000 and $1,104,890
(operating transfer from Dept. of Public Safety)
3/18/15 36

$840.1
$501.6
$50.2 $54.4
-$100$0
$100$200$300$400$500$600$700$800$900
$1,000
Instruction Institutional Support Categorical Aid &Other Support to
Colleges
Equipment &Instructional
Resources
37
Equipment and Instructional Resources
What it is:
• Equipment
• Instructional Resources
What it pays for:
• Computers
• Instructional equipment
• Books and other library resources
3.8% of Total Support
Mill
ion
s
3/18/15

38
Equipment Allotment
• Each college receives a base allocation of
$100,000.
• Remaining funds are allocated to the
colleges on a weighted FTE basis.
• $245.12 per Equipment FTE (E/FTE) • Low = .5 E/FTE (College Transfer, General Education, Basic Skills)
• Moderate = .75 E/FTE (Occupational Education)
• High = 1.0 E/FTE (Technical and Vocational Education)
$48,962,762 allotted in FY 2014-15
3/18/15
39
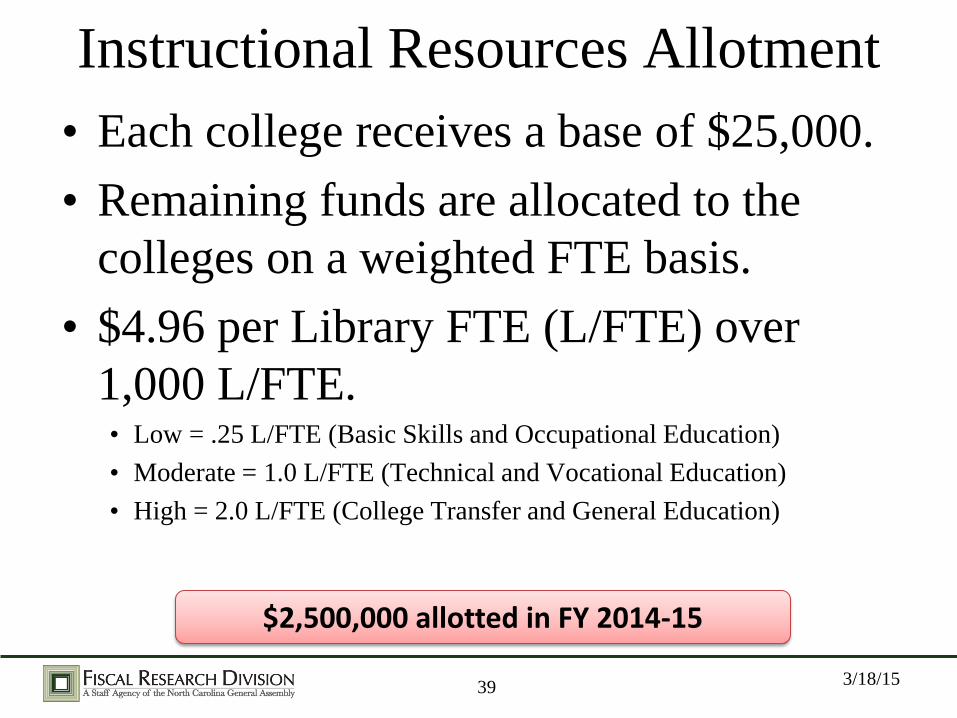
Instructional Resources Allotment
• Each college receives a base of $25,000.
• Remaining funds are allocated to the
colleges on a weighted FTE basis.
• $4.96 per Library FTE (L/FTE) over
1,000 L/FTE. • Low = .25 L/FTE (Basic Skills and Occupational Education)
• Moderate = 1.0 L/FTE (Technical and Vocational Education)
• High = 2.0 L/FTE (College Transfer and General Education)
$2,500,000 allotted in FY 2014-15
3/18/15

40
Management Flexibility Reserve
• Management flexibility reduction is a budget cut
that is not specifically prescribed.
• Colleges have the flexibility to determine what
budget line items to cut, within certain
parameters.
• Allocated on a pro-rata basis based on each
colleges’ estimated General Fund appropriation.
Total Management Flexibility Reduction: $59,233.302
3/18/15

($38.80)
($17.00)
($0.02) ($3.50)
-$50
-$40
-$30
-$20
-$10
$0
Instruction Institutional Support
Categorical Aid &Other Support to
Colleges
Equipment &Instructional
Resources
41
Management Flexibility Reduction M
illio
ns
3/18/15
