nber working paper series the case of the ... working paper series the case of the negative nominal...
TRANSCRIPT

NBER WORKING PAPER SERIES
THE CASE OF THE NEGATIVENOMINAL INTEREST RATES:NEW ESTIMATES OF THE TERMSTRUCTURE OF INTEREST RATESDURING THE GREAT DEPRESSION
Stephen G. Cecchetti
Working Paper No. 2472
NATIONAL BUREAU OF ECONOMIC RESEARCH1050 Massachusetts Avenue
Cambridge, MA 02138December 1987
Much of the work contained in this paper was completed while the author was aVisiting Scholar at the Federal Reserve Bank of Kansas City. Thanks are dueto Bob Cumby for discussions and aid beyond the call of duty; Rick Mishkinfor numerous conversations; Bob Barsky, Ernie Bloch, Hobart Carr, BenFriedman, Ed Kane, Peter Temin, Paul Wachtel, Eugene White and theparticipants in the 1987 NBER Summer Institute for discussions and commentson an earlier draft; Ellen Nose, Raj Mital, Tom Dean and Chuck Larson foruntiring research assistance. The research reported here is part of theNBER's research program in Financial Markets and Monetary Economics. Anyopinions expressed are those of the author and not those of the NationalBureau of Economic Research. Support from the Lynde and Harry BradleyFoundation is gratefully acknowledged.

NBER Working Paper #2472December 1987
The Case of the Negative Nominal Interest Rates:New Estimates of the Term Structure of Interest Rates
During the Great Depression
ABSTRACT
During the 1930s and early 1940s U.S. Treasury bonds and notes hadnegative nominal yields as they approached maturity. But since an investorcan always hold cash, this is impossible. Any bond must have a positivenominal yield. This paper poses a resolution to this puzzle: in addition tomaking coupon payments, Treasury securities were options that gave theowner the right to buy a new security on a future date. The paper proposesa method for valuing this 'exchange privilege' and computing the yield tothe coupon bearing component of these composite bond/options. The caseof the negative nominal interest rates demonstrates that the construction ofaccurate data requires close examination of the institutional environment,even when studying financial markets.
The corrected bond and note yields are used to calculate new estimatesof the term structure of interest rates from 1929 to 1949. These new dataallow one to follow changes in the both the level and the shape of the yieldcurve during the Great Depression.
Stephen G. CecchettiDepartment of Economics410 Arps HailOhio State University1945 N. High StreetColumbus, Ohio 43210—1172(614) 292-9339

1 IntroductionOn December 31, 1932 the New York Times listed the yield on a 3%
United States Liberty Bond as -1.74%. This seems impossible. An investorcan always hold cash rather than an interest bearing security, so any bondshould have a positive nominal yield. It is well known that during the GreatDepression the prices of Treasury Bills at auction occasionally exceeded par.But the negative yields were extremely small, on the order of .05%.1 Yieldsof this small a magnitude can be explained by both the fact that TreasuryBills were exempt from personal property taxes in some states {See Homer(1976) pg. 355.] and that Treasury securities were required as collateral fora bank to hold U.S. Government deposits.2 Negative nominal yields on theorder of -2% are an entirely different story. In fact, from mid-1932 throughmid-1942, the vast majority of coupon bearing U.S. Government securitiesbore negative nominal yields as they neared maturity.3
Since negative nominal yields are impossible in a world where one canalways hold cash, these securities must have had other attributes that werebeing valued. During the 1930s, the standard practice of the U. S. Treasurywas to issue new bonds with coupon rates that implied market prices abovepar, but sell them at par. Holders of maturing bonds and notes were givenpreferential treatment in the distribution of the new issue. Coupon bearingTreasury securities had what was called an 'exchange privilege'. At maturity,they could be exchanged at par for a new issue. Government bonds and noteswere not just coupon securities; they were options as well. The option hadvalue that was included in the quoted price. As a bond approached maturity,this premium caused the price to rise high enough that the computed yieldwas negative.
The solution to the first puzzle, that of the negative nominal interestrates, has given way to a second one: Why did the Treasury sell new issuesat prices below those prevailing in the market? The answer to this questioncan be found by studying the institutional environment of the 1930s. Legal
in excess of par were received throughout 1939, 1940 and 1941. The highestrecorded was 100.018 on January 8, 1941. See the Annual Report of the Secretary of theTreasury, 1941 pg. 301.
2j have also heard the claim that banks substituted Treasury Bills for smaller de-nomination currency in making interbank transfers, and so the negative yield reflectedconvenience. Unfortunately, this could not be substantiated.
3The plots in both Durand (1942) and the U.S. Treasury Bulletin for 1939 implynegative nominal yields for maturities below two years. Childs (1947, pg. 259) also notesthe existence of negative nominal yields in the 1930's but provides no explanation.
1

constraints forced the Treasury to sell new securities at par. To insure thatan offering actually sold, the coupon rate had to be set above the currentmarket interest rate. Initial purchasers were paid to place the new issue.This was the method of underwriting.
The purpose of this paper is to describe the conditions that led to theapparent negative nominal interest rates and then use this information toconstruct accurate data on the returns to holding U.S. Government securi-ties during the 1930s and 1940s. Proper computation of the term structureduring the 1930s requires careful examination of the institutionsof the bondmarket and Treasury debt management. In what follows, a method for valu-ing the exchange privilege is described and used to correct the measurementof the yields of traded securities. These are used to construct term structureestimates from 1929 to 1949 that are consistent with those currently in use.These new data replace the sketchy data contained in the Federal ReserveBoard's Banking and Monetary Statistics of the United States, and for thefirst time allow one to follow changes in the shape of the term structure dur-ing the Great Depression. The interest rate data can be added to new dataon three and six month time loans in Mankiw and Miron (1985) and thenew output, production and unemployment data in Romer (1986a, 1986b,
1986c and 1987).The motivation for constructing this new data set is twofold. First,
empirical research in macroeconomics often relies on the use of lengthytimeseries data.4 While Salomon Brothers publishes estimates of yields at 3months, 1, 2, 3, 4, 5, 10, and 20 years to maturity beginning in 1950, dataon the term structure of interest rates prior to 1950 are noticeably missing.Second, the resurgence of interest in the economics of the Great Depression6makes it all the more important to exploit new data sources.
The remainder of this paper is divided into five sections. Section II de-scribes the raw data collected and used in the study. The following sectionprovides a detailed account of the Treasury practices that caused nominalinterest rates to be negative. The rationale for the Treasury's behavior is
also examined. A method for valuing the exchange provision is then pro-
4This is true of the original work on business cycle dating summari2ed in Moore andZarnowitz (1986) and the more recent studies of the effects of money by Friedman andSchwartz (1982) and investment by Gordon and Veitch (1986).
Recently, McCulloch (1987) has estimated coupon corrected yield curves for December1946 to February 1987 that will likely replace the Salomon data in future research.
6Papers by Bernanke (1983, 1986), Bernanke and Powell (1986), Field (1984), Hamilton(1987) and the essays in Brunner (1981) are examples.
2

posed and used to compute the yield to the coupon bearing component ofthe composite bond/option. To allow the complete use of the information inthe data, it is necessary to study the tax status of existing securities. Thisis the task of Section 4. The following section uses this tax information,together with the corrected yields from Section 3, to construct estimates ofthe term structure using a technique derived by Nelson and Seigel (1985).The concluding section provides a comparison of the new interest rate serieswith those previously available and finds that there are substantial differ-ences. The adjustments for the exchange privilege lead to systematicallyhigher estimates of yields at maturities below five years.
2 Data
Existing data on nominal interest rates prior to World War II are bothlimited in scope and imprecise. The Federal Reserve Board's Banking andMonetary Statistics of the United States contains several series for interestrates during the inter-war period, but it is dlifficult to tell exactly how thenumbers were constructed and to what securities they actually refer. Forexample, Table No. 122 on page 460 of the Banking and Monetary Statisticsincludes monthly series for '3- to 5-year tax exempt Treasury notes', whileTable No. 128 on page 468 reports longer term bond yields under the simpleheading 'U.S. Government'. The second of these refers to the unweightedaverage of the yield on all outstanding bonds with at least twelve years tomaturity. Clearly, there is motivation for collecting a new and more completeset of interest rate data.
Construction of a new data set on the term structure requires infor-mation on the prices of outstanding Treasury issues. These raw data werecollected from the New York Times financial column entitled 'Bond Sales onthe New York Stock Exchange.' Quotes on the prices of all U.S. TreasuryBonds, Notes and Certificates of Indebtedness were collected from the NewYork Times for the final trading day of each month from January 1929 toDecember 1949. The data set is complete in that it contains a yield forevery bond, note or certificate for every month during which it was in exis-tence. It is composed of all 152 coupon bearing securities either in existencein January 1929 or issued during the twenty-one year period examined, Ofthis total, 56 are bonds, 54 are notes, and 42 are certificates of indebtedness.
In addition to coupon securities, beginning in mid-1931 data were col-lected on the yield of Treasury Bifis with three months to maturity —prices
3

are not reported.7 As is currently the case, Treasury Bills were pure discountsecurities. Other Treasury Bills of shorter maturity were excluded since the
major objective is to study yields at longer maturities.8As is nearly always the case in research on financial markets, the data
refer to dealer price quotes. There is no guarantee that actual transactionsoccurred at these prices. This problem is minimized by computing yieldsbased on the mean of the bid/ask spread. But it is impossible to know howlarge an error comes from systematic differences betweendealer quotes and
transactions prices.It is possible, however, to insure that trading occurred. The New York
Times does report volume. For example, on January 30, 1932, volume inthe 3% Treasury Bonds of 1940-43 amounted to $130,000. While this isa very small fraction of the nearly $360 million of the issue outstanding, itis important that there was some trading. To make the data set complete,in several isolated cases it was necessary to use price quotes that did notreflect trading on the New York Stock Exchange. These quotes were found
in the New York Times under the heading 'U.S. Bond Quotations —Closingquotations for issues not traded in on [sic] the Stock Exchange yesterday.'
Since the majority of U.S. Treasury bonds issued during this period con-tamed call provisions, there is a problem in computing the yield to maturity.Fortunately, except for several very special cases, all bonds were called onthe first allowable date. As such, all yields were computed to the call date.9
The raw data consists of 9070 observations over 252 months, or justunder 36 observations per month, on average. These raw data are availablefrom the author on standard diskettes. As one would expect, the number of
observations is small during the first few years, increasing substantially withthe debt issues of the middle 1930s and again with the issues duringWorld
7Childs (1947, pg. 432) describes early Treasury Bill issues. While the first TreasuryBills were issued in 1929, it was not until 1931 that a series can be constructed that iscomposed solely of issues with three months to maturity. During 1929 and 1930, bills
were issued at irregular intervals and matured in three, six, nine or twelve months. Threemonth Treasury Bill rates were found for February, April and May 1931, as well as everymonth beginning with July 1931.
81n addition, all interest bearing government debt not issued directly by the U.S. Trea-sury, such as securities issued by the Federal Home Loan Bank Board or the Reconstruction
Finance Corporation, is omitted.alternative is to compute the yield to the call date when the price of the security
exceeds par, and the yield to the final maturity date when the price is below par. Use of
this rule would have virtually no effect on the results since bonds nearly always sold at
prices in excess of par.
4

War II. In 1929, 1930 and 1931 there are an average of only 14 data pointsper month. By 1933, the average is over 20, rising steady to 40 in 1939, to54 in 1945 and falling to 38 in 1949. The implication is that the estimatedyield curves will be less accurate for the earlier period simply because of thepaucity of data.
3 Negative Nominal Yields and theExchange Privilege
Consider the following exercise. Take the data described in Section 2 fora representative month and compute the yield to maturity for all the couponbearing securities based on the mean of the bid/ask spread. The results forFebruary 1935 are plotted in Figure 1.10 In the figure, N's refer to fullytax exempt securities and P's refer to partially tax exempt securities. Thisdistinction is discussed further in Section 4. The solid line is an estimate ofa term structure using the techniques described in Section 5. (Following thestandard convention, all interest rates are in bond yield equivalents — twotimes the six month rate.)
Figure 1 has several striking features. First, except for the single Nrepresenting the 3 month Treasury Bill yield of .15%, the yield curve issmoothly upward sloping, if one were to neglect the vertical scale, thepicture would not seem odd. The problem is that the lowest point is aTreasury note with 5 months to expiration and a yield of -1.25%. if thisresult were obtained for an isolated month, one would be inclined to checkthe raw price data for errors. But negative yields arise consistently from1932 through 1942.
Discussions of the period note the existence of negative nominal yields.They point out that during the 1930s the standard practice of the U.S.Treasury was to issue new bonds above par and give holders of maturingbonds, notes and certificates preferential treatment in distributing the newissue. Maturing securities had an 'exchange privilege' which gave themadded value.
The remainder of this section is divided into two parts. The first pro-vides a discussion of the institutional environment that led to the apparentnegative nominal yields and discusses the reason for the Treasury to issue
10A similar diagram was constructed for every month of the data set. From 1934 to1941 all of the figures had the same general features as Figure 1.
5

—1
FIG
UR
E
1
Unc
orre
cted
Yie
ld C
urve
for
Feb
ruar
y 19
35
Years To Maturity
3 2 1 0
—2
5

securities in the way that it did. This is followed by a detailed descriptionof how to correct the data for the existence of the exchange privilege.
3.1 The Exchange PrivilegeEach year, the Annual Report of the Secretary of the Treasury describes
the offerings of securities during that year. In the 1930s, new offeringswere announced from one to two weeks prior to the date of issue. Theannouncement stipulated the method of payment. The purchaser was eitherrequired to pay cash, required to exchange an existing security (valued atpar), or given a choice of the two. Of the 86 new and additional offerings ofbonds, notes and certificates of indebtedness from 1932 to 1940, 15 requiredcash payment, 31 could be obtained only by exchange, and the remaining40 gave the purchaser a choice.11
For reasons that wifi be discussed below, the Treasury'sregular practicewas to fix the coupon rate on a new issue above the current interest ratefor a bond of equivalent maturity, causing the initial price of the new bondin the securities market to exceed par. Exchange allowed the holder ofamaturing security to reap the benefit of this, giving value to the exchangeprivilege.12 Of the 57 coupon bearing securities that matured between 1932and 1940, 54 could be exchanged at maturity for new issues that initiallysold in excess of par.
Cash payment was by subscription. Prospective purchasers made appli-cation for a certain amount of the issue and sent either 5% or 10% (dependingon the issue) of the face value as a deposit. Subscription was guaranteedupto some level, usually $5,000 or $10,000. Individuals' requests in excess ofthe minimum were filled as a percentage of the total of all applications. Forexample, subcribers to the 1949-52 bond, whose issue was announcedon December 3, 1934, were alloted 18% of the amount they requested, butnot less than $10,000.. Between 1932 and 1940, cash subscribers, on average,were alloted 15.4% of their requests, but not less than $5263.
Once the allotment was determined, a cash subscriber could take deliv-ery by paying the remaining balance. For example, a request for $100,000
'1The total of 86 issues exceeds the actual number of new securities by 19 because ofthe practice of making additional offerings of aireading existing securities.
'2Durand (1942) mentions the exchange privilege, but implies that its value is derivedfrom the saving in brokerage fees that comes from rolling over an investment. It is difficultto see why someone wishing a long term security would buy a maturing one simply for thebenefit of having it roll over. Theis (1985) in replicating the work of Durand also notesthe existence of the exchange privilege and correctly points out the source of its value.
7

might require a $10,000 deposit. lithe final allotment were 18%,then upondelivery the subscriber must pay the balance of $8,000. Because the bondswere issued above par, a cash subscriber could make a profit by seffing themimmediately. In the case of the 3% 1949-52 bond, the bid price on De-
cember 15, 1934 was 101w, implying a profit of 1. Alternatively, sincethe offering announcement guaranteed a minimum allotment, in this case$10,000, a subscriber could sell the securities to a dealer on a when-issuedbasis. In this second case, the investor would take delivery of the bonds andimmediately hand them over to the dealer, retaining the difference betweenpar and the when-issued price that was previously agreed upon.13
Neither of the strategies associated with cash subscription was withoutrisk. Since the market price of the bond on the issue date was uncertain atthe time of subscription, there is clear risk in actually taking delivery andthen selling the bonds on the open market. Since the allotment was notguaranteed, an investor had no way of knowing the quantity that would bedelivered and could not safely sell more than the guaranteed amount on awhen-issued basis. Exchange, on the other hand, was less risky since theamount of the new issue received was always guaranteed.
At this point, it is useful to compute the realized values of both the ex-change privilege and the profit from cash subscription. The profitfrom cashsubscription is easily determined by collecting data on the first quoted priceof a new issue and taking the difference from par. In order to value the ex-change privilege, information in the Treasury's offering notices, reprintedinthe Annual Report of the Secretary of the Treasury, was used to match each
maturing note and bond, beginning with the 2% Treasury note maturing onMarch 15, 1932, with the new issues for which it could be exchanged. Thenthe value of each new security on its issue date was determined by using theclosing quotation from the New York Times on that date.14 The realizedvalue of the exchange privilege is the difference between the first bid price of
the new issue and par. When a security could be exchanged for morethanone new one, the value was assumed to be that of the most lucrative trade
13Porter (1938,1939) calls this a 'free-ride' and describes in detail how to make a quickprofit in the week preceding the new issue. She suggested subscribing, and selling theguaranteed amount, then only $1000, on a when-issued basis. According to aBell's accountin the December 11, 1938 New York Times, Porter's article in the December 1938 issue
of Scribner's Magazine set off a rush of subscriptions during that month and caused the
Treasury to reduce the guaranteed amount.'41n several cases, no quote was found in the newspaper. For bonds, the first available
quotation reported by Childs was substituted. For notes, the first available quote waslocated in the New York Times.
8

available. Obviously, the realized value was always nonnegative.To illustrate the procedure, take an example. The 2% Note issued on
January 29, 1934 and maturing on March 15, 1935 could be exchanged fora 1% Note maturing on March 15, 1940. The March 16, 1935 New YorkTimes reported the first bid on the new issue as 101k, 1.16% above par.
Between 1932 and 1940, the average value of the exchange privilege re-alized by holder of maturing coupon secruities was 1.1% with a standarddeviation of .67%. Cash subscribers realized an average profit of .68% witha standard deviation of .51%.
It appears that the mechanism used to issue and refund Treasury debtinvolved giving away substantial amounts money. But closer examination ofboth the legal and economic environment of the 1930s leads to an explana-nation of the Treasury's behavior. From the end of 1929 to the end of 1939the interest bearing debt of the U.S. Government more than doubled, risingfrom $16 biffion to $41 biffion. Prior to the Depression, major buildups ofgovernment debt had only occured during wartime and the severe Depres-sions of the 19th century. As such, the Treasury had no real mechanismfor issuing debt. The network of dealers and banks that serve to distributenewly issued securities today was not yet in place.
Current law also constrained Treasury actions. The Second Liberty BondAct, which gave authority for the issuance of Treasury debt, required thatnew Treasury Bonds and Certificates of Indebtedness be issued at par, andnew Notes issued at not less than par.'5 Given this statute, the only way toguarantee that a new issue would be sold (or maturing securities presentedfor exchange), was to set the coupon rate on the new bond or note abovethe current market interest rate on a comparable security.16
As is mentioned above, participation in either subscription or exchangeentailed risks, and so some sort of compensation was in order. With apotential exchange, there was no way of knowing what the value wouldbe until the full transaction was complete. The characteristics of the newsecurity were announced only a few weeks prior to maturity of the existingbond or note. For subscribers, there was the uncertainty about the sizeof the allotment and the movement of interest rates over the week priorto the physical delivery of the securities. The compensation for this risk isanalogous to the fee paid to underwriters of corporate securities who commit
15See U.S. Department of Treasury (1938).16Perhaps surprisingly, auctions of coupon securities by the U.S. Treasury did not begin
until 1970. Treasury Bills, on the other had, have been auctioned since their inception in1929.
9

themselves to selling a fixed quantity of a stock or bond at a given price ona future date, thereby assuming the risk inherent in price fluctuations.
Two pieces of evidence support the view that the exchange privilegeand the profit to cash subscription were underwriting spreads. First, themagnitude of the differential is appropriate. Cohan (1961), in his study ofthe cost of floating private debt in the 1930s, concludes that gross under-writing spreads for offerings of Aaa public utility bonds between 1935 and1940 ranged from 1.65% to 2.01%. The discrepancy between this and theapproprixmately 1% compensation for underwriting Treasury issues is easily
explained by differences in risk.'7Additional evidence comes from looking at the identity of the initial
purchasers of the Treasury's new offerings. During the 1930s, individuals inthe Second Federal Reserve District, New York, were alloted over 50% of all
new securities (either on subscription or exchange). It is natural to concludethat the banks and dealers in New York City, who dominate this FederalReserve District, were being paid a fee to insure placement of the bonds.'8
The impact of the legal constraints is also easy to demonstrate. Again,take the example of the 1 % Note issued on March 15, 1935 and maturing5 years later. As has already been noted, on March 16, 1935 the first bid for
the new issue was 101k. This implies a yield to maturity of 1.38%. Duringthis period, there seems to have been a convention that all coupon rates werequoted in even ths.'9 While the Treasury could have set the coupon rateat 1% and still sold the issue — the initial price would have been approx-
imately 1O0 — this may not have been viewed as sufficient compensationfor potential underwriters (brokers or individuals) to be willing to acceptthe risk associated with subscribing to this new issue.
Contemporary beliefs, as expressed in January 2, 1939 issue of Barron's,support this view. An article entitled 'Valuing of "Rights" in TreasuryNotes' states, in part:
17The fact that issues were heavily oversubscribed suggests that the payment offered bythe government exceeded the market clearing underwriting fee. But since everyone knew
how the subscription procedure worked, there must have been substantial gaming involved
in determining the subscription amounts. In fact, if every subscriber was indifferent aboutbeing ailoted an additional bonds, the ratio of requests to allotments could have become
arbitrarily large.18This is similar to the underwriting mechanism of the 1950s described in Bloch (1963).
Then, banks were allowed to buy new issues by simply crediting the Treasury's tax and
loan account at that bank.'9The first coupon security that did not have a coupon rate that was a multiple of .
was a 0.90% Note issued on December 1, 1944.
10

At the present time, the Treasury is faced with the prospectof having to borrow substantial amounts of new money for sometime to come. In addition, there is a large volume of short-termTreasury obligations that must be refunded during the next fewyears. Under these circumstances, [Treasury] Secretary [Henry]Morgenthau has apparently concluded that it is wise to make newUnited States Treasury issues unusually attractive to investors.
3.2 Computing the Corrected YieldsAn estimate of the market value of the exchange privilege substantially
prior to the maturity of a security is needed to correct the data for the valueof the exchange privilege.20 The effect of the exchange privilege is to raisethe price of a bond above what it otherwise would be. An interpretationof this is that securities were trading as if their face value exceeded 100 bya 'bonus' representing the value of the exchange privilege. Once the bonusis estimated, the yield to the coupon bearing component of the compositesecurity can be computed.
The realized value of the exchange privilege — computed by assumingthat an investor holds a bond to maturity, makes the exchange and sellsthe new security on the day of issue — is of no use. As is clear from theprevious discussion, the realized value is a biased estimate of the market'sexpectation, since it includes an underwriting spread. Fortunately, an arbi-trage condition can be used to value the exchange privilege and correct theyield estimates.
All coupon bearing securities in the sample made payments at six monthintervals. This means that all notes, bonds and certificates with less thansix months to maturity were pure discount securities.21 Beginning in Juneof 1931, the Government regularly issued three month Treasury Bifis. Arbi-trage implies that the yield on a note with less than six months to maturityand a bill maturing on the same day must be the same. This provides asimple way of calculating the market (or implied) value of the exchangeprivilege. Three months or less prior to maturity, each coupon bearing se-curity can be matched with a Treasury Bifi maturing on the same day. Theimplied value of the exchange privilege is the difference between the traded
20The same article in Barron's quoted above contains subjective estimates of the valueof the exchange privilege that differ by small amounts from those computed here.
The fact that interest on coupon bearing securities accrues linearly introduces a smallerror that is imperceptible at low interest rates.
11
price of the security and the price implied by the Treasury Bill rate, appro-priately discounted.22
To see how the computation is done, define P as the price quoted in thenewspaper for a bond nearing maturity. An individual purchasing the bondmust pay this price, plus accrued interest. Interest on government securitiesaccrues linearly between coupon payments. Assume the bond pays a couponSC per year, or $C every six months, and has rn years to maturity. Sincem is less than year (the bond has less than six months to maturity), thelast coupon payment was ( — m) years ago, and the accrued interest is
— m). The price with accrued interest is just F' = P + -( — m).
Arbitrage requires that the yield to holding this security equal the yield toholding a Treasury Bill maturity in m years, call this T. The implied value ofthe exchange privilege (Pre), is calculated from the arbitrage relationship:23
1 100+C+Pre . (1)(1 + r)m
The computation is very simple. Take the example of the 2% notematuring on March 15, 1935. On December 30, 1934, with two and one-halfmonths to maturity, the closing quotation for the mean of the bid/ask spreadwas 101.19, so the actual price with accrued interest was 101.19+2.5(g)101.92. if calculated naively, this implies a nominal yield to maturity of—3.28% at an annual rate. On the same date, the Treasury Bifis maturing onboth March 7 and March 21, 1934 yielded 0.20% bid, but no ask is reported.Assuming a bid/ask spread of 's indicates a mean bid/ask spread yield of0.05%. The implied value of the exchange privilege is calculated as the facevalue that is consistent with a price of 101.92 and a yield of 0.05%:
101.92= 100+2+Pr . (2)(1 + 0.0005)
For this case, the value of Pre is 0.68. The bond is trading as if its facevalue were 100.68. As noted above, the bond could have been traded in fora new security seffing for 101.16. So, while the realized value was 1.16, theimplied or market expected value was only 0.68.
22Thjs ignores the tax distortions in the Treasury Bill data mentioned in the introduc-tion, which are clearly small relative to the problem caused by the exchange privilege.
23Tax considerations do not effect this calculation, since both interest and capital gainson government securities were tax-exempt prior to 1941. See Section 4.1 for a partialdiscussion.
12

This procedure was employed for all coupon securities maturing betweenMarch 1932 and December 1944.24 All of the estimates are based on themean of the bid and ask price and maturity dates that match within threedays. When an ask price was not available, one was computed from the bidassuming a bid/ask spread of 25 (It is worth noting that marking thecoupon security to the Treasury Bill rate makes the information in the noteor bond yield redundant. As such, the yield curves estimated in Section 5do not utilize the coupon security yields at short maturities.)
A simple univariate regression can be used to summarize the relation-ship between the realized and the market expected value of the exchangepremium. Assuming that the realized premium (Pr) equals the expectedpremium (Pre) plus an orthogonal error, the appropriate regression is
Pr(i) .461 + 1.032 Pre(i)(.161) (.216)
(Numbers in parentheses are standard errors)—2Mean of Pr = 1.036 Number of Observations = 65 R .25
As anticipated, the market implied premium is correlated with the realizedvalue, but systematically underestimates it.26 The evidence supports thehypothesis that the value of the exchange privilege was related to its functionas an underwriting fee.
Once the implied market value of the exchange privilege is determinedfor every relevant coupon security, the yields can be recomputed. For eachsecurity, Pre(i) is assumed to be an increment to the face value. The yieldis recomputed for the entire lifetime of the note or bond assuming that theface value is [100 + Pre(i)], not the usual 100. For example, in thecase of
24Whjle the practice of allowing payment by exchange continued beyond 1944, theterms were no longer as favorable. Allotment was not guarantee, and so the value of the'privilege' disappeared.
25The results are not sensitive to the use of either the bid or ask in place of themidpointof the spread — the estimated values of the exchange privilege change by less than 0.0001.
26The comparison assumes that an individual cashes in the new security on the day itis issued. Prior to December of 1940, the capital gain from the sale of a note or certificateof deposit was nontaxable. If, however, the premium were taxable as a short term capitalgain, this would provide another explanation for the difference between the realized andimplied values in equation (3). For reasons that are described in the Section 4, it is onlybeginning in 1941 that the tax effects could have been significant. Examination of the datashows that the relationship between the realized and implied premium has no systematicdifference over the two periods.
13

the 2% Note described above, the yield for every month from January 1934
to February 1935 was recomputed assuming the face value was 100.68.27
Adopting this procedure entails making a very strong, but unavoidableassumption. For the entire lifetime of a bond, market participants are as-sumed to perfectly anticipate what the value of the exchange privilege will
be when the security reaches three months to maturity. Since the prices
of all government securities, except for Treasury Bills, were subject to the
distortions of the exchange privilege, there is no other way of determiningthe implicit value of the coupon bearing component of a bond or note atany time other than when its maturity is less than three months. Since noother data are available, there is no other way to proceed.28
Figure 2 plots the estimated yields corrected for the value of the ex-
change privilege for February of 1935. Again, P and N denote to differencesin tax treatment and the solid line is a term structure using the techniques
described in Section 5. For longer maturities, in excess of seven years or so,the data are nearly identical to the uncorrected yields plottedin Figure 1.
But for the shorter maturities, below five years, the yields are now strictly
positive and smoothly upward sloping. Futhermore, the three month Trea-
sury Bill yield that is so much higher than the remainder of the yield curvein Figure 1 no longer stands out.
There is obviously more noise in the corrected datathan in the raw data
in Figure 1. Any plot of the yield to maturity against the time to maturityfor coupon securities will only produce a smooth pattern, evenin theory, if all
the coupon rates are the same. This explains why, even at longermaturities,the figure reveals small vertical displacements. Matters are obviously worse
at the shorter maturities. While this may be due to inaccuracies in thequoted prices,29 some of the errors, are too large to be accounted for byanything but mismeasurement of the value of the exchange privilege. For
2TThe fact that both the realized and the market expected value of exchange privilegewere always strictly greater than zero, suggests that the option was always in the money.
If this was the case, an options pricing model is not need to compute the decay in the
value of the exchange privilege going back in time. The market implied value must decay
at the rate of interest implying that the method used is correct.28J is possible to examine the fluctuation in the market value of the exchangeprivilege
associated with a given security. This is done by recomputing the value of Pre for theobservations when the bond or note had less than three months to maturity. The results
of this exercise show only small movements.29 quotes are for the end of the day, but reflect information and revision at different
times of the day. Because of the nonlinearity of the yield computation, price quotationerrors cause larger errors in yields at at shorter maturities.
14

3 2 1 0 0
FIG
UR
E 2
Cor
rect
ed Y
eId
Cur
ve fo
r F
ebru
ary
1935
YeC
rS
Tc
Mct
L4r
ty
P P
P
P
P
NN
N
N
3 6
9 12
15

example, on December 31, 1938 the corrected yield to maturity for the 2%Note maturing on June 15, 1939 is estimated to be 1.025% (the uncorrectedyield is -2.13%). At the same time, the T-Bill maturing on March 29, 1934yielded 0.05%. A data point like this one is clearly visible on a scatter plot.The error is much to large to be the result of an error in a price quotethat is incorrect by several 32nd's. Mismeasurement of the value of theexchange privilege is the clear source. It is important to keep in mind thatthe shorter the time to maturity, the larger these errors become. As such,in the following analysis all coupon bearing securities with maturity of lessthan six months are omitted.
Errors and all, the corrections for the exchange privilege are extremelyimportant. They completely eliminate the existence of apparent negativenominal interest rates on coupon bearing securities and allow computationof yield curves for the 1930s.
4 Tax ConsiderationsThroughout the 1930s and 1940s, securities with different tax status
coexisted. It is important, therefore, to take account of the tax treatmentof interest payments in determining how to use the information containedin all of the data.
Changes in both individual and corporate taxes allow division of the 1929to 1949 period into two distinct subperiods. The dividing point is January1941. Prior to 1941, the interest income on nearly all U.S. Governmentsecurities was either partially or wholly tax exempt.30 Beginning on March1, 1941, all newly issued securities bore interest that was fully taxable. Theinterest on Treasury notes issued in December 1940 and January 1941 wasfully taxable as well.
The remainder of this section describes the details of the tax treatment ofinterest payments to individuals and corporations during these two period.The conclusion is that for the 1941 to 1949 period it is possible to conformto the precedent set by the Salomon data and quote nominal interest ratesof fully taxable securities on a before tax basis. From 1929 to 1940 all theinterest on government debt was essentially exempt from taxation, and sothe yields measure alter tax returns.
30Several issues prior to June of 1930 bore interest that was fully taxable to individuals,but wholly tax exempt for corporations. These will not be dealt with separately.
16

4.1 1929 to 1940
For the majority of the first twelve years of the sample, ifiterest on Trea-sury Bills, Notes and Certificates of Indebtness was completely exempt fromboth personal and corporate taxes. Interest on Treasury bonds, however,was partially tax exempt. The meaning of the partial tax exemption de-pended on whether the bond was owned by an individual or a corporation.It is important to consider both cases.
For individuals, the interest on the first $5000 face value of bonds heldwas exempt from income tax. Any additional interest was taxable at the'surtax' rate. During this period, the individual income tax was composed ofa 'normal' tax, which had at most two steps and a surtax that was graduatedwith as many as 55 steps. Today, the personal income tax simply sums thetwo. As has been the case in recent history, tax rates changed frequently.For the bulk of the period, the normal tax rate was 4 percent. The surtaxrate ranged from 1% to 75% depending on income.31
For corporations, interest on all government obligations was fully taxexempt prior to 1934. From 1934 to 1940, the interest on the face value inexcess of $5000 was taxable at the 'declared value excess profits' tax rate,but was exempt from the normal corporate income tax. Income in excess ofa certain percentage of the book value of a corporation's capital stock wassubject to this tax. In 1934-35, the rate was 5% on profits in excess of 10%of book value. From 1934 to 1940, this form of the excess profits tax rose to6% on profits between 10% and 15% of the book value of the capital stock,and equaled 12% of profits in excess of 15% of book value.
It is difficult to believe that the partial tax exemption had any valueto individuals holding Treasury Bonds since the majority of the owners ofthe bonds almost certainly held amounts in excess of $5000. Interest theyreceived was, to a first approximation, fully taxable. For corporations, how-ever, the tax exemption was very important.
The implication is that a proper comparison of partially and whollytax exempt bonds requires some inference about the identity of the ownerof the marginal bond. While it is impossible to determine the marginalparticipant in the securities market, information on the average participantcan be gleaned from data on the ownership of the bonds and the interestincome on which taxes were paid.
Data from tax returns show that the vast majority of the securities wereowned by corporations. Individuals were required to report ownership of
31See Statistics of Income For 1950, Part 1, pg. 319 if. for data on the surtax.
17

government debt. Tabulations of these returns in various issues of the Statis-tics of Income show that only 10% of the outstanding debt was owned indi-viduals. Corporations, on the other hand, reported holding in excess of halfof the debt.32
Data from corporate income tax returns allow examination of the taxliability faced by corporations receiving interest payments from the U.S.Treasury. These data show that the declared value excess profits tax paidon interest was negligible. The marginal tax rate applicable to interestincome faced by corporations was on the order of %.
The conclusion is that, between 1929 and 1940 partially tax exemptsecurities can be treated as if they were wholly tax exempt. Corporationsowned the bulk of the securities and faced tax rates that were negligible.This classification allows construction of estimates of the term structure ofnominal interest rates on tax exempt securities prior to World War II.
4.2 1941 to 1949
Beginning in 1941, the interest on all newly issued Treasury securitieswas treated as regular income to individuals and normal profits to corpora-tions. For individuals, this did not represent a very large change, since thepartial tax exemption of the previous years had very little impact. But forcorporations, the tax status of these new issues made their yields substan-tially different. Not only was the interest on the taxable securities subjectto the normal corporate profits tax and the declared value excess profits tax,but it was also subject to a new excess profits tax and numerous surtaxesduring World War II.
To see the difference this made to a corporation, take 1941 as an example.Interest paid on partially tax exempt bonds was subject to the declared valueadded excess profits tax with a maximum rate that had risen to 13.2%, plusa surtax with a maximum rate of 7%. By contrast, interest from fullytaxable securities was subject to both the normal corporate profits tax andan additional excess profits tax. The normal profits tax rate was 24% forcorporations with net income in excess of $38,500 and an excess profits tax.The new excess profits tax rates were very high. They began at 20% forincome less than $20,000 and increased to a maximum of 50% for incomein excess of $500,000. The highest tax rate on fully taxable interest income
32The remaining 40% is ale likely owned by entities that are neither domestic corpora-tions nor individuals, i.e. foreigners, trusts and the government.
18

was nearly 95%•33 This is substantially higher than the maximum rate of20.2% on the interest from partially tax exempt bonds.
Throughout WWII, corporate and personal taxes remained very high.When the war ended, tax rates were revised. Individual taxes fell slightlyin 1946, reflecting a change in the level of the normal tax from 6% to 3%.Corporate taxes, on the other hand, fell substantially when the excess profitstax was eliminated. As a result, the maximum corporate profits tax onincome in excess of $50,000 went down to 38%.
It is clear that, with the changes in tax law and the introduction of fullytaxable U.S. Government securities, any comparison of yields must take taxstatus into account. Unlike the earlier period, securities that appeared tobe different, now were. It is impossible, however, to determine what theeffective after tax yields were given that the law changed frequently andthat the data on the composition of ownership is not sufficiently detailed.
The conclusion is that data exist for estimation of a nontaxable termstructure from 1929 to 1940 and a taxable term structure from 1941 to1949. Unfortunately, any attempt to derive a consistent term structure,either taxable or tax exempt, for the entire period would require ad hoc
adjustments to one period or the other.
5 Estimating the Term StructureTo estimate the term structure, it is necessary to fit a curve through the
scatter of points similar to Figure 2 for each month of the sample. Thereis a large literature on estimating the term structure of interest rates.34What is needed here is a technique that provides a sufficiently broad set ofalternative shapes, but is parsimonious in its parameterization. Consideringthat the early months have fewer than 15 data points apiece, it is importantto use a method that requires estimation of the fewest parameters possible.
Nelson and Seigel (1985) derive a four parameter model that allows forhumped, monotonic and S-shaped yield curves. Their specification, derived
1941 to the end of 1945 both corporate and individual taxes were confiscatory.The highest surtax rate for individual rose from 75% in 1940 to 91% in 1945, while thehighest marginal tax rate for corporations exceeded 95%.
34Durand (1942, 1958) and Dura.nd and Winn (1947) pioneered the field by drawingfreehand curves through scatter diagrams. McCulloch (1971) and Shea (1985) provide ex-aminations of analytical curve fitting techniques which use cubic splines and exponentials.Brown and Dybvig (1986) estimate yield curves using the model derived by Cox, Ingersolland Ross (1985).
19

as the solution to a differential equation relating the forward rate to thetime to maturity, is
m[1—e]R(m)=a+b +ce , (4)
where R(m) is the yield to maturity m, and a, b, c and r are parameters.While Nelson and Seigel apply (4) to data on pure discount securities, hereit is used as an approximation for securities regardless of whether they arecoupon bearing or not.
It would be preferable to use a technique that accounts for the factthat securities with different coupon rates and the same maturity date areexpected to have different yields. But methods such as those in McCulloch(1971) or Brown and Dybvig (1986), require large amounts of data. Theerrors that are introduced by ignoring the differences in coupon rates areclearly small relative to the corrections made for the exchange privilege.35
Equation (4) was modified to take into account the tax differences de-scribed in Section 4. For the 1941 to 1949 period a multiplicative constantwas estimated to allow yields on securities with different tax status to differsystematically. The following specification was used:
R(m) = (1 + aD + atDt)f(m, 9) , (5)
where1 if the security is partially tax exempt and 0 otherwise,
= 1 if the security is fully taxable and 0 otherwise,
f(m, 9) is the Nelson and Seigel function in (4), and the a's are parametersthat measure the difference between either partially tax exempt or fullytaxable securities and nontaxable ones.36
For each month from January 1929 to December 1949, estimation ofequation (5) proceeded as follows. First, because of the inaccuracies in the
35A comparison of Figures 1 and 2 shows that coupon rate differences cause errors onthe order of 0.1 percentage points, while adjustment for the exchange privilege increasesmeasured yields by amounts in excess of a full percentage point.
36An important problem in more recent yield curve estimation does not arise here.McCulloch (1975) discusses how, for fully taxable securities selling below par, the differ-ential tax treatment of the principle appreciation and the coupon payment can producemisleading results. But for the period under study, bonds sold almost exclusively abovepar.
20

procedure for valuing the exchange privilege, all coupon securities with lessthan six months to maturity were omitted.37
From 1934 to 1945, the Treasury Bill rate was usually below 0.25%. Assuch, the yield curves came very close to zero at short maturities. If leftunconstrained, estimates of the yields at three months to maturity wereoccasionally negative. The solution is to force the estimates to go exactlythrough the Treasury Bill rate at a maturity of three months. The constraintis imposed by restricting the value of the constant term a in equation (4).
Finally, as suggested by Nelson and Seigel, estimation was conditionalon the parameter i-. Plots of the data show that the yield curve becomesflat at longer maturities, suggesting that r should not be in a range above200, and so a search was done over a grid from 10 to 250 in increments of 10.The final estimate minimized the sum of squared residuals over this range.38
The results are yield curve estimates for each month. For February 1935,the fitted values are plotted as the solid line in Figure 2. As can be seenfrom the figure, the line fits fairly well for maturities contained in the dataset. In fact, the fitted values account for 90% of the variation in the datain over 200 of the 252 months. Extrapolation to maturities longer thanexisting securities can be misleading, however. The fitted values turn downat longer maturities, while the scatter plot shows no signs of a downwardslope. This implies that the estimates are likely to be unreliable at maturitiespast twenty years, and have only limited accuracy past fifteen years.
The appendix reports estimates of nominal interest rates at maturitiesfrom three months to twenty years, monthly from January 1929 to December1949. The data are for the last trading day of each month. The full dataset is available from the author on standard diskettes.
3TBoth because of their call provisions and their tax status, the 3.% Treasury Notesof March, September and December of 1930-32 were also omitted. These notes were fullytaxable and tended to fall on the yield curve when the maturity date was assumed tobe the final redemption date. Since they were actually called during 1930 and 1931, itwas unclear how to differentiate between the value of the call provision and the value ofthe coupon payments. In addition, after December 1930, all Liberty Bonds were omitted.These were issues used to finance the World War I that contained provisions that allowed.them to be called beginning in 1932. They are the only bonds in the sample that werenot called on the first date allowed.
381t was not possible to estimate r by simple nonlinear least squares. For a numberof months, the estimate of r grew too large. As r grows, e goes to zero and c in (4)cannot be estimated.
21

6 Concluding RemarksThe mystery of negative nominal interest rates has ben solved. The
legal and economic environment of the 1930s restricted the method in whichthe Treasury issued and refunded coupon bearing securities. The Treasurywas required by law to issue new bonds at par, and to insure that an offeringsold, coupon rates were set so that initial market prices exceeded par. Inthis way individuals and brokers were paid an underwriting fee to place thenew securities. Since holders of maturing securities were given preferencein the distribution of a new issue, the quoted prices reflected the value ofan exchange privilege — the option to hold the bond or note to maturityand roll it over into a new security. The increase in the price was largeenough that the yield, computed in the standard way, appeared negative.Adjustment for this distortion in the price allows recomputationof the yield
to the coupon bearing component of the composite bond/option.Taking account of the value of the exchange privilege is obviously im-
portant. Any comparison of nominal interest rates with and without theadjustment shows systematic differences. Figure 3, for example, plots theFederal Reserve Board's series entitled '3- to 5-year tax exempt Treasurynotes', from Banking and Monetary Statistic8 Table 122 against the new es-timates for tax exempt yields on U.S. Government securities with four yearsto maturity. Figure 4 compares the new ten year to maturity estimates withthe FRB series for 'U.S. Government' bonds.
Both plots show striking differences. As one would expect, the FRBmedium term series is systematically too low, since it fails to account forthe value of the exchange privilege. The new four year estimates are onaverage 0.27 percentage points, or 30%, higher. This represents a revisionin the level of not only the nominal interest rate for this period, but anincrease in the estimate of the real interest rate as well.
Differences are also apparent in comparing the old and new series forlonger term yields. This time the FRB series is higher than the new tenyear series from 1935 through 1940. Over the entire period, the averagelevel of the FRB series is 0.16 percentage points higher than the ten yearseries. In addition, the old series is too stable, with a standard deviation0.22 percentage points below the new ten year estimates. Examination ofnew series at longer maturities shows that the FRB bond data is close tothe new estimates at fifteen years to maturity.
The usefulness of these new data is without question. Much of the argu-ment over the casues of the length and depth of the Great Depression turns
22

FIG
UR
E 3
5.
Com
paris
on o
f F
RB
4 Y
ear
EsU
mat
es,
3—5'
s an
d N
ew
1933
to 1
940
1933
19
34-
1935
19
36
19.3
7 19
36
19.39
194-
0 19
4-1
Das
h: N
ew 4
yea
r es
tmat
es,
tax—
exem
pt
Sol
id:
3—5
year
tax—
exem
pt
I' I
3 2
I'
1
I,'
0
\/ I
p /
/ ,
I —
\ \_

L 0
5-
1
FIG
UR
E 4
Com
paris
on o
f F
RB
Gov
ernm
ent B
ond
and
New
10
Yea
r E
stim
ates
, 19
29 t
o 19
40
o 1 9Z9 ig,30 19,31
19.32
19.3
,3
19.3
4.
1g.3
l9
.3 1
.37
19.3
8 19
,39
19-4
-0
194-
1
Das
h: N
ew 1
0 ye
ar e
stim
ates
, ta
x—ex
empt
S
olid
: F
RB
U.S
. G
over
nmen
t B
onds
'I 'I
I \,
''I
I' I'
3 2-
I' .
I I
' I' / I
''- a,

on attempts to interpret movements in interest rates. The new data willallow detailed study of a type that could not have previously been under-taken. In particular, they can be used to examine movements in the slopeof the term structure and shifts in the spread between corporate and U.S.Government bond yields in the crucial period from 1929 to 1933. Hopefully,this will allow investigators to differentiate among the various theories forthe causes of the most severe economic downturn of the twentieth century.
25

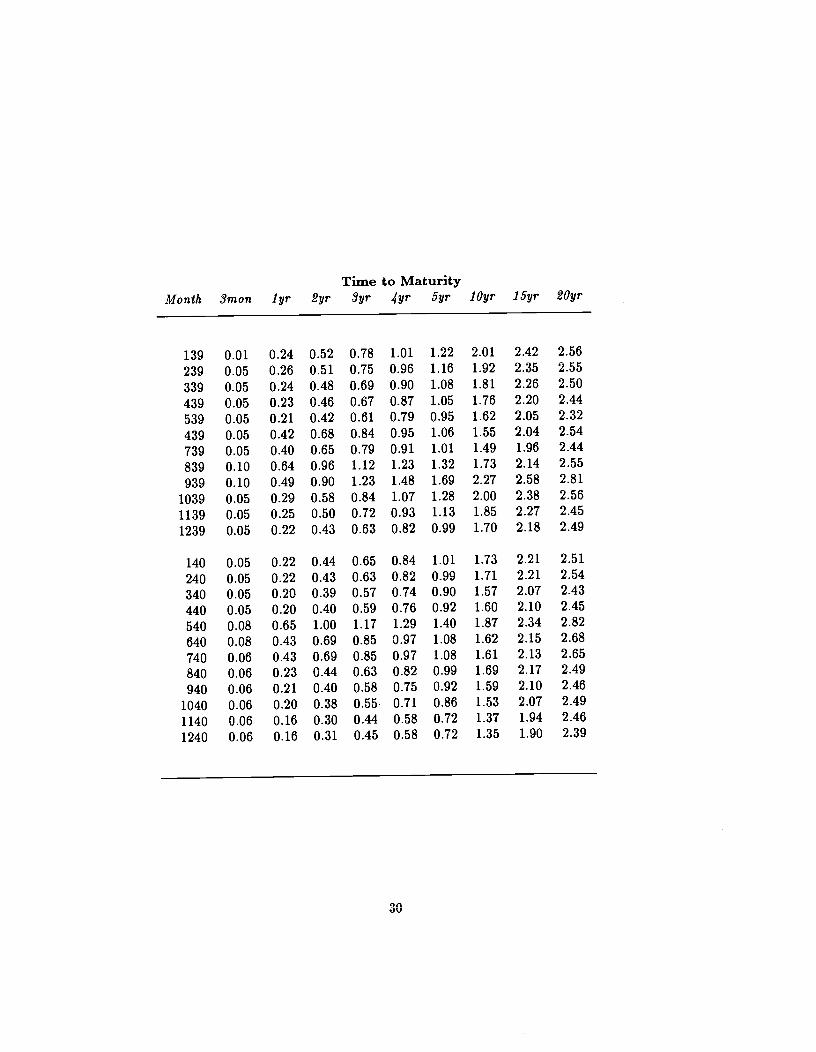
AppendixThe following table contains the constant maturity nominal term structure
estimated using the Nelson and Seigel specification described in Section 5. From1929 to 1940, the estimates are for nominal yields on wholly tax exempt secu-rities. From 1941 to 1949 the estimates are for nominal yields on fully taxablesecurities. All data refer to the last trading day of the month.
TABLE A.1Constant Maturity Yield Curve, 1929 to 1949
Time to MaturityMon1h 3mon lyr 2yr Syr 4yr 5yr lOyr l5yr 2Oyr
Nonazable
129 4.72 4.55 4.37 4.22 4.09 3.99 3.69 3.57 3.51
229 4.75 4.62 4.46 4.32 4.20 4.10 3.77 3.66 3.70
329 5.03 4.89 4.73 4.58 4.45 4.33 3.92 3.76 3.79
429 5.09 4.86 4.59 4.38 4.21 4.07 3.69 3.59 3.58
529 5.19 5.04 4.86 4.70 4.55 4.42 3.95 3.73 3.71
629 4.86 4.76 4.64 4.53 4.42 4.33 3.94 3.69 3.54729 4.94 4.83 4.69 4.56 4.44 4.33 3.87 3.55 3.35829 4.69 4.61 4.51 4.42 4.33 4.25 3.93 3.72 3.60
929 4.89 4.80 4.69 4.58 4.48 4.39 4.00 3.71 3.50
1029 4.00 4.37 4.47 4.44 4.36 4.28 3.84 3.40 2.96
1129 3.01 3.59 3.83 3.87 3.84 3.80 3.57 3.34 3.10
1229 2.82 3.43 3.69 3.75 3.74 3.72 3.57 3.41 3.26
26

Time to MaturityMonth 3mon lyr 2yr Syr yr 5yr lOyr l5yr 2Oyr
130 3.84 3.90 3.90 3.87 3.84 3.81 3.64 3.47 3.31230 3.04 3.52 3.71 3.75 3.74 3.71 3.55 3.39 3.23330 2.71 3.22 3.45 3.51 3.51 3.50 3.41 3.33 3.24430 2,96 3.35 3.53 3.57 3.57 3.56 3.48 3.40 3.31530 2.07 2.94 3.34 3.45 3.46 3.46 3.36 3.27 3.17630 1.78 2.43 2.93 3.19 3.32 3.38 3.35 3.23 3.11730 1.54 2.53 3.01 3.16 3.20 3.22 3.24 3.25 3.26830 2.09 2.49 2.85 3.07 3.21 3.30 3.35 3.25 3.12930 1.42 2.36 2.83 2.98 3.03 3.06 3.14 3.21 3.28
1030 1.76 2.28 2.70 2.93 3.05 3.12 3.19 3.19 3.191130 1.53 1.97 2.39 2.67 2.85 2.98 3.22 3.27 3.301230 1.25 1.93 2.48 2.79 2.96 3.05 3.20 3.24 3.28
131 1.10 1.59 2.06 2.39 2.63 2.79 3.18 3.36 3.50231 1.50 1.72 2.00 2.24 2.45 2.64 3.24 3.38 3.19331 1.33 2.01 2.55 2.85 3.01 3.11 3.24 3.28 3.31431 1.20 1.87 2.40 2.71 2.88 2.98 3.16 3.23 3.30531 0.65 1.17 1.70 2.09 2.38 2.60 3.06 3.16 3.17631 0.60 1.05 1.53 1.92 2.23 2.47 3.07 3.15 3.06731 0.35 0.78 1.28 1.70 2.04 2.32 3.07 3.18 2.98831 0.40 1.31 2.04 2.45 2.69 2.83 3.08 3.19 3.29931 1.37 1.67 2.02 2.32 2.57 2.79 3.40 3.45 3.16
1031 2.50 2.68 2.90 3.09 3.25 3.40 3.81 3.83 3.561131 2.40 2.58 2.79 2.98 3.14 3.28 3.72 3.78 3.571231 2.75 3.80 4.28 4.41 4.43 4.41 4.28 4.15 4.01
132 2.30 3.91 4.64 4.83 4.85 4.82 4.60 4.37 4.14232 2.37 3.65 4.23 4.38 4.39 4.36 4.16 3.95 3.73332 1.75 3.35 4.08 4.28 4.31 4.29 4.13 3.95 3.77432 0.55 1.76 2.70 3.20 3.47 3.60 3.67 3.57 3.46532 0.25 1.34 2.35 3.01 3.44 3.71 4.06 3.95 3.78632 0.25 1.30 2.27 2.90 3.30 3.55 3.84 3.69 3.49732 0.25 1.42 2.35 2.85 3.13 3.29 3.46 3.47 3.46832 0.20 1.39 2.33 2.85 3.13 3.28 3.44 3.43 3.42932 0.10 1.03 1.90 2.47 2.85 3.09 3.43 3.38 3.28
1032 0.10 0.89 1.69 2.27 2.68 2.97 3.49 3.45 3.291132 0.05 0.86 1.68 2.26 2.68 2.97 3.48 3.41 3.221232 0.05 0.80 1.55 2.10 2.49 2.77 3.29 3.28 3.15
27

Time to MaturityMonth Smon lyr 2yr 3yr .yr 5yr lOyr l5yr lOyr
133 0.05 0.73 1.43 1.97 2.37 2.67 3.26 3.20 2.96233 0.63 1.74 2.62 3.09 3.34 3.47 3.56 3.49 3.42333 1.00 1.91 2.62 3.01 3.22 3.33 3.42 3.39 3.34433 0.35 1.28 2.14 2.70 3.06 3.28 3.54 3.40 3.22533 0.20 1.06 1.85 2.38 2.72 2.95 3.28 3.25 3.17633 0.15 0.91 1.67 2.21 2.59 2.86 3.29 3.18 2.95733 0.25 1.09 1.87 2.38 2.72 2.94 3.26 3.22 3.14833 0,12 0.86 1.60 2.14 2.52 2.78 3.25 3.19. 3.01933 0.05 0.83 1.61 2.17 2.57 2.85 3.31 3.22 3.01
1033 0.15 1.04 1.87 2.42 2.77 3.00 3.31 3.25 3.131133 0.35 1.61 2.60 3.12 3.39 3.53 3.57 3.43 3.29
1233 0.50 2.26 3.11 3.37 3.45 3.48 3.52 3.55 3.58
134 0.60 2.14 2.89 3.13 3.22 3.26 3.35 3.44 3.53
234 0.15 1.34 2.28 2.79 3.07 3.21 3.34 3.29 3.24334 0.15 0.90 1.65 2.18 2.56 2.82 3.24 3.13 2.91434 0.15 0.80 1.47 1.95 2.30 2.56 3.08 3.12 3.07534 0.15 0.67 1.24 1.69 2.06 2.34 3.00 2.99 2.72
634 0.15 0.60 1.12 1.54 1.90 2.18 2.91 2.95 2.67
734 0.15 0.60 1.12 1.55 1.91 2.20 2.94 2.94 2.58
834 0.20 0.76 1.36 1.83 2.19 2.47 3.07 3.04 2.78934 0.25 1.08 1.85 2.37 2.70 2.92 3.25 3.23 3.16
1034 0.25 0.90 1.55 2.03 2.37 2.61 3.07 3.06 2.951134 0.25 0.90 1.55 2.02 2.36 2.60 3.05 3.04 2.921234 0.20 0.71 1.26 1.71 2.07 2.35 2.98 2.96 2.68
135 0.20 0.63 1.12 1.53 1.87 2.15 2.84 2.83 2.48
235 0.15 0.51 0.94 1.32 1.64 1.93 2.73 2.76 2.24
335 0.15 0.48 0.87 1.22 1.53 1.80 2.65 2.87 2.67
435 0.15 0.47 0.85 1.19 1.50 1.77 2.64 2.88 2.66
535 0.15 0.49 0.89 1.23 1.53 1.79 2.55 2.74 2.59
635 0.15 0.45 0.81 1.13 1.42 1.67 2.51 2.78 2.62735 0.15 0.44 0.79 1.11 1.39 1.65 2.50 2.80 2.69835 0.20 0.55 0.96 1.32 1.64 1.91 2.73 2.84 2.48935 0.20 0.61 1.08 1.47 1.79 2.06 2.77 2.92 2.81
1035 0.20 0.56 0.98 1.34 1.65 1.91 2.70 2.90 2.771135 0.15 0.52 0.96 1.33 1.64 1.91 2.71 2.90 2.791235 0.15 0.48 0.87 1.22 1.52 1.79 2.65 2.89 2.74
28

Time to MaturityMonth 3mon lyr 2yr Syr $yr 5yr lOyr l5yr 2Cyr
136 0.20 0.52 0.90 1.23 1.53 1.79 2.63 2.88 2.72236 0.20 0.49 0.83 1.15 1.43 1.67 2.51 2.81 2.71336 0.20 0.48 0.82 1.13 1.40 1.64 2.46 2.74 2.65436 0.20 0.48 0.82 1.12 1.39 1.63 2.45 2.73 2.62536 0.20 0.49 0.83 1.13 1.40 1.64 2.40 2.67 2.63636 0.15 0.48 0.86 1.19 1.46 1.70 2.40 2.67 2.73736 0.15 0.49 0.88 1.20 1.48 1.70 2.38 2.64 2.73836 0.20 0.50 0.84 1.14 1.40 1.62 2.31 2.58 2.66936 0.18 0.51 0.89 1.20 1.46 1.68 2.31 2.58 2.71
1036 0.10 0.50 0.93 1.26 1.52 1.72 2.28 2.56 2.761136 0.11 0.44 0.80 1.08 1.31 1.50 2.08 2.41 2.691236 0.20 0.66 1.06 1.33 1.51 1.64 2.06 2.40 2.74
137 0.22 0.73 1.17 1.45 1.63 1.76 2.14 2.43 2.72237 0.25 0.78 1.23 1.51 1.69 1.81 2.16 2.42 2.67337 0.60 1.16 1.64 1.93 2.11 2.24 2.56 2.80 3.03437 0.60 1.07 1.52 1.84 2.06 2.23 2.62 2.80 2.96537 0.45 1.20 1.63 1.81 1.92 2.01 2.39 2.77 3.15637 0.39 1.26 1.73 1.92 2.03 2.11 2.46 2.80 3.14737 0.32 1.14 1.60 1.79 1.89 1.98 2.34 2.69 3.05837 0.42 1.33 1.82 2.01 2.11 2.18 2.49 2.79 3.08937 0.25 1.15 1.64 1.85 1.96 2.05 2.43 2.80 3.17
1037 0.23 1.11 1.59 1.80 1.92 2.01 2.40 2.80 3.191137 0.12 1.03 1.53 1.74 1.86 1.95 2.34 2.73 3.121237 0.12 0.92 1.37 1.58 1.71 1.81 2.27 2.72 3.17
138 0.14 0.90 1.34 1.54 1.66 1.76 2.22 2.67 3.12238 0.12 0.82 1.23 1.43 1.57 1.67 2.17 2.67 3.16338 0.12 0.88 1.32 1.53 1.66 1.77 2.26 2.75 3.24438 0.08 0.67 1.05 1.24 1.38 1.50 2.05 2.59 3.14538 0.08 0.37 0.71 0.99 1.24 1.45 2.13 2.50 2.75638 0.08 0.31 0.60 0.87 1.11 1.33 2.12 2.52 2.63738 0.08 0.35 0.67 0.95 1.18 1.39 2.08 2.45 2.68838 0.08 0.61 0.96 1.14 1.28 1.39 1.94 2.49 3.03938 0.12 0,41 0.74 1.02 1.26 1.46 2.13 2.48 2.71
1038 0.05 0.32 0.63 0.91 1.14 1.35 2.06 2.43 2.641138 0.05 0.32 0.64 0.92 1.16 1.38 2.11 2.48 2.681238 0.05 0.28 0.56 0.81 1.04 1.26 2.04 2.45 2.59
29
Time to MaturityMonth Smon lyr 2yr 3yr .ç(yr 5yr lOyr l5yr Oyr
139 0.01 0.24 0.52 0.78 1.01 1.22 2.01 2.42 2.56
239 0.05 0.26 0.51 0.75 0.96 1.16 1.92 2.35 2.55
339 0.05 0.24 0.48 0.69 0.90 1.08 1.81 2.26 2.50
439 0.05 0.23 0.46 0.67 0.87 1.05 1.76 2.20 2.44
539 0.05 0.21 0.42 0.61 0.79 0.95 1.62 2.05 2.32
439 0.05 0.42 0.68 0.84 0.95 1.06 1.55 2.04 2.54
739 0.05 0.40 0.65 0.79 0.91 1.01 1.49 1.96 2.44
839 0.10 0.64 0.96 1.12 1.23 1.32 1.73 2.14 2.55
939 0.10 0.49 0.90 1.23 1.48 1.69 2.27 2.58 2.81
1039 0.05 0.29 0.58 0.84 1.07 1.28 2.00 2.38 2.56
1139 0.05 0.25 0.50 0.72 0.93 1.13 1.85 2.27 2.45
1239 0.05 0.22 0.43 0.63 0.82 0.99 1.70 2.18 2.49
140 0.05 0.22 0.44 0.65 0.84 1.01 1.73 2.21 2.51
240 0.05 0.22 0.43 0.63 0.82 0.99 1.71 2.21 2.54
340 0.05 0.20 0.39 0.57 0.74 0.90 1.57 2.07 2.43
440 0.05 0.20 0.40 0.59 0.76 0.92 1.60 2.10 2.45
540 0.08 0.65 1.00 1.17 1.29 1.40 1.87 2.34 2.82
640 0.08 0.43 0.69 0.85 0.97 1.08 1.62 2.15 2.68
740 0.06 0.43 0.69 0.85 0.97 1.08 1.61 2.13 2.65
840 0.06 0.23 0.44 0.63 0.82 0.99 1.69 2.17 2.49
940 0.06 0.21 0.40 0.58 0.75 0.92 1.59 2.10 2.46
1040 0.06 0.20 0.38 0.55. 0.71 0.86 1.53 2.07 2.49
1140 0.06 0.16 0.30 0.44 0.58 0.72 1.37 1.94 2.46
1240 0.06 0.16 0.31 0.45 0.58 0.72 1.35 1.90 2.39
30

Time to MaturityMonth Smon lyr 2yr Syr 4yr 5yr 1Ojr l5yr 2Oyr
Taxable
141 0.09 0.26 0.48 0.69 0.88 1.06 1.82 2.36 2.73241 0.08 0.24 0.44 0.62 0.79 0.95 1.56 1.93 2.13341 0.15 0.34 0.57 0.78 0.98 1.17 1.89 2.35 2.60441 0.13 0.31 0.53 0.74 0.94 1.12 1.86 2.38 2.71541 0.13 0.31 0.54 0.75 0.94 1.13 1.87 2.38 2.70641 0.13 0.29 0.50 0.69 0.88 1.05 1.76 2.26 2.60741 0.13 0.28 0.47 0.65 0.82 0.99 1.67 2.17 2.54841 0.13 0.29 0.49 0.69 0.86 1.03 1.72 2.21 2.54941 0.13 0.30 0.51 0.71 0.90 1.07 1.75 2.19 2.46
1041 0.13 0.32 0.56 0.77 0.96 1.13 1.74 2.07 2.251141 0.35 0.50 0.69 0.86 1.02 1.16 1.73 2.08 2.271241 0.35 0.57 0.82 1.03 1.22 1.37 1.89 2.17 2.36
142 0.25 0.48 0.76 1.00 1.21 1.39 1.99 2.28 2.40242 0.30 0.53 0.80 1.04 1.25 1.44 2.06 2.35 2.45342 0.30 0.51 0.76 0.99 1.19 1.37 2.00 2.32 2.43442 0.35 0.57 0.83 1.07 1.27 1.45 2.06 2.35 2.46542 0.38 0.61 0.88 1.11 1.31 1.48 2.03 2.28 2.40642 0.34 0.60 0.90 1.14 1.34 1.52 2.04 2.27 2.40742 0.35 0.62 0.93 1.19 1.40 1.58 2.10 2.33 2.44842 0.35 0.63 0.94 1.20 1.41 1.59 2.12 2.34 2.44942 0.35 0.65 0.98 1.24 1.46 1.63 2.12 2.34 2.46
1042 0.35 0.63 0.94 1.20 1.42 1.60 2.13 2.35 2.461142 0.35 0.64 0.96 1.23 1.45 1.63 2.16 2.38 2.491242 0.32 0.63 0.97 1.24 1.46 1.63 2.14 2.35 2.47
143 0.32 0.59 0.89 1.15 1.37 1.55 2.12 2.36 2.46243 0.32 0.59 0.90 1.16 1.38 1.57 2.13 2.37 2.47343 0.35 0.64 0.97 1.23 1.44 1.62 2.11 2.34 2.47443 0.35 0.65 0.98 1.24 1.45 1.63 2.12 2.33 2.45543 0.35 0.63 0.94 1.19 1.40 1.57 2.06 2.28 2.43643 0.35 0.61 0.90 1.15 1.36 1.53 2.06 2.30 2.44743 0.35 0.61 0.91 1.16 1.37 1.55 2.08 2.32 2.45843 0.35 0.63 0.95 1.21 1.41 1.58 2.08 2.31 2.46943 0.35 0.66 0.98 1.24 1.44 1.60 2.05 2.28 2.45
1043 0.35 0.66 1.00 1.26 1.46 1.62 2.07 2.30 2.471143 0.35 0.63 0.95 1.22 1.44 1.62 2.16 2.38 2.491243 0.35 0.65 0.97 1.23 1.45 1.62 2.12 2.35 2.48
31

Time to MaturityMonth .9mon lyr 2yr Syr .4yr 5yr lOyr 15yr Oyr
144 0.32 0.65 0.99 1.26 1.47 1.64 2.10 2.32 2.49244 0.32 0.64 0.99 1.25 1.46 1.63 2.09 2.32 2.48344 0.35 0.64 0.97 1.23 1.44 1.61 2.12 2.35 2.49444 0.35 0.62 0.93 1.19 1.40 1.59 2.15 2.40 2.50544 0.35 0.62 0.93 1.20 1.42 1.60 2.17 2.40 2.50644 0.35 0.65 0.98 1.24 1.46 1.63 2.14 2.36 2.50744 0.35 0.63 0.95 1.21 1.43 1.61 2.15 2.38 2.50844 0.35 0.61 0.91 1.17 1.39 1.57 2.16 2.40 2.49944 0.35 0.62 0.93 1.19 1.41 1.60 2.16 2.39 2.49
1044 0.35 0.65 0.98 1.24 1.46 1.63 2.14 2.36 2.501144 0.35 0.67 1.02 1.28 1.49 1.65 2.11 2.33 2.501244 0.35 0.67 1.02 1.28 1.49 1.65 2.11 2.32 2.48
145 0.35 0.60 0.90 1.14 1.35 1.53 2.07 2.31 2.42245 0.35 0.61 0.90 1.13 1,33 1.49 1.98 2.23 2.40345 0.35 0.61 0.89 1.13 1.32 1.48 1.98 2.24 2.41445 0.35 0.61 0.89 1.10 1.26 1.40 1.83 2.13 2.41545 0.35 0.81 1.09 1.22 1.32 1.39 1.75 2.10 2.45645 0.35 0.78 1.05 1.18 1.27 1.35 1.70 2.05 2.41745 0.35 0.81 1.08 1.22 1.31 1.38 1.73 2.07 2.41845 0.35 0.82 1.10 1.24 1.33 1.40 1.74 2.08 2.41945 0.35 0.81 1.09 1.22 1.31 1.39 1.73 2.07 2.42
1045 0.35 0.79 1.06 1.19 1.28 1.35 1.70 2.04 2.381145 0.35 0.77 1.02 1.15 1.24 1.32 1.66 2.01 2.361245 0.35 0.74 0.99 1.12 1.20 1.28 1.63 1.98 2.32
146 0.35 0.69 0.91 1.03 1.11 1.19 1.53 1.87 2.22246 0.35 0.65 0.85 0.96 1.05 1.12 1.47 1.82 2.16346 0.35 0.71 0.93 1.04 1.12 1.19 1.50 1.81 2.12446 0.35 0.79 1.05 1.18 1.26 1.32 1.63 1.92 2.22546 0.35 0.80 1.06 1.18 1.27 1.33 1.64 1.94 2.24646 0.35 0.75 1.00 1.12 1.21 1.28 1.60 1.91 2.23746 0.35 0.78 1.04 1.17 1.25 1.32 1.65 1.97 2.30846 0.35 0.81 1,09 1.22 1.30 1.37 1.69 2.01 2.33946 0.35 0.86 1.16 1.29 1.38 1.44 1.75 2.06 2.37
1046 0.35 0.85 1.13 1.27 1.35 1.42 1.72 2.03 2.331146 0.35 0.90 1.21 1.35 1.43 1.50 1.79 2.08 2.371246 0.35 0.86 1.15 1.28 1.36 1.43 1.72 2.02 2.31
32

Time to MaturityMonth Smon lyr 2yr Syr yr 5yr lOyr l5yr 2Oyr
147 0.35 0.84 1.12 1.25 1.33 1.40 1.71 2.01 2.31247 0.35 0.84 1.12 1.25 1.34 1.40 1.70 2.00 2.30347 0.35 0.81 1.09 1.21 1.30 1.37 1.68 1.99 2.30447 0.35 0.86 1.15 1.28 1.37 1.43 1.72 2.01 2.30547 0.35 0.86 1.15 1.28 1.36 1.43 1.72 2.01 2.9647 0.35 0.87 1.17 1.31 1.39 1.46 1.76 2.05 2.35747 0.70 1.00 1.20 1.30 1.38 1.44 1.75 2.05 2.36847 0.73 0.98 1.15 1.25 1.33 1.40 1.71 2.03 2.34947 0.78 1.02 1.18 1.28 1.35 1.42 1.74 2.05 2.37
1047 0.85 1.13 1.31 1.41 1.49 1.55 1.85 2.14 2.441147 0.91 1.12 1.32 1.46 1.57 1.65 1.96 2.22 2.491247 0.92 1.10 1.30 1.48 1.64 1.77 2.20 2.40 2.47
148 0.94 1.11 1.31 1.49 1.64 1.77 2.20 2.40 2.48248 0.96 1.12 1.30 1.47 1.62 1.75 2.19 2.40 2.47348 0.99 1.14 1.31 1.47 1.61 1.73 2.16 2.38 2.48448 0.96 1.12 1.31 1.47 1.61 1.73 2.14 2.36 2.50548 0.96 1.08 1.23 1.37 1.49 1.61 2.05 2.31 2.44648 0.97 1.13 1.32 1.48 1.62 1.74 2.15 2.37 2.50748 0.96 1.14 1.34 1.51 1.66 1.79 2.20 2.39 2.50848 1.04 1.20 1.39 1.55 1.70 1.82 2.22 2.41 2.48948 1.08 1.24 1.43 1.59 1.73 1.85 2.23 2.41 2.49
1048 1.08 1.27 1.47 1.64 1.78 1.89 2.23 2.40 2.511148 1.08 1.24 1.43 1.59 1.72 1.83 2.20 2.39 2.511248 1.10 1.23 1.39 1.53 1.65 1.76 2.16 2.38 2.48
149 1.11 1.22 1.36 1.49 1.60 1.71 2.12 2.35 2.46249 1.11 1.22 1.36 1.49 1.60 1.71 2.11 2.33 2.43349 1.11 1.21 1.34 1.46 1.57 1.67 2.07 2.31 2.45449 1.10 1.20 1.33 1.44 1.55 1.65 2.06 2.32 2.47549 1.10 1.19 1.31 1.43 1.53 1.63 2.03 2.31 2.50649 1.02 1.11 1.22 1.33 1.43 1.53 1.93 2.23 2.45749 0.98 1.07 1.18 1.29 1.39 1.49 1.90 2.20 2.42849 1.01 1.07 1.16 1.25 1.33 1.42 1.81 2.15 2.45949 1.00 1.08 1.18 1.28 1.37 1.46 1.84 2.15 2.39
1049 1.02 1.10 1.20 1.29 1.38 1.47 1.85 2.15 2.381149 1.06 1.13 1.22 1.31 1.40 1.48 1.84 2.14 2.381249 1.05 1.11 1.19 1.27 1.35 1.43 1.79 2.11 2.39
33

References
Bell, Effiot V., 'Treasury Moves to End "Free Rides",' New York Times
December 11, 1938, Part III, pg. 1.Bernanke, Ben S., 'Nonmonetary Effects of the Financial Crisis in the Prop-
agation of the Great Depression,' American Economic Review, 73, June
1983, 257—276.
'Employment, Hours, and Earnings in the Depression: An Analy-sis of Eight Manufacturing Industries,' American Economic Review, 76,March 1986, 82—109.
______ and James Powell, 'The Cyclical Behavior of Industrial Labor Mar-
kets: A Comparison of the Pre—War and Post—War Eras,' inR.J. Gordon,ed. The American Business Cycle: Continuity and Change, Chicago,lii.:
University of Chicago Press for NBER, 1986.
Bloch, Ernest, 'The Treasury's Deposit Balances and the Banking System,'in Essays in Money and Credit, New York: Federal Reserve Bank of New
York, December 1964, 19—24.
Board of Governors of the Federal Reserve. Banking and Monetary Statis-
tics. 1943.
Brown, Stephen and Philip Dybvig, 'The Empirical Implications of the Cox,
Ingersoll and Ross Theory of the Term Structureof Interest Rates,' Jour-
nal of Finance 41, July 1986, 617—632.
Brunner, Karl, ed. The Great Depression Revisited. Boston: Martinus
Nijhoff, 1981.
Cohan, Avery B., 'Cost of Flotation of Long-Term Corporate Debt Since
1935,' School of Business Administration, University of North Carolina
Research Paper 6, April 1961.
Childs, C.F. Concerning U.S. Government Securities, 1635-195. Chicago:The Lakeside Press, 1947.
Cox, John C., Johathan E. Ingersoll and Stephen A. Ross, 'A Theory of theTerm Structure of Interest Rates,' Econometrica 53, March 1985, 385—
408.
Durand, David. 'Basic Yields of Corporate Bonds, 1900—1942', Technical
Paper No. 3. New York: National Bureau of Economic Research, 1942.
34

_______ 'A Quarterly Series of Corporate Basic Yields, 1952—1957, and SomeAttendant Reservations,' Journal of Finance 13, 1958, 348—356.
______ and Wiffis J. Winn. 'Basic Yields of Bonds 1926—1947: Their Mea-surement and Pattern', Technical Paper No. 6, New York: NationalBureau of Economic Research, 1947.
Field, Alexander J.,'Asset Exchanges and the Transaction Demand for Mon-ey, 1919—1929,' American Economic Review 74, March 1984, 43—59.
Friedman, Milton and Anna Schwartz. Monetary Trends in the United Statesand the United Kingdom. Chicago: University of Chicago Press, 1982.
Gordon, Robert J. and John M. Veitch, 'Fixed Investment in the AmericanBusiness Cycle, 1919—1983,' in in R.J. Gordon, ed. The American Busi-ness Cycle: Continuity and Change, Chicago, Ill.: University of ChicagoPress for NBER, 1986.
Hamilton, James D., 'Monetary factors in the Great Depression,' Journal ofMonetary Economics 19, March 1987, 145—169.
Homer, Sidney. A History of Interest Rates. 2nd Edition, 1976.
Mankiw, N. Gregory and Jeffrey Miron, 'The Changing Behavior of theTerm Structure of Interest Rates,' N.B.E.R. Working Paper 1669, July1985.
McCulloch, J. Huston, 'Measuring the Term Structure of Interest Rates,'Journal of Business 44, January 1971, 19—3 1.
'The Tax Adjusted Yield Curve,' Journal of Finance 30, June 1975,811—829.
'Appendix II. U.S. Term Structure Data, 1946—1987,' N.B.E.R.Working Paper 2341, August 1987.
Moore, Geoffrey H. and Victor Zarnowitz, 'The Development and Role of theNational Bureau of Economic Research's Business Cycle Chronologies,' inR.J. Gordon, ed. The American Business Cycle: Continuity and Change,Chicago, Ill.: University of Chicago Press for NBER, 1986.
Nelson, Charles R. and Andrew F. Seigel, 'Parsimonious Modeling of YieldCurves for U.S. Treasury Bifis,' N.B.E.R. Working Paper No, 1594, March1985.
Porter, Sylvia F., 'Gambling in Governments,' Scribner's Magazine 104,December 1938, 43—46.
35

______ How to Make Money in Government Bonds. New York: Harperand Brothers, 1939.
Romer, Christina, 'Spurious Volatility in Historical Unemployment Data,'Journal of Political Economy 94, February 1986, 1—37. (a)
______ 'Is the Stabilization of the Postwar Economy a Figment of the Data'American Economic Review 76, June 1986, 314—334. (b)
______ 'The Prewar Business Cycle Reconsidered: New Estimates of GrossNational Product, 1869—1918,' NBER Working Paper No. 1969, June1986. (c)
,'Gross National Product, 1909—1928: Existing Estimates, New Es-timates, and New Interpretations of World War I and its Aftermath,'NBER Working Paper No. 2187, March 1987.
Salomon Brothers. An Analytical Record of Stock Market Yieldsand Yield
Spreads. 1985.
Shea, Gary, 'Interest Rate Term Structure Estimation with ExponentialSplines: A Note,' Journal of Finance 40, March 1985, 319—325.
Theis, Clifford, 'New Estimates of the Term Structure of Interest Rates,1920-1939,' Journal of Financial Research 8, Winter 1985, 297—306.
U.S. Department of Internal Revenue. Statistics of Income, various issues.
U.S. Department of the Treasury. Annual Report of the Secretary of the
Treasury. various issues.
______ U.S. Treasury Bulletin, various issues.
______ A Compilation of the Principal Laws of the Unisted States Relationgto the Public Debt to Which is Added the Second Liberty Bond Act (AsAmended). Washington, D. C.: U.S. Government Printing Office, 1938.
'Valuing the 'Rights' in Treasury Notes,' Barron's, 19, January 2, 1939,
pg. 1.
Williams, John Burr. The Theory of Investment Value. Cambridge, Mass.:
The Harvard University Press, 1938.
36