navigating the new normal in washington state nmta conference november 9, 2011 steve mullin...
Post on 19-Dec-2015
215 views
TRANSCRIPT

Navigating the New Normal in Washington StateNMTA ConferenceNovember 9, 2011
Steve MullinPresident, Washington Roundtable

What is the national picture?
• Economy stalled• Consumer &
business confidence is weak• Stock market is
volatile
High unemployment
Weak consumer confidence

GDP revisions show economy close to stalling

Consumer confidence is very weak

Sales expectations & small business optimism also low
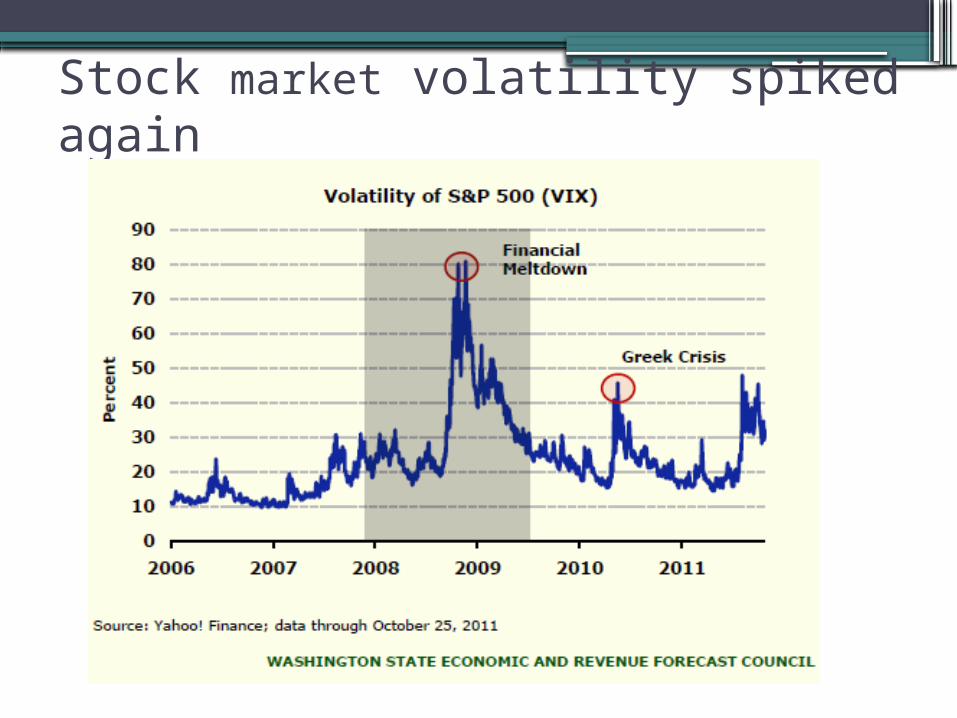
Stock market volatility spiked again

World GDP to remain weak through 2012

US Banks exposure to Europe is concerning

Washington’s economy
The troubling The promising
• Unemployment remains above 9%.
• Worst downturn in non-residential construction in 30 years.
• Single family home prices continue to decline.
• State revenue projections have been repeatedly reduced.
• Roundtable members: 2012 could look a lot like 2011.
• Boeing has over 7 years of commercial orders on its books.
• Software publishing employment is growing.
• Export growth is strong.

Deepest & most persistent employment decline since WWII
0 2 4 6 8 10 12 14 16 18 20 22 24 26 28 30 32 34 36 38 40 42 44 46 48-8%
-7%
-6%
-5%
-4%
-3%
-2%
-1%
0%
1%
Washington Job Losses
19481953195719591960196219691979198120022008
Number of Months After Peak Employment
Perc
en
t Jo
b L
oss
es
Rela
tive
to P
eak E
m-
plo
ymen
t M
on
th
CurrentEmploymentRecession
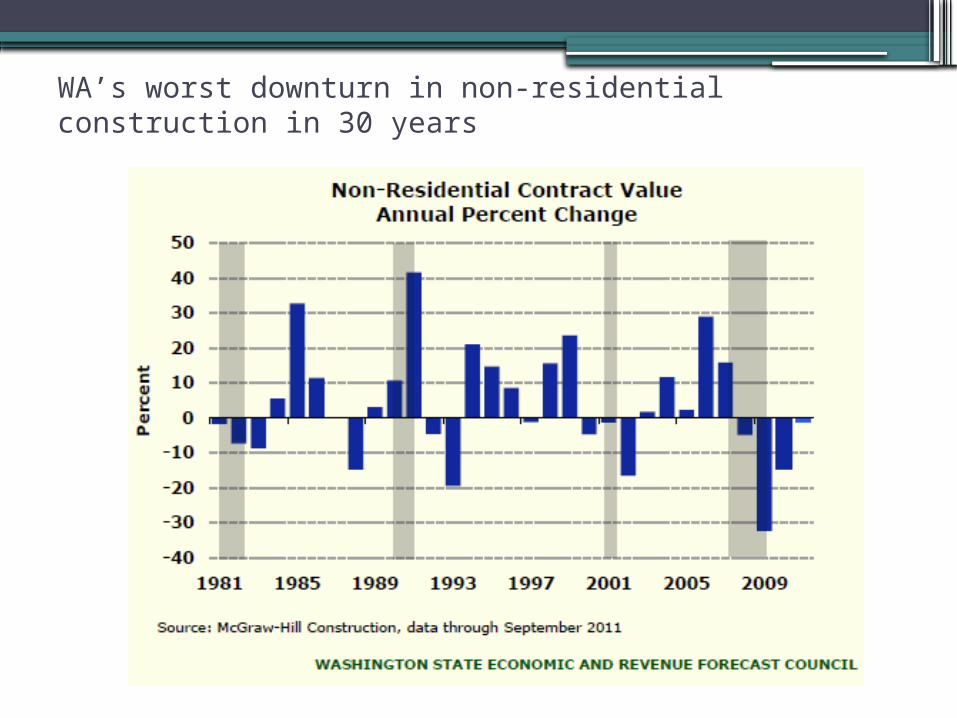
WA’s worst downturn in non-residential construction in 30 years

Single-family home prices continue to decline
Aug. 2011US down 3.9%
Seattle down 6.1%.
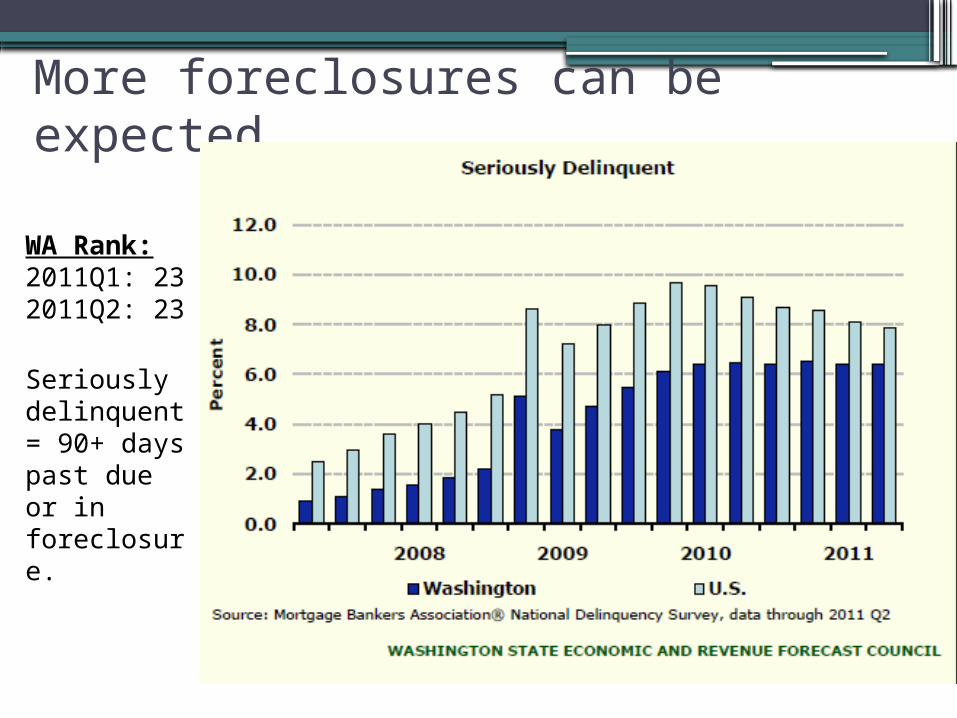
More foreclosures can be expected
WA Rank:2011Q1: 232011Q2: 23
Seriously delinquent = 90+ days past due or in foreclosure.
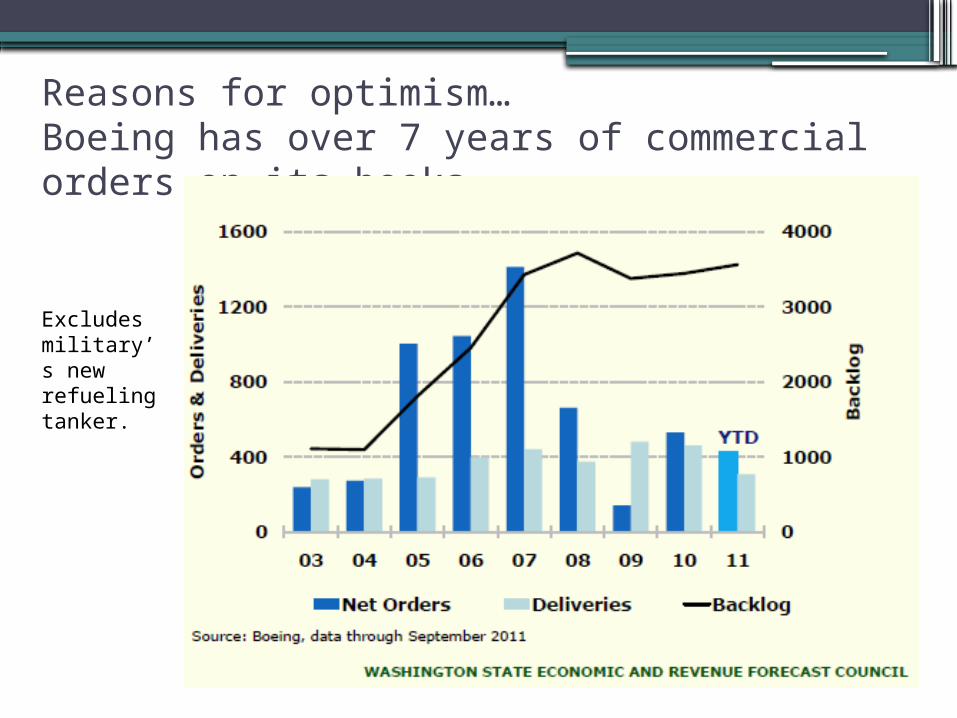
Reasons for optimism…Boeing has over 7 years of commercial orders on its books
Excludes military’s new refueling tanker.

Reasons for optimism…Software publishing employment is growing
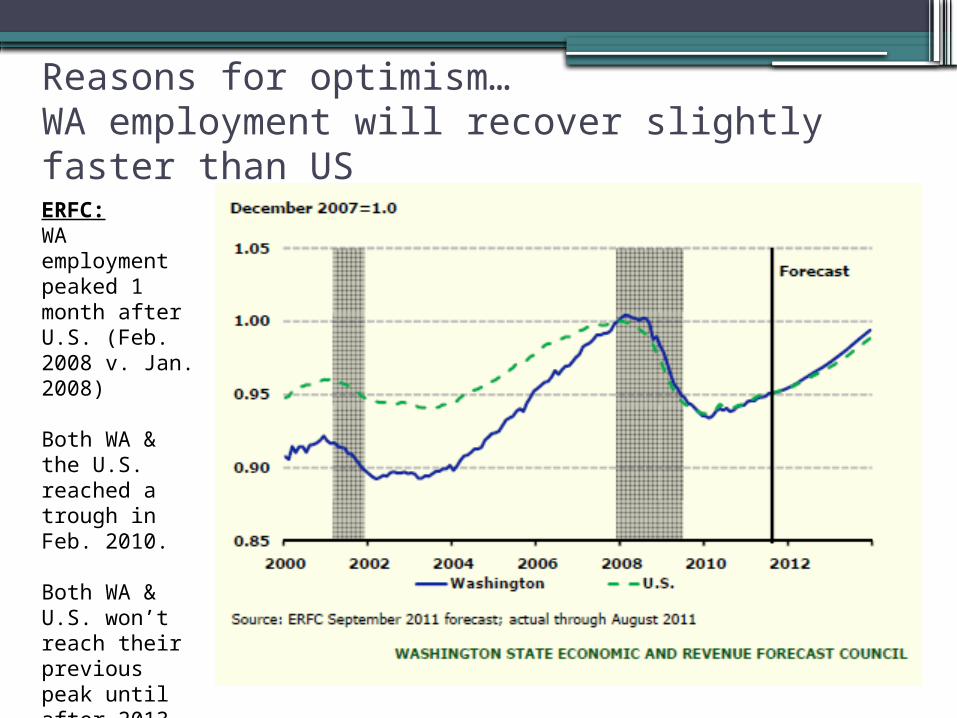
Reasons for optimism…WA employment will recover slightly faster than USERFC:WA employment peaked 1 month after U.S. (Feb. 2008 v. Jan. 2008)
Both WA & the U.S. reached a trough in Feb. 2010.
Both WA & U.S. won’t reach their previous peak until after 2013.
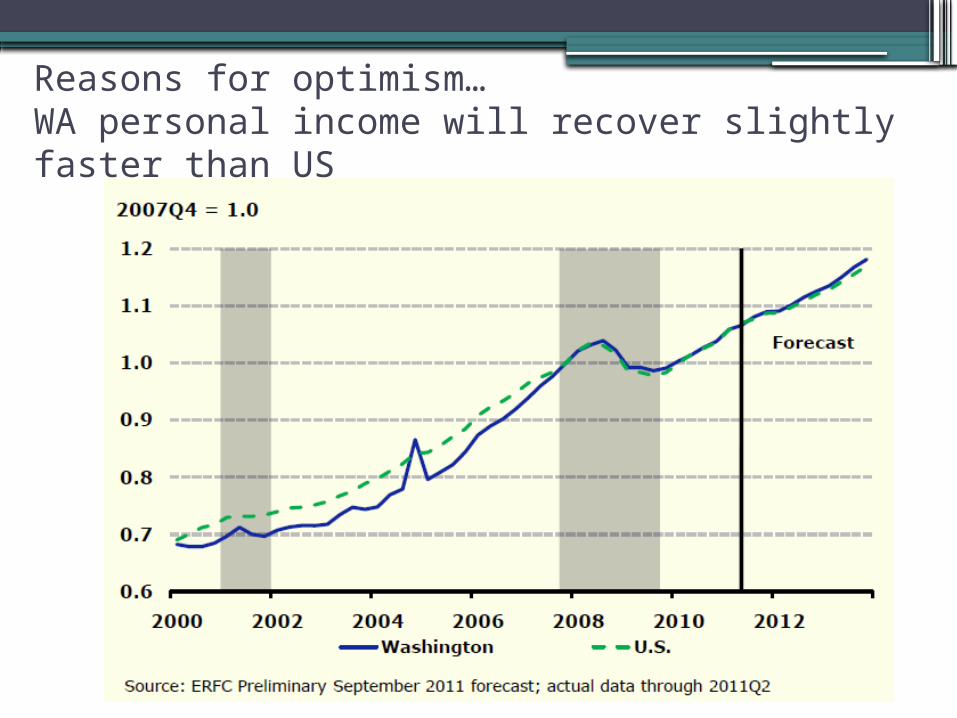
Reasons for optimism…WA personal income will recover slightly faster than US
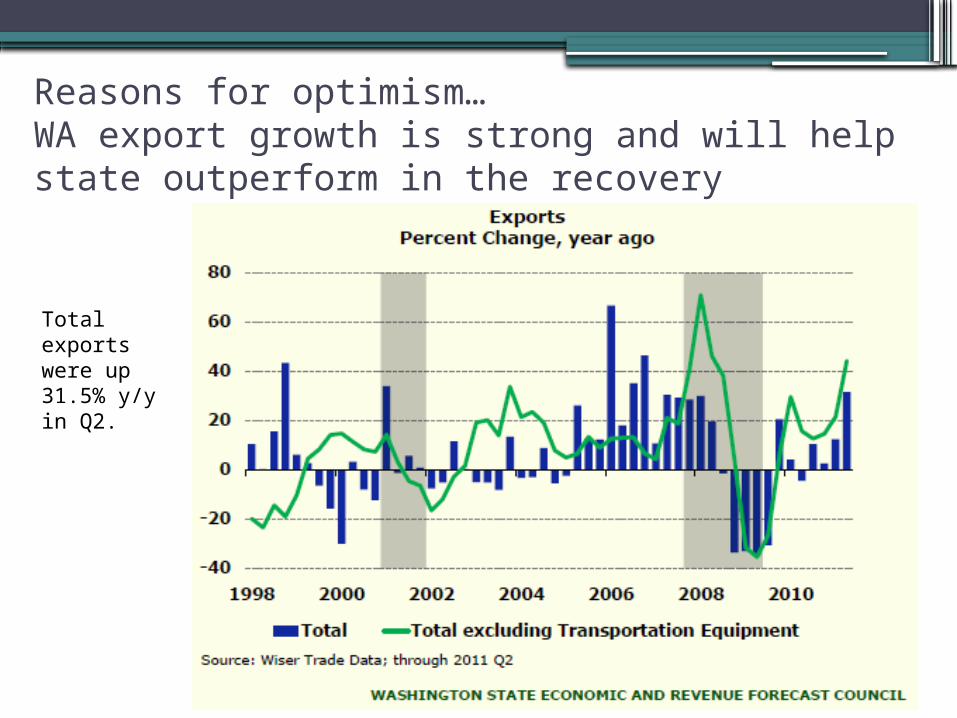
Reasons for optimism…WA export growth is strong and will help state outperform in the recovery
Total exports were up 31.5% y/y in Q2.

Washington:Real per capita general fund state revenue
General Fund & Related Funds for FY 07-09. New definition for GF in FY10-13.
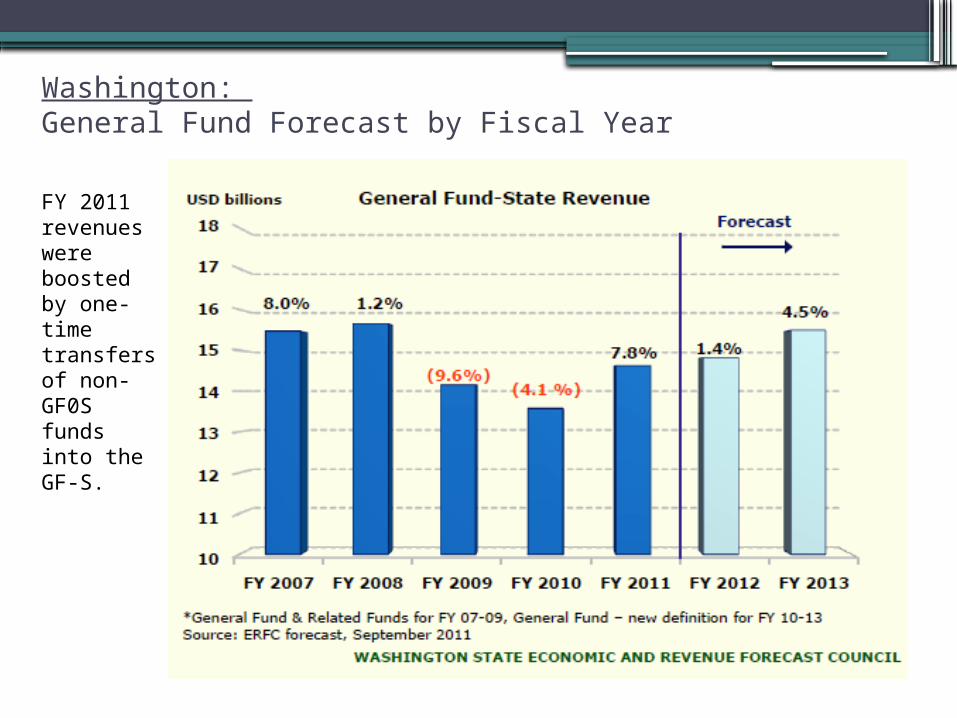
Washington: General Fund Forecast by Fiscal Year
FY 2011 revenues were boosted by one-time transfers of non-GF0S funds into the GF-S.

Washington’s business climate:What Roundtable members are saying
•Outlook: guarded.•Economy:
▫2012 will look a lot like 2011.▫Washington’s recovery is heavily dependent
on national economy, which continues to struggle.
▫Optimism / concern is sector specific – sectors that touch housing in any way are most negative.
▫Bright spots: ramp up in hiring at Boeing; tech.

Perception of state business climate isn’t good, but getting better
Improving; 27%
Getting Worse; 73%
2011: Perception of State Business Climate
Im-prov-ing; 17%
Getting Worse; 83%
2010: Perception of State Business Climate
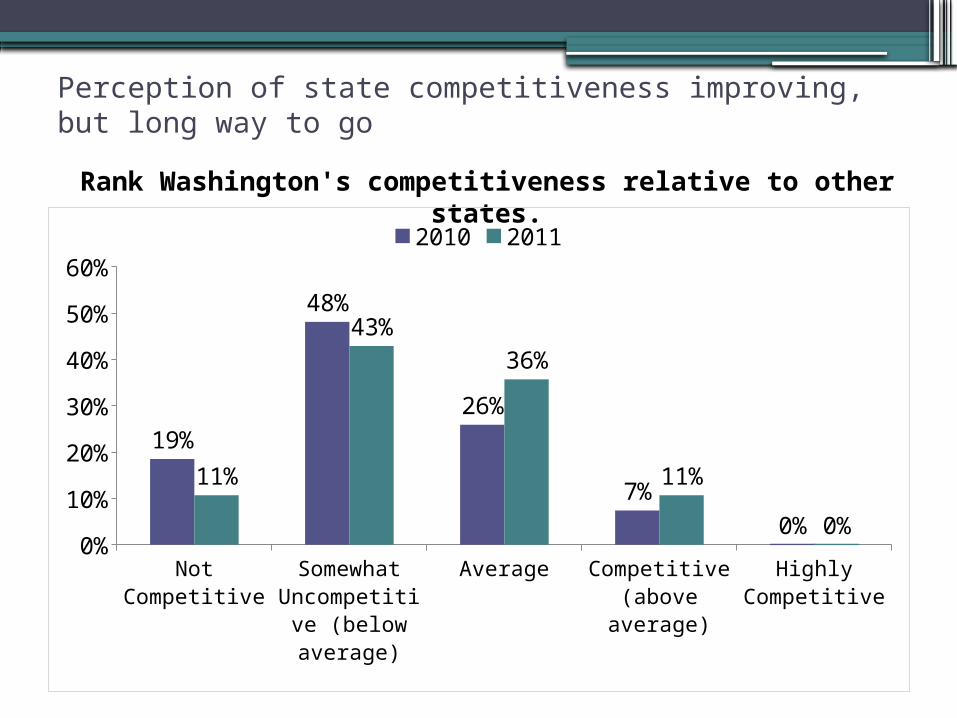
Perception of state competitiveness improving, but long way to go
Rank Washington's competitiveness relative to other states.
Not Compet-itive
Somewhat Uncompet-itive (below
average)
Average Competitive (above av-
erage)
Highly Competitive
0%
10%
20%
30%
40%
50%
60%
19%
48%
26%
7%
0%
11%
43%
36%
11%
0%
2010 2011
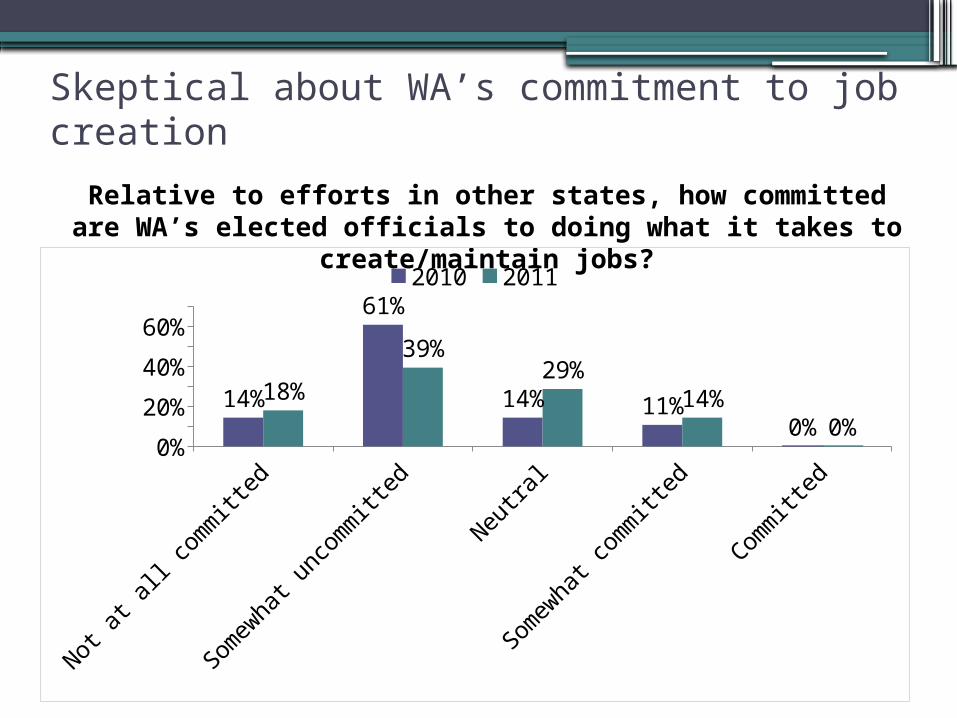
Skeptical about WA’s commitment to job creation
Relative to efforts in other states, how committed are WA’s elected officials to doing what it takes to create/maintain jobs?
Not
at a
ll co
mm
itted
Som
ewha
t unc
omm
itted
Neu
tral
Som
ewha
t com
mitt
ed
Comm
itted
0%
20%
40%
60%
14%
61%
14% 11%0%
18%
39%29%
14%0%
2010 2011
What can state leaders do about it?•Acknowledge the bad.•Set a vision for a positive future.•Take action.

Deal with the immediate crisis.
Boost confidence.• F
iscal stability
• Prioritized investment
Improve competitiveness.• W
orkforce
• Infrastructure
• Costs
Jobs.
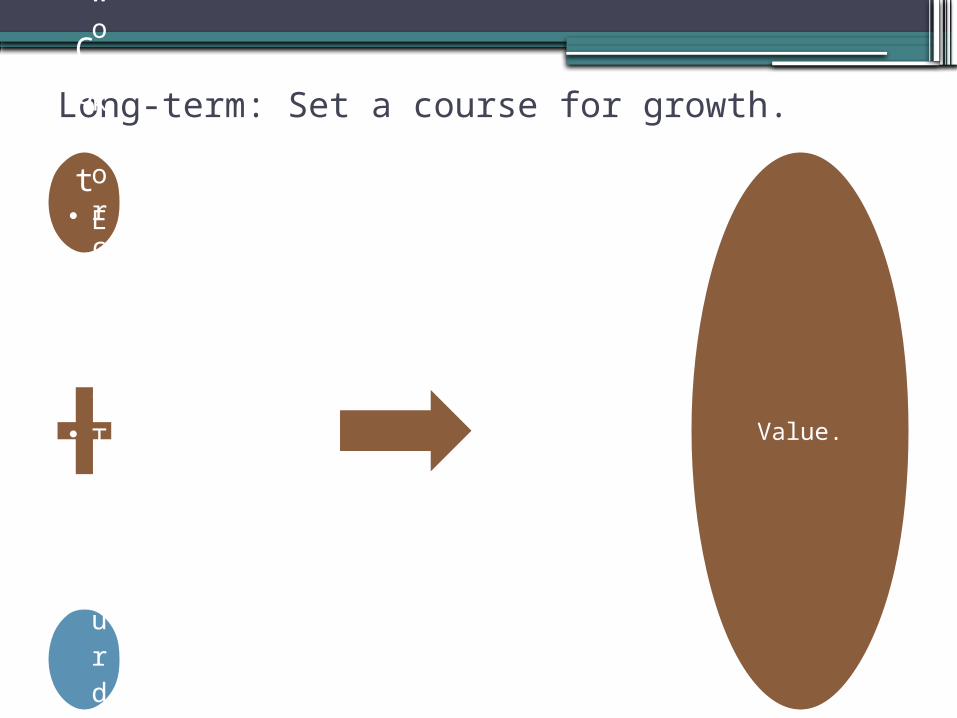
Long-term: Set a course for growth.
Quality• E
ducation
&
workforce
• Infrastructure
• Innovation
Cost• E
nergy
• Tax
burden
• Business costs
Value.

First:Identify what constitutes success for Washington state.
Second:Establish a roadmap for moving our state forward.
BENCHMARKS for a BETTER WASHINGTON

BENCHMARKS for a BETTER
WASHINGTON
• Look beyond just the next 2 years.
• Embrace a balanced a comprehensive plan for ongoing improvement.
• Commit to pursue necessary policy changes and measure progress against clear, measurable benchmarks.
• Long-term success and vitality depends on a common commitment to: • protect & enhance quality of
life.• provide employers with the
competitive edge necessary to succeed in a global economy.

BENCHMARKS for a BETTER WASHINGTON
Criteria:
• Benchmark must speak to the idea that Washington must compete on value (quality AND cost).
• Benchmark has to be measurable via recognized, reliable, independent sources that include comparative data for all 50 states.
Goals:
• Rank among the top 10 states in the nation on key quality of life and innovation metrics.
• Stay or get out of the 10 states with the highest business costs.

Goal: Rank among the top 10 states for total private sector (non-govt.) job growth.
Current Rank: 15th
Private sector job growth drives economic growth.
Goal:Rank among the top 10 states in the number of utility patents granted annually.
Current Rank: 4th
Inventors in WA secured 5,258 utility patents in 2010, up from 4,309 the previous year (which ranked the state 5th in the nation).
Goal:Rank among the top 10 states for low electricity rates (industrial and commercial).
Current Rank: 1st2009 data ranks Washington the lowest out of the 50 states with an average cost of 5.95 cents/kW-hr.
31
BENCHMARKS for a BETTER WASHINGTON

Goal: Rank among the top 10 states in high school graduation rates.
Current Rank: 42ndWA’s graduation rate in 2008 was 65.6%. More than 30,000 students fail to graduate every year; this equates to 170 students dropping out every day.
Goal:Rank among the top 10 states in student performance in math & science.
Current Rank: 9th in math; 21st in science 40% of 8th graders score at above or proficient in mathematics. 34% of 8th graders score at or above proficient in science.
Goal: Rank among the top 10 states in bachelor’s degrees awarded per capita.
Current Rank: 35th
By 2018, 67% of jobs in WA will require some postsecondary training. A higher ranking is needed to ensure WA is preparing its young people for success in its economy.
32
BENCHMARKS for a BETTER WASHINGTON
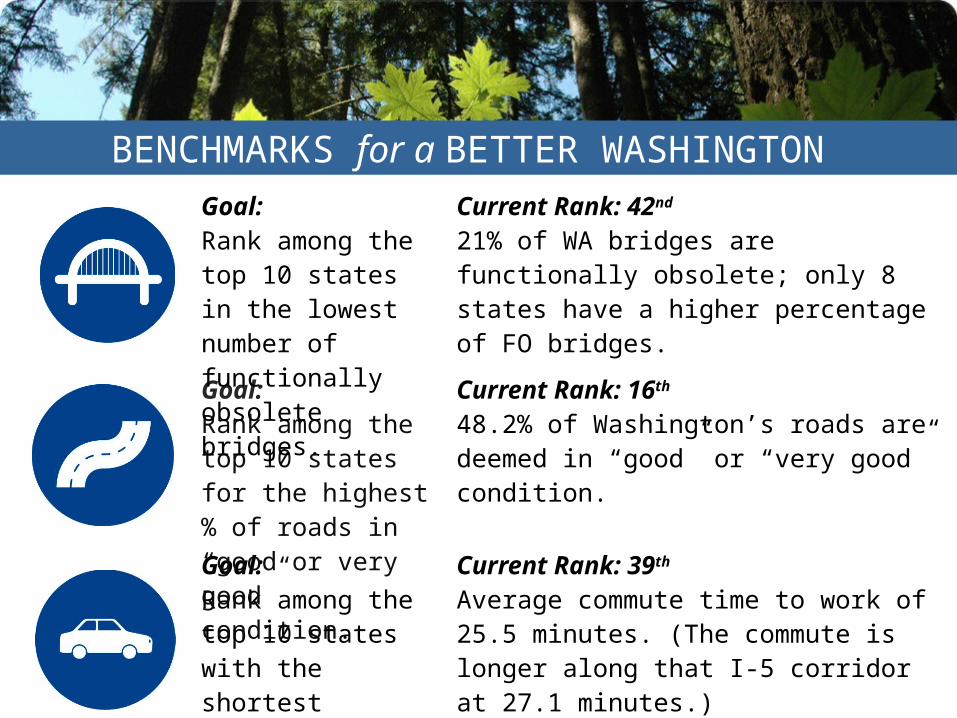
Goal: Rank among the top 10 states with the shortest commute travel times per person.
Current Rank: 39th Average commute time to work of 25.5 minutes. (The commute is longer along that I-5 corridor at 27.1 minutes.)
Goal: Rank among the top 10 states for the highest % of roads in “good or very good” condition.
Current Rank: 16th 48.2% of Washington’s roads are deemed in “good” or “very good” condition.
Goal: Rank among the top 10 states in the lowest number of functionally obsolete bridges.
Current Rank: 42nd
21% of WA bridges are functionally obsolete; only 8 states have a higher percentage of FO bridges.
33
BENCHMARKS for a BETTER WASHINGTON
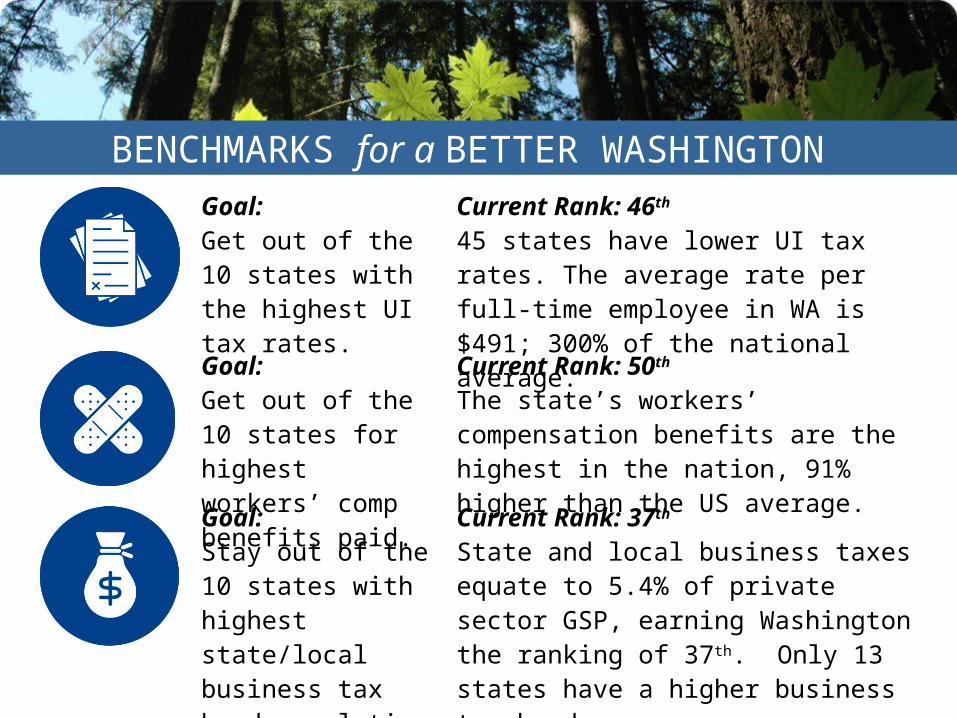
Goal: Stay out of the 10 states with highest state/local business tax burden relative to private sector GSP.
Current Rank: 37th State and local business taxes equate to 5.4% of private sector GSP, earning Washington the ranking of 37th. Only 13 states have a higher business tax burden.
Goal: Get out of the 10 states with the highest UI tax rates.
Current Rank: 46th 45 states have lower UI tax rates. The average rate per full-time employee in WA is $491; 300% of the national average.
Goal: Get out of the 10 states for highest workers’ comp benefits paid.
Current Rank: 50th The state’s workers’ compensation benefits are the highest in the nation, 91% higher than the US average.
34
BENCHMARKS for a BETTER WASHINGTON

• Fiscal policy:▫ Focus on sustainable spending.▫ Maintain reserve = to 5% of GF
expenditures.▫ Establish defined contribution
pension plan for new hires.▫ Reinstate firm expenditure limit▫ Better manage debt service
• Business costs▫ Refrain from expanding UI
benefits.▫ Adopt mainstream voluntary
settlement option.▫ Establish precise definition for
occupational disease.▫ Permit private insurers to offer
workers’ compensation policies.
A year-long partnership to research and promote a series of actionable and substantive policy recommendations that, if enacted, will preserve essential services, lay a foundation for sustainable economic growth and create an environment in which Washingtonians can thrive.
Key recommendations:• Establish a public
policy foundation for economic vitality.
• Reset state spending to a sustainable level.
• Competitive Sourcing▫ Ensure contracting out authority
isn’t subject to collective bargaining.
▫ ID opportunities to reduce costs through competitive contracting.
▫ Create commission
• Health Care▫ Continue to seek Medicaid
waivers to gain maximum flexibility.
▫ Collective bargaining: negotiate a benefits agreements approaching private sector parity.
• Government restructuring▫ Pursue agency consolidation.

• Regulatory reform▫ Adopt EPA standards, exceeding
them only when justified.▫ Create a permanent task force
monitoring leg. & gov. rule-making.▫ Exempt minor projects from the
SEPA process.
• Economic Development▫ Expand STEM education & enhance
accountability.▫ Use new four-tier evaluation system
to guide K-12 personnel decisions.▫ Make performance primary criterion
in teacher layoffs.▫ Preserve access to higher education.▫ Retain tax incentives the promote
investment & job creation.▫ Preserve tolling to support
transportation investments.
A year-long partnership to research and promote a series of actionable and substantive policy recommendations that, if enacted, will preserve essential services, lay a foundation for sustainable economic growth and create an environment in which Washingtonians can thrive.
Key recommendations:• Establish a public
policy foundation for economic vitality.
• Reset state spending to a sustainable level.

Priorities for the short-term: 2012

Priorities for the long-term
Make Washington a
top 10 state in
quality of life and innovation.
Ensure our state isn’t one
of the most
expensive for
business.

Questions?www.waroundtable.com @waroundtable on twitter www.facebook.com/washingtonbenchmarks