navigating in uplan budget & resource management january 2015
TRANSCRIPT

Navigating in UPlanBudget & Resource Management
January 2015

© [2015-2016] “University of California San Francisco (UCSF)” Ownership of CopyrightThe copyright in this material (including without limitation the text, artwork, photographs, and images) are owned by UCSF.Copyright LicenseUCSF grants to you a non-exclusive royalty-free revocable license to:- View this material on a computer- Store this course in your cache or memory- Print pages or material from this course for your own personal and non-commercial use.All rights reserved.Enforcement of CopyrightUCSF takes the protection of its copyright very seriously. If UCSF discovers that copyrighted materials have been used in contravention of the license above, UCSF may bring legal proceedings against you seeking monetary damages and an injunction to stop you from using the materials.
2

Contents
Getting Started in UPlan UPlan Menus and Toolbars Preferences and MyOrg Forms and Navigations Right-click Menu Features Seeding and Global Assumptions UPlan Reports
3

Getting Started in UPlan

5
Logging on to UPlan Log on via MyAccess Sign in using the same username and password as the you normally use to
sign into your computer every day Format your browsers according to UPlan Job Aid 201 for PC; 202 for Mac Note: the name UPlan will not appear on this screen or within the system

The HomePage is the gateway for accessing the UPlan Recently Opened shows the items you use frequently Quick Links directs you to the UPlan applications UCSFPlan and
CommtPln Explore will take you to Hyperion Financial Reports (FR)
6

Logging Off UPlan
When you have finished working in UPlan, you need to log off If you do not log off, your session will time out It is always best to log off of your session when you have
completed your work
7

To open a UPlan Application, simply click on the link from the HomePage You can open multiple applications at once, including second
instances of the same application A new tab appears below the masthead when you open an
application, form or report Allows you to have multiple items open at the same time Allows movement between pages by clicking the appropriate tab heading A tab can be closed by clicking the Close “x” button on the tab
8

You have several options for opening UPlan applications
9
From the Menu bar, click Navigate > Applications > Planning, then select the application.
From the Menu bar, click File > Open > Applications > Planning, then select the application.
From the HomePage, in the Quick Links section, under Applications, click the application link of your choice.
or
or

Each application page is divided into two sections
10
The View Pane displays selections of forms, task lists, and preferences.
The Content Pane displays the corresponding task list or form selected.
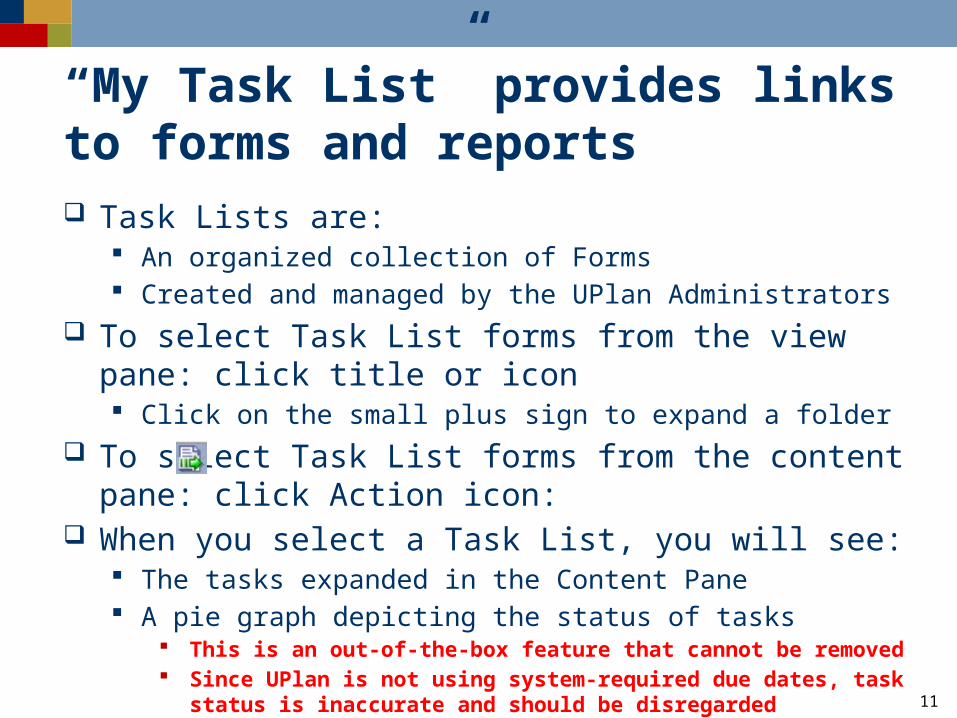
“My Task List” provides links to forms and reports Task Lists are:
An organized collection of Forms Created and managed by the UPlan Administrators
To select Task List forms from the view pane: click title or icon Click on the small plus sign to expand a folder
To select Task List forms from the content pane: click Action icon:
When you select a Task List, you will see: The tasks expanded in the Content Pane A pie graph depicting the status of tasks
This is an out-of-the-box feature that cannot be removed Since UPlan is not using system-required due dates, task status is inaccurate and
should be disregarded
11

The Task List Status buttons at the bottom of the window are not used UCSF is not using what Hyperion Planning calls “work flow”
Task List Status information therefore is not meaningful At the bottom of each form, there is a place to check if the
task is complete. DO NOT USE THIS.
It is possible that someone will use this button. This will: Mark the task complete for all users, regardless of their DeptID or level Possibly change the appearance of the pie chart in Task List Status
Normally, the pie chart is all blue (indicating incomplete)
12
With button used

UPlan Menus and Toolbars

Menus in the masthead help you perform actions
14
FILE MENUOpen Open an applicationSave Save data input to data formsPrint Print the current data form
displayedPreferences Set various preferencesLog Off Log off Exit Exit Workspace
EDIT MENUOpen Open an applicationSave Save data input to data
forms
Print Print the current data form displayed
Preferences Set various preferences
Log Off Log off Exit Exit Workspace
VIEW MENURefresh Refresh the current view to reflect
what is stored in the database
Show / Hide Dimension Names on Page
Display (or hide) names of dimensions in the Page Filter area.
Instructions Show description of how to use the current form
View Masthead Hide masthead
TOOLS MENUChange Password
Change your UPlan password (Do not use)
Export as Spreadsheet
Create an Excel version of the current form, including currently displayed data

The UPlan toolbar provides several options for navigating within Workspace Some icons are available throughout UPlan. These are circled
in orange. Others toolbar buttons become available as data forms open.
When you open a Form, the Toolbar displays additional icons. These are highlighted in red.
15

Toolbar Icon Functionality
Icon DescriptionHome Opens the HomePage tabExplore Opens the Explore tab for accessing Reports Save Saves input on data formsRefresh Refreshes the data form with data stored in the databasePrint Prints the current data form displayedAdjust Increases or decreases values by a percentage or a valueGrid Spread Spreads data across dimensions on the data formCell Text Adds comments to a specific cell at any level in data formsLock/Unlock Locks or unlocks cells when spreading dataSupporting Detail Adds detail that aggregates the cell value in data formsCut Cuts a data value from a cell on a data formCopy Copy data values on a data formPaste Paste data values into other cells on a data form
16

Preferences and MyOrg

Preferences may be set to indicate how certain items display within an application Use Preferences to set your MyOrg DeptID
Found on User Variable tab in Preferences MyOrg is:
A DeptID, at any level of the tree, that is used to identify or limit the number of departments displayed on a form
A pre-designed filter that allows you to focus your efforts on the DeptIDs you want to plan
Required to be set for both Employee Planning and Commitment Tracking modules
Planners should select a MyOrg that represents the portion of the DeptID tree for which they are responsible
18

Forms and Navigation

“Forms” are the UPlan screens for entering or retrieving data Forms are predefined templates
Planners can modify data only; not the design of the forms
Forms are similar to Excel spreadsheets Data appear in rows and columns Data entry is made in individual cells Planners can use edit, copy, and paste keyboard or mouse
functions Note: when accessing forms via the web, planners cannot
enter formulas into cells
20

Within each form, some or all of these common steps may be performed View data Enter or edit data Add rows Expand columns Change page filters Navigate from a landing page to a data entry form Save changes to data
21

22
Forms can be accessed in three ways
1) From My Task List View Pane
2) From My Task List Content Pane (use action icon )
3) By using the right-click menu on a landing page (in some cases)

UPlan contains three types of forms
1) Landing Pages Provide a summary list of information Do not allow data entry May be used to access Data Entry Forms, typically as a
jumping off point
2) Data Entry Forms
3) Form Reports Do not allow data entry May be used to access Data Entry Forms
23

24
Forms in UPlan
Data Entry & Landing Page Forms you will use in UPlan include:
*Note: These forms are Landing Pages
Module Form(s)General Planning • Revenue and Expense – Level C (or E)
• Tuition and Fee Revenue Calculator• Global Assumptions
Employee Planning • Existing Employees*• To-be-Hired*• Employee Search*
Commitment Tracking • Manage Commitments*• Commitments Search*

Composite Forms include multiple tabs or panes to improve navigation Multiple forms combined on one screen view Two main types of composite forms in UPlan:
Multiple Panes:
Multiple Tabs:
25
TOP
BOTT
OM

26
Parts of a Form

Point of View and Page Filters determine what data appears on your form Point of View (POV) contains hard-coded dimensions for the
form (except MyOrg is not hard-coded) Page Filters are dimensions that can be changed
Note: Some forms display one or the other, or both27

28
Selecting Page Filters Mouse over the Page Filter arrow button to open
the Member Selection tool Type in the search box or scroll through the
Member list Click on your selection Either change another Page Filter value or Press the
Go icon to refresh your Page Filter selection:
Note: Make sure to check the Page Filter selections each time you begin working on a form to ensure you are viewing/entering data for the correct dimension members.

An intersection is a specific combination of dimension members Intersections are defined by:
Point of View Page Filters Specific column and row
Data can be entered in valid planning intersections On writable Data Entry Forms Where cells are white (in most cases)
29

Cell shading helps users differentiate information
30
Pink cells highlight the Completion Tracking row
Yellow cells indicate unsaved changes
Orange cells indicate read-only data, typically subtotals
White cells indicate intersections where data can be entered
Gray cells indicate read-only intersections of data, typically fed
from elsewhere; they may also be a calculation on some forms
Blue cells indicate supporting detail
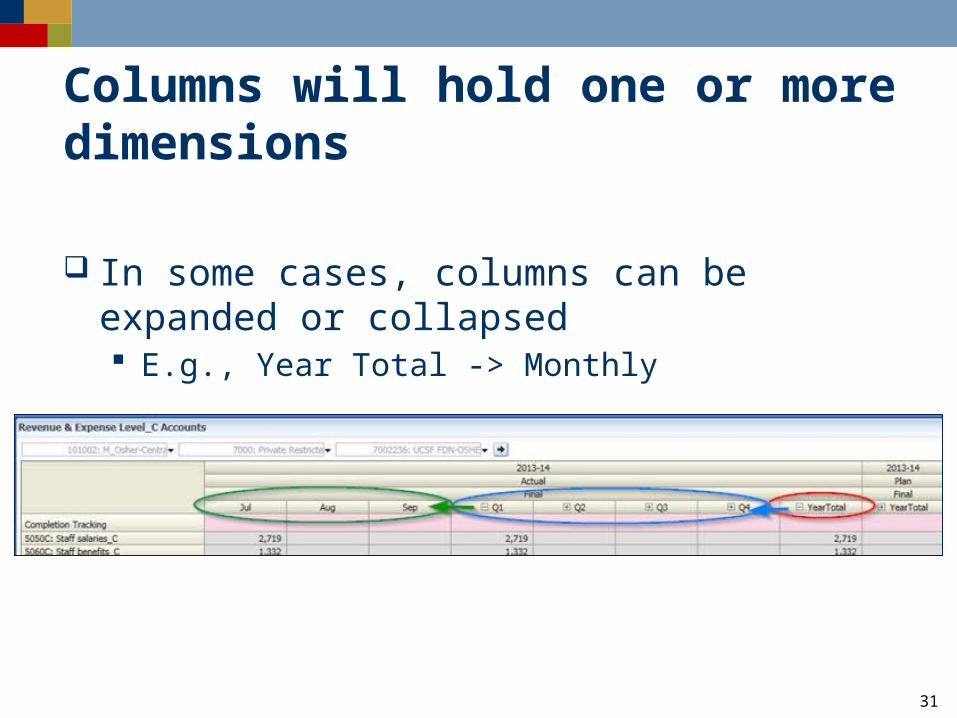
Columns will hold one or more dimensions
In some cases, columns can be expanded or collapsed E.g., Year Total -> Monthly
31

Rows will also hold some number of dimensions Depending on the form, rows may hold:
Accounts DFP combinations Commitments Employees
Generally, rows with no data will be suppressed on the form Planners can add rows to a form using a right-click menu
option
32

Runtime Prompts are dialog boxes that appear, requiring additional information They may appear at various times, such as when:
adding accounts to the Revenue & Expense form adding a new To-Be-Hired (TBH) in Employee Planning
In most cases, planners can use a look-up icon to select a member:
33

The Member Selection dialog box is a frequently-used tool
The buttons in the search box aid in finding desired members:
Highlight column members on the left and use the buttons in the middle to add or delete your selection(s):
34
Filtered Search Show a list of all members including this text
Search Up Advance to the next member containing this text
Search Down Go back to the last member containing this text

Data can be entered into writable intersections (white cells) Options for data entry:
Typing values directly Cutting and pasting
Forms in UPlan use many of the Excel shortcut keys
35
Shortcut ActionEnter Enter the value and move the cursor to the field in the next row Tab Enter the value and move the cursor to the field in the next column Shift + Tab Enter the value and move the cursor to the field in the previous column Esc Cancel the value and restore the previous value Ctrl + C Copy the values in the field or range of fields Ctrl + X Cut the selected field or range of fields Ctrl + V Paste content from the clipboard Ctrl + S Save data

To enter data, click on the cell until an inner white box appears Click or double click cell until it shows an inner white box Highlight or delete existing data Type a value If value is a percentage, use one of these methods
Include the percent sign: 100% or 50% Use a decimal equivalent: 1.0 or .50
36

Data entered in the YearTotal column will spread to individual months A value entered in a month stays in that month and
updates the YearTotal A value entered in YearTotal spreads across the
months Spreading will follow existing proportional distribution
pattern of values in cells Only open (non-actualized) months will update To clear the spreading pattern, use Grid Spread on the
right-click menu
37

Save your data early and often When using web forms, saving submits your data to the UPlan database During save, form totals are recalculated to reflect the new data for
members that are calculated dynamically Three options: Use Ctrl + S, File > Save, or the Save icon
Refresh data allows you to discard any unwanted, unsaved data changes (a warning appears)
Use View > Refresh or the Refresh icon Refresh may also clear up temporary issues (such as Page filters not
displaying)
Note: Navigating from the one form to another form without saving will result in the loss of unsaved data
38
save
refresh

Data Precision and Rounding
Data for forecasts and plans need not be exact Data values on forms are rounded to the dollar
Monthly values may not sum perfectly to year total values
39

Exporting Forms to Excel Spreadsheets
UPlan forms can only be edited directly in the UPlan workspace
However, forms can be exported to spreadsheets easily Landing Page Forms Data Entry Forms Read-only Form Reports
Composite Forms only export the form currently visible To export all parts of a composite form, you need to export each
one individually Select Tools > Export as Spreadsheet
40

Other Tips and TricksDesired Result How to PerformWiden columns in a form Move cursor between columns and click
and drag to desired widthChange the magnification of the screen display
Use your browser’s view menu or keyboard shortcuts to zoom in or out
Choose how to display members in Member Selection dialog boxes
Click the Display Property Icon and choose to display member name, alias, or both
Show dimension names for Page Filters on a form
Select View > Show Dimension Names on Page
Have numbers appear with commas
In Preferences > Display Options, set thousands display to Comma
41

Right-click Menu Features

Many actions in UPlan are achieved via right-click menus
These features include: Edit: Copy, Cut, Paste, Clear Add a row (such as an Account) Remove a row (such as an Account) Adjust Data
For certain actions (such as adding a row), you must right-click on the right-most row header
43

The Adjust Data option enables value or percentage changes to data1) Highlight cell(s) and choose one of these methods:
Right click and choose Adjust > Adjust Data Use the Edit > Adjust menu option Click on the Adjust icon
2) Select By Value or By Percentage and Increase or Decrease3) Then type a whole numberNote: It is possible to adjust multiple cells at one time
Cells must be contiguous Cells must be at same level and dimension (such as Months)
44

Spreading distributes data from YearTotal to individual months Spreading occurs based on the following logic:
If no data are in the open months, the new YearTotal value will spread evenly
If data exist in any or all of the open months, the new YearTotal value will spread proportionally
If some open months are locked or final (such as for closed months of the Forecast), the data will spread based only on the available months
Whenever you make changes to data, whether using spreading, grid spreading, or adjusting, gray, read-only cells will be ignored.
45

Grid Spread is similar to spreading, but allows more control
46
Grid Spread Option
Result
Proportional spread
Takes the updated value and distributes proportionally based on current value in each month
Evenly split Takes the updated value and divides it evenly, regardless of current value in each month
Fill Takes the updated value and copies it to each month
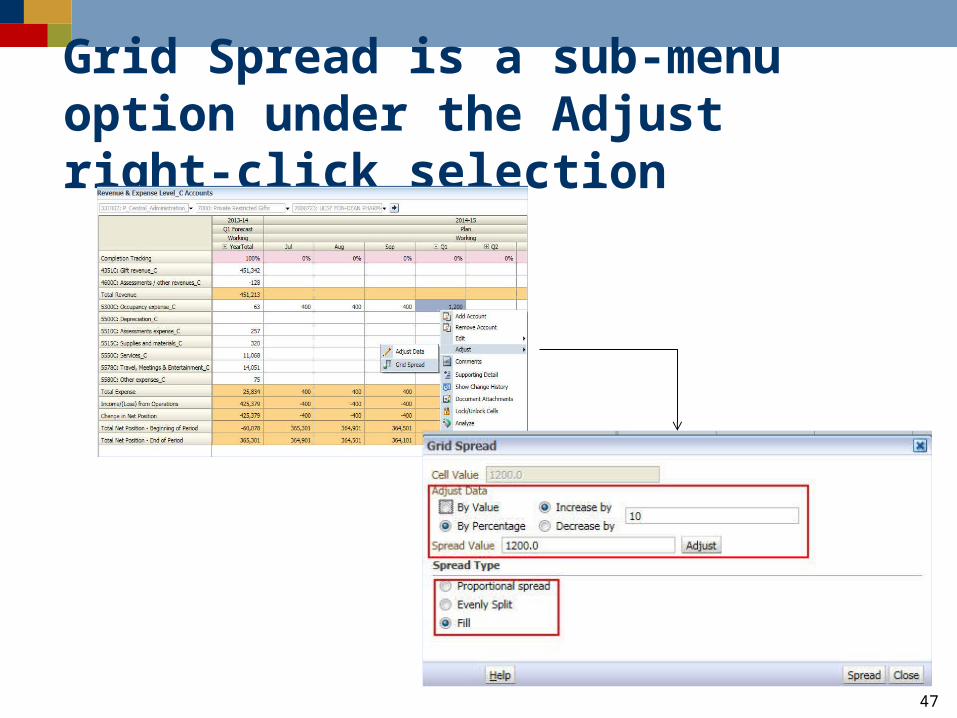
Grid Spread is a sub-menu option under the Adjust right-click selection
47

At various times, planners will want to add a Row to the data entry form
1) Right-click on a row and select the Add option Planner must click on the right-most row header on the
form Options will vary depending on the data entry form
2) A Runtime Prompt dialog box opens3) Type your selection, or click on the Member
Selection icon4) The Member Selection dialog box opens5) Search for and highlight your selection6) Choose Add, click OK and Launch
48

In some cases, it is also possible to remove a row
1) Move your mouse to a row you want to remove2) Right-click and select the Remove option3) A warning window opens, click OK4) The selected row no longer displays on the form
Note: Planners can only remove one row at a time
49

Cell Comments allow planners to add or edit background information1. Right Click on a cell and
select Comments
2. To add a comment, select Actions > Add or click the green plus sign
3. Type a comment, using formatting if desired
50
Cells with comments are indicated with a blue triangle in the upper right corner of the cell

Supporting Detail allows users to document how a value is calculated Useful when specific factors/equations/drivers determine a
cell’s value1. Highlight a desired cell and right-click2. Select Action>Add Child from the Supporting Detail Dialogue
Box or click the Add Child Button3. Add Labels, Data, and Operators and click Save
51
1. 2. 3.

Locking prevents data in those cells from being over-written Locking cells may be useful during:
Spreading Adjusting Grid spreading
Locked cells appear light brown Unlocking locked cells
Can be manually done Happens automatically on save
Lock and unlock a cell using the right-click menu
52

If desired, you can hide rows with no data
By default, most forms in UPlan show only rows with data in them
Hiding rows allows you to remove all rows with no data during the current session
To hide rows in forms: Right click on a row heading in a form and select Filter >
Hide Rows with zeros and no data The form refreshes, showing only rows with data
To restore all rows in this session, right click and select Filter > Show Rows with zeros and no data
53

Forms can be filtered based on rows or columns Filtering allows you to keep or exclude only rows or
columns that match certain criteria
Filtering can be accessed through the Right-Click Menu
54

55
Filtering Rows or Columns in Forms (cont’d)
Filtering criteria in the dialogue box include:
To restore the data, right-click and select Filter > Cancel Filter
Criteria Function
Type Select Keep to retain items matching your selection or Exclude to remove items matching your selection
Filter Compare Select one of the options in the dropdown box such as Equals or Greater Than
Value Type an amount or text information with which to compare the rows (or columns); if you are using text, the Filter Compare selection must be Equals or Not Equals

UPlan Reports

UPlan Reporting
UPlan contains two types of reports based on how data is accessed Form Reports Hyperion FR Reports Help to identify areas in planning that may need attention Summarize data to help identify areas where corrections may be
needed
My Reports Management that will include both financial and planning information Provides drill-down and drill-through functionality For more information about MyReports, visit the Finance3 website
57

UPlan Form Reports are accessible from the Task List Read-only Easy-to-use
Use Page Filters to change the data displayed Export to Excel using the Tools menu In some cases, form reports will include right-click options
allowing navigation to data entry forms Form reports are typically found in a reports folder
General Planning > Reports Employee Planning > Reports Commitment Tracking > Commitment Reports
58

Hyperion FR Reports (aka Explore Reports) are accessed using the Explore button Dialog boxes for selecting report filters are similar to
those used for member selection on forms Export to Excel using File > Export
59

To run a Hyperion FR Reports, click Explore
1. Select one of the folders to find Hyperion Reports for Commitment Tracking or General Planning
60

61
Running Hyperion FR Reports (cont.)
2. Select a report you want to run and open it in HTML Preview3. Use the Preview User Point of View to select dimension
members you want to run the report You can also select POV members on the report
4. Once the report is open, you can: Scroll through the report to preview it in HTML Export the file to Microsoft Office using File > Export and choose
Excel, Word or PowerPoint Change to PDF preview and print

62
Selecting POV Members1. From the Preview User Point of
View, you can type or look up and select dimension members
2. Expand members in the hierarchy and manually find and select the dimension member of your choice.
3. Alternatively, search for a member by name or description by using the Find drop down list to choose Name or Description, then type in the box and click the binocular icon to search.

63
Selecting POV Members (cont.)
The results appear. You may get a message if there are more than 50 choices matching your search. If so, you may need to refine your search criteria.

64
Setting Preferences for Hyperion FR Reports
1. From anywhere in UPlan, select File > Preferences
2. Select Financial Reporting from the left side bar.
3. Set your Default preview mode to HTML Preview
4. Under User Point of View, set Preview to On

Review Quiz!
65
1. True or False:a) MyOrg is a pre-designed filter that allows you to focus your
efforts on the DeptIDs you want to plan.b) A pie graph on the content pane depicting the status of tasks
is useful to me.c) Multiple tabs in UPlan can be open at the same time.d) It is always best to log off of your session when you have
completed working in it.

66
Quiz!
2. What are some of the factors that may influence logic behind spreading data?

67
Quiz!
3. Can Composite Forms be exported to Excel?

68
Quiz!
4. What color is a locked cell?
Answers to Navigating in UPlan Quiz
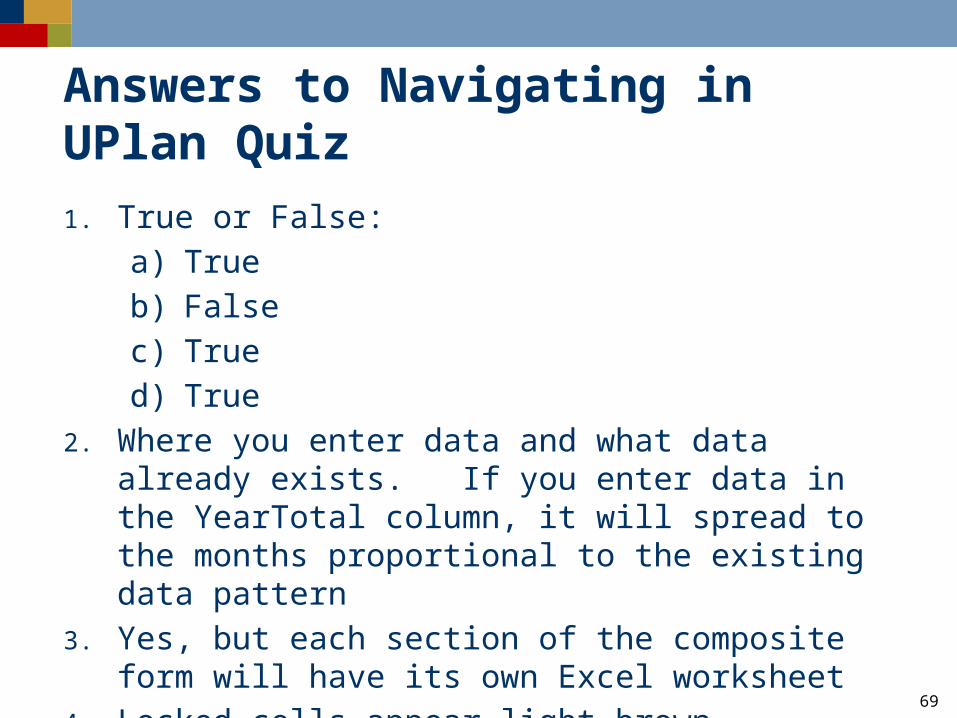
1. True or False:a) Trueb) Falsec) Trued) True
2. Where you enter data and what data already exists. If you enter data in the YearTotal column, it will spread to the months proportional to the existing data pattern
3. Yes, but each section of the composite form will have its own Excel worksheet
4. Locked cells appear light brown
69