navigating assurance client health · wired or wireless client endpoint device health, such as...
TRANSCRIPT

Navigating Assurance Client Health
Cisco DNA Center 1.2 Training

Core Software Group
Navigating Assurance Client HealthCisco DNA Center 1.2 Training i
Copyright Page
THE SPECIFICATIONS AND INFORMATION REGARDING THE PRODUCTS IN THIS MANUAL ARE SUBJECT TO CHANGE WITHOUT NOTICE. ALL STATEMENTS, INFORMATION, AND RECOMMENDATIONS IN THIS MANUAL ARE BELIEVED TO BE ACCURATE BUT ARE PRESENTED WITHOUT WARRANTY OF ANY KIND, EXPRESS OR IMPLIED. USERS MUST TAKE FULL RESPONSIBILITY FOR THEIR APPLICATION OF ANY PRODUCTS.
THE SOFTWARE LICENSE AND LIMITED WARRANTY FOR THE ACCOMPANYING PRODUCT ARE SET FORTH IN THE INFORMATION PACKET THAT SHIPPED WITH THE PRODUCT AND ARE INCORPORATED HEREIN BY THIS REFERENCE. IF YOU ARE UNABLE TO LOCATE THE SOFTWARE LICENSE OR LIMITED WARRANTY, CONTACT YOUR CISCO REPRESENTATIVE FOR A COPY.
The Cisco implementation of TCP header compression is an adaptation of a program developed by the University of California, Berkeley (UCB) as part of UCB’s public domain version of the UNIX operating system. All rights reserved. Copyright © 1981, Regents of the University of California.
NOTWITHSTANDING ANY OTHER WARRANTY HEREIN, ALL DOCUMENT FILES AND SOFTWARE OF THESE SUPPLIERS ARE PROVIDED “AS IS” WITH ALL FAULTS. CISCO AND THE ABOVE-NAMED SUPPLIERS DISCLAIM ALL WARRANTIES, EXPRESSED OR IMPLIED, INCLUDING, WITHOUT LIMITATION, THOSE OF MERCHANTABILITY, FITNESS FOR A PARTICULAR PURPOSE AND NONINFRINGEMENT OR ARISING FROM A COURSE OF DEALING, USAGE, OR TRADE PRACTICE.
IN NO EVENT SHALL CISCO OR ITS SUPPLIERS BE LIABLE FOR ANY INDIRECT, SPECIAL, CONSEQUENTIAL, OR INCIDENTAL DAMAGES, INCLUDING, WITHOUT LIMITATION, LOST PROFITS OR LOSS OR DAMAGE TO DATA ARISING OUT OF THE USE OR INABILITY TO USE THIS MANUAL, EVEN IF CISCO OR ITS SUPPLIERS HAVE BEEN ADVISED OF THE POSSIBILITY OF SUCH DAMAGES.
Cisco and the Cisco Logo are trademarks of Cisco Systems, Inc. and/or its affiliates in the U.S. and other countries. A listing of Cisco's trademarks can be found at www.cisco.com/go/trademarks. Third party trademarks mentioned are the property of their respective owners. The use of the word partner does not imply a partnership relationship between Cisco and any other company. (1005R)
THIS DOCUMENT IS CONSIDERED CISCO PROPERTY AND COPYRIGHTED AS SUCH. NO PORTION OF COURSE CONTENT OR MATERIALS MAY BE RECORDED, REPRODUCED, DUPLICATED, DISTRIBUTED OR BROADCAST IN ANY MANNER WITHOUT CISCO’S WRITTEN PERMISSION.
Any Internet Protocol (IP) addresses and phone numbers used in this document are not intended to be actual addresses and phone numbers. Any examples, command display output, network topology diagrams, and other figures included in the document are shown for illustrative purposes only. Any use of actual IP addresses or phone numbers in illustrative content is unintentional and coincidental.
Navigating Assurance Client Health
© Copyright 2018 Cisco Systems, Inc. All rights reserved.

Core Software Group
Navigating Assurance Client HealthCisco DNA Center 1.2 Training ii
Contents Basics
Why Is It Important? Where Does It Happen? What Skills Do I Need?
Basic Proficient
What Terms Should I Know? Fabric Domain Network Hierarchy WLANs or SSIDs
Evaluating the Big Picture… …on the Client Health Page.
What Will I See? And What Will I See…
On the Geographical Map? In the List View?
Where Do I Find Client Health Organized… …By SSIDs (WLANs)? …By Radio Frequencies?
What Are the Common Page Features? Dashlet Chart Elements on the Client Health Page Detailed Information Panels Endpoint Lists
How Can I Add or Position Dashlets? What Affects the Information That I Am Seeing?
Time Periods and Time Stamps Changing the Time Period Persistent Filters on Page Navigation
How are Client Health Metrics Looking? Get a Summary View of Client Health
What Will I See? Where Do I Find…
…Client Onboarding Attempts and Lengths of Time until Onboarded? The Client Onboarding Times Dashlet The Client Onboarding Times Panel
…The Signal Strengths That Endpoints are Receiving (RSSIs)? The Connectivity RSSI Dashlet The Connectivity RSSI Panel
…Signal-to-Noise Ratios for Client Endpoints?

Core Software Group
Navigating Assurance Client HealthCisco DNA Center 1.2 Training iii
The Connectivity SNR Dashlet The Connectivity SNR Panel
…The Number of Clients That Are Associated To Each SSID? The Client Count per SSID Dashlet The Client Count per SSID Panel
…The Number of Clients That Are Using Each Radio Band Frequency? The Client Count per Band Dashlet The Client Count per Band Panel
…The Physical Link Health of Wired Clients? The Connectivity Physical Link Dashlet The Connectivity Physical Link Panel
…The Numbers of DNS Requests and Responses per Minute? The DNS Dashlet
…Health Metrics and Attributes for Client Devices? The Client Devices List
How is a Specific Client Endpoint Doing? Get a Holistic View on the Client 360
What Will I See? How Do I Open the Client 360 Page for a Specific Endpoint?
Where Do I Find… …Issues That Are Affecting the Endpoint? …A List of Resolved Issues and Their Details? …The Endpoint’s Network Path and the Health of Devices on the Path? …Endpoint-Related Events and Their Statuses? …The Tool for Evaluating the Path That Traffic Is Using?
Path Traces for Flow Mapping and Path Health How Do I Prepare To Run a Path Trace? How Do I Run a Path Trace?
…Application Use and Health? …More Metrics and Detailed Information?
The Detail Information Section Reviewing Device Type and Connectivity Attributes Reviewing Transmit / Receive Metrics and DNS Request / Response Times Reviewing Signal Strength and Signal to Noise Metrics Reviewing Apple® iOS Client Metrics and Connectivity to APs
What Was an Endpoint Experiencing at a Certain Time?
How Are All of a Single User’s Clients Doing? Get a Holistic View on the User-Based Client 360
What Will I See? How Do I Open a User-Based Client 360 Page?

Core Software Group
Navigating Assurance Client HealthCisco DNA Center 1.2 Training iv
Watch It Happen in Cisco DNA Center Video
Evaluating a System User’s Printer Connection (8:00)
Want More? Find Product Information Find Training Contact Us About This Training

Core Software Group Basics
Navigating Assurance Client Health 1
Basics Why Is It Important?
Cisco DNA Center Assurance provides comprehensive functionality that helps you to ensure higher and more consistent service levels to meet growing business demands.
By correlating information from the network, clients, applications, and contextual sources, Cisco DNA Center delivers network monitoring results and proactive insights into:
● Wired or wireless client endpoint device health, such as computers, mobile devices, or equipment.
● Potential or active client issues or failures that can affect business operations.
Cisco DNA Center Assurance presents detailed metrics, data, and history on clients, including:
● Wired and wireless client health.
● Client onboarding times.
● Received signal strength indicator (RSSI) measurements.
● Wired client connectivity health.
When you combine current network complexities with bring-your-own-device policies and other integrated equipment, managing clients effectively is critical to:
● Ensuring network service levels, network security, and end users’ network experiences.
● Managing enterprise operations.
● Proactively planning for network growth.
Assurance also presents wireless client disconnection information for some Apple iOS devices.
This training introduces you to:
● The types and levels of information that the Client Health page provides.
● The organization and layout of page features.
● General navigation and functions that you can use to access the information that you need.
Important Notes: The functionality that you see and the tasks that you can perform depend on the system’s licensing and configuration, and on your system user role. To recognize the overarching features and navigation that are available in Assurance, review the Assurance Features and Navigation training.

Core Software Group Basics
Navigating Assurance Client Health 2
Where Does It Happen?
You can view client insights, health states, and performance metrics on the Client Health page for all of the client endpoints connected to the network based on the settings that can affect what you see.
Note: Assurance also provides the Client 360 page for detailed health and metrics data related to a specific client endpoint.

Core Software Group Basics
Navigating Assurance Client Health 3
The Assurance | Overall Health page provides several methods by which you can open Client Health.
On the menu bar:
● On the Health menu, select Client.
On the Overall Health Summary dashlet:
● Below Client, click View Client Health.

Core Software Group Basics
Navigating Assurance Client Health 4
When you use the menu or dashlet methods of navigation, the system opens the Client Health page and, by default, presents the health states and metrics for the previous 24-hour period for clients:
● In all of the locations in the network hierarchy.
● That are using all of the radio band frequencies.
● That are on all of the service set identifiers (SSIDs).
You also can open Client Health so that it presents the data for a specific location in the network hierarchy automatically.
These methods are available on the geographical map and in the list view in the collapsed dashlet on the Overall Health page.
To open Client Health by using the dashlet toolbar:
● On the collapsed dashlet, click the list view or geographical map button.
To open Client Health by using a geographical map location: 1. Zoom the map view to a single location level.
2. Point to the location health indicator.
A pop-up window opens.
3. In the pop-up window, click Clients.
0.
Geographical map button List view button
To open Client Health, in the pop-up window, click Clients.

Core Software Group Basics
Navigating Assurance Client Health 5
To open Client Health by using the list view:
● Under Client Health, locate the row of the location of interest, and then click the link icon.
In the row of the location of interest, click the link icon.

Core Software Group Basics
Navigating Assurance Client Health 6
What Skills Do I Need?
To recognize, evaluate, and manage Assurance Client Health, you need the following experience.
Basic ● Practical network and LAN or WAN management experience
● Cisco Internetwork Operating System (IOS) concepts
Proficient ● Cisco DNA Center user interface and navigation
● OSI model
● Network hardware design and concepts
● Wired and wireless networking concepts
What Terms Should I Know?
Fabric Domain
A virtual network in a fabric topology, running over the physical infrastructure
Network Hierarchy
As an initial system configuration task, system users organize the network hierarchy, which arranges enterprise locations based on their geographical or organizational relationships. These relationships can include many sites, buildings at each site, and floors in each building in parent/child arrangements.
In the configuration and provisioning processes, system users assign devices to locations in the hierarchy.
Then Assurance organizes information based on the network hierarchy in various areas of Client Health to support the ability to identify locations or problem areas more easily.
WLANs or SSIDs
During network design, system users configure enterprise WLANs based on the network hierarchy.
Cisco DNA Center refers to WLANs as service set identifiers (SSIDs).

Core Software Group Evaluating the Big Picture…
Navigating Assurance Client Health 7
Evaluating the Big Picture… …on the Client Health Page.
What Will I See?
Health states and metrics for various measurements with links to details and possible issues
A collapsed dashlet containing the geographical map and list view
A summary of client health states for all clients and by client type
Filters and a timeline to control the information that Client Health displays
A list of clients active during the time period with links to Client 360 pages

Core Software Group Evaluating the Big Picture…
Navigating Assurance Client Health 8
And What Will I See…
On the Geographical Map?
The geographical map displays a visual representation of the client health states of the enterprise network, indicating each enterprise location based on the network hierarchy, the zoom level of the map and the other settings that can affect what you see.
The location indicators apply color-coding that indicates the most critical client health state occurring at each location.
Important Note: The location level health indicators are non-interactive.
The geographical map is available on the collapsed dashlet below the timeline.
To open the geographical map:
● On the collapsed dashlet, click the geographical map button.
Geographical map button

Core Software Group Evaluating the Big Picture…
Navigating Assurance Client Health 9
In the List View?
The list view applies a table layout to present client health states for the enterprise network, and selects the Hierarchical Site View by default, which organizes the list by the enterprise locations in the network hierarchy.
For each location, it organizes the health score indicators by client type and includes data based on the other settings that can affect what you see.
When you navigate to the Client Health page by using the menu or dashlet method, it indicates the health states combined for all sites.
When you navigate to the Client Health page by using the geographical map or list method, the list selects and applies that location’s data.
The list view is available on the collapsed dashlet below the timeline.
To open the list view:
● On the collapsed dashlet, click the list view button.
Data for all sites organized based on the network hierarchy
Data for a single site organized based on the network hierarchy
List view button

Core Software Group Evaluating the Big Picture…
Navigating Assurance Client Health 10
The list view indicates the total numbers of clients that are in a healthy state at each location in the All column. Parent locations’ percentages indicate the average of the health states for all of their child locations.
It also breaks out the percentage of wired and wireless clients in healthy states at each location.
You also can select the Building View layout, which organizes the list by building. When location groups have child sites or multiple buildings, each building is a separate line item in the list.
It also includes an entry for all of the buildings in the network hierarchy.
Total number of clients
Percentage of total healthy clients
Percentages of healthy wireless and wired clients
All of the buildings in the network hierarchy
Building level view
Core Software Group Evaluating the Big Picture…
Navigating Assurance Client Health 11
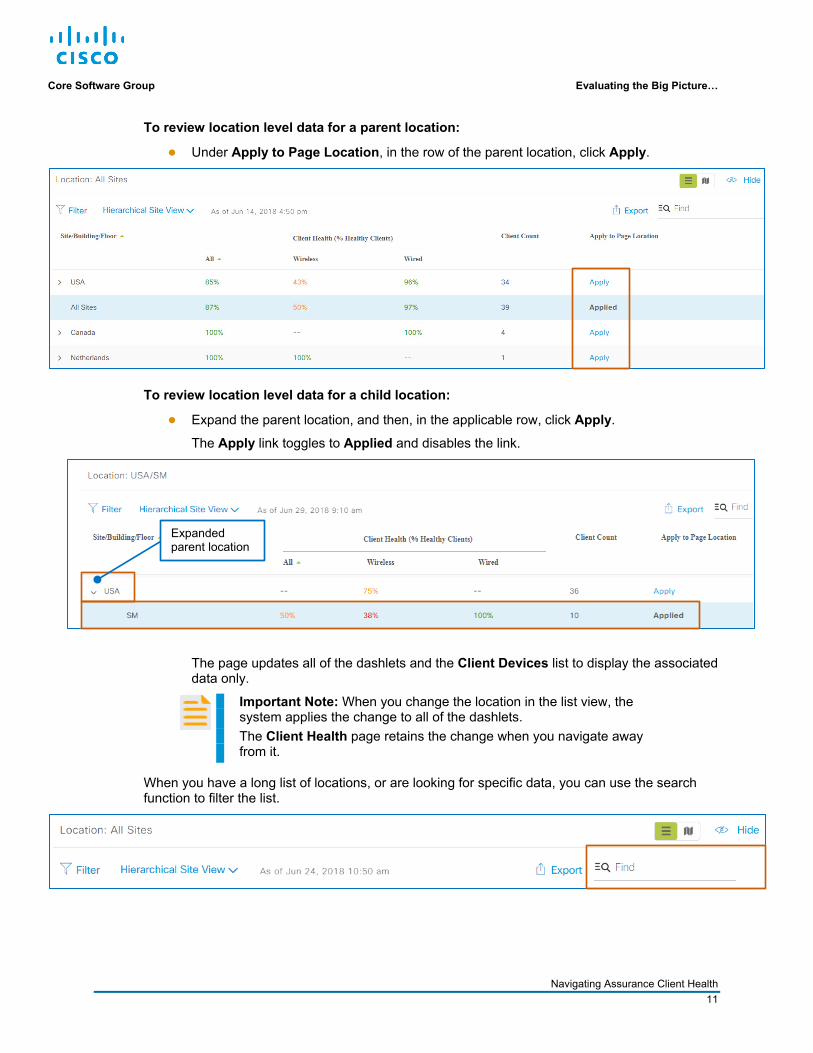
To review location level data for a parent location:
● Under Apply to Page Location, in the row of the parent location, click Apply.
To review location level data for a child location:
● Expand the parent location, and then, in the applicable row, click Apply.
The Apply link toggles to Applied and disables the link.
The page updates all of the dashlets and the Client Devices list to display the associated data only.
Important Note: When you change the location in the list view, the system applies the change to all of the dashlets. The Client Health page retains the change when you navigate away from it.
When you have a long list of locations, or are looking for specific data, you can use the search function to filter the list.
Expanded parent location

Core Software Group Evaluating the Big Picture…
Navigating Assurance Client Health 12
To filter the list:
● In the Find field, begin typing a character string that the data includes.
As you type, the list updates to display all of the items that match the criteria.
Where Do I Find Client Health Organized…
…By SSIDs (WLANs)?
You can display client health states, metrics, and the device list for all of the enterprise SSIDs or a specific SSID.
The Client Health page displays information for all of the configured SSIDs by default.
To review the health, metrics, and devices associated with a specific SSID:
● In the SSID drop-down list, select the SSID name.
The page updates to display the specific metrics for the SSID that you selected.
Important Note: The SSID drop-down list is the only indicator on the page that you have applied this filter to the data on the page. Refer to all of the settings to identify the data that you are seeing.
SSID drop-down list

Core Software Group Evaluating the Big Picture…
Navigating Assurance Client Health 13
…By Radio Frequencies?
The Client Health page displays information for client endpoints on the 2.4 GHz and 5 GHz radio band frequencies combined, by default.
To review metrics and endpoints associated with a specific radio band frequency:
● In the radio bands drop-down list, select the frequency.
The page updates to display the specific metrics for the radio band frequency that you selected.
Important Note: The radio bands drop-down list is the only indicator on the page that you have applied this filter to the data on the page. Refer to the all of the settings to identify the data that you are seeing.
Radio bands drop-down list
Specific radio band frequency

Core Software Group Evaluating the Big Picture…
Navigating Assurance Client Health 14
What Are the Common Page Features?
Dashlet Chart Elements on the Client Health Page
Chart elements include time interval tabs. Based on the time interval, the dashlet displays different chart types, such as bar or scatter charts.
For more information about a specific data element on the chart, you can point to it. This action opens a pop-up window with such details as affected numbers or percentages of clients, or of the metrics that the element represents.
Point to a data element for more information.
Time interval tabs

Core Software Group Evaluating the Big Picture…
Navigating Assurance Client Health 15
Detailed Information Panels
Most Client Health dashlets provide access to detailed information on panels by using their View Details links.
The information opens in a panel on the right of the application and overlays the page.
View Details links
View Details links
Open panel
Core Software Group Evaluating the Big Picture…
Navigating Assurance Client Health 16
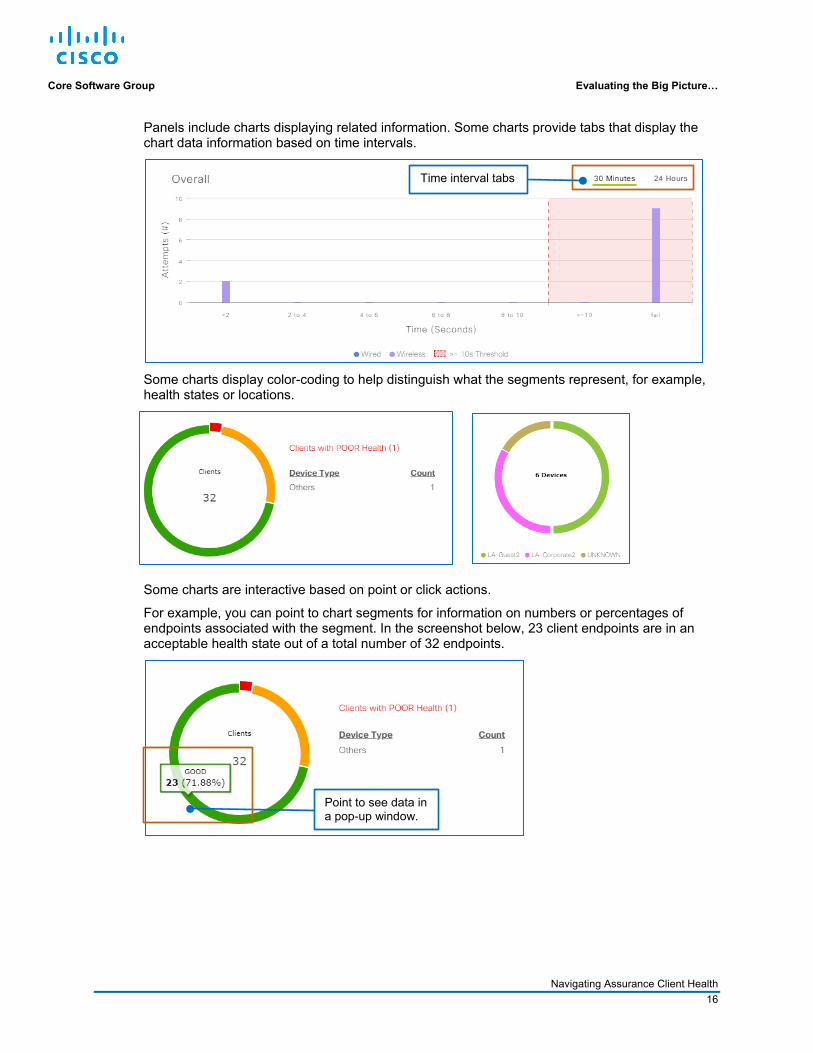
Panels include charts displaying related information. Some charts provide tabs that display the chart data information based on time intervals.
Some charts display color-coding to help distinguish what the segments represent, for example, health states or locations.
Some charts are interactive based on point or click actions.
For example, you can point to chart segments for information on numbers or percentages of endpoints associated with the segment. In the screenshot below, 23 client endpoints are in an acceptable health state out of a total number of 32 endpoints.
Time interval tabs
Point to see data in a pop-up window.

Core Software Group Evaluating the Big Picture…
Navigating Assurance Client Health 17
When you click a segment, the information beside the chart updates to display the data associated with the chart and the endpoint list updates to display the applicable endpoints.
In the screenshot below, when you click the red chart segment representing a poor health state, the endpoint list Health filter changes to indicate the health state and lists the applicable endpoints.
Panels also can contain tabs below the panel name so that you can see details based on specific device types, metrics, or other information on charts and in endpoint lists.
Tab navigation
Endpoint list filters
Endpoint list

Core Software Group Evaluating the Big Picture…
Navigating Assurance Client Health 18
Endpoint Lists
The Client Health page and all of the detailed information panels include a client endpoint list.
It lists the endpoints based on its Health and Data filter settings and any other active settings that are affecting what you see on the page and in the list.
To see the devices in a specific health state, in the device list:
● Beside Health, click the health state.
Endpoint list filters
Core Software Group Evaluating the Big Picture…
Navigating Assurance Client Health 19
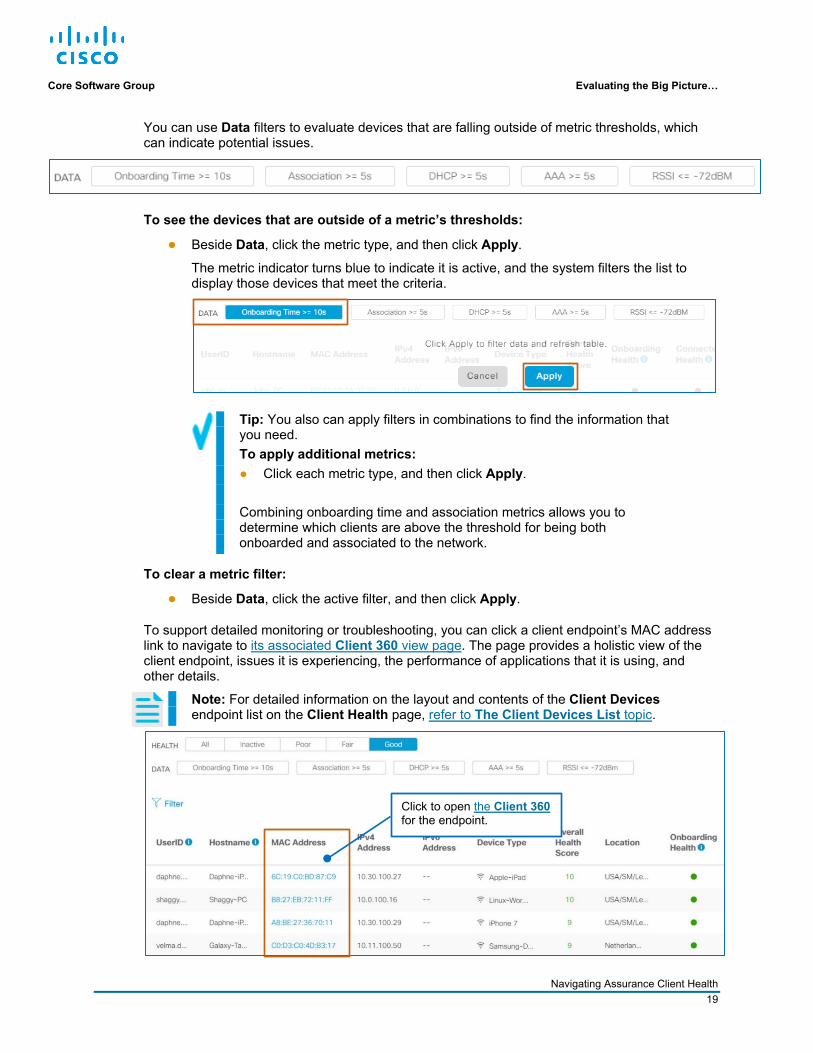
You can use Data filters to evaluate devices that are falling outside of metric thresholds, which can indicate potential issues.
To see the devices that are outside of a metric’s thresholds:
● Beside Data, click the metric type, and then click Apply.
The metric indicator turns blue to indicate it is active, and the system filters the list to display those devices that meet the criteria.
Tip: You also can apply filters in combinations to find the information that you need. To apply additional metrics: ● Click each metric type, and then click Apply. Combining onboarding time and association metrics allows you to determine which clients are above the threshold for being both onboarded and associated to the network.
To clear a metric filter:
● Beside Data, click the active filter, and then click Apply.
To support detailed monitoring or troubleshooting, you can click a client endpoint’s MAC address link to navigate to its associated Client 360 view page. The page provides a holistic view of the client endpoint, issues it is experiencing, the performance of applications that it is using, and other details.
Note: For detailed information on the layout and contents of the Client Devices endpoint list on the Client Health page, refer to The Client Devices List topic.
Click to open the Client 360 for the endpoint.

Core Software Group Evaluating the Big Picture…
Navigating Assurance Client Health 20
You can define a series of attributes for a more specific list.
To apply attribute filters:
● Click Filter, in each drop-down list, type or select each attribute parameter, and then click Apply.
When you apply attribute filters, they appear below the Filter link.
To clear a filter:
● Under Filter, click the X next to the filter that you want to remove. The list updates automatically.

Core Software Group Evaluating the Big Picture…
Navigating Assurance Client Health 21
How Can I Add or Position Dashlets?
Some dashlets in Client Health are not visible in the default layout. You can add these dashlets to the page. You also can position dashlets on the page for optimal visibility.
When you add or position dashlets, the system retains the changes when you navigate away from the page or log out of the system. Changes that you make do not affect other users’ layouts.
To add or position dashlets:
● On the Client Health page, in the Actions drop-down list, select Edit Dashboard.
The system makes the page available for editing and opens the Add Dashlet, Cancel, and Save buttons.
Add Dashlet button
Cancel and Save buttons

Core Software Group Evaluating the Big Picture…
Navigating Assurance Client Health 22
To view the available dashlets:
● Click Add Dashlet.
The Add Dashlet panel opens and lists all of the dashlets, including those that are visible on the page.
Tip: To see a dashlet layout to the right of the list: ● In the list, select the dashlet row.
Search Tips: To filter the list of dashlets by a category: ● Below Add Dashlet, in the drop-down list, select the category. To find a dashlet by using a character string: ● In the search field, begin typing a character string. The list updates
automatically to display all of the dashlets containing the string that you typed.
Search by character string Filter by category
Select a dashlet…
…to see its layout.

Core Software Group Evaluating the Big Picture…
Navigating Assurance Client Health 23
To add a dashlet or dashlets to the page: 1. Beside the name of each dashlet that you want to add, select the check box, and then
click Add.
The system adds each dashlet to the page.
2. To apply the changes to the page, click Save.
0.
To apply the changes, click Save.

Core Software Group Evaluating the Big Picture…
Navigating Assurance Client Health 24
To position dashlets on the page:
● Drag each dashlet to the position that you want, and then click Save.
●
Note: In addition to adding a dashlet to a page, you can configure a custom page, referred to as a dashboard, and then add and position dashlets on the page. For information on configuring and managing custom pages, refer to the Configuring a Custom Dashboard Page in the Assurance Features and Navigation training.
Drag each dashlet…
…and then, click Save.

Core Software Group Evaluating the Big Picture…
Navigating Assurance Client Health 25
What Affects the Information That I Am Seeing?
Time Periods and Time Stamps
Client Health displays provides a page level time stamp above the drop-down lists to indicate the last time that the page data was refreshed, which occurs when you first open the page or when you refresh the page manually.
This way, you can determine the age of the information and whether you need to update it manually.
Note: For detailed information on time stamps and data aging, refer to the Time Stamp and Data Aging Concepts topic in the Assurance Features and Navigation training.
When you open the Client Health page, the system displays the time period of the previous 24 hours up to the current system time of the device that you are using by default.
The ending time of the time period applied to the page appears at the top of each dashlet and each dashlet includes metrics up to that ending time.
Important Note: The time period drop-down list and the timeline slider work together to affect the time period for which you are seeing data. For example, you can select an earlier date or date range in the drop-down list, and then refine the time period further by using the slider. Refer to the time stamps on the page, in dashlets, and in lists to ensure that you are seeing the data that you expect. For additional information on time period settings, review the Changing the Time Period topic.
Time period drop-down list and timeline slider
Page level time stamp
Ending time of the time period applied to the page

Core Software Group Evaluating the Big Picture…
Navigating Assurance Client Health 26
Changing the Time Period
The time interval drop-down list provides time period selections of 3 hours, 24 hours, or 7 days based on your local client time, which constrains the start and end dates and times that you can select.
For example, if the date is 15 June and you select 7 days, the Start Date fields change to indicate the date of 8 June and local client time; the End Date fields indicate the current date and local client time.
Important Note: If you open the time interval drop-down list and select a start date that is different from today’s date and then make other time period changes, those changes remain when you open the drop-down list subsequently and change the time interval or date selections. For example, today’s date is 15 June and you change the start date to 12 June and apply it. The page updates to display the related data. Then, when you return to the calendar and change the date or time interval, the page refers to the 12 June date as its basis, not the current date. To reset the automated calendar updates when you change a time interval: ● Refresh the page.
To select a specific time period by using the time interval drop-down list: 1. To indicate the time interval by which you want to constrain the data, under Time Range,
click the applicable option button.
2. To indicate a custom time period based on the time constraint, in the Start Date and End Date fields, select the date and time periods.
3. Click Apply. 0.
You also can customize the time interval by using the timeline sliders.
To customize the view by selecting a specific time period on the timeline:
● Drag each timeline slider to the interval that you want to view, and then, click Apply.

Core Software Group Evaluating the Big Picture…
Navigating Assurance Client Health 27
When you change the time interval, the geographical map displays the health states for the time period...
…as does the list view.
The dashlets and device list also display data based on the time period that you apply.
The Client Health Summary dashlet displays metrics for the time period…

Core Software Group Evaluating the Big Picture…
Navigating Assurance Client Health 28
…most of the metrics dashlets include the 30 Minutes tabs and update the date range tabs to Custom tabs, which display the metrics for the time period that you applied…
…and the client count dashlets and the Client Devices list display the 5 Minutes tabs and update the date range tabs to Custom tabs, which display the metrics for the time period that you applied…
Custom time period tab
Custom time period tab
Custom time period tab

Core Software Group Evaluating the Big Picture…
Navigating Assurance Client Health 29
Persistent Filters on Page Navigation
When you apply specific settings to Client Health, those settings persist when you navigate away from the page. Persistent settings include changes to:
● The network location.
● The SSID.
● The radio frequency.
● The time period applied on the timeline.
When you return to the Client Health page, any changes that you made previously still apply.
To determine the location for the data that you are seeing, you can refer to the Location field, which is always visible, or the list view.
When you change settings by using the drop-down lists, the drop-down list is the only indicator on the page that the information is filtered.
Tip: Refer to the combination of the Location field and drop-down list settings to determine the data that you are seeing.
Location applied in list
Location field

Core Software Group How Are Client Health Metrics Looking?
Navigating Assurance Client Health 30
How are Client Health Metrics Looking? Get a Summary View of Client Health
What Will I See?
The Client Health Summary provides an overview of the numbers of clients in each health state.
Under All Clients, the system combines wired and wireless client health percentages into a single metric and provides a timeline of the combined metric based on the settings that affect what you see.
Under Wireless and Wired, the system displays health metrics by client type, which helps you to determine which portions of the network might need more attention, and provides links to detailed information.
Note: The system does not display health metrics for inactive clients because they are not connected to the network.
The system does not include inactive clients in the combined percentage.
Wireless summary Combined summary Wired summary

Core Software Group How Are Client Health Metrics Looking?
Navigating Assurance Client Health 31
Under Wireless and Wired, the dashlet indicates the percentage of client endpoints in a healthy state.
Each chart indicates the total number of active endpoints, which means that they are attached to and authenticated on the network, the segments represent the number of endpoints in all applicable health states, and a list indicates the endpoints in the most critical health state.
To see the number and percentage of clients that are experiencing the health state that the color-coding indicates, you can point to that segment of the chart.
Below Wireless and Wired, you can access and review detailed wired or wireless client metrics.
Open wireless metrics details.
Open wired metrics details.

Core Software Group How Are Client Health Metrics Looking?
Navigating Assurance Client Health 32
When you open details, the Clients panel opens, overlaying the page. In the panel, the associated tab is active based on the dashlet in which you clicked View Details.
The panel filters to indicate the number of clients in the most critical health state automatically.

Core Software Group How Are Client Health Metrics Looking?
Navigating Assurance Client Health 33
Where Do I Find…
…Client Onboarding Attempts and Lengths of Time until Onboarded?
The Client Onboarding Times Dashlet
The Client Onboarding Times dashlet, which is visible by default, displays aggregated wired and wireless client endpoint onboarding attempts and the lengths of time until onboarding process is completed in ranges of seconds.
Onboarding time includes the time that it takes to complete each stage of the onboarding process, including the time that it takes for the endpoint to associate to and be authenticated by the network, and to obtain an IP address by using DHCP.
In the 30 minute chart view, the chart emphasizes onboarding times that exceed the system-defined threshold for an acceptable onboarding and failures to onboard in the red highlighted area.
Onboarding time threshold overages and failures

Core Software Group How Are Client Health Metrics Looking?
Navigating Assurance Client Health 34
The Client Onboarding Times Panel
In the panel, the Overall tab is active and displays times for the entire process, and the device list is filtered to display the endpoints that are experiencing onboarding times that are above the acceptable threshold.
The other tabs provide insight into the health of the client during each stage of onboarding, including association, authentication (AAA), and obtaining an IP address (DHCP).

Core Software Group How Are Client Health Metrics Looking?
Navigating Assurance Client Health 35
…The Signal Strengths That Endpoints are Receiving (RSSIs)?
The Connectivity RSSI Dashlet
The Connectivity Received Signal Strength Indicator (RSSI) dashlet, which is visible by default, indicates the RSSI distribution for all client endpoints.
The dashlet displays the percentage of endpoints receiving signal strengths in each dBm range. In the screenshot below, there are no client endpoints experiencing signal strengths that are below the pre-defined system threshold.
The Connectivity RSSI Panel When you open the panel, the device list displays any client endpoints with metrics that are below the acceptable RSSI threshold.
Signal strengths below the acceptable threshold
Data filter default selections on page entry

Core Software Group How Are Client Health Metrics Looking?
Navigating Assurance Client Health 36
…Signal-to-Noise Ratios for Client Endpoints?
The Connectivity SNR Dashlet
The Connectivity Signal-to-Noise Ratio (SNR) dashlet, which is visible by default, indicates the SNR values for all client endpoints.
The dashlet displays the percentages of endpoints experiencing signal-to-noise ratios in each dB range. In the screenshot below, there are no endpoints with SNRs below the pre-defined system threshold.
The Connectivity SNR Panel
When you open the panel, the device list displays all of the endpoints that are below the acceptable SNR threshold by default.
Percentage of endpoints with signal-to-noise ratio below the acceptable threshold
Data filter default selections on page entry

Core Software Group How Are Client Health Metrics Looking?
Navigating Assurance Client Health 37
…The Number of Clients That Are Associated To Each SSID?
The Client Count per SSID Dashlet
The Client Count per SSID dashlet, which is visible by default, displays the total number of clients that are associated to all of the SSIDs on the network.
Each segment represents an SSID. The chart represents each SSID in color-coding to distinguish them in the chart with a legend below it.
When the system fails to capture the client count for an SSID, it identifies those SSIDs as UNKNOWN.

Core Software Group How Are Client Health Metrics Looking?
Navigating Assurance Client Health 38
The Client Count per SSID Panel When you open the panel, it displays dashlet chart and the list displays all of the endpoints associated to all of the SSIDs for all health states.
The list provides health filters for each health state, and data filters so that you can see the number of endpoints that are exceeding acceptable onboarding thresholds, including total onboarding time and the time for each stage of the onboarding process.
Data filters for total onboarding time and each stage of the onboarding process

Core Software Group How Are Client Health Metrics Looking?
Navigating Assurance Client Health 39
…The Number of Clients That Are Using Each Radio Band Frequency?
The Client Count per Band Dashlet The Client Count per Band dashlet, which is visible by default, displays the total number of client endpoints that are using the 2.4 GHz or 5GHz radio band frequencies.
Each segment represents the number and percentage of endpoints on each band.

Core Software Group How Are Client Health Metrics Looking?
Navigating Assurance Client Health 40
The Client Count per Band Panel
When you open the panel, it displays the dashlet chart and the list displays all of the endpoints associated to all of the SSIDs for all health states.
The list provides health filters for each health state.
The data filters include seeing the number of endpoints:
● That are exceeding acceptable onboarding thresholds, including total onboarding time and the time for each stage of the onboarding process.
● That are exceeding the acceptable RSSI threshold.
Data filter for total onboarding time and each stage of the onboarding process

Core Software Group How Are Client Health Metrics Looking?
Navigating Assurance Client Health 41
…The Physical Link Health of Wired Clients?
The Connectivity Physical Link Dashlet
The Connectivity Physical Link dashlet, which is visible by default, displays the number of devices with physical links that are up or down, or that contain errors
Physical links are wired connections between endpoints and the network, such as network cables.
In the chart, the color-coding represents:
● Green (Up) Endpoint links that are connected physically
● Yellow (Errors) Endpoint connections that are experiencing issues or errors, such as dropped or corrupt packets or mismatches in the packet and frame size configuration
● Red (Down) Endpoint links that are not connected physically

Core Software Group How Are Client Health Metrics Looking?
Navigating Assurance Client Health 42
The Connectivity Physical Link Panel
When you open the panel, it displays the dashlet chart and the list displays all of the endpoints in all health states.
The list provides health filters for each health state.

Core Software Group How Are Client Health Metrics Looking?
Navigating Assurance Client Health 43
…The Numbers of DNS Requests and Responses per Minute?
The DNS Dashlet
The DNS dashlet, which is a dashlet that you can add to the page, displays:
● The average number of DNS requests and responses that client endpoints have made or received at one minute time intervals within a 30 minute time period based on the time stamp.
● The total number of DNS requests and responses that client endpoints have made or received in a 30 minute time period based on the time stamp.
Extensive DNS response times can indicate endpoints’ failures to obtain DNS server responses when, for example, the server is unreachable or is not responding to queries.

Core Software Group How Are Client Health Metrics Looking?
Navigating Assurance Client Health 44
…Health Metrics and Attributes for Client Devices?
The Client Devices List
Client Devices lists each client endpoint that is active during the time interval indicated on the tab and based on other settings that can affect the information that you see.
On page entry, the list displays all of the endpoint types, wired and wireless, in all health states.
Important Note: When you navigate to a different area of Assurance, or make a change to the time interval, the Client Devices list refreshes to display endpoints in all health states.
When the Cisco DNA Center deployment includes an Identity Services Engine (ISE) that is integrated for Assurance, the UserID field indicates the network user for wired and wireless clients.
For wireless clients, the Hostname field indicates the device’s name by obtaining the data from the WLC.
The MAC Address link indicates the NIC card in the device that is connected to the network and provides a link to the endpoint’s Client 360 page.

Core Software Group How Are Client Health Metrics Looking?
Navigating Assurance Client Health 45
Either the IPv4 Address or the IPv6 Address field indicates the applicable IP address to which the endpoint is connected.
The Device Type indicates the specific type of device that is connected to the endpoint.
The device type indicates Unknown when the system cannot obtain the information from ISE.
The Overall Health Score of each client indicates the sum of the onboarding and connected health scores, up to a maximum of 10.
The Onboarding Health indicator indicates a score color-code based on whether the endpoint onboarding process occurred within an acceptable range.
The Connected Health indicator indicates a score color-code based on whether the endpoint remains in an acceptable range after the system has authenticated and associated it successfully.
Note: The Client Device list only shows clients with completed health score calculations. Because client health score calculations occur every 5 minutes, newly onboarded clients or clients with pending health score calculations might not appear in the device list.
For detailed information on health scoring concepts related to time stamps, refer to the Time Stamp and Data Aging Concepts Page in the Assurance Features and Navigation training.

Core Software Group How Are Client Health Metrics Looking?
Navigating Assurance Client Health 46
Client Devices also lists the following for each endpoint:
● The network device to which it is connected
● The endpoint’s location in the network hierarchy
● VLAN identifier
● For wireless devices:
The SSID to which it is connected
The AP group to which it belongs
The radio band frequency it is using.
Note: For client endpoints that Assurance does not recognize, the SSID, AP Group, and Band attributes in the list are blank.

Core Software Group How is a Specific Client Endpoint Doing?
Navigating Assurance Client Health 47
How is a Specific Client Endpoint Doing? Get a Holistic View on the Client 360
What Will I See?
The Client 360 page provides information and insights for a specific client endpoint, including:
● A timeline that displays the client endpoint experience at a certain time.
● Issues that affect the endpoint. (Issues)
● The onboarding topology, the health and other details of devices on the topology and the states of each stage of onboarding (association, authentication, IP address assignment). (Onboarding)
● A list of specific events that Cisco DNA Center is capturing. (Event Viewer)
● A tool that evaluates the path that traffic is using between the endpoint and a specific destination point. (Path Trace)
● The applications that the endpoint is accessing and their health. (Application Experience)
● Additional device attributes and metrics. (Detail Information)
Review the health state of an endpoint over time in the timeline
Click a link to navigate to the associated section below.

Core Software Group How is a Specific Client Endpoint Doing?
Navigating Assurance Client Health 48
When you open a Client 360 page, the page displays data for the past 24 hours by default.
You can change the time period by using the drop-down list or the timeline to evaluate data related to that interval for more detailed analysis.
Note: When you apply a different time period and navigate away from the page, the setting does not persist. When you return to the page, the 24-hour default setting applies.
You also can evaluate a specific point in time by using the timeline, which can be helpful when resolving issues.
Note: For more information, refer to the What Was a Client Endpoint Experiencing at a Certain Time? topic.
In SD-Access deployments, you can apply client-related data for a specific fabric domain by using the domain drop-down list.
Time period drop-down list
Interactive timeline
Domain drop-down list

Core Software Group How is a Specific Client Endpoint Doing?
Navigating Assurance Client Health 49
How Do I Open the Client 360 Page for a Specific Endpoint?
For a single endpoint, you can open Client 360 pages by using:
● The Cisco DNA Center global search feature on the Client Health page.
● The MAC address links available in endpoint lists on the Client Health page and on dashlet detailed information panels.
To open a Client 360 page for a single endpoint by using the global search feature: 1. On the application toolbar, click the global search icon.
The Search dialog box opens.
2. In the Search field, begin typing the character string for the search.
Note: Your search can include characters in the endpoint’s MAC address, host name, the user ID, which is authenticated by the ISE server, or the endpoint IP address.
A list of results matching the characters that you type begins populating automatically.
Global search icon
Begin typing a character string…
…for a list of results.

Core Software Group How is a Specific Client Endpoint Doing?
Navigating Assurance Client Health 50
3. To indicate the endpoint that you want to see, in the results list, select the item.
The dialog box provides information about the endpoint and links to more information to the right of the search results.
4. To open the Client 360 page for the endpoint, click the Client 360 link.
0.
To open a Client 360 by using a MAC address link:
● In the Client Devices list, click the MAC address link for the endpoint of interest.
Note: Endpoint lists in panels also provide navigation links to the Client 360 page.
Click to open the Client 360 page.
Click a link to open the Client 360 page.

Core Software Group How is a Specific Client Endpoint Doing?
Navigating Assurance Client Health 51
The following screenshot illustrates the information available on a Client 360 page for an endpoint.

Core Software Group How is a Specific Client Endpoint Doing?
Navigating Assurance Client Health 52
Where Do I Find…
…Issues That Are Affecting the Endpoint?
Issues lists the problems that are affecting the endpoint. The system identifies issues by computing, analyzing, and correlating incoming data and correlating the data with system-defined metrics.
Providing this information with links for immediate access to details helps to ensure that potential or ongoing problems receive more immediate attention or action, as needed.
Tip: For your reference, Assurance provides an issue catalog that categorizes and lists the issues that Cisco DNA Center presents. To open the list: ● Click Issues, and then, below the toolbar, click View Issue Catalog.
The catalog provides tabs for each issue category.
Issue categories
Click Issues…
…click View Issue Catalog…

Core Software Group How is a Specific Client Endpoint Doing?
Navigating Assurance Client Health 53
For each category, the issues in the list include descriptions and possible root causes for them. You can select an issue to see its related information.
Entries in the list are open and are occurring or have occurred during the time period that the page indicates in the time interval drop-down list or on the timeline.
The time stamp beside the issue indicates its most recent occurrence. The number of occurrences of the problem appear below the description link.
To review issue details, under the issue heading:
● Click the issue description link.
A panel opens, overlaying the page.
Issue description link
Number of occurrences
Time stamp of most recent occurrence
Select an issue… …to review its description and possible causes

Core Software Group How is a Specific Client Endpoint Doing?
Navigating Assurance Client Health 54
The panel provides:
● The option to change the issue status from Open to Resolve.
● A description of the issue.
● Based on the type of issue and its complexity, related charts and metrics.
● Areas and numbers of clients that the issue affects.
● Suggestions to correct the issue, and depending on issue, the ability to run commands that retrieve additional information or provide corrective suggestions.
When issues are complex, the panel can provide various charts and information on the issue.
When you determine that an open issue is no longer a problem, you can resolve the issue.
To indicate that the issue is resolved:
● In the Status drop-down list, select Resolve. This action moves the issue to the Resolved Issues list.
Important Note: You cannot move or change the status of a resolved issue.
Information pages with scroll navigation

Core Software Group How is a Specific Client Endpoint Doing?
Navigating Assurance Client Health 55
Finally, you can review a list of actions you can take to help more clearly identify or resolve the issue.
When suggestions are collapsed, you can expand them to see a list of associated steps that you can take.
Some suggested actions can contain commands that you can run to obtain additional information or additional corrective suggestions.

Core Software Group How is a Specific Client Endpoint Doing?
Navigating Assurance Client Health 56
…A List of Resolved Issues and Their Details?
Under Issues, you can access a list of previous issues that affected the endpoint that either the system resolved automatically or a system user resolved manually.
This information can provide deeper insight when you are working to evaluate or resolve current issues.
To open the list of resolved issues:
● Below the Issues list, click Resolved Issues.
A panel opens with a list of resolved issues and includes the date that the issue was resolved.
When the system automatically or system users manually resolve issues, the Resolved Issues list retains the issue for 14 days, and then removes it from the list.
Important Note: You cannot move or change the status of a resolved issue.
Open the list of resolved issues that the endpoint experienced.

Core Software Group How is a Specific Client Endpoint Doing?
Navigating Assurance Client Health 57
…The Endpoint’s Network Path and the Health of Devices on the Path?
Onboarding displays the device topology that is connecting the endpoint to the network, the health of those devices, and the status of the AAA and DHCP services.
The following screenshot illustrates the onboarding process for a wireless client. In this example, the client endpoint Daphne-PC connects to the hierarchical group LA-Corporate2’s SSID on a specific AP in that group, which is joined to a WLC in the LA1 group in the network hierarchy.
A green checkmark beside AAA indicates that the client successfully associated and authenticated to the network.
Note: When a client is onboarding by using open authentication, the AAA status indicator does not appear.
A green checkmark beside DHCP indicates that the client obtained an IP address.
A red cross beside either service indicates that the service has failed.
Note: When a service fails during onboarding, the system also captures the corresponding issue in the Issues list on the Client 360 page.
When no services are listed, an issue has occurred during the onboarding process, but the system has not captured any events related to the AAA or DHCP service.
Tip: In this case, you can refer to the Issues list to review the events that the system captured.
Successfully running services

Core Software Group How is a Specific Client Endpoint Doing?
Navigating Assurance Client Health 58
The color-coded number beside the endpoint icon indicates the health of its connectivity.
Color-coded numbers beside device icons indicate their overall health based on applicable metrics. The numbers in parentheses below device icons indicate the number of devices connected to it.
The numbers in parentheses below devices indicate the number of devices connected to it.
You can point to an endpoint icon to see more information.
You can point to a device icon to see device attributes and access a link to its Device 360.
Point to a device to see related information.
Click to open the device’s Device 360 page.
Device health indicator with score
Number of devices connected to the device Health of endpoint
connectivity

Core Software Group How is a Specific Client Endpoint Doing?
Navigating Assurance Client Health 59
…Endpoint-Related Events and Their Statuses?
The Event Viewer lists the following endpoint-related events that the system collects for the 24-hour time period.
The Event Viewer includes information about the following events:
● Re-authentication
● Broadcast encryption rekey
● Onboarding processes
● Intra-roaming of the endpoint among access points
● Application response times that the endpoint is experiencing
Beside each event, color-coding indicates the event’s success or failure.
It also has an area to display event details when you select one for review.
Event list
Event details area

Core Software Group How is a Specific Client Endpoint Doing?
Navigating Assurance Client Health 60
To see a list of contributing events:
● In the list of events, expand an item.
The item opens a list of the additional actions related to that event and their statuses.
Select an event in the list to see its details.
Expand to see the list of events contributing to the root event.
Select an item to see more details in the preview window.

Core Software Group How is a Specific Client Endpoint Doing?
Navigating Assurance Client Health 61
…The Tool for Evaluating the Path That Traffic Is Using?
Path Traces for Flow Mapping and Path Health
Path Trace provides the tool that you can use to map the complete path that client traffic is taking from the IP address to which a client is connected to its destination, such as a server or printer.
Running a path trace supports monitoring and troubleshooting end-to-end connectivity, such as when you are evaluating issues.
When you initiate a path trace, Cisco DNA Center reviews and collects network topology and routing data from the devices supporting the traffic. It calculates and displays the path between a client endpoint and its destination in a path trace topology. Following is an example of a complete path trace.
A completed path trace displays:
● The path direction.
Note: The Path Trace tool provides the flexibility to run a path trace from any source to any destination to support troubleshooting. For example, you can run a separate path trace to evaluate the reverse direction of the flow, when that is helpful.
● Each intermediate network device that traffic is using to traverse to its destination and
their protocols, its health state, and the number of endpoints connected to it.
Path direction indicator
Legend icon

Core Software Group How is a Specific Client Endpoint Doing?
Navigating Assurance Client Health 62
● Above the topology, a description of the path with a time stamp indicating the most recent time that you ran the path or the system refreshed it.
● To the right of the trace topology, a legend defining the device icons and link types.
● Based on items that you can select for the path trace to identify:
At each ingress and egress interface, each access control list (ACL) on that interface that match the criteria that you indicate when you configure the path trace.
■ Permit ACLs appear in green color-coding.
■ Deny ACLs appear in red color-coding.
■ When there is lack of data, such as a missing source or destination interface or protocol, in the trace configuration, the trace returns an ACL result in black color-coding.
Device level CPU and memory utilization statistics.
Interface level ingress or egress drops.
● For wireless clients, the CAPWAP tunnel that is connecting the access point to the WLC to which it is joined.

Core Software Group How is a Specific Client Endpoint Doing?
Navigating Assurance Client Health 63
You can point to a device to see device details and access a link to the Device 360 page, which can provide insight when troubleshooting a problem.
You can point to a link to see the protocol running between two devices.
You can point to ingress and egress interface icons for a device to see the interface that the path is using, the VLAN that the interface is using and packet drop metrics.
When you include interface statistics in the trace, you can click More Details to open a panel with the detailed interface statistics.
Tip: If a link in a pop-up window does not respond, rerun the path trace or refresh the page to enable it.
Point to a link…
…to see the protocol.
Point to a device icon…
…or open the Device 360 page.
…to see its name and statistics, if included in the trace…
Point to an ingress or egress interface…
…to see summary interface information….
…or open a panel with detailed interface statistics.
Panel

Core Software Group How is a Specific Client Endpoint Doing?
Navigating Assurance Client Health 64
When you run a path trace with ACL results, you can point to an ACL icon to see the ACL name and its rule.
How Do I Prepare To Run a Path Trace?
Before you begin a path trace, ensure that the system inventory contains all of the devices, such as routers, switches, Cisco WLCs, and access points, between the source device and destination device, and that they are in a managed state.
To do so, you can review Inventory page, which you can access on the Cisco DNA Center home page.
When you need to run a path trace for a specific interface or port on either the source or destination device, obtain each interface and port number that you need.
Validate the managed state of devices under Last Sync Status.
Core Software Group How is a Specific Client Endpoint Doing?
Navigating Assurance Client Health 65
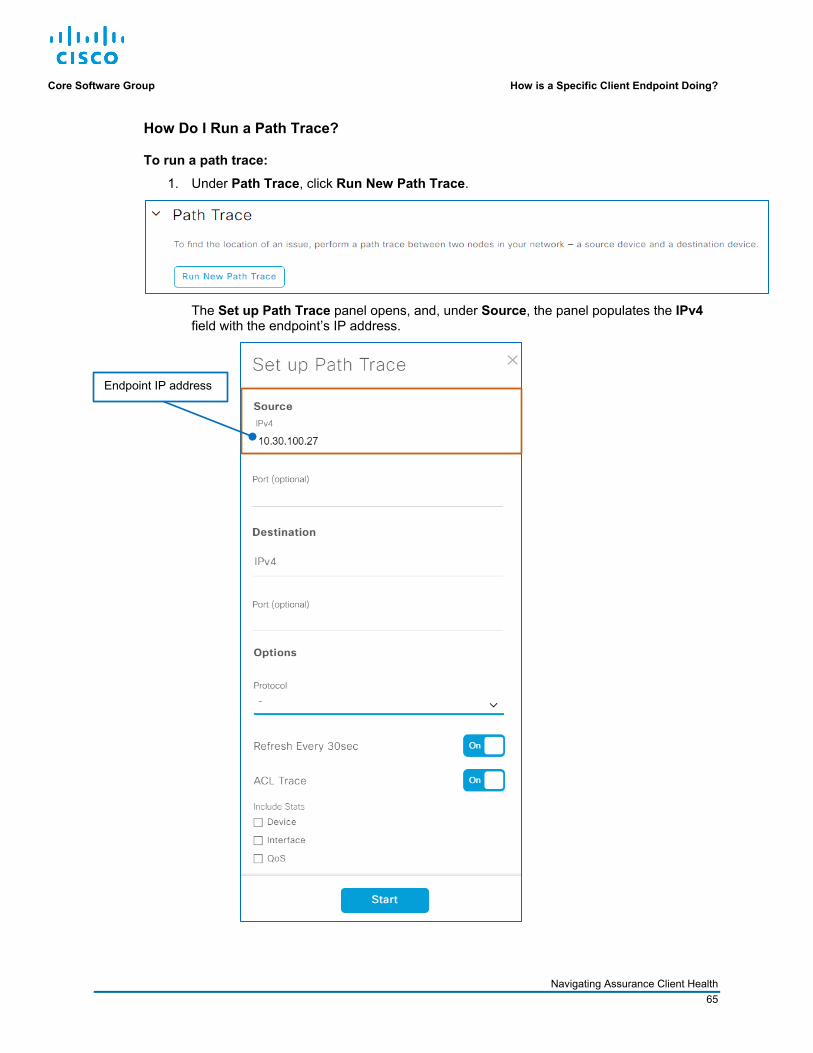
How Do I Run a Path Trace?
To run a path trace: 1. Under Path Trace, click Run New Path Trace.
The Set up Path Trace panel opens, and, under Source, the panel populates the IPv4 field with the endpoint’s IP address.
Endpoint IP address

Core Software Group How is a Specific Client Endpoint Doing?
Navigating Assurance Client Health 66
2. To identify the client endpoint at which you want the trace to start, under Source:
a. In the IPv4 field:
● To use the endpoint IP address, validate and accept the default address that the panel populated.
● To select another endpoint or identifier, click the field, and then, in the drop-down
list select the endpoint.
Note: For added flexibility during troubleshooting, you can select any source or destination endpoint to run the trace. This way, you do not need to navigate to another 360 page to run the trace of interest.
Tip: You can filter the list to find the endpoint that you need by typing an IP address, a host name, a user name, or an application name. The list filters automatically as you type to display the results that match the string.

Core Software Group How is a Specific Client Endpoint Doing?
Navigating Assurance Client Health 67
b. Optionally, to identify the interface on which you need to start the trace, in the Port field, type the interface number.
.
.
3. Under Destination, to indicate the point at which you want to end the trace.
a. In the IPv4 field, click the field, and then, in the drop-down list, type or select the destination IP address.
Tip: The Destination | IPv4 field accepts IP addresses only, but you can filter the drop-down list by using any criteria that is included in the description. Begin typing to filter the list, which populates automatically as you type with the results that match the string.
Based on the type of device you select for the destination, the panel also opens the Interface field above the Port field.

Core Software Group How is a Specific Client Endpoint Doing?
Navigating Assurance Client Health 68
b. Optionally, to indicate the interface on which you need to start the trace, in the Interface field, type the interface number.
c. Optionally, to indicate a specific port on the interface, in the Port field, type the port number.
.
4. Optionally, to indicate a specific protocol for Cisco DNA Center to use to establish the path trace connection, in the Protocol drop-down list, select tcp or udp.
5. To indicate whether the system runs the trace at 30 second intervals:
● To run the trace every 30 seconds, accept the default selection of On.
● To run the trace once and evaluate the results, toggle the button to Off.
Note: The trace will continue to refresh as long as it is available on the page. Rerunning a path trace at 30 second intervals can be helpful for ongoing troubleshooting, for example, when a network user is experiencing issues connecting to a specific device.
6. To indicate whether devices on the trace contain access control lists (ACLs) that match trace criteria:
● To see the ACL indicators, accept the default selection of On.
● To not see ACL indicators, toggle the button to Off.
Important Note: When you include source or destination interfaces or ports, or protocol options in the path trace, the ACL trace results will include only those ACLs that apply based on the combination of items that you defined or selected. That means that there can be one or more ACLs on the interface that do not appear in the path trace results.

Core Software Group How is a Specific Client Endpoint Doing?
Navigating Assurance Client Health 69
7. To configure the path trace to collect additional metrics, under Include Stats:
● To see device level CPU and memory statistics, select the Device check box.
● To see ingress or egress interface drop statistics, select the Interface check box.
Tip: The quality of service statistics are available for routers only and return a subset of complete QoS data. To ensure that you see the data that you want on any device, run the QoS command directly of that device.
8. To run the trace, click Start.
The panel closes automatically, and the system indicates that the trace is in progress.
0.
When the path trace is complete, the system displays the topology results based on the settings in the trace configuration.
To clear a path trace or run a subsequent one:
● Manually refresh the page by using the browser button.

Core Software Group How is a Specific Client Endpoint Doing?
Navigating Assurance Client Health 70
…Application Use and Health?
You can review the health and metrics of applications that an endpoint is running under Application Experience in the Client 360.
Important Note: To collect application quantitative and qualitative metrics, a user must enable Cisco NetFlow data collection and apply the applicable telemetry profile by using Cisco DNA Center on the routers that are managing the traffic.
You also can use Application Experience to troubleshoot clients that onboard successfully but experience throughput or other issues based on an application’s qualitative metrics.
Application Experience categorizes applications by using the network-based application recognition (NBAR) engine’s standard classifications:
● Business Relevant Applications that are critical to business. Examples: Microsoft Outlook and Cisco WebEx.
● Business Irrelevant Applications that are not critical to business. Examples: YouTube and Netflix.
● Default Applications that the NBAR engine cannot identify in its classifications.
NBAR category tabs

Core Software Group How is a Specific Client Endpoint Doing?
Navigating Assurance Client Health 71
Application Experience determines the health score of an application by calculating packet loss and network latency. Under Most Recent, it presents the health score in color code for the most recent calculation.
To see application health details over the last 24 hours:
● Under Health, in the Last 24 Hours column, for the application of interest, point to View.
A pop-up window opens and displays the trend of the application’s health score for the previous 24 hours and is not interactive. The red dot indicates the current time.
Under Usage, Bytes indicates the number of bytes exchanged between each application and the endpoint.
Percentage indicates the amount of traffic each application is generating out of the total application traffic being exchanged with the endpoint.
Pop-up window with trend timeline
View link

Core Software Group How is a Specific Client Endpoint Doing?
Navigating Assurance Client Health 72
Under DSCP, to indicate each application’s quality of service attributes, Marking indicates each application’s DSCP classification.
Preservation indicates whether the application setting that retains the application’s DSCP class as its traffic traverses the network is enabled.
You also can see each application’s average throughput of traffic between the client and servers and its QoS traffic class.
NetFlow data from routers provides the average and maximum percentages for:
● The packet loss that the client is experiencing.
● The latency occurring for the client on the network.
● The amount of time application server delay, which is, for Real-time Transport Protocol (RTP)-based applications, such as voice over IP or video streaming applications, the time that it takes the server to respond to a request from the application.

Core Software Group How is a Specific Client Endpoint Doing?
Navigating Assurance Client Health 73
To see application throughput and qualitative metrics charts for a specific application:
● Beside the application of interest, click the option button.
The Application Experience panel opens and overlays the page. The panel provides interactive charts with metrics’ behavior over the 24-hour time period.
You can point to any chart to see all of the metrics for a specific time.
Application option button

Core Software Group How is a Specific Client Endpoint Doing?
Navigating Assurance Client Health 74
Application Experience also provides access to the Application 360 page for each application that is running on the client.
Links to open application based 360 pages

Core Software Group How is a Specific Client Endpoint Doing?
Navigating Assurance Client Health 75
…More Metrics and Detailed Information?
The Detail Information Section
Under Detail Information, the Client 360 page includes the following tabs with more device information and metrics.
● Device Info Device attributes and connection information
● Connectivity Charts that map the number of bytes that the device transmits (Tx) and receives (Rx), and DNS request and response times for the last 24 hours
● RF Charts that illustrate the signal strength in relation to noise levels for the last 24 hours
● iOS Analytics When the device connected to the endpoint is an Apple® device, additional metrics, connectivity, and dissociation details
Note: iOS Analytics tab availability depends on the combination of the versions of the Apple device’s operating system, its hardware, and the Cisco access points.

Core Software Group How is a Specific Client Endpoint Doing?
Navigating Assurance Client Health 76
Reviewing Device Type and Connectivity Attributes
The Device Info tab lists device attributes and device connection information.
Reviewing Transmit / Receive Metrics and DNS Request / Response Times
The Connectivity tab provides charts that illustrate the following over a 24-hour period.
● The bytes that the device transmits (Tx) and receives (Rx)
● The DNS request and the DNS query response times

Core Software Group How is a Specific Client Endpoint Doing?
Navigating Assurance Client Health 77
The Tx (bytes) and Rx (bytes) charts include a threshold line to emphasize when the endpoint is transmitting or receiving packets that are below acceptable levels.
The charts also provide a comparison tool so that you can evaluate the metrics for a specific time side-by-side.
To compare the transmit and receive data for a specific time:
● On either chart, point to the time of interest. You can move the pointer along the timeline to see varying metrics.
Threshold indicator
To compare statistics, point to a time on either chart.

Core Software Group How is a Specific Client Endpoint Doing?
Navigating Assurance Client Health 78
Reviewing Signal Strength and Signal to Noise Metrics
For wirelessly connected clients, the RF tab provides charts that illustrate the following measurements over a 24-hour period:
● The signal strength that the endpoint is receiving (RSSI)
● The signal-to-noise ratio (SNR) that the device is experiencing
This information helps you to determine if the client is experiencing poor RF conditions, such as high noise levels or issues with the radio channel utilization, width, or mode.

Core Software Group How is a Specific Client Endpoint Doing?
Navigating Assurance Client Health 79
The RSSI and SNR charts include a threshold line so that you can evaluate when the endpoint is experiencing measurements that are below acceptable levels.
The charts also provide a comparison tool so that you can evaluate the metrics for a specific time side-by-side.
To compare the signal strength and signal-to-noise data for a specific time:
● On either chart, point to the time of interest. You can move the pointer along the timeline to see varying metrics.
To compare statistics, point to a time on either chart.
Threshold indicator

Core Software Group How is a Specific Client Endpoint Doing?
Navigating Assurance Client Health 80
Reviewing Apple® iOS Client Metrics and Connectivity to APs
When you select an endpoint to which an Apple® device is connected wirelessly, Detail Information includes the iOS Analytics tab, which displays.
● A list and the topology for the access point to which the device is connected and other available access points.
● A list of device disassociation actions.
Note: iOS Analytics tab availability depends on the combination of the versions of the Apple device’s operating system, its hardware, and the Cisco access points.
Neighbor APs presents the access point list and topology.
In the topology below the list, a solid line indicates the device’s active connection to an access point.
Dotted lines indicate access points to which the device also can connect.
iOS Analytics tab for Apple® wireless devices
Device’s active connection to an access point
Access point available to the device

Core Software Group How is a Specific Client Endpoint Doing?
Navigating Assurance Client Health 81
In general, when a client connects to an access point, it remains connected until there is reason to connect to a different access point or to disconnect. Devices join the nearest AP with the strongest signal based on the connection’s RSSI and SNR measurements.
Client Disassociation Details lists:
● Each time that the device disconnected from any access point and the reason that it disconnected.
● The access point to which the device was connected.
● The length of time that the device was connected.
● The location of the access point.

Core Software Group How is a Specific Client Endpoint Doing?
Navigating Assurance Client Health 82
What Was an Endpoint Experiencing at a Certain Time?
You can evaluate the health of an endpoint at a specific point in time by using the timeline.
This context supports issue troubleshooting, proactive responses to changing conditions, and helps to avoid similar problems in the future.
When you point the timeline:
● A pair of dotted lines indicate the pointer position on the timeline.
● The tooltip indicates the time period on which you are pointing.
● An information area below it expands with details about the state of the endpoint at that specific time.
● A Click to lock indicator opens, emphasizing the action that you can take to keep the information area visible when you move the pointer away from the timeline.
Click to lock indicator
Pointer position indicator
Pointer time period tooltip
Time period information area

Core Software Group How is a Specific Client Endpoint Doing?
Navigating Assurance Client Health 83
When you click a point on the timeline, the information area remains visible on the page when you move the pointer away from the timeline.
The time period information area provides the same information that the Client 360 page does for the state of the endpoint at that time.
Note: Locking a timeline point does not affect the 24-hour time period that is applied to the overall page.
The Client Health score is based only on those metrics that apply for the time period, which are listed under Onboarding and Connectivity. The metrics for which the score is reporting display color-code beside them.
Under Events, the information area indicates the number of successful or failed event that occurred at that time.
Onboarding metric contributing to health score
Connectivity metrics contributing to health score

Core Software Group How is a Specific Client Endpoint Doing?
Navigating Assurance Client Health 84
To see a complete list of events for the time period in the timeline:
● Below Events, click See Full List.
The link navigates to the Event Viewer section on the Client 360 page.
Click See Full List…
…to navigate to the Event Viewer list.

Core Software Group How Are All of a Single User’s Clients Doing?
Navigating Assurance Client Health 85
How Are All of a Single User’s Clients Doing? Get a Holistic View on the User-Based Client 360
What Will I See?
The user-based Client 360 page includes all of the devices that are associated with a single network user and provides the same information, features, and functions as the Client 360 for a specific client endpoint.
The system collects end user data from WLCs, and, based on the system configuration, also can:
● In deployments with an Identify Services Engine (ISE), identify the device type.
● In deployments with Cisco Connected Mobile Experiences (CMX), the endpoint device’s location.
The page provides tabs for each of the user’s connected devices.
Click a tab to see the data for the related device.
Core Software Group How Are All of a Single User’s Clients Doing?
Navigating Assurance Client Health 86
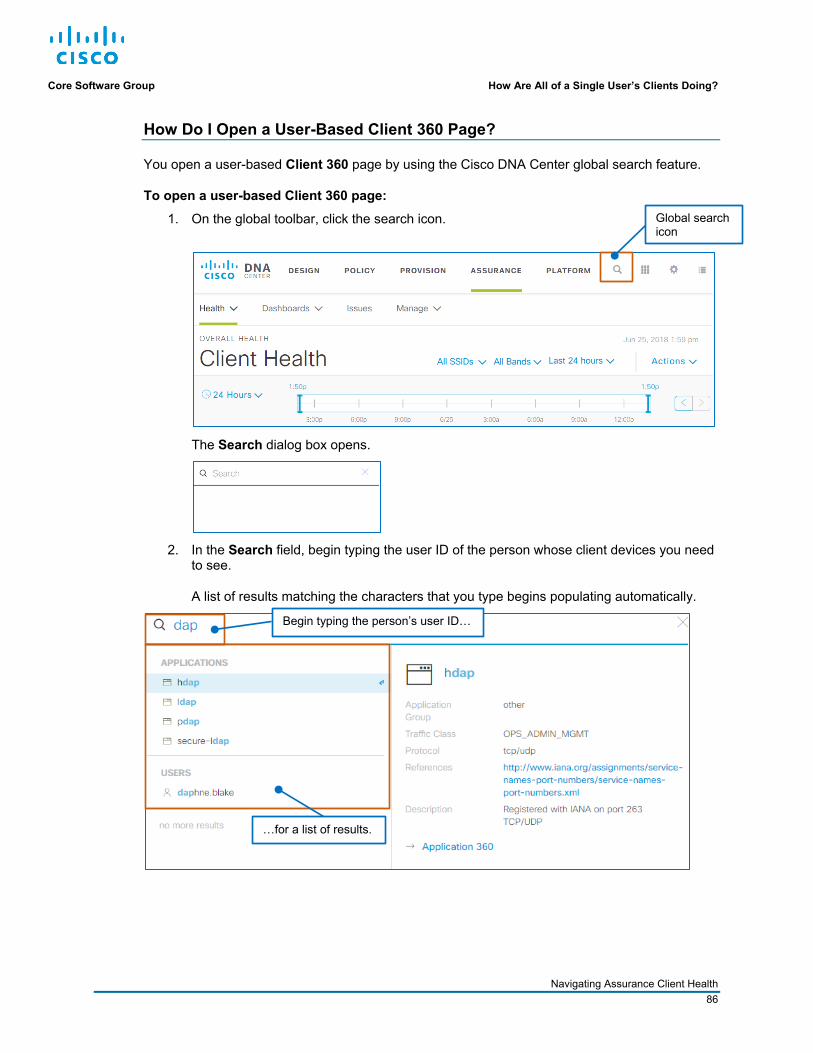
How Do I Open a User-Based Client 360 Page?
You open a user-based Client 360 page by using the Cisco DNA Center global search feature.
To open a user-based Client 360 page: 1. On the global toolbar, click the search icon.
The Search dialog box opens.
2. In the Search field, begin typing the user ID of the person whose client devices you need
to see.
A list of results matching the characters that you type begins populating automatically.
Global search icon
Begin typing the person’s user ID…
…for a list of results.

Core Software Group How Are All of a Single User’s Clients Doing?
Navigating Assurance Client Health 87
3. To access the User 360 link, in the results list, under Users, select the person’s user ID.
The dialog box provides the User 360 link to the right of the search results.
4. To open the user-based Client 360 page, click User 360.
The Client 360 page with tabs for each of the user’s devices opens. 0.
Click to open the User 360 page.

Core Software Group Watch It Happen in Cisco DNA Center
Navigating Assurance Client Health 88
Watch It Happen in Cisco DNA Center Video
This step-by-step instructional video demonstrates all of the steps that you can take to complete the task.
And, it includes the context that you need for a deeper understanding of system processes, best practices, and considerations for optimal system usage and results.
Evaluating a System User’s Printer Connection (8:00)
Watch as we use the Assurance Path Trace tool to map the complete path that traffic is taking from its source IP address to its destination.
The results provide insight into ongoing or potential issues that might be affecting network traffic.
How To Watch a Video
To watch a video:
● Click the video’s title link, which opens an MP4 file.
Based on your system and configuration, you might need to start the video manually.
Note: Video download and streaming times can vary.

Core Software Group Want More?
Navigating Assurance Client Health 89
Want More? Find Product Information
Visit the Cisco Web site to learn more about Cisco DNA Center.
Visit the Cisco Web site to review or download technical documentation.
Find Training
Visit the Cisco Web site to access other Cisco DNA Center learning opportunities.
Visit the Cisco Web site to access learning opportunities for other Cisco products.
Contact Us About This Training
Send us a message with questions or comments about this training.
Note: Please send messages that address training content only. Follow your regular business process to request technical support or address technical or application-related questions.