nature genetics: doi:10.1038/ng - media.nature.com · supplementary figure 1 effects of...
TRANSCRIPT

Supplementary Figure 1
Effects of incorporating uncertainty in classical HLA allele prediction.
Comparison of P values and odds ratios estimated for each cohort for all classical HLA allele effects shown in Figure 1 under methods taking account of uncertainty in classical HLA allele imputation (y axis) and not taking into account uncertainty (x axis). The values reported are from a model including additive and non-additive effects for DRB1*15:01 and principal components, in addition to the indicated allele. DOM, dominant term; REC, recessive term; INT, interaction term.
Nature Genetics: doi:10.1038/ng.3395

Supplementary Figure 2
Comparison of manually curated and automated approaches for building a model of HLA risk for multiple sclerosis.
Summary of the results from the model selection procedures (without interaction search) using manual curation (left), automatic model search with alleles at four-digit resolution (middle) and automatic mega-analysis augmented with alleles grouped at two-digit resolution and by sharing of amino acid residues. Alleles are shown in order of inclusion in each approach and were matched between approaches by LD (the Pearson correlation coefficient across the entire cohort is shown and groups are identified by color). At each stage, models with additive (no superscript), dominant (D), recessive (R) and general (G) risk were tested. The allele used to refer to each group is indicated in bold. Effects identified that were better explained by interactions between other alleles are underlined. Note that DRB1_AA57.S is a near-perfect proxy (r = 0.95) for the presence of either DRB1*08:01 or DRB1*13:03, although a model with independent effects for the two alleles provides better fit. We note also that B_AA326.C is weakly correlated with the presence of B*44:02 (r = 0.26), although the latter remains significant in FEM if the former is included.
Nature Genetics: doi:10.1038/ng.3395
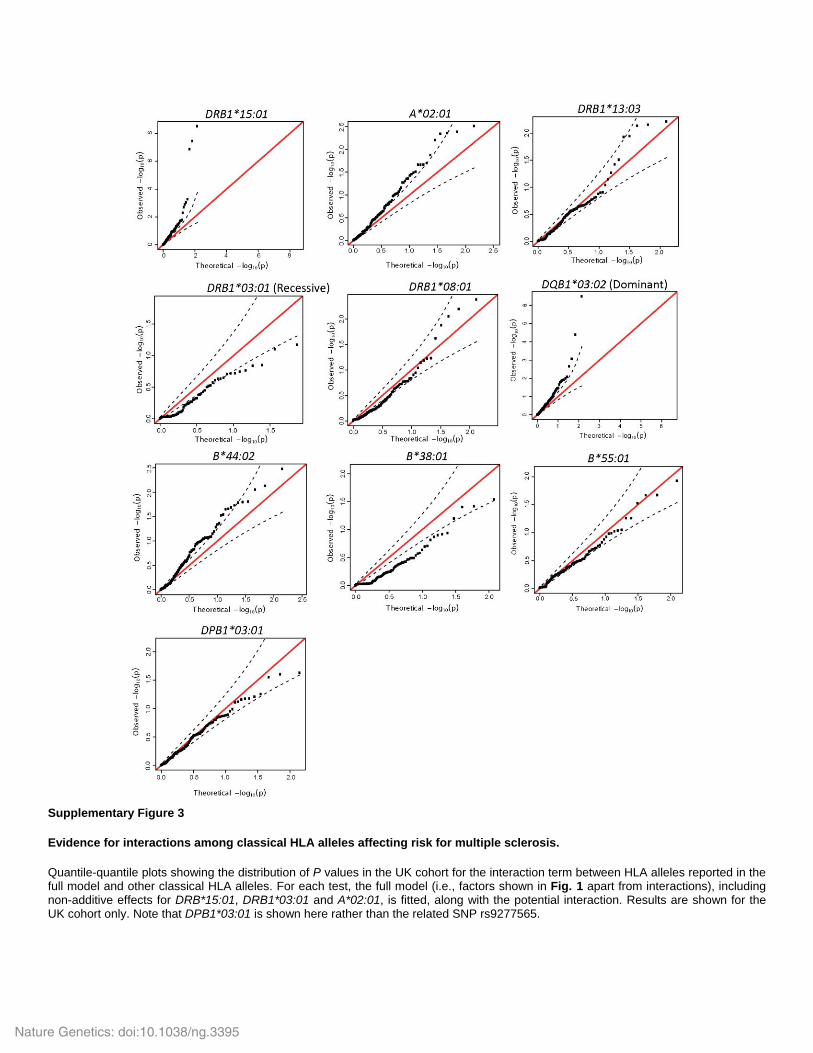
Supplementary Figure 3
Evidence for interactions among classical HLA alleles affecting risk for multiple sclerosis.
Quantile-quantile plots showing the distribution of P values in the UK cohort for the interaction term between HLA alleles reported in the full model and other classical HLA alleles. For each test, the full model (i.e., factors shown in Fig. 1 apart from interactions), including non-additive effects for DRB*15:01, DRB1*03:01 and A*02:01, is fitted, along with the potential interaction. Results are shown for the UK cohort only. Note that DPB1*03:01 is shown here rather than the related SNP rs9277565.
Nature Genetics: doi:10.1038/ng.3395

Supplementary Figure 4
Evidence for interactions between classical HLA alleles and non-HLA disease-associated variants affecting risk for multiple sclerosis.
Quantile-quantile plots showing the distribution of P values within the UK cohort for the interaction term between HLA alleles reported in the full model and non-HLA SNP variation influencing genetic risk for multiple sclerosis (from ref. 11). For each test, the full model, including non-additive effects for DRB*15:01, DRB1*03:01 and A*02:01, is fitted, along with the potential interaction. Results are shown for the UK cohort only. Note that DPB1*03:01 is shown here rather than the related SNP rs9277565.
Nature Genetics: doi:10.1038/ng.3395

Supplementary Figure 5
Interactions between HLA variants and combined non-HLA risk for multiple sclerosis.
The effect of the indicated allele or variant in the UK cohort among individuals stratified into quartiles by a combined non-HLA risk score, obtained by multiplying the odds ratios associated with each genotype carried by an individual at non-HLA loci influencing risk (from ref. 11). The point estimate and 95% confidence interval for effect size are estimated independently for each quartile of non-HLA genetic risk. Dashed and dotted lines indicate the combined point estimate and 95% confidence interval, respectively. HOM, risk for homozygous genotype; DOM, dominance term; INT, interaction term.
Nature Genetics: doi:10.1038/ng.3395

Supplementary Figure 6
Conflation between evidence for interactions and a departure from additivity for DRB1*15:01 and A*02:01.
Top, quantile-quantile plots showing the distribution of P values for interaction terms between DRB1*15:01 (left) and A*02:01 (right) and non-HLA variants known to affect risk of multiple sclerosis (from ref. 11) under a model where the HLA allele acts additively (on the log-odds scale). Bottom, as above, but where a departure from additivity is included for DRB1*15:01 and A*02:01. Because potential interactions are modeled as an additional additive effect of the associated SNP that only acts in the presence of at least one copy of the HLA allele, deviations from additivity can partly mimic potential interactions with the non-HLA variants.
Nature Genetics: doi:10.1038/ng.3395

Supplementary Figure 7
Classical HLA alleles affecting age at onset.
Meta-analysis showing effects of pairs of classical HLA alleles in strong LD (DRB1*15:01–DQB1*06:02 and DRB1*01:01–DQA1*01:01) on age at onset.
Nature Genetics: doi:10.1038/ng.3395

Class II HLA interactions modulate genetic risk for
multiple sclerosis
The International Multiple Sclerosis Genetics Consortium
Supplementary Note
1 International IBD Genetics Consortium (IIBDGC) contributing members
Murray Barclay1, Laurent Peyrin-Biroulet2, Mathias Chamaillard3, Jean-Frederick Colombel4, Mario Cottone5, Anthony Croft6, Renata D'Incà7, Jonas Halfvarson8,9, Katherine Hanigan6, Paul Henderson10,11, Jean-Pierre Hugot12,13, Amir Karban14, Nicholas A Kennedy15, Mohammed Azam Khan16, Marc Lémann17, Arie Levine18, Dunecan Massey19, Monica Milla20, Grant W Montgomery21, Sok Meng Evelyn Ng22, Ioannis Oikonomou22, Harald Peeters23, Deborah D. Proctor22, Jean-Francois Rahier24, Rebecca Roberts2, Paul Rutgeerts25, Frank Seibold26, Laura Stronati27, Kirstin M Taylor28, Leif Törkvist29, Kullak Ublick30, Johan Van Limbergen31, Andre Van Gossum32, Morten H. Vatn33, Hu Zhang20, Wei Zhang22, Australia and New Zealand IBDGC*, Belgium Genetic Consortium†, Initiative on Crohn and Colitis, NIDDK IBDGC‡, United Kingdom IBDGC, Wellcome Trust Case Control Consortium§
1Department of Medicine, University of Otago, Christchurch, New Zealand. 2Gastroenterology Unit, INSERM U954, Nancy University and Hospital, France. 3INSERM, U1019, Lille, France. 4Univ Lille Nord de France, CHU Lille and Lille-2 University,Gastroenterology Unit, France. 5Division of Internal Medicine, Villa Sofia-V. Cervello Hospital, University of Palermo, Palermo, Italy. 6Inflammatory Bowel Diseases, Genetic Epidemiology, Queensland Institute of Medical Research, Brisbane, Australia. 7Department of Surgical and Gastroenterological Sciences, University of Padua, Padua, Italy. 8Department of Medicine, Örebro University Hospital, Örebro, Sweden. 9School of Health and Medical Sciences, Örebro University, Örebro, Sweden. 10Royal Hospital for Sick Children, Paediatric Gastroenterology and Nutrition, Edinburgh, UK. 11Child Life and Health, University of Edinburgh, Edinburgh, UK. 12INSERM U843, Paris, France. 13Univ-Paris Diderot Sorbonne Paris-Cité, Paris France. 14Department of Gastroenterology, Faculty of Medicine, Technion-Israel Institute of Technology, Haifa, Israel. 15Gastrointestinal Unit, Institute of Genetics and Molecular Medicine, University of Edinburgh, Edinburgh, UK. 16Genetic Medicine, MAHSC, University of Manchester, Manchester, UK. 17Université Paris Diderot, GETAID group, Paris, France. 18Pediatric Gastroenterology Unit, Wolfson Medical Center and Sackler School of Medicine, Tel Aviv University, Tel Aviv, Israel. 19Inflammatory Bowel Disease Research Group, Addenbrooke’s Hospital, University of Cambridge, Cambridge, UK. 20Azienda Ospedaliero Universitaria (AOU) Careggi, Unit of Gastroenterology SOD2, Florence, Italy. 21
Molecular Epidemiology, Queensland Institute of Medical Research, Brisbane, Australia. 22Department of Internal Medicine, Section of Digestive Diseases, Yale School of Medicine, New Haven, Connecticut, USA. 23Dept Gastroenterology - University hospital Gent - De Pintelaan - 9000 Gent Belgium. 24Dept Gastroenterology - UCL Mont Godinne Belgium. 25Division of Gastroenterology, University Hospital
Nature Genetics: doi:10.1038/ng.3395

Gasthuisberg, Leuven, Belgium. 26University of Bern, Division of Gastroenterology, Inselspital, Bern, Switzerland. 27Department of Radiobiology and Human Health, Italian National Agency for New Technologies, Energy and Sustainable Economic Development (ENEA), Rome, Italy. 28Dept Gastroenterology, Guy's & St Thomas' NHS Foundation Trust, St Thomas' Hospital, London, UK. 29Department of Clinical Science, Intervention and Technology, Karolinska Institutet, Stockholm, Sweden. 30Division of Clinical Pharmacology and Toxicology, University Hospital Zurich, Zurich, Switzerland. 31Division of Pediatric Gastroenterology, Hepatology and Nutrition, Hospital for Sick Children, Toronto, Ontario, Canada. 32Dept Gastroenterology - 3University Brussels. 33 Department of Transplantation Medicine, Division of Cancer medicine, Surgery and Transplantation, Oslo University Hospital Rikshospitalet, Oslo, Norway.
1.1 Australia and New Zealand IBDGC* Jane M. Andrews1, Peter A. Bampton2, Murray Barclay3, Timothy H. Florin4, Richard Gearry3, Krupa Krishnaprasad5, Ian C. Lawrance6, Gillian Mahy7, Grant W. Montgomery8, Graham Radford-Smith5,9, Rebecca L. Roberts10, Lisa A. Simms5.
1Inflammatory Bowel Disease Service, Department of Gastroenterology and Hepatology, Royal Adelaide Hospital, and School of Medicine, University of Adelaide, Adelaide, Australia. 2Department of Gastroenterology and Hepatology, Flinders Medical Centre and School of Medicine, Flinders University, Adelaide, Australia. 3Department of Gastroenterology, Christchurch Hospital and Department of Medicine, University of Otago, Christchurch, New Zealand. 4Department of Gastroenterology, Mater Health Services, Brisbane, Australia, and School of Medicine, University of Queensland, Brisbane, Australia. 5Inflammatory Bowel Diseases, Genetics and Computational Biology, Queensland Institute of Medical Research, Brisbane, Australia. 6Centre for Inflammatory Bowel Diseases, Fremantle Hospital and School of Medicine and Pharmacology, The University of Western Australia, Fremantle, Australia. 7Department of Gastroenterology, The Townsville Hospital and James Cook University School of Medicine, Townsville, Australia. 8Molecular Epidemiology, Genetics and Computational Biology, Queensland Institute of Medical Research, Brisbane, Australia. 9Department of Gastroenterology, Royal Brisbane and Womens Hospital, and School of Medicine, University of Queensland, Brisbane, Australia. 10University of Otago, Department of Medicine, Christchurch, New Zealand.
1.2 Belgium Genetic Consortium† Leila Amininijad1, Isabelle Cleynen2, Olivier Dewit3, Denis Franchimont1, Michel Georges4, Debby Laukens5, Harald Peeters5, Jean-Francois Rahier3, Paul Rutgeerts2, Emilie Theatre4, 6, André Van Gossum1, Severine Vermeire7.
1Erasmus Hospital, Free University of Brussels, Department of Gastroenterology, Brussels, Belgium. 2Department of Pathophysiology, Gastroenterology section, KU Leuven, Leuven, Belgium. 3Department of Gastroenterology, Clinique Universitaire St-Luc, Brussels, Belgium. 4Unit of Animal Genomics, Groupe Interdisciplinaire de Gnoprotomique Applique (GIGA-R) and Faculty of Veterinary Medicine, University of Lige, Lige, Belgium. 5Ghent University Hospital, Department of Gastroenterology and Hepatology, Ghent, Belgium. 6Division of Gastroenterology, Centre Hospitalier Universitaire, Universit de Lige, Lige, Belgium. 7Division of Gastroenterology, University Hospital Gasthuisberg, Leuven, Belgium.
Nature Genetics: doi:10.1038/ng.3395
1.3 NIDDK Inflammatory Bowel Disease Genetics Consortium‡ Guy Aumais1, Leonard Baidoo2, Arthur M. Barrie III2, Karen Beck2, Edmond-Jean Bernard3, David G. Binion2, Alain Bitton4, Steve R. Brant5, Judy H. Cho6,7, Albert Cohen8, Kenneth Croitoru9, Mark J. Daly10,11, Lisa W. Datta5, Colette Deslandres12, Richard H. Duerr2,13, Debra Dutridge14, John Ferguson7, Joann Fultz2, Philippe Goyette15, Gordon R. Greenberg9, Talin Haritunians14, Gilles Jobin16, Seymour Katz17, Raymond G. Lahaie18, Dermot P. McGovern14,19, Linda Nelson2, Sok Meng Ng7, Kaida Ning7, Ioannis Oikonomou7, Pierre Paré20, Deborah D. Proctor7, Miguel D. Regueiro2, John D. Rioux15, Elizabeth Ruggiero7, L. Philip Schumm21, Marc Schwartz2, Regan Scott2, Yashoda Sharma7, Mark S. Silverberg9, Denise Spears5, A. Hillary Steinhart9, Joanne M. Stempak9, Jason M. Swoger2, Constantina Tsagarelis4, Wei Zhang7, Clarence Zhang22, Hongyu Zhao22.
1University of Montreal, Maissonneuve – Rosemont Hospital, Quebec Association of Gastroenterologists, Montréal, Québec, Canada. 2Division of Gastroenterology, Hepatology and Nutrition, Department of Medicine, University of Pittsburgh School of Medicine, Pittsburgh, Pennsylvania, USA. 3Hôpital Hôtel Dieu, Montréal, Québec, Canada. 4Division of Gastroenterology, McGill University Health Centre, Royal Victoria Hospital, Montréal, Québec, Canada. 5Inflammatory Bowel Disease Center, Department of Medicine, Johns Hopkins University School of Medicine, Baltimore, Maryland, USA. 6Department of Genetics, Yale School of Medicine, New Haven, Connecticut, USA. 7Department of Internal Medicine, Section of Digestive Diseases, Yale School of Medicine, New Haven, Connecticut, USA. 8Division of Gastroenterology, Hôpital Général Juif Sir Mortimer B. Davis Jewish General Hospital, Montréal, Québec, Canada. 9Mount Sinai Hospital Inflammatory Bowel Disease Centre, University of Toronto, Toronto, Ontario, Canada. 10Analytic and Translational Genetics Unit, Massachusetts General Hospital, Harvard Medical School, Boston, Massachusetts, USA. 11Broad Institute of MIT and Harvard, Cambridge, Massachusetts, USA. 12Hopital Sainte Justine, Montréal, Québec, Canada. 13Department of Human Genetics, University of Pittsburgh Graduate School of Public Health, Pittsburgh, Pennsylvania, USA. 14Medical Genetics Institute, Cedars-Sinai Medical Center, Los Angeles, California, USA. 15Université de Montréal and the Montreal Heart Institute, Research Center, Montréal, Québec, Canada. 16Pavillon Maisonneuve, Montréal, Québec, Canada. 17Long Island Clinical Research Associates, Great Neck, New York, USA. 18CHUM – Hopital Sainte-Luc, Montréal, Québec, Canada. 19Inflammatory Bowel and Immunobiology Research Institute, Cedars-Sinai Medical Center, Los Angeles, California, USA. 20Laval University, Quebec City, Québec, Canada. 21Department of Health Studies, University of Chicago, Chicago, Illinois, USA. 22Department of Biostatistics, School of Public Health, Yale University, New Haven, Connecticut, USA.
Nature Genetics: doi:10.1038/ng.3395

2 Building a model of HLA risk for multiple sclerosis
Below we give details of the models considered and the steps taken at each stage of the selection procedure when building a model for HLA driven risk for multiple sclerosis with manual curation and a UK focus. A summary of the factors identified at each step is shown in Supplementary Figure 2.
2.1.1 Baseline model with DRB1*15:01, DRB1*03:01, DRB1*13:03, A*02:01 and departures from additivity
We started by assessing the evidence for deviations from additivity (on the log-odds – logistic - scale) for all four alleles of our baseline model, focusing primarily on the UK cohort. Specifically, we compared a baseline logistic model where the additive term is:
ܯ = + ுܩ כ ଵ + 1ܥ כ ଵ + 2ܥ כ ଶ + 3ܥ כ ଷ + 4ܥ כ ସ + 5ܥ כ ହ ,
where ܩு0,1,2 is the genotype for the respective HLA allele, to a model with an additional parameter which captures deviations from additivity for that HLA allele (in blue), coded as a correction of the effect for samples homozygous for the respective allele:
ூேܯ = + ுܩ כ ଵ + ு_ுைெܫ כ ଵಹೀಾ + 1ܥ כ ଵ + 2ܥ כ ଶ + 3ܥ כ ଷ + 4ܥ כସ + 5ܥ כ ହ ,
where ܫு_ுைெ = ൜1, ுܩ == 20, ݏݓݎݐ
. We refer to this parameter as the homozygote correction term
for the allele. Models ܯ and ܯூே are nested, and the P value for the added term is obtained from the LRT. Each allele was assessed in turn.
For DRB1*15:01, there was significant evidence for departures from additivity, with P = 7x10⁻⁶ for the homozygote correction term and a negative ଵுைெ, indicating that the effect of homozygotes is significantly less than double that of the heterozygotes in the log-scale (i.e. the risk effect is partially dominant). The effect remained strong and consistent in the 4-allele model (including parameters for DRB1*03:01, DRB1*13:03 and A*02:01). It was therefore decided to include two parameters for the DRB1*15:01 effect in the model.
For DRB1*03:01, the homozygote correction term had much stronger evidence for association with the trait in the UK cohort than the additive term (P = 3x10-11 versus P = 4x10⁻³, respectively). Moreover, the additive term appeared to have a protective effect on the trait in the single-allele model (only DRB1*03:01 included) but a deleterious one in the 4-allele model. We therefore included a single parameter for DRB1*03:01 at this step assuming a recessive effect for that allele. We note that the automated search approaches favour inclusion of a weak additive risk term, which (after inclusion of the factors below) has strong support in the FEM (P = 3.5x10⁻⁸).
For DRB1*13:03, there was no evidence for departures from additivity (P > 0.05 for the homozygote correction term) in neither the single-allele nor the 4-allele models. Therefore, a single parameter for this allele was added in the baseline model, assuming an additive effect on the log-odds scale.
For A*02:01, the homozygote correction term had a negative coefficient, indicating that the effect of two copies of the allele on disease was less than double that of a single allele, but was only marginally significant (P = 0.043) in the UK cohort. In the 4-allele model, the effect was consistent with that in the single allele model, but with P = 0.08). Nevertheless, in the light of the interaction analysis (see below) showing that deviations from additivity in A*02:01 can mimic weak interactions with A*02:01
Nature Genetics: doi:10.1038/ng.3395

and non HLA loci (Supplementary Fig. 6), it was decided to include two parameters for A*02:01 in the model.
The resulting linear term of in the baseline model is:
ସܯ = + ோଵହଵܩ כ ଵ + ோଵହଵுைெܫ כ ଵுைெ+ ଶଵܩ כ ଶ + ଶଵுைெܫ כ ଶுைெ + ோଵଷଷܩ כ ଷ + ோଷଵுைெܫ כ ସுைெ+ 1ܥ כ ଵ + 2ܥ כ ଶ + 3ܥ כ ଷ + 4ܥ כ ସ + 5ܥ כ ହ
All terms replicate and validate in the FEM.
2.1.2 The signal of association at DPB1 When all HLA alleles and SNPs in the region were added in turn in to the above model (assuming an additive effect in the log-scale), the strongest subsequent signal in the UK is seen at rs9277565 with P = 1x10-22 (compared to the most associated classical HLA allele, DPB1*03:01, with P = 5x10-16). rs9277565 is in moderate LD with DPB*03:01 (r2 of 0.4 to 0.7 across cohorts) and it is likely that they are capturing the same effect (no DPB1 signal is seen after conditioning on the SNP). Given the higher strength of association it was decided to include rs9277565 in the model rather than the DPB allele. There was no evidence for departure from additivity (P > 0.05 for the homozygote correction term). The effect replicates and validates in the FEM.
2.1.3 A protective effect for B*44:02 In the 6-allele model, across all SNPs and classical HLA alleles, the most significant effect in the UK was for B*44:02 (P = 1x10-12) and B*44:02 was therefore also included in the model; assuming an additive effect on the log-odds scale since there was no evidence for departures from additivity (P > 0.05). The effect replicates and validates in the FEM. We note that B*44:02 is in moderate LD with C*05:01 (r2 = 0.56 in controls), and likely explains previous reports of association of this allele with MS risk1.
2.1.4 A protective effect of the rare allele B*38:01 Across 7-allele models, the strongest signal in the UK came from a SNP, rs2229092 (P = 8x10-11). Among classical HLA alleles, the strongest signals were observed at C*15:02 (P = 2x10⁻⁷) and B*38:01 (P = 7x10⁻⁷). However, C*15:02 was found to be in high LD with SNPs which showed stronger evidence for association with the disease (e.g. r2 = 0.86 with rs16899166 and r2 = 0.91 with rs5009853). B*38:01 on the other hand, showed stronger evidence for association in comparison with all SNPs it was in LD with (and showed no association, r2 > 0.01, to any SNP with stronger association). We therefore included B*38:01 in the model at this stage. No evidence for departures from additivity was detected. The effect replicates and validates in the FEM.
2.1.5 A risk effect for DRB1*08:01 In the 8-allele model, C*15:02 (P = 3x10⁻⁷) and rs2229092 (P = 1x10⁻¹⁰) remained the most associated HLA allele and SNP in the UK, respectively. The second most strongly associated HLA allele was DRB1*08:01 (P = 2x10⁻⁶). Notably this allele had shown suggestive evidence for association in the FEM analysis of the original 2011 GWAS2 (P = 2x10⁻⁷), but was not highlighted as associated in that study as it showed only marginal evidence of association in the UK cohort alone (P = 0.025). The same allele was also reported previously by another study, though also not at genome-wide significance3. Given this prior evidence for association of DRB1*08:01 with MS ,the fact that it was not in high LD (r2 > 0.8) with SNPs with stronger evidence for association, and shows no correlation with C*15:02 or
Nature Genetics: doi:10.1038/ng.3395

rs2229092 (r2 < 0.01), we included DRB1*08:01 in the model. The effect replicates and validates in the FEM. The other effects are discussed below.
2.1.6 Interaction between DRB1*15:01 and DQA1*01:01, and an effect associated with LTA Based on our interaction analysis we next considered an DQA1*01:01-DRB1*15:01 interaction term (i.e. a parameter indicating an effect of DQA1*01:01 only when at least one copy of DRB1*15:01 allele is carried by the individual; see section below on searching for HLA-HLA interactions). The inclusion of this interaction term leads to a better fit than all models containing any of the non-interaction variants (P = 2x10-12). The interaction term replicates in the FEM and was therefore included in the model. We also note that the interaction term shows strong association in a model with DRB1*15:01 alone (P = 3x10-12 with 2 parameters for DRB1*15:01). In contrast, the P-value for a marginal effect of DQA1*01:01 is 0.033. In the full model, the marginal effect for DQA1*01:01 has P > 0.1, so both before and after the other terms have been included in the model, the interaction term shows substantially stronger evidence for association than a marginal DQA1*01:01 term.
When including the interaction term in the model, the signals at C*15:02 and rs2229092 remain. To further evaluate their roles, we ran the FEM on models including the 9 established parameters (2 for DRB1*15:01, 2 for A*02:01, a recessive effect for DRB1*03:01, additive effects for DRB1*13:03, DRB1*08:01, B*44:02, B*38:01, rs9277565, and the DQA1*01:01-DRB1*15:01 interaction term) together with each of C*15:02 and rs2229092 in turn. In the analysis including rs2229092, this SNP exhibited strong evidence for association (P = 1x10-19) in the FEM. In contrast, in the analysis including C*15:02, the evidence for association failed to reach the 10-9 threshold (P = 6x10⁻⁹) and is seen to be much weaker in the other non-UK cohorts (FEM P = 0.0015). This C*15:02 allele is in high LD with SNPs exhibiting stronger signals of association throughout our stepwise regression approach. Consequently, while our results are supportive of a possible role for C*15:02 in risk for MS, the level of evidence does not meet the standards applied here for inclusion. We also considered models where rs2229092 was included at earlier stages of the model and found no material changes in the results for other reported effects. Similarly, when including only rs2229092 (together with 5 PCs as covariates), it is strongly associated in the UK (P = 7x10⁻⁵). We therefore included rs2229092 in the model rather than C*15:02.
It should also be noted that while rs2229092 (a missense variant in the LTA gene) exhibits the strongest signal in the 10-allele model in the UK and is highly significant in the FEM, it is moderately correlated (r2~0.45) with other SNPs which show strong evidence for association, such as rs225798 and rs2230365, both in the NFKBIL1 gene; these alternate SNPs are also candidates for driving this observed association. While the possibility that rs2229092 (or another of these SNPs) are tagging one (or more) signals coming from HLA alleles cannot be ruled out, the evidence for association is substantially stronger for the SNP than for any HLA alleles included in our analysis suggesting this is not the case, at least for more common HLA alleles. We note that rs2229092 is in moderate LD (r2 = 0.33 in controls) with the previously reported rs25164894 (and generally lies within an extended LD block), though the latter shows weaker association in this analysis.
2.1.7 A deleterious effect for DQB1*03:02 and evidence for interaction with DQB1*03:01 When looking across the other cohorts for HLA alleles with remaining evidence for association in the 11-allele model, the only allele with P < 1x10⁻⁵ in any of the cohorts is DQB1*03:02 in the SWE cohort (P = 2x10⁻⁸). DQB1*03:02 exerts a dominant effect on the log-odds scale and also appears significantly associated with MS in the FEM across cohorts (P = 2x10-13). Moreover, there is supporting evidence
Nature Genetics: doi:10.1038/ng.3395

for this effect from the automated approaches. Therefore, it was decided to include this allele in the model as well. When conducting the interaction analysis for DQB1*03:02, we found strong evidence (P<10-6) for an interaction between DQB1*03:02 and DQB1*03:01 in the UK cohort (Fig. 2). When including the interaction term in the full model, the effect of the interaction term was significantly associated with MS in the FEM across cohorts (P = 7x10-12). Moreover, the DQB1*03:02 association with MS became somewhat stronger and even more significant (P = 2x10-22, compared to P=2x10-13 before the interaction term was added.
2.1.8 Remaining signals in the UK and other cohorts The only other HLA allele included in the model is B*55:01. Despite showing no evidence for association with MS with P < 10-5 in any single cohort, it appeared significantly associated with MS in the automated approaches and its signal was validated in the FEM across cohorts for the full model (P = 10-11). It confers a protective effect with no evidence for deviations from additivity.
Conditioning on the effects described above, no classical HLA allele showed evidence for association with MS with P < 10-5 within the UK cohort in the full, 13-allele model. However, 14 SNPs did show evidence for association at that level, with the top hit, rs9267482 (P = 7x10⁻¹⁰) lying in the DDX39B
(BAT1) gene. This SNP is also highly significant in the FEM (P = 10-21). These and other SNP signals were not included in the model as the primary focus is on HLA alleles.
Nature Genetics: doi:10.1038/ng.3395

3 Secondary phenotypes
Secondary phenotypes, such as clinical course (Primary Progressive vs Relapsing Remitting MS), severity (calculated as Multiple Sclerosis Severity Score, MSSS, which reflects the rate at which patients affected with the disease accumulate disability5) and age at onset were available for a proportion of the samples studied (Supplementary Table 5). At first, we sought to assess the evidence for an effect of the combined HLA risk score on each of the secondary phenotypes. The HLA risk score was estimated from the effect sizes of the alleles included in the 10-allele model and reported in the main text, as they were estimated from the FEM, as:
ோூௌ ௌைோாܣܮܪ = exp (ܩோଵହଵ כ ଵ + ோଵହଵுைெܫ כ ଵுைெ+ ଶଵܩ כ ଶ + ଶଵுைெܫ כ ଶுைெ + ோଵଷଷܩ כ ଷ + ோଷଵுைெܫ כ ସுைெ+ ோଵܩ כ ହ + ସସଶܩ כ + ଷଵܩ כ + ௦ଽଶହହܩ כ + ொଵଵܩכ ோଵହଵଽܫ + ௦ଶଶଶଽଽଶܩ כ ଵ)
where ܩ௫ 0,1,2 , ܫ௫ = ൜1, ௫ܩ == 10, ݏݓݎݐ
௫ுைெܫ , = ൜1, ௫ܩ == 20, ݏݓݎݐ
for each HLA allele or SNP ݔ.
The HLA risk score was quantile normalised within each cohort. We used the HLA risk score as the explanatory variable and conducted the following analyses:
x linear regression with AAO (which is approximately normally distributed) x linear regression analysis with MSSS, using the quantile-normalised MSSS values as the
phenotype, x logistic regression analysis of extremes on MSSS, splitting the patients into two groups of low
(MSSS<2.5) and high (MSSS>7.5) severity and using the resulting binary grouping as the phenotype value, and
x logistic regression analysis on clinical course (PPMS vs RRMS).
For all models, we included 5 PCs as covariates. When running these on the UK cohort, the HLA risk score was found nominally associated with AAO (P = 0.042) but not with MSSS or the clinical course. The association of HLA risk score with AAO was confirmed in a FEM across cohorts (P = 7x10⁻¹⁰, Fig. 4A). Specifically, the difference in age of onset between individuals lying at the 5th and 95th percentiles is approximately 2 years (34.23 and 32.26 years respectively).
3.1 Age at onset In order to assess the effect of specific HLA alleles on the age at onset (AAO) of MS, we conducted linear regression analysis in a stepwise fashion, considering AAO as the phenotype and including 5 PCs as covariates in all models. All alleles were assumed to exert an additive effect on the trait. The models were run separately for each cohort and results were subsequently combined by running a fixed-effects meta-analysis for alleles with nominally significant associations (and the same direction of effect) in two or more cohorts. As for disease risk, joint analysis of the combined cohorts controlling from cohort effects and PCs was also carried out using an automated model search procedures with and without allele groupings based on 2-digit classifications and sharing of amino acid residues.
3.1.1 Manually curated approach with UK focus From the manually-curated approach, across all single-allele models, the strongest signal came from DRB1*01:01 (P = 4x10-11, effect size = 1.82 years per allele). DRB1*01:01 is in moderate LD with
Nature Genetics: doi:10.1038/ng.3395

DQA1*01:01 (r2 = 0.6) and DQB*05:01 (r2 = 0.7), which also showed comparable effects in the same direction. The second strongest signal came from DQB1*06:02, which decreases the age at onset of MS (P = 6x10-11, effect size =-0.98 years per allele). DRB1*15:01 and DQA1*01:02, are both part of the extended MS risk haplotype containing DQB1*06:02, and thus as expected also exhibited strong associations in the same direction (Supplementary Fig. 7).
After conditioning on DRB1*01:01, DQB1*06:02 was the only allele that remained associated with AAO of MS at the genome-wide significance threshold (P = 2x10⁻⁸, effect size = -0.76 years per allele), with DRB1*15:01 narrowly missing this (P = 8x10⁻⁸, effect size= -0.72 years per allele). With these data it is not possible to definitively establish which of these class II alleles is driving the observed association. Hence, and because DRB1*15:01 is driving the association with the main phenotype, it was decided to include DRB1*15:01 in the model. When DRB1*15:01 was also included in the model, no other allele showed genome-wide significant evidence for association with AAO.
In order to ensure that the effect of DRB1*01:01 on AAO is not tagging an effect from DQA*01:01 in the presence of DRB1*15:01 or vice versa, we conducted a formal model comparison between models with
x both DRB1*01:01 and the interaction term included (‘BOTH’), x only DRB1*01:01 included (‘DRB0101 ONLY’), or x only the interaction term included (‘DQA0101INT ONLY’),
for both the binary MS phenotype and the AAO. 5 PCs were included as covariates in both models. All other susceptibility alleles were also included in the respective models. Results from the UK cohort indicate that a model with only DRB1*01:01 in fits the data better for AAO (both Akaike Information Criterion - AIC - and BIC), whereas a model with only the DQA*01:01 - DRB1*15:01 interaction term in fits the data better for the main MS phenotype (both AIC and BIC); data not shown. In summary, the effects of the DQA1*01:01 - DRB1*01:01 haplotype MS risk and AAO are best explained through distinct models but the evidence separating the alternative is not overwhelming.
3.1.2 Automated model search across combined cohorts The automated model searches (with and without allele groupings) were carried out as for disease status on the subset of individuals for which AAO data was available. The primary factor identified when 4-digit alleles were considered was, as with the manually-curated approach, an additive effect for DQB1*06:02 (each copy reducing AAO by 1.2 years), with a subsequence general genotype effect for DRB1*01:01 (Het genotype increase AAO by 3.9 years, Hom increases AAO by 5.2 years). When allele groupings were also considered, the primary effect identified (a general genotype model associated with sharing of a histidine residue at position 30 among DQB1 alleles) correlates with DQA1*01:01 (r = 0.67), DRB1*01:01 (r = 0.52) and DQB1*06:02 / DRB1*15:01 (-0.37 / -0.32), thus incompletely capturing the two effects associated with classical HLA alleles.
3.2 Severity and clinical course In order to further assess the effect of HLA alleles on the severity of MS, we more fully explored the relationship between HLA alleles and Multiple Sclerosis Severity Score (MSSS)5. We conducted
x linear regression analysis, using the quantile-normalised MSSS values as the phenotype and
Nature Genetics: doi:10.1038/ng.3395

x logistic regression analysis of extremes, splitting the patients into two groups of low (MSSS<2.5) and high (MSSS>7.5) severity and using the resulting binary grouping as the phenotype value.
For both sets of models, 5 PCs were included as covariates. Under both sets of models, no HLA alleles were found to be significantly associated with the severity of MS. There was some suggestive evidence for a modest effect of B*08:01 (which is correlated with DRB1*03:01, r = 0.73) towards a more severe disease manifestation, more so for the binary analysis (FEM P = 2 x 10⁻⁵, OR = 1.32). However, this does not reach the level of evidence applied throughout the analysis and is not analysed further.
In order to assess the effect of HLA alleles on the clinical course of MS (Primary Progressive vs Relapsing Remitting MS), we conducted logistic regression analysis, considering clinical course as the phenotype and including 5 PCs as covariates in all models. Using this model, we found no evidence for association between HLA alleles and clinical course of MS (No alleles with P > 0.05 in the UK and / or P > 10-5 in the FEM).
Nature Genetics: doi:10.1038/ng.3395
4 Full Acknowledgements
We thank the patients, families and healthy control individuals that participated in this study. We also thank the nurses and referring physicians. This project was supported by the National Institutes of Health (NS049477, NS26799, R01NS032830, RC2NS070340, R01NS067305, RC2GM093080), the Wellcome Trust (as part of the Wellcome Trust Case Control Consortium 2 project - 085475/B/08/Z, 085475/Z/08/Z, 084702/Z/08/Z and 098051), the UK Multiple Sclerosis Society (857/07, 861/07, 862/07, 894/08, 898/08 and 955/11), the UK Medical Research Council (G0700061), the Naomi Branson Foundation, the Sainsbury Foundation, the US National Multiple Sclerosis Society (grants RG 4198-A-1 and 4680-A-1, postdoctoral fellowship FG 1938-A-1 and Harry Weaver Neuroscience Scholars JF2138A1 and JF-2137A4), the South Florida chapter of the National Multiple Sclerosis Society, the Cambridge NIHR Biomedical Research Centre, DeNDRon North West, the Bibbi and Niels Jensens Foundation, the Swedish Brain Foundation, the Swedish Research Council, the Knut and Alice Wallenberg Foundation, the Swedish Heart-Lung Foundation, the AFA Foundation, the Foundation for Strategic Research, the Stockholm County Council (project 592229), the Strategic Cardiovascular and Diabetes Programmes of Karolinska Institutet and Stockholm County Council, the Swedish Council for Working life and Social Research, the Institut National de la Santé et de la Recherche Médicale (INSERM), the Fondation d’Aide pour la Recherche sur la Sclérose En Plaques (ARSEP), the Association Française contre les Myopathies (AFM) and GIS-IBISA, the German Ministry for Education and Research (BMBF), the German Competence Network Multiple Sclerosis (KKNMS, Control-MS, 01GI0917), the Deutsche Forschungsgemeinschaft (SyNergy Cluster, JE 530/1-1), Munich Biotec Cluster M4, the Fidelity Biosciences Research Initiative, the Research Foundation Flanders (FWO-Vlaanderen), the Research Fund KU Leuven (OT/11/087), the Belgian Neurological Society, the Belgian Charcot Foundation, the Gemeinnützige Hertie Stiftung, the Clinical Research Priority Program-MS (CRPPMS) of the University Zurich, the Danish Multiple Sclerosis Society, the Danish Council for Strategic Research, the Center of Excellence for Disease Genetics of the Academy of Finland, the Sigrid Juselius Foundation, the Helsinki University Central Hospital Research Foundation, the Italian Foundation for Multiple Sclerosis (FISM grants “Progetto Speciale Immunochip”, 2011/R/14), Fondazione Cariplo (grant 2010-0728), the Italian Ministry of University and Research (MIUR, PRIN08), the CRT Foundation of Turin (Italy), the Italian Ministry of Health (grant Giovani Ricercatori 2007, D.lgs 502/92), the Italian Foundation for Multiple Sclerosis, the Italian Institute of Experimental Neurology (INSPE), the MS association of Oslo, the Norwegian Research Council (143153 and 143410/HFH), the South Eastern Norwegian Health Authorities (51852/ILM) the Australian National Health and Medical Research Council (633275, 1053756) and the French Government (ANR-10-IAIHU-06).
We acknowledge use of samples from the British 1958 Birth Cohort DNA collection (funded by the Medical Research Council grant G0000934 and the Wellcome Trust grant 068545/Z/02), the UK National Blood Service controls (funded by the Wellcome Trust), the Vanderbilt University Medical Center’s BioVU DNA Resources Core (supported by institutional funding and by the Vanderbilt CTSA grant 1UL1RR024975-01 from NCRR/NIH), the Centre de Ressources Biologiques du Réseau Français d’Etude Génétique de la Sclérose en Plaques (CRB-REFGENSEP), the Norwegian Bone Marrow Registry controls, the Norwegian Multiple Sclerosis Registry and Biobank, the North American Research Committee on MS (NARCOMS) Registry (supported by the Consortium of Multiple Sclerosis Centers, CMSC) and the Brigham and Womens Hospital PhenoGenetic Project. This study makes use of data generated by the DILGOM project funded by the Academy of Finland (grants 136895, 263836, 118065).
Nature Genetics: doi:10.1038/ng.3395

The GWAS made use of external control data from the popgen biobank (www.popgen.de, supported by the German Ministry of Education and Research (BMBF) through the National Genome Research Network (NGFN) and received infrastructure support through the DFG excellence cluster "Inflammation at Interfaces"), the Swedish Breast Cancer study (funded by the Agency for Science & Technology and Research of Singapore (A*STAR), the Susan G Komen Breast Cancer Foundation, and the National Institute of Health - R01 CA 104021), HYPERGENES (a European Commission project, HEALTH-F4-2007-201550), the Children’s Hospital of Philadelphia (CHOP, funded by an Institutional Development Award to the Center for Applied Genomics from the Children’s Hospital of Philadelphia), the Swedish CAD study (funded by the Knut and Alice Wallenberg Foundation, the Swedish Research Council - 8691 and the Stockholm County Council - 562183), the BRC-REFGENSEP, Pitié-Salpêtrière ĞŶƚƌĞĚഺ/ŶǀĞƐƚŝŐĂƚŝŽŶůŝŶŝƋƵĞ;/Ϳ'ĠŶĠƚŚŽŶtĞůůĐŽŵĞdƌƵƐƚ^ĂŶŐĞƌ/ŶƐƚŝƚƵƚĞ'ĞŶŽƚLJƉŝŶŐ&ĂĐŝůŝƚLJthe Biorepository and the Center for Genome Technology within the University of Miami John P. Hussman Institute for Human Genomics, the Center for Applied Genomics, the Children’s Hospital of Philadelphia, the Institut du Cerveau et de la Moelle épinière (ICM), the Norwegian Multiple Sclerosis Registry and Biobank, the SNP Technology Platform in Uppsala (www.genotyping.se) and UCSF.
5 Supplementary note references
1. Yang, Y. et al. Clinical whole-exome sequencing for the diagnosis of mendelian
disorders. N Engl J Med 369, 1502-1511 (2013).
2. The International Multiple Sclerosis Genetics Consortium & The Wellcome Trust Case
Control Consortium 2. Genetic risk and a primary role for cell-mediated immune
mechanisms in multiple sclerosis. Nature 476, 214-219 (2011).
3. Dyment, D.A. et al. Complex interactions among MHC haplotypes in multiple
sclerosis: susceptibility and resistance. Hum Mol Genet 14, 2019-2026 (2005).
4. Gonzaga-Jauregui, C., Lupski, J.R. & Gibbs, R.A. Human genome sequencing in health
and disease. Annu Rev Med 63, 35-61 (2012).
5. Roxburgh, R.H. et al. Multiple Sclerosis Severity Score: using disability and disease
duration to rate disease severity. Neurology 64, 1144-1151 (2005).
Nature Genetics: doi:10.1038/ng.3395

Supplementary Note: Estimating genome-wide e↵ect of
epistasis on the HLA loci using linear mixed models
Abstract
To test the total contribution of epistasis to the e↵ect sizes of HLA alleles, we develop astatistical framework that uses a linear mixed model (LMM) to model the total net impactof interaction between the HLA allele and an unmeasured polygenic score. We can then userealised relatedness matrices of “unrelated” (i.e. not closely related) individuals, estimatedfrom genome-wide SNP data, to fit these models (analogously to how LMMs can be usedto estimate the total contribution of common SNPs to additive heritability e.g.6). In thisappendix we outline the basic model (in which e↵ect sizes are treated as unobserved heritabletraits), demonstrate that this model induces a heritability of HLA alleles within cases pro-portional to the strength of total epistasis, and give equations to convert between the size ofthis induced heritability and the parameters of the epistatic model. We show using simula-tions that this method is well calibrated, and has high power to detect moderate polygenicepistasis in studies with at least 3000 cases and 3000 controls. Finally, we apply this modelto the IMSGC Immunochip data and imputed HLA alleles to calculate the total contributionof epistasis to the HLA odds ratios from variants included on the Immunochip.
A.1 The personalised e↵ect size model
Assume that a continuous phenotype is influenced by a marginal e↵ect of the dosage of a majorlocus xi (such as the HLA), with a marginal e↵ect size , as well as additive/additive interactionsbetween the major locus and L minor loci (e.g. non-HLA loci) with normalized dosages a1 toaL, each with no marginal e↵ect and each increasing the e↵ect size of the major locus by xj .
Normalized in this sense means aj =a0j
2fjp
2fi
(1fi
), where a
0j 2 (0, 1, 2) is the unnormalized dosage
and fj is the allele frequency. We can write down the overall genetic score for individual i as
yi = 0 + xi +LX
j=1
xjxiaji (1)
We can rewrite this as
yi = 0 + xi
0
@ +
X
j
xjaji
1
A
= 0 + xii (2)
where i = +P
j xjaji is now a (potentially unobserved) personalised e↵ect size, equivalentto the amount that the phenotype is increased by the major locus in individuals with a genomeidentical to that of individual i.
If we look across a number of individuals, providing that L is large and that the xj valuesare drawn from a distribution that is close to normal, the vector of personalised e↵ect sizes willbe distributed according to
~
N(,v2) (3)
1
Nature Genetics: doi:10.1038/ng.3395

where v
2 =P
j 2xj and is the realised relatedness matrix of the individuals. This is defined
as the average covariance in standardized genotypes aij (as defined by6) across the set of SNPsthat interact with the major locus. As we do not know the true set of SNPs that are interactingwith the major locus, we instead use a set of genome-wide SNPs to estimate this relatednessmatrix.
A.2 Binary traits and within case analyses
For binary disease traits, we define a link function g between the continuous score and the prob-ability of disease, such that
P (di = 1|yi) = g(yi) = g(0 + ixi). (4)
Usually g(yi) ! 1 as yi ! 1, and g(yi) ! 0 as yi ! 1. For instance, if g(yi) = logit(yi),then we have a logistic model with i corresponding to a personalised log-odds ratio. 0 needs tobe picked such that E[g(yi)] = K, where K is the prevalence of the disease.
We can reverse this model in order to remove (usually unobserved) i, and instead createan (approximate) linear mixed model that predicts the dosage of the major allele using the case-control status and the realised relatedness matrix. Assuming that cases are rare in the population,or that controls are population controls, most of our information will come from within cases, andwe thus create a within-case model:
~x|(~d = 1) N
µx,
2x
h
2x+ (1 h
2x)I
(5)
In this equation h
2x is the induced heritability of the major locus dosage in cases. As we show
below, this in heritability is induced in cases by the genome-wide polygenic epistasis, and in theremainder of this section we describe how the relate this heritability parameter to the originalmodel parameters.
The probability of a given case having a particular dosage xi at the major locus, conditionalon the case’s personalised e↵ect size, is
P (xi|i, di = 1) =g(0 + ixi)p(xi)Px0i
g(0 + ix0i)p(x
0i). (6)
The expected dosage of the risk allele in cases is then
µx = E[xi|di = 1]
=
Z
i
X
xi
xiP (xi|i, di = 1)
!P (i)di, (7)
where P (i) is the normal density with mean and variance v
2 (taken from equation 3).The variance in risk allele dosage in cases is given by
2x = V ar[xi|di = 1]
=
Z
i
X
xi
x
2iP (xi|i, di = 1)
!P (i)di E[xi|di = 1]2 (8)
The covariance in major locus dosage between two individuals i and j with a kinship coecientij can be calculated using
E[xixj |di = 1, dj = 1,ij ] =
Z
i
Z
j
0
@X
xi
X
xj
xixjP (xi = 1|i, di = 1)P (xj |j , dj = 1)
1
AP (i,j |ij)didj
Cov[xi, xj |di = 1, dj = 1] = E[xixj |di = 1, dj = 1,ij ] E[xi|di = 1]2 (9)
2
Nature Genetics: doi:10.1038/ng.3395

where P (i,j |ij) is a multivariate normal density, with mean, variance and covariance takenfrom equation 3.
The heritability h
2x can be estimated by calculating the covariance for various kinship values,
and fitting a linear model where
Cov[xi, xj |di = 1, dj = 1]
V ar[xi|di = 1]= h
2xij (10)
For some choices of link function the true covariance will not be linearly dependent on the kin-ship coecient, and so this linear will be an approximation. To test how close this approximationis, we calculated model parameters under the logit link model, assuming a major allele with a riskallele frequency of 30% and an odds ratio of 2 for a disease with a prevalence of K = 0.01. Wevaried the disease prevalence and the size of the epistatic e↵ect (measured by the coecient ofvariation v
).
For these parameters the logit model induced a additive heritability of major allele in cases,in the sense that the correlation in major allele count was very close to linearly proportion to thecoecient of relatedness, as shown in the following figure:
x x x x x x x x x x x x x x x x x x x x x x x x x x x x x x x x x x x x x x x x x x x x x x x x x x x
0.0 0.1 0.2 0.3 0.4 0.5
0.00
0.02
0.04
0.06
0.08
Kinship coefficient
Cor
rela
tion
in m
ajor
alle
le d
ose
x x x x x x x x x x x x x x x x x x x x x x x x x x x x x x x x x x x x x x x x x x x x x x x x x x x
Coefficient of variation10.5
Relationship between kinship coecient and correlation in major allele count in cases for di↵erent coecients of
variation. K = 0.01, f = 0.3, = log(2). Crosses represent the actual values, and the lines show a linear fit by
least squares.
A.3 Strength of the induced heritability
To investigate the strength of the induced heritability, we calculated model parameters under thelogit link model. As above, we looked at a major allele with a risk allele frequency of 30% and anodds ratio of 2, and varied the coecient of variation v
. The results are shown in the following
figure:
3
Nature Genetics: doi:10.1038/ng.3395

0.0 0.5 1.0 1.5 2.0
0.0
0.1
0.2
0.3
Coefficient of variation
Indu
ced
herit
abilit
y
Prevalence of disease (%)
Indu
ced
herit
abilit
y
0.00
0.05
0.10
0.15
0.20
0.01 0.1 0.5 1 2 5 10 20 50
K = 0.01, f = 0.3, = log(2) f = 0.3, = log(2), v= 1
Induced heritability of major allele count in cases under a logit link for di↵erent coecients of variation and preva-
lence.
For a relatively rare disease (K = 0.01) genome-wide epistasis creates a detectable heritabilityof major alleles in cases (h2
x > 0.1) when the coecient of variation rises around 70% or so (leftpanel). For common diseases (K > 0.02) the induced heritability falls o↵ rapidly (right panel).
A.4 Correcting for population stratification
HLA alleles are highly stratified geographically, and this population stratification could also con-tribute to a heritability of HLA alleles (as geographically close individuals will have both moresimilar HLA alleles and higher genome-wide relatedness). However, if cases and controls are wellmatched, this heritability due to stratification will be similar in cases and in controls. Thus tocorrect for stratification we calculate the heritability of HLA alleles in both cases and controls, andsubtract the with-control heritability from the with-case heritability to estimate the heritabilityinduced by epistasis h2
x.
A.5 Comparison with GCTA’s GxqE method
Our method above is similar to the gene-environment interaction methods included in GCTA7,and in particular with the GxqE method for estimating a variance component due to an interac-tion between polygenic risk and a quantitative environmental exposure. This method estimatesvariance components by fitting the following model:
~
d N
0 + ~x, VG+ VGxqE
0 + VeI
. (11)
where 0ij = ijxixj (i.e. the product of the genome-wide covariance and covariance in envi-
ronmental exposures). As with standard variance component methods for discrete diseases2, thebinary disease status is approximated as a normally distributed variable.
To see the connection between this random e↵ects model and our own, let us extend our modelgiven in equation 2 in a similar fashion. We will model the disease status as normal variable givenby a combination of the major locus e↵ect yi (including both marginal and epistasis e↵ects, as inequation 2), an additive polygenic component li N(0, VG) and an error term ei N(0, VeI),such that
di = yi + li + ei
= 0 + ixi + li + ei. (12)
4
Nature Genetics: doi:10.1038/ng.3395

Assuming no covariance between li and i (i.e. that e↵ect sizes for additive genetic risk lociand gene-environment interaction loci are independent) the covariance in disease status is thengiven by
Cov[di, dj ] = xixjCov[i,j ] + Cov[li, lj ] + Cov[ei, ej ]
= xixjv2ij + VGij + ijVe (13)
where ij is the delta function (ij = 1 if i = j and 0 otherwise).By comparison with equation 11, we can see that VGxqE = v
2. This means that if the environ-mental exposure is substituted for the dosage of a major risk locus, the GxqE variance componentestimated by GCTA is also an estimate of the epistatic variance due to polygenic interaction withthat major locus.
In essence, both GCTA’s GxqE method, and our induced heritability method, aim to infer thesame parameter. However, while our method uses an explicit link function to model case-controlstatus as a binary variable, and applies the linear mixed model approximation to the conditionalallele dosage xi|di, the GxqE method applies the approximation directly to the disease status di.
A.6 Simulation study
To validate that the method works as expected, and to investigate the power of the method, wecarried out a simulation study. We calculated the power and distribution of estimated inducedheritabilities and p-values across simulations for di↵erent values of the simple size N and epistaticvariance v2. In all cases we simulated a disease with K = 0.01, an HLA locus with allele frequencyfHLA = 0.143 and e↵ect size HLA = log(3.78) (i.e. the observed allele frequency and e↵ect sizefor HLA-DRB1*15:01). We assumed that Immunochip variants accounted for 20% of the additivevariance of the disease on the liability scale.
We generated a large simulated Immunochip test population of 1 million individuals to testthe method (i.e. a large enough population to see significant numbers of a↵ected individuals evenwith K = 0.01). We constructed this set using seed data from 8783 QC+ UK controls with 161119QC+ SNPs. We first phased each chromosome using SHAPEIT23 (r790) with default parameters,and we then generated new simulated individuals from these haplotypes using HAPGEN5 (v2.2.0),again with default settings.
For a given simulation, we picked 1000 simulated causal variants from the set of all non-HLAImmunochip variants with a minor allele frequency greater than 0.1%. For each locus g we assignedan additive e↵ect size
addg and an epistatic e↵ect size
epig .
addg were drawn from N(0,2
add),where add = 0.046 was chosen such that these variants explained 20% of the additive varianceon the liability scale. epi
g were drawn from N(0, v2), as we drawn independently of addg . Finally,
we assigned an HLA dosage to each individual, drawn from binomial(2, fHLA).We then assigned each individual as a case with a probability equal to
P = logit
µ+ xHLA(HLA +
X
g
q2fg(1 fg)
epig xg) +
X
g
q2fg(1 fg)
addg xg)
!(14)
where xHLA and xg are genotype dosages at HLA and non-HLA loci respectively, and where µwas selected such that E[P (D)] = K. To produce the final simulated dataset we randomly selectedN of these cases and N controls (i.e. non-cases), and then calculated the induced heritability ofthe HLA allele in cases and controls. We repeated the whole process 100 times (starting withdrawing the 1000 causal variants) for each tested value of N and v
2.The estimated induced heritabilities across the simulations are shown in the figures below:
5
Nature Genetics: doi:10.1038/ng.3395

v/HLA = 0
v/HLA = 0.5
v/HLA = 1The estimated induced heritability for three di↵erent coecients of variation. The blue line shows the expected
induced heritability using equations 9 and 10.
The estimated parameter is distributed around zero in the purely additive case (i.e. whenv = 0, top panel), and the distribution of p-values is uniform. In the presence of epistasis (middleand bottom panels) the estimates of the induced heritability are centered on the true heritabilityexpected from the equations given in section A.2 above, and the range of the estimates tightenaround the true value as the sample size increases.
The results of the power calculates are shown in the following figure:
6
Nature Genetics: doi:10.1038/ng.3395
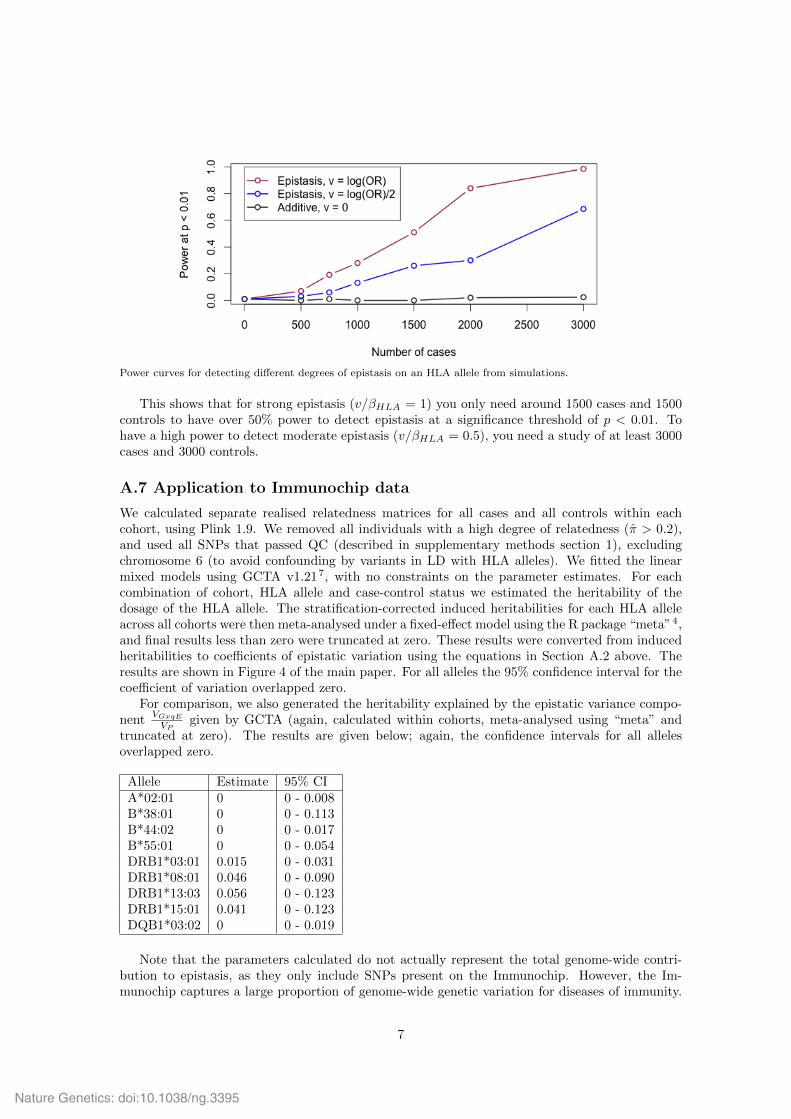
Power curves for detecting di↵erent degrees of epistasis on an HLA allele from simulations.
This shows that for strong epistasis (v/HLA = 1) you only need around 1500 cases and 1500controls to have over 50% power to detect epistasis at a significance threshold of p < 0.01. Tohave a high power to detect moderate epistasis (v/HLA = 0.5), you need a study of at least 3000cases and 3000 controls.
A.7 Application to Immunochip data
We calculated separate realised relatedness matrices for all cases and all controls within eachcohort, using Plink 1.9. We removed all individuals with a high degree of relatedness ( > 0.2),and used all SNPs that passed QC (described in supplementary methods section 1), excludingchromosome 6 (to avoid confounding by variants in LD with HLA alleles). We fitted the linearmixed models using GCTA v1.217, with no constraints on the parameter estimates. For eachcombination of cohort, HLA allele and case-control status we estimated the heritability of thedosage of the HLA allele. The stratification-corrected induced heritabilities for each HLA alleleacross all cohorts were then meta-analysed under a fixed-e↵ect model using the R package “meta”4,and final results less than zero were truncated at zero. These results were converted from inducedheritabilities to coecients of epistatic variation using the equations in Section A.2 above. Theresults are shown in Figure 4 of the main paper. For all alleles the 95% confidence interval for thecoecient of variation overlapped zero.
For comparison, we also generated the heritability explained by the epistatic variance compo-nent V
GxqE
VP
given by GCTA (again, calculated within cohorts, meta-analysed using “meta” andtruncated at zero). The results are given below; again, the confidence intervals for all allelesoverlapped zero.
Allele Estimate 95% CIA*02:01 0 0 - 0.008B*38:01 0 0 - 0.113B*44:02 0 0 - 0.017B*55:01 0 0 - 0.054DRB1*03:01 0.015 0 - 0.031DRB1*08:01 0.046 0 - 0.090DRB1*13:03 0.056 0 - 0.123DRB1*15:01 0.041 0 - 0.123DQB1*03:02 0 0 - 0.019
Note that the parameters calculated do not actually represent the total genome-wide contri-bution to epistasis, as they only include SNPs present on the Immunochip. However, the Im-munochip captures a large proportion of genome-wide genetic variation for diseases of immunity.
7
Nature Genetics: doi:10.1038/ng.3395

For instance, Chen et al 1 found that >70% of genetic variation in inflammatory bowel diseaserisk tagged by GWAS arrays was also tagged by the Immunochip. Thus, while the contributionof epistasis is likely underestimated, the degree of underestimation should be small.
References
[1] G. B. Chen, S. H. Lee, M. J. Brion, G. W. Montgomery, N. R. Wray, et al. Estimation andpartitioning of (co)heritability of inflammatory bowel disease from GWAS and immunochipdata. Hum. Mol. Genet., 23(17):4710–4720, Sep 2014.
[2] S. H. Lee, N. R. Wray, M. E. Goddard, and P. M. Visscher. Estimating missing heritability fordisease from genome-wide association studies. Am. J. Hum. Genet., 88(3):294–305, Mar 2011.
[3] J. O’Connell, D. Gurdasani, O. Delaneau, N. Pirastu, S. Ulivi, M. Cocca, M. Traglia, J. Huang,J. E. Hu↵man, I. Rudan, R. McQuillan, R. M. Fraser, H. Campbell, O. Polasek, G. Asiki,K. Ekoru, C. Hayward, A. F. Wright, V. Vitart, P. Navarro, J. F. Zagury, J. F. Wilson,D. Toniolo, P. Gasparini, N. Soranzo, M. S. Sandhu, and J. Marchini. A general approach forhaplotype phasing across the full spectrum of relatedness. PLoS Genet., 10(4):e1004234, Apr2014.
[4] Guido Schwarzer. meta: Meta-Analysis with R, 2014. URLhttp://CRAN.R-project.org/package=meta. R package version 4.0-1.
[5] Z. Su, J. Marchini, and P. Donnelly. HAPGEN2: simulation of multiple disease SNPs. Bioin-formatics, 27(16):2304–2305, Aug 2011.
[6] J. Yang, B. Benyamin, B. P. McEvoy, S. Gordon, A. K. Henders, D. R. Nyholt, P. A. Madden,A. C. Heath, N. G. Martin, G. W. Montgomery, M. E. Goddard, and P. M. Visscher. CommonSNPs explain a large proportion of the heritability for human height. Nat. Genet., 42(7):565–569, Jul 2010.
[7] J. Yang, S. H. Lee, M. E. Goddard, and P. M. Visscher. GCTA: a tool for genome-widecomplex trait analysis. Am. J. Hum. Genet., 88(1):76–82, Jan 2011.
8
Nature Genetics: doi:10.1038/ng.3395

Country Abbr Case Control
Australia and New Zealand AUSNZ 1021 947
Belgium BEL 313 1705
Denmark DEN 890 835
Finland FIN 471 488
France FRA 387 354
Germany GER 2621 6308
Italy ITA 962 1256
Norway NOR 911 701
Sweden SWE 2740 2872
UK UK 4542 9359
USA USA 2607 5560
ALL ALL 17465 30385
Supplementary Table 1. Number of cases and controls across the 11 cohorts investigated in this study.
Locus Accuracy
T=0 Accuracy
T=0.7 Call Rate
T=0.7 HLA-A 0.97 0.97 0.98 HLA-B 0.95 0.98 0.94 HLA-C 0.97 0.97 0.99 HLA-DPB1 0.9 0.98 0.85 HLA-DQA1 0.98 0.98 0.97 HLA-DQB1 0.97 0.98 0.99 HLA-DRB1 0.91 0.95 0.9 HLA-DRB3 0.94 0.96 0.96 HLA-DRB4 0.98 0.98 0.98 HLA-DRB5 0.99 1 1
Supplementary Table 2. Imputation accuracy at 4-digit type resolution in a 2/3-1/3 cross validation experiment without applying a call threshold (T) on the posterior probabilities (call rate=100%, 2nd column), and with applying a threshold of T=0.7 (3rd column, with call rate shown at column 4).
Allele No call threshold T=0.7
Sensitivity Specificity PPV Sensitivity Specificity PPV
A*02:01 1 1 0.96 1 1 0.96 B*44:02 0.99 1 0.98 0.99 1 0.99 B*38:01 1 1 0.89 1 1 0.92 B*55:01 1 1 1 1 1 1 DRB1*15:01 1 1 0.98 1 1 0.98 DRB1*13:03 0.93 1 1 1 1 1 DRB1*08:01 1 1 0.84 1 1 0.84 DRB1*03:01 0.99 1 0.99 0.99 1 1 DQA1*01:01 1 1 1 1 1 1 DQB1*03:02 0.97 0.99 0.95 0.97 0.99 0.95 DQB1*06:02 0.99 1 0.98 0.99 1 0.99 DRB1*01:01 0.82 0.99 0.9 0.99 0.99 0.9
Supplementary Table 3. Allele-specific sensitivity, specificity and positive predictive value (PPV) for alleles discussed in the main text. Statistics are calculated from 2/3 – 1/3 cross-validation experiment at a 4-digit level resolution, without applying a call threshold (T) on posterior probabilities (call rate=100%, columns 2-4) , and with applying a threshold of T=0.7 (columns 5-7).
Nature Genetics: doi:10.1038/ng.3395

Supplementary Table 5: Patient counts across cohorts for the secondary phenotypes analysed in this study. AAO: Age at onset; MSSS: multiple sclerosis severity score.
Cohort AAO Clinical Course MSSS MSSS<2.5 MSSS>7.5
AUSNZ 794 810 713 177 151 BEL 298 295 271 79 80 DEN 889 890 885 231 138 FIN 275 290 246 63 64 FRA 366 366 360 93 69 GER 391 2046 352 130 30 ITA 910 924 833 439 52 NOR 812 880 406 123 111 SWE 2375 2298 1998 699 381 UK 3909 3651 2001 436 531 USA 1122 1141 1043 407 161
Supplementary Table 4. Comparison of models for multiple sclerosis disease risk and age at onset. For disease risk, all other effects reported in Supplementary Table 4 are included. All models have the same number of parameters, hence the results are equivalent in ranking for Akaike Information Criterion (AIC) and Bayesian Information Criterion (BIC). The model with the highest likelihood is identified in orange and the model with the second highest likelihood is identified in yellow.
Main effect Second effect Second locus effect Disease Risk Age at Onset AIC in UK AIC in All AIC in UK AIC in All
DRB1*15:01 DQA1*01:01 Additive 15751 56435 29296 90472 DRB1*15:01 DRB1*01:01 Additive 15757 56437 29294 90467 DRB1*15:01 DQB1_AA70.G Hom 15733 56382 30130 85297 DRB1*15:01 DQA1*01:01 Interaction 15722 56378 30135 85316 DRB1*15:01 DRB1*01:01 Interaction 15734 56413 30134 85315 DRB1*15:01 DQB1_AA70.G Hom interaction 15727 56354 30131 85305 DQB1*06:02 DQA1*01:01 Additive 15829 56730 29296 90471 DQB1*06:02 DRB1*01:01 Additive 15837 56737 29293 90466 DQB1*06:02 DQB1_AA70.G Hom 15825 56701 30130 85296 DQB1*06:02 DQA1*01:01 Interaction 15812 56695 30135 85316 DQB1*06:02 DRB1*01:01 Interaction 15821 56723 30134 85314 DQB1*06:02 DQB1_AA70.G Hom interaction 15826 56696 30131 85305
Nature Genetics: doi:10.1038/ng.3395