natural selection on human microrna binding sites inferred from snp data
TRANSCRIPT

Natural selection on human microRNA binding sitesinferred from SNP dataKevin Chen1 & Nikolaus Rajewsky1,2
A fundamental problem in biology is understanding how naturalselection has shaped the evolution of gene regulation. Herewe use SNP genotype data and techniques from populationgenetics to study an entire layer of short, cis-regulatory sites inthe human genome. MicroRNAs (miRNAs) are a class of smallnoncoding RNAs that post-transcriptionally repress mRNAthrough cis-regulatory sites in 3¢ UTRs. We show that negativeselection in humans is stronger on computationally predictedconserved miRNA binding sites than on other conservedsequence motifs in 3¢ UTRs, thus providing independent supportfor the target prediction model and explicitly demonstrating thecontribution of miRNAs to darwinian fitness. Our techniquesextend to nonconserved miRNA binding sites, and we estimatethat 30%–50% of these are functional when the mRNA andmiRNA are endogenously coexpressed. As we show thatpolymorphisms in predicted miRNA binding sites are likely tobe deleterious, they are candidates for causal variants of humandisease. We believe that our approach can be extended tostudying other classes of cis-regulatory sites.
Despite longstanding interest in the evolution of human gene regula-tion, it is only recently that data have become available to study thisprocess genome-wide, with the emergence of SNP genotype data inthree human populations from the HapMap1 and Perlegen2 projectsand multiple sequenced mammalian genomes. Here we focus onmiRNAs, which are thought to regulate 430% of human protein-coding genes and have crucial roles in development and metabo-lism3,4. Naturally occurring polymorphisms in miRNA binding siteshave been implicated in Tourette’s syndrome in humans5 and muscu-larity in sheep6, and a set of SNPs in miRNA-associated motifs hasbeen collected6.
Several groups have computationally predicted a large class ofmiRNA binding sites (hereafter referred to as miRNA sites) using amodel in which miRNA-mRNA binding is nucleated by an exactWatson-Crick match to the first six to eight bases from the 5¢ end ofthe miRNA (reviewed in ref. 3). Using this approach, we predictedB22,000 miRNA sites conserved in five mammals (see Methods).Previous analyses using comparative genomics suggested an averagefalse positive rate of B50% for predicted miRNA sites conserved in
these species3. However, this estimate is likely to be conservative as it isdifficult to construct sets of nonfunctional sequences as controls, andthe approach gives no estimate for nonconserved miRNA sites.
Genome-wide SNP genotype data provide a new approach forstudying cis-regulatory sites. It has recently been shown7 that SNPdensity in exonic splicing enhancers is lower than expected, suggestingnegative selection, but with the caveat that SNP density is sensitive tomutation rate biases (such as those due to base composition). Othergroups used genotype data to demonstrate negative selection, asopposed to a lower mutation rate, on conserved noncoding regions,but they made no explicit connection to cis-regulatory sites (see ref. 8and references therein). These studies examined only the averageintensity of selection on an entire class of elements and not thedistribution of selective effects within the class.
Here we use SNP density and genotype data from three humanpopulations to study miRNA-mediated gene regulation. We mappedB25,000 SNPs genotyped in the HapMap and Perlegen projects tohuman 3¢ UTRs, of which 384 mapped to conserved miRNA sites. Wefound that SNP density in conserved miRNA sites (0.50 SNPs/kb) waslower than in conserved control sites (0.73 SNPs/kb; see Methods) andthat SNP density was significantly lower in the region matching the5¢ end of the miRNA than in the rest of the site (Fig. 1; w2 test, P¼ 5 �10–5). Because we used conservation in the 5¢ region for targetprediction, we verified that the difference in SNP density betweenthe two regions was significantly larger in predicted miRNA sites thanin conserved control sites (w2 test, P ¼ 0.0004). We also observed aslight enrichment for SNPs that preserve GU base pairings in thebinding site compared with those in 3¢ UTRs overall (w2 test, P¼ 0.13),suggesting that GU base pairings may be tolerated in some cases.Because the SNP density analysis supported the target model, weconcentrated on SNPs in bases 2–7 of miRNA sites, which are believedto be the most important bases for miRNA target recognition3.
As SNP density is sensitive to mutation rate heterogeneity, wecorroborated our findings using derived allele frequency (DAF) data(Methods), which is robust to these effects9. Given a set of SNPs, anexcess of rare derived alleles is a signature of negative selection.Because ascertainment bias with SNP data is well known10, we avoidedmethods that compare SNPs with neutral models (such as Tajima’s D)and instead compared different DAF distributions directly using a
Received 6 July; accepted 21 September; published online 29 October 2006; doi:10.1038/ng1910
1Center for Comparative Functional Genomics, Department of Biology, New York University, New York, New York 10003, USA. 2Max Delbruck Centrum fur MolekulareMedizin, Robert-Rossle-Strasse 10, Berlin-Buch, Germany. Correspondence should be addressed to N.R. ([email protected]).
1 45 2 VOLUME 38 [ NUMBER 12 [ DECEMBER 2006 NATURE GENETICS
LET TERS©
2006
Nat
ure
Pub
lishi
ng G
roup
ht
tp://
ww
w.n
atur
e.co
m/n
atur
egen
etic
s

Mann-Whitney test11. This approach is still sensitive to ascertainmentbias between functional classes (for example, synonymous and non-synonymous sites), so we focused on SNPs in 3¢ UTRs, for whichascertainment bias should be uniform.
In the HapMap data, we found that the DAF distributionof these SNPs was significantly skewed toward rare alleles in allthree populations relative to synonymous sites, nonsynonymoussites, 3¢ UTRs and conserved 7-mers in 3¢ UTRs (P values inTable 1; Fig. 2). In the Perlegen data, we found similar trends(P values in Table 1; Supplementary Fig. 1 online), althoughstatistical significance is lower, probably owing to the smallernumber of SNPs. Although nonselective forces such as demography,drift and hitchhiking can affect allele frequencies9, they shouldaffect all functional classes equally. Thus, the DAF analysis is indicativeof stronger negative selection acting on predicted conserved miRNAsites than on other major functional classes. This includes otherconserved 7-mers in 3¢ UTRs (many of which should be functional)which should have the same ascertainment bias as conservedmiRNA sites.
Polymorphism data are generally informative only of weak selectiveeffects in recent evolution (B80,000 years in the human lineage),whereas divergence data are potentially informative of strongerselective effects and more distant evolutionary events (B6 millionyears in the human lineage)12. Thus, we used the McDonald-Kreitmantest13 which compares levels of intraspecies polymorphism and inter-species divergence in two classes of sites assumed a priori to experiencedifferent selective intensities. Weakly deleterious mutations contributemore to polymorphism than to divergence, soan excess of polymorphism is consistent withnegative selection13. When comparing con-served miRNA sites with either 3¢ UTRs orconserved 7-mers in 3¢ UTRs, we found morepolymorphism than divergence in conservedmiRNA sites, suggesting stronger negativeselection on conserved miRNA sites, althoughthis result was not statistically significant(Supplementary Methods online). This resultcan be reconciled with the previous analysesby hypothesizing that some miRNA sites areeither neutrally or adaptively evolving, thusinflating the amount of divergence andreducing the statistical power to detect nega-tive selection.
To test this hypothesis, we turned to thePoisson Random Field (PRF) framework14.We used a likelihood approach to fit a PRFmixture model with two classes of sites, onewith selection coefficient r0 and the otherwith selection coefficient Z0, to the DAFdata. We used formal likelihood ratio tests toshow that this model fits the data significantlybetter (w2, 1 degree of freedom, P o 1.2 �10–7) than one- or three-class mixture models(Supplementary Methods). We then usedthe two-class PRF mixture model to estimatethe fraction of functional and nonfunctionalmiRNA sites. The maximum likelihoodfit was achieved for a model in which 85%of the conserved miRNA sites are undernegative selection (in other words, arefunctional) (Supplementary Methods),
which is a higher estimate than previous comparative genomicanalyses3 but is concordant with experimental evidence from Droso-phila melanogaster15.
Next we extended our analysis to nonconserved miRNA sites bypredicting B600,000 miRNA sites genome-wide for all 328 knownhuman miRNAs16 (Methods). Several groups have suggested thatmany of nonconserved sites are functional when the mRNA isexpressed in the same tissue as the miRNA and that there is wide-spread selection for mRNAs (‘anti-targets’) to avoid miRNA sites thatwould otherwise be detrimental3,15,17–19. We investigated both gainsand losses of nonconserved miRNA sites genome-wide but did notfind any evidence that they are evolving differently than 3¢ UTRsoverall in all populations when analyzing either the HapMap orPerlegen DAF distributions (one-sided Mann-Whitney, P 4 0.16)or the McDonald-Kreitman test (w2, P 4 0.48).
However, many predicted nonconserved miRNA sites may notbe endogenous targets because the mRNA and miRNA are notexpressed in the same spatiotemporal domain. Thus, we focused ona smaller set of B12,000 nonconserved miRNA sites in mRNAsexpressed in the same tissue as the miRNA (‘coexpressed’ miRNAsites; see Methods). In this set, we found that the DAF analysis wasindeed consistent with negative selection against the loss of noncon-served miRNA sites when compared with 3¢ UTRs overall in theHapMap data (P o 0.02) (Fig. 3), and the Perlegen data showed asimilar trend that was less significant (P o 0.08), probably owing tothe smaller number of SNPs (Supplementary Fig. 2 online). We usedthe same PRF approach as before to estimate that 30%–50% of
Table 1 Derived allele frequency analysis of SNPs in conserved miRNA sites
Data set Population Synonymous Nonsynonymous 3¢ UTR
3¢ UTR
conserved 7-mers
Number of
SNPs
HapMap European 8.5 � 10–7 0.0001 0.0001 0.004 48
Chinese + Japanese 2.8 � 10–7 0.0001 0.001 0.03 50
Yoruban (Nigerian) 1.7 � 10–5 0.004 0.0005 0.03 47
Perlegen European 0.07 0.2 0.04 0.17 35
Chinese 0.01 0.05 0.01 0.05 35
African American 0.003 0.04 0.002 0.04 35
P values in a one-sided Mann-Whitney U test comparing the derived allele frequency (DAF) distribution of SNPsin conserved miRNA sites with the distribution of SNPs in other major functional classes of nucleotides. Boldfaceindicates P 4 0.05. The last column refers to the number of SNPs in conserved miRNA sites. The number of SNPsin 3¢ UTR conserved 7-mers is 4989 in all populations, and the number of SNPs in the synonymous, nonsynonymousand 3¢ UTR classes is 43,421 in all populations.
0.08
0.07
0.06
0.05
0.04
Frac
tion
of S
NP
s
0.03
0.02
0.01
01 2 3 4 5 6 7 8 9 10
Position in binding site111213141516171819202122
0.08
0.07
0.06
0.05
0.04
Frac
tion
of S
NP
s
0.03
0.02
0.01
01 2 3 4 5 6 7 8 9 10
Position in binding site11 12 13 14 15 16 17 1819 20 21 22
a b
Figure 1 SNP density in conserved miRNA sites. (a,b) SNP density in (a) predicted conserved miRNAbinding sites and (b) conserved random controls. The dotted lines track the average SNP density in the
region matching the 5¢ end of the miRNA (bases 1–8; region 1) and the rest of the binding site (bases
9–22; region 2). The significant difference in SNP density between regions 1 and 2 of conserved
miRNA binding sites (w2, P ¼ 5 � 10–5), when compared with the much smaller difference between
regions 1 and 2 of conserved random controls, supports the target prediction model (w2, P ¼ 0.0004).
NATURE GENETICS VOLUME 38 [ NUMBER 12 [ DECEMBER 2006 1 45 3
LET TERS©
2006
Nat
ure
Pub
lishi
ng G
roup
ht
tp://
ww
w.n
atur
e.co
m/n
atur
egen
etic
s

coexpressed sites are functional (Supplementary Methods), consistentwith previous estimates17 and other results18,19.
We also observed greater negative selection against gaining anmiRNA site than on 3¢ UTRs overall in the Yoruban HapMappopulation (one-sided Mann-Whitney, P ¼ 0.027), although theevidence was weaker or not present in the other populations(Fig. 3). Although the general concordance between the HapMap(Fig. 3) and Perlegen data (Supplementary Fig. 2) for the patternsobserved in Europeans, Africans and Asians suggests a true underlyingbiological cause, with the current data, we conclude that there isevidence for selection against gaining sites (‘anti-targets’), but it isweaker than that for selection against losing sites. One possibility isthat anti-targets are not as common as true targets. Another possibleexplanation stems from the difficulty of defining ‘nonconservation’, assites could be evolutionarily conserved but not detected as such owingto technical reasons (such as misalignment), biological reasons (suchas genome rearrangements), or target model insufficiencies3. Forexample, for 29% of the ‘nonconserved’ human sites, a motifcomplementary to bases 2–7 of the miRNA appears somewhere inthe orthologous 3¢ UTR of each of the other four species. Thus, it ispossible that fewer than 30%–50% of true evolutionarily noncon-served sites are functional. This issue should be revisited when betterexpression and SNP data are available.
Finally, we screened for recent positive selection on miRNA sites(within the last 50,000–75,000 years12) by identifying SNPs in con-served miRNA sites whose allele frequencies are highly differentiated inAfricans, Asians and Europeans, as measured by the Fst parameter
(see Methods). Although some variation in Fst is expected fromnonselective processes, an unusually high Fst suggests recent localselection. This analysis does not necessarily pinpoint the causativeallele but localizes the putative selective event to a genomic region. Werestricted our search to SNPs with global heterozygosity 40.1, as theseare the only SNPs informative of population differentiation. Out of25 informative SNPs, we identified a single SNP (rs1054528), locatedin a conserved binding site of miR-204 and miR-211 in the Map1lc3bgene, with an Fst higher than 99.8% of SNPs in 3¢ UTRs with the sameheterozygosity. The site is present in 87% of Africans but absent inalmost all Europeans and Asians. Post-transcriptional misregulation ofthis gene has been implicated in giant axonal neuropathy20 and FragileX syndrome21, and the latter has been linked to miRNAs22. We notethat although positive selection is generally rare in species with smalleffective population sizes, like humans, it may be easier to detectpositive selection on miRNA sites in species with larger effectivepopulation sizes, like Drosophila.
In conclusion, we have used human SNP genotype data to showthat there is significant negative selection acting on a large class ofcomputationally predicted conserved miRNA target sites and toestimate that B85% of them are functional. We have also used thisapproach to estimate that 30%–50% of nonconserved miRNA sites inhuman 3¢ UTRs are functional when expressed in the same tissue asthe miRNA. These estimates were derived using the PRF model, whichdepends crucially on the assumption of independent evolutionbetween SNPs. This assumption may be more reasonable for geno-typed SNP data and short cis-regulatory sites for many trans-acting
a b0.9 c0.8
0.7
0.6
0.5
0.4
0.3
Frac
tion
of S
NP
s
0.2
0.1
0.1 0.2 0.3 0.4 0.5Derived allele frequency
0.6 0.7 0.8 0.9 10
0.8
0.7
0.6
0.5
0.4
Frac
tion
of S
NP
s
0.3
0.2
0.1
0.1 0.2 0.3 0.4 0.5Derived allele frequency
0.6 0.7 0.8 0.9 10
0.7
0.6
0.5
0.4
Frac
tion
of S
NP
s
0.3
0.2
0.1
0.1 0.2 0.3 0.4 0.5Derived allele frequency
0.6 0.7 0.8 0.9 10
Figure 2 DAF distributions in conserved miRNA sites suggests stronger negative selection compared with other conserved 7-mers in 3¢ UTRs. (a–c) Derived
allele frequency (DAF) distributions of HapMap SNPs in conserved miRNA sites in (a) Europeans, (b) Asians (Chinese and Japanese) and (c) Yorubans.
An excess of derived alleles with low frequencies is indicative of weak negative selection. Dark blue: synonymous sites, purple: 3¢ UTRs, yellow: conserved
3¢ UTR 7-mers, light blue: nonsynonymous sites, red: conserved miRNA sites. Error bars represent s.d. from 1,000 independent bootstrap replicates.
a b c0.7
0.6
0.5
0.4
Frac
tion
of S
NP
s
0.3
0.2
0.1
0.1 0.2 0.3 0.4 0.5
Derived allele frequency
0.6 0.7 0.8 0.9 10
0.7
0.6
0.5
0.4
Frac
tion
of S
NP
s
0.3
0.2
0.1
0.1 0.2 0.3 0.4 0.5
Derived allele frequency
0.6 0.7 0.8 0.9 10
0.7
0.6
0.5
0.4
Frac
tion
of S
NP
s
0.3
0.2
0.1
0.1 0.2 0.3 0.4 0.5
Derived allele frequency
0.6 0.7 0.8 0.9 10
Figure 3 DAF distributions in nonconserved miRNA sites coexpressed with the miRNAs. (a–c) DAF distributions of HapMap SNPs in coexpressed miRNA
sites in (a) Europeans, (b) Asians (Chinese and Japanese) and (c) Yorubans. An excess of polymorphisms with low frequencies is indicative of weak negative
selection. Dark blue: synonymous sites, purple: 3¢ UTRs, yellow: gained or lost nonconserved miRNA sites, light blue: coexpressed nonconserved miRNA
sites being lost in humans, red: coexpressed nonconserved miRNA sites being gained in humans. Compared with 3¢ UTRs, the significant excess of low-
frequency derived alleles in lost coexpressed nonconserved sites indicates weak negative selection against losing such miRNA sites in humans. Support
for negative selection against gaining such miRNA sites is weaker. Error bars represent s.d. from 1,000 independent bootstrap replicates.
1 45 4 VOLUME 38 [ NUMBER 12 [ DECEMBER 2006 NATURE GENETICS
LET TERS©
2006
Nat
ure
Pub
lishi
ng G
roup
ht
tp://
ww
w.n
atur
e.co
m/n
atur
egen
etic
s
factors dispersed across the genome than for polymorphisms in thecoding sequences of one or a few genes, to which the PRF model istraditionally applied.
Furthermore, as we have shown that mutations in either con-served or coexpressed miRNA sites are often deleterious, they are goodcandidates for causal variants in disease mapping studies. All SNPs inmiRNA sites of various classes (Table 2) and the associated miRNAsites are available in the Supplementary Note and SupplementaryTables 1–3 online, and SNP data and miRNA target predictions areavailable from the UCSC genome browser23. We also note that ourconservative definition of a polymorphic site excludes other mutationsthat affect miRNA regulation, including SNPs in other regions of thesite5 and SNPs in miRNA genes themselves24,25, which should beinteresting for future investigations.
Finally, the approach taken in this study of analyzing genome-widepolymorphism in cis elements is not specific to miRNAs, SNPs orhumans but rather has the potential to be more widely used in futureinvestigations of other classes of cis elements and polymorphisms andother species.
METHODSAlignment data. We downloaded human RefSeq transcript annotations,
human consensus CDS (CCDS) annotations and 17-way vertebrate multiZ
alignments from the University of California, Santa Cruz (UCSC) browser23,
discarding transcripts that did not map uniquely to the human genome (release
hg17). We assembled the multiZ alignments into contiguous multiple align-
ments, as described previously in ref. 26, and discarded all species except for
the human, chimp, rhesus macaque, mouse, rat and dog. We removed
insertions or deletions in the alignment caused by other species not considered
in the analysis.
SNP data. We downloaded human SNP data (dbSNP build 125) from the
UCSC genome browser23 and discarded all insertion and deletion polymorph-
isms, SNPs with more than two alleles, SNPs monomorphic (that is, having
only one allele) in all populations and SNPs that did not map uniquely to the
human genome (release hg17). We downloaded genotype data from the
International HapMap Project1 (release 20) and Perlegen Sciences2. HapMap
SNPs were genotyped in 90 Yoruban individuals in Ibadan, Nigeria; 44 Japanese
in Tokyo; 45 Han Chinese in Beijing and 90 CEPH individuals (Utah residents
with ancestry from northern and western Europe). Following common
practice, we combined the Japanese and Chinese populations into one
population. Perlegen SNPs were genotyped in 23 African Americans, 24 Han
Chinese and 24 European Americans. For each of the three groups (Africans,
Europeans and Asians), we were able to map B21,000 HapMap SNPs and
B14,000 Perlegen SNPs to 3¢ UTRs, for a total of B25,000 genotyped SNPs in
3¢ UTRs.
Expression data. We compiled miRNA expression data comprising 31 miRNAs
and 45 miRNA-tissue assignments (Supplementary Table 4 online) from
ref. 17 and data described in ref. 27. We obtained mRNA expression data from
ref. 28 and processed it as previously described in ref. 27. An miRNA and an
mRNA are defined as ‘coexpressed’ if the mRNA is expressed at a level 41.2
times the median expression level in the tissue of miRNA expression. The
trends reported in the main text are robust for cutoffs in the range 1.0–1.3. At
lower cutoffs, the signal is not discernible above the noise, and at higher cutoffs,
there is too little data for statistical analysis (data not shown).
Conserved miRNA binding site predictions. For the SNP density analysis, we
use the term ‘miRNA site’ to refer to the entire 22-nt site in the 3¢ UTR
complementary to the miRNA. For the remainder of the analysis, we use the
term ‘miRNA site’ to refer a 6-mer in a 3¢ UTR with exact Watson-Crick
complementarity to bases 2–7 from the 5¢ end of the mature miRNA. We
predicted miRNA targets by searching for such 6-mers exactly conserved in
human, chimpanzee, mouse, rat and dog, requiring an additional match to
either base 1 or 8 of the mature miRNA in each species (not necessarily the
same base in all species). This method is similar to the core PicTar algorithm26,
but it ignores the relatively small number of predicted imperfect binding sites.
In total, we predicted B22,000 unique conserved miRNA sites using a set of 62
confidently defined vertebrate-conserved miRNAs26. For SNPs in binding sites,
we predicted a binding site if either allele of the SNP caused a binding site.
Similarly, we define a conserved 7-mer to be a stretch of seven bases in the
human genome that is exactly conserved in the same five species. Overlapping
conserved 7-mers are allowed, and, again, for SNPs in conserved 7-mers, both
alleles of the SNP were considered. This definition is conservative because it
probably includes sites complementary to miRNAs not in our set.
Nonconserved miRNA binding site predictions. We predicted B626,000 total
miRNA sites in the human genome for all 328 miRNAs in Rfam 8 with no
conservation filter16. We defined a set of ‘nonconserved sites’ by taking this set
and removing all conserved miRNA sites. We also remove nonconserved
miRNA sites for a particular miRNA that fall into the same 3¢ UTR as a
conserved miRNA site for the same miRNA, as selective pressure on these
redundant sites is not expected to be the same as that on nonredundant sites.
For example, if a 3¢ UTR contains a conserved site for let-7 and nonconserved
sites for let-7 and miR-1, we remove both let-7 sites for the nonconserved
analysis but retain the miR-1 site. After we filtered by expression, 4,764 mRNAs
remained. All conserved and coexpressed miRNA sites are given as Supple-
mentary Tables 1 and 2. Instructions for uploading these data into the UCSC
Genome Browser are given in the Supplementary Note.
SNP density analysis. For the SNP density analysis, we combined all SNPs
genotyped by either HapMap or Perlegen in each of three groups: Asians
(HapMap Chinese and Japanese and Perlegen Chinese), Africans (HapMap
Yoruban and Perlegen African American) and Europeans (HapMap European
and Perlegen European American). For the random controls in Figure 1b, we
took all 62 conserved miRNAs and shifted each one by 6, 8 and 10 bases, and
we used the resulting sequences with the above miRNA site prediction
algorithm to predict conserved control binding sites, averaging the results of
the three trials.
McDonald-Kreitman analysis. A full presentation and discussion of this
analysis is provided in the Supplementary Methods.
Derived allele frequency (DAF) analysis. For each SNP, we defined the
‘ancestral allele’ as the human allele equal to the chimpanzee allele at the
aligned base and the ‘derived allele’ as the other human allele. If the chimpanzee
allele did not match either human allele, we used the rhesus macaque allele as
the outgroup, and if this also did not match one of the human alleles, the SNP
was discarded for the DAF analysis. We were able to define a derived allele for
498% of genotyped SNPs in 3¢ UTRs. For miRNA sites containing a SNP, we
inferred a gain of a site if the derived allele created a binding site and a loss if
the ancestral allele created a binding site. The error bars in Figures 2 and 3
represent s.d. from 1,000 independent bootstrap replicates.
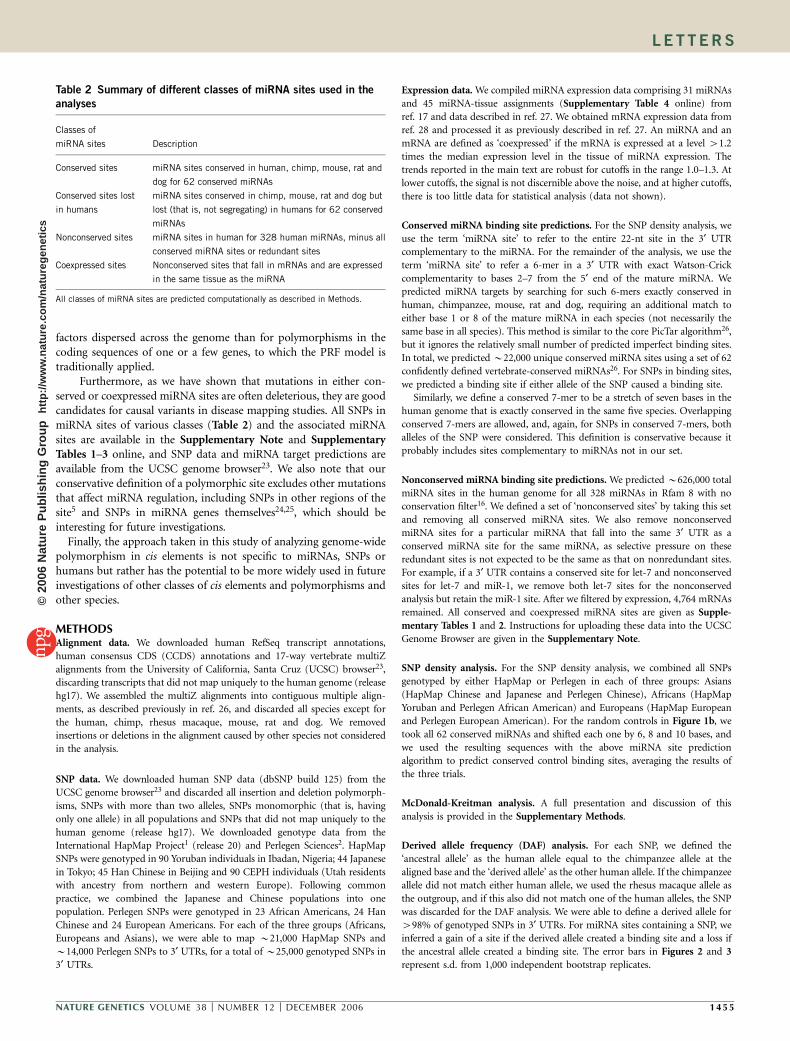
Table 2 Summary of different classes of miRNA sites used in the
analyses
Classes of
miRNA sites Description
Conserved sites miRNA sites conserved in human, chimp, mouse, rat and
dog for 62 conserved miRNAs
Conserved sites lost
in humans
miRNA sites conserved in chimp, mouse, rat and dog but
lost (that is, not segregating) in humans for 62 conserved
miRNAs
Nonconserved sites miRNA sites in human for 328 human miRNAs, minus all
conserved miRNA sites or redundant sites
Coexpressed sites Nonconserved sites that fall in mRNAs and are expressed
in the same tissue as the miRNA
All classes of miRNA sites are predicted computationally as described in Methods.
NATURE GENETICS VOLUME 38 [ NUMBER 12 [ DECEMBER 2006 1 45 5
LET TERS©
2006
Nat
ure
Pub
lishi
ng G
roup
ht
tp://
ww
w.n
atur
e.co
m/n
atur
egen
etic
s

Poisson random field analysis. A full presentation and discussion of this
analysis is provided in the Supplementary Methods.
Fst analysis. The inbreeding coefficient, Fst, is commonly used as a measure of
the differentiation of allele frequencies between different populations9. It can be
interpreted as the probability that two alleles are identical by descent. We
estimated Fst only for SNPs with genotype data in all three groups: Africans,
Asians and Europeans. To correct for small sample sizes, we estimated Fst using
the method of ref. 29. For SNPs genotyped by both projects, we combined all
the data into the three groups (Europeans, Asians and Africans) because the
allele frequencies in both projects are very similar (410,449 SNPs jointly
genotyped, Pearson’s R 4 0.97 in all three groups). As Fst is positively
correlated with predicted heterozygosity (that is, 2pq under Hardy-Weinberg
equilibrium), we binned the SNPs in increments of 0.05 in predicted hetero-
zygosity following ref. 30 and computed the empirical rank for the SNPs in
each bin separately.
URLs. International HapMap Project, http://www.hapmap.org; Perlegen
Sciences, http://genome.perlegen.com.
Note: Supplementary information is available on the Nature Genetics website.
ACKNOWLEDGMENTSWe thank P. Andolfatto, R. Borowsky, E. Halperin, N. Hubner and M. Siegalfor helpful discussions. We also thank E. van Nimwegen and R. Nielsen forcritical readings of a preliminary version of the manuscript. This research wassupported in part by the Howard Hughes Medical Institute grant through theUndergraduate Biological Sciences Education Program to New York University.
COMPETING INTERESTS STATEMENTThe authors declare that they have no competing financial interests.
Published online at http://www.nature.com/naturegenetics
Reprints and permissions information is available online at http://npg.nature.com/
reprintsandpermissions/
1. International HapMap Consortium. The International HapMap Project. Nature 426,789–796 (2003).
2. Hinds, D.A. et al. Whole-genome patterns of common DNA variation in three humanpopulations. Science 307, 1072–1079 (2005).
3. Rajewsky, N. microRNA target predictions in animals. Nat. Genet. 38, s8–13 (2006).4. Bartel, D.P. MicroRNAs: genomics, biogenesis, mechanism and function. Cell 116,
281–297 (2004).5. Abelson, J.F. et al. Sequence variants in SLITRK1 are associated with Tourette’s
syndrome. Science 310, 317–320 (2005).6. Clop, A. et al. A mutation creating a potential illegitimate microRNA target site
in the myostatin gene affects muscularity in sheep. Nat. Genet. 38, 813–818(2006).
7. Fairbrother, W.G., Holste, D., Burge, C.B. & Sharp, P.A. Single nucleotide polymorph-ism-based validation of exonic splicing enhancers. PLoS Biol. 9, E268 (2004).
8. Drake, J.A. et al. Conserved noncoding sequences are selectively constrained and notmutation cold spots. Nat. Genet. 38, 223–227 (2006).
9. Hartl, D.L. A Primer of Population Genetics (Sinauer, Sunderland, Massachusetts,2000).
10. Clark, A.G., Hubisz, M.J., Bustamante, C.D., Williamson, S.H. & Nielsen, R. Ascer-tainment bias in studies of human genome-wide polymorphism. Genome Res. 15,1496–1502 (2005).
11. Akashi, H. Inferring the fitness effects of DNA mutations from polymorphism anddivergence data: statistical power to detect directional selection under stationarity andfree recombination. Genetics 151, 221–238 (1999).
12. Sabeti, P.C. et al. Positive natural selection in the human lineage. Science 312,1614–1620 (2006).
13. McDonald, J.H. & Kreitman, M. Adaptive protein evolution at the Adh locus inDrosophila. Nature 351, 652–654 (1991).
14. Sawyer, S.A. & Hartl, D.L. Population genetics of polymorphism and divergence.Genetics 132, 1161–1176 (1992).
15. Stark, A., Brennecke, J., Bushati, N., Russell, R.B. & Cohen, S.M. Animal MicroRNAsconfer robustness to gene expression and have a significant impact on 3¢UTRevolution. Cell 123, 1133–1146 (2005).
16. Griffiths-Jones, S. et al. Rfam: annotating non-coding RNAs in complete genomes.Nucleic Acids Res. 33, D121–D124 (2005).
17. Farh, K.K. et al. The widespread impact of mammalian microRNAs on mRNArepression and evolution. Science 310, 1817–1821 (2005).
18. Krutzfeldt, J. et al. Silencing of microRNAs in vivo with ’antagomirs’. Nature 438,685–689 (2005).
19. Giraldez, A.J. et al. Zebrafish MiR-430 promotes deadenylation and clearance ofmaternal mRNAs. Science 312, 75–79 (2006).
20. Allen, E. et al. Gigaxonin-controlled degradation of MAP1B light chain is critical toneuronal survival. Nature 438, 224–228 (2005).
21. Lu, R. et al. The fragile X protein controls microtubule-associated protein 1B transla-tion and microtubule stability in brain neuron development. Proc. Natl. Acad. Sci. USA101, 15201–15206 (2004).
22. Jin, P., Alisch, R.S. & Warren, S.T. RNA and microRNAs in fragile X mental retardation.Nat. Cell Biol. 6, 1048–1053 (2004).
23. Karolchik, D. et al. The UCSC Genome Browser Database. Nucleic Acids Res. 31,51–54 (2003).
24. Gottwein, E., Cai, X. & Cullen, B.R. A novel assay for viral microRNA function identifiesa single nucleotide polymorphism that affects Drosha processing. J. Virol. 80, 5321–5326 (2006).
25. Iwai, N. & Naraba, H. Polymorphisms in human pre-miRNAs. Biochem. Biophys. Res.Commun. 331, 1439–1444 (2005).
26. Krek, A. et al. Combinatorial microRNA target predictions. Nat. Genet. 37, 495–500(2005).
27. Sood, P., Krek, A., Zavolan, M., Macino, G. & Rajewsky, N. Cell-type-specific signaturesof microRNAs on target mRNA expression. Proc. Natl. Acad. Sci. USA 103,2746–2751 (2006).
28. Su, A.I. et al. A gene atlas of the mouse and human protein-encoding transcriptomes.Proc. Natl. Acad. Sci. USA 101, 6062–6067 (2004).
29. Weir, B.S. & Cockerham, C.C. Estimating F-statistics for the analysis of populationstructure. Evolution 38, 1358–1370 (1984).
30. Rockman, M.V., Hahn, M.W., Soranzo, N., Zimprich, F. & Goldstein, D.B. Ancient andrecent positive selection transformed opioid cis-regulation in humans. PLoS Biol. 3,e387 (2005).
1 45 6 VOLUME 38 [ NUMBER 12 [ DECEMBER 2006 NATURE GENETICS
LET TERS©
2006
Nat
ure
Pub
lishi
ng G
roup
ht
tp://
ww
w.n
atur
e.co
m/n
atur
egen
etic
s