natural resources management department summary …
TRANSCRIPT
NATURAL RESOURCES MANAGEMENT DEPARTMENT SUMMARY
MISSION STATEMENT:
Foster sustainable use and stewardship of Brevard County’s natural resources through cost-effective, science-based and consensus-driven management actions.
PROGRAMS AND SERVICES:
ACCOMPLISHMENTS, INITIATIVES, TRENDS AND ISSUES AND SERVICE LEVEL IMPACTS:
SAVE OUR INDIAN RIVER LAGOON:
• Reduce New Pollution at the Source • Remove Old Pollution from the Lagoon • Restore Natural Filtration Services and Systems • Respond to New Information and Opportunities • Staff to the Citizens’ Oversight Committee
Accomplishments:
• Completed 23 projects removing over 25,000 pounds of nitrogen and nearly 2,700 pounds of phosphorus, to date
• Contracted for the construction of 21 projects • Contracted for the design and/or permitting of 33 projects • Approved funding for 43 new or substitute projects in the 2020 Plan Update • Refined stormwater and muck dredging priorities in the 2020 Plan Update • Added and updated an online story map for all projects approved to receive a funding
allocation • Launched grant programs to reimburse homeowners for sewer repairs, sewer connections and
septic upgrades • Launched Lagoon Loyal program to incentivize actions by businesses and residents to reduce
water pollution
Initiatives:
• Revise revenue projections in response to COVID-19 impacts on the local economy and sales tax collections
• Measure the performance of funded projects to reduce or remove pollution • Use actual costs from competitively bid projects to update cost estimates for planned projects • Refine cost-effectiveness of project types using field measurements of performance and
updated cost estimates • Refine pollution loading estimates for private package treatment plants • Test alternative media for passive inground nutrient reducing septic drain field upgrades
• Test alternative materials for oyster restoration • Analyze water quality and clarity data to track progress for improving health of the Indian River
Lagoon
Trends and Issues:
• Water quality and clarity are beginning to indicate multi-year trends toward improved conditions
• Reductions in anticipated revenues will require removing or reducing the funding for previously approved projects
• Monitor potential impacts to the Half Cent Sales Tax revenue as a result of the COVID-19 pandemic
Service Level Impacts:
Changes in revenue impact the degree of water quality and clarity improvement that can be accomplished by this program; However, sufficient Balance Forward is available to fund all projects anticipated to be ready to proceed in Fiscal Year 2021.
ENVIRONMENTAL RESOURCE MANAGEMENT:
• Development order review • Environmental regulation compliance • Ecosystems Management
Accomplishments:
• Timely review of record numbers of building permits, site plans, subdivisions and environmental applications
• Natural Resources received many code enforcement complaints, opened 99 cases and had a 43% compliance rate
• Completed FDEP grant early, harvesting plants from 30 stormwater ponds to reduce nutrient load to the Lagoon
• Approximately 200,000 visitors explored the Ritch Grissom Memorial Wetlands in Viera; volunteers have raised over $63,000 in donations and provided over 25,000 hours of service valued at over $630,000 over the last decade
Initiatives:
• Leading and participating in Lean Six Sigma projects • Seeking grants and donations to fund the longterm strategic plan for the Ritch Grissom
Memorial Wetlands • Continue to assess ordinances and policies to streamline implementation and improve
effectiveness
• Using continuing education opportunities to keep up with current rules and scientific standards and practices
• Reducing nutrient loading in stormwater ponds through new Ecosystem Management team • Revising work flow pattern in response to COVID-19 impacts with success in maintaining service
levels
Trends and Issues:
• Permit review activity in beginning of fiscal year was trending heavily upward; however, pressures from COVID-19 are expected to end Fiscal Year 2021 very close to the Fiscal Year 2020 level of approximately 8,000 reviews
• Revenues come from a number of sources including: permitting fees, code enforcement fines, payments for Alternative Landscape Enhancement Plans, General Fund, public donations for maintaining public access to the Viera Wetlands, fees for services rendered to other departments and balance forward; all of these revenue sources except General Funds and fees from other departments were adjusted to account for COVID-19 impacts
Service Level Impacts:
Viera Wetlands will remain closed as long as volunteer rangers are subject to “safer at home” orders
ENVIRONMENTAL REMEDIATION COMPLIANCE:
This program conducts pollutant storage system compliance verification inspections along with oversight and reviews of site assessments and remedial action plans at petroleum contaminated facilities as contracted by the Florida Department of Environmental Protection (FDEP). In addition, the program performs compliance assistance visits (CAVs) with regards to Hazardous Waste Small Quantity Generators to ensure compliance with state mandates.
Accomplishments:
• In Fiscal Year 2020 over 353 storage tank compliance assistance visits were conducted along with numerous installation, closure, and discharge inspections in Brevard and Indian River County per the state’s request
• Reviewed site assessment, remediation, and monitoring reports for over 255 known petroleum contaminated facilities in Brevard, Indian River, St Lucie, Martin and Okeechobee Counties
• Conducted more than 846 compliance assistance visits to educate local Hazardous Waste Small Quantity Generators in Brevard to provide information about state mandates and promote Best Management Practices
• Assisted/responded to 68 hazardous waste complaints filed with the FDEP through the State Watch office and partnered in the state’s District Small Quantity Generator roundtable meetings
Initiatives:
• Continue to train all compliance staff on how to provide cost effective and efficient inspection services
• Continue to educate and assist facility owners and operators on complying with State & Federal rules and regulations to reduce risk of hazardous discharges
• Continue to educate and assist owners and operators on pollution prevention strategies to reduce the number of new releases of hazardous materials, hazardous waste, and petroleum products
Trends and Issues:
• Program is reducing the state’s backlog of petroleum contaminated sites by remediating 40 to 60 sites annually
• Assessing old low scoring sites to identify which sites are no longer polluted due to natural attenuation and to update the score for prioritizing sites that still need clean-up
• The program continues to maintain and improve its longtime working relationship with the FDEP regarding petroleum remediation, pollutant storage system compliance and the hazardous waste SQG programs
Service Level Impacts:
Not Applicable
BEACHES, BOATING & WATERWAYS:
This program maintains Brevard county beaches and waterways to assure coastal protection and safe navigation to support quality of life and Brevard’s tourism-based economy. Work includes beach nourishment and dune restoration projects, waterway marker maintenance, navigation dredging in county managed waterways and removal of derelict vessels.
Accomplishments:
• In Fiscal Year 2020 over fifty derelict vessels were removed from Brevard County waterways • Secured $45,000 of state grant funding and $6,000 in donations from local fishing groups to
continue deployments of reef modules at the County’s artificial fishing reef site off Port Canaveral
• Obtained over $30 million in federal funds to place approximately 1 million cubic yards of sand along 11 miles of County shoreline in partnership with US Army Corps of Engineers, including initial construction of the Mid Reach
• Executed construction of a 14-mile emergency dune project, placing 98,000 cubic yards of sand in the South Beaches, and began process to obtain $4 million in FEMA reimbursement for the work
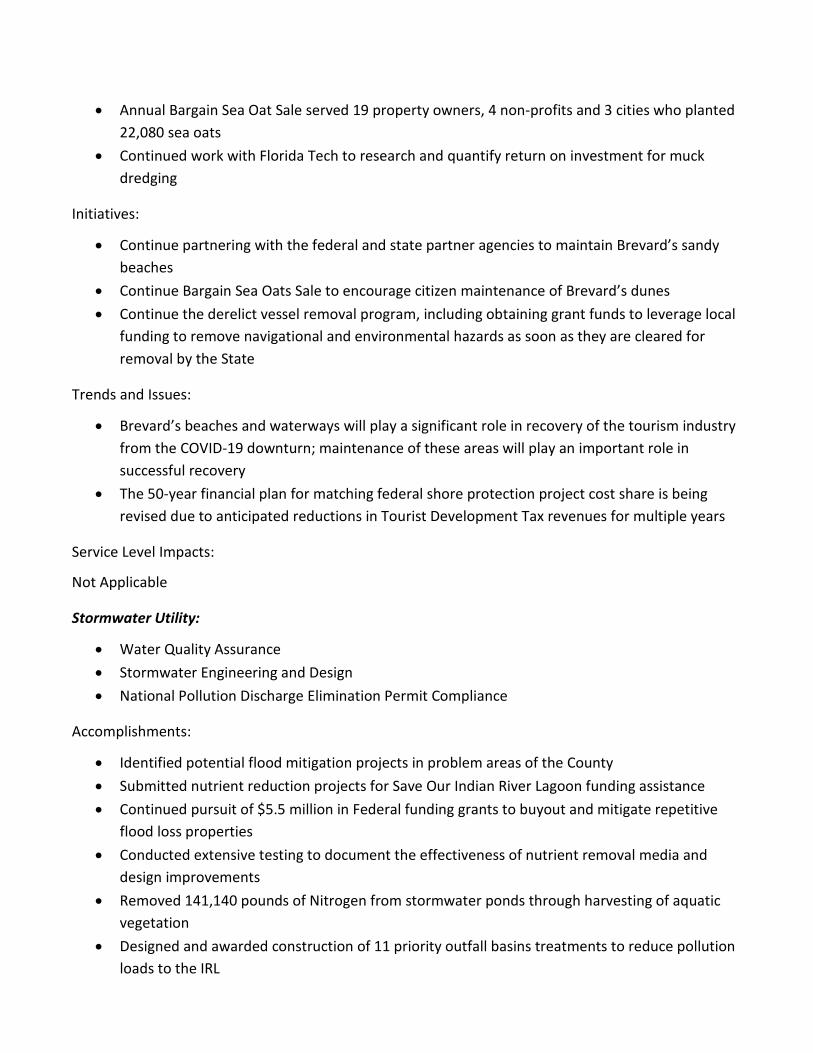
• Annual Bargain Sea Oat Sale served 19 property owners, 4 non-profits and 3 cities who planted 22,080 sea oats
• Continued work with Florida Tech to research and quantify return on investment for muck dredging
Initiatives:
• Continue partnering with the federal and state partner agencies to maintain Brevard’s sandy beaches
• Continue Bargain Sea Oats Sale to encourage citizen maintenance of Brevard’s dunes • Continue the derelict vessel removal program, including obtaining grant funds to leverage local
funding to remove navigational and environmental hazards as soon as they are cleared for removal by the State
Trends and Issues:
• Brevard’s beaches and waterways will play a significant role in recovery of the tourism industry from the COVID-19 downturn; maintenance of these areas will play an important role in successful recovery
• The 50-year financial plan for matching federal shore protection project cost share is being revised due to anticipated reductions in Tourist Development Tax revenues for multiple years
Service Level Impacts:
Not Applicable
Stormwater Utility:
• Water Quality Assurance • Stormwater Engineering and Design • National Pollution Discharge Elimination Permit Compliance
Accomplishments:
• Identified potential flood mitigation projects in problem areas of the County • Submitted nutrient reduction projects for Save Our Indian River Lagoon funding assistance • Continued pursuit of $5.5 million in Federal funding grants to buyout and mitigate repetitive
flood loss properties • Conducted extensive testing to document the effectiveness of nutrient removal media and
design improvements • Removed 141,140 pounds of Nitrogen from stormwater ponds through harvesting of aquatic
vegetation • Designed and awarded construction of 11 priority outfall basins treatments to reduce pollution
loads to the IRL
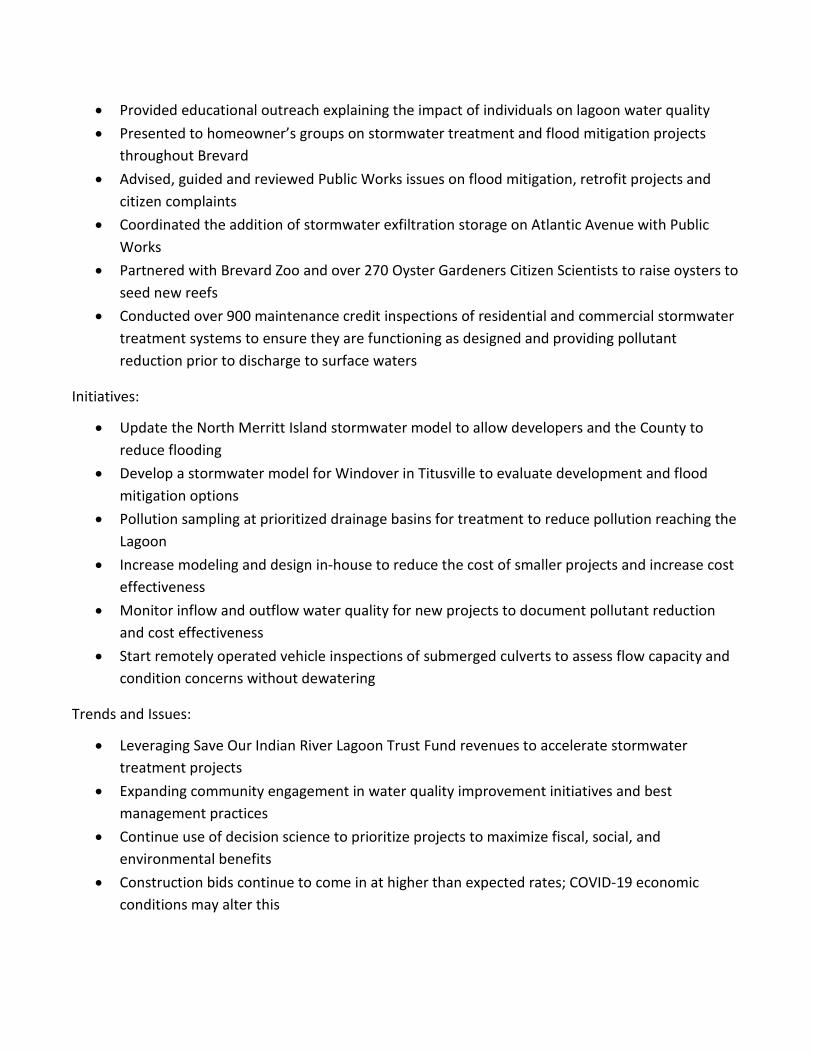
• Provided educational outreach explaining the impact of individuals on lagoon water quality • Presented to homeowner’s groups on stormwater treatment and flood mitigation projects
throughout Brevard • Advised, guided and reviewed Public Works issues on flood mitigation, retrofit projects and
citizen complaints • Coordinated the addition of stormwater exfiltration storage on Atlantic Avenue with Public
Works • Partnered with Brevard Zoo and over 270 Oyster Gardeners Citizen Scientists to raise oysters to
seed new reefs • Conducted over 900 maintenance credit inspections of residential and commercial stormwater
treatment systems to ensure they are functioning as designed and providing pollutant reduction prior to discharge to surface waters
Initiatives:
• Update the North Merritt Island stormwater model to allow developers and the County to reduce flooding
• Develop a stormwater model for Windover in Titusville to evaluate development and flood mitigation options
• Pollution sampling at prioritized drainage basins for treatment to reduce pollution reaching the Lagoon
• Increase modeling and design in-house to reduce the cost of smaller projects and increase cost effectiveness
• Monitor inflow and outflow water quality for new projects to document pollutant reduction and cost effectiveness
• Start remotely operated vehicle inspections of submerged culverts to assess flow capacity and condition concerns without dewatering
Trends and Issues:
• Leveraging Save Our Indian River Lagoon Trust Fund revenues to accelerate stormwater treatment projects
• Expanding community engagement in water quality improvement initiatives and best management practices
• Continue use of decision science to prioritize projects to maximize fiscal, social, and environmental benefits
• Construction bids continue to come in at higher than expected rates; COVID-19 economic conditions may alter this

Service Level Impacts:
If construction bids for projects continue to increase at the current rates, the number of projects constructed will decrease.
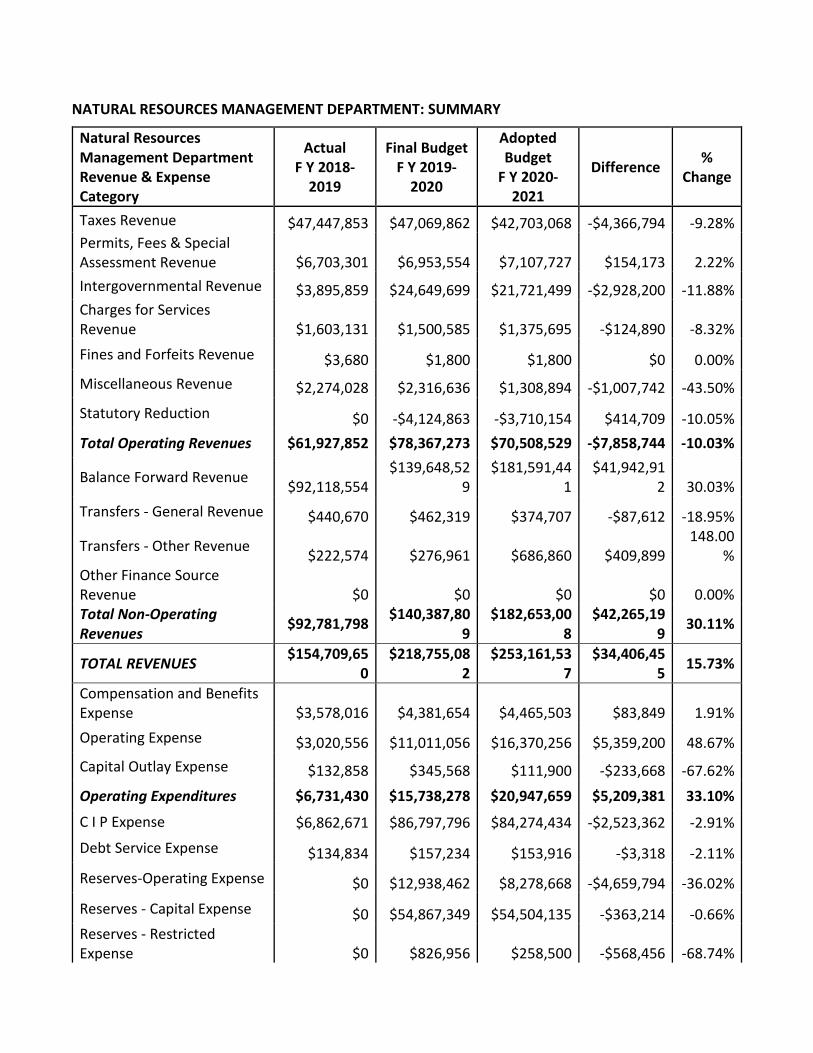
NATURAL RESOURCES MANAGEMENT DEPARTMENT: SUMMARY
Natural Resources Management Department Revenue & Expense Category
Actual F Y 2018-
2019
Final Budget F Y 2019-
2020
Adopted Budget
F Y 2020-2021
Difference % Change
Taxes Revenue $47,447,853 $47,069,862 $42,703,068 -$4,366,794 -9.28% Permits, Fees & Special Assessment Revenue $6,703,301 $6,953,554 $7,107,727 $154,173 2.22% Intergovernmental Revenue $3,895,859 $24,649,699 $21,721,499 -$2,928,200 -11.88% Charges for Services Revenue $1,603,131 $1,500,585 $1,375,695 -$124,890 -8.32% Fines and Forfeits Revenue $3,680 $1,800 $1,800 $0 0.00% Miscellaneous Revenue $2,274,028 $2,316,636 $1,308,894 -$1,007,742 -43.50%
Statutory Reduction $0 -$4,124,863 -$3,710,154 $414,709 -10.05% Total Operating Revenues $61,927,852 $78,367,273 $70,508,529 -$7,858,744 -10.03%
Balance Forward Revenue $92,118,554 $139,648,52
9 $181,591,44
1 $41,942,91
2 30.03% Transfers - General Revenue $440,670 $462,319 $374,707 -$87,612 -18.95%
Transfers - Other Revenue $222,574 $276,961 $686,860 $409,899 148.00
% Other Finance Source Revenue $0 $0 $0 $0 0.00% Total Non-Operating Revenues $92,781,798 $140,387,80
9 $182,653,00
8 $42,265,19
9 30.11%
TOTAL REVENUES $154,709,650
$218,755,082
$253,161,537
$34,406,455 15.73%
Compensation and Benefits Expense $3,578,016 $4,381,654 $4,465,503 $83,849 1.91% Operating Expense $3,020,556 $11,011,056 $16,370,256 $5,359,200 48.67% Capital Outlay Expense $132,858 $345,568 $111,900 -$233,668 -67.62%
Operating Expenditures $6,731,430 $15,738,278 $20,947,659 $5,209,381 33.10%
C I P Expense $6,862,671 $86,797,796 $84,274,434 -$2,523,362 -2.91%
Debt Service Expense $134,834 $157,234 $153,916 -$3,318 -2.11% Reserves-Operating Expense $0 $12,938,462 $8,278,668 -$4,659,794 -36.02% Reserves - Capital Expense $0 $54,867,349 $54,504,135 -$363,214 -0.66% Reserves - Restricted Expense $0 $826,956 $258,500 -$568,456 -68.74%
Natural Resources Management Department Revenue & Expense Category
Actual F Y 2018-
2019
Final Budget F Y 2019-
2020
Adopted Budget
F Y 2020-2021
Difference % Change
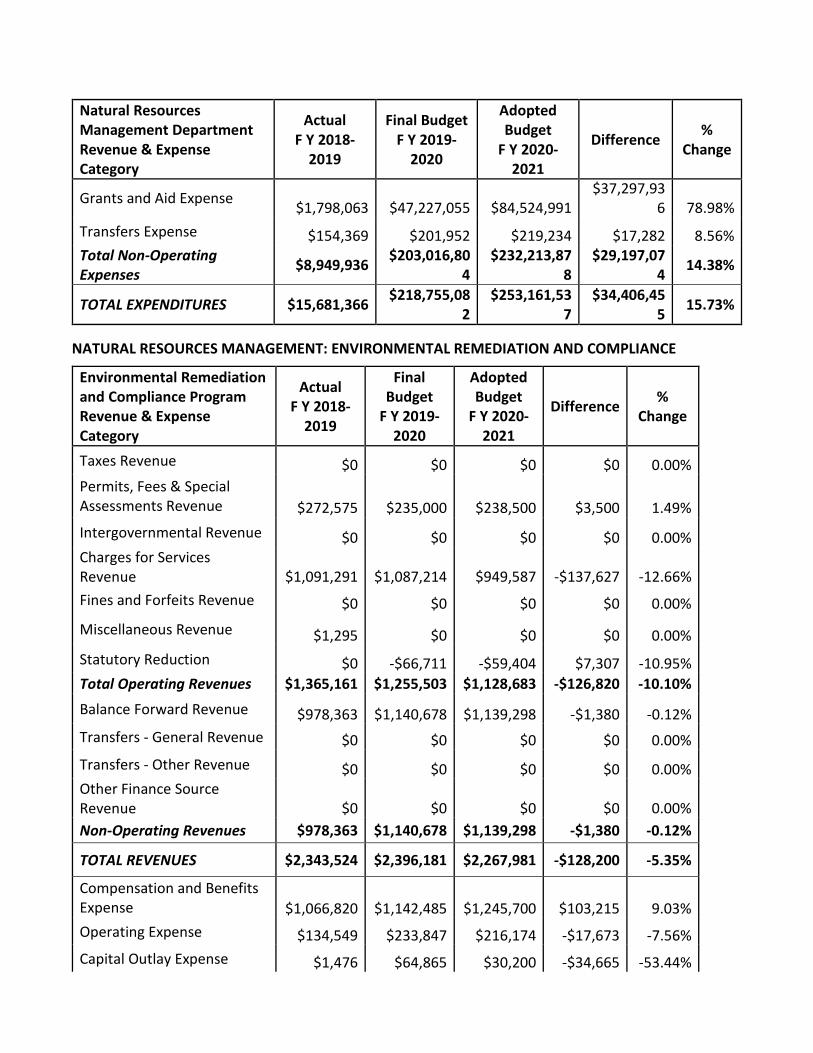
Grants and Aid Expense $1,798,063 $47,227,055 $84,524,991 $37,297,93
6 78.98% Transfers Expense $154,369 $201,952 $219,234 $17,282 8.56% Total Non-Operating Expenses $8,949,936 $203,016,80
4 $232,213,87
8 $29,197,07
4 14.38%
TOTAL EXPENDITURES $15,681,366 $218,755,082
$253,161,537
$34,406,455 15.73%
NATURAL RESOURCES MANAGEMENT: ENVIRONMENTAL REMEDIATION AND COMPLIANCE
Environmental Remediation and Compliance Program Revenue & Expense Category
Actual F Y 2018-
2019
Final Budget
F Y 2019-2020
Adopted Budget
F Y 2020-2021
Difference % Change
Taxes Revenue $0 $0 $0 $0 0.00% Permits, Fees & Special Assessments Revenue $272,575 $235,000 $238,500 $3,500 1.49% Intergovernmental Revenue $0 $0 $0 $0 0.00% Charges for Services Revenue $1,091,291 $1,087,214 $949,587 -$137,627 -12.66% Fines and Forfeits Revenue $0 $0 $0 $0 0.00%
Miscellaneous Revenue $1,295 $0 $0 $0 0.00% Statutory Reduction $0 -$66,711 -$59,404 $7,307 -10.95% Total Operating Revenues $1,365,161 $1,255,503 $1,128,683 -$126,820 -10.10%
Balance Forward Revenue $978,363 $1,140,678 $1,139,298 -$1,380 -0.12% Transfers - General Revenue $0 $0 $0 $0 0.00% Transfers - Other Revenue $0 $0 $0 $0 0.00% Other Finance Source Revenue $0 $0 $0 $0 0.00% Non-Operating Revenues $978,363 $1,140,678 $1,139,298 -$1,380 -0.12%
TOTAL REVENUES $2,343,524 $2,396,181 $2,267,981 -$128,200 -5.35%
Compensation and Benefits Expense $1,066,820 $1,142,485 $1,245,700 $103,215 9.03% Operating Expense $134,549 $233,847 $216,174 -$17,673 -7.56% Capital Outlay Expense $1,476 $64,865 $30,200 -$34,665 -53.44%
Environmental Remediation and Compliance Program Revenue & Expense Category
Actual F Y 2018-
2019
Final Budget
F Y 2019-2020
Adopted Budget
F Y 2020-2021
Difference % Change
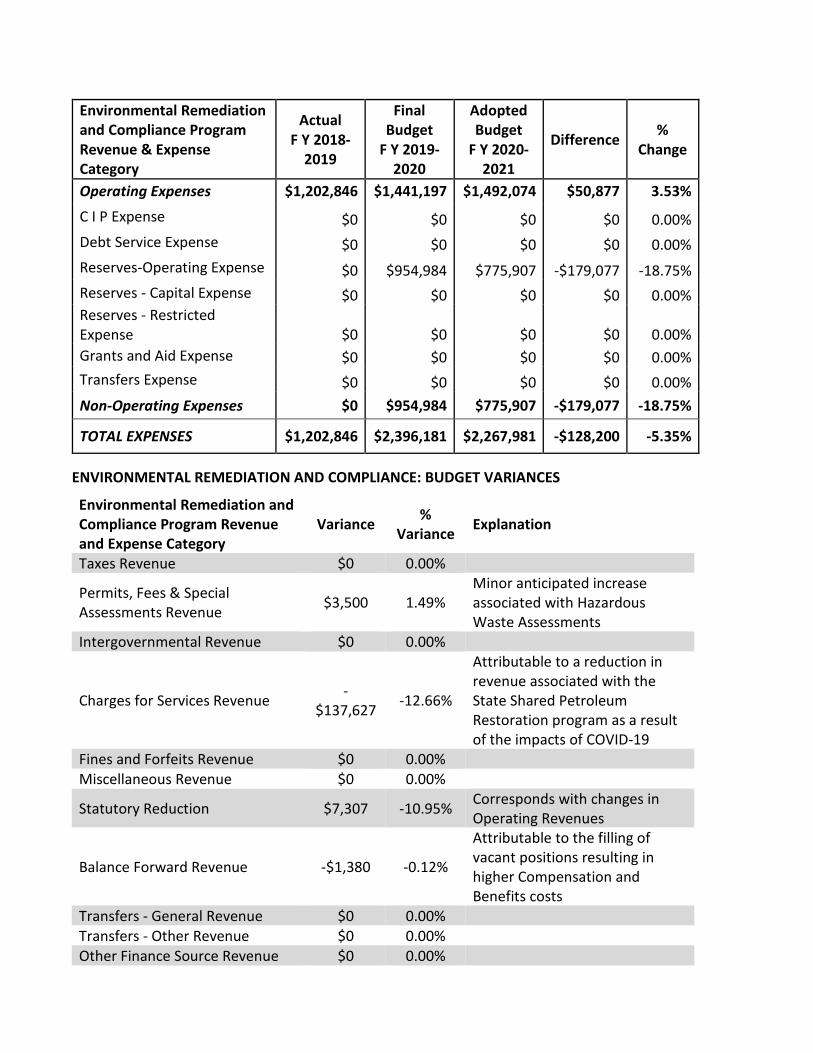
Operating Expenses $1,202,846 $1,441,197 $1,492,074 $50,877 3.53%
C I P Expense $0 $0 $0 $0 0.00% Debt Service Expense $0 $0 $0 $0 0.00% Reserves-Operating Expense $0 $954,984 $775,907 -$179,077 -18.75% Reserves - Capital Expense $0 $0 $0 $0 0.00% Reserves - Restricted Expense $0 $0 $0 $0 0.00% Grants and Aid Expense $0 $0 $0 $0 0.00% Transfers Expense $0 $0 $0 $0 0.00% Non-Operating Expenses $0 $954,984 $775,907 -$179,077 -18.75%
TOTAL EXPENSES $1,202,846 $2,396,181 $2,267,981 -$128,200 -5.35%
ENVIRONMENTAL REMEDIATION AND COMPLIANCE: BUDGET VARIANCES
Environmental Remediation and Compliance Program Revenue and Expense Category
Variance % Variance Explanation
Taxes Revenue $0 0.00%
Permits, Fees & Special Assessments Revenue $3,500 1.49%
Minor anticipated increase associated with Hazardous Waste Assessments
Intergovernmental Revenue $0 0.00%
Charges for Services Revenue -$137,627 -12.66%
Attributable to a reduction in revenue associated with the State Shared Petroleum Restoration program as a result of the impacts of COVID-19
Fines and Forfeits Revenue $0 0.00% Miscellaneous Revenue $0 0.00%
Statutory Reduction $7,307 -10.95% Corresponds with changes in Operating Revenues
Balance Forward Revenue -$1,380 -0.12%
Attributable to the filling of vacant positions resulting in higher Compensation and Benefits costs
Transfers - General Revenue $0 0.00% Transfers - Other Revenue $0 0.00% Other Finance Source Revenue $0 0.00%
Environmental Remediation and Compliance Program Revenue and Expense Category
Variance % Variance Explanation
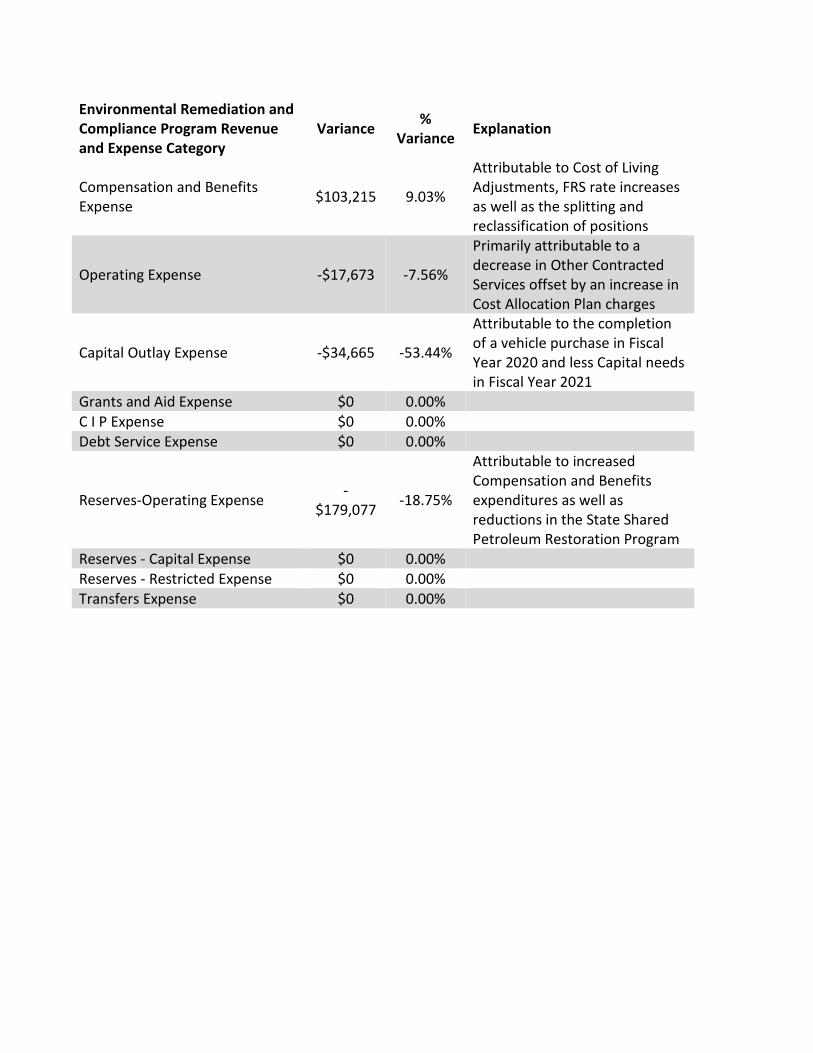
Compensation and Benefits Expense $103,215 9.03%
Attributable to Cost of Living Adjustments, FRS rate increases as well as the splitting and reclassification of positions
Operating Expense -$17,673 -7.56%
Primarily attributable to a decrease in Other Contracted Services offset by an increase in Cost Allocation Plan charges
Capital Outlay Expense -$34,665 -53.44%
Attributable to the completion of a vehicle purchase in Fiscal Year 2020 and less Capital needs in Fiscal Year 2021
Grants and Aid Expense $0 0.00% C I P Expense $0 0.00%
Debt Service Expense $0 0.00%
Reserves-Operating Expense -$179,077 -18.75%
Attributable to increased Compensation and Benefits expenditures as well as reductions in the State Shared Petroleum Restoration Program
Reserves - Capital Expense $0 0.00% Reserves - Restricted Expense $0 0.00%
Transfers Expense $0 0.00%
NATURAL RESOURCES MANAGEMENT: ENVIRONMENTAL RESOURCES MANAGEMENT
Environmental Resources Management Program Revenue & Expense Category
Actual F Y 2018-
2019
Final Budget
F Y 2019-2020
Adopted Budget
F Y 2020-2021
Difference % Change
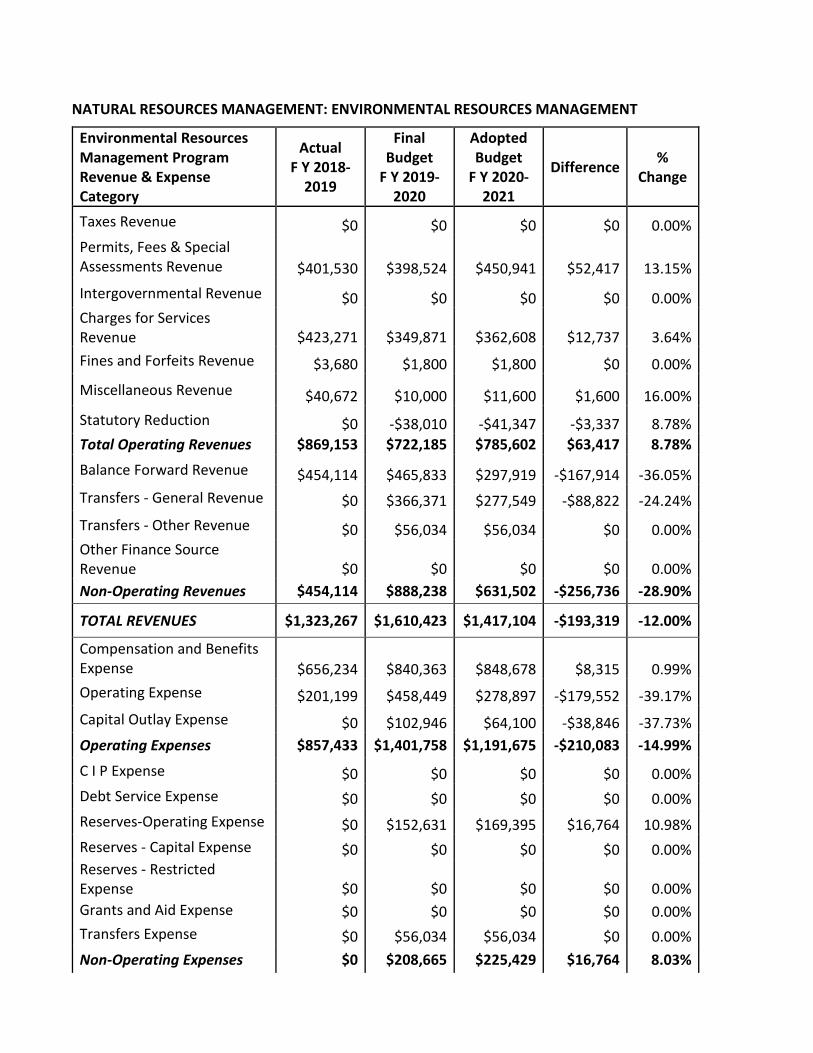
Taxes Revenue $0 $0 $0 $0 0.00% Permits, Fees & Special Assessments Revenue $401,530 $398,524 $450,941 $52,417 13.15% Intergovernmental Revenue $0 $0 $0 $0 0.00% Charges for Services Revenue $423,271 $349,871 $362,608 $12,737 3.64% Fines and Forfeits Revenue $3,680 $1,800 $1,800 $0 0.00%
Miscellaneous Revenue $40,672 $10,000 $11,600 $1,600 16.00% Statutory Reduction $0 -$38,010 -$41,347 -$3,337 8.78% Total Operating Revenues $869,153 $722,185 $785,602 $63,417 8.78%
Balance Forward Revenue $454,114 $465,833 $297,919 -$167,914 -36.05% Transfers - General Revenue $0 $366,371 $277,549 -$88,822 -24.24% Transfers - Other Revenue $0 $56,034 $56,034 $0 0.00% Other Finance Source Revenue $0 $0 $0 $0 0.00% Non-Operating Revenues $454,114 $888,238 $631,502 -$256,736 -28.90%
TOTAL REVENUES $1,323,267 $1,610,423 $1,417,104 -$193,319 -12.00%
Compensation and Benefits Expense $656,234 $840,363 $848,678 $8,315 0.99% Operating Expense $201,199 $458,449 $278,897 -$179,552 -39.17% Capital Outlay Expense $0 $102,946 $64,100 -$38,846 -37.73% Operating Expenses $857,433 $1,401,758 $1,191,675 -$210,083 -14.99%
C I P Expense $0 $0 $0 $0 0.00% Debt Service Expense $0 $0 $0 $0 0.00% Reserves-Operating Expense $0 $152,631 $169,395 $16,764 10.98% Reserves - Capital Expense $0 $0 $0 $0 0.00% Reserves - Restricted Expense $0 $0 $0 $0 0.00% Grants and Aid Expense $0 $0 $0 $0 0.00% Transfers Expense $0 $56,034 $56,034 $0 0.00% Non-Operating Expenses $0 $208,665 $225,429 $16,764 8.03%
Environmental Resources Management Program Revenue & Expense Category
Actual F Y 2018-
2019
Final Budget
F Y 2019-2020
Adopted Budget
F Y 2020-2021
Difference % Change
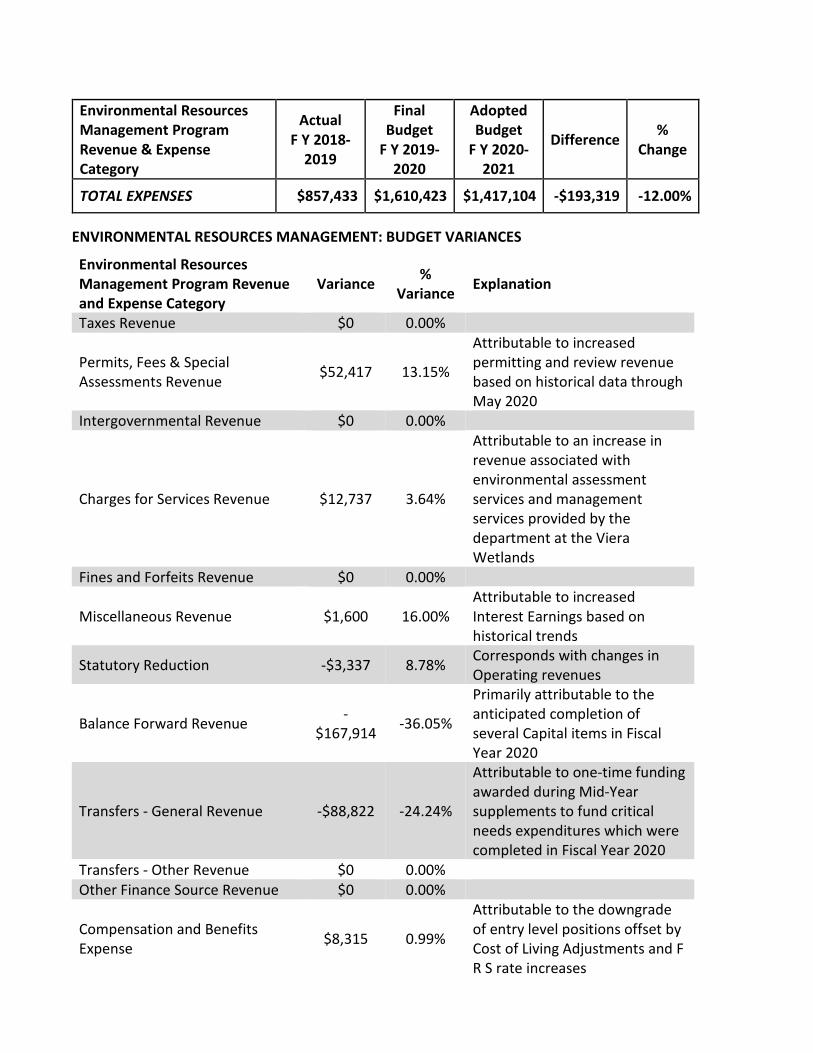
TOTAL EXPENSES $857,433 $1,610,423 $1,417,104 -$193,319 -12.00%
ENVIRONMENTAL RESOURCES MANAGEMENT: BUDGET VARIANCES
Environmental Resources Management Program Revenue and Expense Category
Variance % Variance Explanation
Taxes Revenue $0 0.00%
Permits, Fees & Special Assessments Revenue $52,417 13.15%
Attributable to increased permitting and review revenue based on historical data through May 2020
Intergovernmental Revenue $0 0.00%
Charges for Services Revenue $12,737 3.64%
Attributable to an increase in revenue associated with environmental assessment services and management services provided by the department at the Viera Wetlands
Fines and Forfeits Revenue $0 0.00%
Miscellaneous Revenue $1,600 16.00% Attributable to increased Interest Earnings based on historical trends
Statutory Reduction -$3,337 8.78% Corresponds with changes in Operating revenues
Balance Forward Revenue -$167,914 -36.05%
Primarily attributable to the anticipated completion of several Capital items in Fiscal Year 2020
Transfers - General Revenue -$88,822 -24.24%
Attributable to one-time funding awarded during Mid-Year supplements to fund critical needs expenditures which were completed in Fiscal Year 2020
Transfers - Other Revenue $0 0.00% Other Finance Source Revenue $0 0.00%
Compensation and Benefits Expense $8,315 0.99%
Attributable to the downgrade of entry level positions offset by Cost of Living Adjustments and F R S rate increases
Environmental Resources Management Program Revenue and Expense Category
Variance % Variance Explanation
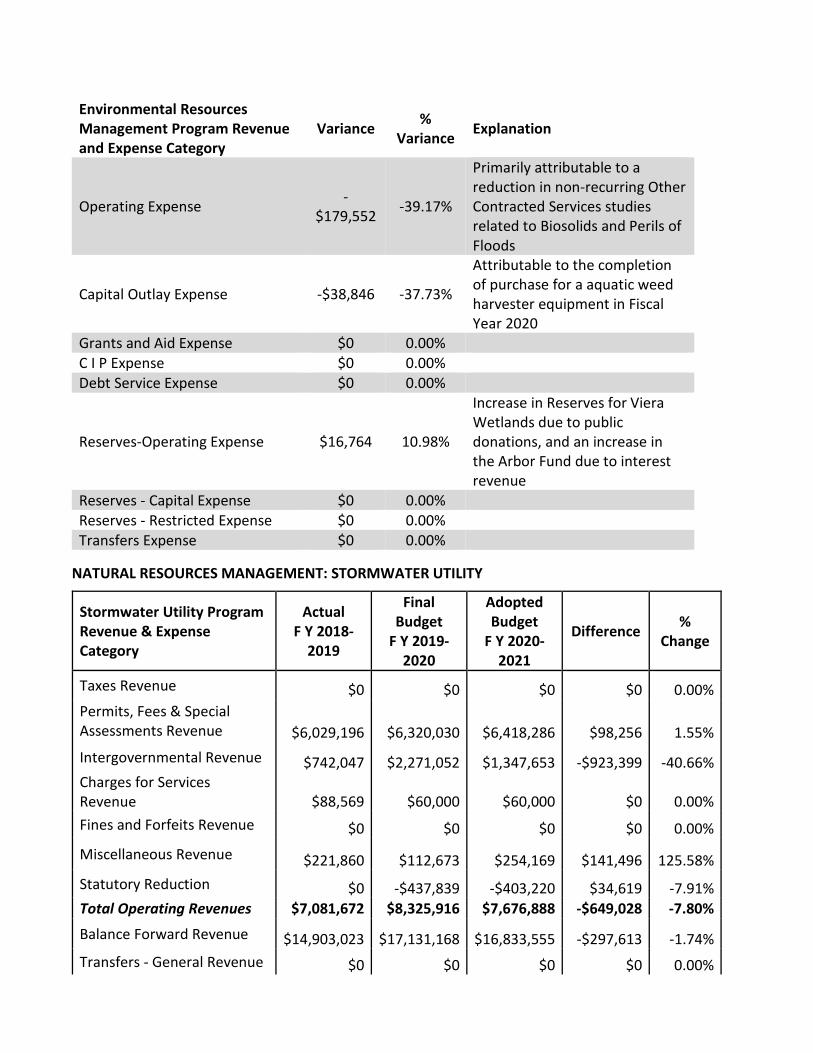
Operating Expense -$179,552 -39.17%
Primarily attributable to a reduction in non-recurring Other Contracted Services studies related to Biosolids and Perils of Floods
Capital Outlay Expense -$38,846 -37.73%
Attributable to the completion of purchase for a aquatic weed harvester equipment in Fiscal Year 2020
Grants and Aid Expense $0 0.00% C I P Expense $0 0.00%
Debt Service Expense $0 0.00%
Reserves-Operating Expense $16,764 10.98%
Increase in Reserves for Viera Wetlands due to public donations, and an increase in the Arbor Fund due to interest revenue
Reserves - Capital Expense $0 0.00% Reserves - Restricted Expense $0 0.00%
Transfers Expense $0 0.00%
NATURAL RESOURCES MANAGEMENT: STORMWATER UTILITY
Stormwater Utility Program Revenue & Expense Category
Actual F Y 2018-
2019
Final Budget
F Y 2019-2020
Adopted Budget
F Y 2020-2021
Difference % Change
Taxes Revenue $0 $0 $0 $0 0.00% Permits, Fees & Special Assessments Revenue $6,029,196 $6,320,030 $6,418,286 $98,256 1.55% Intergovernmental Revenue $742,047 $2,271,052 $1,347,653 -$923,399 -40.66% Charges for Services Revenue $88,569 $60,000 $60,000 $0 0.00% Fines and Forfeits Revenue $0 $0 $0 $0 0.00%
Miscellaneous Revenue $221,860 $112,673 $254,169 $141,496 125.58% Statutory Reduction $0 -$437,839 -$403,220 $34,619 -7.91% Total Operating Revenues $7,081,672 $8,325,916 $7,676,888 -$649,028 -7.80%
Balance Forward Revenue $14,903,023 $17,131,168 $16,833,555 -$297,613 -1.74% Transfers - General Revenue $0 $0 $0 $0 0.00%
Stormwater Utility Program Revenue & Expense Category
Actual F Y 2018-
2019
Final Budget
F Y 2019-2020
Adopted Budget
F Y 2020-2021
Difference % Change
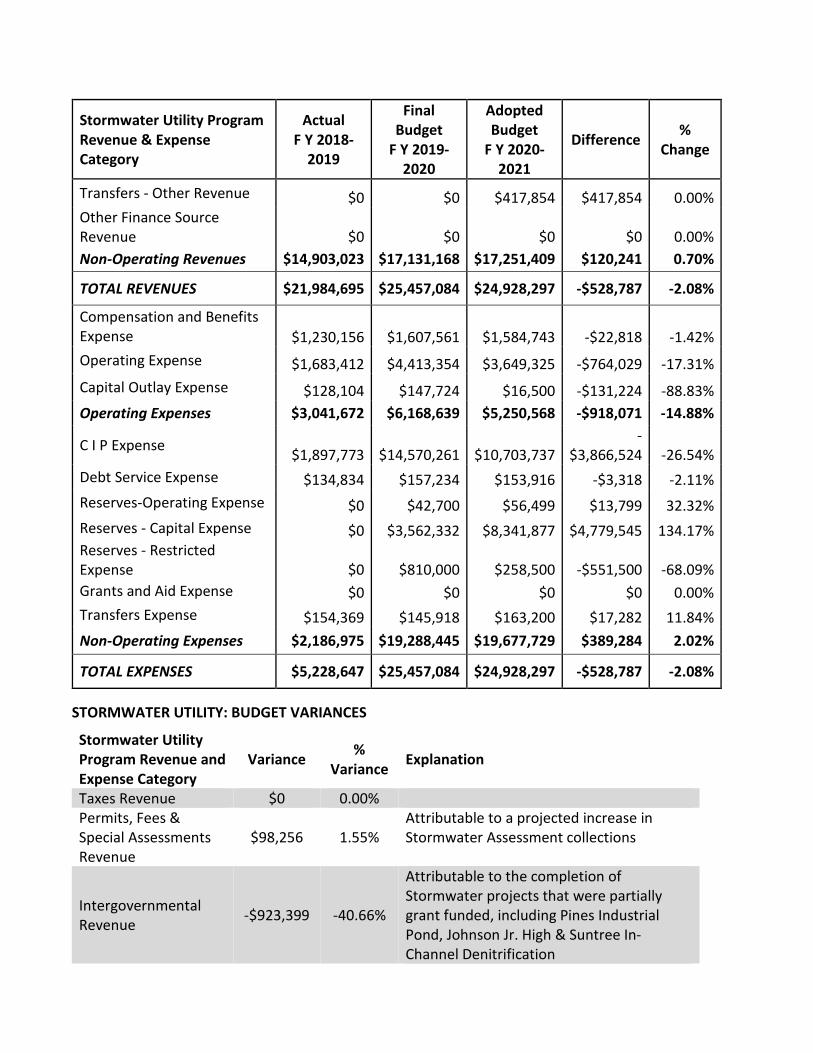
Transfers - Other Revenue $0 $0 $417,854 $417,854 0.00% Other Finance Source Revenue $0 $0 $0 $0 0.00% Non-Operating Revenues $14,903,023 $17,131,168 $17,251,409 $120,241 0.70%
TOTAL REVENUES $21,984,695 $25,457,084 $24,928,297 -$528,787 -2.08%
Compensation and Benefits Expense $1,230,156 $1,607,561 $1,584,743 -$22,818 -1.42% Operating Expense $1,683,412 $4,413,354 $3,649,325 -$764,029 -17.31% Capital Outlay Expense $128,104 $147,724 $16,500 -$131,224 -88.83% Operating Expenses $3,041,672 $6,168,639 $5,250,568 -$918,071 -14.88%
C I P Expense $1,897,773 $14,570,261 $10,703,737 -
$3,866,524 -26.54% Debt Service Expense $134,834 $157,234 $153,916 -$3,318 -2.11% Reserves-Operating Expense $0 $42,700 $56,499 $13,799 32.32% Reserves - Capital Expense $0 $3,562,332 $8,341,877 $4,779,545 134.17% Reserves - Restricted Expense $0 $810,000 $258,500 -$551,500 -68.09% Grants and Aid Expense $0 $0 $0 $0 0.00% Transfers Expense $154,369 $145,918 $163,200 $17,282 11.84% Non-Operating Expenses $2,186,975 $19,288,445 $19,677,729 $389,284 2.02%
TOTAL EXPENSES $5,228,647 $25,457,084 $24,928,297 -$528,787 -2.08%
STORMWATER UTILITY: BUDGET VARIANCES
Stormwater Utility Program Revenue and Expense Category
Variance % Variance Explanation
Taxes Revenue $0 0.00% Permits, Fees & Special Assessments Revenue
$98,256 1.55% Attributable to a projected increase in Stormwater Assessment collections
Intergovernmental Revenue -$923,399 -40.66%
Attributable to the completion of Stormwater projects that were partially grant funded, including Pines Industrial Pond, Johnson Jr. High & Suntree In-Channel Denitrification
Stormwater Utility Program Revenue and Expense Category
Variance % Variance Explanation
Charges for Services Revenue $0 0.00%
Fines and Forfeits Revenue $0 0.00%
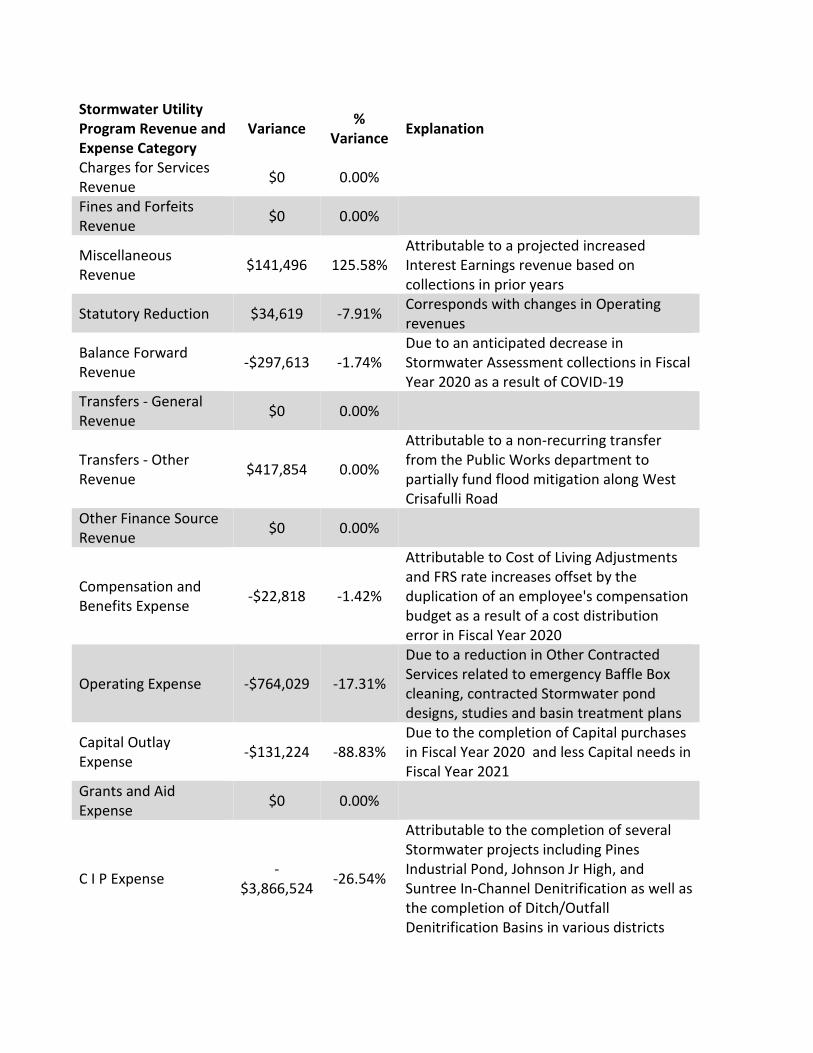
Miscellaneous Revenue $141,496 125.58%
Attributable to a projected increased Interest Earnings revenue based on collections in prior years
Statutory Reduction $34,619 -7.91% Corresponds with changes in Operating revenues
Balance Forward Revenue -$297,613 -1.74%
Due to an anticipated decrease in Stormwater Assessment collections in Fiscal Year 2020 as a result of COVID-19
Transfers - General Revenue $0 0.00%
Transfers - Other Revenue $417,854 0.00%
Attributable to a non-recurring transfer from the Public Works department to partially fund flood mitigation along West Crisafulli Road
Other Finance Source Revenue $0 0.00%
Compensation and Benefits Expense -$22,818 -1.42%
Attributable to Cost of Living Adjustments and FRS rate increases offset by the duplication of an employee's compensation budget as a result of a cost distribution error in Fiscal Year 2020
Operating Expense -$764,029 -17.31%
Due to a reduction in Other Contracted Services related to emergency Baffle Box cleaning, contracted Stormwater pond designs, studies and basin treatment plans
Capital Outlay Expense -$131,224 -88.83%
Due to the completion of Capital purchases in Fiscal Year 2020 and less Capital needs in Fiscal Year 2021
Grants and Aid Expense $0 0.00%
C I P Expense -$3,866,524 -26.54%
Attributable to the completion of several Stormwater projects including Pines Industrial Pond, Johnson Jr High, and Suntree In-Channel Denitrification as well as the completion of Ditch/Outfall Denitrification Basins in various districts
Stormwater Utility Program Revenue and Expense Category
Variance % Variance Explanation
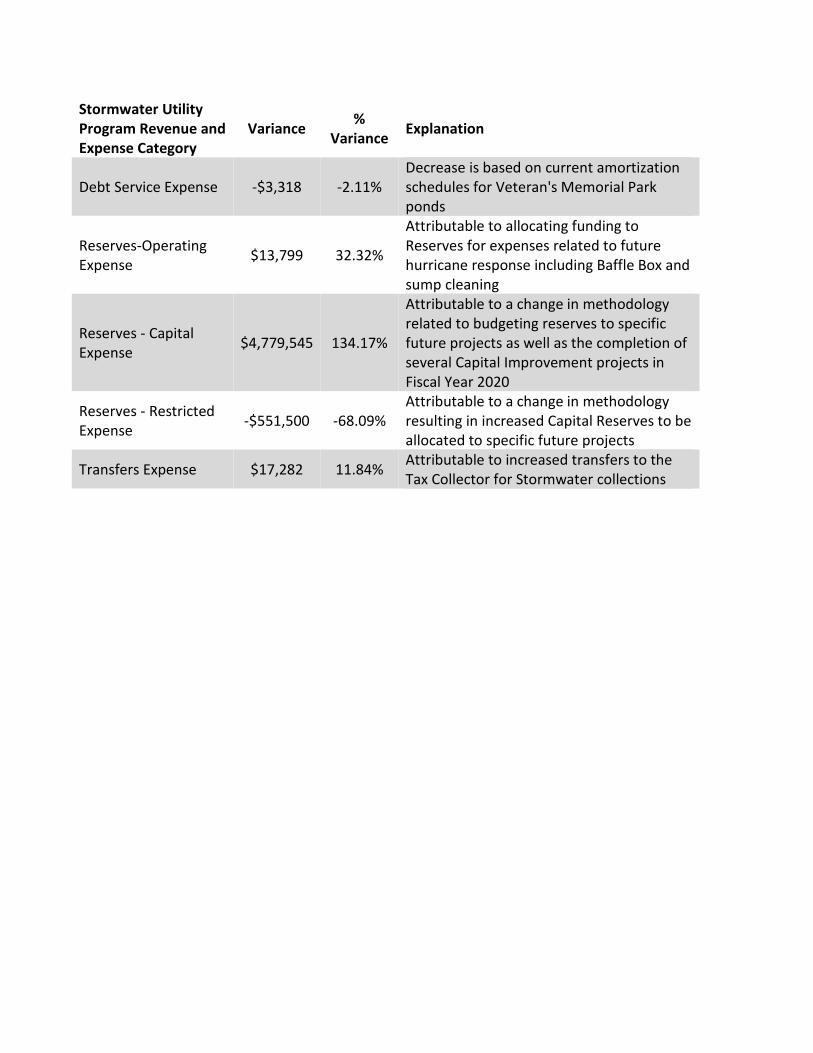
Debt Service Expense -$3,318 -2.11% Decrease is based on current amortization schedules for Veteran's Memorial Park ponds
Reserves-Operating Expense $13,799 32.32%
Attributable to allocating funding to Reserves for expenses related to future hurricane response including Baffle Box and sump cleaning
Reserves - Capital Expense $4,779,545 134.17%
Attributable to a change in methodology related to budgeting reserves to specific future projects as well as the completion of several Capital Improvement projects in Fiscal Year 2020
Reserves - Restricted Expense -$551,500 -68.09%
Attributable to a change in methodology resulting in increased Capital Reserves to be allocated to specific future projects
Transfers Expense $17,282 11.84% Attributable to increased transfers to the Tax Collector for Stormwater collections
NATURAL RESOURCES MANAGEMENT: SAVE OUR INDIAN RIVER LAGOON
Save our Indian River Lagoon Program Revenue & Expense Category
Actual F Y 2018-
2019
Final Budget F Y 2019-
2020
Adopted Budget
F Y 2020-2021
Difference % Change
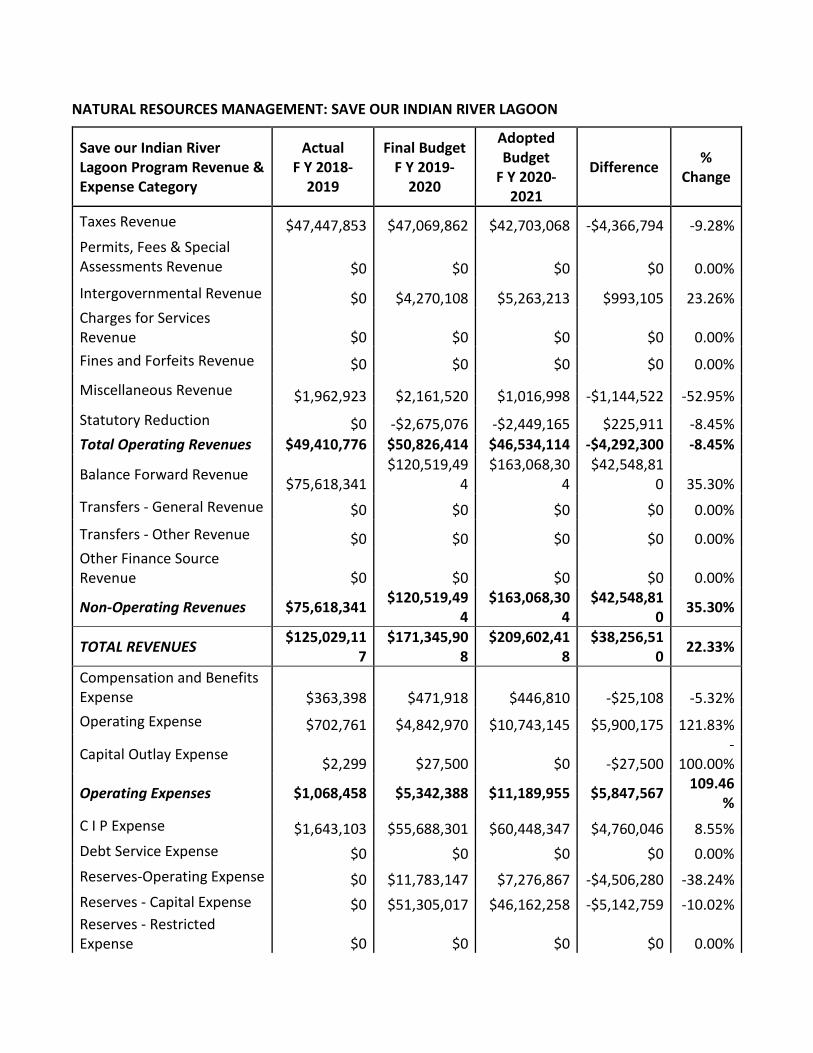
Taxes Revenue $47,447,853 $47,069,862 $42,703,068 -$4,366,794 -9.28% Permits, Fees & Special Assessments Revenue $0 $0 $0 $0 0.00% Intergovernmental Revenue $0 $4,270,108 $5,263,213 $993,105 23.26% Charges for Services Revenue $0 $0 $0 $0 0.00% Fines and Forfeits Revenue $0 $0 $0 $0 0.00%
Miscellaneous Revenue $1,962,923 $2,161,520 $1,016,998 -$1,144,522 -52.95% Statutory Reduction $0 -$2,675,076 -$2,449,165 $225,911 -8.45% Total Operating Revenues $49,410,776 $50,826,414 $46,534,114 -$4,292,300 -8.45%
Balance Forward Revenue $75,618,341 $120,519,49
4 $163,068,30
4 $42,548,81
0 35.30% Transfers - General Revenue $0 $0 $0 $0 0.00% Transfers - Other Revenue $0 $0 $0 $0 0.00% Other Finance Source Revenue $0 $0 $0 $0 0.00%
Non-Operating Revenues $75,618,341 $120,519,494
$163,068,304
$42,548,810 35.30%
TOTAL REVENUES $125,029,117
$171,345,908
$209,602,418
$38,256,510 22.33%
Compensation and Benefits Expense $363,398 $471,918 $446,810 -$25,108 -5.32% Operating Expense $702,761 $4,842,970 $10,743,145 $5,900,175 121.83%
Capital Outlay Expense $2,299 $27,500 $0 -$27,500 -
100.00%
Operating Expenses $1,068,458 $5,342,388 $11,189,955 $5,847,567 109.46%
C I P Expense $1,643,103 $55,688,301 $60,448,347 $4,760,046 8.55% Debt Service Expense $0 $0 $0 $0 0.00% Reserves-Operating Expense $0 $11,783,147 $7,276,867 -$4,506,280 -38.24% Reserves - Capital Expense $0 $51,305,017 $46,162,258 -$5,142,759 -10.02% Reserves - Restricted Expense $0 $0 $0 $0 0.00%
Save our Indian River Lagoon Program Revenue & Expense Category
Actual F Y 2018-
2019
Final Budget F Y 2019-
2020
Adopted Budget
F Y 2020-2021
Difference % Change
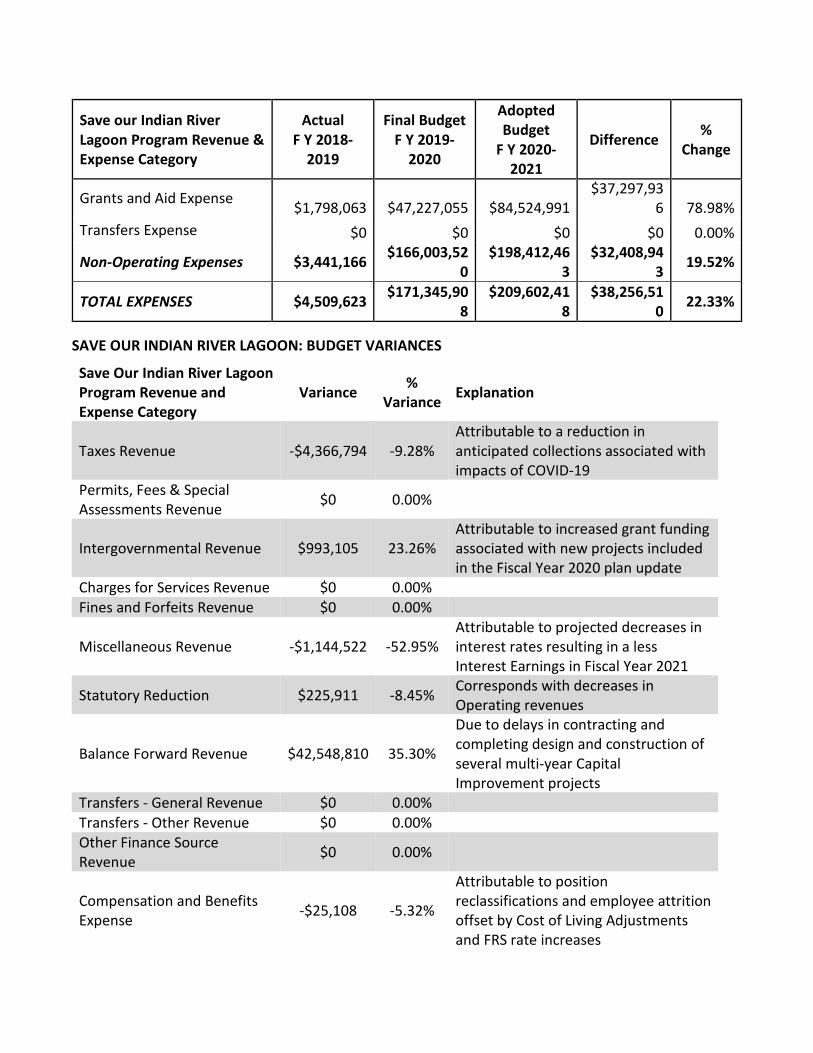
Grants and Aid Expense $1,798,063 $47,227,055 $84,524,991 $37,297,93
6 78.98% Transfers Expense $0 $0 $0 $0 0.00%
Non-Operating Expenses $3,441,166 $166,003,520
$198,412,463
$32,408,943 19.52%
TOTAL EXPENSES $4,509,623 $171,345,908
$209,602,418
$38,256,510 22.33%
SAVE OUR INDIAN RIVER LAGOON: BUDGET VARIANCES
Save Our Indian River Lagoon Program Revenue and Expense Category
Variance % Variance Explanation
Taxes Revenue -$4,366,794 -9.28% Attributable to a reduction in anticipated collections associated with impacts of COVID-19
Permits, Fees & Special Assessments Revenue $0 0.00%
Intergovernmental Revenue $993,105 23.26% Attributable to increased grant funding associated with new projects included in the Fiscal Year 2020 plan update
Charges for Services Revenue $0 0.00% Fines and Forfeits Revenue $0 0.00%
Miscellaneous Revenue -$1,144,522 -52.95% Attributable to projected decreases in interest rates resulting in a less Interest Earnings in Fiscal Year 2021
Statutory Reduction $225,911 -8.45% Corresponds with decreases in Operating revenues
Balance Forward Revenue $42,548,810 35.30%
Due to delays in contracting and completing design and construction of several multi-year Capital Improvement projects
Transfers - General Revenue $0 0.00% Transfers - Other Revenue $0 0.00% Other Finance Source Revenue $0 0.00%
Compensation and Benefits Expense -$25,108 -5.32%
Attributable to position reclassifications and employee attrition offset by Cost of Living Adjustments and FRS rate increases
Save Our Indian River Lagoon Program Revenue and Expense Category
Variance % Variance Explanation
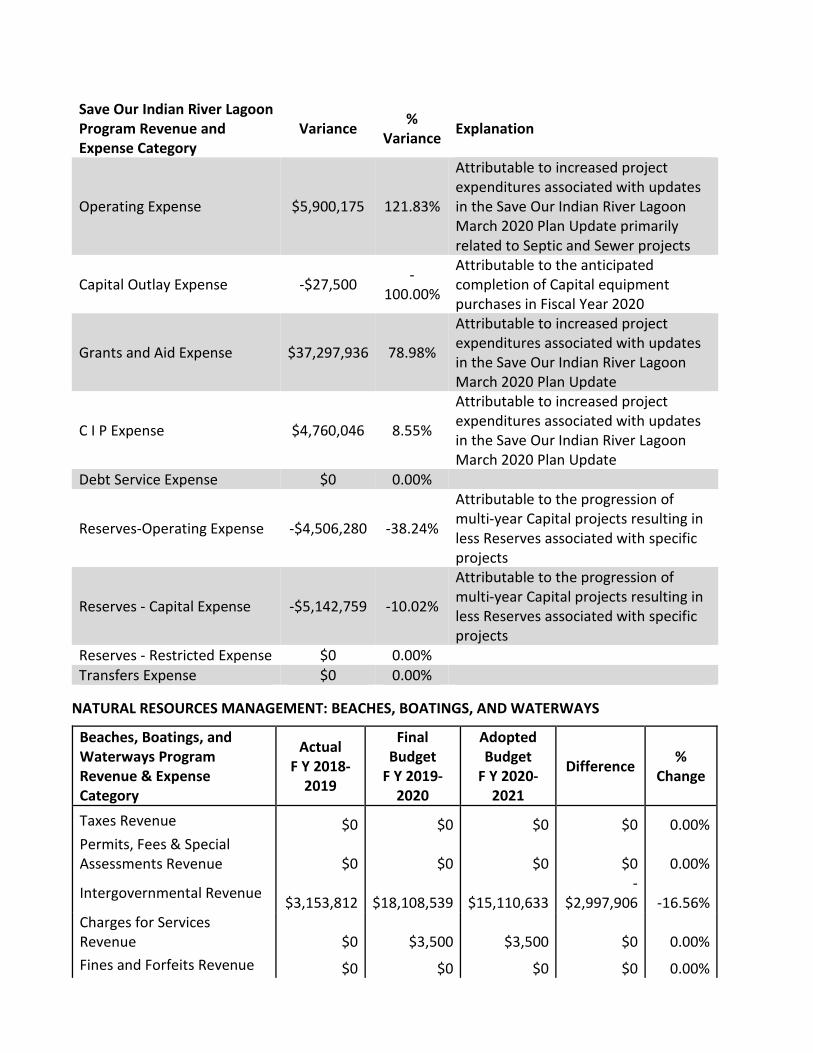
Operating Expense $5,900,175 121.83%
Attributable to increased project expenditures associated with updates in the Save Our Indian River Lagoon March 2020 Plan Update primarily related to Septic and Sewer projects
Capital Outlay Expense -$27,500 -100.00%
Attributable to the anticipated completion of Capital equipment purchases in Fiscal Year 2020
Grants and Aid Expense $37,297,936 78.98%
Attributable to increased project expenditures associated with updates in the Save Our Indian River Lagoon March 2020 Plan Update
C I P Expense $4,760,046 8.55%
Attributable to increased project expenditures associated with updates in the Save Our Indian River Lagoon March 2020 Plan Update
Debt Service Expense $0 0.00%
Reserves-Operating Expense -$4,506,280 -38.24%
Attributable to the progression of multi-year Capital projects resulting in less Reserves associated with specific projects
Reserves - Capital Expense -$5,142,759 -10.02%
Attributable to the progression of multi-year Capital projects resulting in less Reserves associated with specific projects
Reserves - Restricted Expense $0 0.00%
Transfers Expense $0 0.00%
NATURAL RESOURCES MANAGEMENT: BEACHES, BOATINGS, AND WATERWAYS
Beaches, Boatings, and Waterways Program Revenue & Expense Category
Actual F Y 2018-
2019
Final Budget
F Y 2019-2020
Adopted Budget
F Y 2020-2021
Difference % Change
Taxes Revenue $0 $0 $0 $0 0.00% Permits, Fees & Special Assessments Revenue $0 $0 $0 $0 0.00%
Intergovernmental Revenue $3,153,812 $18,108,539 $15,110,633 -
$2,997,906 -16.56% Charges for Services Revenue $0 $3,500 $3,500 $0 0.00% Fines and Forfeits Revenue $0 $0 $0 $0 0.00%
Beaches, Boatings, and Waterways Program Revenue & Expense Category
Actual F Y 2018-
2019
Final Budget
F Y 2019-2020
Adopted Budget
F Y 2020-2021
Difference % Change
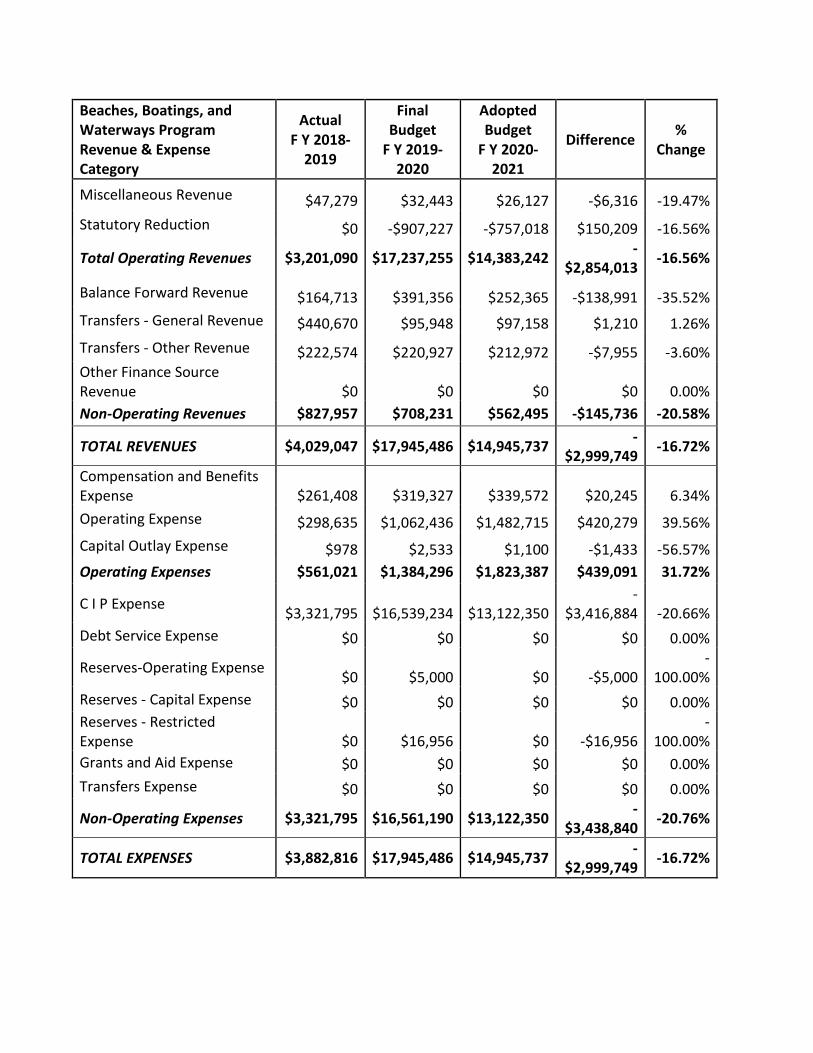
Miscellaneous Revenue $47,279 $32,443 $26,127 -$6,316 -19.47% Statutory Reduction $0 -$907,227 -$757,018 $150,209 -16.56%
Total Operating Revenues $3,201,090 $17,237,255 $14,383,242 -$2,854,013 -16.56%
Balance Forward Revenue $164,713 $391,356 $252,365 -$138,991 -35.52% Transfers - General Revenue $440,670 $95,948 $97,158 $1,210 1.26% Transfers - Other Revenue $222,574 $220,927 $212,972 -$7,955 -3.60% Other Finance Source Revenue $0 $0 $0 $0 0.00% Non-Operating Revenues $827,957 $708,231 $562,495 -$145,736 -20.58%
TOTAL REVENUES $4,029,047 $17,945,486 $14,945,737 -$2,999,749 -16.72%
Compensation and Benefits Expense $261,408 $319,327 $339,572 $20,245 6.34% Operating Expense $298,635 $1,062,436 $1,482,715 $420,279 39.56% Capital Outlay Expense $978 $2,533 $1,100 -$1,433 -56.57% Operating Expenses $561,021 $1,384,296 $1,823,387 $439,091 31.72%
C I P Expense $3,321,795 $16,539,234 $13,122,350 -
$3,416,884 -20.66% Debt Service Expense $0 $0 $0 $0 0.00%
Reserves-Operating Expense $0 $5,000 $0 -$5,000 -
100.00% Reserves - Capital Expense $0 $0 $0 $0 0.00% Reserves - Restricted Expense $0 $16,956 $0 -$16,956
-100.00%
Grants and Aid Expense $0 $0 $0 $0 0.00% Transfers Expense $0 $0 $0 $0 0.00%
Non-Operating Expenses $3,321,795 $16,561,190 $13,122,350 -$3,438,840 -20.76%
TOTAL EXPENSES $3,882,816 $17,945,486 $14,945,737 -$2,999,749 -16.72%
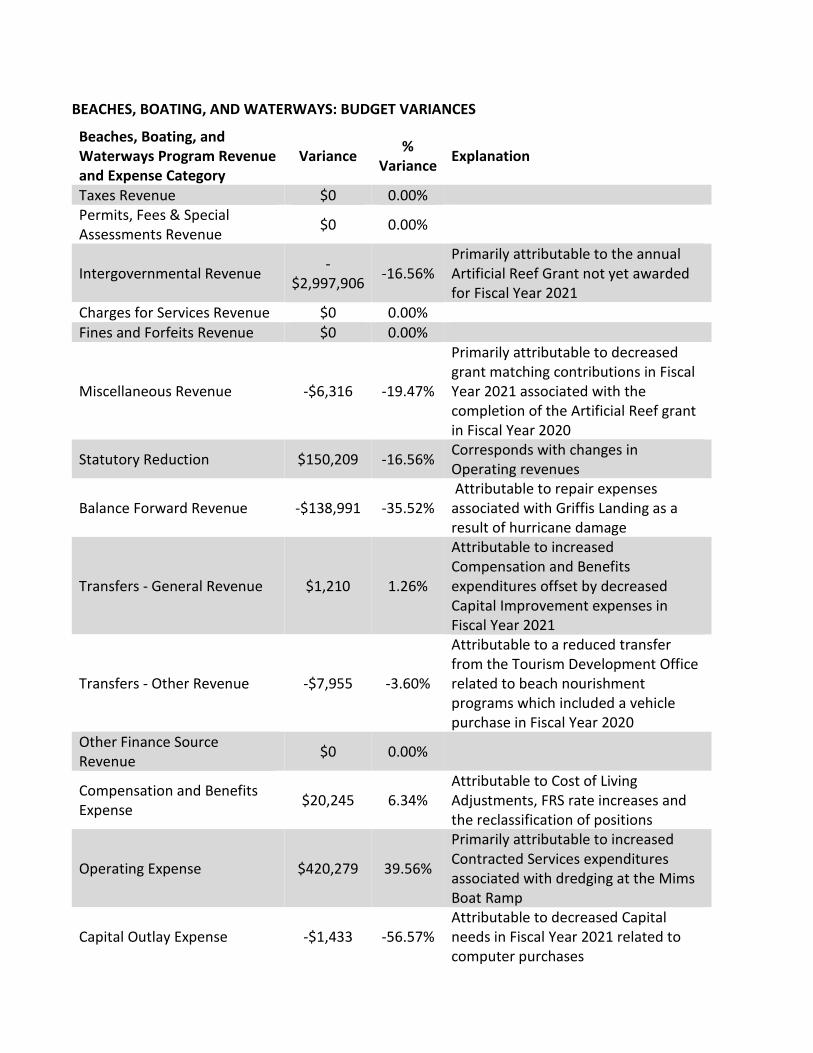
BEACHES, BOATING, AND WATERWAYS: BUDGET VARIANCES
Beaches, Boating, and Waterways Program Revenue and Expense Category
Variance % Variance Explanation
Taxes Revenue $0 0.00% Permits, Fees & Special Assessments Revenue $0 0.00%
Intergovernmental Revenue -$2,997,906 -16.56%
Primarily attributable to the annual Artificial Reef Grant not yet awarded for Fiscal Year 2021
Charges for Services Revenue $0 0.00% Fines and Forfeits Revenue $0 0.00%
Miscellaneous Revenue -$6,316 -19.47%
Primarily attributable to decreased grant matching contributions in Fiscal Year 2021 associated with the completion of the Artificial Reef grant in Fiscal Year 2020
Statutory Reduction $150,209 -16.56% Corresponds with changes in Operating revenues
Balance Forward Revenue -$138,991 -35.52% Attributable to repair expenses associated with Griffis Landing as a result of hurricane damage
Transfers - General Revenue $1,210 1.26%
Attributable to increased Compensation and Benefits expenditures offset by decreased Capital Improvement expenses in Fiscal Year 2021
Transfers - Other Revenue -$7,955 -3.60%
Attributable to a reduced transfer from the Tourism Development Office related to beach nourishment programs which included a vehicle purchase in Fiscal Year 2020
Other Finance Source Revenue $0 0.00%
Compensation and Benefits Expense $20,245 6.34%
Attributable to Cost of Living Adjustments, FRS rate increases and the reclassification of positions
Operating Expense $420,279 39.56%
Primarily attributable to increased Contracted Services expenditures associated with dredging at the Mims Boat Ramp
Capital Outlay Expense -$1,433 -56.57% Attributable to decreased Capital needs in Fiscal Year 2021 related to computer purchases
Beaches, Boating, and Waterways Program Revenue and Expense Category
Variance % Variance Explanation
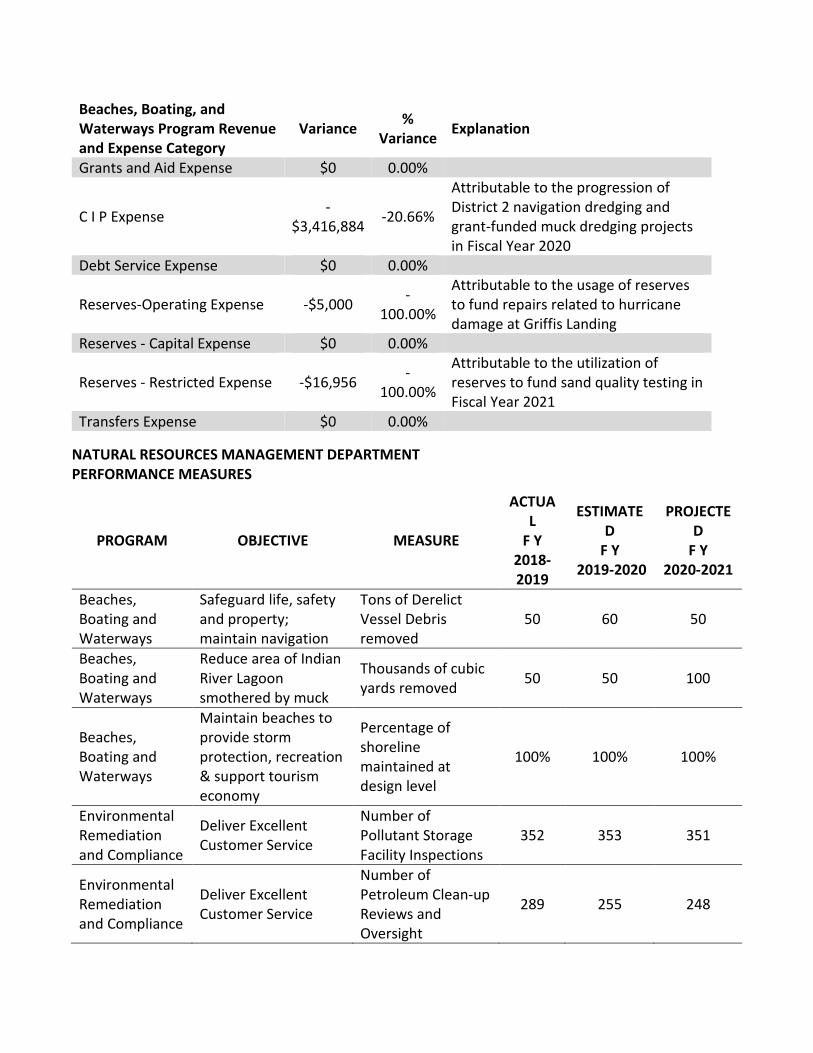
Grants and Aid Expense $0 0.00%
C I P Expense -$3,416,884 -20.66%
Attributable to the progression of District 2 navigation dredging and grant-funded muck dredging projects in Fiscal Year 2020
Debt Service Expense $0 0.00%
Reserves-Operating Expense -$5,000 -100.00%
Attributable to the usage of reserves to fund repairs related to hurricane damage at Griffis Landing
Reserves - Capital Expense $0 0.00%
Reserves - Restricted Expense -$16,956 -100.00%
Attributable to the utilization of reserves to fund sand quality testing in Fiscal Year 2021
Transfers Expense $0 0.00%
NATURAL RESOURCES MANAGEMENT DEPARTMENT PERFORMANCE MEASURES
PROGRAM OBJECTIVE MEASURE
ACTUAL
F Y 2018-2019
ESTIMATED
F Y 2019-2020
PROJECTED
F Y 2020-2021
Beaches, Boating and Waterways
Safeguard life, safety and property; maintain navigation
Tons of Derelict Vessel Debris removed
50 60 50
Beaches, Boating and Waterways
Reduce area of Indian River Lagoon smothered by muck
Thousands of cubic yards removed 50 50 100
Beaches, Boating and Waterways
Maintain beaches to provide storm protection, recreation & support tourism economy
Percentage of shoreline maintained at design level
100% 100% 100%
Environmental Remediation and Compliance
Deliver Excellent Customer Service
Number of Pollutant Storage Facility Inspections
352 353 351
Environmental Remediation and Compliance
Deliver Excellent Customer Service
Number of Petroleum Clean-up Reviews and Oversight
289 255 248
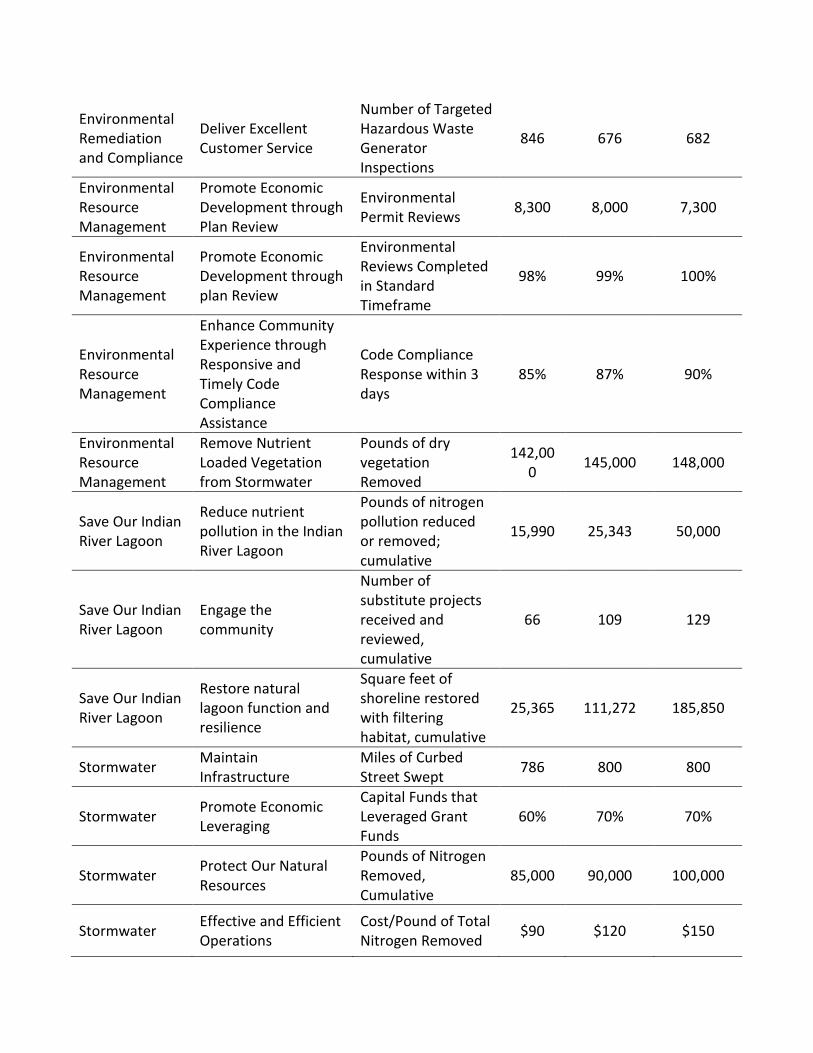
Environmental Remediation and Compliance
Deliver Excellent Customer Service
Number of Targeted Hazardous Waste Generator Inspections
846 676 682
Environmental Resource Management
Promote Economic Development through Plan Review
Environmental Permit Reviews 8,300 8,000 7,300
Environmental Resource Management
Promote Economic Development through plan Review
Environmental Reviews Completed in Standard Timeframe
98% 99% 100%
Environmental Resource Management
Enhance Community Experience through Responsive and Timely Code Compliance Assistance
Code Compliance Response within 3 days
85% 87% 90%
Environmental Resource Management
Remove Nutrient Loaded Vegetation from Stormwater
Pounds of dry vegetation Removed
142,000 145,000 148,000
Save Our Indian River Lagoon
Reduce nutrient pollution in the Indian River Lagoon
Pounds of nitrogen pollution reduced or removed; cumulative
15,990 25,343 50,000
Save Our Indian River Lagoon
Engage the community
Number of substitute projects received and reviewed, cumulative
66 109 129
Save Our Indian River Lagoon
Restore natural lagoon function and resilience
Square feet of shoreline restored with filtering habitat, cumulative
25,365 111,272 185,850
Stormwater Maintain Infrastructure
Miles of Curbed Street Swept 786 800 800
Stormwater Promote Economic Leveraging
Capital Funds that Leveraged Grant Funds
60% 70% 70%
Stormwater Protect Our Natural Resources
Pounds of Nitrogen Removed, Cumulative
85,000 90,000 100,000
Stormwater Effective and Efficient Operations
Cost/Pound of Total Nitrogen Removed $90 $120 $150

from Stormwater Runoff
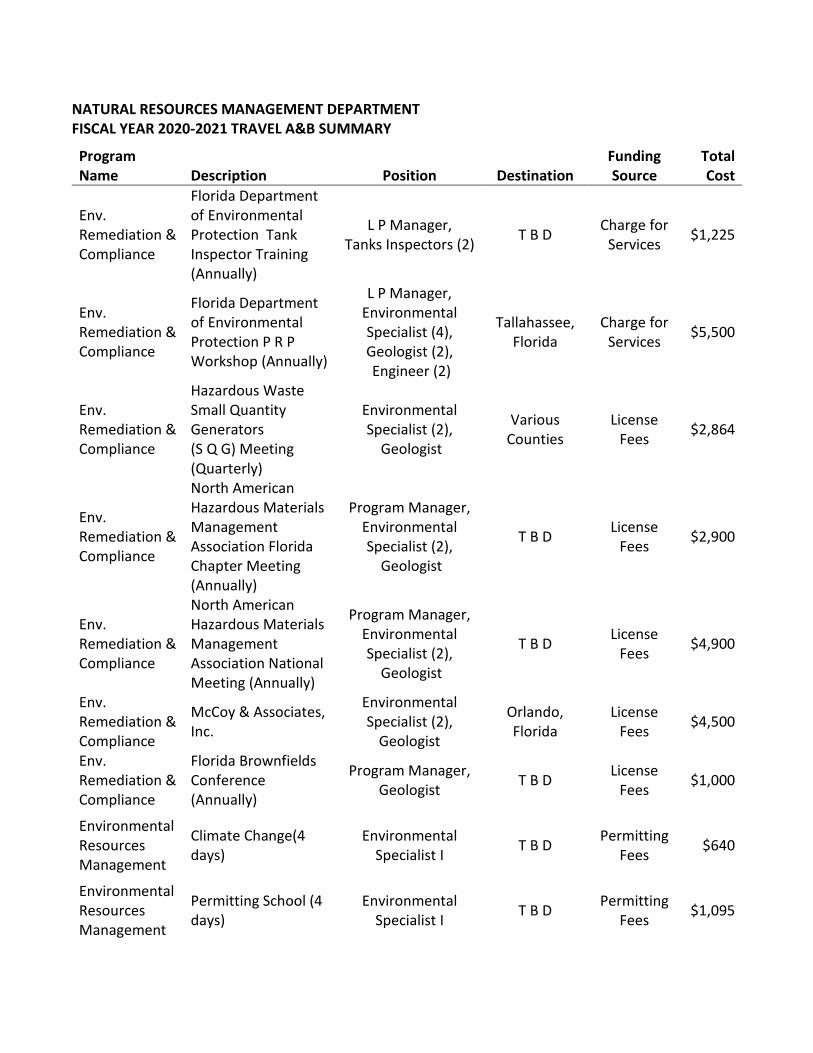
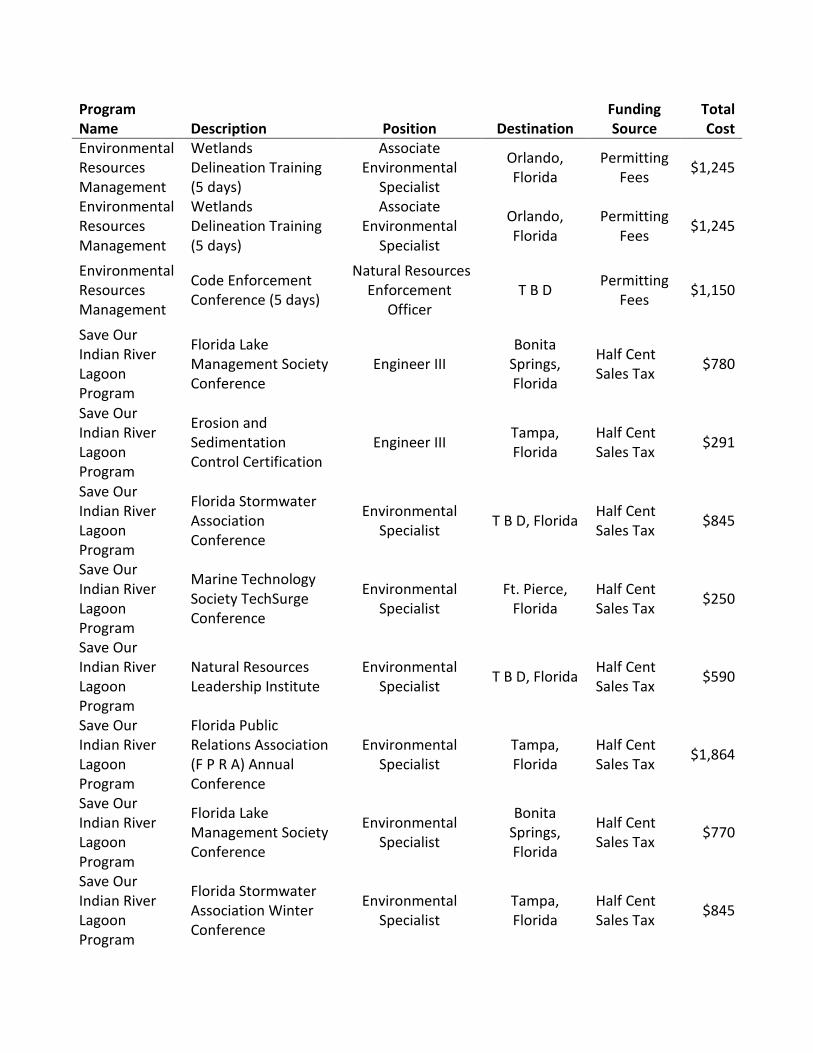
NATURAL RESOURCES MANAGEMENT DEPARTMENT FISCAL YEAR 2020-2021 TRAVEL A&B SUMMARY
Program Name Description Position Destination
Funding Source
Total Cost
Env. Remediation & Compliance
Florida Department of Environmental Protection Tank Inspector Training (Annually)
L P Manager, Tanks Inspectors (2) T B D Charge for
Services $1,225
Env. Remediation & Compliance
Florida Department of Environmental Protection P R P Workshop (Annually)
L P Manager, Environmental Specialist (4), Geologist (2), Engineer (2)
Tallahassee, Florida
Charge for Services $5,500
Env. Remediation & Compliance
Hazardous Waste Small Quantity Generators (S Q G) Meeting (Quarterly)
Environmental Specialist (2),
Geologist
Various Counties
License Fees $2,864
Env. Remediation & Compliance
North American Hazardous Materials Management Association Florida Chapter Meeting (Annually)
Program Manager, Environmental Specialist (2),
Geologist
T B D License Fees $2,900
Env. Remediation & Compliance
North American Hazardous Materials Management Association National Meeting (Annually)
Program Manager, Environmental Specialist (2),
Geologist
T B D License Fees $4,900
Env. Remediation & Compliance
McCoy & Associates, Inc.
Environmental Specialist (2),
Geologist
Orlando, Florida
License Fees $4,500
Env. Remediation & Compliance
Florida Brownfields Conference (Annually)
Program Manager, Geologist T B D License
Fees $1,000
Environmental Resources Management
Climate Change(4 days)
Environmental Specialist I T B D Permitting
Fees $640
Environmental Resources Management
Permitting School (4 days)
Environmental Specialist I T B D Permitting
Fees $1,095
Program Name Description Position Destination
Funding Source
Total Cost
Environmental Resources Management
Wetlands Delineation Training (5 days)
Associate Environmental
Specialist
Orlando, Florida
Permitting Fees $1,245
Environmental Resources Management
Wetlands Delineation Training (5 days)
Associate Environmental
Specialist
Orlando, Florida
Permitting Fees $1,245
Environmental Resources Management
Code Enforcement Conference (5 days)
Natural Resources Enforcement
Officer T B D Permitting
Fees $1,150
Save Our Indian River Lagoon Program
Florida Lake Management Society Conference
Engineer III Bonita
Springs, Florida
Half Cent Sales Tax $780
Save Our Indian River Lagoon Program
Erosion and Sedimentation Control Certification
Engineer III Tampa, Florida
Half Cent Sales Tax $291
Save Our Indian River Lagoon Program
Florida Stormwater Association Conference
Environmental Specialist T B D, Florida Half Cent
Sales Tax $845
Save Our Indian River Lagoon Program
Marine Technology Society TechSurge Conference
Environmental Specialist
Ft. Pierce, Florida
Half Cent Sales Tax $250
Save Our Indian River Lagoon Program
Natural Resources Leadership Institute
Environmental Specialist T B D, Florida Half Cent
Sales Tax $590
Save Our Indian River Lagoon Program
Florida Public Relations Association (F P R A) Annual Conference
Environmental Specialist
Tampa, Florida
Half Cent Sales Tax $1,864
Save Our Indian River Lagoon Program
Florida Lake Management Society Conference
Environmental Specialist
Bonita Springs, Florida
Half Cent Sales Tax $770
Save Our Indian River Lagoon Program
Florida Stormwater Association Winter Conference
Environmental Specialist
Tampa, Florida
Half Cent Sales Tax $845
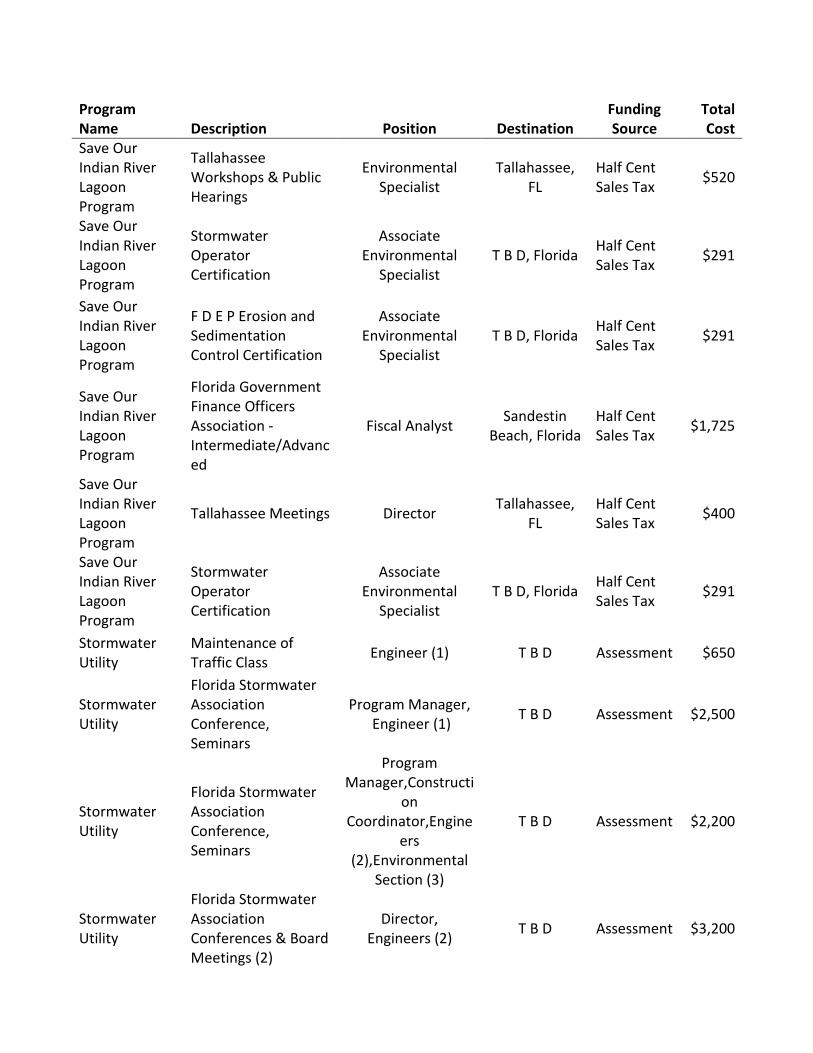
Program Name Description Position Destination
Funding Source
Total Cost
Save Our Indian River Lagoon Program
Tallahassee Workshops & Public Hearings
Environmental Specialist
Tallahassee, FL
Half Cent Sales Tax $520
Save Our Indian River Lagoon Program
Stormwater Operator Certification
Associate Environmental
Specialist T B D, Florida Half Cent
Sales Tax $291
Save Our Indian River Lagoon Program
F D E P Erosion and Sedimentation Control Certification
Associate Environmental
Specialist T B D, Florida Half Cent
Sales Tax $291
Save Our Indian River Lagoon Program
Florida Government Finance Officers Association - Intermediate/Advanced
Fiscal Analyst Sandestin Beach, Florida
Half Cent Sales Tax $1,725
Save Our Indian River Lagoon Program
Tallahassee Meetings Director Tallahassee, FL
Half Cent Sales Tax $400
Save Our Indian River Lagoon Program
Stormwater Operator Certification
Associate Environmental
Specialist T B D, Florida Half Cent
Sales Tax $291
Stormwater Utility
Maintenance of Traffic Class Engineer (1) T B D Assessment $650
Stormwater Utility
Florida Stormwater Association Conference, Seminars
Program Manager, Engineer (1) T B D Assessment $2,500
Stormwater Utility
Florida Stormwater Association Conference, Seminars
Program Manager,Constructi
on Coordinator,Engine
ers (2),Environmental
Section (3)
T B D Assessment $2,200
Stormwater Utility
Florida Stormwater Association Conferences & Board Meetings (2)
Director, Engineers (2) T B D Assessment $3,200
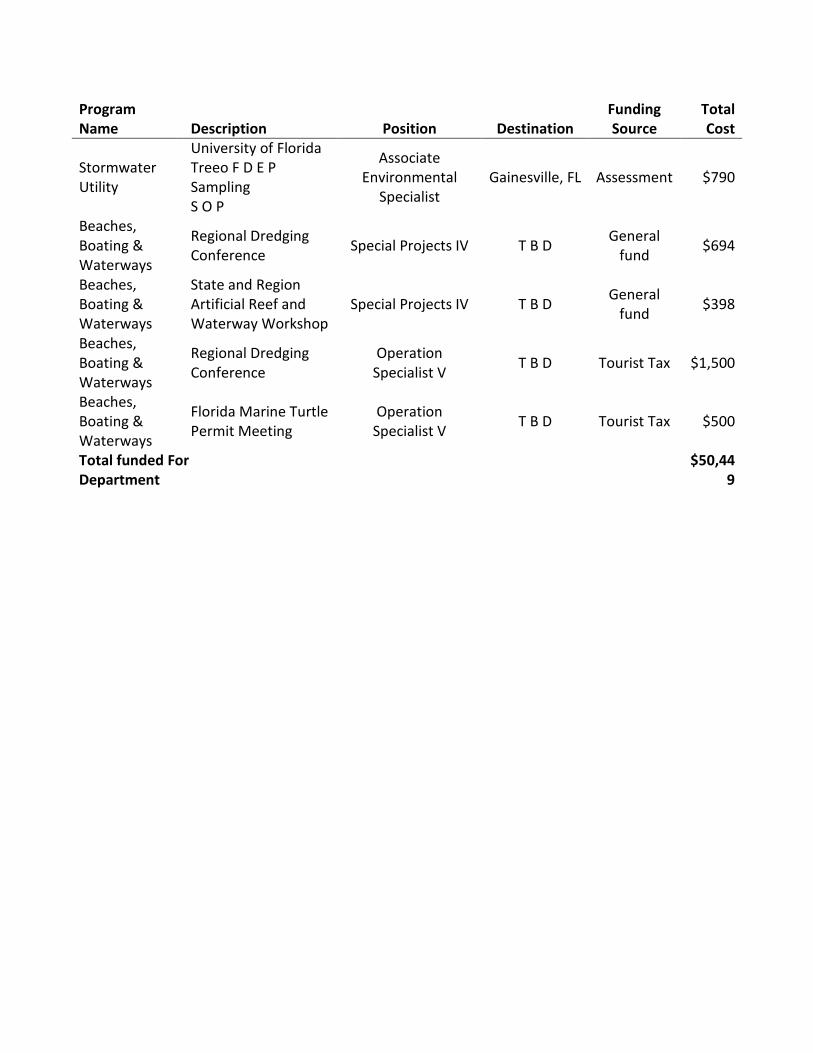
Program Name Description Position Destination
Funding Source
Total Cost
Stormwater Utility
University of Florida Treeo F D E P Sampling S O P
Associate Environmental
Specialist Gainesville, FL Assessment $790
Beaches, Boating & Waterways
Regional Dredging Conference Special Projects IV T B D General
fund $694
Beaches, Boating & Waterways
State and Region Artificial Reef and Waterway Workshop
Special Projects IV T B D General fund $398
Beaches, Boating & Waterways
Regional Dredging Conference
Operation Specialist V T B D Tourist Tax $1,500
Beaches, Boating & Waterways
Florida Marine Turtle Permit Meeting
Operation Specialist V T B D Tourist Tax $500
Total funded For Department
$50,449
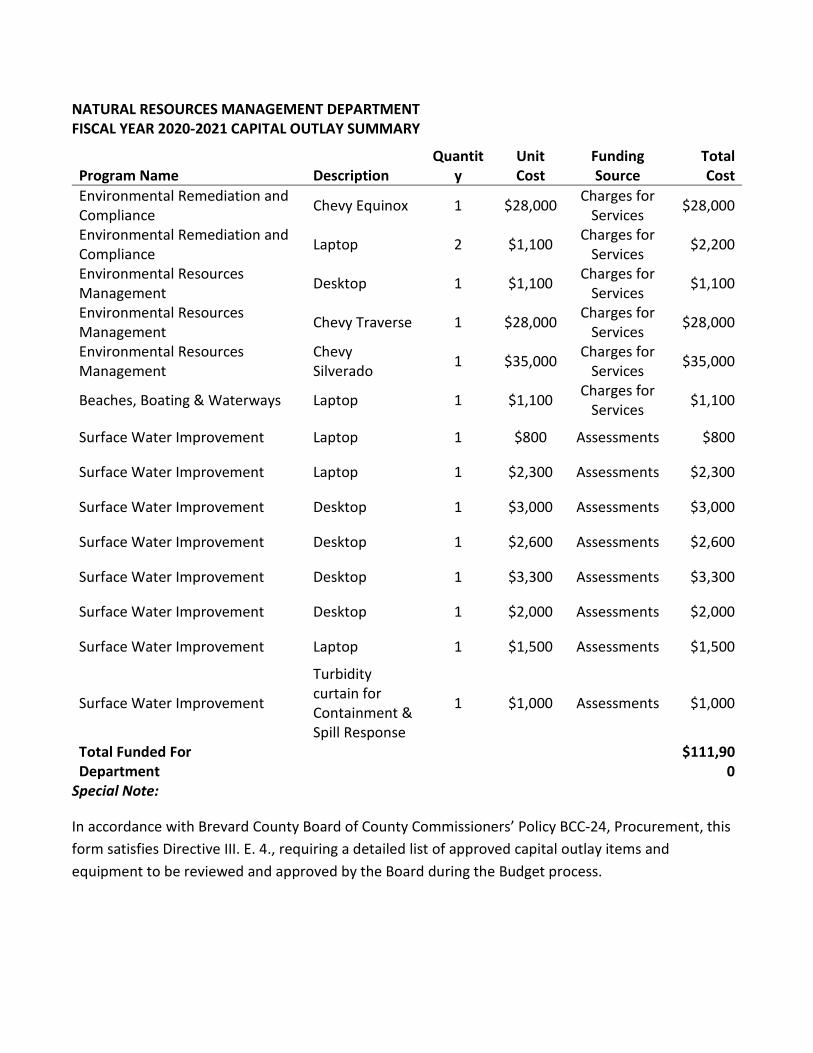
NATURAL RESOURCES MANAGEMENT DEPARTMENT FISCAL YEAR 2020-2021 CAPITAL OUTLAY SUMMARY
Program Name Description Quantit
y Unit Cost
Funding Source
Total Cost
Environmental Remediation and Compliance Chevy Equinox 1 $28,000 Charges for
Services $28,000
Environmental Remediation and Compliance Laptop 2 $1,100 Charges for
Services $2,200
Environmental Resources Management Desktop 1 $1,100 Charges for
Services $1,100
Environmental Resources Management Chevy Traverse 1 $28,000 Charges for
Services $28,000
Environmental Resources Management
Chevy Silverado 1 $35,000 Charges for
Services $35,000
Beaches, Boating & Waterways Laptop 1 $1,100 Charges for Services $1,100
Surface Water Improvement Laptop 1 $800 Assessments $800
Surface Water Improvement Laptop 1 $2,300 Assessments $2,300
Surface Water Improvement Desktop 1 $3,000 Assessments $3,000
Surface Water Improvement Desktop 1 $2,600 Assessments $2,600
Surface Water Improvement Desktop 1 $3,300 Assessments $3,300
Surface Water Improvement Desktop 1 $2,000 Assessments $2,000
Surface Water Improvement Laptop 1 $1,500 Assessments $1,500
Surface Water Improvement
Turbidity curtain for Containment & Spill Response
1 $1,000 Assessments $1,000
Total Funded For Department $111,90
0 Special Note:
In accordance with Brevard County Board of County Commissioners’ Policy BCC-24, Procurement, this form satisfies Directive III. E. 4., requiring a detailed list of approved capital outlay items and equipment to be reviewed and approved by the Board during the Budget process.
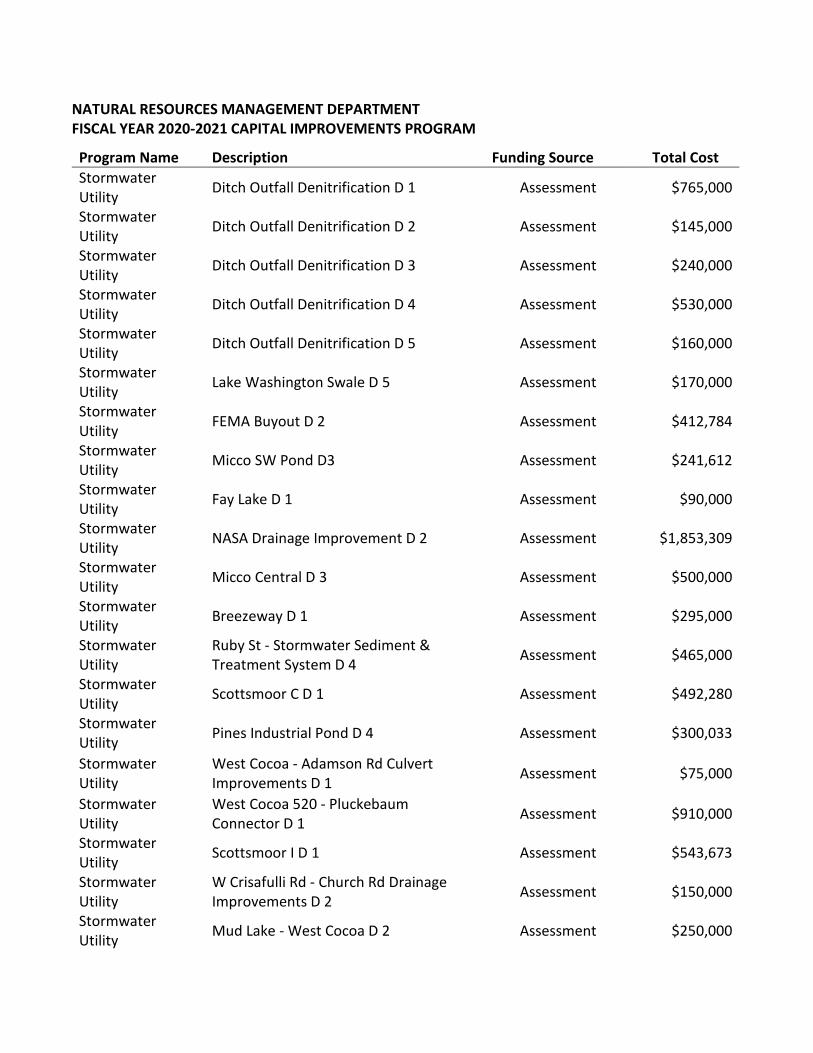
NATURAL RESOURCES MANAGEMENT DEPARTMENT FISCAL YEAR 2020-2021 CAPITAL IMPROVEMENTS PROGRAM
Program Name Description Funding Source Total Cost Stormwater Utility Ditch Outfall Denitrification D 1 Assessment $765,000
Stormwater Utility Ditch Outfall Denitrification D 2 Assessment $145,000
Stormwater Utility Ditch Outfall Denitrification D 3 Assessment $240,000
Stormwater Utility Ditch Outfall Denitrification D 4 Assessment $530,000
Stormwater Utility Ditch Outfall Denitrification D 5 Assessment $160,000
Stormwater Utility Lake Washington Swale D 5 Assessment $170,000
Stormwater Utility FEMA Buyout D 2 Assessment $412,784
Stormwater Utility Micco SW Pond D3 Assessment $241,612
Stormwater Utility Fay Lake D 1 Assessment $90,000
Stormwater Utility NASA Drainage Improvement D 2 Assessment $1,853,309
Stormwater Utility Micco Central D 3 Assessment $500,000
Stormwater Utility Breezeway D 1 Assessment $295,000
Stormwater Utility
Ruby St - Stormwater Sediment & Treatment System D 4 Assessment $465,000
Stormwater Utility Scottsmoor C D 1 Assessment $492,280
Stormwater Utility Pines Industrial Pond D 4 Assessment $300,033
Stormwater Utility
West Cocoa - Adamson Rd Culvert Improvements D 1 Assessment $75,000
Stormwater Utility
West Cocoa 520 - Pluckebaum Connector D 1 Assessment $910,000
Stormwater Utility Scottsmoor I D 1 Assessment $543,673
Stormwater Utility
W Crisafulli Rd - Church Rd Drainage Improvements D 2 Assessment $150,000
Stormwater Utility Mud Lake - West Cocoa D 2 Assessment $250,000
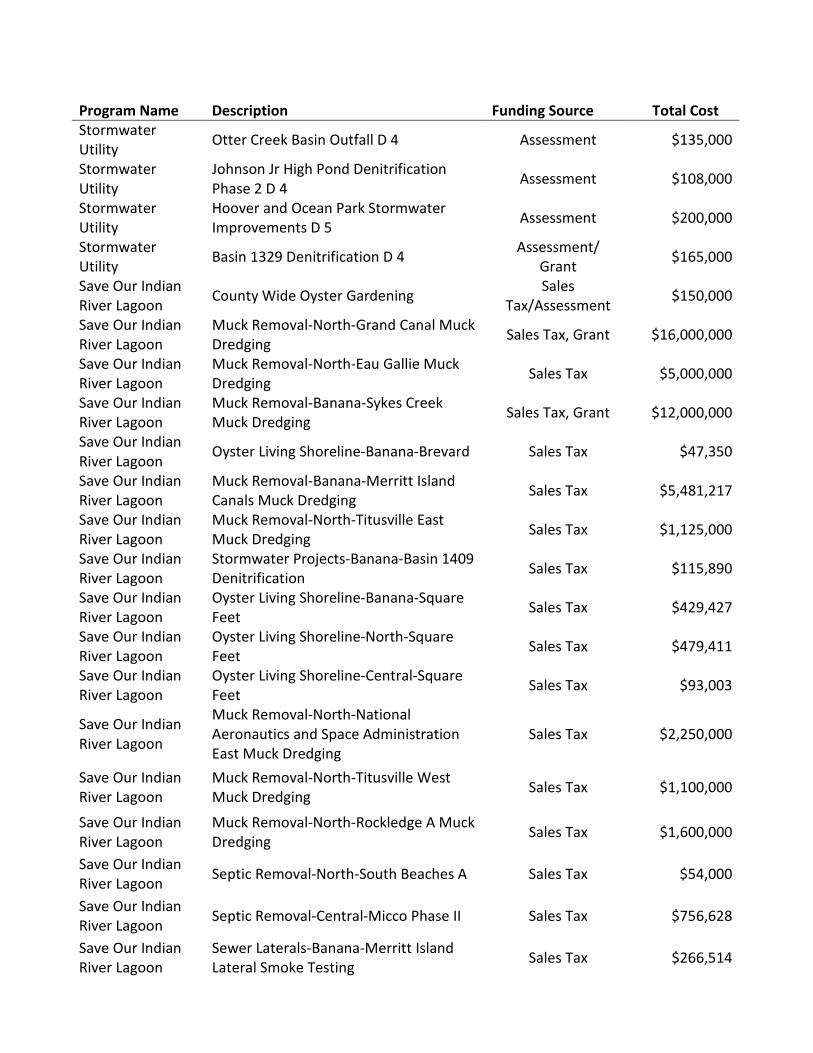
Program Name Description Funding Source Total Cost Stormwater Utility Otter Creek Basin Outfall D 4 Assessment $135,000
Stormwater Utility
Johnson Jr High Pond Denitrification Phase 2 D 4 Assessment $108,000
Stormwater Utility
Hoover and Ocean Park Stormwater Improvements D 5 Assessment $200,000
Stormwater Utility Basin 1329 Denitrification D 4 Assessment/
Grant $165,000
Save Our Indian River Lagoon County Wide Oyster Gardening Sales
Tax/Assessment $150,000
Save Our Indian River Lagoon
Muck Removal-North-Grand Canal Muck Dredging Sales Tax, Grant $16,000,000
Save Our Indian River Lagoon
Muck Removal-North-Eau Gallie Muck Dredging Sales Tax $5,000,000
Save Our Indian River Lagoon
Muck Removal-Banana-Sykes Creek Muck Dredging Sales Tax, Grant $12,000,000
Save Our Indian River Lagoon Oyster Living Shoreline-Banana-Brevard Sales Tax $47,350
Save Our Indian River Lagoon
Muck Removal-Banana-Merritt Island Canals Muck Dredging Sales Tax $5,481,217
Save Our Indian River Lagoon
Muck Removal-North-Titusville East Muck Dredging Sales Tax $1,125,000
Save Our Indian River Lagoon
Stormwater Projects-Banana-Basin 1409 Denitrification Sales Tax $115,890
Save Our Indian River Lagoon
Oyster Living Shoreline-Banana-Square Feet Sales Tax $429,427
Save Our Indian River Lagoon
Oyster Living Shoreline-North-Square Feet Sales Tax $479,411
Save Our Indian River Lagoon
Oyster Living Shoreline-Central-Square Feet Sales Tax $93,003
Save Our Indian River Lagoon
Muck Removal-North-National Aeronautics and Space Administration East Muck Dredging
Sales Tax $2,250,000
Save Our Indian River Lagoon
Muck Removal-North-Titusville West Muck Dredging Sales Tax $1,100,000
Save Our Indian River Lagoon
Muck Removal-North-Rockledge A Muck Dredging Sales Tax $1,600,000
Save Our Indian River Lagoon Septic Removal-North-South Beaches A Sales Tax $54,000
Save Our Indian River Lagoon Septic Removal-Central-Micco Phase II Sales Tax $756,628
Save Our Indian River Lagoon
Sewer Laterals-Banana-Merritt Island Lateral Smoke Testing Sales Tax $266,514
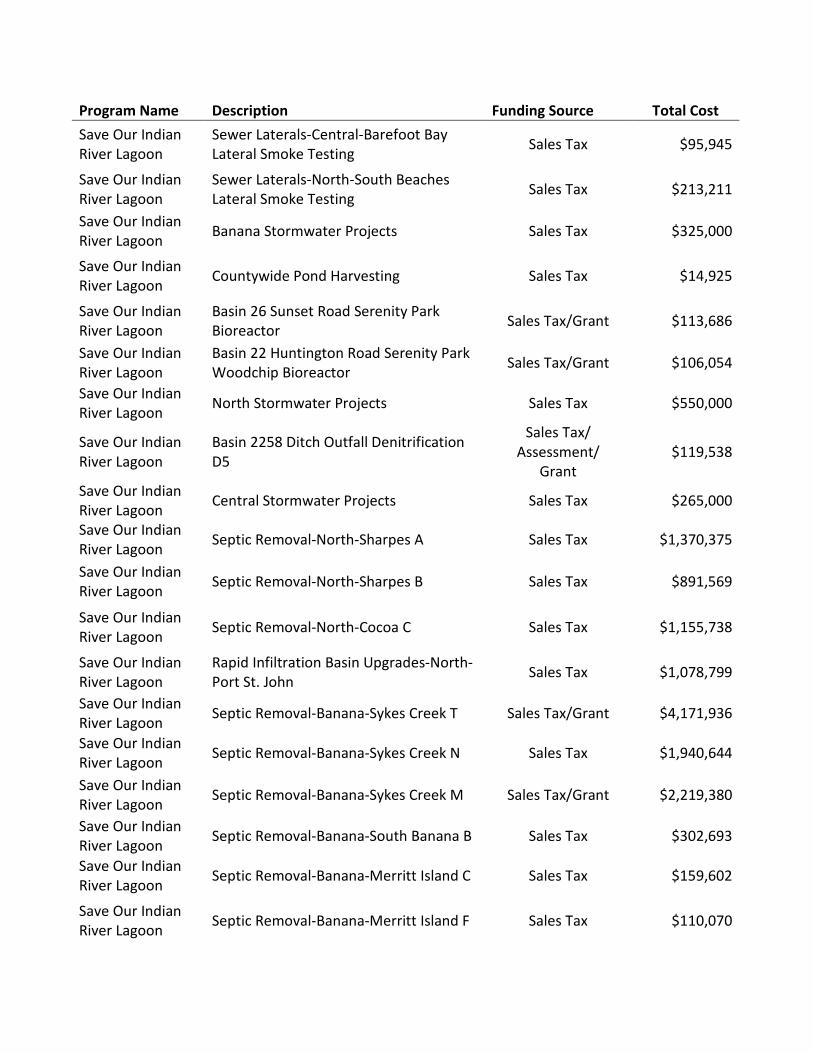
Program Name Description Funding Source Total Cost Save Our Indian River Lagoon
Sewer Laterals-Central-Barefoot Bay Lateral Smoke Testing Sales Tax $95,945
Save Our Indian River Lagoon
Sewer Laterals-North-South Beaches Lateral Smoke Testing Sales Tax $213,211
Save Our Indian River Lagoon Banana Stormwater Projects Sales Tax $325,000
Save Our Indian River Lagoon Countywide Pond Harvesting Sales Tax $14,925
Save Our Indian River Lagoon
Basin 26 Sunset Road Serenity Park Bioreactor Sales Tax/Grant $113,686
Save Our Indian River Lagoon
Basin 22 Huntington Road Serenity Park Woodchip Bioreactor Sales Tax/Grant $106,054
Save Our Indian River Lagoon North Stormwater Projects Sales Tax $550,000
Save Our Indian River Lagoon
Basin 2258 Ditch Outfall Denitrification D5
Sales Tax/ Assessment/
Grant $119,538
Save Our Indian River Lagoon Central Stormwater Projects Sales Tax $265,000
Save Our Indian River Lagoon Septic Removal-North-Sharpes A Sales Tax $1,370,375
Save Our Indian River Lagoon Septic Removal-North-Sharpes B Sales Tax $891,569
Save Our Indian River Lagoon Septic Removal-North-Cocoa C Sales Tax $1,155,738
Save Our Indian River Lagoon
Rapid Infiltration Basin Upgrades-North-Port St. John Sales Tax $1,078,799
Save Our Indian River Lagoon Septic Removal-Banana-Sykes Creek T Sales Tax/Grant $4,171,936
Save Our Indian River Lagoon Septic Removal-Banana-Sykes Creek N Sales Tax $1,940,644
Save Our Indian River Lagoon Septic Removal-Banana-Sykes Creek M Sales Tax/Grant $2,219,380
Save Our Indian River Lagoon Septic Removal-Banana-South Banana B Sales Tax $302,693
Save Our Indian River Lagoon Septic Removal-Banana-Merritt Island C Sales Tax $159,602
Save Our Indian River Lagoon Septic Removal-Banana-Merritt Island F Sales Tax $110,070
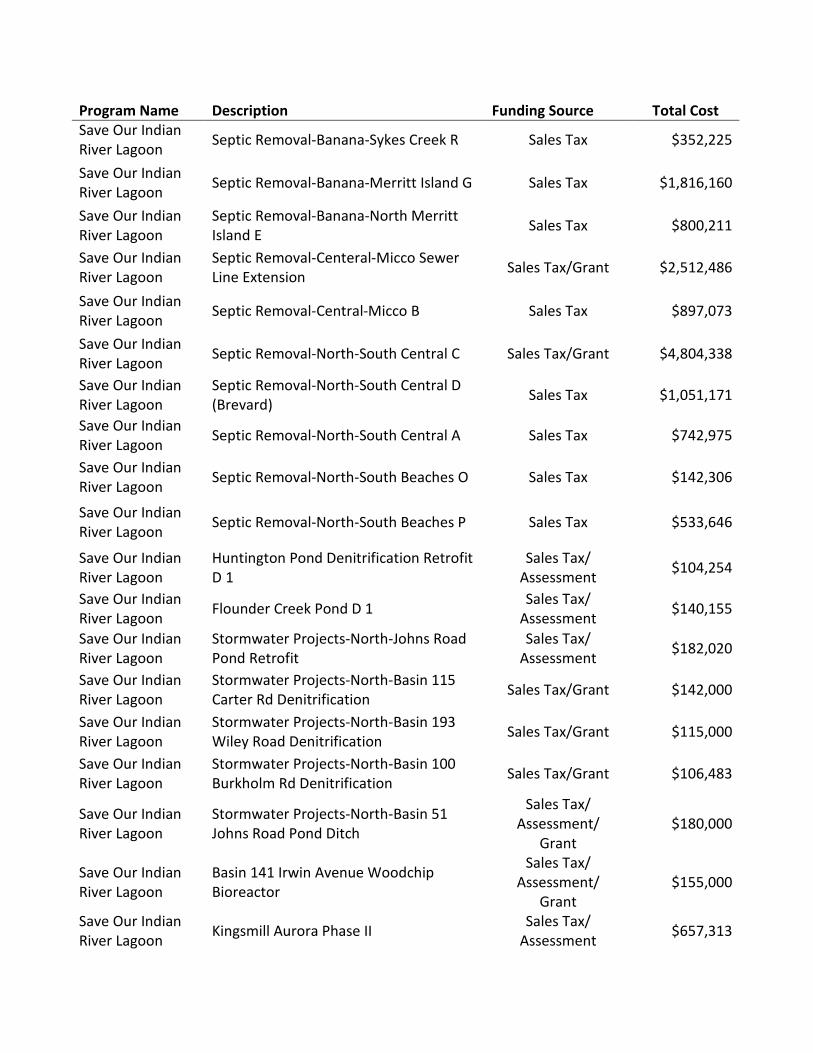
Program Name Description Funding Source Total Cost Save Our Indian River Lagoon Septic Removal-Banana-Sykes Creek R Sales Tax $352,225
Save Our Indian River Lagoon Septic Removal-Banana-Merritt Island G Sales Tax $1,816,160
Save Our Indian River Lagoon
Septic Removal-Banana-North Merritt Island E Sales Tax $800,211
Save Our Indian River Lagoon
Septic Removal-Centeral-Micco Sewer Line Extension Sales Tax/Grant $2,512,486
Save Our Indian River Lagoon Septic Removal-Central-Micco B Sales Tax $897,073
Save Our Indian River Lagoon Septic Removal-North-South Central C Sales Tax/Grant $4,804,338
Save Our Indian River Lagoon
Septic Removal-North-South Central D (Brevard) Sales Tax $1,051,171
Save Our Indian River Lagoon Septic Removal-North-South Central A Sales Tax $742,975
Save Our Indian River Lagoon Septic Removal-North-South Beaches O Sales Tax $142,306
Save Our Indian River Lagoon Septic Removal-North-South Beaches P Sales Tax $533,646
Save Our Indian River Lagoon
Huntington Pond Denitrification Retrofit D 1
Sales Tax/ Assessment $104,254
Save Our Indian River Lagoon Flounder Creek Pond D 1 Sales Tax/
Assessment $140,155
Save Our Indian River Lagoon
Stormwater Projects-North-Johns Road Pond Retrofit
Sales Tax/ Assessment $182,020
Save Our Indian River Lagoon
Stormwater Projects-North-Basin 115 Carter Rd Denitrification Sales Tax/Grant $142,000
Save Our Indian River Lagoon
Stormwater Projects-North-Basin 193 Wiley Road Denitrification Sales Tax/Grant $115,000
Save Our Indian River Lagoon
Stormwater Projects-North-Basin 100 Burkholm Rd Denitrification Sales Tax/Grant $106,483
Save Our Indian River Lagoon
Stormwater Projects-North-Basin 51 Johns Road Pond Ditch
Sales Tax/ Assessment/
Grant $180,000
Save Our Indian River Lagoon
Basin 141 Irwin Avenue Woodchip Bioreactor
Sales Tax/ Assessment/
Grant $155,000
Save Our Indian River Lagoon Kingsmill Aurora Phase II Sales Tax/
Assessment $657,313
Program Name Description Funding Source Total Cost Save Our Indian River Lagoon
Stormwater Projects-Banana-Basin 1304 Seagull Bioreactor Sales Tax/Grant $152,925
Total Funded For Department $86,937,037