natural resources conservation service effects of ... · practice adoption on cultivated cropland...
TRANSCRIPT
United States Department of Agriculture
Natural Resources Conservation Service
Effects of Conservation Practice Adoption on Cultivated Cropland Acres in Western Lake Erie Basin, 2003-06 and 2012
Conservation Effects Assessment Project (CEAP) - Cropland
Special Study Report
March 2016
i
Cover Image: Aerial View of the Western Lake Erie Basin. Provided by Resource Assessment Division, Soil Science and Resource Assessment, Natural Resources Conservation Service, United States Department of Agriculture (map ID #m13722_RAD). Created January 27, 2016. Aerial data source: Environmental Systems Research Institute (ESRI), DigitalGlobe Aerial Imagery. Data last modified January 15, 2016. Suggested Citation: U.S. Department of Agriculture, Natural Resources Conservation Service. 2016. Effects of Conservation Practice Adoption on Cultivated Cropland Acres in Western Lake Erie Basin, 2003-06 and 2012. 120 pp.
The Conservation Effects Assessment Project (CEAP)—Strengthening the science base for natural resource conservation
The Conservation Effects Assessment Project (CEAP) was initiated by USDA’s Natural Resources Conservation Service (NRCS), Agricultural Research Service (ARS), and National Institute of Food and Agriculture (NIFA) [formerly known as Cooperative State Research, Education, and Extension Service (CSREES)] in 2002 as a means to analyze societal and environmental benefits gained from the 2002 Farm Bill’s substantial increase in conservation program funding. The CEAP-1 survey was conducted on agricultural lands across the United States in 2003-06. The goals of CEAP-1 were to estimate conservation benefits for reporting at the national and regional levels and to establish the scientific understanding of the effects and benefits of conservation practices at the watershed scale. As CEAP evolved, the scope was expanded to assess the impacts and efficacy of various conservation practices on maintaining and improving soil and water quality at regional, national, and watershed scales.
CEAP activities are organized into three interconnected efforts:
• Bibliographies, literature reviews, and scientific workshops to establish what is known about the environmental effects of conservation practices at the field and watershed scale.
• National and regional assessments to estimate the environmental effects and benefits of conservation practices on the landscape and to estimate conservation treatment needs. The four components of the national and regional assessment effort are Cropland; Wetlands; Grazing Lands, including rangeland, pastureland, and grazed forestland; and Wildlife.
• Watershed studies to provide in-depth quantification of water quality and soil quality impacts of conservation practices at the local level and to provide insight on what practices are most effective and where they are needed within a watershed to achieve environmental goals.
CEAP-1 benchmark results, currently published for12 watersheds, provide a scientific basis for interpreting conservation practice implementation impacts and identifying remaining conservation practice needs. These reports continue to inform decision-makers, policymakers, and the public on the environmental and societal benefits of conservation practice use. CEAP-2, the second national survey of agricultural lands across the United States, is currently underway, with sampling occurring in 2015 and 2016.
Additional information on the scope of the project can be found at http://www.nrcs.usda.gov/technical/nri/ceap/.
The U.S. Department of Agriculture (USDA) prohibits discrimination in all its programs and activities on the basis of race, color, national origin, age, disability, and where applicable, sex, marital status, familial status, parental status, religion, sexual orientation, genetic information, political beliefs, reprisal, or because all or part of an individual’s income is derived from any public assistance program. (Not all prohibited bases apply to all programs.) Persons with disabilities who require alternative means for communication of program information (Braille, large print, audiotape, etc.) should contact USDA’s TARGET Center at (202) 720-2600 (voice and TDD). To file a complaint of discrimination, write to USDA, Director, Office of Civil Rights, 1400 Independence Avenue, S.W., Washington, D.C. 20250-9410, or call (800) 795-3272 (voice) or (202) 720-6382 (TDD). USDA is an equal opportunity provider and employer.
ii
This report was prepared by the Conservation Effects Assessment Project (CEAP)-Cropland Modeling Team and published by the USDA’s Natural Resources Conservation Service (NRCS). The modeling team consists of scientists and analysts from NRCS, USDA’s Agricultural Research Service (ARS), the University of Massachusetts, and Texas A&M AgriLife Research. Natural Resources Conservation Service, USDA
M. Lee Norfleet, Project Coordinator, Temple, TX, Soil Scientist Jay D. Atwood, Temple, TX, Agricultural Economist Tim Dybala, Temple, TX, Civil Engineer Maria Hrebik, Temple, TX, Civil Engineer Kevin Ingram, Beltsville, MD, Agricultural Economist Mari-Vaughn V. Johnson, Temple, TX, Agronomist Chris Lester, Temple, TX, Soil Conservationist Daryl Lund, Beltsville, MD, Soil Scientist Loretta J. Metz, Temple, TX, Rangeland Management Specialist Robert Sowers, Beltsville, MD, Information Management Specialist Evelyn Steglich, Temple, TX, Natural Resource Specialist
Agricultural Research Service, USDA, Grassland, Soil, and Water Research Laboratory, Temple, TX Jeff Arnold, Agricultural Engineer Kathrine D. Behrman, Research Scientist (Contract) Daren Harmel, Agricultural Engineer Mike White, Agricultural Engineer
Blackland Research & Extension Center, Texas A&M AgriLife Research, Temple, TX
Tom Gerik, Director Arnold King, Resource Conservationist David C. Moffitt, Environmental Engineer Theresa Pitts, Programmer Xiuying (Susan) Wang, Agricultural Engineer Jimmy Williams, Agricultural Engineer
The study was conducted under the direction of David Smith, Deputy Chief for Soil Science and Resource Assessment; Michele Laur, former Director of Resource Assessment Division; Dan Mullarkey, current Director of Resource Assessment Division, and Micheal Golden and Douglas Lawrence, former Deputy Chief for Soil Survey and Resource Assessment, NRCS. Executive support was provided by NRCS Chief Jason Weller and former NRCS Chief Dave White. Acknowledgements The team thanks Shiela Corley, Torey Lawrence, Esmerelda Dickson, and Julia Klapproth, USDA National Agricultural Statistics Service, for leading the survey data collection effort; Mark Siemers and Todd Campbell, CARD, Iowa State University, for providing I-APEX support; NRCS field offices, for assisting in collection of conservation practice data; Kevin Ingram and Chieh (Peter) Chen, USDA NRCS, Beltsville, MD, for geographic information systems (GIS) analysis support; Armen Kemanian, Penn State University, for improving the denitrification routine in APEX; Susan Wallace, George Wallace, and Karl Musser, Paradigm Systems, Beltsville, MD, for graphics support, National Resources Inventory (NRI) database support, website support, and calculation of standard errors; and many others who provided advice, guidance, and suggestions throughout the project. Last, but certainly not least, the team thanks the producers, land operators, farmers, and ranchers, without whose continued cooperation the CEAP effort, including this report, would not be possible.
iii
Foreword This report on the Western Lake Erie Basin marks the second in a series of priority regional revisits that have occurred since the Nation’s croplands were originally surveyed and assessed by the U.S. Department of Agriculture’s (USDA) Natural Resources Conservation Service (NRCS) through the Conservation Effects Assessment Project (CEAP) in 2003-2006. The original Great Lakes region report was released as part of the national CEAP-Cropland series of regional reports, continuing the tradition within USDA of assessing the status, condition, and trend of natural resources to determine how to improve conservation programs to best meet the Nation’s needs (USDA NRCS 2011). The regional CEAP reports use a sampling and modeling approach to quantify the environmental benefits that farmers and conservation programs currently provide to society, and to explore prospects for attaining additional benefits with further or alternative conservation treatment. This report differs from the 2011-published “Assessment of the Effects of Conservation Practices on Cultivated Cropland in the Great Lakes Region” in several key aspects. The 2011 report covered the entire Great Lakes region, whereas this report is the result of a special study in CEAP-Cropland focused on the Western Lake Erie Basin. The survey data for the 2011 report was collected over a multiyear period (2003-06) as part of the original (or CEAP-1) CEAP-Cropland national survey, while the resurvey activity that informs this report occurred solely in the fall of 2012. During the interim between the publication of the benchmark report in 2011 and this report, there have been numerous improvements and updates performed on the Agricultural Policy/Environmental eXtender (APEX) model, improvements in soils input data, increased weather data availability, and refinement of analytical techniques for evaluating the model results. As these changes impacted data interpretation, model function, and results, the 2003-06 data was reanalyzed alongside the 2012 data. The more robust approach used in this analysis produced results that differ from the results reported in the original USDA NRCS CEAP report for the Great Lakes region (USDA NRCS 2011). Therefore, readers of both reports will notice differences in certain results, procedures, and interpretations. The 2011 report quantified the conservation practices on the ground at the time of the survey and provided an assessment of their impacts at the edge of the field and at the 8- and 4-digit HUC (hydrologic unit code) watershed outlets. This report is limited to quantifying practice adoption per the 2012 survey, assessing the impacts at the edge of the field, and exploring potential future conservation strategy scenarios. Analyses of watershed instream processes and outlet delivery with the Soil and Water Assessment Tool (SWAT) will follow in a subsequent report. The entire Great Lakes region will be sampled in a second national CEAP-Cropland effort over 2015 and 2016 (CEAP-2), and a report will follow. USDA has a rich tradition of working with farmers and ranchers to enhance agricultural productivity and environmental conservation through voluntary programs. Many USDA programs provide financial assistance to producers to encourage adoption of conservation practices appropriate to local soil and site conditions. Other USDA programs, in tandem with state and local programs, provide technical assistance to design, install, and implement conservation practices that are consistent with farmer objectives and policy goals. By participating in USDA conservation programs, producers are able to: • install structural practices such as riparian buffers, grass filter strips, terraces, grassed waterways, and contour farming, all of
which reduce erosion, sedimentation, and nutrients leaving the field; • adopt conservation systems and practices such as conservation tillage, nutrient management, integrated pest management, and
irrigation water management, which conserve resources and maintain the long-term productivity of crop and pastureland; • convert land with high capacity to produce significant wildlife and other ecosystem service benefits from agriculture to managed
natural systems; and • retire land that is too fragile, less productive, or unprofitable for continued agricultural production by planting and maintaining
grasses, trees, or wetland vegetation on it.
As soil and water conservation remains a national priority, it is imperative to quantify the effectiveness of current conservation practices and identify the potential for improving conservation gains. Over the past several decades, as the relationship between crop production and the environment in which it depends has become better understood, goals have shifted from solely preventing erosion to achieving sustainable agricultural productivity by balancing the trade-offs associated with agricultural production and other potential ecosystem services. Expansion of our scientific understanding of agroecological systems has contributed to a broadening of USDA conservation policy objectives and development of more sophisticated conservation planning, practice design, and implementation. These more holistic conservation goals and management approaches enable NRCS to work with farmers and ranchers to plan, select, and apply conservation practices that best allow and support their continuous long-term operations to produce food, forage, feed, and fiber while conserving the Nation’s soil and water resources.
iv
Effects of Conservation Practice Adoption on Cultivated Cropland Acres in Western Lake Erie Basin, 2003-06 and 2012
Contents Page Key Findings ................................................................................................................................................................... vi
Executive Summary ....................................................................................................................................................... vii
Chapter 1: Sampling and Modeling Approach ........................................................................................................... 1 Scope of Study .......................................................................................................................................................... 1 The NRI-CEAP Cropland Farmer Survey ................................................................................................................ 2 Sampling and Modeling Approach ........................................................................................................................... 2 Reporting Scale ......................................................................................................................................................... 3 Modeling Changes, Issues, and Assumptions ........................................................................................................... 4 Simulating the Effects of Weather ............................................................................................................................ 5
Chapter 2: Evaluation of Changes in Conservation Practice Use—2003-06 and 2012 ............................................ 7 Conservation Practice Use: Historical Context ......................................................................................................... 7 Conservation Practice Use: Strategies ...................................................................................................................... 7 Structural Conservation Practices ............................................................................................................................. 8 Structural Conservation Practices: Analyses ............................................................................................................ 9 Annual Practices: Cover Crops ................................................................................................................................. 11 Annual Practices: Residue and Tillage Management................................................................................................ 11 Residue and Tillage Management Practices: Analyses ............................................................................................. 12 Sediment Management Levels .................................................................................................................................. 13 Annual Practices: Nutrient Management .................................................................................................................. 14 Nutrient Management Practices—Results ................................................................................................................ 15 Comprehensive Nutrient Application Management Assessment .............................................................................. 19 Nutrient Application Management Levels ................................................................................................................ 20 Soil Testing ............................................................................................................................................................... 21 Advanced Technologies in Precision Agriculture..................................................................................................... 22
Chapter 3: Edge-of-Field Effects of Conservation Practices ..................................................................................... 25 The Field-Level Cropland Model—APEX ............................................................................................................... 25 Effects of Practices on Fate and Transport of Water ................................................................................................ 26 Effects of Conservation Practices on Water Erosion and Sediment Loss ................................................................. 27 Effects of Conservation Practices on Soil Organic Carbon ...................................................................................... 32 Effects of Conservation Practices on Nitrogen Loss................................................................................................. 37 Comprehensive Nitrogen Application Management: Nitrogen Loss Solutions ........................................................ 43 Effects of Conservation Practices on Phosphorus Loss ............................................................................................ 44 Comprehensive Phosphorus Application Management: Phosphorus Loss Solutions ............................................... 51
Chapter 4: Assessment of Conservation Treatment Needs ........................................................................................ 54 Regional Resource Concerns and Resource Loss Pathways ..................................................................................... 55 Acres With Losses Exceeding Threshold ................................................................................................................. 61 Acres Meeting Regional Resource Concerns ............................................................................................................ 63
Chapter 5: Exploring Conservation Solutions............................................................................................................. 67 Strategy, Simulation, Set-up, and Definitions ............................................................................................................ 68 Strategy Simulation Results ....................................................................................................................................... 69 Intra-annual Implications of Conservation Strategies ................................................................................................ 75 Conservation Solutions in Context ............................................................................................................................. 77
References ....................................................................................................................................................................... 81
Appendix A: Margin of Error for Selected Estimates of Acres and Edge-of-Field Impacts ................................... 83
Appendix B: The No-Practice Scenario ....................................................................................................................... 98

v
Appendix C: Criteria and Scoring for Treatment Levels ...........................................................................................103
Appendix D: Nutrient Management, Nitrogen and Phosphorus Scoring Method ...................................................105
Appendix E: Criteria for Four Classes of Soil Runoff Potential................................................................................107
Appendix F: Criteria for Four Classes of Soil Leaching Potential ............................................................................108
Appendix G: Rules for Applying Practices in Alternative Conservation Strategies ................................................109 Documentation Reports A series of documentation reports and associated publications by members of the modeling team and CEAP-Croplands component are available on the CEAP website at http://www.nrcs.usda.gov/technical/nri/ceap.
vi
Effects of Conservation Practice Adoption on Cultivated Cropland Acres in Western Lake Erie Basin, 2003-06 and 2012 Key Findings Farmers maintained conservation practices, cropland acreage, and crop mixes despite higher commodity prices. Between the 2003-06 and the 2012 CEAP surveys, average corn prices nearly tripled, rising to $6.67 per bushel, and average soybean prices nearly doubled, rising to $13.24 per bushel. Despite these increases, cultivated cropland acreage and crop mixes did not change significantly between the two surveys. Average annual phosphorus application rates decreased from 21.5 pounds per acre in 2003-06 to 18.7 pounds in 2012. In addition, application methods that reduce the risk of phosphorus runoff and leaching losses increased from being in use on 45 percent of acres to being in use on 60 percent of acres, and edge-of-field trapping practices that reduce runoff losses, such as filter strips, increased from being in use on 18 percent of acres to being in use on 31 percent of acres. The cost of conservation practices in place represents a significant annual investment. Using NRCS conservation practice cost data, the costs of reported conservation practices were estimated for recognized NRCS practices, regardless of whether the practice was funded through federal or state programs, through local initiatives, or by producers. Practices reported in the CEAP-1 survey (2003-06), represented a $208 million annual investment in conservation; an average of 1.8 practices were applied per acre, at an average annual cost of $43.39 per acre. The 2012 CEAP survey indicates the regional investment in conservation increased by nearly $69 million since the CEAP-1 survey, to a total annual investment of $277 million. The average number of practices adopted per acre increased to 2.36, with an annual investment of $56.98 per acre. Voluntary conservation is making significant headway in reducing nutrient and sediment losses from farm fields. Compared to a scenario simulating the removal of all conservation practices in WLEB, conservation practices in use in 2012 reduce annual sediment losses by 81 percent (9.1 million tons per year), reduce total nitrogen losses by 36 percent (40.6 million pounds per year), and reduce total phosphorus losses by 75 percent (11.4 million pounds per year). In the 2012 conservation condition, harvested crops remove an average of 16.3 pounds of phosphorus per acre per year, which is 87 percent of the average phosphorus applied per acre annually (18.7 pounds). Simulations suggest average annual total phosphorus loss is 1.9 pounds per acre with 1.3 pounds lost via subsurface pathways, primarily tile drainage; 0.5 pounds of phosphorus remain on the field as legacy phosphorus, which may reside in the soil for years, be used by a following crop, or eventually be lost from the field. In the 2012 survey, farmers report phosphorus application rates at or below crop removal rates on 58 percent of acres, indicating some level of phosphorus mining of the in-field legacy load. No single conservation solution will meet the needs of each field and farm. Western Lake Erie Basin croplands are diverse in terms of soils, farm fields, farming operations, and management, which creates differences in conservation needs and potential solutions. Soils that make up small portions of fields can be significant sources of nutrient and sediment loss, especially when their loss vulnerabilities differ from the vulnerabilities of the soils that make up the majority of the field. Comprehensive field-scale conservation planning and conservation systems are needed to accommodate different treatment needs within and across farm fields, while maintaining productivity. Additional progress in nutrient and erosion control will depend on advanced precision technologies. Nutrient and erosion control needs vary across cropped fields, requiring management of unique zones or soils within field boundaries. Precision agriculture techniques that involve potential yield effects, zoned or gridded soil testing, and variable fertilizer rates can help achieve additional nitrogen and phosphorus loss reduction. Producers can use these technologies to identify low yielding or highly vulnerable portions of fields that may benefit from more intensive management or alternative uses.
vii
Effects of Conservation Practice Adoption on Cultivated Cropland Acres in Western Lake Erie Basin, 2003-06 and 2012
Executive Summary
The 2012 CEAP survey in the Western Lake Erie Basin (WLEB) enables analyses of agricultural and conservation changes that occurred since the 2003-06 CEAP survey (CEAP-1). This report evaluates those changes and their effects on conservation concerns in WLEB. While the 2012 survey period covered in this CEAP special study reflects conservation actions at the time of the 2011 record algal bloom in Lake Erie, it does not capture producer response to the heightened regional awareness triggered by the bloom. This report also presents outcomes of alternative conservation solutions modeled to assess their potential to address the conservation treatment needs of the variable cropland soils and soil conditions in the region. Particular attention is paid to phosphorus loss dynamics. The impacts of nutrient and sediment legacy loads must be recognized when assessing agricultural conservation progress in WLEB. Legacy loads and their effects on water quality response to conservation actions are well documented (Meals et al. 2010; McDowell et al. 2002; Kleinman et al. 2011b; Sharpley et al. 2013; Chen et al. 2014), but the magnitude and process dynamics of the legacy loads in WLEB are not well understood. Consequently, analyses presented here represent the impacts of the live load and the in-field legacy load that accumulates during the simulation. Both loads are the result of current agricultural and conservation practices and their effects on potential material losses from farm fields. This report provides information on loss dynamics at the edge of the field and does not include legacy and associated lag-time dynamics due to past land management. The 2012 conservation condition. This report examines the impacts of conservation practice adoption on five major resource concerns that impact soil health and off-site water quality in WLEB: sediment loss, soil organic carbon change, subsurface nitrogen loss, total phosphorus loss, and soluble phosphorus loss. These analyses indicate that in the 2012 conservation condition:
• Ninety-nine percent of cropland acres are managed with at least one conservation practice, but there is still opportunity to improve conservation management across the basin through the use of complementary practices and comprehensive conservation planning.
• Thirty-five percent of cropland acres have conservation practices in place that adequately address all five resource concerns, and 59 percent of cropland acres have practices that adequately address at least four resource concerns.
• Ninety-six percent of cropland acres are adequately managed to prevent average annual sediment losses of more than 2 tons per acre.
• Seventy percent or more of nitrogen applied is removed by crop harvest on nearly 95 percent of cropland acres. • Fifty-eight percent of cropland acres are managed with phosphorus application rates at or below crop removal rates. • Forty-two percent of cropland acres are the source of 78 percent of total annual phosphorus losses and 80 percent of total
annual sediment losses. • Winter application rates were unchanged and remained low, with 13 percent of total phosphorus applied between November
and February. • More than 8.9 million gallons of diesel fuel consumption equivalents were saved from conservation tillage adoption,
translating to a reduction of over 99,500 tons of CO2 emissions. These highlights demonstrate that most cropland acres in Western Lake Erie Basin have conservation practices in place, while a fraction of the cropland soils are in need of additional conservation treatments to address regional concerns. However, vulnerable soils are not located in large, homogenous tracts, but rather are embedded in fields of other, less vulnerable soil types. Comprehensive conservation planning and application of appropriate conservation systems on nearly all acres will help producers identify and treat vulnerable in-field soils to further reduce sediment, phosphorus, and nitrogen losses. Assessment of changes in conservation adoption. This CEAP-Cropland special study was designed to assess the 2012 conservation condition and identify changes in agricultural and conservation practices since the CEAP-1 farmer survey (2003-06). Analyses of the two farmer surveys and associated modeling simulations revealed the following, when comparing the 2012 conservation condition with the 2003-06 conservation condition:
• Cropping systems, cropped acres, tillage management practices, and cropping intensity did not change. • In the 2012 conservation condition, fewer than 6 percent of acres were managed with cover crops. • Cropland acres managed with one or more structural practice controlling erosion increased from 34 to 54 percent of acres.
viii
• Cropland acres managed with an edge-of-field trapping practice, such as a filter or buffer, increased from 18 to 31 percent of acres.
• Nitrogen and phosphorus application methods improved. Acres on which all nutrient applications were incorporated in some manner (knifed, injected, tilled, or banded) increased. The percent of cropped acres on which nitrogen was incorporated at every application increased from 29 to 43 percent and on which phosphorus was incorporated at every application increased from 45 to 60 percent.
• Management of nitrogen and phosphorus application rate to crop removal ratios did not change. • Management of nitrogen and phosphorus application timing did not change. • The percent of acres managed with moderately high or high levels of nutrient application management did not change. In the
2012 conservation condition, 34 and 78 percent of cropland acres were managed at moderately high and high levels for phosphorus and nitrogen, respectively.
• No statistically significant change occurred in the use of soil testing. About 71 percent of acres had a soil test within the last 5 years in the 2012 conservation condition.
• Use of precision agriculture techniques increased. Acres on which GPS was used to map soil properties increased from 8 percent to 36 percent of cropland acres. The use of variable rate technology increased from 4 to 14 percent of cropland acres.
Conservation practice adoption in WLEB was largely maintained between the two surveys, while management that did change moved in a positive direction. Since CEAP-1, there have been no negative changes in agricultural management and conservation practice use by farmers in Western Lake Erie Basin. The significant changes in management and conservation practice adoption that occurred between the two survey periods resulted in the following environmental gains when comparing the 2012 conservation condition with the 2003-06 conservation condition:
• Average sheet and rill erosion decreased from 1.3 to 0.8 tons per acre per year. • Average sediment lost at the edge of the field decreased from 1.1 to 0.5 tons per acre per year, largely due to the increased
adoption of edge-of-field trapping practices. • Average phosphorus application rates declined, with average annual application rates decreasing by nearly 2.7 pounds per
acre, declining from 21.5 to 18.7 pounds per acre per year. Crop removal rates remained constant, at 16.4 and 16.3 pounds of phosphorus per acre per year removed by harvest.
• Average total phosphorus loss declined from 2.3 to 1.9 pounds per acre per year. The decrease was driven by a reduction in surface losses, which correlates with the reduction in sediment losses. Soluble phosphorus losses remained the same, at 1.3 pounds per acre annually delivered past the edge of the field.
• Average nitrogen losses to surface flows decreased from 7.1 to 4.6 pounds per acre per year, although nitrogen inputs and subsurface losses did not change significantly, nor did nitrogen removed by crops at harvest.
The surface runoff control and trapping structural practices adopted between 2003-06 and 2012 provided significant reductions in the long-term average runoff losses of sediment, nitrogen, and phosphorus. However, subsurface losses of the more reactive soluble phosphorus and nitrogen did not decline and represent the primary conservation treatment need in WLEB. Conservation Treatment Needs and Solutions. Remaining treatment needs for each conservation concern were assessed by comparing simulated average per-acre losses in the 2012 conservation condition with loss thresholds established for these analyses. These thresholds provide a metric for comparison and do not represent current policy or suggest anticipated ecological impacts. Acres on which average annual losses for all five resource concerns (sediment loss, soil organic carbon change, subsurface nitrogen loss, total phosphorus loss, and soluble phosphorus loss) are maintained below the thresholds are considered to have adequate treatment in place. The following are the key points from these analyses:
• Management in place on 35 percent of cropland acres keeps average annual losses below the loss thresholds for all five resource concerns; management on an additional 24 percent of acres achieves loss rates below the thresholds for four resource concerns.
• Soluble phosphorus loss is the greatest treatment need in WLEB, with 42 percent of acres exceeding an average annual loss threshold of 1 pound per acre per year. The majority of soluble phosphorus losses occur through the subsurface pathway.
• Subsurface nitrogen loss is the second greatest treatment need, with 29 percent of acres exceeding the 25-pound-per-acre average annual threshold.
• Management on 20 percent of acres achieves loss rates below the loss thresholds for two or fewer resource concerns. These 20 percent of acres account for 65 percent of total sediment loss, 30 percent of total nitrogen losses, and 45 percent of total phosphorus losses from cropland acres in the 2012 conservation condition.
• Acres on which loss rates are lower than the loss thresholds for all five resource concerns have considerably lower per-acre losses than do acres with management that achieves loss rates below loss thresholds for only two concerns, including 86
ix
percent lower average annual sediment losses, 58 percent lower annual total nitrogen losses, and 77 percent lower total phosphorus losses.
• Acres needing treatment very rarely exist in isolation within single fields. Comprehensive conservation planning considers the soils within the field and develops targeted solutions to meet the needs of each soil. Precision techniques for assessment of needs and variable rate application will likely contribute to the conservation solution in this region.
The alternative conservation management solutions simulated in these analyses were developed with input from local conservationists, researchers, crop consultants, farm groups, and government and non-government organizations in Western Lake Erie Basin. Single-approach strategies included the simulation of the addition of erosion control practices, nutrient management practices, tillage, cover crops, or drainage water management. Simulated multiple-approach strategies applied various combinations of the single-approach strategies to all appropriate acres. Simulated strategies were evaluated for their effects on both yields and edge-of-field losses of sediment, nitrogen, and phosphorus. The findings support the need for individualized, comprehensive conservation planning that addresses the variability within fields. Results demonstrate that there is no “one-size-fits-all” conservation solution, even within an individual field. The conservation strategies demonstrate that careful, comprehensive conservation planning is needed on every cropland acre in WLEB if vulnerable soils are to be appropriately treated. No simulated solution was the optimal solution for every acre and every resource concern. Tradeoffs in terms of nutrient loss reduction and yield sustainability varied by conservation solution. Exploration of the impacts of conservation solutions, relative to the 2012 conservation condition, demonstrate:
• A simulated solution that incorporates improved nutrient management, erosion control, and cover crop adoption reduces nitrogen losses on 97 percent of acres and phosphorus losses on 95 percent of acres, but decreases corn yields and soybean yields on 45 and 63 percent of acres, respectively. This strategy reduces total phosphorus losses by 43 percent when applied to all acres and soluble phosphorus losses by 27 percent when applied to all acres.
• Simulations including cover crop adoption demonstrate the need for close monitoring of soil phosphorus, because crop yields decline once excess phosphorus is mined from soil. Soil testing can be used to prevent yield losses, and farmers and conservationists must keep in mind that cover crops provide additional soil health and carryover nitrogen-reduction benefits.
• Increased conventional tillage tends to increase sediment losses and reallocate phosphorus from soluble losses to sediment- attached losses. In cases where conventional, more intense tillage is added, total phosphorus losses increase while soluble losses are minimally impacted. If tillage is deemed necessary due to significant phosphorus stratification, it should be accompanied by crop cover adoption, preferably with additional runoff control and trapping measures.
1
Chapter 1 Sampling and Modeling Approach Scope of Study This study provides a regional, watershed-scale evaluation of farm management and conservation practice adoption in Western Lake Erie Basin (WLEB) in 2003-06 and 2012. Process-based models are used to estimate the potential regional effects of these practices on water, sediment, soil carbon, nitrogen, and phosphorus dynamics at the edge-of-field scale. Specifically, this report compares agricultural management in use in 2003-06 to that in use in 2012. It does so by: • Evaluating and comparing the extent of conservation
practice adoption in WLEB in 2003-06 and 2012, • Estimating and comparing average edge-of-field impacts
of conservation practices in use in 2003-06 and 2012, • Estimating conservation treatment needs on cultivated
cropland acres in WLEB under the management and conservation conditions in 2003-06 and 2012, and
• Exploring impacts of hypothetical conservation treatment strategies through simulation of various conservation practice adoption scenarios.
All differences between the simulations can be attributed to differences in agricultural management and conservation treatment reported for the two sampling periods. Although the exact points simulated, including their associated weather, soils, reported management, and conservation treatments applied, differed between the two sampling periods, the point selection in both sampling periods was designed to be representative of agricultural management in WLEB. Therefore, the simulations capture the impacts of the agricultural management in use during the two sample periods. These analyses are not restricted to federal conservation practices or programs. This study quantifies and compares the anticipated average annual impacts of long-term adoption of conservation practices reported to be in place in 2003-06 with those in place in 2012, regardless of how, when, or why the practices came to be in use. Practices considered here include those adopted by farmers on their own, as well as practices that are the result of federal, state, or local programs or initiatives. This report is not and should not be considered an evaluation of federal conservation programs. This report estimates the average annual edge-of-field impacts anticipated from long-term adoption of conservation practices and agricultural management in place on cultivated cropland acres in 2003-06 and 2012. These simulations are not intended to provide information on conservation or management practices on lands other than cultivated croplands. These simulations are not intended to forecast future climate, future technology development, or future conservation impacts by the agricultural or other sectors of society. Instead, the simulation approach represents average annual outcomes that may be expected once the reported management practices take
full effect, assuming current technology and current and recent weather patterns. This is not a long-term trend analysis of practice impacts. This report provides focused analyses of anticipated average annual edge-of-field conservation benefits that will be provided by conservation practices in use on cropped acres in WLEB over the long-term. Edge-of-field impacts do not translate directly into comparable and immediate benefits to streams, rivers, creeks, lakes, or groundwater. However, the conservation practices adopted across WLEB and simulated here do lower nitrogen, phosphorus, and sediment losses from farmed fields, providing conservation benefits to streams and rivers that flow into Lake Erie and contributing to an improvement of the ecological health of the region. It is beyond the scope of this report to provide analyses of the impacts of agricultural management and conservation on instream water quality, instream water quantity, or delivery to Lake Erie. The instream and basin delivery scale impacts will be addressed in a subsequent report utilizing these results and the Soil and Water Assessment Tool (SWAT; Arnold et al. 1999). The closing chapter of this report explores potential edge-of-field impacts of various conservation strategies (chapter 5). A subsequent publication will explore the use of an optimization approach to identify the potential of various conservation practice adoption strategies to achieve natural resource conservation goals. This subsequent publication will also consider more specific economic aspects of natural resource management in WLEB, including estimation of benefits associated with various investment strategies and increments of investment in conservation on cropped acres in the region. Edge-of-field or instream monitoring measurements taken today reflect the legacy of prior management, which may mask the benefits of conservation practices in use today. In-stream measurements include a mixture of nutrients from natural sources and agricultural nutrients from various years of application, which means they measure both “live” and “legacy” loads (Meals et al. 2010). For this reason, simulated water, sediment, and nutrient dynamics may not match observed values in specific years, as it often takes time for conservation practices to produce measureable impacts. Lag-times and legacy loads contribute to the time it takes for agricultural conservation practices to provide measureable positive benefits to the environment. Lag-times between the establishment of mitigating conservation practices and measureable impacts on water quality are well documented. Principle components of lag-time include (1) the time needed for an adopted practice to produce an intended impact, (2) the time needed for that impact to reach the water body for which it was intended, and (3) the time needed for the water body to respond in a measureable way (Meals et al. 2010). Legacy load impacts on sediment and nutrient dynamics are a primary reason that the evaluation of conservation practice success and identification of remaining challenges in
2
watershed management cannot be regarded as solely reflective of today’s management (Meals et al. 2010; Sharpley et al. 2013). Soils, subsoils, macropores, and preferential flow pathways within farm fields may serve as sediment and nutrient sinks and sources, especially for phosphorus (Tomer et al. 2010; Jarvie et al. 2013; Sebilo et al. 2013; Sharpley et al. 2013; Liu et al. 2014; Andersson et al. 2015). When sediment and nutrients settle out of flowing water, they become a part of a sink, or legacy load, the dynamics of which can impact edge-of-field measurements for a long time. These nutrients and sediment may settle into pore spaces in the soil matrix of the field, or be deposited in ditches or flow pathways on the field. Resuspension and redistribution may occur days, years, or decades later, contributing to a lag-time before conservation benefits are discernable (McDowell et al. 2002; Kleinman et al. 2011b; Sharpley et al. 2013; Chen et al. 2014). Edge-of-field simulation results reported here do not account for lag-times or legacy-load dynamics or impacts due to past management. This is an assessment of the average nutrient and sediment dynamics that can be expected over the long-term under the management reported to be in use during each of the survey periods (2003-06 and 2012). Simulations presented here reflect the long-term impacts of the “live” load, based on nutrients applied during the 52-year simulation period and their interaction with reported management systems. The NRI-CEAP Cropland Farmer Survey Acreage estimates used in this report are derived from the 2003 National Resources Inventory (NRI) for simulation of the 2003-06 condition and from the 2010 NRI for simulation of the 2012 condition (appendix A.1). The 2003 and 2010 NRIs indicate that, respectively, 63 and 64 percent of WLEB (4.80 and 4.86 million acres) was managed as cultivated cropland, a difference of 1 percent, and within the margins of error for both surveys. The final CEAP sample points for each survey period were constructed by pooling the set of usable, completed surveys within each survey period. For purposes of this report, cropped acres include land in row crops or close-grown crops, and hay and pasture grown in rotation with row crops and close-grown crops. Cultivated cropland does not include land that has been in perennial hay, pasture, or horticulture for 3 or more years without inclusion of an annual crop in the rotation. This report does not consider changes in impacts of any land use other than cultivated cropland between the two sampling dates. Cropland was managed in much the same way in both survey periods (table 1.1; appendix A.1). Conservation conditions simulated in this report are based on NRI-CEAP-Cropland farmer surveys administered by the USDA National Agricultural Statistics Service (NASS) in 2003-06 and again in 2012. Data from the CEAP-1 492 1 Both surveys, the enumerator instructions, and other documentation are at http://www.nrcs.usda.gov/wps/portal/nrcs/detail/national/technical/nra/ceap/?cid=nrcs143_014163
sample points collected in 2003-06 provide data for the 2003-06 conservation condition against which to compare analyses of the 1,019 sample points collected in 2012, which represent the 2012 conservation condition.1 Sixty-eight percent of the points visited in 2003-06 were resampled in 2012. Farmer participation was voluntary, and the information gathered is confidential. The survey content was specifically designed to provide information on farming activities for use with a physical process-based model to enable estimation of edge-of-field effects of conservation practices. Relevant to this report, the NRI-CEAP-Cropland farmer survey obtained the following management information for the survey year and the 2 years prior to the survey year:
• crops grown, including double crops and cover crops;
• crop rotation plan;
• application of commercial fertilizers (source, method, rate, and timing);
• application of manure (source and type, nutrient content, consistency, method, rate, and timing);
• irrigation practices (system type, amount, and frequency); and
• timing and equipment used for all field operations (tillage, planting, cultivation, and harvesting).
Additional survey information included:
• most recent soil nutrient test;
• conservation practices associated with the field;
• field characteristics, such as proximity to a water body or wetland and presence of tile or surface drainage systems; and
• general characteristics of the operator and the operation.
In a separate and complementary survey, NRCS field offices provided information on the practices specified in conservation plans for the farm field associated with each sampled point, when applicable. Sampling and Modeling Approach The CEAP-Cropland sampling and modeling approach captures the diversity of land use, soils, climate, and topography; accounts for site-specific farming activities; estimates the loss of materials at the edge-of-field scale, where the science is most developed; and provides a statistical basis for aggregating edge-of-field results to the regional level. The following methods were used:
• 492 National Resources Inventory (NRI) points drawn from the 2003 NRI were sampled in WLEB in 2003-06; these were a subset of the national CEAP sample points that informed the original (henceforth CEAP-1)
3
USDA NRCS CEAP-Cropland National Assessment of the Great Lakes region (USDA NRCS 2011);2
• 1,019 NRI points drawn from the 2010 NRI were sampled in WLEB in 2012;
• The NRI sample design ensures that points drawn for each CEAP-Cropland survey provide a statistical sample representing the diversity of soils and other conditions for cropped acres in WLEB. All NRI sample points are linked to NRCS soil survey databases and climate databases used in these analyses;
• Cropped acre estimates for points sampled in 2003-06 are based on acreage weights derived from the 2003 NRI; cropped acre estimates for points sampled in 2012 are based on acreage weights from the 2010 NRI;
• During both sampling periods the NRI-CEAP-Cropland farmer survey was conducted at the NRI sample points to collect detailed information on farming and conservation practices in use at the points; and
• The field-level effects of the crop management and conservation practices were estimated with a field-scale physical process model—the Agricultural Policy/Environmental eXtender (APEX)—which simulates day-to-day farming activities, wind and water erosion, loss or gain of soil organic carbon, and edge-of-field losses of water, soil, and nutrients.
The modeling strategy for comparing the long-term effects of conservation practices in use during the 2003-06 and 2012 sampling periods consists of simulation of three conservation conditions:
1. The 2003-06 conservation condition is based on model simulations that account for cropping patterns, farming activities, and conservation practices as reported in the 2003-06 NRI-CEAP-Cropland farmer survey and other sources;
2. The 2012 conservation condition is based on model simulations that account for cropping patterns, farming activities, and conservation practices as reported in the 2012 NRI-CEAP-Cropland farmer survey and other sources; and
3. The no-practice condition is based on model simulations that remove all conservation practices reported to be in use on the 2003-06 sample points. Soils, weather, crop rotations, and other model inputs (with the exception of those related to conservation practices) and model parameters are held the same as for the 2003-06 conservation condition.
The no-practice condition provides perspective on the benefits of conservation practices on cultivated cropland and the loads that would leave the edge of the field if no agricultural conservation practices were adopted in WLEB, or if practices in use during the survey periods were abandoned. 2 Information about the CEAP sample design is in “NRI-CEAP Cropland Survey Design and Statistical Documentation,” available at http://www.nrcs.usda.gov/technical/nri/ceap.
Simulations of both the 2003-06 and 2012 conservation conditions rely heavily on four sources of conservation practice information:
1. NRI-CEAP-Cropland farmer surveys, administered by NASS;
2. National Resources Inventory (NRI) data; 3. Conservation plans on file at NRCS field offices; and 4. Reports on Conservation Reserve Enhancement
Program (CREP) and Continuous Conservation Reserve Program (CCRP) practices from USDA FSA offices.
Reporting Scale In each sampling period a representative set of sample points was drawn from the NRI data, and NRI-CEAP-Cropland farmer surveys were conducted to determine management at these points. The 2003-06 national CEAP-Cropland sample that informed the CEAP-1 USDA NRCS CEAP-Cropland National Assessment of the Great Lakes region (USDA NRCS 2011) was designed for reporting results at the 4-digit hydrologic unit code (HUC) scale. The 492 points sampled in WLEB during the 2003-06 sampling period (USDA NRCS 2011) were a subset of the national CEAP-Cropland sample (CEAP-1). Data collection during this period was necessarily a multiyear effort due to the large number of sample points surveyed nationally. In the fall of 2012, WLEB was specifically targeted for resampling as a CEAP-Cropland special study. The 2012 special study effort included an increased number of sampling points in an attempt to collect enough data to allow analyses at a spatial resolution finer than the 4-digit HUC reporting basis of the CEAP-1 USDA NRCS CEAP-Cropland National Assessment of the Great Lakes region (USDA NRCS 2011). The 1,019 points representing WLEB during the 2012 survey were sampled in a single year. Statistical analyses revealed that the increased sampling intensity did not allow further spatial down-scaling of results. The sample size and statistical design restricts reliable and defensible reporting of results to the 4-digit HUC scale. Federal restrictions on the burden to the public imposed by surveys and costs to administer surveys limit the ability of CEAP-Cropland analyses to provide comprehensive and statistically valid estimates at scales below the 4-digit HUC. However, the increased sampling in 2012 does improve statistical confidence in the HUC-4-scale results.
4
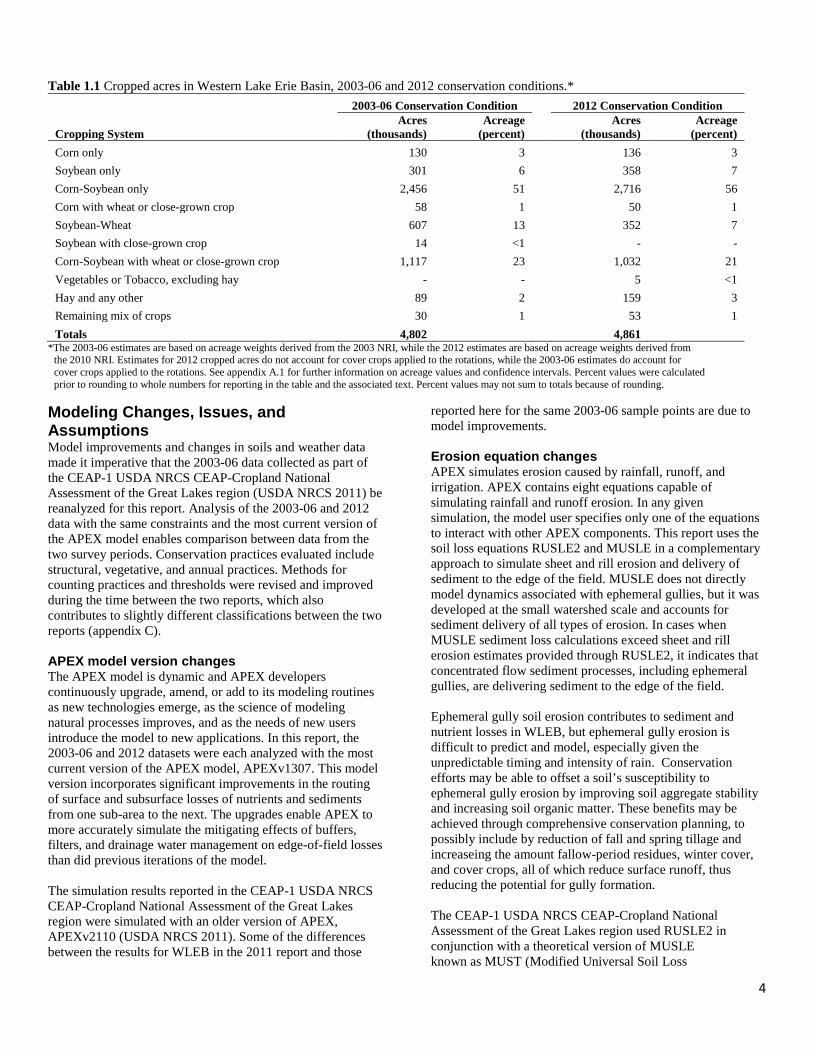
Table 1.1 Cropped acres in Western Lake Erie Basin, 2003-06 and 2012 conservation conditions.*
Cropping System
2003-06 Conservation Condition 2012 Conservation Condition Acres
(thousands) Acreage
(percent) Acres
(thousands) Acreage
(percent) Corn only 130 3 136 3 Soybean only 301 6 358 7 Corn-Soybean only 2,456 51 2,716 56 Corn with wheat or close-grown crop 58 1 50 1 Soybean-Wheat 607 13 352 7 Soybean with close-grown crop 14 <1 - - Corn-Soybean with wheat or close-grown crop 1,117 23 1,032 21 Vegetables or Tobacco, excluding hay - - 5 <1 Hay and any other 89 2 159 3 Remaining mix of crops 30 1 53 1 Totals 4,802 4,861
*The 2003-06 estimates are based on acreage weights derived from the 2003 NRI, while the 2012 estimates are based on acreage weights derived from the 2010 NRI. Estimates for 2012 cropped acres do not account for cover crops applied to the rotations, while the 2003-06 estimates do account for cover crops applied to the rotations. See appendix A.1 for further information on acreage values and confidence intervals. Percent values were calculated prior to rounding to whole numbers for reporting in the table and the associated text. Percent values may not sum to totals because of rounding.
Modeling Changes, Issues, and Assumptions Model improvements and changes in soils and weather data made it imperative that the 2003-06 data collected as part of the CEAP-1 USDA NRCS CEAP-Cropland National Assessment of the Great Lakes region (USDA NRCS 2011) be reanalyzed for this report. Analysis of the 2003-06 and 2012 data with the same constraints and the most current version of the APEX model enables comparison between data from the two survey periods. Conservation practices evaluated include structural, vegetative, and annual practices. Methods for counting practices and thresholds were revised and improved during the time between the two reports, which also contributes to slightly different classifications between the two reports (appendix C). APEX model version changes The APEX model is dynamic and APEX developers continuously upgrade, amend, or add to its modeling routines as new technologies emerge, as the science of modeling natural processes improves, and as the needs of new users introduce the model to new applications. In this report, the 2003-06 and 2012 datasets were each analyzed with the most current version of the APEX model, APEXv1307. This model version incorporates significant improvements in the routing of surface and subsurface losses of nutrients and sediments from one sub-area to the next. The upgrades enable APEX to more accurately simulate the mitigating effects of buffers, filters, and drainage water management on edge-of-field losses than did previous iterations of the model. The simulation results reported in the CEAP-1 USDA NRCS CEAP-Cropland National Assessment of the Great Lakes region were simulated with an older version of APEX, APEXv2110 (USDA NRCS 2011). Some of the differences between the results for WLEB in the 2011 report and those
reported here for the same 2003-06 sample points are due to model improvements. Erosion equation changes APEX simulates erosion caused by rainfall, runoff, and irrigation. APEX contains eight equations capable of simulating rainfall and runoff erosion. In any given simulation, the model user specifies only one of the equations to interact with other APEX components. This report uses the soil loss equations RUSLE2 and MUSLE in a complementary approach to simulate sheet and rill erosion and delivery of sediment to the edge of the field. MUSLE does not directly model dynamics associated with ephemeral gullies, but it was developed at the small watershed scale and accounts for sediment delivery of all types of erosion. In cases when MUSLE sediment loss calculations exceed sheet and rill erosion estimates provided through RUSLE2, it indicates that concentrated flow sediment processes, including ephemeral gullies, are delivering sediment to the edge of the field. Ephemeral gully soil erosion contributes to sediment and nutrient losses in WLEB, but ephemeral gully erosion is difficult to predict and model, especially given the unpredictable timing and intensity of rain. Conservation efforts may be able to offset a soil’s susceptibility to ephemeral gully erosion by improving soil aggregate stability and increasing soil organic matter. These benefits may be achieved through comprehensive conservation planning, to possibly include by reduction of fall and spring tillage and increaseing the amount fallow-period residues, winter cover, and cover crops, all of which reduce surface runoff, thus reducing the potential for gully formation. The CEAP-1 USDA NRCS CEAP-Cropland National Assessment of the Great Lakes region used RUSLE2 in conjunction with a theoretical version of MUSLE known as MUST (Modified Universal Soil Loss
5
Equation-Theoretical) (USDA NRCS 2011). Compared to MUSLE, MUST tends to be more sensitive to lower, less-intense rainfall and runoff events, and generates higher sediment yields for these events; at the same time MUST tends to underestimate the impact of more significant precipitation events (Williams et al. 2012). Soil data changes Each NRI-CEAP point is linked to a soil map unit and the interpretive soils information contained in the National Soil Information System (NASIS). This database was designed to support NRCS conservation planning needs and provide inputs for the agency’s empirical erosion and engineering models. NASIS data was not designed to meet the needs of many of the process-based equations in the APEX model. The NASIS data for soil properties is organized in layers, which may be composed of one or more soil horizons. The surface layers have the properties of the first horizon distributed throughout the layer. Subsequent layers usually have the properties associated with the most limiting horizon within the layer distributed throughout the layer. Although useful in empirical models, this approach creates unnatural boundaries between soil layers and unrealistic depths of changes in soil qualities, which, when input into process-based models, unrealistically impact water flow, root growth, soil organic carbon, pH, and bulk density. NASIS soils data also tends to overestimate soil carbon stores since the surface carbon content is assumed to extend throughout the entire first soil layer. Further, construction of the NASIS database is land-use independent; therefore, some map unit values may not be reflective of the land uses being modeled. In the modeling process used in the CEAP-1 USDA NRCS CEAP-Cropland National Assessment of the Great Lakes region (USDA NRCS 2011), NASIS challenges were addressed by adjusting the affected model parameters and/or soil data inputs. The adjustments for the soil layer data were obtained from the national soil characterization database, which is derived from point data and organized by horizons, rather than layers. The national soil characterization database contains the core data upon which the interpretive data in NASIS is based. Adjustments applied to overcome the idiosyncrasies of the NASIS data, such as the aforementioned issue with artificial boundaries between soil layers, often disallowed process-based simulation of the effects of a limiting horizon present within a soil layer. To eliminate this problem, this and future CEAP-Cropland reports will use horizon-based data derived from the national soil characterization database or a close taxonomic representative for each map unit component. All other interpretive data elements from NASIS for key model inputs were used without modification. These include interpretations such as water table depth, flood frequency, ponding, soil albedo, and other properties used by some of the more empirical model relationships and equations in APEX. These properties are also used for categorization and data analysis.
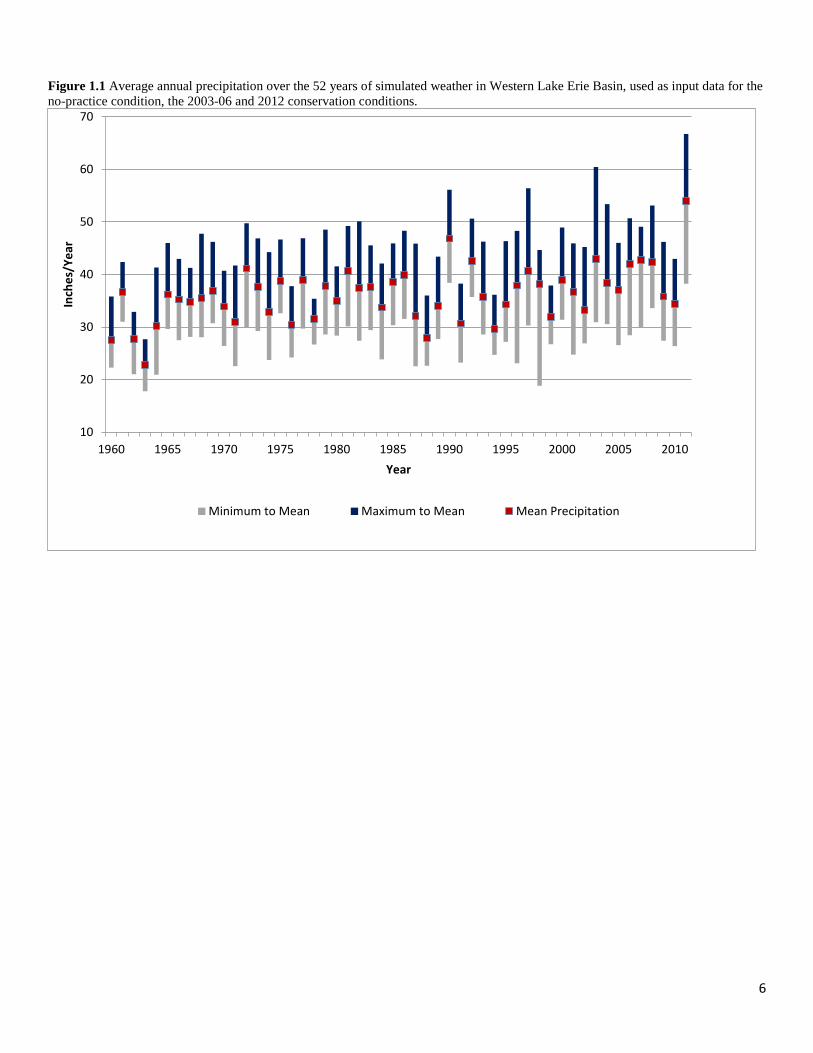
Simulating the Effects of Weather Weather is the predominant factor determining the loss of soil and nutrients from farm fields, as well as the effects of conservation practices. To capture the effects of weather, each scenario was simulated using 52 years of actual daily weather data (1960-2011), the extent of the data available from the National Climatic Data Center (NCDC) at the commencement of analyses. Simulations in this report use 5 more years of weather data than was available during the analyses conducted for the CEAP-1 USDA NRCS CEAP-Cropland National Assessment of the Great Lakes region (USDA NRCS 2011). Weather data used here includes precipitation, temperature maximums, and temperature minimums (Eischeid et al. 2000). In the CEAP-1 USDA NRCS CEAP-Cropland National Assessment of the Great Lakes region (USDA NRCS 2011), weather data inputs were derived from weather station data combined with the respective PRISM (Parameter-Elevation Regressions on Independent Slopes Model) (Daly et al. 1994) monthly map estimates to construct daily estimates of precipitation and temperature (Di Luzio et al. 2008). The PRISM system involves interpolation across weather stations, which mutes the intensity of daily precipitation events due to construction of multistation averages. In order to better represent intensities related to real weather, analyses for this report assign each sample point to a representative weather station within the 12-digit HUC in which it was located. These changes in determination of representative weather for the sampled points lead to some differences in model inputs for precipitation as compared to weather developed under the PRISM system, which causes results of these analyses to be slightly different than those of the CEAP-1 USDA NRCS CEAP-Cropland National Assessment of the Great Lakes region (USDA NRCS 2011). Average annual precipitation over the 52 years in WLEB ranged from 32.7 to 40.3 inches and averaged about 36.2 inches for cropped acres in this region. The highest rainfall year was 2011 (53.9 inches) and the driest year was 1963 (22.8 inches), with locations within the basin in those years ranging from 17.8 to 66.7 inches (fig. 1.1). Annual precipitation varied between years, varied spatially within the region, and was distributed differently throughout individual years. The use of long-term weather to inform the simulations allows these analyses to include realistic simulation of the effectiveness of conservation practices in extreme weather years, such as during floods and prolonged droughts, as captured in the natural variability inherent in the 52-year weather record. Throughout most of this report, model results are presented in terms of the 52-year model runs. Model outputs predict average impacts of cropping patterns and conservation practices reported to be in use during 2003-06 or 2012, assuming technologies do not change, conservation practices are maintained, new practices are not adopted, and weather patterns observed from 1960 to 2012 continue into the future.
6
Figure 1.1 Average annual precipitation over the 52 years of simulated weather in Western Lake Erie Basin, used as input data for the no-practice condition, the 2003-06 and 2012 conservation conditions.
10
20
30
40
50
60
70
1960 1965 1970 1975 1980 1985 1990 1995 2000 2005 2010
Inch
es/Y
ear
Year
Minimum to Mean Maximum to Mean Mean Precipitation
7
Chapter 2 Evaluation of Changes in Conservation Practice Use—2003-06 and 2012 Conservation Practice Use: Historical Context Conservation practices have long been used in Western Lake Erie Basin. In the 1950s and 1960s, scientists and the public became increasingly concerned over eutrophication and related water quality issues in the Great Lakes, and in Lake Erie in particular. The Great Lakes Water Quality Agreement (GLWQA), signed between the United States and Canada in 1972, was historic, being the first international agreement intended to protect and restore a large ecosystem shared across international borders (Tschorke 2008). The GLWQA also led to the establishment of effluent limits for municipal sewage treatment plants and determination of target load reductions; it was hypothesized that if the targets were met, eutrophication in the Great Lakes would be reduced. Beginning in the 1970s, conservation practice use began to be much more widespread in the region. In the 1980s, although there were no incentives offered to reduce fertilizer applications, farmers voluntarily began to reduce phosphorus applications. In the 1980s farmers also began to move away from managing phosphorus applications to increase soil phosphorus test levels, and instead moved towards managing phosphorus applications to maintain soil levels so they only replaced phosphorus removed by crops at harvest (Baker and Richards 2002). Between 1980 and 1995 nutrient sales declined in the Maumee and Sandusky watersheds. In Ohio, incentive-based conservation programs promoted voluntary adoption of conservation practices, including planting winter cover, adopting conservation tillage, and/or joining the Conservation Reserve Program (CRP). Reductions in
phosphorus use and adoption of conservation practices correlated with observed decreases in dissolved, total, and particulate phosphorus and sediment delivery to Lake Erie during the same time period (Sharpley et al. 2012). By 1995 conservation tillage was in use on nearly 50 percent of cultivated cropland in the Maumee and Sandusky watersheds, primarily due to inclusion of no-till soybean in rotations (Richards et al. 2002a). By 1995, 85 percent of the highly erodible land (HEL) in the Maumee River Basin and 97 percent of the HEL in the Sandusky River Basin had been treated with conservation practices (Richards et al. 2002b). In the late 1980s and early 1990s, no-till and reduced tillage systems were the dominant cropping practices in northwestern Ohio. At the same time, adoption of streamside buffer practices and the practice of setting aside HEL (i.e., not farming it) contributed to a reduction in sediment and particulate phosphorus delivery to Lake Erie (Ohio Lake Erie Phosphorus Task Force 2010). In the early 1990s county Soil Water Conservation Districts (SWCDs) in WLEB developed phosphorus reduction strategies as part of an initiative to clean up the Great Lakes. The strategies focused on reducing sediment and total phosphorus loadings. These strategies have apparently been effective at achieving their goals, but dissolved reactive phosphorus (DRP) was not a focus and was not adequately addressed by these plans. Since 1995, precipitation and discharge have both increased slightly in the region relative to earlier weather patterns. In 2000, Ohio initiated the Lake Erie Conservation Reserve Enhancement Program (CREP) as part of the USDA Conservation Reserve Program, which provides incentives to farmers to install filter strips and riparian forest buffers and to restore wetlands. The International Joint Commission suggests that improved phosphorus management, manure treatment, conservation tillage, cover crops, and wetlands are conservation practices that do or may reduce total phosphorus and/or DRP in WLEB (International Joint Commission 2014). During the 1990s, NRCS conservation efforts began to broaden from prevention of soil erosion and enhancement of production sustainability to encompass goals of reducing other environmental impacts associated with agricultural production, including reducing nutrient export from farm fields and enhancing ecosystem services associated with agroecosystems. Today traditional conservation practices used to control surface water runoff and erosion mitigate a significant portion of potential nutrient losses, especially on soils inherently vulnerable to erosion losses. Adoption of comprehensive conservation plans and improved precision farming practices enable farmers to treat soils vulnerable to leaching with leaching-specific practices and to treat soils vulnerable to runoff with erosion control practices. Regardless of inherent soil vulnerabilities, opportunities remain for more gains through increased adoption of complementary comprehensive nutrient management practices. Conservation Practice Use: Strategies The three-pronged Avoid, Control, Trap (ACT) conservation systems approach reduces nutrient and sediment losses. The
The USDA NRCS promotes adoption of comprehensive conservation plans, individually designed to address site-specific resource concerns. There are no single practice solutions capable of addressing all resource concerns. Further, sometimes positive actions taken to address one resource concern require additional complementary efforts to offset potentially negative impacts on another resource concern. It is not the intent of this report to parse or isolate the individual effects of each conservation practice. This report was designed to assess the impacts of the conservation systems in place at the time of the two surveys. Simulation modeling was applied to predict the anticipated impacts of these practices if they are maintained into the future.
8
first prong operates on the concept that land managers should Avoid increased potential for sediment and nutrient losses, through adoption of comprehensive conservation plans that include decreased tillage and targeted, more timely nutrient applications. Comprehensive nutrient management strategies achieve the avoidance component of the ACT conservation systems approach by minimizing nutrient losses to the environment while maximizing availability of nutrients for crop growth. Careful application of the 4Rs (Right Source, Right Method, Right Rate, and Right Timing of nutrient application) maximizes nutrient use efficiency in the agroecosystem, which minimizes nutrient losses from the edge of the field. Adoption of appropriate nutrient management strategies is especially important in WLEB, where dissolved nutrients are an ecological concern, because the predominant benefits of structural practices include reduced losses of sediment and sediment-bound nutrients. Structural practices, such as terraces or contouring, slow the movement of runoff and associated sediment and nutrients, thus helping to Control losses from the crop field. Concentrated flow control practices used in conjunction with overland flow control practices can significantly reduce sediment and associated nutrient losses from cultivated cropland. In particular, croplands with untreated or undertreated ephemeral gullies may suffer sediment and nutrient losses during major storm events, whereby the fields may lose both recently applied nutrients and legacy nutrients stored in the field’s soils. Complementing the Avoid and Control components of the ACT system is a third layer of conservation practices designed to Trap runoff and capture sediment and associated nutrients. Surface trapping practices include filter strips and buffers; subsurface trapping practices include drainage water management. Under certain circumstances, wetlands may be constructed or restored to trap both surface and subsurface losses. Given the long history of conservation in Western Lake Erie Basin, it is not surprising that most cropped acres in the region benefit from a conservation practice. Conservation practice adoption continues to make headway in important, measurable ways. The most striking changes in conservation practice adoption noted between the two survey periods include increases in adoption of structural practices, especially at the edge of the field, and adoption of precision agricultural practices. Structural and vegetative conservation practices (referred to as “structural practices” herein), once implemented, are usually kept in place for several years. Designed primarily for erosion control, structural practices also mitigate edge-of-field nutrient losses, providing both controlling and trapping benefits. Structural practices include:
1. In-field water erosion control practices • designed to control overland flow (terraces,
contour buffer strips, contour farming, in-field
vegetative strips, strip-cropping, and contour strip-cropping), and
• designed to control concentrated flow (grassed waterways, grade stabilization structures, diversions, and other structures for water control);
2. Edge-of-field practices designed to buffer and filter surface runoff before it leaves the field (riparian forest buffers, riparian herbaceous cover, filter strips, and field borders),
3. drainage water management practices that promote biochemical and physical processes that reduce the environmental impacts of both carryover nutrients and nutrients that leach below the root zone,
4. irrigation practices (irrigation method and irrigation water management), and
5. wind erosion control practices (windbreaks, shelterbelts, crosswind trap strips, herbaceous wind barriers, and hedgerow planting).
Annual conservation practices are an active part of the crop production system each year. These practices are designed to promote soil quality, reduce in-field erosion, and reduce the availability of sediment and nutrients for transport by wind or water. They include:
• cover crops, • residue and tillage management, and • nutrient management.
Structural Conservation Practices Data on structural practices associated with each sample point were obtained from four sources:
1. The 2003-06 and 2012 NRI-CEAP-Cropland farmer surveys, which included questions about the presence of structural practices: terraces, grassed waterways, vegetative buffers (in-field), hedgerow plantings, riparian forest buffers, riparian herbaceous buffers, windbreaks or herbaceous wind barriers, contour buffers (in-field), field borders, filter strips, critical area planting, grassed waterways, and grade stabilization structures;
2. The NRCS field offices provided data on all structural practices included in conservation plans associated with the field in which the sample point was located, if relevant;
3. The USDA Farm Service Agency (FSA) provided practice information for fields enrolled in the Continuous Conservation Reserve Program (CCRP) and Conservation Reserve Enhancement Program (CREP) for information on the adoption of the following structural practices: contour grass strips, filter strips, grassed waterways, riparian buffers (trees), and field windbreaks (Rich Iovanna, USDA FSA, personal communication, 2013); and
4. The 2003 and 2010 National Resources Inventory (NRI) provided additional information for structural practices that could be reliably identified from aerial photography as part of the NRI data collection process, for the 2003-06 and 2012 NRI points, respectively. These practices
9
include contour buffer strips, contour farming, contour strip-cropping, field strip-cropping, terraces, crosswind strip-cropping, crosswind trap strips, diversions, field borders, filter strips, grassed waterways or outlets, hedgerow planting, herbaceous wind barriers, riparian forest buffers, and windbreak or shelterbelt establishment.
The methods for identifying these practices and the modeling techniques used to simulate them improved during the interim between this and the original (henceforth CEAP-1) USDA NRCS CEAP-Cropland National Assessment of the Great Lakes region (USDA NRCS 2011). The 2003-06 and 2012 data were analyzed with these new methods in order to enable direct comparison in this report. These improvements altered practice counts in the 2003-06 data as compared to the CEAP-1 report, leading to some differences in the outcomes of this and the CEAP-1 analyses. Ninety-five percent confidence intervals (CIs) were calculated as 1.96 times the calculated standard error (SE) for each survey period. The SE was calculated with the “delete-a-group jackknife” replication procedure commonly used for variance estimation of the annual NRI survey (Kott 2001). Statistical significance between the two survey periods was determined indirectly by comparing the overlap between the two ninety-five percent CIs. Overlapping CIs were interpreted as indicating no significant difference between the two survey periods. Structural Conservation Practices: Analyses Western Lake Erie Basin cropland acres treated with one or more structural practices for water erosion control increased by over 1,030,500 acres during the interim between the two survey periods (appendix A.1). The amount of cropland in WLEB treated with at least one structural practice designed to control or trap runoff losses increased from 34 percent in 2003-06 to 55 percent in 2012 (table 2.1). WLEB cropped acres on which farmers adopted one structural practice for water erosion control increased from 25 to 40 percent of acres in 2003-06 and 2012, respectively. Acres with two or more structural practices for water erosion control increased by 6 percentage points, increasing from 9 to 15 percent of cropped acres between 2003-06 and 2012. Structural control practices can be classified by functionality, as either overland flow practices, concentrated flow practices, or edge-of-field buffering and filtering practices. During the time period between the two surveys, the use of overland flow practices and concentrated flow practices remained unchanged, while the number of acres treated with edge-of-field trapping practices increased.
Overland flow control practices are designed to slow the movement of water across the soil surface, thereby reducing both surface water runoff and sheet and rill erosion. The cropland in WLEB is not highly prone to runoff losses, so overland flow practices are not common in the region. Cropped acres treated with overland flow practices remained unchanged, at 1 percent of acres in both survey periods (table 2.2). Concentrated flow control practices are designed to prevent the development of gullies along flow paths within a field. These practices are typically installed to control both ephemeral and classic gullies and are essential for controlling damaging runoff during intense storms and high rainfall events, especially on the gently rolling and nearly level cropland typical in WLEB. Cropped acres treated with concentrated flow practices remained unchanged, at 23 and 21 percent of acres, in 2003-06 and 2012, respectively (table 2.2). Edge-of-field buffering and filtering practices are designed to capture the surface runoff losses that are not mitigated by in-field conservation practices. These practices are part of the trapping component in the ACT strategy; they slow runoff flows, allowing sediment and nutrients to settle out of the water before it enters adjacent waterways. Between 2003-06 and 2012, farmers adopted trapping practices on an additional 623,300 acres, increasing the percent of WLEB cropland acres treated by trapping practices from 18 to 31 percent of cropland acres (table 2.2). NRCS practice standards for edge-of-field mitigation include edge-of-field filter strips, riparian herbaceous buffers, and riparian forest buffers. CCREP and CREP buffer practices are also included in this category. Some conservation practices provide benefits beyond their original intentions. Two such practices are field borders and drainage water management. Field borders have multiple intended purposes; they tend to be narrower than filter strips or buffer strips and therefore provide less filtration benefits. However, when placed on the downslope edge of fields, field borders do provide some trapping benefits. When field borders are placed along open field ditches or mains and laterals of tile drainage systems, they provide some protection against ditch bank sloughing, thus reducing the potential for the loss of large slugs of sediment and associated legacy nutrients during intense storm events. Between 2003-06 and 2012, the amount of WLEB cropland acres on which field borders were applied increased from 5 to 19 percent (table 2.2).
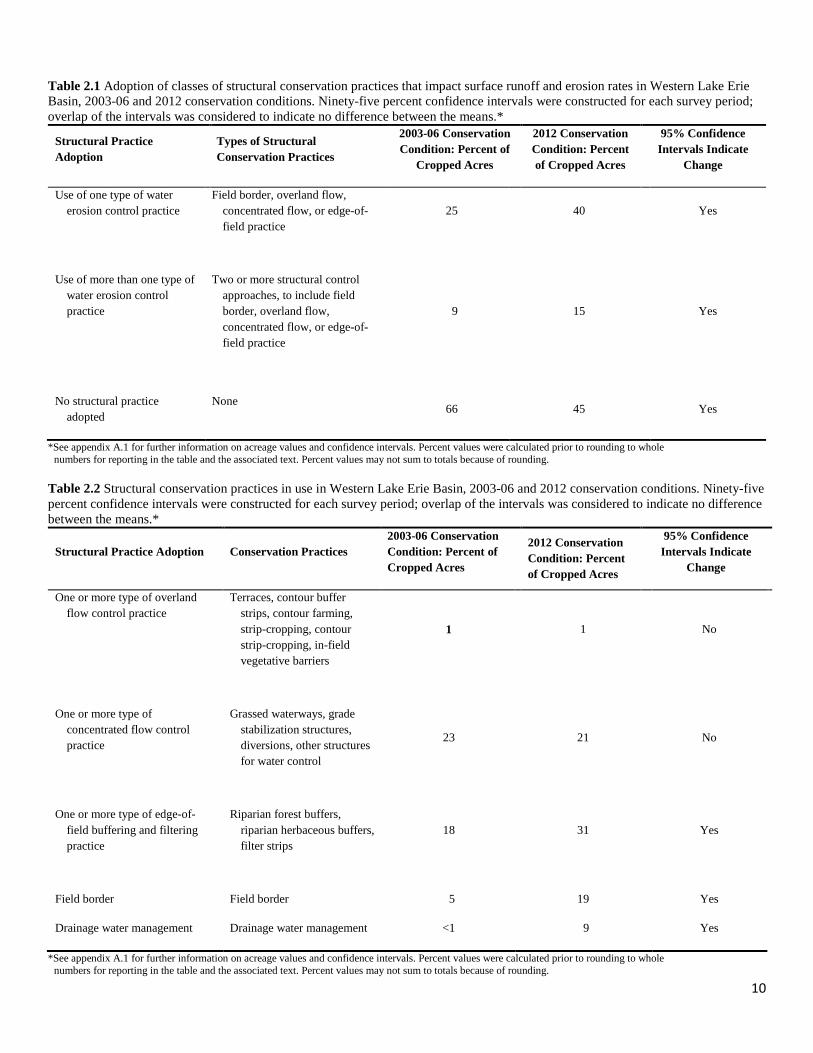
10
Table 2.1 Adoption of classes of structural conservation practices that impact surface runoff and erosion rates in Western Lake Erie Basin, 2003-06 and 2012 conservation conditions. Ninety-five percent confidence intervals were constructed for each survey period; overlap of the intervals was considered to indicate no difference between the means.*
Structural Practice Adoption
Types of Structural Conservation Practices
2003-06 Conservation Condition: Percent of
Cropped Acres
2012 Conservation Condition: Percent of Cropped Acres
95% Confidence Intervals Indicate
Change
Use of one type of water erosion control practice
Field border, overland flow, concentrated flow, or edge-of-field practice
25 40 Yes
Use of more than one type of water erosion control practice
Two or more structural control approaches, to include field border, overland flow, concentrated flow, or edge-of-field practice
9 15 Yes
No structural practice adopted
None
66
45
Yes
*See appendix A.1 for further information on acreage values and confidence intervals. Percent values were calculated prior to rounding to whole numbers for reporting in the table and the associated text. Percent values may not sum to totals because of rounding.
Table 2.2 Structural conservation practices in use in Western Lake Erie Basin, 2003-06 and 2012 conservation conditions. Ninety-five percent confidence intervals were constructed for each survey period; overlap of the intervals was considered to indicate no difference between the means.*
Structural Practice Adoption Conservation Practices 2003-06 Conservation Condition: Percent of Cropped Acres
2012 Conservation Condition: Percent of Cropped Acres
95% Confidence Intervals Indicate
Change
One or more type of overland flow control practice
Terraces, contour buffer strips, contour farming, strip-cropping, contour strip-cropping, in-field vegetative barriers
1 1 No
One or more type of concentrated flow control practice
Grassed waterways, grade stabilization structures, diversions, other structures for water control
23 21 No
One or more type of edge-of-field buffering and filtering practice
Riparian forest buffers, riparian herbaceous buffers, filter strips
18 31 Yes
Field border Field border 5 19 Yes
Drainage water management Drainage water management <1 9 Yes
*See appendix A.1 for further information on acreage values and confidence intervals. Percent values were calculated prior to rounding to whole numbers for reporting in the table and the associated text. Percent values may not sum to totals because of rounding.
11
Drainage water management (DWM) is a conservation practice designed to manage the timing and amount of water discharged from tile drainage systems. Traditionally drainage water management (DWM) has been primarily used during the non-growing season as a means to control drainage from the field and keep the soil profile saturated, which promotes denitrification (Skaggs et al. 2012). Denitrification is a natural, microbe-facilitated process by which nitrates are converted to nitrogen gas, thus decreasing the amount of nitrogen that could potentially be lost through runoff, leaching, or tile drainage. More recently DWM practices have been improved to control water tables below the root zone during the growing season in order to reduce soluble nutrient losses to leaching and tile drains. As it is currently applied, DWM provides dual benefits, improving water quality by keeping nutrients in the soil and benefiting crop production by keeping nutrients and water available for plant growth (Skaggs et al. 2010). This enhanced application of DWM is an excellent conservation practice option on the generally flat and tile drained cropland acres in WLEB, where it could complement current conservation practices and help reduce the amount of dissolved nutrients leaving farm fields through the soil profile. Between 2003-06 and 2012, acreage with DWM practices increased from less than 1 percent to 9 percent of acres (table 2.2). Annual Practices: Cover Crops Incorporation of cover crops into crop rotations may increase the multifunctionality of the land and diversify the farmer’s economic base while also conserving soil and improving soil health. However, cover crop adoption is only one part of an effective conservation management plan. Benefits of cover crops, conservation tillage, structural practices, and nutrient management strategies are often intertwined. To produce consistent and beneficial results, conservation management plans must be reevaluated and applied appropriately and consistently.
Cover crop adoption may provide numerous ecological benefits. For example, cover crops may protect soil from erosional processes; may promote soil health and water quality by reducing nutrient input requirements for crop production or by utilizing “leftover” or legacy nutrients from previous crops, making them less available to losses via erosion; and may contribute to soil quality by converting atmospheric carbon into plant tissue, which eventually becomes soil organic matter and contributes to soil carbon pools. Additionally, depending on management, cover crops may provide pollinator or wildlife benefits, including habitat and food production. Cover cropping consists of planting grass, small grains, or legumes between primary crop intervals. A cover crop is typically not harvested as a principal crop and is often terminated by tillage or herbicide application prior to maturity, though it may also be used as mulch or forage material. Some cover crops are planted for soil protection during establishment of spring crops such as melons, spinach, and potatoes. Early spring cover crop vegetation protects both the soil and young crop seedlings. Spring-planted cover crops are interseeded into a growing crop or are followed by the seeding of a summer or late fall crop that may be harvested during that same year or early the next year. Late-summer-planted cover crops are followed by the harvest of another crop in the same crop year or the next spring. Fall-planted cover crops are followed by the spring planting of a crop for harvest the next year. Local emphasis on cover crop adoption has gained momentum in WLEB in recent years. However, the fall 2012 survey occurred before the recent movement towards adoption of cover crops. Farmers shifting to annual or semiannual use of cover crops after the fall of 2011 would not have been accounted for in this survey. The surveys show that cover crops were used at least once in a 3-year rotation on 2 and 6 percent of cropped acres in WLEB in 2003-06 and 2012, respectively (table 2.3).
Table 2.3 Adoption of cover crops in Western Lake Erie Basin, 2003-06 and 2012 conservation conditions. Ninety-five percent confidence intervals were constructed for each survey period; overlap of the intervals was considered to indicate no difference between the means.*
Cover Crop Strategy 2003-06 Conservation Condition: Percent of
Cropped Acres
2012 Conservation Condition: Percent of
Cropped Acres
95% Confidence Intervals Indicate Change
Cover crop use at least 1 out of 3 years 2 6 Yes No cover crop treatment 98 94 No
*See appendix A.1 for further information on acreage values and confidence intervals. Percent values were calculated prior to rounding to whole numbers for reporting in the table and the associated text. Percent values may not sum to totals because of rounding.
Annual Practices: Residue and Tillage Management Conservation residue and tillage management practices are often used in conjunction with overland control practices or in lieu of overland control practices, especially when slopes are gentle or fields have complex contours, which make more
engineered overland flow control practices difficult to implement and maintain. In WLEB, conservation tillage is an important means by which farmers address sheet and rill erosion. Conservation tillage practices retain residue on the soil surface, which protects the soil and associated nutrients from being lost to wind and water erosion, improves
12
infiltration, increases water availability for the crops, and builds soil health. Tillage impacts conservation goals for several reasons (Reicosky 2001):
• Tillage may provide better aeration and weed control; • Tillage may increase respiration rates, contributing to
soil organic carbon loss, a decline in agroecological diversity, and a decline in density of soil organisms;
• Tillage incorporates nutrients, lessening the probability of nutrient loss through runoff pathways;
• Tillage breaks up and buries plant residues, reducing soil surface protection against erosion;
• Tillage may cause soil compaction, decreasing soil health and possibly stressing crop roots;
• Tillage operations require time and energy inputs, which increase operational costs and increase carbon dioxide emissions; and
• Periodic use of intense tillage alternated with conservation tillage can significantly reduce or eliminate the positive effects of conservation tillage.
Residue and tillage management practice simulations were based on the field operations and machinery types reported in the NRI-CEAP-Cropland farmer survey for each sample point. The Soil Tillage Intensity Rating (STIR) (USDA NRCS 2007a) was used to calculate the soil disturbance intensity for each crop grown in each of the previous 3 years of management at each sample point for each of the two NRI-CEAP-Cropland farmer survey periods (2003-06 and 2012). STIR is a function of the kinds of tillage, the frequency of tillage, and the depths of tillage. Tillage management and conservation tillage adoption was assessed on a crop-by-crop basis for each cropping system. Management of each crop was classified according to its total annual STIR. The full benefits of adopting conservation tillage are realized only with consistent use of reduced tillage for all crops in a rotation. Farmers may employ “rotational tillage,” in which one type of tillage is used on one crop, and a different intensity of tillage is used on the following crop. Use of conventional tillage on one crop in a rotation can diminish or negate many of the positive aspects associated with adoption of conservation tillage, especially no-till (Reicosky 2001). However, no-till is not the tillage solution for all crops on all acres. In particular, phosphorus application benefits from incorporation, which can generally be accomplished with some form of mulch tillage or specially developed low impact methods of incorporation. STIR classifications used in this report are more conservative than those used in the CEAP-1 USDA NRCS CEAP-Cropland National Assessment of the Great Lakes region (USDA NRCS 2011). Threshold numbers have been lowered, requiring achievement of lower STIR values. To assess conservation tillage adoption during each of the two survey periods, the following STIR classifications were developed for cultivated cropland in WLEB, based on NRCS residue and tillage management practice
standards and guidance from NRCS national Agronomist, Norm Widman (2012. personal communications): • Continuous Conventional Tillage: all crops in the
rotation are conventionally tilled (STIR >80), • Seasonal Conventional Tillage: at least one crop in the
rotation is conventionally tilled (STIR>80) and at least one crop is conservation tilled (STIR<80),
• Continuous Mulch Tillage: all crops in the rotation are produced under tillage with STIR values for each crop between 20 and 80,
• Seasonal No-till: at least one crop is produced with no-till (STIR <20) and no crop in the rotation is conventionally tilled (STIR>80), and
• Continuous No-till: all crops in rotation are produced with minimum tillage having STIR values <20.
Ninety-five percent confidence intervals (CI) were calculated as 1.96 times the calculated standard error (SE) for each survey period. The SE was calculated with the “delete-a-group jackknife” replication procedure commonly used for variance estimation of the annual NRI survey (Kott 2001). Statistical significance between the two survey periods was determined indirectly by comparing the overlap between the two ninety-five percent CIs. Overlapping CIs were interpreted as indicating no significant difference between the two survey periods. Residue and Tillage Management Practices: Analyses Conservation tillage practices, widely used in WLEB, work in conjunction with structural erosion control practices to reduce sediment and associated nutrient losses from farm fields. Tillage management did not change appreciably in Western Lake Erie Basin in the time between the two surveys (fig. 2.1; appendix A.1). Some form of conservation tillage, including mulch tillage, seasonal no-tillage, and continuous no-tillage, was used on 67 and 63 percent of cropland acreage in WLEB in 2003-06 and 2012, respectively. The survey results suggest a slight, though not statistically discernable, increase in the application of conventional tillage for one or more crops in a rotation in 2012 as compared to 2003-06. Periodic tillage may provide a means by which to address phosphorus stratification, a condition thought to be associated with increased risk of soluble phosphorus losses due to saturation (Franzluebbers 2002). It is possible that farmers in WLEB are adopting this strategy, which would increase the application of conventional tillage practices. Periodic use of tillage should be carefully considered; it may reduce losses of dissolved nutrients while increasing losses of sediment-associated nutrients through water and wind erosion. In some cases and under some nutrient management systems, it is extremely important to incorporate nutrients into the soil in order to minimize nutrients in runoff losses. When employed, tillage should be accompanied by in-field erosion control practices and edge-of-field trapping practices carefully designed to work together on a site-specific basis in a comprehensive conservation plan.
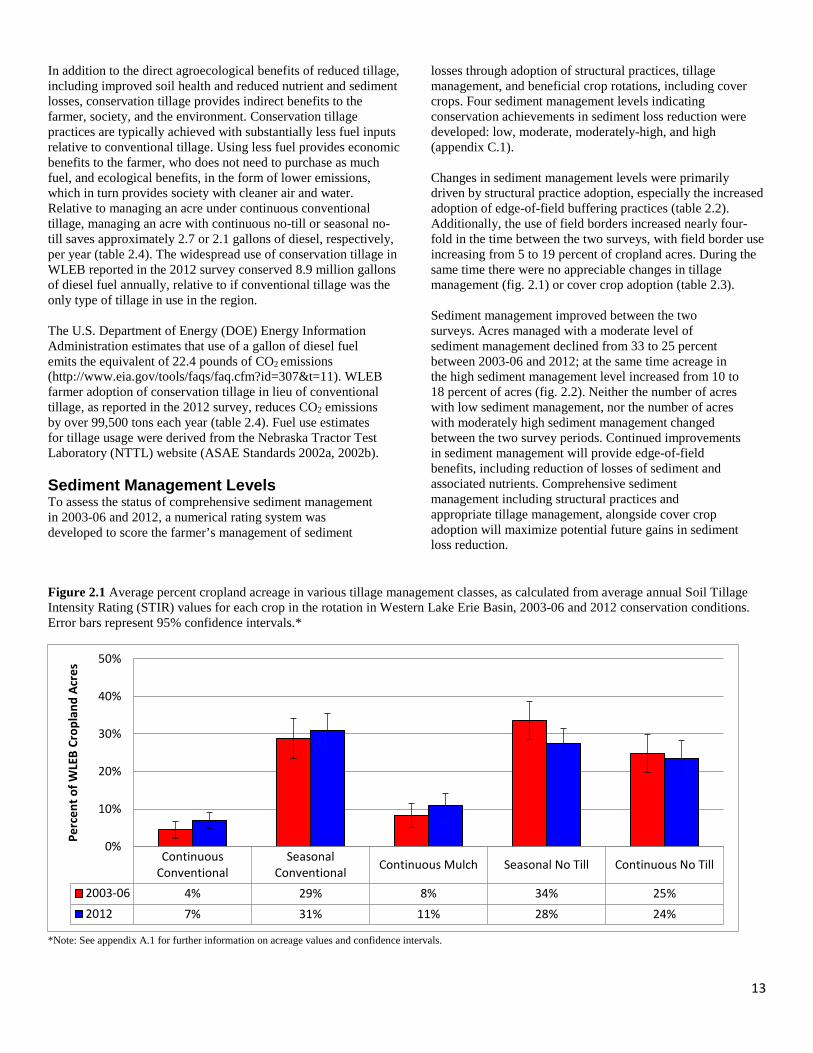
13
In addition to the direct agroecological benefits of reduced tillage, including improved soil health and reduced nutrient and sediment losses, conservation tillage provides indirect benefits to the farmer, society, and the environment. Conservation tillage practices are typically achieved with substantially less fuel inputs relative to conventional tillage. Using less fuel provides economic benefits to the farmer, who does not need to purchase as much fuel, and ecological benefits, in the form of lower emissions, which in turn provides society with cleaner air and water. Relative to managing an acre under continuous conventional tillage, managing an acre with continuous no-till or seasonal no-till saves approximately 2.7 or 2.1 gallons of diesel, respectively, per year (table 2.4). The widespread use of conservation tillage in WLEB reported in the 2012 survey conserved 8.9 million gallons of diesel fuel annually, relative to if conventional tillage was the only type of tillage in use in the region. The U.S. Department of Energy (DOE) Energy Information Administration estimates that use of a gallon of diesel fuel emits the equivalent of 22.4 pounds of CO2 emissions (http://www.eia.gov/tools/faqs/faq.cfm?id=307&t=11). WLEB farmer adoption of conservation tillage in lieu of conventional tillage, as reported in the 2012 survey, reduces CO2 emissions by over 99,500 tons each year (table 2.4). Fuel use estimates for tillage usage were derived from the Nebraska Tractor Test Laboratory (NTTL) website (ASAE Standards 2002a, 2002b). Sediment Management Levels To assess the status of comprehensive sediment management in 2003-06 and 2012, a numerical rating system was developed to score the farmer’s management of sediment
losses through adoption of structural practices, tillage management, and beneficial crop rotations, including cover crops. Four sediment management levels indicating conservation achievements in sediment loss reduction were developed: low, moderate, moderately-high, and high (appendix C.1). Changes in sediment management levels were primarily driven by structural practice adoption, especially the increased adoption of edge-of-field buffering practices (table 2.2). Additionally, the use of field borders increased nearly four-fold in the time between the two surveys, with field border use increasing from 5 to 19 percent of cropland acres. During the same time there were no appreciable changes in tillage management (fig. 2.1) or cover crop adoption (table 2.3). Sediment management improved between the two surveys. Acres managed with a moderate level of sediment management declined from 33 to 25 percent between 2003-06 and 2012; at the same time acreage in the high sediment management level increased from 10 to 18 percent of acres (fig. 2.2). Neither the number of acres with low sediment management, nor the number of acres with moderately high sediment management changed between the two survey periods. Continued improvements in sediment management will provide edge-of-field benefits, including reduction of losses of sediment and associated nutrients. Comprehensive sediment management including structural practices and appropriate tillage management, alongside cover crop adoption will maximize potential future gains in sediment loss reduction.
Figure 2.1 Average percent cropland acreage in various tillage management classes, as calculated from average annual Soil Tillage Intensity Rating (STIR) values for each crop in the rotation in Western Lake Erie Basin, 2003-06 and 2012 conservation conditions. Error bars represent 95% confidence intervals.*
*Note: See appendix A.1 for further information on acreage values and confidence intervals.
ContinuousConventional
SeasonalConventional Continuous Mulch Seasonal No Till Continuous No Till
2003-06 4% 29% 8% 34% 25%2012 7% 31% 11% 28% 24%
0%
10%
20%
30%
40%
50%
Perc
ent o
f WLE
B Cr
opla
nd A
cres
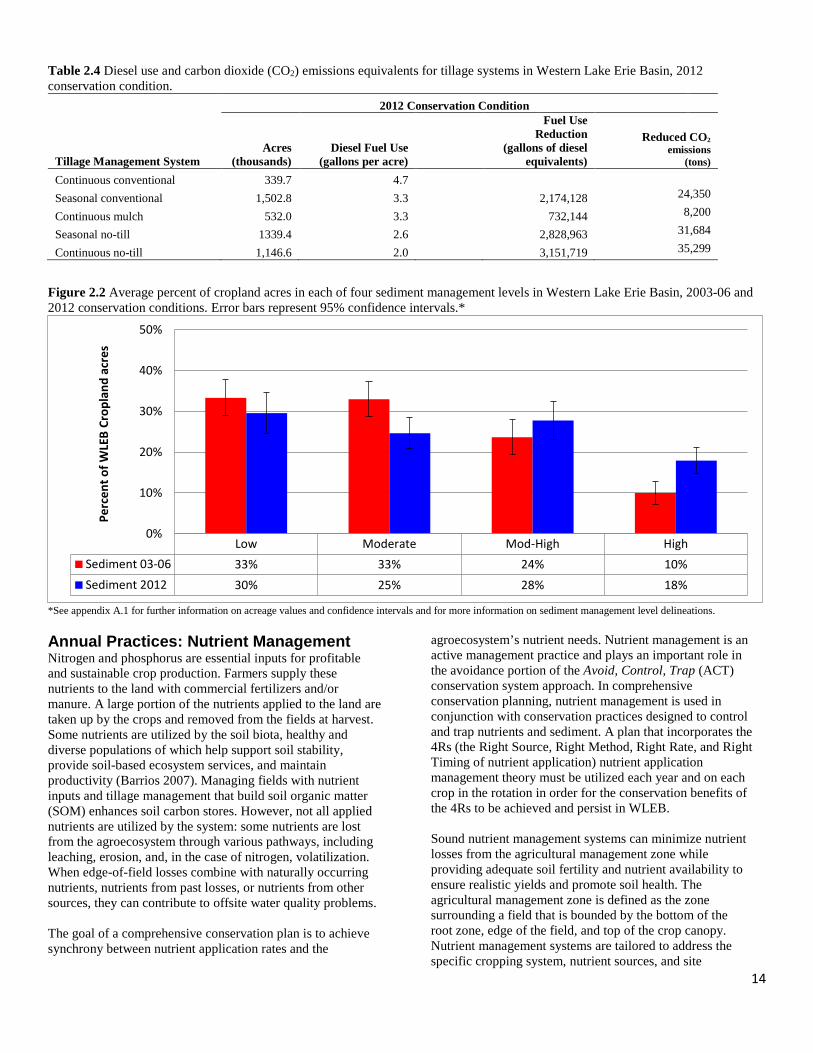
14
Table 2.4 Diesel use and carbon dioxide (CO2) emissions equivalents for tillage systems in Western Lake Erie Basin, 2012 conservation condition.
Tillage Management System
2012 Conservation Condition
Acres (thousands)
Diesel Fuel Use (gallons per acre)
Fuel Use Reduction
(gallons of diesel equivalents)
Reduced CO2 emissions
(tons) Continuous conventional 339.7 4.7 Seasonal conventional 1,502.8 3.3 2,174,128 24,350
Continuous mulch 532.0 3.3 732,144 8,200
Seasonal no-till 1339.4 2.6 2,828,963 31,684
Continuous no-till 1,146.6 2.0 3,151,719 35,299 Figure 2.2 Average percent of cropland acres in each of four sediment management levels in Western Lake Erie Basin, 2003-06 and 2012 conservation conditions. Error bars represent 95% confidence intervals.*
*See appendix A.1 for further information on acreage values and confidence intervals and for more information on sediment management level delineations. Annual Practices: Nutrient Management Nitrogen and phosphorus are essential inputs for profitable and sustainable crop production. Farmers supply these nutrients to the land with commercial fertilizers and/or manure. A large portion of the nutrients applied to the land are taken up by the crops and removed from the fields at harvest. Some nutrients are utilized by the soil biota, healthy and diverse populations of which help support soil stability, provide soil-based ecosystem services, and maintain productivity (Barrios 2007). Managing fields with nutrient inputs and tillage management that build soil organic matter (SOM) enhances soil carbon stores. However, not all applied nutrients are utilized by the system: some nutrients are lost from the agroecosystem through various pathways, including leaching, erosion, and, in the case of nitrogen, volatilization. When edge-of-field losses combine with naturally occurring nutrients, nutrients from past losses, or nutrients from other sources, they can contribute to offsite water quality problems. The goal of a comprehensive conservation plan is to achieve synchrony between nutrient application rates and the
agroecosystem’s nutrient needs. Nutrient management is an active management practice and plays an important role in the avoidance portion of the Avoid, Control, Trap (ACT) conservation system approach. In comprehensive conservation planning, nutrient management is used in conjunction with conservation practices designed to control and trap nutrients and sediment. A plan that incorporates the 4Rs (the Right Source, Right Method, Right Rate, and Right Timing of nutrient application) nutrient application management theory must be utilized each year and on each crop in the rotation in order for the conservation benefits of the 4Rs to be achieved and persist in WLEB. Sound nutrient management systems can minimize nutrient losses from the agricultural management zone while providing adequate soil fertility and nutrient availability to ensure realistic yields and promote soil health. The agricultural management zone is defined as the zone surrounding a field that is bounded by the bottom of the root zone, edge of the field, and top of the crop canopy. Nutrient management systems are tailored to address the specific cropping system, nutrient sources, and site
Low Moderate Mod-High HighSediment 03-06 33% 33% 24% 10%Sediment 2012 30% 25% 28% 18%
0%
10%
20%
30%
40%
50%
Perc
ent o
f WLE
B Cr
opla
nd a
cres
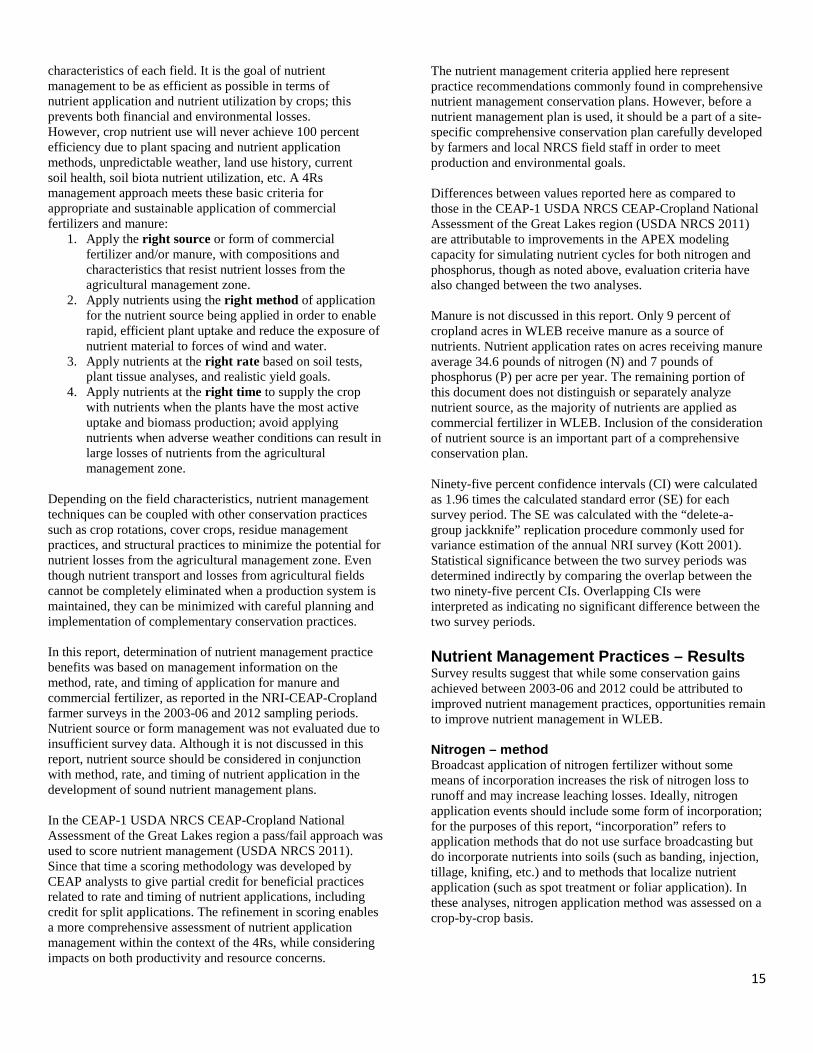
15
characteristics of each field. It is the goal of nutrient management to be as efficient as possible in terms of nutrient application and nutrient utilization by crops; this prevents both financial and environmental losses. However, crop nutrient use will never achieve 100 percent efficiency due to plant spacing and nutrient application methods, unpredictable weather, land use history, current soil health, soil biota nutrient utilization, etc. A 4Rs management approach meets these basic criteria for appropriate and sustainable application of commercial fertilizers and manure:
1. Apply the right source or form of commercial fertilizer and/or manure, with compositions and characteristics that resist nutrient losses from the agricultural management zone.
2. Apply nutrients using the right method of application for the nutrient source being applied in order to enable rapid, efficient plant uptake and reduce the exposure of nutrient material to forces of wind and water.
3. Apply nutrients at the right rate based on soil tests, plant tissue analyses, and realistic yield goals.
4. Apply nutrients at the right time to supply the crop with nutrients when the plants have the most active uptake and biomass production; avoid applying nutrients when adverse weather conditions can result in large losses of nutrients from the agricultural management zone.
Depending on the field characteristics, nutrient management techniques can be coupled with other conservation practices such as crop rotations, cover crops, residue management practices, and structural practices to minimize the potential for nutrient losses from the agricultural management zone. Even though nutrient transport and losses from agricultural fields cannot be completely eliminated when a production system is maintained, they can be minimized with careful planning and implementation of complementary conservation practices. In this report, determination of nutrient management practice benefits was based on management information on the method, rate, and timing of application for manure and commercial fertilizer, as reported in the NRI-CEAP-Cropland farmer surveys in the 2003-06 and 2012 sampling periods. Nutrient source or form management was not evaluated due to insufficient survey data. Although it is not discussed in this report, nutrient source should be considered in conjunction with method, rate, and timing of nutrient application in the development of sound nutrient management plans. In the CEAP-1 USDA NRCS CEAP-Cropland National Assessment of the Great Lakes region a pass/fail approach was used to score nutrient management (USDA NRCS 2011). Since that time a scoring methodology was developed by CEAP analysts to give partial credit for beneficial practices related to rate and timing of nutrient applications, including credit for split applications. The refinement in scoring enables a more comprehensive assessment of nutrient application management within the context of the 4Rs, while considering impacts on both productivity and resource concerns.
The nutrient management criteria applied here represent practice recommendations commonly found in comprehensive nutrient management conservation plans. However, before a nutrient management plan is used, it should be a part of a site-specific comprehensive conservation plan carefully developed by farmers and local NRCS field staff in order to meet production and environmental goals. Differences between values reported here as compared to those in the CEAP-1 USDA NRCS CEAP-Cropland National Assessment of the Great Lakes region (USDA NRCS 2011) are attributable to improvements in the APEX modeling capacity for simulating nutrient cycles for both nitrogen and phosphorus, though as noted above, evaluation criteria have also changed between the two analyses. Manure is not discussed in this report. Only 9 percent of cropland acres in WLEB receive manure as a source of nutrients. Nutrient application rates on acres receiving manure average 34.6 pounds of nitrogen (N) and 7 pounds of phosphorus (P) per acre per year. The remaining portion of this document does not distinguish or separately analyze nutrient source, as the majority of nutrients are applied as commercial fertilizer in WLEB. Inclusion of the consideration of nutrient source is an important part of a comprehensive conservation plan. Ninety-five percent confidence intervals (CI) were calculated as 1.96 times the calculated standard error (SE) for each survey period. The SE was calculated with the “delete-a-group jackknife” replication procedure commonly used for variance estimation of the annual NRI survey (Kott 2001). Statistical significance between the two survey periods was determined indirectly by comparing the overlap between the two ninety-five percent CIs. Overlapping CIs were interpreted as indicating no significant difference between the two survey periods. Nutrient Management Practices – Results Survey results suggest that while some conservation gains achieved between 2003-06 and 2012 could be attributed to improved nutrient management practices, opportunities remain to improve nutrient management in WLEB. Nitrogen – method Broadcast application of nitrogen fertilizer without some means of incorporation increases the risk of nitrogen loss to runoff and may increase leaching losses. Ideally, nitrogen application events should include some form of incorporation; for the purposes of this report, “incorporation” refers to application methods that do not use surface broadcasting but do incorporate nutrients into soils (such as banding, injection, tillage, knifing, etc.) and to methods that localize nutrient application (such as spot treatment or foliar application). In these analyses, nitrogen application method was assessed on a crop-by-crop basis.
16
Between 2003-06 and 2012, there was a marked increase in the adoption of application methods in which each nitrogen application is incorporated; the use of these methods increased from 29 to 43 percent between 2003-06 and 2012 (table 2.5). This improvement in method of application should help reduce nitrogen losses in runoff. However, the percent of WLEB cropland acres on which nitrogen applications were never managed with incorporation remained constant over both surveys, at 24 and 21 percent of acres in 2003-06 and 2012, respectively. The acres with no incorporation represent areas in which additional conservation benefits could be realized. Spring top-dressing of nitrogen on small grains was not included in this analyses and counted against the application management score. Nitrogen – rate Assessment of nitrogen application rates was based on the ratio of the amount of nitrogen applied as fertilizer or manure to the amount of nitrogen removed at harvest. A ratio of nitrogen application rate to crop removal rate was calculated as the N-use efficiency (NUE) for each crop in rotation for crops receiving nitrogen, except legumes. An average NUE developed for each point enabled classification of acres into application rate management classes. Application rates do not include other nitrogen inputs, such as biofixation, atmospheric deposition, or nitrogen released by degrading soil organic matter. Ideally nitrogen application rates should not exceed crop nitrogen removal rates for each crop by more than 40 percent (NUE≤1.4), except for small-grain crops (wheat, barley, oats, rice, rye, buckwheat, emmer, spelt, and triticale), for which application rates should not exceed removal rates by more than 60 percent (NUE≤1.6). There was no discernable change in nitrogen application rates between the two surveys (table 2.6). Although acres on which the ratio of nitrogen application to crop nitrogen utilization was greater than 1.4 were minimal in both survey periods, 5 percent of acres in 2003-06 and 4 percent of acres in 2012. There is opportunity to improve nitrogen rate management on these acres. The amount of acreage on which more nitrogen was removed at harvest than was applied as fertilizer was 22 percent of acres in both survey periods. On these acres farmers are employing a nitrogen drawdown strategy, in which crops deplete the soil of nutrients applied as fertilizer in previous years. In most cases application of a drawdown strategy every year is not a sustainable strategy, because it mines the soil of nutrients and at some point the farmer will need to increase nutrient application to maintain production. Nitrogen – timing Application timing is a critical component of the 4Rs of nutrient management. Timing nitrogen application events close to the planting date supplies the nutrient closer to the time when the crop needs and can utilize it, thereby reducing the risk of nitrogen loss and improving crop yields. When nitrogen application is optimal for plant uptake, the chances of nitrogen loss through runoff and leaching is diminished. Poor
timing, even with proper rates, can have significant negative economic and ecological consequences. The analyses in the CEAP-1 USDA NRCS CEAP-Cropland National Assessment of the Great Lakes region required all commercial fertilizer and manure nitrogen applications be within 21 days before or after planting to be classified as “appropriate” (USDA NRCS 2011). In this report the time between nitrogen application and planting date was considered in greater detail. Preferred nitrogen application timing was considered to be within 7 days before or after the planting date (appendix C.2). In the 2003-06 and 2012 conservation conditions, farmers managed 52 and 41 percent of WLEB cropland acres, respectively, with the growing year’s first nitrogen application timing within 7 days of the planting date (table 2.7). Although this is not a decline statistically, the mean values for each conservation condition raise concerns of a potential decline in acreage on which the first nitrogen application is appropriately timed. The majority of cropland acres in WLEB, 60 and 54 percent in the 2003-06 and 2012 conservation conditions, respectively, received their first application of nitrogen between 21 days prior to planting to 7 days post planting. Although not a statistical change, the mean number of acres in the category of nitrogen application management applying the first application of nitrogen more than 21 days prior to plant date was 32 and 39 percent of acres in the 2003-06 and 2012 conservation conditions, respectively. There is opportunity to improve timing on these acres, which would benefit crop-use efficiency, potentially improve yields, and provide ecological benefits associated with diminished nitrogen losses from the edge of the field. In WLEB, an important aspect of timing to consider is the splitting of nitrogen applications, a conservation practice which reduces the risk of nitrogen loss by supplying smaller amounts of nutrients at different stages of the crop calendar according to anticipated crop needs. In the 2003-06 and 2012 conservation conditions, 51 and 63 percent of WLEB cropland acres are managed with split nitrogen applications, respectively. While the use of splitting is generally an effective conservation practice for reducing nitrogen loss potentials, this practice may also lead to increased winter applications of nitrogen and may explain why some acres received their first application of nitrogen outside of the 7- and 21-day windows around the planting date. In the 2003-06 and 2012 conservation conditions, 16 and 24 percent of cropland acres, respectively, received early starter fertilizer between November and February, when soils are most vulnerable to nitrogen loss due to precipitation patterns and lack of vegetative cover to mitigate erosion. The cold temperature during winter months reduces the risk of biological losses from microorganisms or weeds, but warm periods and early spring warm up still pose a threat. While farmers are utilizing split application methods, with reduced rates at each application as a conservation practice intended to reduce the potential for nitrogen loss, there is still opportunity to improve timing of nitrogen splitting to improve N-use efficiency and reduce potential for nitrogen losses. It should also be noted
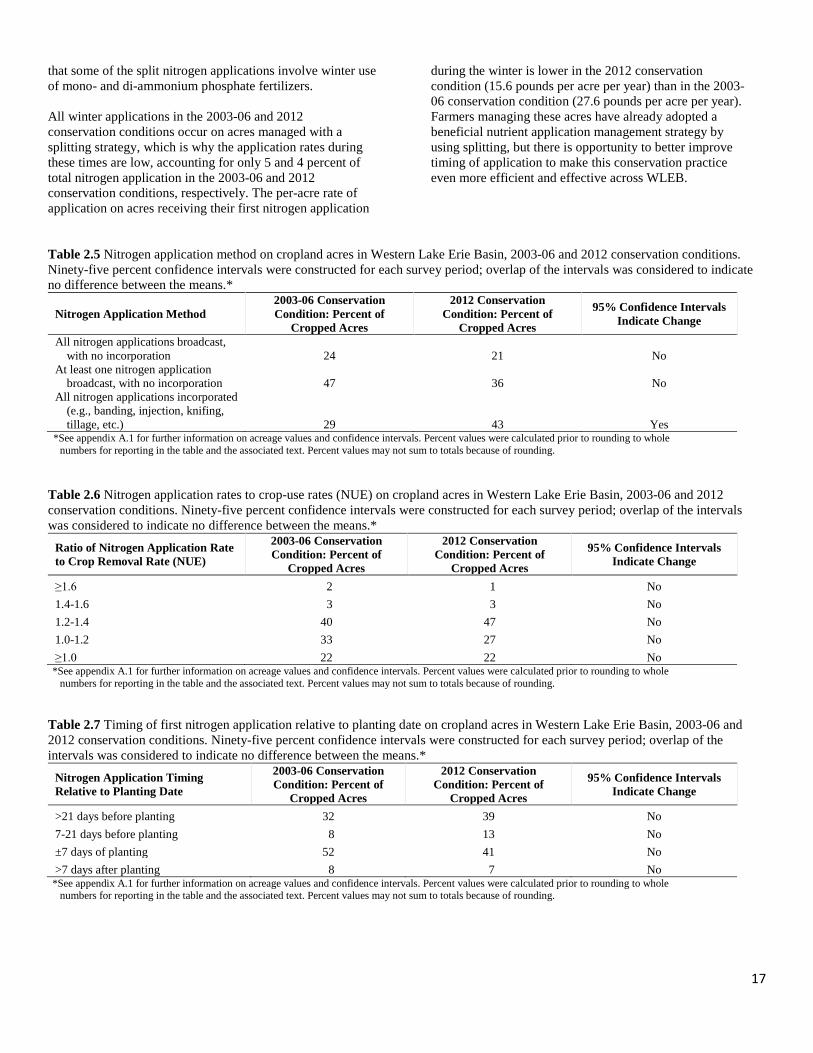
17
that some of the split nitrogen applications involve winter use of mono- and di-ammonium phosphate fertilizers. All winter applications in the 2003-06 and 2012 conservation conditions occur on acres managed with a splitting strategy, which is why the application rates during these times are low, accounting for only 5 and 4 percent of total nitrogen application in the 2003-06 and 2012 conservation conditions, respectively. The per-acre rate of application on acres receiving their first nitrogen application
during the winter is lower in the 2012 conservation condition (15.6 pounds per acre per year) than in the 2003-06 conservation condition (27.6 pounds per acre per year). Farmers managing these acres have already adopted a beneficial nutrient application management strategy by using splitting, but there is opportunity to better improve timing of application to make this conservation practice even more efficient and effective across WLEB.
Table 2.5 Nitrogen application method on cropland acres in Western Lake Erie Basin, 2003-06 and 2012 conservation conditions. Ninety-five percent confidence intervals were constructed for each survey period; overlap of the intervals was considered to indicate no difference between the means.*
Nitrogen Application Method 2003-06 Conservation Condition: Percent of
Cropped Acres
2012 Conservation Condition: Percent of
Cropped Acres
95% Confidence Intervals Indicate Change
All nitrogen applications broadcast, with no incorporation 24 21 No
At least one nitrogen application broadcast, with no incorporation 47 36 No
All nitrogen applications incorporated (e.g., banding, injection, knifing, tillage, etc.) 29 43 Yes
*See appendix A.1 for further information on acreage values and confidence intervals. Percent values were calculated prior to rounding to whole numbers for reporting in the table and the associated text. Percent values may not sum to totals because of rounding.
Table 2.6 Nitrogen application rates to crop-use rates (NUE) on cropland acres in Western Lake Erie Basin, 2003-06 and 2012 conservation conditions. Ninety-five percent confidence intervals were constructed for each survey period; overlap of the intervals was considered to indicate no difference between the means.*
Ratio of Nitrogen Application Rate to Crop Removal Rate (NUE)
2003-06 Conservation Condition: Percent of
Cropped Acres
2012 Conservation Condition: Percent of
Cropped Acres
95% Confidence Intervals Indicate Change
≥1.6 2 1 No 1.4-1.6 3 3 No 1.2-1.4 40 47 No 1.0-1.2 33 27 No ≥1.0 22 22 No
*See appendix A.1 for further information on acreage values and confidence intervals. Percent values were calculated prior to rounding to whole numbers for reporting in the table and the associated text. Percent values may not sum to totals because of rounding.
Table 2.7 Timing of first nitrogen application relative to planting date on cropland acres in Western Lake Erie Basin, 2003-06 and 2012 conservation conditions. Ninety-five percent confidence intervals were constructed for each survey period; overlap of the intervals was considered to indicate no difference between the means.*
Nitrogen Application Timing Relative to Planting Date
2003-06 Conservation Condition: Percent of
Cropped Acres
2012 Conservation Condition: Percent of
Cropped Acres
95% Confidence Intervals Indicate Change
>21 days before planting 32 39 No 7-21 days before planting 8 13 No ±7 days of planting 52 41 No >7 days after planting 8 7 No
*See appendix A.1 for further information on acreage values and confidence intervals. Percent values were calculated prior to rounding to whole numbers for reporting in the table and the associated text. Percent values may not sum to totals because of rounding.
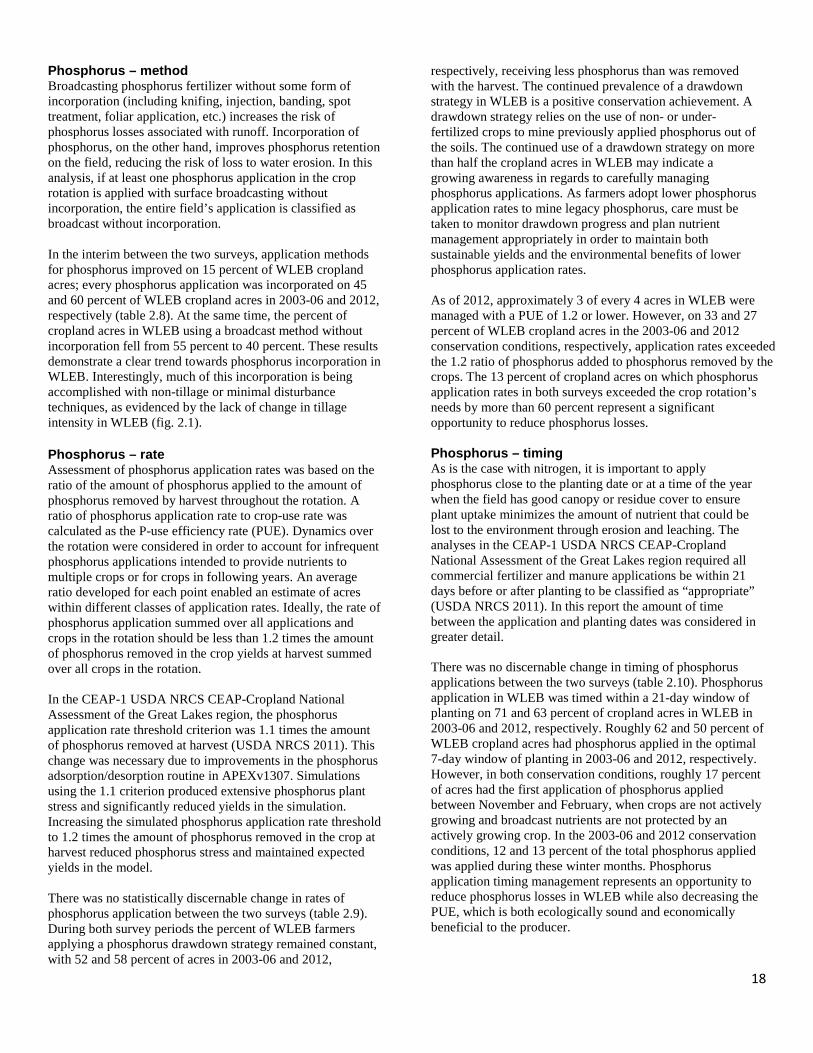
18
Phosphorus – method Broadcasting phosphorus fertilizer without some form of incorporation (including knifing, injection, banding, spot treatment, foliar application, etc.) increases the risk of phosphorus losses associated with runoff. Incorporation of phosphorus, on the other hand, improves phosphorus retention on the field, reducing the risk of loss to water erosion. In this analysis, if at least one phosphorus application in the crop rotation is applied with surface broadcasting without incorporation, the entire field’s application is classified as broadcast without incorporation. In the interim between the two surveys, application methods for phosphorus improved on 15 percent of WLEB cropland acres; every phosphorus application was incorporated on 45 and 60 percent of WLEB cropland acres in 2003-06 and 2012, respectively (table 2.8). At the same time, the percent of cropland acres in WLEB using a broadcast method without incorporation fell from 55 percent to 40 percent. These results demonstrate a clear trend towards phosphorus incorporation in WLEB. Interestingly, much of this incorporation is being accomplished with non-tillage or minimal disturbance techniques, as evidenced by the lack of change in tillage intensity in WLEB (fig. 2.1). Phosphorus – rate Assessment of phosphorus application rates was based on the ratio of the amount of phosphorus applied to the amount of phosphorus removed by harvest throughout the rotation. A ratio of phosphorus application rate to crop-use rate was calculated as the P-use efficiency rate (PUE). Dynamics over the rotation were considered in order to account for infrequent phosphorus applications intended to provide nutrients to multiple crops or for crops in following years. An average ratio developed for each point enabled an estimate of acres within different classes of application rates. Ideally, the rate of phosphorus application summed over all applications and crops in the rotation should be less than 1.2 times the amount of phosphorus removed in the crop yields at harvest summed over all crops in the rotation. In the CEAP-1 USDA NRCS CEAP-Cropland National Assessment of the Great Lakes region, the phosphorus application rate threshold criterion was 1.1 times the amount of phosphorus removed at harvest (USDA NRCS 2011). This change was necessary due to improvements in the phosphorus adsorption/desorption routine in APEXv1307. Simulations using the 1.1 criterion produced extensive phosphorus plant stress and significantly reduced yields in the simulation. Increasing the simulated phosphorus application rate threshold to 1.2 times the amount of phosphorus removed in the crop at harvest reduced phosphorus stress and maintained expected yields in the model. There was no statistically discernable change in rates of phosphorus application between the two surveys (table 2.9). During both survey periods the percent of WLEB farmers applying a phosphorus drawdown strategy remained constant, with 52 and 58 percent of acres in 2003-06 and 2012,
respectively, receiving less phosphorus than was removed with the harvest. The continued prevalence of a drawdown strategy in WLEB is a positive conservation achievement. A drawdown strategy relies on the use of non- or under-fertilized crops to mine previously applied phosphorus out of the soils. The continued use of a drawdown strategy on more than half the cropland acres in WLEB may indicate a growing awareness in regards to carefully managing phosphorus applications. As farmers adopt lower phosphorus application rates to mine legacy phosphorus, care must be taken to monitor drawdown progress and plan nutrient management appropriately in order to maintain both sustainable yields and the environmental benefits of lower phosphorus application rates. As of 2012, approximately 3 of every 4 acres in WLEB were managed with a PUE of 1.2 or lower. However, on 33 and 27 percent of WLEB cropland acres in the 2003-06 and 2012 conservation conditions, respectively, application rates exceeded the 1.2 ratio of phosphorus added to phosphorus removed by the crops. The 13 percent of cropland acres on which phosphorus application rates in both surveys exceeded the crop rotation’s needs by more than 60 percent represent a significant opportunity to reduce phosphorus losses. Phosphorus – timing As is the case with nitrogen, it is important to apply phosphorus close to the planting date or at a time of the year when the field has good canopy or residue cover to ensure plant uptake minimizes the amount of nutrient that could be lost to the environment through erosion and leaching. The analyses in the CEAP-1 USDA NRCS CEAP-Cropland National Assessment of the Great Lakes region required all commercial fertilizer and manure applications be within 21 days before or after planting to be classified as “appropriate” (USDA NRCS 2011). In this report the amount of time between the application and planting dates was considered in greater detail. There was no discernable change in timing of phosphorus applications between the two surveys (table 2.10). Phosphorus application in WLEB was timed within a 21-day window of planting on 71 and 63 percent of cropland acres in WLEB in 2003-06 and 2012, respectively. Roughly 62 and 50 percent of WLEB cropland acres had phosphorus applied in the optimal 7-day window of planting in 2003-06 and 2012, respectively. However, in both conservation conditions, roughly 17 percent of acres had the first application of phosphorus applied between November and February, when crops are not actively growing and broadcast nutrients are not protected by an actively growing crop. In the 2003-06 and 2012 conservation conditions, 12 and 13 percent of the total phosphorus applied was applied during these winter months. Phosphorus application timing management represents an opportunity to reduce phosphorus losses in WLEB while also decreasing the PUE, which is both ecologically sound and economically beneficial to the producer.
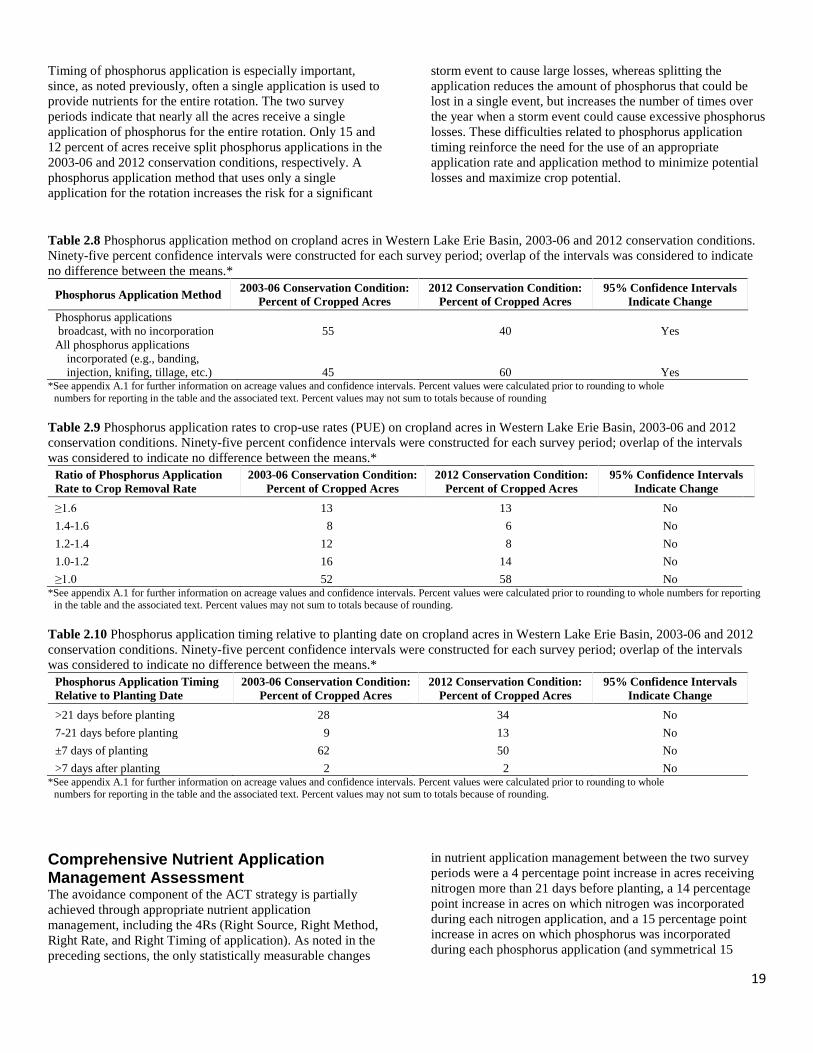
19
Timing of phosphorus application is especially important, since, as noted previously, often a single application is used to provide nutrients for the entire rotation. The two survey periods indicate that nearly all the acres receive a single application of phosphorus for the entire rotation. Only 15 and 12 percent of acres receive split phosphorus applications in the 2003-06 and 2012 conservation conditions, respectively. A phosphorus application method that uses only a single application for the rotation increases the risk for a significant
storm event to cause large losses, whereas splitting the application reduces the amount of phosphorus that could be lost in a single event, but increases the number of times over the year when a storm event could cause excessive phosphorus losses. These difficulties related to phosphorus application timing reinforce the need for the use of an appropriate application rate and application method to minimize potential losses and maximize crop potential.
Table 2.8 Phosphorus application method on cropland acres in Western Lake Erie Basin, 2003-06 and 2012 conservation conditions. Ninety-five percent confidence intervals were constructed for each survey period; overlap of the intervals was considered to indicate no difference between the means.*
Phosphorus Application Method 2003-06 Conservation Condition: Percent of Cropped Acres
2012 Conservation Condition: Percent of Cropped Acres
95% Confidence Intervals Indicate Change
Phosphorus applications broadcast, with no incorporation 55 40 Yes All phosphorus applications
incorporated (e.g., banding, injection, knifing, tillage, etc.) 45 60 Yes
*See appendix A.1 for further information on acreage values and confidence intervals. Percent values were calculated prior to rounding to whole numbers for reporting in the table and the associated text. Percent values may not sum to totals because of rounding
Table 2.9 Phosphorus application rates to crop-use rates (PUE) on cropland acres in Western Lake Erie Basin, 2003-06 and 2012 conservation conditions. Ninety-five percent confidence intervals were constructed for each survey period; overlap of the intervals was considered to indicate no difference between the means.*
Ratio of Phosphorus Application Rate to Crop Removal Rate
2003-06 Conservation Condition: Percent of Cropped Acres
2012 Conservation Condition: Percent of Cropped Acres
95% Confidence Intervals Indicate Change
≥1.6 13 13 No 1.4-1.6 8 6 No 1.2-1.4 12 8 No 1.0-1.2 16 14 No ≥1.0 52 58 No
*See appendix A.1 for further information on acreage values and confidence intervals. Percent values were calculated prior to rounding to whole numbers for reporting in the table and the associated text. Percent values may not sum to totals because of rounding.
Table 2.10 Phosphorus application timing relative to planting date on cropland acres in Western Lake Erie Basin, 2003-06 and 2012 conservation conditions. Ninety-five percent confidence intervals were constructed for each survey period; overlap of the intervals was considered to indicate no difference between the means.*
Phosphorus Application Timing Relative to Planting Date
2003-06 Conservation Condition: Percent of Cropped Acres
2012 Conservation Condition: Percent of Cropped Acres
95% Confidence Intervals Indicate Change
>21 days before planting 28 34 No 7-21 days before planting 9 13 No ±7 days of planting 62 50 No >7 days after planting 2 2 No
*See appendix A.1 for further information on acreage values and confidence intervals. Percent values were calculated prior to rounding to whole numbers for reporting in the table and the associated text. Percent values may not sum to totals because of rounding.
Comprehensive Nutrient Application Management Assessment The avoidance component of the ACT strategy is partially achieved through appropriate nutrient application management, including the 4Rs (Right Source, Right Method, Right Rate, and Right Timing of application). As noted in the preceding sections, the only statistically measurable changes
in nutrient application management between the two survey periods were a 4 percentage point increase in acres receiving nitrogen more than 21 days before planting, a 14 percentage point increase in acres on which nitrogen was incorporated during each nitrogen application, and a 15 percentage point increase in acres on which phosphorus was incorporated during each phosphorus application (and symmetrical 15
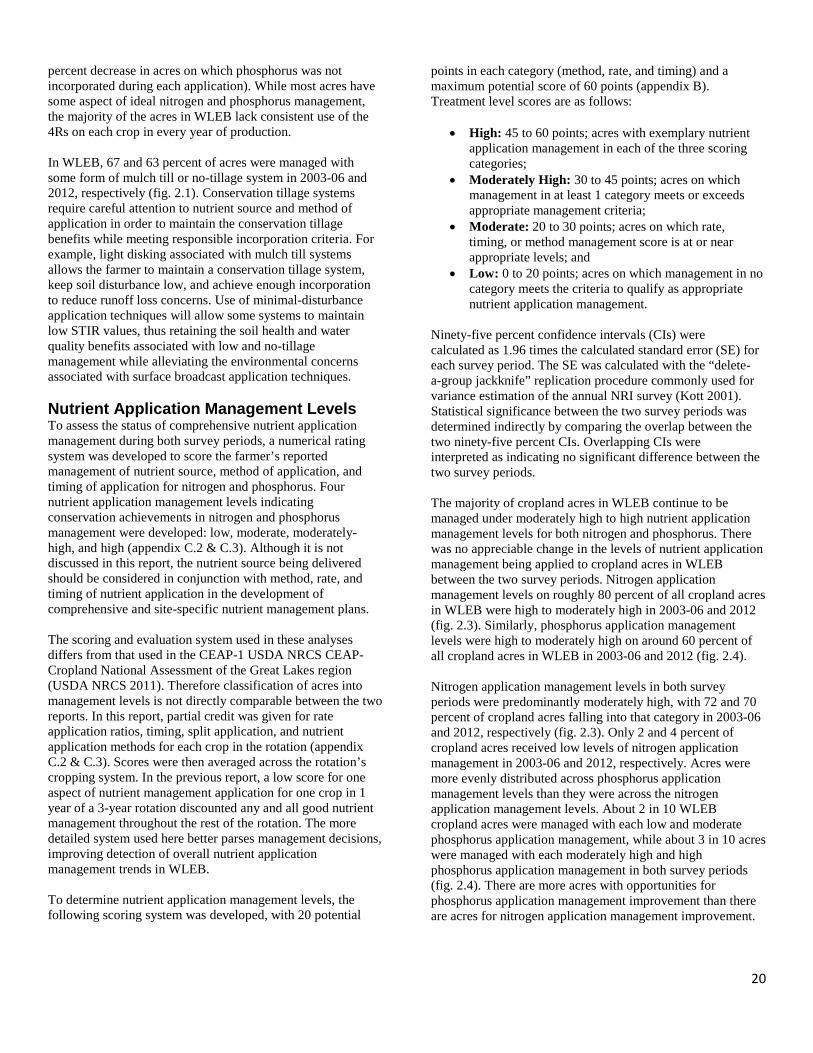
20
percent decrease in acres on which phosphorus was not incorporated during each application). While most acres have some aspect of ideal nitrogen and phosphorus management, the majority of the acres in WLEB lack consistent use of the 4Rs on each crop in every year of production. In WLEB, 67 and 63 percent of acres were managed with some form of mulch till or no-tillage system in 2003-06 and 2012, respectively (fig. 2.1). Conservation tillage systems require careful attention to nutrient source and method of application in order to maintain the conservation tillage benefits while meeting responsible incorporation criteria. For example, light disking associated with mulch till systems allows the farmer to maintain a conservation tillage system, keep soil disturbance low, and achieve enough incorporation to reduce runoff loss concerns. Use of minimal-disturbance application techniques will allow some systems to maintain low STIR values, thus retaining the soil health and water quality benefits associated with low and no-tillage management while alleviating the environmental concerns associated with surface broadcast application techniques. Nutrient Application Management Levels To assess the status of comprehensive nutrient application management during both survey periods, a numerical rating system was developed to score the farmer’s reported management of nutrient source, method of application, and timing of application for nitrogen and phosphorus. Four nutrient application management levels indicating conservation achievements in nitrogen and phosphorus management were developed: low, moderate, moderately-high, and high (appendix C.2 & C.3). Although it is not discussed in this report, the nutrient source being delivered should be considered in conjunction with method, rate, and timing of nutrient application in the development of comprehensive and site-specific nutrient management plans. The scoring and evaluation system used in these analyses differs from that used in the CEAP-1 USDA NRCS CEAP-Cropland National Assessment of the Great Lakes region (USDA NRCS 2011). Therefore classification of acres into management levels is not directly comparable between the two reports. In this report, partial credit was given for rate application ratios, timing, split application, and nutrient application methods for each crop in the rotation (appendix C.2 & C.3). Scores were then averaged across the rotation’s cropping system. In the previous report, a low score for one aspect of nutrient management application for one crop in 1 year of a 3-year rotation discounted any and all good nutrient management throughout the rest of the rotation. The more detailed system used here better parses management decisions, improving detection of overall nutrient application management trends in WLEB. To determine nutrient application management levels, the following scoring system was developed, with 20 potential
points in each category (method, rate, and timing) and a maximum potential score of 60 points (appendix B). Treatment level scores are as follows:
• High: 45 to 60 points; acres with exemplary nutrient application management in each of the three scoring categories;
• Moderately High: 30 to 45 points; acres on which management in at least 1 category meets or exceeds appropriate management criteria;
• Moderate: 20 to 30 points; acres on which rate, timing, or method management score is at or near appropriate levels; and
• Low: 0 to 20 points; acres on which management in no category meets the criteria to qualify as appropriate nutrient application management.
Ninety-five percent confidence intervals (CIs) were calculated as 1.96 times the calculated standard error (SE) for each survey period. The SE was calculated with the “delete-a-group jackknife” replication procedure commonly used for variance estimation of the annual NRI survey (Kott 2001). Statistical significance between the two survey periods was determined indirectly by comparing the overlap between the two ninety-five percent CIs. Overlapping CIs were interpreted as indicating no significant difference between the two survey periods. The majority of cropland acres in WLEB continue to be managed under moderately high to high nutrient application management levels for both nitrogen and phosphorus. There was no appreciable change in the levels of nutrient application management being applied to cropland acres in WLEB between the two survey periods. Nitrogen application management levels on roughly 80 percent of all cropland acres in WLEB were high to moderately high in 2003-06 and 2012 (fig. 2.3). Similarly, phosphorus application management levels were high to moderately high on around 60 percent of all cropland acres in WLEB in 2003-06 and 2012 (fig. 2.4). Nitrogen application management levels in both survey periods were predominantly moderately high, with 72 and 70 percent of cropland acres falling into that category in 2003-06 and 2012, respectively (fig. 2.3). Only 2 and 4 percent of cropland acres received low levels of nitrogen application management in 2003-06 and 2012, respectively. Acres were more evenly distributed across phosphorus application management levels than they were across the nitrogen application management levels. About 2 in 10 WLEB cropland acres were managed with each low and moderate phosphorus application management, while about 3 in 10 acres were managed with each moderately high and high phosphorus application management in both survey periods (fig. 2.4). There are more acres with opportunities for phosphorus application management improvement than there are acres for nitrogen application management improvement.
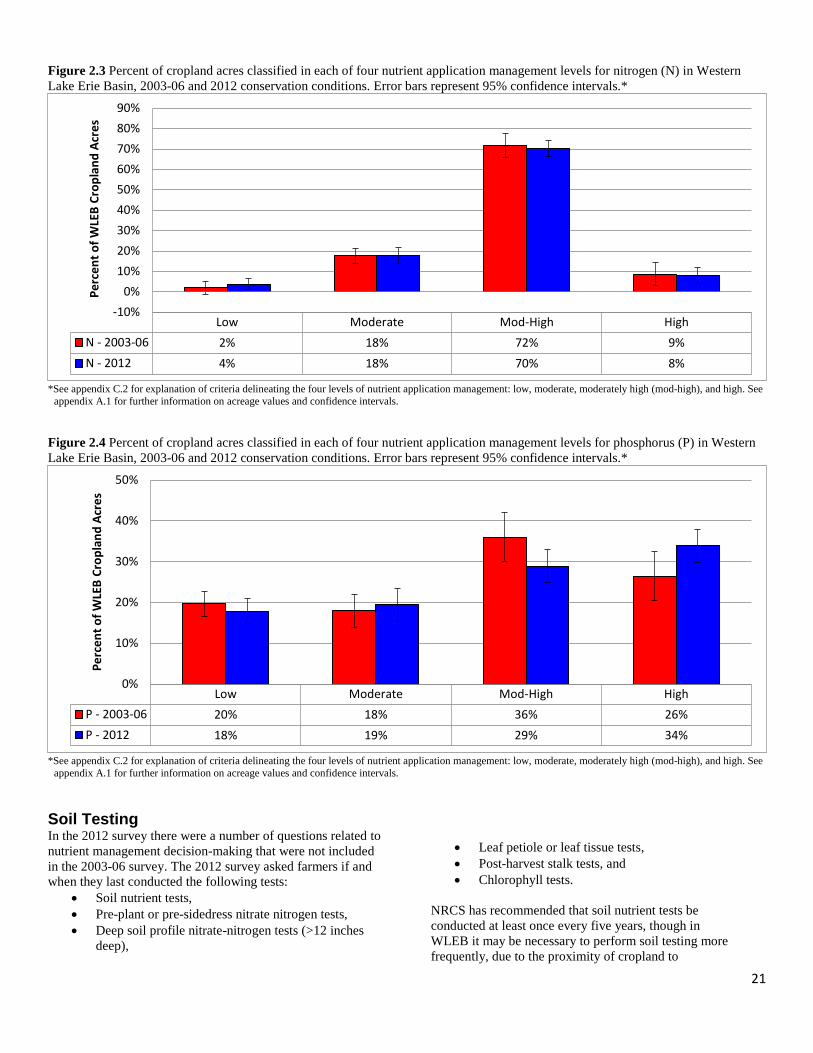
21
Figure 2.3 Percent of cropland acres classified in each of four nutrient application management levels for nitrogen (N) in Western Lake Erie Basin, 2003-06 and 2012 conservation conditions. Error bars represent 95% confidence intervals.*
*See appendix C.2 for explanation of criteria delineating the four levels of nutrient application management: low, moderate, moderately high (mod-high), and high. See
appendix A.1 for further information on acreage values and confidence intervals. Figure 2.4 Percent of cropland acres classified in each of four nutrient application management levels for phosphorus (P) in Western Lake Erie Basin, 2003-06 and 2012 conservation conditions. Error bars represent 95% confidence intervals.*
*See appendix C.2 for explanation of criteria delineating the four levels of nutrient application management: low, moderate, moderately high (mod-high), and high. See
appendix A.1 for further information on acreage values and confidence intervals. Soil Testing In the 2012 survey there were a number of questions related to nutrient management decision-making that were not included in the 2003-06 survey. The 2012 survey asked farmers if and when they last conducted the following tests:
• Soil nutrient tests, • Pre-plant or pre-sidedress nitrate nitrogen tests, • Deep soil profile nitrate-nitrogen tests (>12 inches
deep),
• Leaf petiole or leaf tissue tests, • Post-harvest stalk tests, and • Chlorophyll tests.
NRCS has recommended that soil nutrient tests be conducted at least once every five years, though in WLEB it may be necessary to perform soil testing more frequently, due to the proximity of cropland to
Low Moderate Mod-High HighN - 2003-06 2% 18% 72% 9%N - 2012 4% 18% 70% 8%
-10%0%
10%20%30%40%50%60%70%80%90%
Perc
ent o
f WLE
B Cr
opla
nd A
cres
Low Moderate Mod-High HighP - 2003-06 20% 18% 36% 26%P - 2012 18% 19% 29% 34%
0%
10%
20%
30%
40%
50%
Perc
ent o
f WLE
B Cr
opla
nd A
cres
22
vulnerable water bodies. In WLEB, soil nutrient testing is widely adopted. This test determines the amount of residual nitrogen (N) and phosphorus (P) present in the field that a nutrient management plan should consider to be available to crops as a supplement to applied nutrients. In 2003-06 and 2012, 66 and 71 percent, respectively, of cropland acres in WLEB had had a soil nutrient test in the previous five years (table 2.12). WLEB farmers may be testing their soils more frequently, as the survey asked if there was a soil nutrient test within the previous five years rather than asking about intervals between the most recent soil tests. Results related to nitrogen management suggest that WLEB farmers are aware of the importance of carefully managing nitrogen inputs. Acres on which use of a nitrogen inhibitor was reported increased from 8 to 30 percent of acres between 2003-06 and 2012 (table 2.11). Some farmers are testing specifically for soil nitrogen; in the 2012 survey farmers reported that 8 percent of WLEB acres receive a nitrogen test; this question was not included in the 2003-06 survey, but will be maintained in future surveys (table 2.11). Soil tests should guide application rates, inform tillage management decisions, and inform cover crop management, as these sets of practices impact nutrient use and loss dynamics. Some research has shown that periodic tillage can correct extreme cases of nutrient stratification due to long periods of nutrient application without tillage management (Franzluebbers 2002). It has been posited that phosphorus stratification has led to excessive phosphorus concentrations near the soil surface that are contributing to increased phosphorus losses in runoff in WLEB. While the degree of tillage management applied should be related to the severity of stratification and risk of erosion and phosphorus loss, research on the degree of stratification and soil test level results that would indicate the need for some sort of incorporation to reduce erosional vulnerabilities has shown variable results across different soils. Therefore, there is no singular rule as to what phosphorus tests results should trigger tillage management. However, if and when tillage management is used to reduce phosphorus stratification, the use of a cover crop or high residue crop should follow immediately, in order to reduce the risk of soil and associated nutrient loss. A subsequent soil test should be used to evaluate the impacts of the tillage and cover crop management and to determine nutrient input needs. Additionally, nutrient management plans should consider the nutrient needs of both the primary crop(s) in the rotation alongside cover crop needs in order to maintain crop yields. Maintenance of cover crop management provides numerous benefits in addition to phosphorus loss mitigation. Cover crops may improve nitrogen and phosphorus dynamics and soil health, provide erosion protection through soil stabilization, and serve as important pollinator habitat. Soil testing is an essential component of a comprehensive conservation plan designed to reduce nutrient losses while maintaining crop yields. However, testing must be done properly in order to maximize potential benefits. Collection of
an aggregated sample across a field may lead to poor management decisions because the average needs across the field may not represent the needs of the various soils in the field. Soil tests should be performed on defined zones or grids to better understand nutrient requirements and differences in those requirements across fields due to differences in soils. Management based on field averages may lead to over- or under-fertilization, which may consequently cause diminished yields and/or negative environmental impacts. Advanced Technologies in Precision Agriculture Agricultural fields commonly contain more than one type of soil. Differences between the soils can be significant in terms of the potential yields they will support and their vulnerabilities to various loss pathways. Advanced technologies using GPS interfaces and precision soil mapping enable farmers to tailor nutrient application and conservation management to particular soils, improving production efficiencies while mitigating environmental impacts. Maps can be developed from gridded samples or zoned samples based on soils, topography, or some other continuous measurement across the farm, such as electrical conductivity. When combined with spatially explicit yield data, these maps help explain soil variability across farm fields. Understanding variability is the first step towards developing a comprehensive conservation plan that puts the right suite of the right practices in the right places to achieve ecological and economic goals. Both the 2003-06 and 2012 surveys included a question on whether farmers used a GPS device to map soil properties, such as nitrate levels, pH, and/or electrical conductivity. GPS mapping of soil properties increased from being in use on 8 percent (372,000 acres) of WLEB region’s cropland acres in 2003-06 to being in use on 36 percent (1.7 million acres) in 2012 (appendix A.1). This increase in the use of advanced technologies to better understand in-field dynamics and needs indicates a burgeoning capacity to manage soils within the farm fields rather than using a singular management approach across diverse farm fields. In addition to advances in GPS mapping technologies, variable rate technologies (VRT) provide a means to improve yield and environmental benefits through precision agriculture. Variable rate technologies allow farmers to use GPS technologies integrated with farming equipment to manage portions of their field in very specific ways, including delivery of specific amounts of fertilizer to various portions of their fields based on yield maps and soils maps. Variable rate technologies allows farmers to avoid over-fertilizing soils that have inherently low yields and are thus vulnerable to nutrient losses if fertilized at the same rate as the remainder of the field. Ergo, application of this technology makes economic and ecological sense (USDA NRCS 2007b; Schimmelpfennig and Ebel 2011).
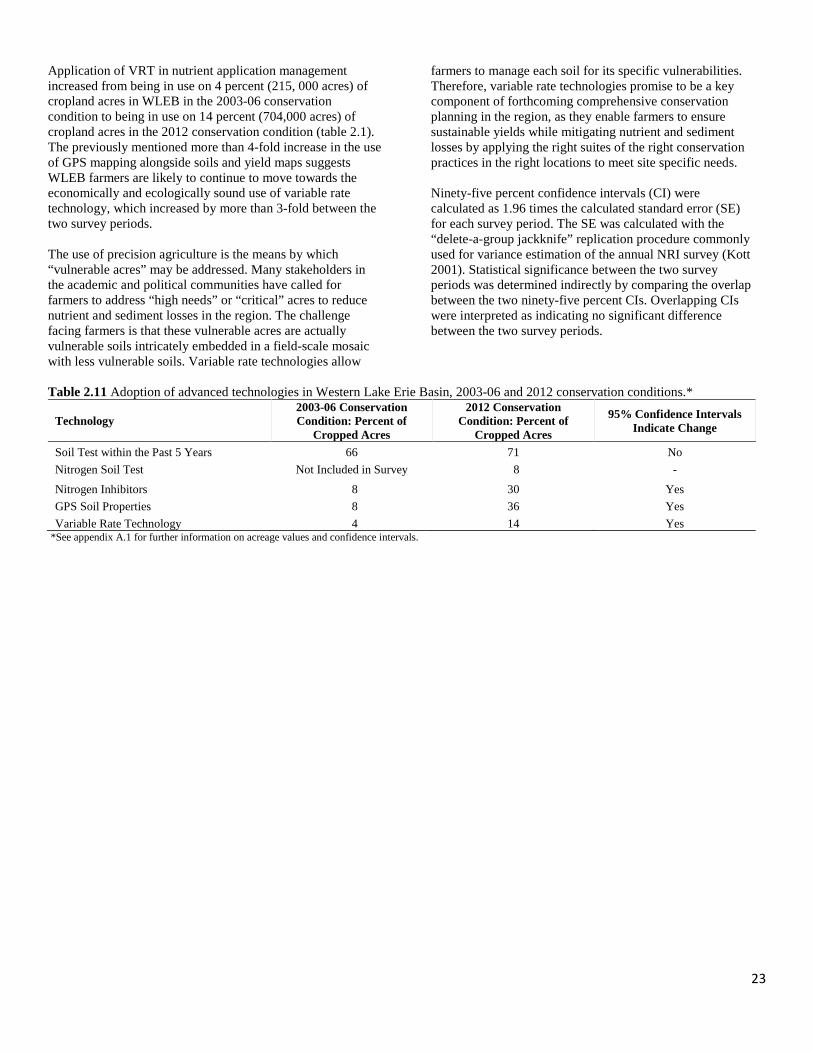
23
Application of VRT in nutrient application management increased from being in use on 4 percent (215, 000 acres) of cropland acres in WLEB in the 2003-06 conservation condition to being in use on 14 percent (704,000 acres) of cropland acres in the 2012 conservation condition (table 2.1). The previously mentioned more than 4-fold increase in the use of GPS mapping alongside soils and yield maps suggests WLEB farmers are likely to continue to move towards the economically and ecologically sound use of variable rate technology, which increased by more than 3-fold between the two survey periods. The use of precision agriculture is the means by which “vulnerable acres” may be addressed. Many stakeholders in the academic and political communities have called for farmers to address “high needs” or “critical” acres to reduce nutrient and sediment losses in the region. The challenge facing farmers is that these vulnerable acres are actually vulnerable soils intricately embedded in a field-scale mosaic with less vulnerable soils. Variable rate technologies allow
farmers to manage each soil for its specific vulnerabilities. Therefore, variable rate technologies promise to be a key component of forthcoming comprehensive conservation planning in the region, as they enable farmers to ensure sustainable yields while mitigating nutrient and sediment losses by applying the right suites of the right conservation practices in the right locations to meet site specific needs. Ninety-five percent confidence intervals (CI) were calculated as 1.96 times the calculated standard error (SE) for each survey period. The SE was calculated with the “delete-a-group jackknife” replication procedure commonly used for variance estimation of the annual NRI survey (Kott 2001). Statistical significance between the two survey periods was determined indirectly by comparing the overlap between the two ninety-five percent CIs. Overlapping CIs were interpreted as indicating no significant difference between the two survey periods.
Table 2.11 Adoption of advanced technologies in Western Lake Erie Basin, 2003-06 and 2012 conservation conditions.*
Technology 2003-06 Conservation Condition: Percent of
Cropped Acres
2012 Conservation Condition: Percent of
Cropped Acres
95% Confidence Intervals Indicate Change
Soil Test within the Past 5 Years 66 71 No Nitrogen Soil Test Not Included in Survey 8 -
Nitrogen Inhibitors 8 30 Yes GPS Soil Properties 8 36 Yes Variable Rate Technology 4 14 Yes
*See appendix A.1 for further information on acreage values and confidence intervals.
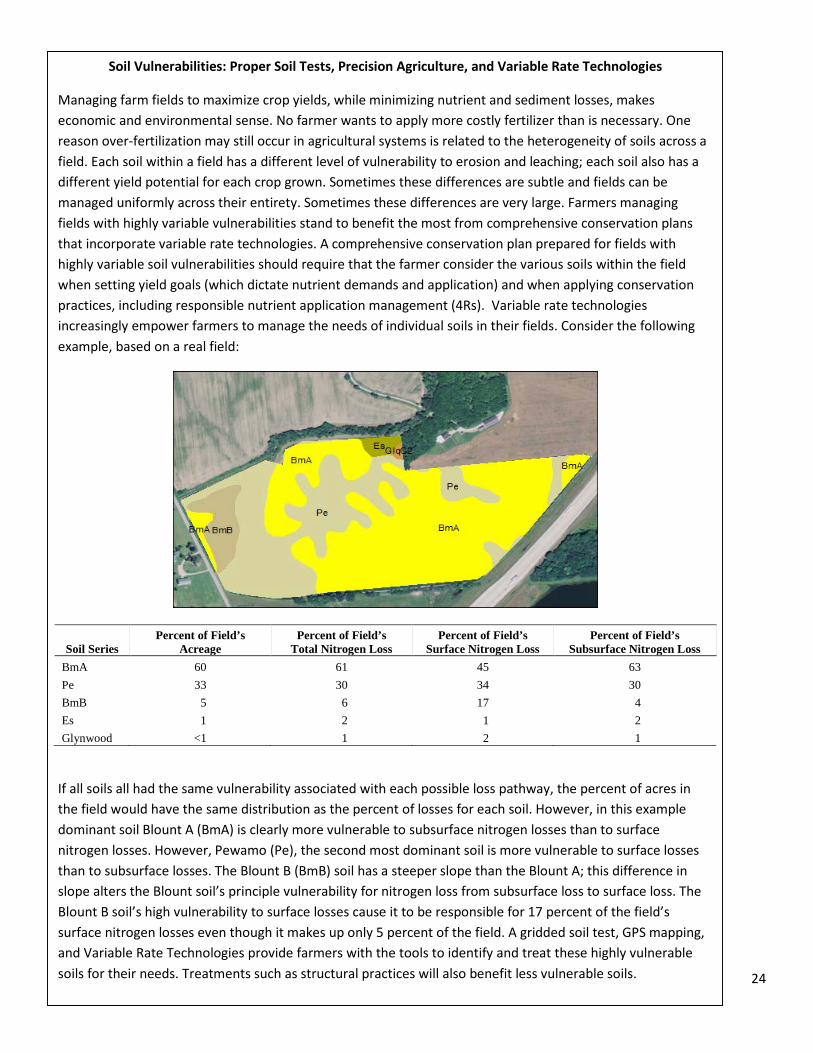
24
Soil Vulnerabilities: Proper Soil Tests, Precision Agriculture, and Variable Rate Technologies
Managing farm fields to maximize crop yields, while minimizing nutrient and sediment losses, makes economic and environmental sense. No farmer wants to apply more costly fertilizer than is necessary. One reason over-fertilization may still occur in agricultural systems is related to the heterogeneity of soils across a field. Each soil within a field has a different level of vulnerability to erosion and leaching; each soil also has a different yield potential for each crop grown. Sometimes these differences are subtle and fields can be managed uniformly across their entirety. Sometimes these differences are very large. Farmers managing fields with highly variable vulnerabilities stand to benefit the most from comprehensive conservation plans that incorporate variable rate technologies. A comprehensive conservation plan prepared for fields with highly variable soil vulnerabilities should require that the farmer consider the various soils within the field when setting yield goals (which dictate nutrient demands and application) and when applying conservation practices, including responsible nutrient application management (4Rs). Variable rate technologies increasingly empower farmers to manage the needs of individual soils in their fields. Consider the following example, based on a real field:
Soil Series Percent of Field’s
Acreage Percent of Field’s
Total Nitrogen Loss Percent of Field’s
Surface Nitrogen Loss Percent of Field’s
Subsurface Nitrogen Loss BmA 60 61 45 63 Pe 33 30 34 30 BmB 5 6 17 4 Es 1 2 1 2 Glynwood <1 1 2 1
If all soils all had the same vulnerability associated with each possible loss pathway, the percent of acres in the field would have the same distribution as the percent of losses for each soil. However, in this example dominant soil Blount A (BmA) is clearly more vulnerable to subsurface nitrogen losses than to surface nitrogen losses. However, Pewamo (Pe), the second most dominant soil is more vulnerable to surface losses than to subsurface losses. The Blount B (BmB) soil has a steeper slope than the Blount A; this difference in slope alters the Blount soil’s principle vulnerability for nitrogen loss from subsurface loss to surface loss. The Blount B soil’s high vulnerability to surface losses cause it to be responsible for 17 percent of the field’s surface nitrogen losses even though it makes up only 5 percent of the field. A gridded soil test, GPS mapping, and Variable Rate Technologies provide farmers with the tools to identify and treat these highly vulnerable soils for their needs. Treatments such as structural practices will also benefit less vulnerable soils.
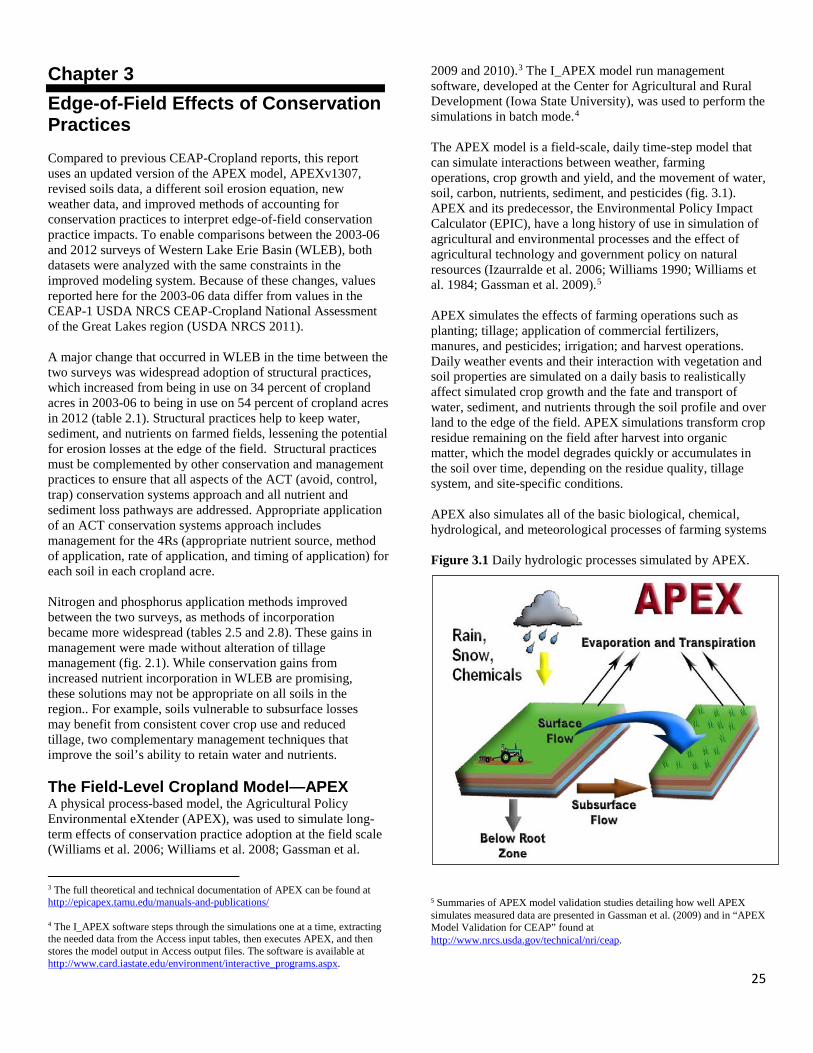
25
Chapter 3 Edge-of-Field Effects of Conservation Practices Compared to previous CEAP-Cropland reports, this report uses an updated version of the APEX model, APEXv1307, revised soils data, a different soil erosion equation, new weather data, and improved methods of accounting for conservation practices to interpret edge-of-field conservation practice impacts. To enable comparisons between the 2003-06 and 2012 surveys of Western Lake Erie Basin (WLEB), both datasets were analyzed with the same constraints in the improved modeling system. Because of these changes, values reported here for the 2003-06 data differ from values in the CEAP-1 USDA NRCS CEAP-Cropland National Assessment of the Great Lakes region (USDA NRCS 2011). A major change that occurred in WLEB in the time between the two surveys was widespread adoption of structural practices, which increased from being in use on 34 percent of cropland acres in 2003-06 to being in use on 54 percent of cropland acres in 2012 (table 2.1). Structural practices help to keep water, sediment, and nutrients on farmed fields, lessening the potential for erosion losses at the edge of the field. Structural practices must be complemented by other conservation and management practices to ensure that all aspects of the ACT (avoid, control, trap) conservation systems approach and all nutrient and sediment loss pathways are addressed. Appropriate application of an ACT conservation systems approach includes management for the 4Rs (appropriate nutrient source, method of application, rate of application, and timing of application) for each soil in each cropland acre. Nitrogen and phosphorus application methods improved between the two surveys, as methods of incorporation became more widespread (tables 2.5 and 2.8). These gains in management were made without alteration of tillage management (fig. 2.1). While conservation gains from increased nutrient incorporation in WLEB are promising, these solutions may not be appropriate on all soils in the region.. For example, soils vulnerable to subsurface losses may benefit from consistent cover crop use and reduced tillage, two complementary management techniques that improve the soil’s ability to retain water and nutrients. The Field-Level Cropland Model—APEX A physical process-based model, the Agricultural Policy Environmental eXtender (APEX), was used to simulate long-term effects of conservation practice adoption at the field scale (Williams et al. 2006; Williams et al. 2008; Gassman et al.
3 The full theoretical and technical documentation of APEX can be found at http://epicapex.tamu.edu/manuals-and-publications/ 4 The I_APEX software steps through the simulations one at a time, extracting the needed data from the Access input tables, then executes APEX, and then stores the model output in Access output files. The software is available at http://www.card.iastate.edu/environment/interactive_programs.aspx.
2009 and 2010).3 The I_APEX model run management software, developed at the Center for Agricultural and Rural Development (Iowa State University), was used to perform the simulations in batch mode.4 The APEX model is a field-scale, daily time-step model that can simulate interactions between weather, farming operations, crop growth and yield, and the movement of water, soil, carbon, nutrients, sediment, and pesticides (fig. 3.1). APEX and its predecessor, the Environmental Policy Impact Calculator (EPIC), have a long history of use in simulation of agricultural and environmental processes and the effect of agricultural technology and government policy on natural resources (Izaurralde et al. 2006; Williams 1990; Williams et al. 1984; Gassman et al. 2009).5 APEX simulates the effects of farming operations such as planting; tillage; application of commercial fertilizers, manures, and pesticides; irrigation; and harvest operations. Daily weather events and their interaction with vegetation and soil properties are simulated on a daily basis to realistically affect simulated crop growth and the fate and transport of water, sediment, and nutrients through the soil profile and over land to the edge of the field. APEX simulations transform crop residue remaining on the field after harvest into organic matter, which the model degrades quickly or accumulates in the soil over time, depending on the residue quality, tillage system, and site-specific conditions. APEX also simulates all of the basic biological, chemical, hydrological, and meteorological processes of farming systems Figure 3.1 Daily hydrologic processes simulated by APEX.
5 Summaries of APEX model validation studies detailing how well APEX simulates measured data are presented in Gassman et al. (2009) and in “APEX Model Validation for CEAP” found at http://www.nrcs.usda.gov/technical/nri/ceap.
26
and their interactions on a daily time-step. Simulated soil erosion includes wind erosion, sheet and rill erosion, and the loss of sediment beyond the edge of the field. The nitrogen, phosphorus, and carbon cycles are simulated, including chemical transformations in the soil that affect nutrient availability for plant growth or for transport from the field. Gaseous exchange between the soil and the atmosphere is simulated, including losses of gaseous nitrogen and nitrogen fixation. The modeling strategy for comparing anticipated long-term effects of conservation practices in place during the 2003-06 and 2012 sampling periods consists of the simulation of three conservation conditions:
1. The 2003-06 conservation condition is based on model simulations that account for cropping patterns, farming activities, and conservation practices as reported in the 2003-06 NRI-CEAP-Cropland survey and other sources;
2. The 2012 conservation condition is based on model simulations that account for cropping patterns, farming activities, and conservation practices as reported in the 2012 NRI-CEAP-Cropland survey and other sources; and
3. The no-practice condition is based on model simulations that remove all conservation practices reported to be in use on the 2003-06 sample points. Soils, weather, crop rotations, other model inputs (with the exception of those related to conservation practices), and model parameters are held the same as for the 2003-06 conservation condition.
The no-practice condition provides perspective on the benefits of conservation practices on cultivated cropland and estimates the loads that would leave the edge of the field if no agricultural conservation practices were adopted in WLEB, or if conservation practices currently in place were abandoned (appendix C). To compare the impacts of each conservation condition, ninety-five percent confidence intervals (CI) were calculated as 1.96 times the calculated standard error (SE) for each survey period. The SE was calculated with the “delete-a-group jackknife” replication procedure commonly used for variance estimation of the annual NRI survey (Kott 2001). Statistical significance between the two survey periods was determined indirectly by comparing the overlap between the two ninety-five percent CIs. Overlapping CIs were interpreted as indicating no significant difference between the two survey periods. Effects of Practices on Fate and Transport of Water The hydrologic conditions of cropped acres in WLEB interact with or drive the estimates of sediment and nutrient losses from these agroecological systems. The APEX model simulates hydrologic processes at the field scale, accounting for precipitation, irrigation, evapotranspiration, surface water runoff, infiltration, and percolation beyond the bottom of the soil profile. The results provide information on losses at the edge of the field.
Precipitation, rarely supplemented by irrigation, supplies water to cropped acres in WLEB. Average annual precipitation over the 52 years of monitored weather data used for simulation ranged from 32.7 to 40.3 inches and averaged about 36.2 inches over all 52 years for WLEB cropped acres. The highest rainfall year was 2011 (53.9 inches) and the driest year was 1963 (22.8 inches), with some locations receiving rainfall amounts as low as 17.8 inches in 1963 and as high as 66.7 inches in 2011 (fig. 1.1). Less than 1 percent of cropped acres were irrigated in the 2003-06 and 2012 conservation conditions. Water is lost to the atmosphere via evapotranspiration (ET), a combination of evaporation and transpiration. ET is the dominant water loss pathway for cropped acres in WLEB under all simulated conditions (table 3.1). Variability in soil characteristics, precipitation, and land cover characteristics contribute to variability in per-acre ET losses. Evapotranspiration is the pathway by which 62 and 63 percent of total precipitation is lost from WLEB cropland in the 2003-06 and 2012 conservation conditions, respectively. Increased adoption of structural water erosion control practices and maintained use of both residue management practices and conservation tillage practices slow the flow of surface water, reducing runoff losses, and allowing water to infiltrate into the soil so it is available to plants as it passes through the root zone. However, re-routed water, previously vulnerable to surface loss pathways, may become vulnerable to subsurface loss pathways. Subsurface loss pathways include deep percolation to groundwater, groundwater return flow to surface water, subsurface flow into a tile or ditch drainage system; lateral subsurface outflow, and quick-return subsurface flow. In WLEB, under all three simulated conservation conditions, the amount of water lost to subsurface loss pathways is more than twice the amount of water lost to surface loss pathways (table 3.1). Adoption of conservation practices, as simulated in the 2003-06 and 2012 conservation conditions, increases the disparity in water loss pathways by allowing water previously lost to runoff to infiltrate into the soil. In the no-practice condition, subsurface losses are, on average, 25 percent of all water losses. Subsurface losses in the 2003-06 and 2012 conservation conditions are greater than in the no-practice condition, but are comparable to each other, averaging 28 and 27 percent of all water losses, respectively (table 3.1, appendix C). As would be expected, the increase in subsurface losses noted in the two conservation conditions is accompanied by a decrease in surface losses. In the no-practice condition surface losses average 12 percent of all water losses, while in the 2003-06 and 2012 conservation conditions, surface water losses average 10 and 9 percent of all water losses, respectively (table 3.1). The distributions of simulation results for water losses via the surface loss pathway (fig. 3.2) and subsurface loss pathway (fig.3.3) show the variability in soil vulnerability to these two loss pathways across the region’s variable soil types, cropping systems, and conservation efforts.
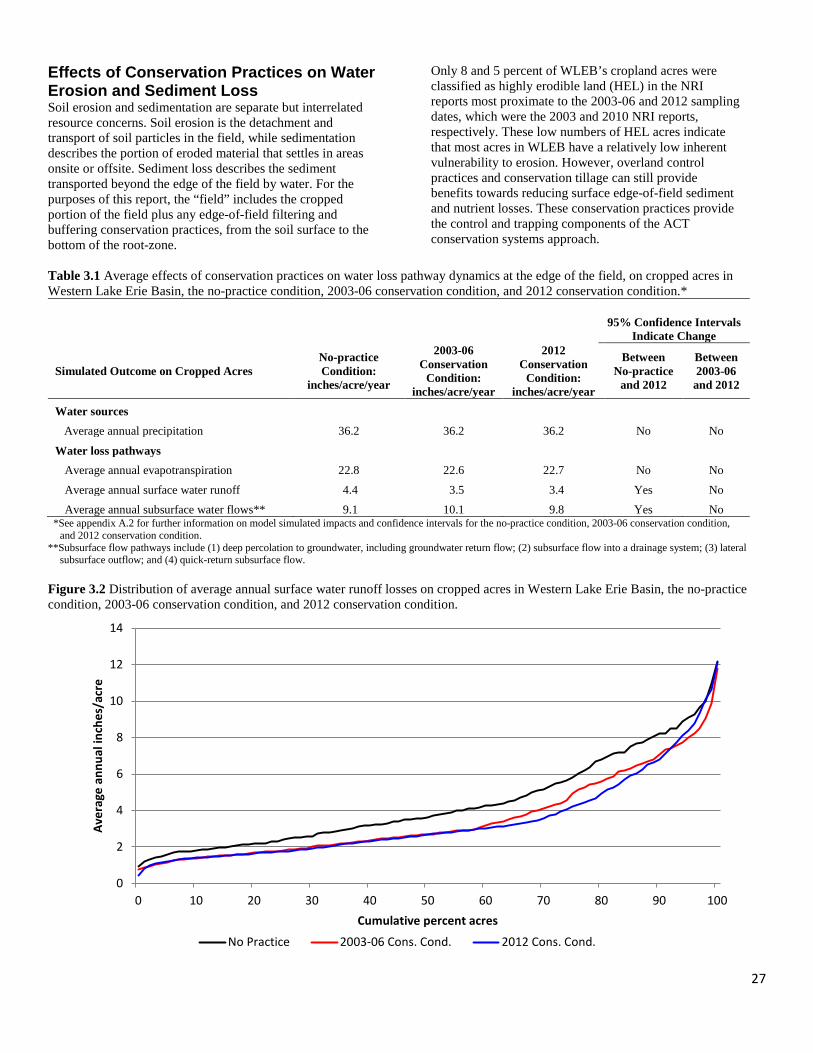
27
Effects of Conservation Practices on Water Erosion and Sediment Loss Soil erosion and sedimentation are separate but interrelated resource concerns. Soil erosion is the detachment and transport of soil particles in the field, while sedimentation describes the portion of eroded material that settles in areas onsite or offsite. Sediment loss describes the sediment transported beyond the edge of the field by water. For the purposes of this report, the “field” includes the cropped portion of the field plus any edge-of-field filtering and buffering conservation practices, from the soil surface to the bottom of the root-zone.
Only 8 and 5 percent of WLEB’s cropland acres were classified as highly erodible land (HEL) in the NRI reports most proximate to the 2003-06 and 2012 sampling dates, which were the 2003 and 2010 NRI reports, respectively. These low numbers of HEL acres indicate that most acres in WLEB have a relatively low inherent vulnerability to erosion. However, overland control practices and conservation tillage can still provide benefits towards reducing surface edge-of-field sediment and nutrient losses. These conservation practices provide the control and trapping components of the ACT conservation systems approach.
Table 3.1 Average effects of conservation practices on water loss pathway dynamics at the edge of the field, on cropped acres in Western Lake Erie Basin, the no-practice condition, 2003-06 conservation condition, and 2012 conservation condition.*
95% Confidence Intervals
Indicate Change
Simulated Outcome on Cropped Acres No-practice Condition:
inches/acre/year
2003-06 Conservation
Condition: inches/acre/year
2012 Conservation
Condition: inches/acre/year
Between No-practice
and 2012
Between 2003-06
and 2012
Water sources
Average annual precipitation 36.2 36.2 36.2 No No
Water loss pathways Average annual evapotranspiration 22.8 22.6 22.7 No No
Average annual surface water runoff 4.4 3.5 3.4 Yes No Average annual subsurface water flows** 9.1 10.1 9.8 Yes No
*See appendix A.2 for further information on model simulated impacts and confidence intervals for the no-practice condition, 2003-06 conservation condition, and 2012 conservation condition.
**Subsurface flow pathways include (1) deep percolation to groundwater, including groundwater return flow; (2) subsurface flow into a drainage system; (3) lateral subsurface outflow; and (4) quick-return subsurface flow.
Figure 3.2 Distribution of average annual surface water runoff losses on cropped acres in Western Lake Erie Basin, the no-practice condition, 2003-06 conservation condition, and 2012 conservation condition.
0
2
4
6
8
10
12
14
0 10 20 30 40 50 60 70 80 90 100
Aver
age
annu
al in
ches
/acr
e
Cumulative percent acres
No Practice 2003-06 Cons. Cond. 2012 Cons. Cond.
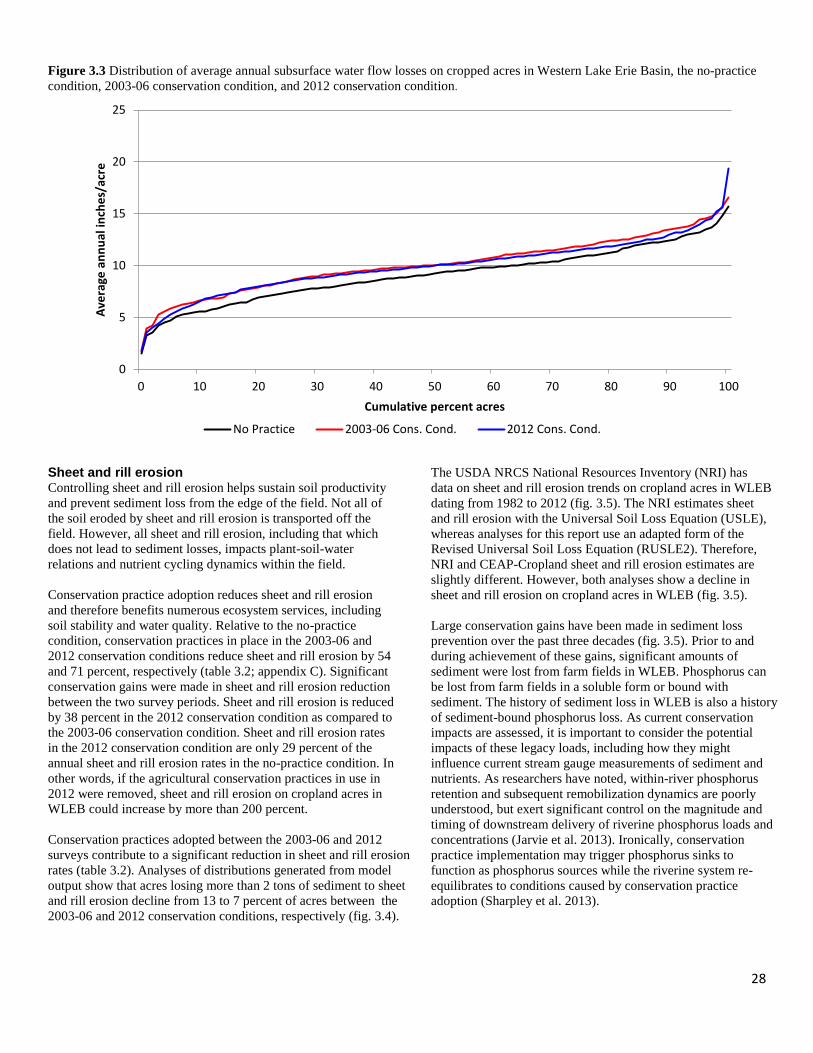
28
Figure 3.3 Distribution of average annual subsurface water flow losses on cropped acres in Western Lake Erie Basin, the no-practice condition, 2003-06 conservation condition, and 2012 conservation condition.
Sheet and rill erosion Controlling sheet and rill erosion helps sustain soil productivity and prevent sediment loss from the edge of the field. Not all of the soil eroded by sheet and rill erosion is transported off the field. However, all sheet and rill erosion, including that which does not lead to sediment losses, impacts plant-soil-water relations and nutrient cycling dynamics within the field. Conservation practice adoption reduces sheet and rill erosion and therefore benefits numerous ecosystem services, including soil stability and water quality. Relative to the no-practice condition, conservation practices in place in the 2003-06 and 2012 conservation conditions reduce sheet and rill erosion by 54 and 71 percent, respectively (table 3.2; appendix C). Significant conservation gains were made in sheet and rill erosion reduction between the two survey periods. Sheet and rill erosion is reduced by 38 percent in the 2012 conservation condition as compared to the 2003-06 conservation condition. Sheet and rill erosion rates in the 2012 conservation condition are only 29 percent of the annual sheet and rill erosion rates in the no-practice condition. In other words, if the agricultural conservation practices in use in 2012 were removed, sheet and rill erosion on cropland acres in WLEB could increase by more than 200 percent. Conservation practices adopted between the 2003-06 and 2012 surveys contribute to a significant reduction in sheet and rill erosion rates (table 3.2). Analyses of distributions generated from model output show that acres losing more than 2 tons of sediment to sheet and rill erosion decline from 13 to 7 percent of acres between the 2003-06 and 2012 conservation conditions, respectively (fig. 3.4).
The USDA NRCS National Resources Inventory (NRI) has data on sheet and rill erosion trends on cropland acres in WLEB dating from 1982 to 2012 (fig. 3.5). The NRI estimates sheet and rill erosion with the Universal Soil Loss Equation (USLE), whereas analyses for this report use an adapted form of the Revised Universal Soil Loss Equation (RUSLE2). Therefore, NRI and CEAP-Cropland sheet and rill erosion estimates are slightly different. However, both analyses show a decline in sheet and rill erosion on cropland acres in WLEB (fig. 3.5). Large conservation gains have been made in sediment loss prevention over the past three decades (fig. 3.5). Prior to and during achievement of these gains, significant amounts of sediment were lost from farm fields in WLEB. Phosphorus can be lost from farm fields in a soluble form or bound with sediment. The history of sediment loss in WLEB is also a history of sediment-bound phosphorus loss. As current conservation impacts are assessed, it is important to consider the potential impacts of these legacy loads, including how they might influence current stream gauge measurements of sediment and nutrients. As researchers have noted, within-river phosphorus retention and subsequent remobilization dynamics are poorly understood, but exert significant control on the magnitude and timing of downstream delivery of riverine phosphorus loads and concentrations (Jarvie et al. 2013). Ironically, conservation practice implementation may trigger phosphorus sinks to function as phosphorus sources while the riverine system re-equilibrates to conditions caused by conservation practice adoption (Sharpley et al. 2013).
0
5
10
15
20
25
0 10 20 30 40 50 60 70 80 90 100
Aver
age
annu
al in
ches
/acr
e
Cumulative percent acres
No Practice 2003-06 Cons. Cond. 2012 Cons. Cond.
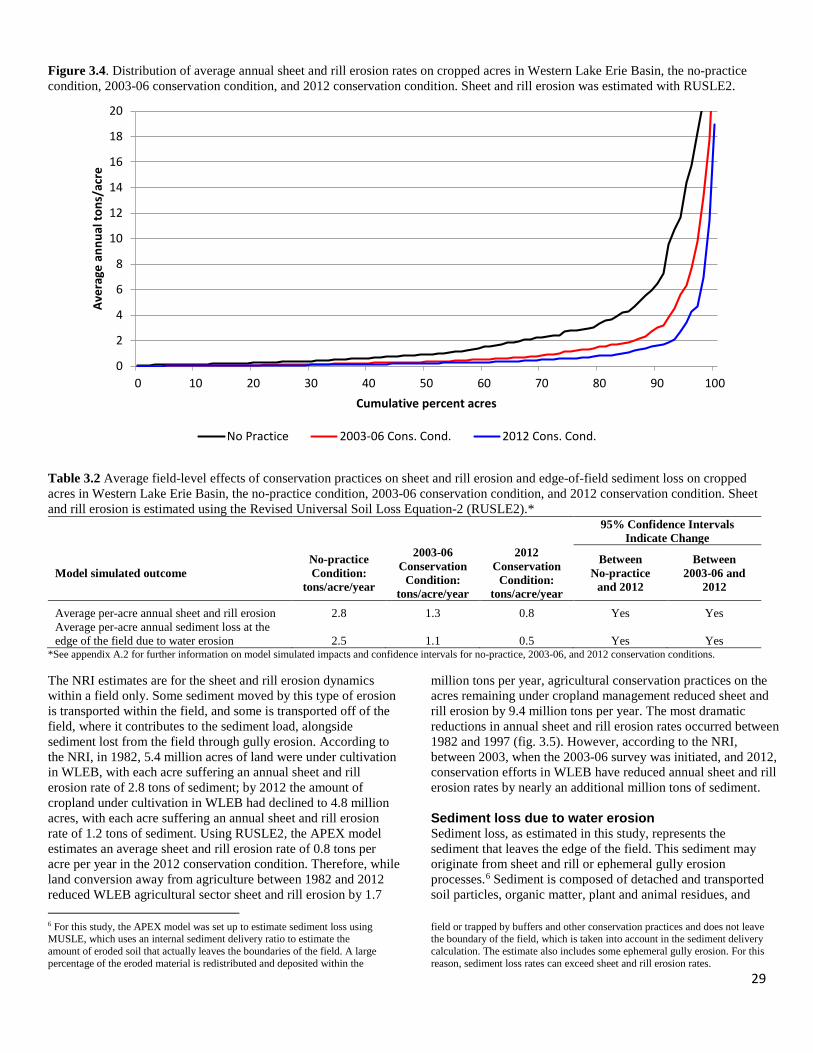
29
Figure 3.4. Distribution of average annual sheet and rill erosion rates on cropped acres in Western Lake Erie Basin, the no-practice condition, 2003-06 conservation condition, and 2012 conservation condition. Sheet and rill erosion was estimated with RUSLE2.
Table 3.2 Average field-level effects of conservation practices on sheet and rill erosion and edge-of-field sediment loss on cropped acres in Western Lake Erie Basin, the no-practice condition, 2003-06 conservation condition, and 2012 conservation condition. Sheet and rill erosion is estimated using the Revised Universal Soil Loss Equation-2 (RUSLE2).*
95% Confidence Intervals Indicate Change
Model simulated outcome No-practice Condition:
tons/acre/year
2003-06 Conservation
Condition: tons/acre/year
2012 Conservation
Condition: tons/acre/year
Between No-practice
and 2012
Between 2003-06 and
2012
Average per-acre annual sheet and rill erosion 2.8 1.3 0.8 Yes Yes Average per-acre annual sediment loss at the edge of the field due to water erosion 2.5 1.1 0.5 Yes Yes
*See appendix A.2 for further information on model simulated impacts and confidence intervals for no-practice, 2003-06, and 2012 conservation conditions. The NRI estimates are for the sheet and rill erosion dynamics within a field only. Some sediment moved by this type of erosion is transported within the field, and some is transported off of the field, where it contributes to the sediment load, alongside sediment lost from the field through gully erosion. According to the NRI, in 1982, 5.4 million acres of land were under cultivation in WLEB, with each acre suffering an annual sheet and rill erosion rate of 2.8 tons of sediment; by 2012 the amount of cropland under cultivation in WLEB had declined to 4.8 million acres, with each acre suffering an annual sheet and rill erosion rate of 1.2 tons of sediment. Using RUSLE2, the APEX model estimates an average sheet and rill erosion rate of 0.8 tons per acre per year in the 2012 conservation condition. Therefore, while land conversion away from agriculture between 1982 and 2012 reduced WLEB agricultural sector sheet and rill erosion by 1.7 6 For this study, the APEX model was set up to estimate sediment loss using MUSLE, which uses an internal sediment delivery ratio to estimate the amount of eroded soil that actually leaves the boundaries of the field. A large percentage of the eroded material is redistributed and deposited within the
million tons per year, agricultural conservation practices on the acres remaining under cropland management reduced sheet and rill erosion by 9.4 million tons per year. The most dramatic reductions in annual sheet and rill erosion rates occurred between 1982 and 1997 (fig. 3.5). However, according to the NRI, between 2003, when the 2003-06 survey was initiated, and 2012, conservation efforts in WLEB have reduced annual sheet and rill erosion rates by nearly an additional million tons of sediment. Sediment loss due to water erosion Sediment loss, as estimated in this study, represents the sediment that leaves the edge of the field. This sediment may originate from sheet and rill or ephemeral gully erosion processes.6 Sediment is composed of detached and transported soil particles, organic matter, plant and animal residues, and
field or trapped by buffers and other conservation practices and does not leave the boundary of the field, which is taken into account in the sediment delivery calculation. The estimate also includes some ephemeral gully erosion. For this reason, sediment loss rates can exceed sheet and rill erosion rates.
0
2
4
6
8
10
12
14
16
18
20
0 10 20 30 40 50 60 70 80 90 100
Aver
age
annu
al to
ns/a
cre
Cumulative percent acres
No Practice 2003-06 Cons. Cond. 2012 Cons. Cond.
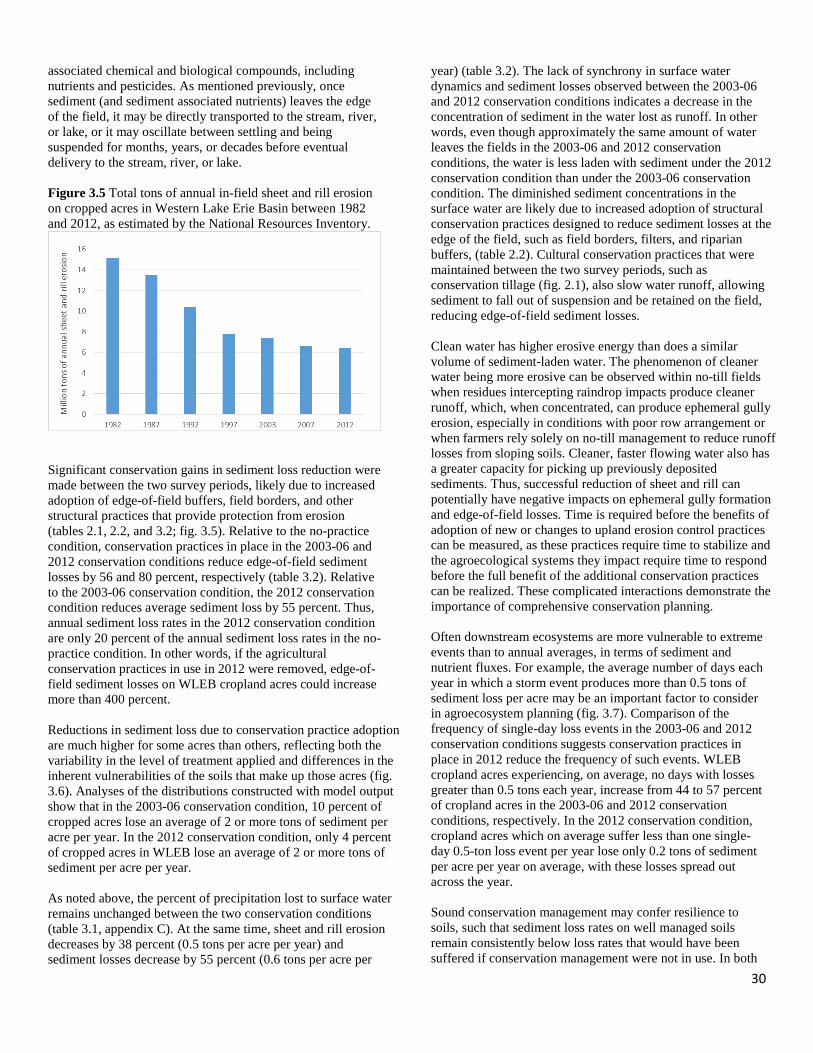
30
associated chemical and biological compounds, including nutrients and pesticides. As mentioned previously, once sediment (and sediment associated nutrients) leaves the edge of the field, it may be directly transported to the stream, river, or lake, or it may oscillate between settling and being suspended for months, years, or decades before eventual delivery to the stream, river, or lake. Figure 3.5 Total tons of annual in-field sheet and rill erosion on cropped acres in Western Lake Erie Basin between 1982 and 2012, as estimated by the National Resources Inventory.
Significant conservation gains in sediment loss reduction were made between the two survey periods, likely due to increased adoption of edge-of-field buffers, field borders, and other structural practices that provide protection from erosion (tables 2.1, 2.2, and 3.2; fig. 3.5). Relative to the no-practice condition, conservation practices in place in the 2003-06 and 2012 conservation conditions reduce edge-of-field sediment losses by 56 and 80 percent, respectively (table 3.2). Relative to the 2003-06 conservation condition, the 2012 conservation condition reduces average sediment loss by 55 percent. Thus, annual sediment loss rates in the 2012 conservation condition are only 20 percent of the annual sediment loss rates in the no-practice condition. In other words, if the agricultural conservation practices in use in 2012 were removed, edge-of-field sediment losses on WLEB cropland acres could increase more than 400 percent. Reductions in sediment loss due to conservation practice adoption are much higher for some acres than others, reflecting both the variability in the level of treatment applied and differences in the inherent vulnerabilities of the soils that make up those acres (fig. 3.6). Analyses of the distributions constructed with model output show that in the 2003-06 conservation condition, 10 percent of cropped acres lose an average of 2 or more tons of sediment per acre per year. In the 2012 conservation condition, only 4 percent of cropped acres in WLEB lose an average of 2 or more tons of sediment per acre per year. As noted above, the percent of precipitation lost to surface water remains unchanged between the two conservation conditions (table 3.1, appendix C). At the same time, sheet and rill erosion decreases by 38 percent (0.5 tons per acre per year) and sediment losses decrease by 55 percent (0.6 tons per acre per
year) (table 3.2). The lack of synchrony in surface water dynamics and sediment losses observed between the 2003-06 and 2012 conservation conditions indicates a decrease in the concentration of sediment in the water lost as runoff. In other words, even though approximately the same amount of water leaves the fields in the 2003-06 and 2012 conservation conditions, the water is less laden with sediment under the 2012 conservation condition than under the 2003-06 conservation condition. The diminished sediment concentrations in the surface water are likely due to increased adoption of structural conservation practices designed to reduce sediment losses at the edge of the field, such as field borders, filters, and riparian buffers, (table 2.2). Cultural conservation practices that were maintained between the two survey periods, such as conservation tillage (fig. 2.1), also slow water runoff, allowing sediment to fall out of suspension and be retained on the field, reducing edge-of-field sediment losses. Clean water has higher erosive energy than does a similar volume of sediment-laden water. The phenomenon of cleaner water being more erosive can be observed within no-till fields when residues intercepting raindrop impacts produce cleaner runoff, which, when concentrated, can produce ephemeral gully erosion, especially in conditions with poor row arrangement or when farmers rely solely on no-till management to reduce runoff losses from sloping soils. Cleaner, faster flowing water also has a greater capacity for picking up previously deposited sediments. Thus, successful reduction of sheet and rill can potentially have negative impacts on ephemeral gully formation and edge-of-field losses. Time is required before the benefits of adoption of new or changes to upland erosion control practices can be measured, as these practices require time to stabilize and the agroecological systems they impact require time to respond before the full benefit of the additional conservation practices can be realized. These complicated interactions demonstrate the importance of comprehensive conservation planning. Often downstream ecosystems are more vulnerable to extreme events than to annual averages, in terms of sediment and nutrient fluxes. For example, the average number of days each year in which a storm event produces more than 0.5 tons of sediment loss per acre may be an important factor to consider in agroecosystem planning (fig. 3.7). Comparison of the frequency of single-day loss events in the 2003-06 and 2012 conservation conditions suggests conservation practices in place in 2012 reduce the frequency of such events. WLEB cropland acres experiencing, on average, no days with losses greater than 0.5 tons each year, increase from 44 to 57 percent of cropland acres in the 2003-06 and 2012 conservation conditions, respectively. In the 2012 conservation condition, cropland acres which on average suffer less than one single-day 0.5-ton loss event per year lose only 0.2 tons of sediment per acre per year on average, with these losses spread out across the year. Sound conservation management may confer resilience to soils, such that sediment loss rates on well managed soils remain consistently below loss rates that would have been suffered if conservation management were not in use. In both
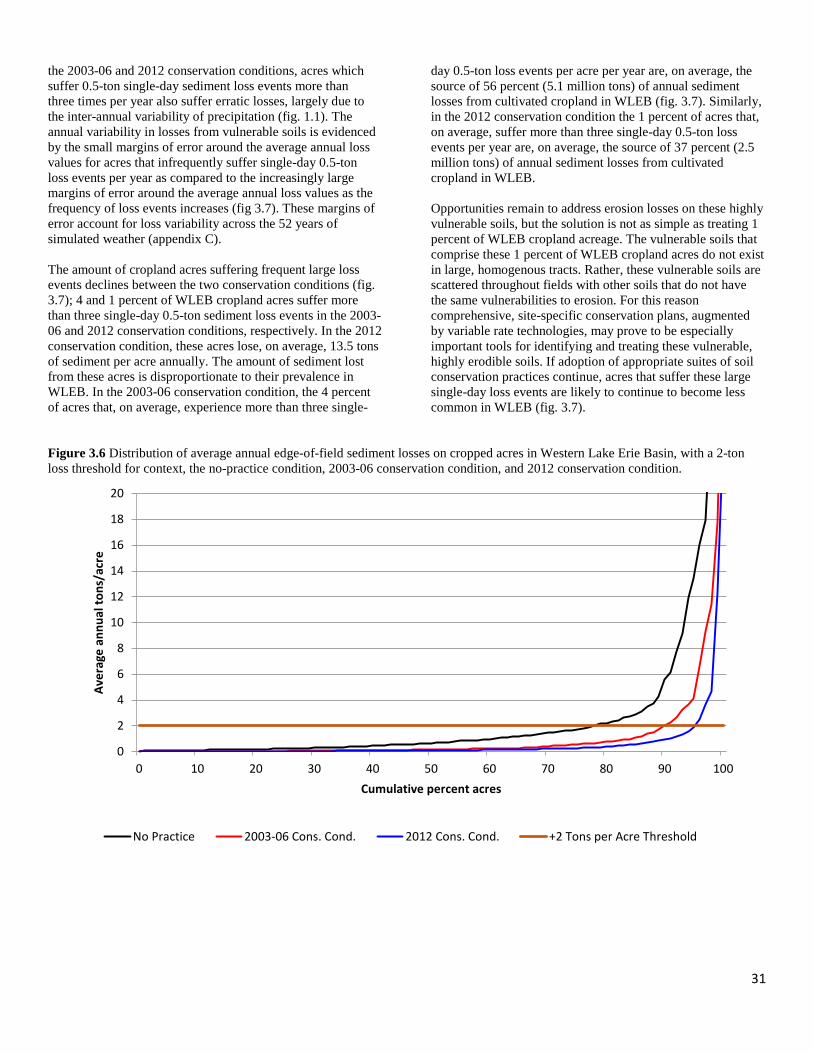
31
the 2003-06 and 2012 conservation conditions, acres which suffer 0.5-ton single-day sediment loss events more than three times per year also suffer erratic losses, largely due to the inter-annual variability of precipitation (fig. 1.1). The annual variability in losses from vulnerable soils is evidenced by the small margins of error around the average annual loss values for acres that infrequently suffer single-day 0.5-ton loss events per year as compared to the increasingly large margins of error around the average annual loss values as the frequency of loss events increases (fig 3.7). These margins of error account for loss variability across the 52 years of simulated weather (appendix C). The amount of cropland acres suffering frequent large loss events declines between the two conservation conditions (fig. 3.7); 4 and 1 percent of WLEB cropland acres suffer more than three single-day 0.5-ton sediment loss events in the 2003-06 and 2012 conservation conditions, respectively. In the 2012 conservation condition, these acres lose, on average, 13.5 tons of sediment per acre annually. The amount of sediment lost from these acres is disproportionate to their prevalence in WLEB. In the 2003-06 conservation condition, the 4 percent of acres that, on average, experience more than three single-
day 0.5-ton loss events per acre per year are, on average, the source of 56 percent (5.1 million tons) of annual sediment losses from cultivated cropland in WLEB (fig. 3.7). Similarly, in the 2012 conservation condition the 1 percent of acres that, on average, suffer more than three single-day 0.5-ton loss events per year are, on average, the source of 37 percent (2.5 million tons) of annual sediment losses from cultivated cropland in WLEB. Opportunities remain to address erosion losses on these highly vulnerable soils, but the solution is not as simple as treating 1 percent of WLEB cropland acreage. The vulnerable soils that comprise these 1 percent of WLEB cropland acres do not exist in large, homogenous tracts. Rather, these vulnerable soils are scattered throughout fields with other soils that do not have the same vulnerabilities to erosion. For this reason comprehensive, site-specific conservation plans, augmented by variable rate technologies, may prove to be especially important tools for identifying and treating these vulnerable, highly erodible soils. If adoption of appropriate suites of soil conservation practices continue, acres that suffer these large single-day loss events are likely to continue to become less common in WLEB (fig. 3.7).
Figure 3.6 Distribution of average annual edge-of-field sediment losses on cropped acres in Western Lake Erie Basin, with a 2-ton loss threshold for context, the no-practice condition, 2003-06 conservation condition, and 2012 conservation condition.
0
2
4
6
8
10
12
14
16
18
20
0 10 20 30 40 50 60 70 80 90 100
Aver
age
annu
al to
ns/a
cre
Cumulative percent acres
No Practice 2003-06 Cons. Cond. 2012 Cons. Cond. +2 Tons per Acre Threshold
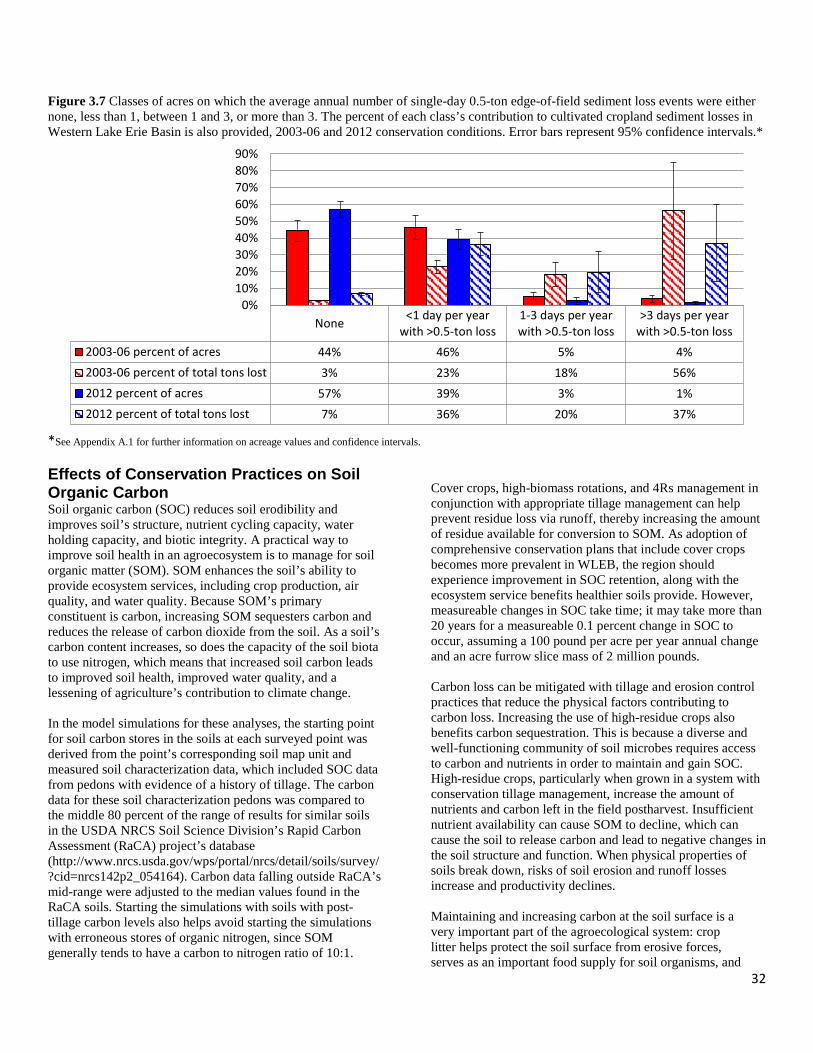
32
Figure 3.7 Classes of acres on which the average annual number of single-day 0.5-ton edge-of-field sediment loss events were either none, less than 1, between 1 and 3, or more than 3. The percent of each class’s contribution to cultivated cropland sediment losses in Western Lake Erie Basin is also provided, 2003-06 and 2012 conservation conditions. Error bars represent 95% confidence intervals.*
*See Appendix A.1 for further information on acreage values and confidence intervals.
Effects of Conservation Practices on Soil Organic Carbon Soil organic carbon (SOC) reduces soil erodibility and improves soil’s structure, nutrient cycling capacity, water holding capacity, and biotic integrity. A practical way to improve soil health in an agroecosystem is to manage for soil organic matter (SOM). SOM enhances the soil’s ability to provide ecosystem services, including crop production, air quality, and water quality. Because SOM’s primary constituent is carbon, increasing SOM sequesters carbon and reduces the release of carbon dioxide from the soil. As a soil’s carbon content increases, so does the capacity of the soil biota to use nitrogen, which means that increased soil carbon leads to improved soil health, improved water quality, and a lessening of agriculture’s contribution to climate change. In the model simulations for these analyses, the starting point for soil carbon stores in the soils at each surveyed point was derived from the point’s corresponding soil map unit and measured soil characterization data, which included SOC data from pedons with evidence of a history of tillage. The carbon data for these soil characterization pedons was compared to the middle 80 percent of the range of results for similar soils in the USDA NRCS Soil Science Division’s Rapid Carbon Assessment (RaCA) project’s database (http://www.nrcs.usda.gov/wps/portal/nrcs/detail/soils/survey/?cid=nrcs142p2_054164). Carbon data falling outside RaCA’s mid-range were adjusted to the median values found in the RaCA soils. Starting the simulations with soils with post-tillage carbon levels also helps avoid starting the simulations with erroneous stores of organic nitrogen, since SOM generally tends to have a carbon to nitrogen ratio of 10:1.
Cover crops, high-biomass rotations, and 4Rs management in conjunction with appropriate tillage management can help prevent residue loss via runoff, thereby increasing the amount of residue available for conversion to SOM. As adoption of comprehensive conservation plans that include cover crops becomes more prevalent in WLEB, the region should experience improvement in SOC retention, along with the ecosystem service benefits healthier soils provide. However, measureable changes in SOC take time; it may take more than 20 years for a measureable 0.1 percent change in SOC to occur, assuming a 100 pound per acre per year annual change and an acre furrow slice mass of 2 million pounds. Carbon loss can be mitigated with tillage and erosion control practices that reduce the physical factors contributing to carbon loss. Increasing the use of high-residue crops also benefits carbon sequestration. This is because a diverse and well-functioning community of soil microbes requires access to carbon and nutrients in order to maintain and gain SOC. High-residue crops, particularly when grown in a system with conservation tillage management, increase the amount of nutrients and carbon left in the field postharvest. Insufficient nutrient availability can cause SOM to decline, which can cause the soil to release carbon and lead to negative changes in the soil structure and function. When physical properties of soils break down, risks of soil erosion and runoff losses increase and productivity declines. Maintaining and increasing carbon at the soil surface is a very important part of the agroecological system: crop litter helps protect the soil surface from erosive forces, serves as an important food supply for soil organisms, and
None <1 day per yearwith >0.5-ton loss
1-3 days per yearwith >0.5-ton loss
>3 days per yearwith >0.5-ton loss
2003-06 percent of acres 44% 46% 5% 4%2003-06 percent of total tons lost 3% 23% 18% 56%2012 percent of acres 57% 39% 3% 1%2012 percent of total tons lost 7% 36% 20% 37%
0%10%20%30%40%50%60%70%80%90%
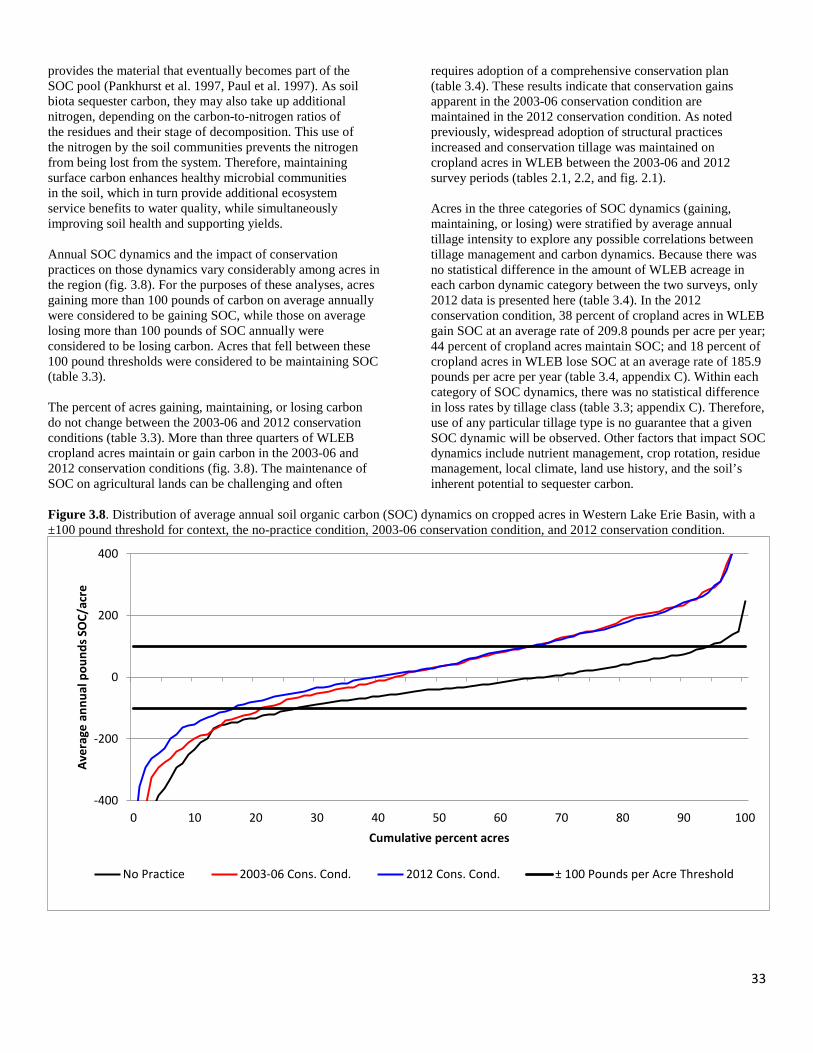
33
provides the material that eventually becomes part of the SOC pool (Pankhurst et al. 1997, Paul et al. 1997). As soil biota sequester carbon, they may also take up additional nitrogen, depending on the carbon-to-nitrogen ratios of the residues and their stage of decomposition. This use of the nitrogen by the soil communities prevents the nitrogen from being lost from the system. Therefore, maintaining surface carbon enhances healthy microbial communities in the soil, which in turn provide additional ecosystem service benefits to water quality, while simultaneously improving soil health and supporting yields. Annual SOC dynamics and the impact of conservation practices on those dynamics vary considerably among acres in the region (fig. 3.8). For the purposes of these analyses, acres gaining more than 100 pounds of carbon on average annually were considered to be gaining SOC, while those on average losing more than 100 pounds of SOC annually were considered to be losing carbon. Acres that fell between these 100 pound thresholds were considered to be maintaining SOC (table 3.3). The percent of acres gaining, maintaining, or losing carbon do not change between the 2003-06 and 2012 conservation conditions (table 3.3). More than three quarters of WLEB cropland acres maintain or gain carbon in the 2003-06 and 2012 conservation conditions (fig. 3.8). The maintenance of SOC on agricultural lands can be challenging and often
requires adoption of a comprehensive conservation plan (table 3.4). These results indicate that conservation gains apparent in the 2003-06 conservation condition are maintained in the 2012 conservation condition. As noted previously, widespread adoption of structural practices increased and conservation tillage was maintained on cropland acres in WLEB between the 2003-06 and 2012 survey periods (tables 2.1, 2.2, and fig. 2.1). Acres in the three categories of SOC dynamics (gaining, maintaining, or losing) were stratified by average annual tillage intensity to explore any possible correlations between tillage management and carbon dynamics. Because there was no statistical difference in the amount of WLEB acreage in each carbon dynamic category between the two surveys, only 2012 data is presented here (table 3.4). In the 2012 conservation condition, 38 percent of cropland acres in WLEB gain SOC at an average rate of 209.8 pounds per acre per year; 44 percent of cropland acres maintain SOC; and 18 percent of cropland acres in WLEB lose SOC at an average rate of 185.9 pounds per acre per year (table 3.4, appendix C). Within each category of SOC dynamics, there was no statistical difference in loss rates by tillage class (table 3.3; appendix C). Therefore, use of any particular tillage type is no guarantee that a given SOC dynamic will be observed. Other factors that impact SOC dynamics include nutrient management, crop rotation, residue management, local climate, land use history, and the soil’s inherent potential to sequester carbon.
Figure 3.8. Distribution of average annual soil organic carbon (SOC) dynamics on cropped acres in Western Lake Erie Basin, with a ±100 pound threshold for context, the no-practice condition, 2003-06 conservation condition, and 2012 conservation condition.
-400
-200
0
200
400
0 10 20 30 40 50 60 70 80 90 100
Aver
age
annu
al p
ound
s SO
C/ac
re
Cumulative percent acres
No Practice 2003-06 Cons. Cond. 2012 Cons. Cond. ± 100 Pounds per Acre Threshold
34
Table 3.3 Average annual soil organic carbon dynamics on cropland acres in Western Lake Erie Basin, 2003-06 and 2012 conservation conditions. On average, “gaining” acres gain more than 100 pounds of carbon per acre per year; “maintaining” acres gain or lose less than 100 pounds of carbon per acre per year; and “losing” acres lose more than 100 pounds of carbon per acre per year.*
Carbon Dynamic 2003-06 Conservation Condition: Percent of
Cropped Acres
2012 Conservation Condition: Percent of
Cropped Acres
95% Confidence Intervals Indicate Change
Acres gaining soil organic carbon 38 38 No Acres maintaining soil organic carbon 38 44 No Acres losing soil organic carbon 24 18 No
*See appendix A.1 for further information on acreage values and confidence intervals. Table 3.4 Relationship between soil organic carbon dynamics and residue and tillage management practices in Western Lake Erie Basin, 2012 conservation condition. On average, “gaining” acres gain more than 100 pounds of carbon per acre per year, “maintaining” acres gain or lose less than 100 pounds of carbon per acre per year, and “losing” acres lose more than 100 pounds of carbon per acre per year.*
2012 Conservation Condition Carbon Dynamic Category and Tillage Management Class
Average Annual STIR Value** Cropped Acres (percent) Average Soil Carbon
change (pounds/acre/year) Acres Gaining Soil Organic Carbon 38 209.8
Continuous no-till acres <20 11 227.3 Seasonal no-till acres 12 205.6 Mulch till acres 20-80 4 211.2 Seasonal conventional till acres 9 191.2 Continuous conventional till acres >80 2 215.3
Acres Maintaining Soil Organic Carbon 44 1.1
Continuous no-till acres <20 9 -2.9 Seasonal no-till acres 12 6.3 Mulch till acres 20-80 6 -7.1 Seasonal conventional till acres 14 6.2 Continuous conventional till acres >80 3 -16.3
Acres Losing Soil Organic Carbon 18 -185.9
Continuous no-till acres <20 4 -187.9 Seasonal no-till acres 4 -208.7 Mulch till acres 20-80 1 -161.0 Seasonal conventional till acres 8 -172.2 Continuous conventional till acres >80 2 -205.8
*See appendix A.3 for further information on acre estimates and confidence intervals. See appendix A.3 for further information on 2012 model impacts with confidence intervals.
**Average annual soil tillage intensity rating (STIR) over all crop years in the rotation. See appendix B for information on STIR rating calculations. A description of STIR can be found at http://stir.nrcs.usda.gov/.
Increased nutrient application rates do not necessarily lead to increased nutrient loss rates and reducing nutrient application rates will not necessarily lead to reductions in nutrient losses. There are many other factors to consider when developing a nutrient application management plan. Analyses of the relationship between nitrogen application rates, nitrogen loss rates, and carbon dynamics reveal interesting correlations (fig. 3.9). Again, because there was no statistical difference in the amount of WLEB acreage in each carbon dynamic category between the two surveys, only 2012 data is presented here. In the 2012 conservation condition, acres gaining carbon receive, on average, 28.5 pounds more nitrogen per year than do acres maintaining carbon; acres gaining or maintaining carbon lose the same amount of total nitrogen, 26.1 and 26.2 pounds nitrogen per acre per year, respectively. However, acres gaining carbon
lose only 28 percent of applied nitrogen, while acres maintaining carbon lose 40 percent of applied nitrogen (fig. 3.9). Analyses of the relationship between phosphorus application rates, phosphorus loss rates, and carbon dynamics in the 2012 conservation condition simulations reveal relationships similar to those observed for nitrogen. Higher phosphorus application rates are correlated with positive carbon trends; on average, acres gaining carbon receive 7.4 pounds more phosphorus per acre per year than do acres maintaining carbon (fig. 3.10). There are also some differences between nitrogen and phosphorus in their relationship to carbon dynamics. In the 2012 conservation condition, total phosphorus loss is higher on acres gaining carbon than on acres maintaining carbon, at 2.0 and 1.5 pounds phosphorus per acre per year, respectively. However, similar to trends
35
observed for nitrogen, acres gaining carbon lose a smaller percent of the phosphorus applied (9 percent) as compared to acres maintaining carbon, which lose a larger percent of the phosphorus applied (11 percent). Subsurface nitrogen and soluble phosphorus losses related to carbon gain dynamics do not mirror those of total nitrogen and total phosphorus losses (figs. 3.9 and 3.10). In the 2012 conservation condition, subsurface nitrogen losses are statistically the same for acres gaining carbon, maintaining carbon, and losing carbon, at 23.6, 22.3, and 22.1 pounds, respectively, of soluble nitrogen per acre per year. However, the percent of total nitrogen lost via subsurface loss pathways is higher on acres gaining carbon (90 percent) than on acres maintaining carbon (85 percent) or losing carbon (67 percent) in the 2012 conservation condition. Soluble phosphorus loss dynamics follow the same trend, except that more phosphorus is lost as soluble phosphorus from acres gaining carbon (1.8 pounds phosphorus per acre per year) than is lost from acres maintaining carbon (1.1 pounds phosphorus per acre per year) or losing carbon (1.0 pounds phosphorus per acre per year). As with subsurface nitrogen losses, the percent of total phosphorus lost as soluble phosphorus is higher on acres gaining carbon (90 percent) than on acres maintaining carbon (73 percent) or losing carbon (40 percent) (fig. 3.10). In the 2012 conservation condition, acres gaining carbon have lower sediment loss rates (0.1 tons per acre per year) than do acres maintaining carbon (0.3 tons per acre per year) or acres losing carbon (1.9 tons per acre per year) (table 3.5). It is likely that acres gaining carbon have conservation practices in place that prevent runoff and erosion losses, which may over time lead to rerouting nutrients to subsurface loss pathways. Careful conservation planning is needed to further reduce subsurface nitrogen and soluble phosphorus losses on acres that have achieved surface loss reductions. The relationship between nutrient application rate and carbon dynamics is also influenced by the crops being grown in rotation (table 3.6). For example, soybeans tend to be managed with low or no nitrogen application and produce small amounts of residue. Therefore, soybeans do not promote carbon sequestration as much as do high biomass crops, which require higher nutrient inputs and produce more residue. In the 2012 conservation condition, 96 percent of the soils gaining carbon have corn in the rotation, though most carbon-gaining acres (93 percent) also have soybeans in rotation. In contrast, only 54 percent of acres losing carbon have corn in the rotation. Ninety-three percent of
the acres losing carbon have soybeans, a low-residue producing crop, as their dominant crop in the rotation. In the 2012 conservation condition, corn and soybean yields on soils gaining carbon were on average 9 percent (15 more bushels of corn per acre) and 12 percent (5 more bushels soybeans per acre) higher than were yields on soils maintaining carbon. Soils losing carbon are associated with the lowest yields; compared to carbon-gaining soils, carbon-losing soils produce only 86 percent of the corn yield (25 fewer bushels per acre) and only 80 percent of the soybean yield (9 fewer bushels per acre). In WLEB, the use of high-biomass crops in rotation may enable some acres to gain carbon even under conventional tillage due to the increased cation exchange capacity of the predominantly clayey soils. Inclusion of more corn than soybeans in a rotation, for example, may provide enough residue to enable the soil to maintain or gain carbon. Inclusion of high biomass crops should be considered as part of a comprehensive conservation plan, as it is a management tool that may improve soil health, stability, and structure, enabling soil to provide increased ecosystem services. Tillage management is another powerful conservation tool to consider in conjunction with crop rotation when managing for SOC and its associated benefits. In the 2012 conservation condition, only 19 percent of continuous no-till acres that lose SOC include corn as part of the rotation, while 92 percent of continuous no-till acres that lose SOC include soybeans in the rotation. On continuous no-till acres that maintain carbon in the 2012 conservation condition, 56 percent have corn in the rotation. On continuous no-till acres that gain carbon, 92 percent include corn in the rotation. In both the 2003-06 and 2012 conservation conditions, carbon-gaining acres have more nutrients applied to them, are managed with rotations that incorporate a higher percentage of high-residue crops, and lose a smaller percentage of nutrients applied than do carbon-losing acres. Acres gaining carbon have healthy soil communities that provide numerous ecosystem services, including resilient crop yields, nutrient retention, and promotion of water and air quality. Acres losing carbon tend to have less healthy soils, lower yields, and less corn (a high-residue crop) in their rotations (table 3.6). Comprehensive conservation plans can address nutrient concerns and carbon dynamics with a number of approaches, such as incorporation of high-residue crops into the rotation, adoption of cover crops to use the nitrogen released by soybean root nodules upon decomposition, and appropriate tillage management.
Table 3.5 Relationship between soil organic carbon dynamics and sediment loss rates from cultivated cropland acres in the Western Lake Erie Basin, 2012 conservation condition. On average, “gaining” acres gain more than 100 pounds of carbon per acre per year; “maintaining” acres gain or lose less than 100 pounds of carbon per acre per year; and “losing” acres lose more than 100 pounds of carbon per acre per year.*
Carbon Dynamic 2012 Conservation Condition: Sediment Loss (tons/acre/year) Acres gaining soil organic carbon 0.1 Acres maintaining soil organic carbon 0.3 Acres losing soil organic carbon 1.9
*See appendix A.3 for further information on 2012 model impacts and confidence intervals.
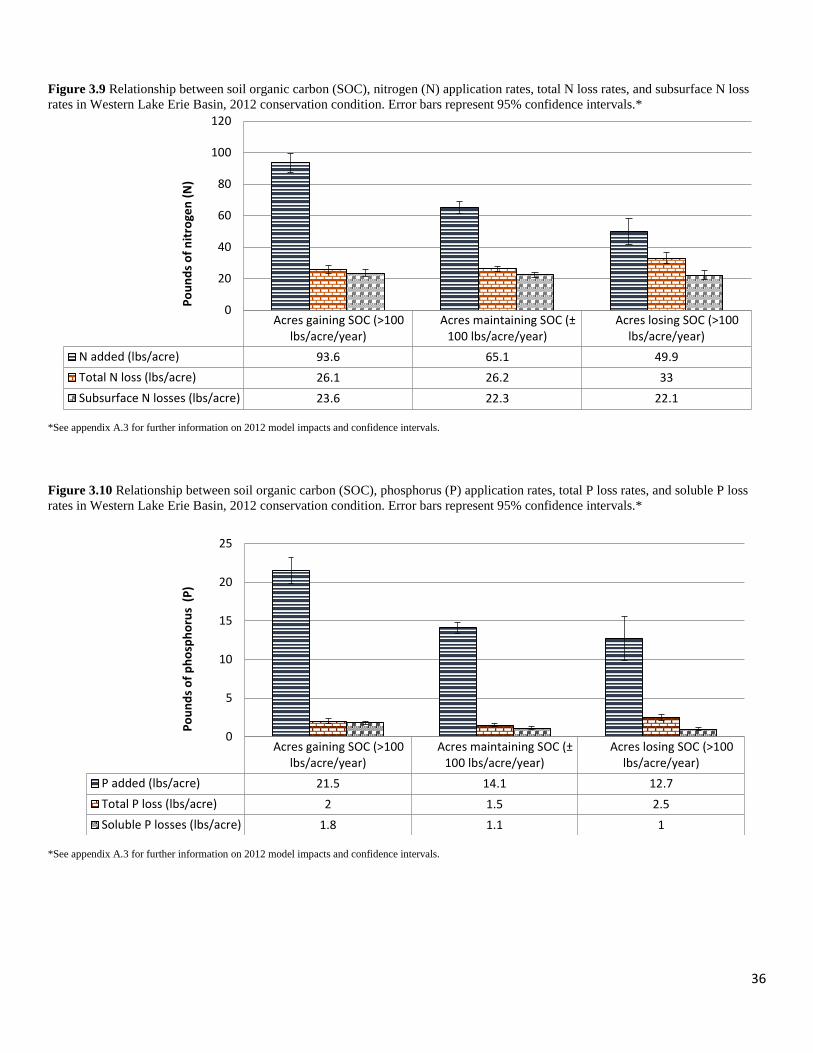
36
Figure 3.9 Relationship between soil organic carbon (SOC), nitrogen (N) application rates, total N loss rates, and subsurface N loss rates in Western Lake Erie Basin, 2012 conservation condition. Error bars represent 95% confidence intervals.*
*See appendix A.3 for further information on 2012 model impacts and confidence intervals. Figure 3.10 Relationship between soil organic carbon (SOC), phosphorus (P) application rates, total P loss rates, and soluble P loss rates in Western Lake Erie Basin, 2012 conservation condition. Error bars represent 95% confidence intervals.*
*See appendix A.3 for further information on 2012 model impacts and confidence intervals.
Acres gaining SOC (>100lbs/acre/year)
Acres maintaining SOC (±100 lbs/acre/year)
Acres losing SOC (>100lbs/acre/year)
N added (lbs/acre) 93.6 65.1 49.9Total N loss (lbs/acre) 26.1 26.2 33Subsurface N losses (lbs/acre) 23.6 22.3 22.1
0
20
40
60
80
100
120
Poun
ds o
f nitr
ogen
(N)
Acres gaining SOC (>100lbs/acre/year)
Acres maintaining SOC (±100 lbs/acre/year)
Acres losing SOC (>100lbs/acre/year)
P added (lbs/acre) 21.5 14.1 12.7Total P loss (lbs/acre) 2 1.5 2.5Soluble P losses (lbs/acre) 1.8 1.1 1
0
5
10
15
20
25
Poun
ds o
f pho
spho
rus
(P)
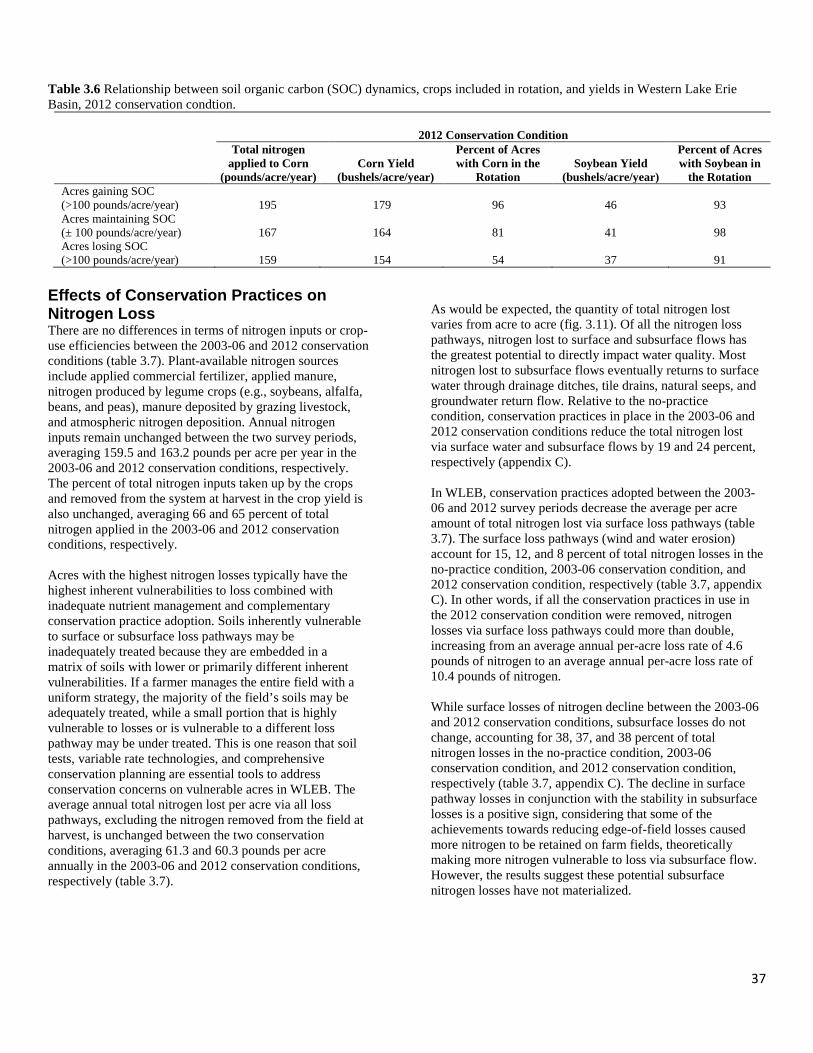
37
Table 3.6 Relationship between soil organic carbon (SOC) dynamics, crops included in rotation, and yields in Western Lake Erie Basin, 2012 conservation condtion.
2012 Conservation Condition
Total nitrogen
applied to Corn (pounds/acre/year)
Corn Yield (bushels/acre/year)
Percent of Acres with Corn in the
Rotation Soybean Yield
(bushels/acre/year)
Percent of Acres with Soybean in
the Rotation Acres gaining SOC (>100 pounds/acre/year) 195 179 96 46 93 Acres maintaining SOC (± 100 pounds/acre/year) 167 164 81 41 98 Acres losing SOC (>100 pounds/acre/year) 159 154 54 37 91
Effects of Conservation Practices on Nitrogen Loss There are no differences in terms of nitrogen inputs or crop-use efficiencies between the 2003-06 and 2012 conservation conditions (table 3.7). Plant-available nitrogen sources include applied commercial fertilizer, applied manure, nitrogen produced by legume crops (e.g., soybeans, alfalfa, beans, and peas), manure deposited by grazing livestock, and atmospheric nitrogen deposition. Annual nitrogen inputs remain unchanged between the two survey periods, averaging 159.5 and 163.2 pounds per acre per year in the 2003-06 and 2012 conservation conditions, respectively. The percent of total nitrogen inputs taken up by the crops and removed from the system at harvest in the crop yield is also unchanged, averaging 66 and 65 percent of total nitrogen applied in the 2003-06 and 2012 conservation conditions, respectively. Acres with the highest nitrogen losses typically have the highest inherent vulnerabilities to loss combined with inadequate nutrient management and complementary conservation practice adoption. Soils inherently vulnerable to surface or subsurface loss pathways may be inadequately treated because they are embedded in a matrix of soils with lower or primarily different inherent vulnerabilities. If a farmer manages the entire field with a uniform strategy, the majority of the field’s soils may be adequately treated, while a small portion that is highly vulnerable to losses or is vulnerable to a different loss pathway may be under treated. This is one reason that soil tests, variable rate technologies, and comprehensive conservation planning are essential tools to address conservation concerns on vulnerable acres in WLEB. The average annual total nitrogen lost per acre via all loss pathways, excluding the nitrogen removed from the field at harvest, is unchanged between the two conservation conditions, averaging 61.3 and 60.3 pounds per acre annually in the 2003-06 and 2012 conservation conditions, respectively (table 3.7).
As would be expected, the quantity of total nitrogen lost varies from acre to acre (fig. 3.11). Of all the nitrogen loss pathways, nitrogen lost to surface and subsurface flows has the greatest potential to directly impact water quality. Most nitrogen lost to subsurface flows eventually returns to surface water through drainage ditches, tile drains, natural seeps, and groundwater return flow. Relative to the no-practice condition, conservation practices in place in the 2003-06 and 2012 conservation conditions reduce the total nitrogen lost via surface water and subsurface flows by 19 and 24 percent, respectively (appendix C). In WLEB, conservation practices adopted between the 2003-06 and 2012 survey periods decrease the average per acre amount of total nitrogen lost via surface loss pathways (table 3.7). The surface loss pathways (wind and water erosion) account for 15, 12, and 8 percent of total nitrogen losses in the no-practice condition, 2003-06 conservation condition, and 2012 conservation condition, respectively (table 3.7, appendix C). In other words, if all the conservation practices in use in the 2012 conservation condition were removed, nitrogen losses via surface loss pathways could more than double, increasing from an average annual per-acre loss rate of 4.6 pounds of nitrogen to an average annual per-acre loss rate of 10.4 pounds of nitrogen. While surface losses of nitrogen decline between the 2003-06 and 2012 conservation conditions, subsurface losses do not change, accounting for 38, 37, and 38 percent of total nitrogen losses in the no-practice condition, 2003-06 conservation condition, and 2012 conservation condition, respectively (table 3.7, appendix C). The decline in surface pathway losses in conjunction with the stability in subsurface losses is a positive sign, considering that some of the achievements towards reducing edge-of-field losses caused more nitrogen to be retained on farm fields, theoretically making more nitrogen vulnerable to loss via subsurface flow. However, the results suggest these potential subsurface nitrogen losses have not materialized.
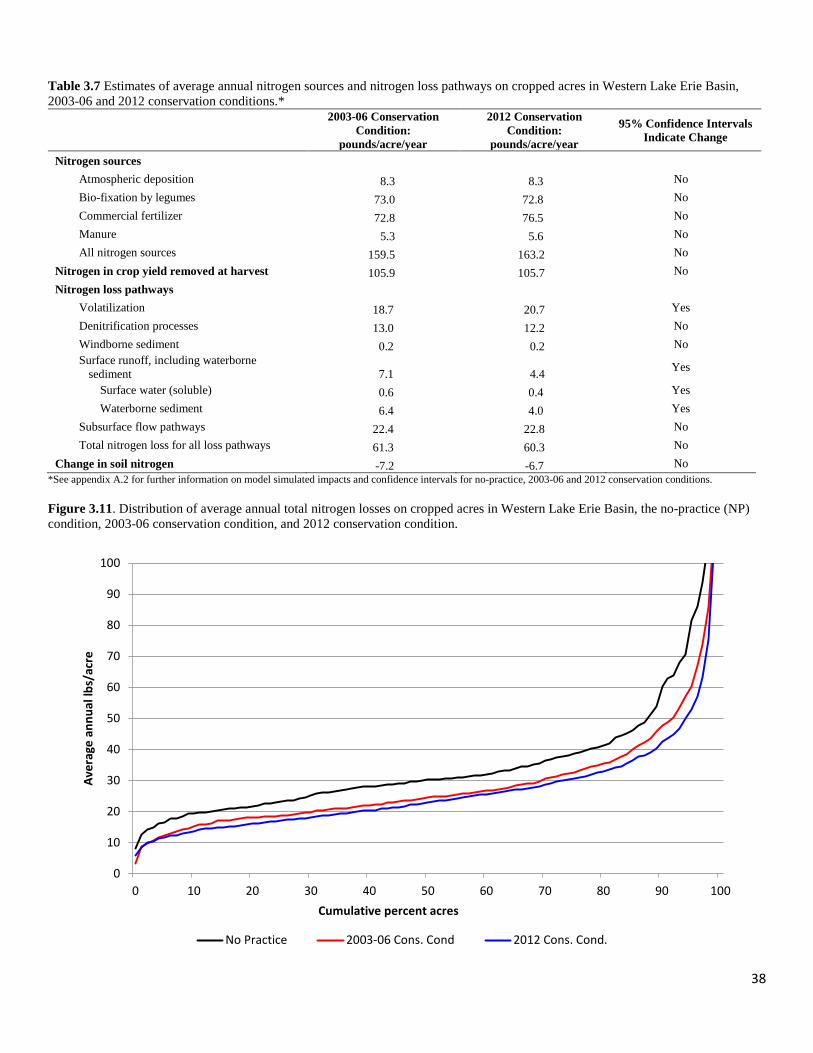
38
Table 3.7 Estimates of average annual nitrogen sources and nitrogen loss pathways on cropped acres in Western Lake Erie Basin, 2003-06 and 2012 conservation conditions.*
2003-06 Conservation Condition:
pounds/acre/year
2012 Conservation Condition:
pounds/acre/year
95% Confidence Intervals Indicate Change
Nitrogen sources Atmospheric deposition 8.3 8.3 No Bio-fixation by legumes 73.0 72.8 No Commercial fertilizer 72.8 76.5 No Manure 5.3 5.6 No All nitrogen sources 159.5 163.2 No
Nitrogen in crop yield removed at harvest 105.9 105.7 No Nitrogen loss pathways
Volatilization 18.7 20.7 Yes Denitrification processes 13.0 12.2 No Windborne sediment 0.2 0.2 No Surface runoff, including waterborne
sediment 7.1 4.4 Yes
Surface water (soluble) 0.6 0.4 Yes Waterborne sediment 6.4 4.0 Yes Subsurface flow pathways 22.4 22.8 No Total nitrogen loss for all loss pathways 61.3 60.3 No
Change in soil nitrogen -7.2 -6.7 No *See appendix A.2 for further information on model simulated impacts and confidence intervals for no-practice, 2003-06 and 2012 conservation conditions. Figure 3.11. Distribution of average annual total nitrogen losses on cropped acres in Western Lake Erie Basin, the no-practice (NP) condition, 2003-06 conservation condition, and 2012 conservation condition.
0
10
20
30
40
50
60
70
80
90
100
0 10 20 30 40 50 60 70 80 90 100
Aver
age
annu
al lb
s/ac
re
Cumulative percent acres
No Practice 2003-06 Cons. Cond 2012 Cons. Cond.
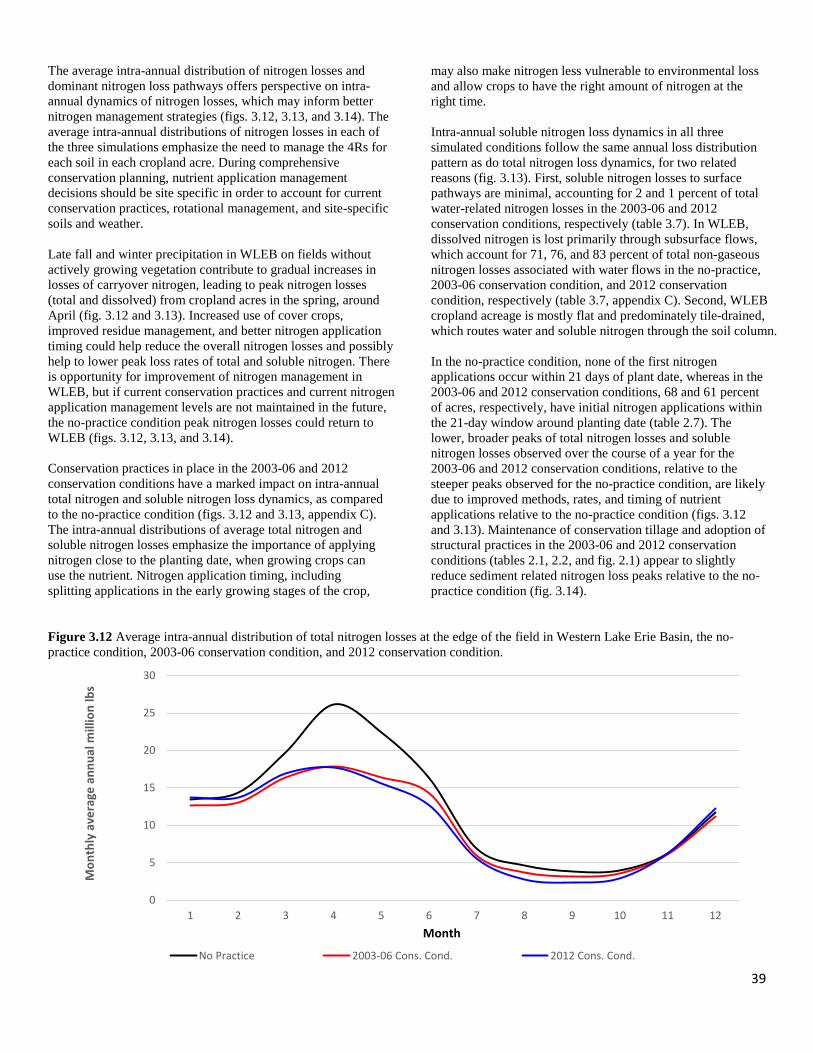
39
The average intra-annual distribution of nitrogen losses and dominant nitrogen loss pathways offers perspective on intra-annual dynamics of nitrogen losses, which may inform better nitrogen management strategies (figs. 3.12, 3.13, and 3.14). The average intra-annual distributions of nitrogen losses in each of the three simulations emphasize the need to manage the 4Rs for each soil in each cropland acre. During comprehensive conservation planning, nutrient application management decisions should be site specific in order to account for current conservation practices, rotational management, and site-specific soils and weather. Late fall and winter precipitation in WLEB on fields without actively growing vegetation contribute to gradual increases in losses of carryover nitrogen, leading to peak nitrogen losses (total and dissolved) from cropland acres in the spring, around April (fig. 3.12 and 3.13). Increased use of cover crops, improved residue management, and better nitrogen application timing could help reduce the overall nitrogen losses and possibly help to lower peak loss rates of total and soluble nitrogen. There is opportunity for improvement of nitrogen management in WLEB, but if current conservation practices and current nitrogen application management levels are not maintained in the future, the no-practice condition peak nitrogen losses could return to WLEB (figs. 3.12, 3.13, and 3.14). Conservation practices in place in the 2003-06 and 2012 conservation conditions have a marked impact on intra-annual total nitrogen and soluble nitrogen loss dynamics, as compared to the no-practice condition (figs. 3.12 and 3.13, appendix C). The intra-annual distributions of average total nitrogen and soluble nitrogen losses emphasize the importance of applying nitrogen close to the planting date, when growing crops can use the nutrient. Nitrogen application timing, including splitting applications in the early growing stages of the crop,
may also make nitrogen less vulnerable to environmental loss and allow crops to have the right amount of nitrogen at the right time. Intra-annual soluble nitrogen loss dynamics in all three simulated conditions follow the same annual loss distribution pattern as do total nitrogen loss dynamics, for two related reasons (fig. 3.13). First, soluble nitrogen losses to surface pathways are minimal, accounting for 2 and 1 percent of total water-related nitrogen losses in the 2003-06 and 2012 conservation conditions, respectively (table 3.7). In WLEB, dissolved nitrogen is lost primarily through subsurface flows, which account for 71, 76, and 83 percent of total non-gaseous nitrogen losses associated with water flows in the no-practice, 2003-06 conservation condition, and 2012 conservation condition, respectively (table 3.7, appendix C). Second, WLEB cropland acreage is mostly flat and predominately tile-drained, which routes water and soluble nitrogen through the soil column. In the no-practice condition, none of the first nitrogen applications occur within 21 days of plant date, whereas in the 2003-06 and 2012 conservation conditions, 68 and 61 percent of acres, respectively, have initial nitrogen applications within the 21-day window around planting date (table 2.7). The lower, broader peaks of total nitrogen losses and soluble nitrogen losses observed over the course of a year for the 2003-06 and 2012 conservation conditions, relative to the steeper peaks observed for the no-practice condition, are likely due to improved methods, rates, and timing of nutrient applications relative to the no-practice condition (figs. 3.12 and 3.13). Maintenance of conservation tillage and adoption of structural practices in the 2003-06 and 2012 conservation conditions (tables 2.1, 2.2, and fig. 2.1) appear to slightly reduce sediment related nitrogen loss peaks relative to the no-practice condition (fig. 3.14).
Figure 3.12 Average intra-annual distribution of total nitrogen losses at the edge of the field in Western Lake Erie Basin, the no-practice condition, 2003-06 conservation condition, and 2012 conservation condition.
0
5
10
15
20
25
30
1 2 3 4 5 6 7 8 9 10 11 12
Mon
thly
ave
rage
ann
ual m
illio
n lb
s
Month
No Practice 2003-06 Cons. Cond. 2012 Cons. Cond.
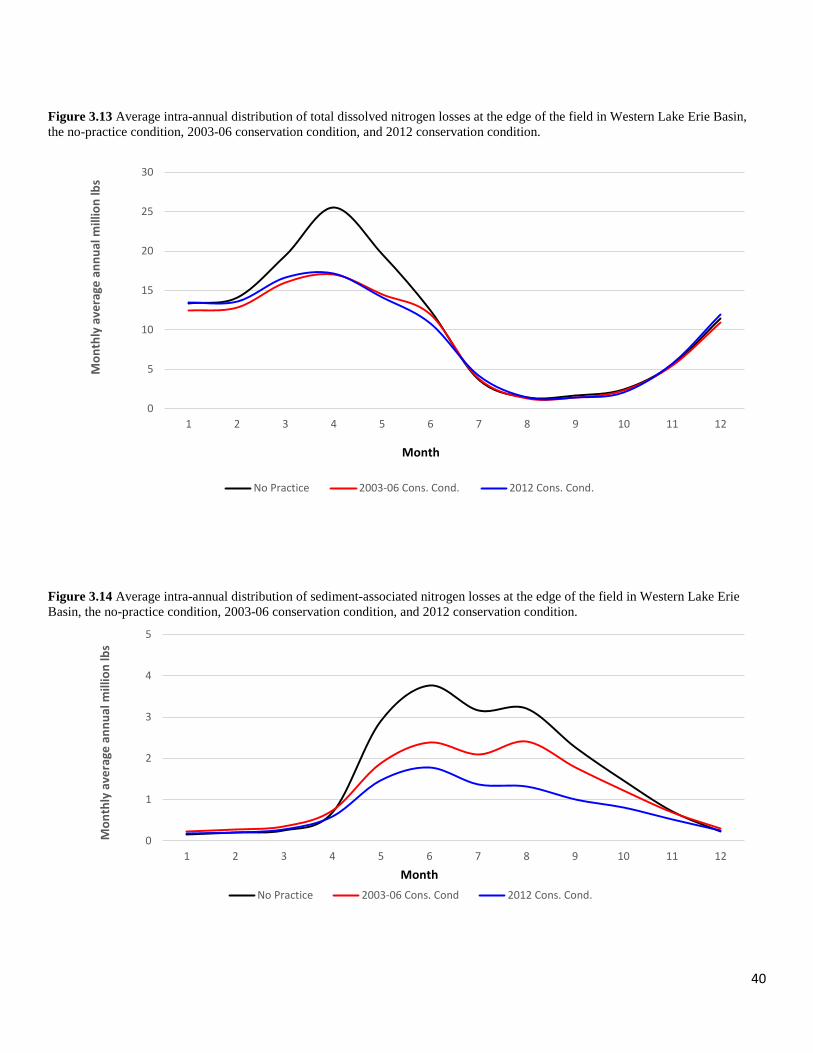
40
Figure 3.13 Average intra-annual distribution of total dissolved nitrogen losses at the edge of the field in Western Lake Erie Basin, the no-practice condition, 2003-06 conservation condition, and 2012 conservation condition.
Figure 3.14 Average intra-annual distribution of sediment-associated nitrogen losses at the edge of the field in Western Lake Erie Basin, the no-practice condition, 2003-06 conservation condition, and 2012 conservation condition.
0
1
2
3
4
5
1 2 3 4 5 6 7 8 9 10 11 12
Mon
thly
ave
rage
ann
ual m
illio
n lb
s
MonthNo Practice 2003-06 Cons. Cond 2012 Cons. Cond.
0
5
10
15
20
25
30
1 2 3 4 5 6 7 8 9 10 11 12
Mon
thly
ave
rage
ann
ual m
illio
n lb
s
Month
No Practice 2003-06 Cons. Cond. 2012 Cons. Cond.
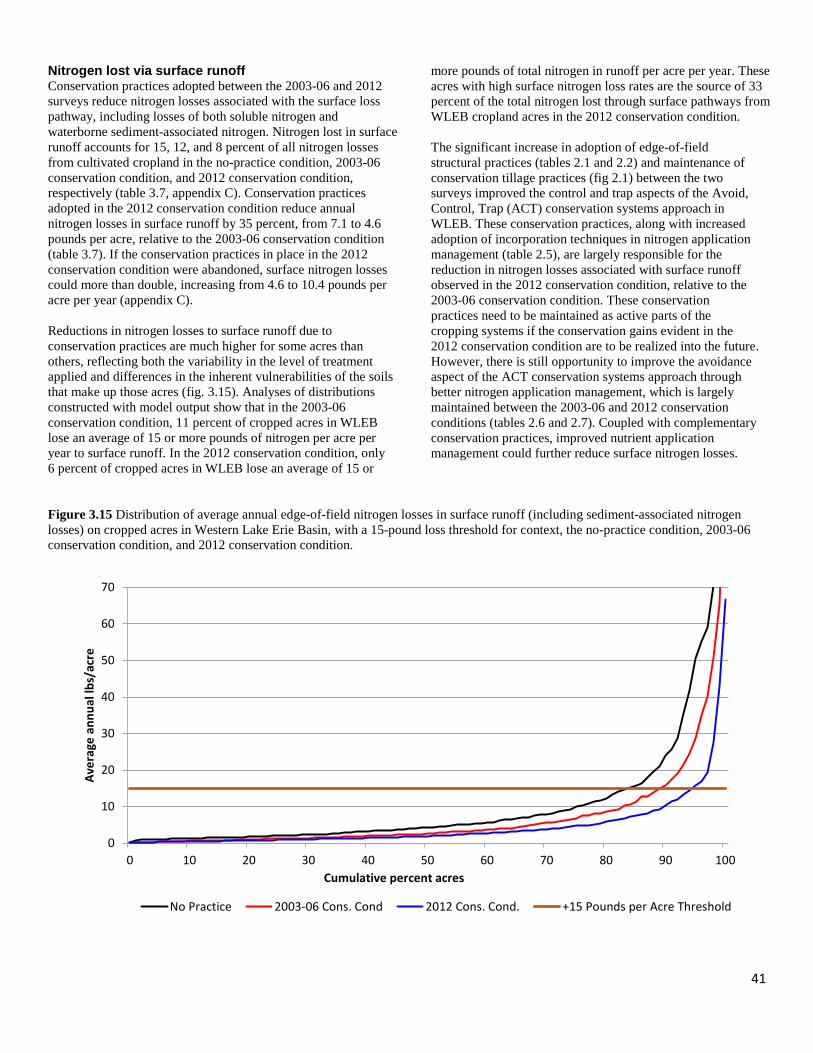
41
Nitrogen lost via surface runoff Conservation practices adopted between the 2003-06 and 2012 surveys reduce nitrogen losses associated with the surface loss pathway, including losses of both soluble nitrogen and waterborne sediment-associated nitrogen. Nitrogen lost in surface runoff accounts for 15, 12, and 8 percent of all nitrogen losses from cultivated cropland in the no-practice condition, 2003-06 conservation condition, and 2012 conservation condition, respectively (table 3.7, appendix C). Conservation practices adopted in the 2012 conservation condition reduce annual nitrogen losses in surface runoff by 35 percent, from 7.1 to 4.6 pounds per acre, relative to the 2003-06 conservation condition (table 3.7). If the conservation practices in place in the 2012 conservation condition were abandoned, surface nitrogen losses could more than double, increasing from 4.6 to 10.4 pounds per acre per year (appendix C). Reductions in nitrogen losses to surface runoff due to conservation practices are much higher for some acres than others, reflecting both the variability in the level of treatment applied and differences in the inherent vulnerabilities of the soils that make up those acres (fig. 3.15). Analyses of distributions constructed with model output show that in the 2003-06 conservation condition, 11 percent of cropped acres in WLEB lose an average of 15 or more pounds of nitrogen per acre per year to surface runoff. In the 2012 conservation condition, only 6 percent of cropped acres in WLEB lose an average of 15 or
more pounds of total nitrogen in runoff per acre per year. These acres with high surface nitrogen loss rates are the source of 33 percent of the total nitrogen lost through surface pathways from WLEB cropland acres in the 2012 conservation condition. The significant increase in adoption of edge-of-field structural practices (tables 2.1 and 2.2) and maintenance of conservation tillage practices (fig 2.1) between the two surveys improved the control and trap aspects of the Avoid, Control, Trap (ACT) conservation systems approach in WLEB. These conservation practices, along with increased adoption of incorporation techniques in nitrogen application management (table 2.5), are largely responsible for the reduction in nitrogen losses associated with surface runoff observed in the 2012 conservation condition, relative to the 2003-06 conservation condition. These conservation practices need to be maintained as active parts of the cropping systems if the conservation gains evident in the 2012 conservation condition are to be realized into the future. However, there is still opportunity to improve the avoidance aspect of the ACT conservation systems approach through better nitrogen application management, which is largely maintained between the 2003-06 and 2012 conservation conditions (tables 2.6 and 2.7). Coupled with complementary conservation practices, improved nutrient application management could further reduce surface nitrogen losses.
Figure 3.15 Distribution of average annual edge-of-field nitrogen losses in surface runoff (including sediment-associated nitrogen losses) on cropped acres in Western Lake Erie Basin, with a 15-pound loss threshold for context, the no-practice condition, 2003-06 conservation condition, and 2012 conservation condition.
0
10
20
30
40
50
60
70
0 10 20 30 40 50 60 70 80 90 100
Aver
age
annu
al lb
s/ac
re
Cumulative percent acres
No Practice 2003-06 Cons. Cond 2012 Cons. Cond. +15 Pounds per Acre Threshold
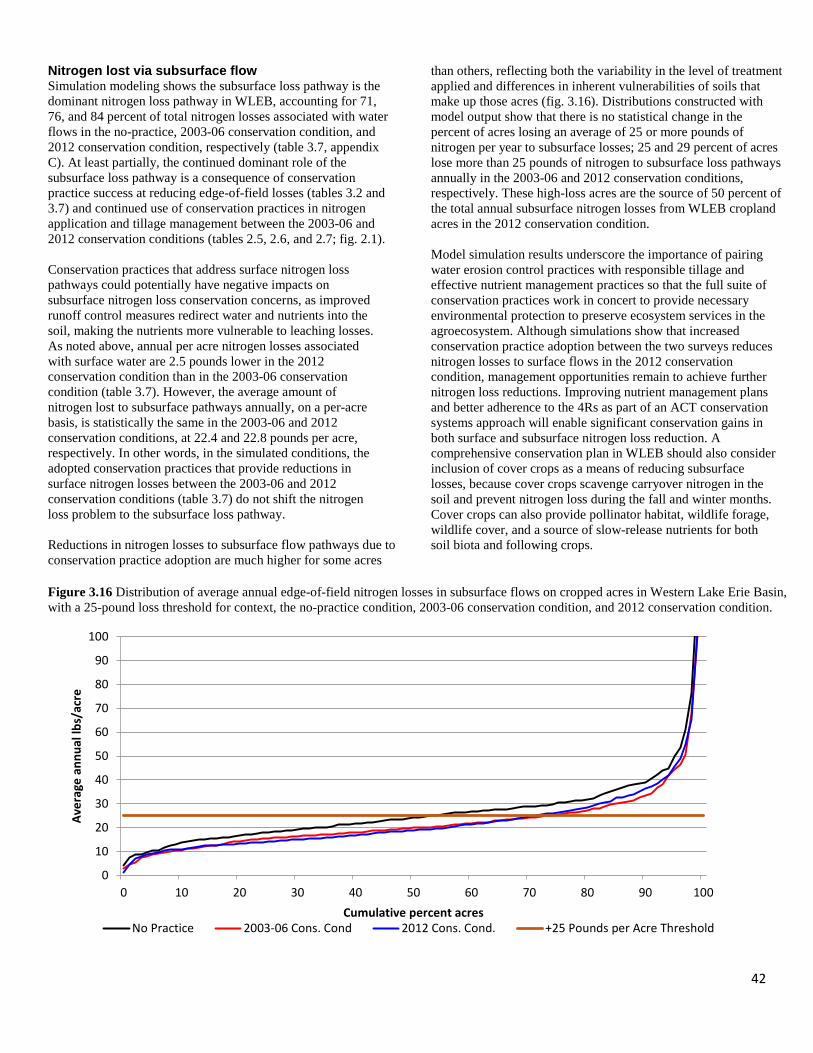
42
Nitrogen lost via subsurface flow Simulation modeling shows the subsurface loss pathway is the dominant nitrogen loss pathway in WLEB, accounting for 71, 76, and 84 percent of total nitrogen losses associated with water flows in the no-practice, 2003-06 conservation condition, and 2012 conservation condition, respectively (table 3.7, appendix C). At least partially, the continued dominant role of the subsurface loss pathway is a consequence of conservation practice success at reducing edge-of-field losses (tables 3.2 and 3.7) and continued use of conservation practices in nitrogen application and tillage management between the 2003-06 and 2012 conservation conditions (tables 2.5, 2.6, and 2.7; fig. 2.1). Conservation practices that address surface nitrogen loss pathways could potentially have negative impacts on subsurface nitrogen loss conservation concerns, as improved runoff control measures redirect water and nutrients into the soil, making the nutrients more vulnerable to leaching losses. As noted above, annual per acre nitrogen losses associated with surface water are 2.5 pounds lower in the 2012 conservation condition than in the 2003-06 conservation condition (table 3.7). However, the average amount of nitrogen lost to subsurface pathways annually, on a per-acre basis, is statistically the same in the 2003-06 and 2012 conservation conditions, at 22.4 and 22.8 pounds per acre, respectively. In other words, in the simulated conditions, the adopted conservation practices that provide reductions in surface nitrogen losses between the 2003-06 and 2012 conservation conditions (table 3.7) do not shift the nitrogen loss problem to the subsurface loss pathway. Reductions in nitrogen losses to subsurface flow pathways due to conservation practice adoption are much higher for some acres
than others, reflecting both the variability in the level of treatment applied and differences in inherent vulnerabilities of soils that make up those acres (fig. 3.16). Distributions constructed with model output show that there is no statistical change in the percent of acres losing an average of 25 or more pounds of nitrogen per year to subsurface losses; 25 and 29 percent of acres lose more than 25 pounds of nitrogen to subsurface loss pathways annually in the 2003-06 and 2012 conservation conditions, respectively. These high-loss acres are the source of 50 percent of the total annual subsurface nitrogen losses from WLEB cropland acres in the 2012 conservation condition. Model simulation results underscore the importance of pairing water erosion control practices with responsible tillage and effective nutrient management practices so that the full suite of conservation practices work in concert to provide necessary environmental protection to preserve ecosystem services in the agroecosystem. Although simulations show that increased conservation practice adoption between the two surveys reduces nitrogen losses to surface flows in the 2012 conservation condition, management opportunities remain to achieve further nitrogen loss reductions. Improving nutrient management plans and better adherence to the 4Rs as part of an ACT conservation systems approach will enable significant conservation gains in both surface and subsurface nitrogen loss reduction. A comprehensive conservation plan in WLEB should also consider inclusion of cover crops as a means of reducing subsurface losses, because cover crops scavenge carryover nitrogen in the soil and prevent nitrogen loss during the fall and winter months. Cover crops can also provide pollinator habitat, wildlife forage, wildlife cover, and a source of slow-release nutrients for both soil biota and following crops.
Figure 3.16 Distribution of average annual edge-of-field nitrogen losses in subsurface flows on cropped acres in Western Lake Erie Basin, with a 25-pound loss threshold for context, the no-practice condition, 2003-06 conservation condition, and 2012 conservation condition.
0
10
20
30
40
50
60
70
80
90
100
0 10 20 30 40 50 60 70 80 90 100
Aver
age
annu
al lb
s/ac
re
Cumulative percent acresNo Practice 2003-06 Cons. Cond 2012 Cons. Cond. +25 Pounds per Acre Threshold
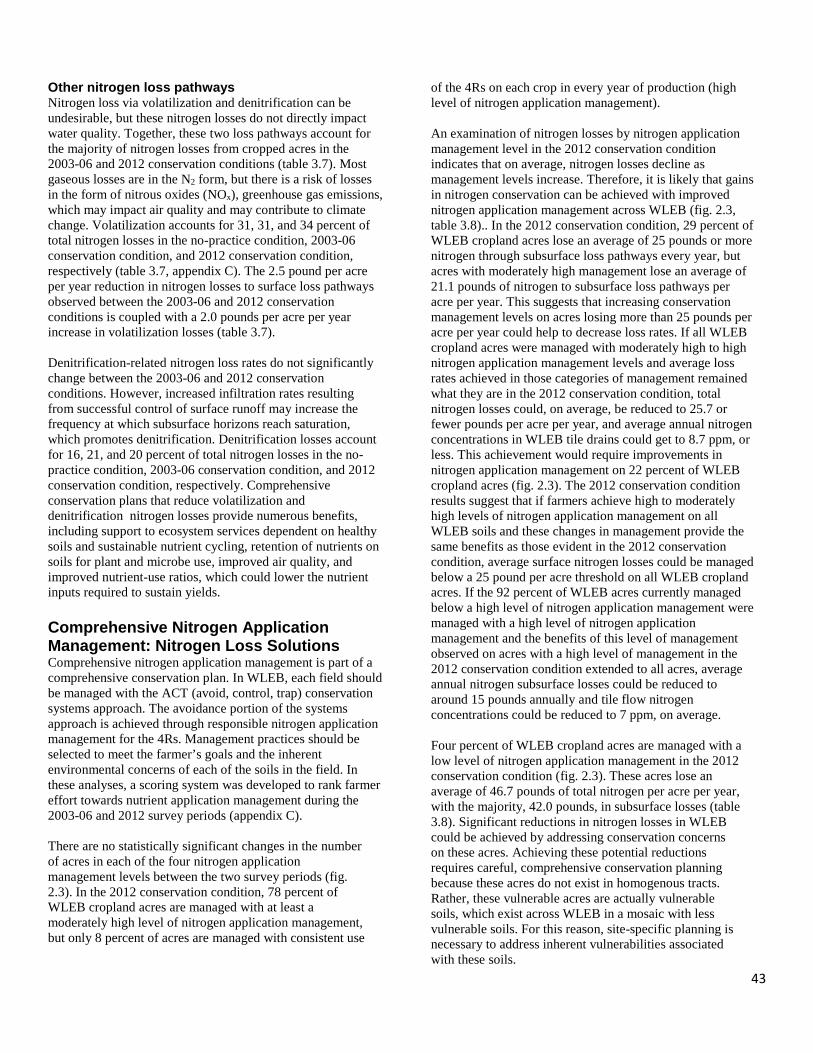
43
Other nitrogen loss pathways Nitrogen loss via volatilization and denitrification can be undesirable, but these nitrogen losses do not directly impact water quality. Together, these two loss pathways account for the majority of nitrogen losses from cropped acres in the 2003-06 and 2012 conservation conditions (table 3.7). Most gaseous losses are in the N2 form, but there is a risk of losses in the form of nitrous oxides (NOx), greenhouse gas emissions, which may impact air quality and may contribute to climate change. Volatilization accounts for 31, 31, and 34 percent of total nitrogen losses in the no-practice condition, 2003-06 conservation condition, and 2012 conservation condition, respectively (table 3.7, appendix C). The 2.5 pound per acre per year reduction in nitrogen losses to surface loss pathways observed between the 2003-06 and 2012 conservation conditions is coupled with a 2.0 pounds per acre per year increase in volatilization losses (table 3.7). Denitrification-related nitrogen loss rates do not significantly change between the 2003-06 and 2012 conservation conditions. However, increased infiltration rates resulting from successful control of surface runoff may increase the frequency at which subsurface horizons reach saturation, which promotes denitrification. Denitrification losses account for 16, 21, and 20 percent of total nitrogen losses in the no-practice condition, 2003-06 conservation condition, and 2012 conservation condition, respectively. Comprehensive conservation plans that reduce volatilization and denitrification nitrogen losses provide numerous benefits, including support to ecosystem services dependent on healthy soils and sustainable nutrient cycling, retention of nutrients on soils for plant and microbe use, improved air quality, and improved nutrient-use ratios, which could lower the nutrient inputs required to sustain yields. Comprehensive Nitrogen Application Management: Nitrogen Loss Solutions Comprehensive nitrogen application management is part of a comprehensive conservation plan. In WLEB, each field should be managed with the ACT (avoid, control, trap) conservation systems approach. The avoidance portion of the systems approach is achieved through responsible nitrogen application management for the 4Rs. Management practices should be selected to meet the farmer’s goals and the inherent environmental concerns of each of the soils in the field. In these analyses, a scoring system was developed to rank farmer effort towards nutrient application management during the 2003-06 and 2012 survey periods (appendix C). There are no statistically significant changes in the number of acres in each of the four nitrogen application management levels between the two survey periods (fig. 2.3). In the 2012 conservation condition, 78 percent of WLEB cropland acres are managed with at least a moderately high level of nitrogen application management, but only 8 percent of acres are managed with consistent use
of the 4Rs on each crop in every year of production (high level of nitrogen application management). An examination of nitrogen losses by nitrogen application management level in the 2012 conservation condition indicates that on average, nitrogen losses decline as management levels increase. Therefore, it is likely that gains in nitrogen conservation can be achieved with improved nitrogen application management across WLEB (fig. 2.3, table 3.8).. In the 2012 conservation condition, 29 percent of WLEB cropland acres lose an average of 25 pounds or more nitrogen through subsurface loss pathways every year, but acres with moderately high management lose an average of 21.1 pounds of nitrogen to subsurface loss pathways per acre per year. This suggests that increasing conservation management levels on acres losing more than 25 pounds per acre per year could help to decrease loss rates. If all WLEB cropland acres were managed with moderately high to high nitrogen application management levels and average loss rates achieved in those categories of management remained what they are in the 2012 conservation condition, total nitrogen losses could, on average, be reduced to 25.7 or fewer pounds per acre per year, and average annual nitrogen concentrations in WLEB tile drains could get to 8.7 ppm, or less. This achievement would require improvements in nitrogen application management on 22 percent of WLEB cropland acres (fig. 2.3). The 2012 conservation condition results suggest that if farmers achieve high to moderately high levels of nitrogen application management on all WLEB soils and these changes in management provide the same benefits as those evident in the 2012 conservation condition, average surface nitrogen losses could be managed below a 25 pound per acre threshold on all WLEB cropland acres. If the 92 percent of WLEB acres currently managed below a high level of nitrogen application management were managed with a high level of nitrogen application management and the benefits of this level of management observed on acres with a high level of management in the 2012 conservation condition extended to all acres, average annual nitrogen subsurface losses could be reduced to around 15 pounds annually and tile flow nitrogen concentrations could be reduced to 7 ppm, on average. Four percent of WLEB cropland acres are managed with a low level of nitrogen application management in the 2012 conservation condition (fig. 2.3). These acres lose an average of 46.7 pounds of total nitrogen per acre per year, with the majority, 42.0 pounds, in subsurface losses (table 3.8). Significant reductions in nitrogen losses in WLEB could be achieved by addressing conservation concerns on these acres. Achieving these potential reductions requires careful, comprehensive conservation planning because these acres do not exist in homogenous tracts. Rather, these vulnerable acres are actually vulnerable soils, which exist across WLEB in a mosaic with less vulnerable soils. For this reason, site-specific planning is necessary to address inherent vulnerabilities associated with these soils.
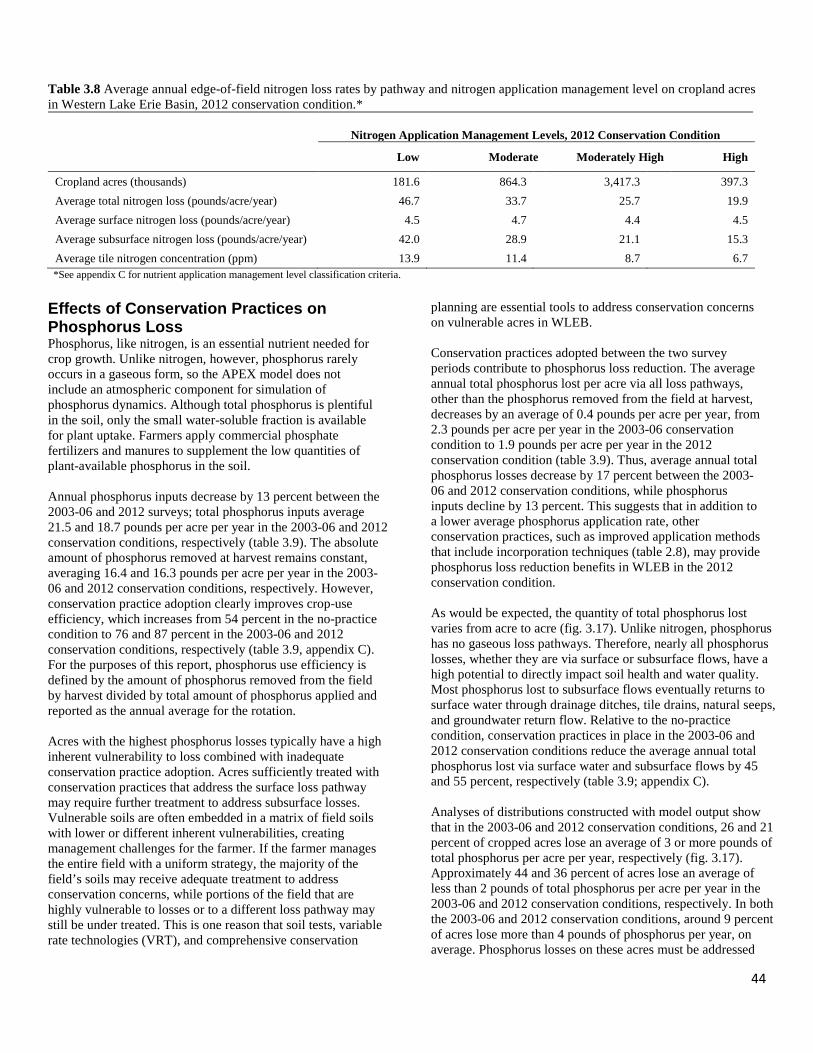
44
Table 3.8 Average annual edge-of-field nitrogen loss rates by pathway and nitrogen application management level on cropland acres in Western Lake Erie Basin, 2012 conservation condition.*
Nitrogen Application Management Levels, 2012 Conservation Condition
Low Moderate Moderately High High
Cropland acres (thousands) 181.6 864.3 3,417.3 397.3 Average total nitrogen loss (pounds/acre/year) 46.7 33.7 25.7 19.9 Average surface nitrogen loss (pounds/acre/year) 4.5 4.7 4.4 4.5 Average subsurface nitrogen loss (pounds/acre/year) 42.0 28.9 21.1 15.3 Average tile nitrogen concentration (ppm) 13.9 11.4 8.7 6.7
*See appendix C for nutrient application management level classification criteria. Effects of Conservation Practices on Phosphorus Loss Phosphorus, like nitrogen, is an essential nutrient needed for crop growth. Unlike nitrogen, however, phosphorus rarely occurs in a gaseous form, so the APEX model does not include an atmospheric component for simulation of phosphorus dynamics. Although total phosphorus is plentiful in the soil, only the small water-soluble fraction is available for plant uptake. Farmers apply commercial phosphate fertilizers and manures to supplement the low quantities of plant-available phosphorus in the soil. Annual phosphorus inputs decrease by 13 percent between the 2003-06 and 2012 surveys; total phosphorus inputs average 21.5 and 18.7 pounds per acre per year in the 2003-06 and 2012 conservation conditions, respectively (table 3.9). The absolute amount of phosphorus removed at harvest remains constant, averaging 16.4 and 16.3 pounds per acre per year in the 2003-06 and 2012 conservation conditions, respectively. However, conservation practice adoption clearly improves crop-use efficiency, which increases from 54 percent in the no-practice condition to 76 and 87 percent in the 2003-06 and 2012 conservation conditions, respectively (table 3.9, appendix C). For the purposes of this report, phosphorus use efficiency is defined by the amount of phosphorus removed from the field by harvest divided by total amount of phosphorus applied and reported as the annual average for the rotation. Acres with the highest phosphorus losses typically have a high inherent vulnerability to loss combined with inadequate conservation practice adoption. Acres sufficiently treated with conservation practices that address the surface loss pathway may require further treatment to address subsurface losses. Vulnerable soils are often embedded in a matrix of field soils with lower or different inherent vulnerabilities, creating management challenges for the farmer. If the farmer manages the entire field with a uniform strategy, the majority of the field’s soils may receive adequate treatment to address conservation concerns, while portions of the field that are highly vulnerable to losses or to a different loss pathway may still be under treated. This is one reason that soil tests, variable rate technologies (VRT), and comprehensive conservation
planning are essential tools to address conservation concerns on vulnerable acres in WLEB. Conservation practices adopted between the two survey periods contribute to phosphorus loss reduction. The average annual total phosphorus lost per acre via all loss pathways, other than the phosphorus removed from the field at harvest, decreases by an average of 0.4 pounds per acre per year, from 2.3 pounds per acre per year in the 2003-06 conservation condition to 1.9 pounds per acre per year in the 2012 conservation condition (table 3.9). Thus, average annual total phosphorus losses decrease by 17 percent between the 2003-06 and 2012 conservation conditions, while phosphorus inputs decline by 13 percent. This suggests that in addition to a lower average phosphorus application rate, other conservation practices, such as improved application methods that include incorporation techniques (table 2.8), may provide phosphorus loss reduction benefits in WLEB in the 2012 conservation condition. As would be expected, the quantity of total phosphorus lost varies from acre to acre (fig. 3.17). Unlike nitrogen, phosphorus has no gaseous loss pathways. Therefore, nearly all phosphorus losses, whether they are via surface or subsurface flows, have a high potential to directly impact soil health and water quality. Most phosphorus lost to subsurface flows eventually returns to surface water through drainage ditches, tile drains, natural seeps, and groundwater return flow. Relative to the no-practice condition, conservation practices in place in the 2003-06 and 2012 conservation conditions reduce the average annual total phosphorus lost via surface water and subsurface flows by 45 and 55 percent, respectively (table 3.9; appendix C). Analyses of distributions constructed with model output show that in the 2003-06 and 2012 conservation conditions, 26 and 21 percent of cropped acres lose an average of 3 or more pounds of total phosphorus per acre per year, respectively (fig. 3.17). Approximately 44 and 36 percent of acres lose an average of less than 2 pounds of total phosphorus per acre per year in the 2003-06 and 2012 conservation conditions, respectively. In both the 2003-06 and 2012 conservation conditions, around 9 percent of acres lose more than 4 pounds of phosphorus per year, on average. Phosphorus losses on these acres must be addressed
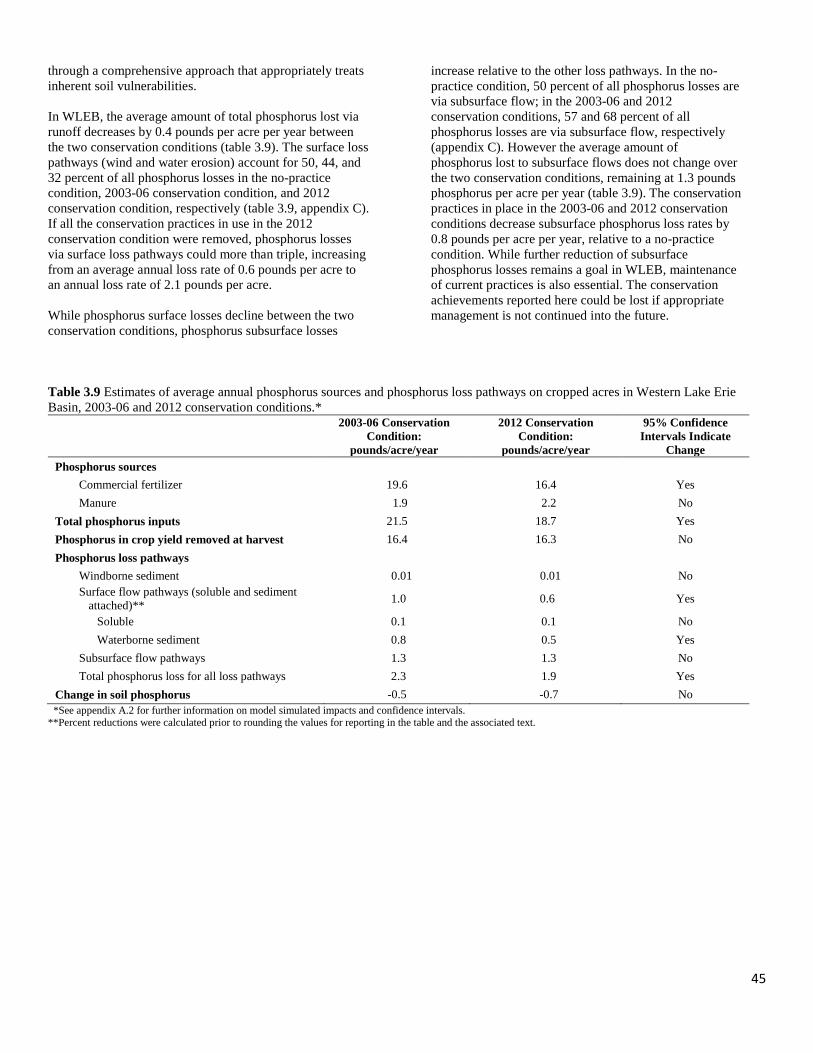
45
through a comprehensive approach that appropriately treats inherent soil vulnerabilities. In WLEB, the average amount of total phosphorus lost via runoff decreases by 0.4 pounds per acre per year between the two conservation conditions (table 3.9). The surface loss pathways (wind and water erosion) account for 50, 44, and 32 percent of all phosphorus losses in the no-practice condition, 2003-06 conservation condition, and 2012 conservation condition, respectively (table 3.9, appendix C). If all the conservation practices in use in the 2012 conservation condition were removed, phosphorus losses via surface loss pathways could more than triple, increasing from an average annual loss rate of 0.6 pounds per acre to an annual loss rate of 2.1 pounds per acre. While phosphorus surface losses decline between the two conservation conditions, phosphorus subsurface losses
increase relative to the other loss pathways. In the no-practice condition, 50 percent of all phosphorus losses are via subsurface flow; in the 2003-06 and 2012 conservation conditions, 57 and 68 percent of all phosphorus losses are via subsurface flow, respectively (appendix C). However the average amount of phosphorus lost to subsurface flows does not change over the two conservation conditions, remaining at 1.3 pounds phosphorus per acre per year (table 3.9). The conservation practices in place in the 2003-06 and 2012 conservation conditions decrease subsurface phosphorus loss rates by 0.8 pounds per acre per year, relative to a no-practice condition. While further reduction of subsurface phosphorus losses remains a goal in WLEB, maintenance of current practices is also essential. The conservation achievements reported here could be lost if appropriate management is not continued into the future.
Table 3.9 Estimates of average annual phosphorus sources and phosphorus loss pathways on cropped acres in Western Lake Erie Basin, 2003-06 and 2012 conservation conditions.*
2003-06 Conservation Condition:
pounds/acre/year
2012 Conservation Condition:
pounds/acre/year
95% Confidence Intervals Indicate
Change Phosphorus sources
Commercial fertilizer 19.6 16.4 Yes Manure 1.9 2.2 No
Total phosphorus inputs 21.5 18.7 Yes Phosphorus in crop yield removed at harvest 16.4 16.3 No Phosphorus loss pathways
Windborne sediment 0.01 0.01 No Surface flow pathways (soluble and sediment
attached)** 1.0 0.6 Yes
Soluble 0.1 0.1 No Waterborne sediment 0.8 0.5 Yes
Subsurface flow pathways 1.3 1.3 No Total phosphorus loss for all loss pathways 2.3 1.9 Yes
Change in soil phosphorus -0.5 -0.7 No *See appendix A.2 for further information on model simulated impacts and confidence intervals. **Percent reductions were calculated prior to rounding the values for reporting in the table and the associated text.
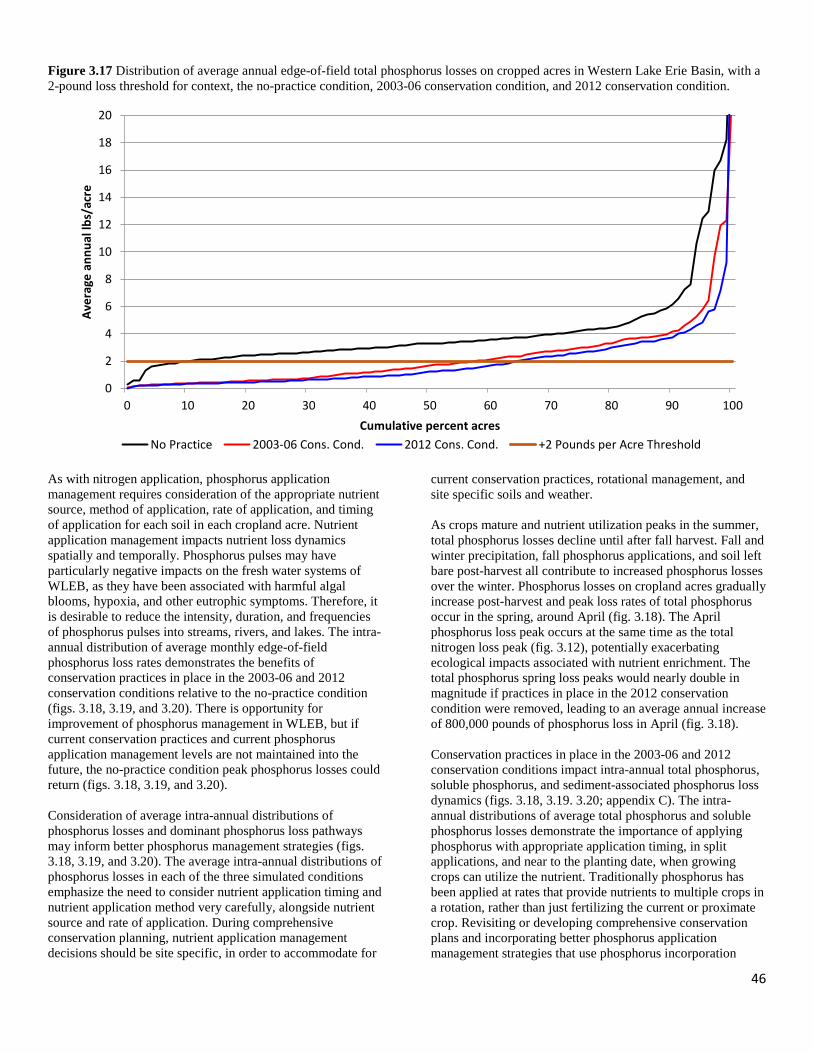
46
Figure 3.17 Distribution of average annual edge-of-field total phosphorus losses on cropped acres in Western Lake Erie Basin, with a 2-pound loss threshold for context, the no-practice condition, 2003-06 conservation condition, and 2012 conservation condition.
As with nitrogen application, phosphorus application management requires consideration of the appropriate nutrient source, method of application, rate of application, and timing of application for each soil in each cropland acre. Nutrient application management impacts nutrient loss dynamics spatially and temporally. Phosphorus pulses may have particularly negative impacts on the fresh water systems of WLEB, as they have been associated with harmful algal blooms, hypoxia, and other eutrophic symptoms. Therefore, it is desirable to reduce the intensity, duration, and frequencies of phosphorus pulses into streams, rivers, and lakes. The intra-annual distribution of average monthly edge-of-field phosphorus loss rates demonstrates the benefits of conservation practices in place in the 2003-06 and 2012 conservation conditions relative to the no-practice condition (figs. 3.18, 3.19, and 3.20). There is opportunity for improvement of phosphorus management in WLEB, but if current conservation practices and current phosphorus application management levels are not maintained into the future, the no-practice condition peak phosphorus losses could return (figs. 3.18, 3.19, and 3.20). Consideration of average intra-annual distributions of phosphorus losses and dominant phosphorus loss pathways may inform better phosphorus management strategies (figs. 3.18, 3.19, and 3.20). The average intra-annual distributions of phosphorus losses in each of the three simulated conditions emphasize the need to consider nutrient application timing and nutrient application method very carefully, alongside nutrient source and rate of application. During comprehensive conservation planning, nutrient application management decisions should be site specific, in order to accommodate for
current conservation practices, rotational management, and site specific soils and weather. As crops mature and nutrient utilization peaks in the summer, total phosphorus losses decline until after fall harvest. Fall and winter precipitation, fall phosphorus applications, and soil left bare post-harvest all contribute to increased phosphorus losses over the winter. Phosphorus losses on cropland acres gradually increase post-harvest and peak loss rates of total phosphorus occur in the spring, around April (fig. 3.18). The April phosphorus loss peak occurs at the same time as the total nitrogen loss peak (fig. 3.12), potentially exacerbating ecological impacts associated with nutrient enrichment. The total phosphorus spring loss peaks would nearly double in magnitude if practices in place in the 2012 conservation condition were removed, leading to an average annual increase of 800,000 pounds of phosphorus loss in April (fig. 3.18). Conservation practices in place in the 2003-06 and 2012 conservation conditions impact intra-annual total phosphorus, soluble phosphorus, and sediment-associated phosphorus loss dynamics (figs. 3.18, 3.19. 3.20; appendix C). The intra-annual distributions of average total phosphorus and soluble phosphorus losses demonstrate the importance of applying phosphorus with appropriate application timing, in split applications, and near to the planting date, when growing crops can utilize the nutrient. Traditionally phosphorus has been applied at rates that provide nutrients to multiple crops in a rotation, rather than just fertilizing the current or proximate crop. Revisiting or developing comprehensive conservation plans and incorporating better phosphorus application management strategies that use phosphorus incorporation
0
2
4
6
8
10
12
14
16
18
20
0 10 20 30 40 50 60 70 80 90 100
Aver
age
annu
al lb
s/ac
re
Cumulative percent acresNo Practice 2003-06 Cons. Cond. 2012 Cons. Cond. +2 Pounds per Acre Threshold
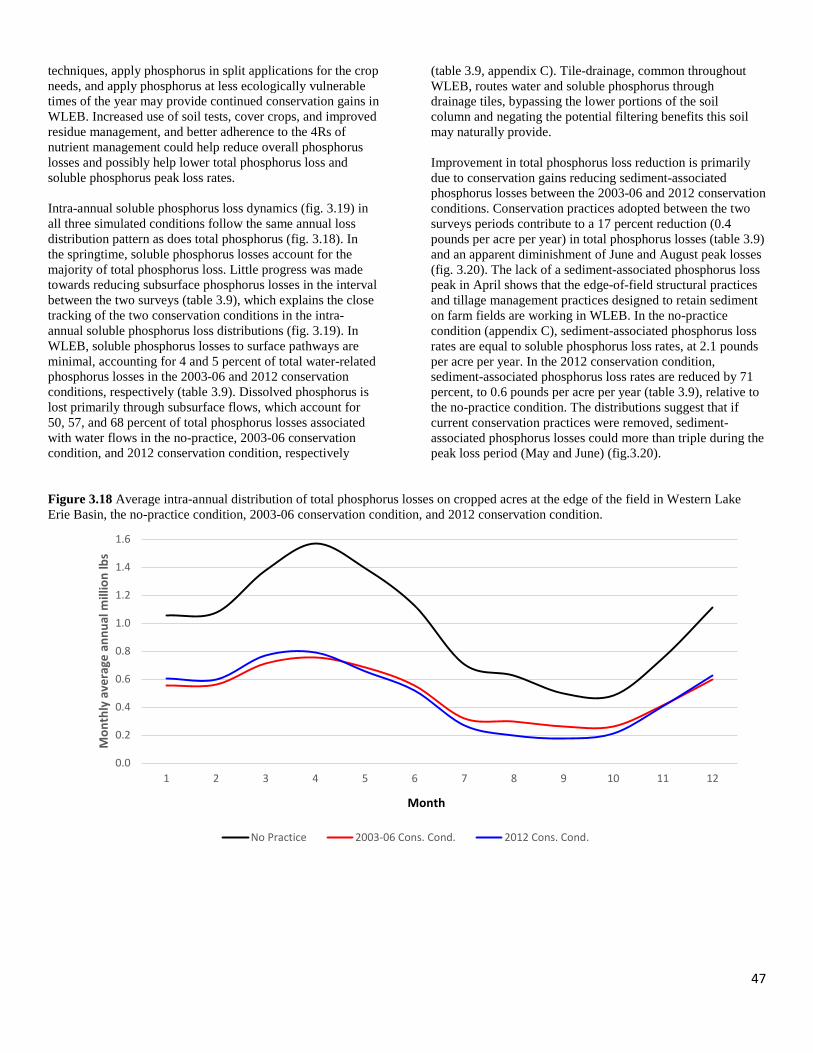
47
techniques, apply phosphorus in split applications for the crop needs, and apply phosphorus at less ecologically vulnerable times of the year may provide continued conservation gains in WLEB. Increased use of soil tests, cover crops, and improved residue management, and better adherence to the 4Rs of nutrient management could help reduce overall phosphorus losses and possibly help lower total phosphorus loss and soluble phosphorus peak loss rates. Intra-annual soluble phosphorus loss dynamics (fig. 3.19) in all three simulated conditions follow the same annual loss distribution pattern as does total phosphorus (fig. 3.18). In the springtime, soluble phosphorus losses account for the majority of total phosphorus loss. Little progress was made towards reducing subsurface phosphorus losses in the interval between the two surveys (table 3.9), which explains the close tracking of the two conservation conditions in the intra-annual soluble phosphorus loss distributions (fig. 3.19). In WLEB, soluble phosphorus losses to surface pathways are minimal, accounting for 4 and 5 percent of total water-related phosphorus losses in the 2003-06 and 2012 conservation conditions, respectively (table 3.9). Dissolved phosphorus is lost primarily through subsurface flows, which account for 50, 57, and 68 percent of total phosphorus losses associated with water flows in the no-practice, 2003-06 conservation condition, and 2012 conservation condition, respectively
(table 3.9, appendix C). Tile-drainage, common throughout WLEB, routes water and soluble phosphorus through drainage tiles, bypassing the lower portions of the soil column and negating the potential filtering benefits this soil may naturally provide. Improvement in total phosphorus loss reduction is primarily due to conservation gains reducing sediment-associated phosphorus losses between the 2003-06 and 2012 conservation conditions. Conservation practices adopted between the two surveys periods contribute to a 17 percent reduction (0.4 pounds per acre per year) in total phosphorus losses (table 3.9) and an apparent diminishment of June and August peak losses (fig. 3.20). The lack of a sediment-associated phosphorus loss peak in April shows that the edge-of-field structural practices and tillage management practices designed to retain sediment on farm fields are working in WLEB. In the no-practice condition (appendix C), sediment-associated phosphorus loss rates are equal to soluble phosphorus loss rates, at 2.1 pounds per acre per year. In the 2012 conservation condition, sediment-associated phosphorus loss rates are reduced by 71 percent, to 0.6 pounds per acre per year (table 3.9), relative to the no-practice condition. The distributions suggest that if current conservation practices were removed, sediment-associated phosphorus losses could more than triple during the peak loss period (May and June) (fig.3.20).
Figure 3.18 Average intra-annual distribution of total phosphorus losses on cropped acres at the edge of the field in Western Lake Erie Basin, the no-practice condition, 2003-06 conservation condition, and 2012 conservation condition.
0.0
0.2
0.4
0.6
0.8
1.0
1.2
1.4
1.6
1 2 3 4 5 6 7 8 9 10 11 12
Mon
thly
ave
rage
ann
ual m
illio
n lb
s
Month
No Practice 2003-06 Cons. Cond. 2012 Cons. Cond.
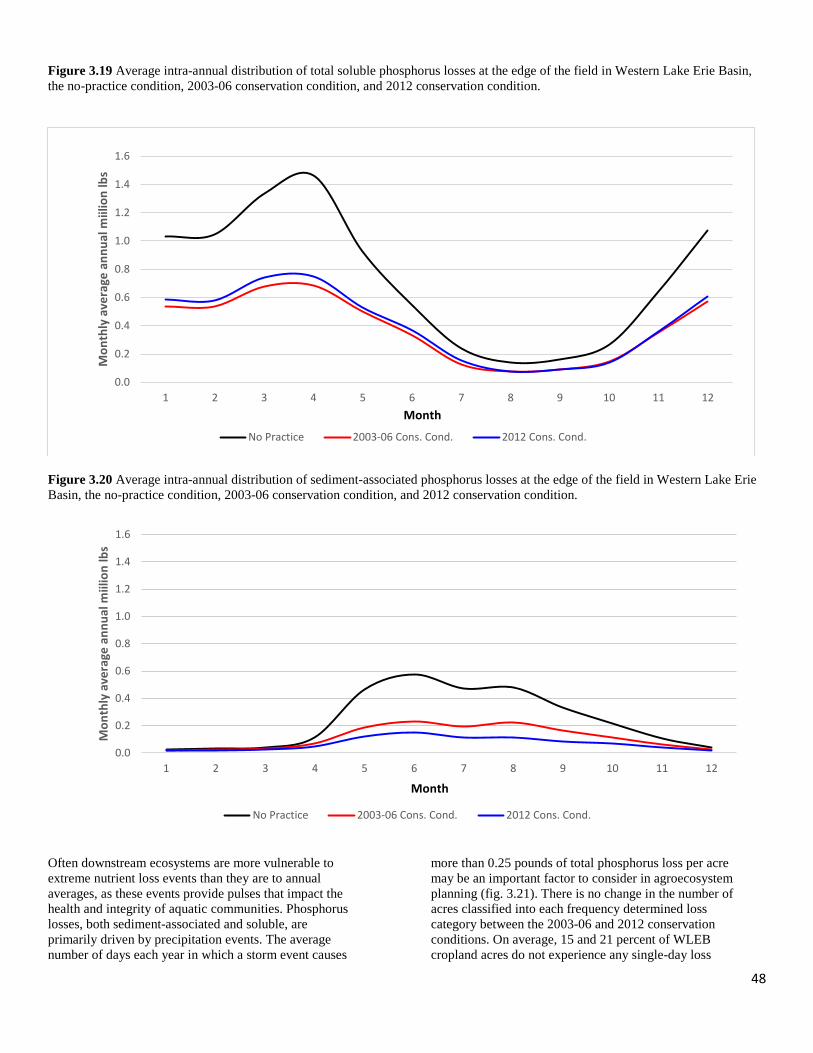
48
Figure 3.19 Average intra-annual distribution of total soluble phosphorus losses at the edge of the field in Western Lake Erie Basin, the no-practice condition, 2003-06 conservation condition, and 2012 conservation condition.
Figure 3.20 Average intra-annual distribution of sediment-associated phosphorus losses at the edge of the field in Western Lake Erie Basin, the no-practice condition, 2003-06 conservation condition, and 2012 conservation condition.
Often downstream ecosystems are more vulnerable to extreme nutrient loss events than they are to annual averages, as these events provide pulses that impact the health and integrity of aquatic communities. Phosphorus losses, both sediment-associated and soluble, are primarily driven by precipitation events. The average number of days each year in which a storm event causes
more than 0.25 pounds of total phosphorus loss per acre may be an important factor to consider in agroecosystem planning (fig. 3.21). There is no change in the number of acres classified into each frequency determined loss category between the 2003-06 and 2012 conservation conditions. On average, 15 and 21 percent of WLEB cropland acres do not experience any single-day loss
0.0
0.2
0.4
0.6
0.8
1.0
1.2
1.4
1.6
1 2 3 4 5 6 7 8 9 10 11 12
Mon
thly
ave
rage
ann
ual m
iilio
n lb
s
Month
No Practice 2003-06 Cons. Cond. 2012 Cons. Cond.
0.0
0.2
0.4
0.6
0.8
1.0
1.2
1.4
1.6
1 2 3 4 5 6 7 8 9 10 11 12
Mon
thly
ave
rage
ann
ual m
iilio
n lb
s
Month
No Practice 2003-06 Cons. Cond. 2012 Cons. Cond.
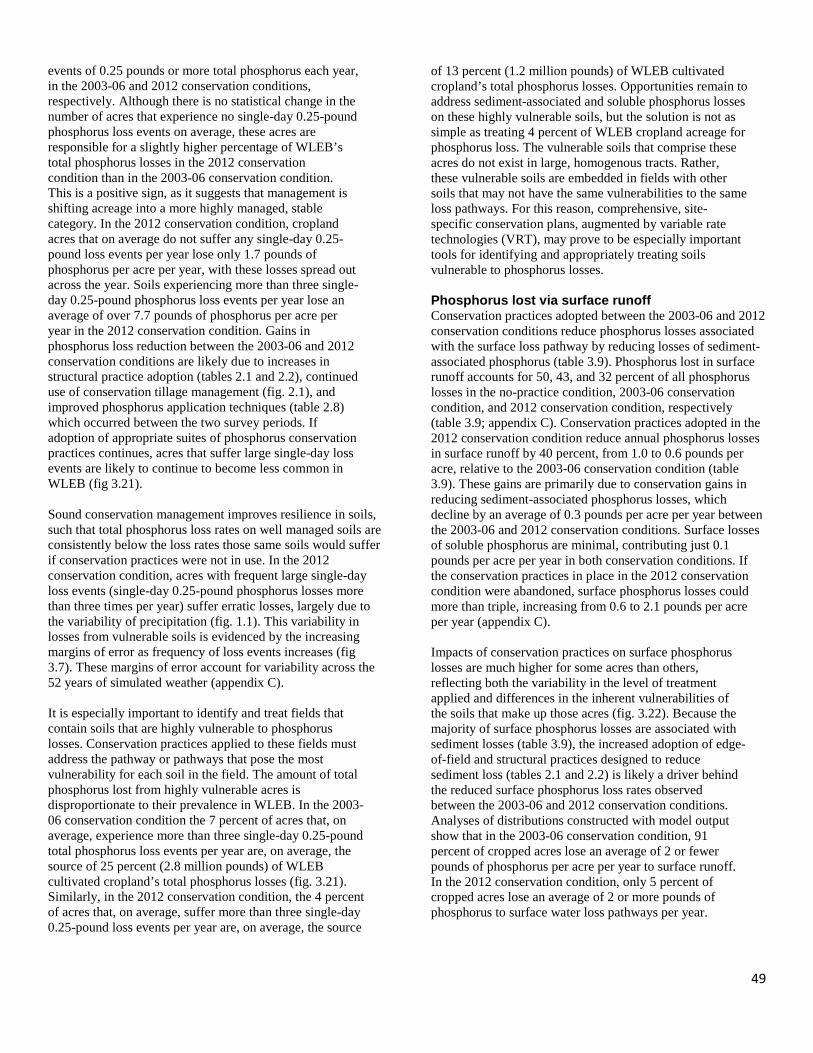
49
events of 0.25 pounds or more total phosphorus each year, in the 2003-06 and 2012 conservation conditions, respectively. Although there is no statistical change in the number of acres that experience no single-day 0.25-pound phosphorus loss events on average, these acres are responsible for a slightly higher percentage of WLEB’s total phosphorus losses in the 2012 conservation condition than in the 2003-06 conservation condition. This is a positive sign, as it suggests that management is shifting acreage into a more highly managed, stable category. In the 2012 conservation condition, cropland acres that on average do not suffer any single-day 0.25-pound loss events per year lose only 1.7 pounds of phosphorus per acre per year, with these losses spread out across the year. Soils experiencing more than three single-day 0.25-pound phosphorus loss events per year lose an average of over 7.7 pounds of phosphorus per acre per year in the 2012 conservation condition. Gains in phosphorus loss reduction between the 2003-06 and 2012 conservation conditions are likely due to increases in structural practice adoption (tables 2.1 and 2.2), continued use of conservation tillage management (fig. 2.1), and improved phosphorus application techniques (table 2.8) which occurred between the two survey periods. If adoption of appropriate suites of phosphorus conservation practices continues, acres that suffer large single-day loss events are likely to continue to become less common in WLEB (fig 3.21). Sound conservation management improves resilience in soils, such that total phosphorus loss rates on well managed soils are consistently below the loss rates those same soils would suffer if conservation practices were not in use. In the 2012 conservation condition, acres with frequent large single-day loss events (single-day 0.25-pound phosphorus losses more than three times per year) suffer erratic losses, largely due to the variability of precipitation (fig. 1.1). This variability in losses from vulnerable soils is evidenced by the increasing margins of error as frequency of loss events increases (fig 3.7). These margins of error account for variability across the 52 years of simulated weather (appendix C). It is especially important to identify and treat fields that contain soils that are highly vulnerable to phosphorus losses. Conservation practices applied to these fields must address the pathway or pathways that pose the most vulnerability for each soil in the field. The amount of total phosphorus lost from highly vulnerable acres is disproportionate to their prevalence in WLEB. In the 2003-06 conservation condition the 7 percent of acres that, on average, experience more than three single-day 0.25-pound total phosphorus loss events per year are, on average, the source of 25 percent (2.8 million pounds) of WLEB cultivated cropland’s total phosphorus losses (fig. 3.21). Similarly, in the 2012 conservation condition, the 4 percent of acres that, on average, suffer more than three single-day 0.25-pound loss events per year are, on average, the source
of 13 percent (1.2 million pounds) of WLEB cultivated cropland’s total phosphorus losses. Opportunities remain to address sediment-associated and soluble phosphorus losses on these highly vulnerable soils, but the solution is not as simple as treating 4 percent of WLEB cropland acreage for phosphorus loss. The vulnerable soils that comprise these acres do not exist in large, homogenous tracts. Rather, these vulnerable soils are embedded in fields with other soils that may not have the same vulnerabilities to the same loss pathways. For this reason, comprehensive, site-specific conservation plans, augmented by variable rate technologies (VRT), may prove to be especially important tools for identifying and appropriately treating soils vulnerable to phosphorus losses. Phosphorus lost via surface runoff Conservation practices adopted between the 2003-06 and 2012 conservation conditions reduce phosphorus losses associated with the surface loss pathway by reducing losses of sediment-associated phosphorus (table 3.9). Phosphorus lost in surface runoff accounts for 50, 43, and 32 percent of all phosphorus losses in the no-practice condition, 2003-06 conservation condition, and 2012 conservation condition, respectively (table 3.9; appendix C). Conservation practices adopted in the 2012 conservation condition reduce annual phosphorus losses in surface runoff by 40 percent, from 1.0 to 0.6 pounds per acre, relative to the 2003-06 conservation condition (table 3.9). These gains are primarily due to conservation gains in reducing sediment-associated phosphorus losses, which decline by an average of 0.3 pounds per acre per year between the 2003-06 and 2012 conservation conditions. Surface losses of soluble phosphorus are minimal, contributing just 0.1 pounds per acre per year in both conservation conditions. If the conservation practices in place in the 2012 conservation condition were abandoned, surface phosphorus losses could more than triple, increasing from 0.6 to 2.1 pounds per acre per year (appendix C). Impacts of conservation practices on surface phosphorus losses are much higher for some acres than others, reflecting both the variability in the level of treatment applied and differences in the inherent vulnerabilities of the soils that make up those acres (fig. 3.22). Because the majority of surface phosphorus losses are associated with sediment losses (table 3.9), the increased adoption of edge-of-field and structural practices designed to reduce sediment loss (tables 2.1 and 2.2) is likely a driver behind the reduced surface phosphorus loss rates observed between the 2003-06 and 2012 conservation conditions. Analyses of distributions constructed with model output show that in the 2003-06 conservation condition, 91 percent of cropped acres lose an average of 2 or fewer pounds of phosphorus per acre per year to surface runoff. In the 2012 conservation condition, only 5 percent of cropped acres lose an average of 2 or more pounds of phosphorus to surface water loss pathways per year.
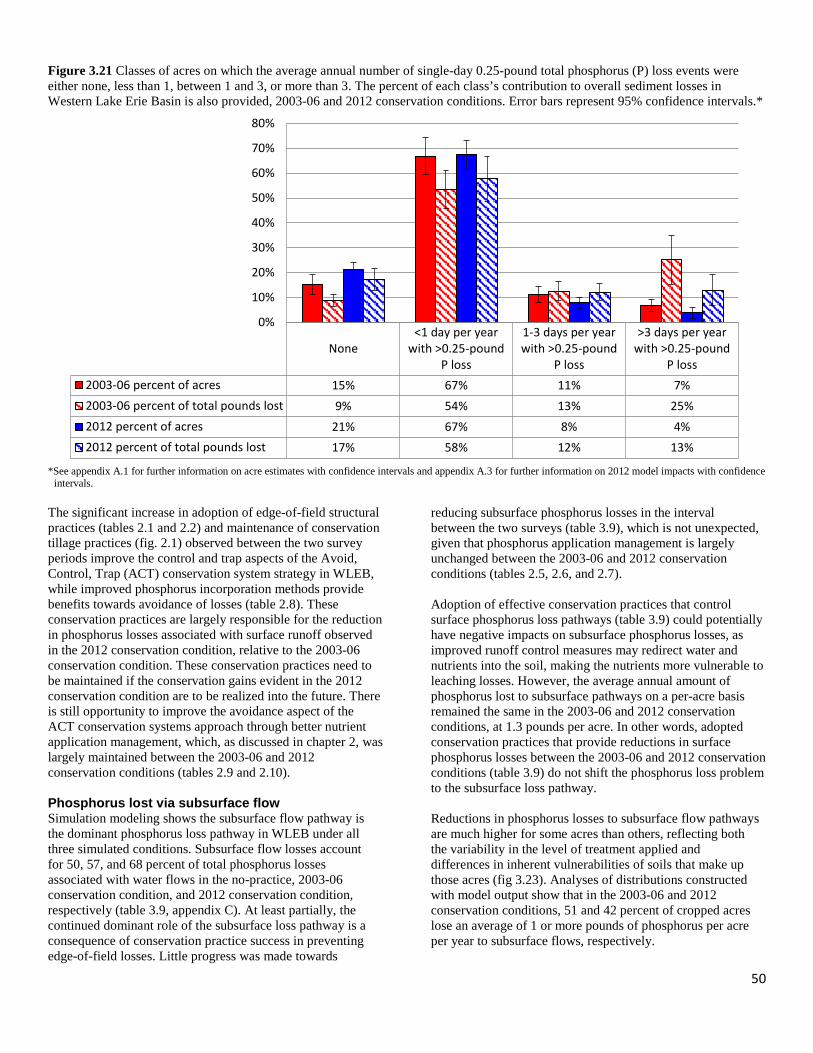
50
Figure 3.21 Classes of acres on which the average annual number of single-day 0.25-pound total phosphorus (P) loss events were either none, less than 1, between 1 and 3, or more than 3. The percent of each class’s contribution to overall sediment losses in Western Lake Erie Basin is also provided, 2003-06 and 2012 conservation conditions. Error bars represent 95% confidence intervals.*
*See appendix A.1 for further information on acre estimates with confidence intervals and appendix A.3 for further information on 2012 model impacts with confidence intervals.
The significant increase in adoption of edge-of-field structural practices (tables 2.1 and 2.2) and maintenance of conservation tillage practices (fig. 2.1) observed between the two survey periods improve the control and trap aspects of the Avoid, Control, Trap (ACT) conservation system strategy in WLEB, while improved phosphorus incorporation methods provide benefits towards avoidance of losses (table 2.8). These conservation practices are largely responsible for the reduction in phosphorus losses associated with surface runoff observed in the 2012 conservation condition, relative to the 2003-06 conservation condition. These conservation practices need to be maintained if the conservation gains evident in the 2012 conservation condition are to be realized into the future. There is still opportunity to improve the avoidance aspect of the ACT conservation systems approach through better nutrient application management, which, as discussed in chapter 2, was largely maintained between the 2003-06 and 2012 conservation conditions (tables 2.9 and 2.10). Phosphorus lost via subsurface flow Simulation modeling shows the subsurface flow pathway is the dominant phosphorus loss pathway in WLEB under all three simulated conditions. Subsurface flow losses account for 50, 57, and 68 percent of total phosphorus losses associated with water flows in the no-practice, 2003-06 conservation condition, and 2012 conservation condition, respectively (table 3.9, appendix C). At least partially, the continued dominant role of the subsurface loss pathway is a consequence of conservation practice success in preventing edge-of-field losses. Little progress was made towards
reducing subsurface phosphorus losses in the interval between the two surveys (table 3.9), which is not unexpected, given that phosphorus application management is largely unchanged between the 2003-06 and 2012 conservation conditions (tables 2.5, 2.6, and 2.7). Adoption of effective conservation practices that control surface phosphorus loss pathways (table 3.9) could potentially have negative impacts on subsurface phosphorus losses, as improved runoff control measures may redirect water and nutrients into the soil, making the nutrients more vulnerable to leaching losses. However, the average annual amount of phosphorus lost to subsurface pathways on a per-acre basis remained the same in the 2003-06 and 2012 conservation conditions, at 1.3 pounds per acre. In other words, adopted conservation practices that provide reductions in surface phosphorus losses between the 2003-06 and 2012 conservation conditions (table 3.9) do not shift the phosphorus loss problem to the subsurface loss pathway. Reductions in phosphorus losses to subsurface flow pathways are much higher for some acres than others, reflecting both the variability in the level of treatment applied and differences in inherent vulnerabilities of soils that make up those acres (fig 3.23). Analyses of distributions constructed with model output show that in the 2003-06 and 2012 conservation conditions, 51 and 42 percent of cropped acres lose an average of 1 or more pounds of phosphorus per acre per year to subsurface flows, respectively.
None<1 day per year
with >0.25-poundP loss
1-3 days per yearwith >0.25-pound
P loss
>3 days per yearwith >0.25-pound
P loss2003-06 percent of acres 15% 67% 11% 7%2003-06 percent of total pounds lost 9% 54% 13% 25%2012 percent of acres 21% 67% 8% 4%2012 percent of total pounds lost 17% 58% 12% 13%
0%
10%
20%
30%
40%
50%
60%
70%
80%
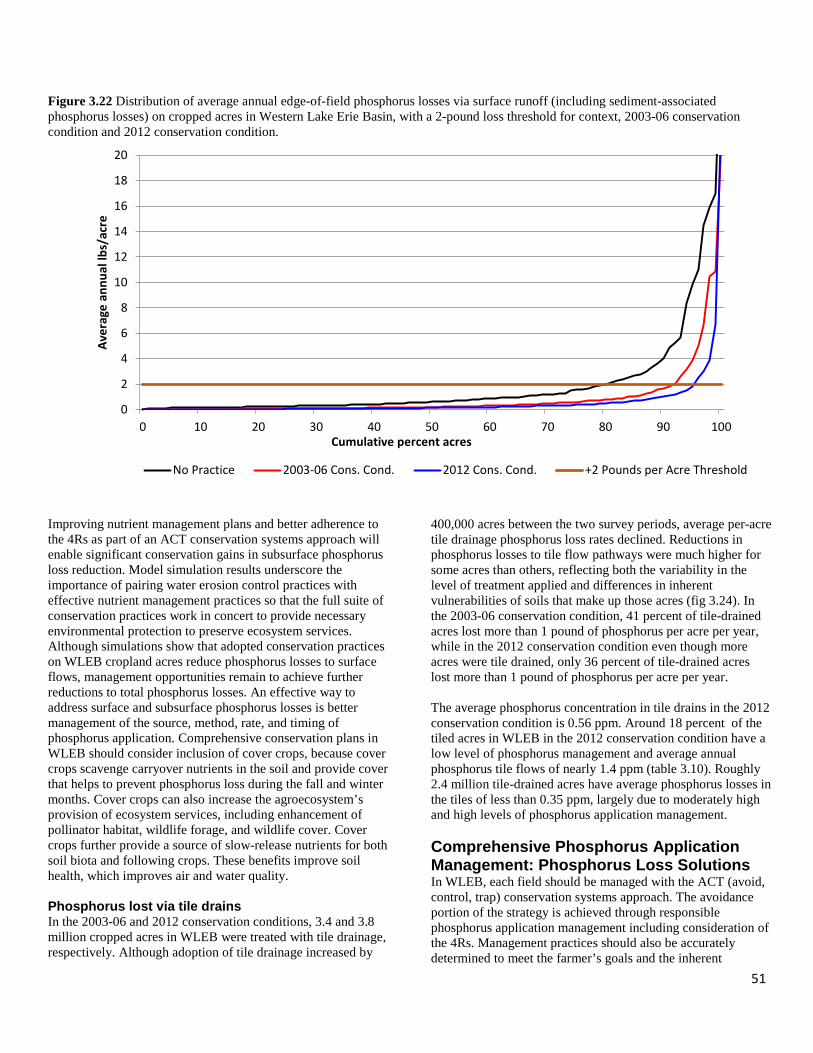
51
Figure 3.22 Distribution of average annual edge-of-field phosphorus losses via surface runoff (including sediment-associated phosphorus losses) on cropped acres in Western Lake Erie Basin, with a 2-pound loss threshold for context, 2003-06 conservation condition and 2012 conservation condition.
Improving nutrient management plans and better adherence to the 4Rs as part of an ACT conservation systems approach will enable significant conservation gains in subsurface phosphorus loss reduction. Model simulation results underscore the importance of pairing water erosion control practices with effective nutrient management practices so that the full suite of conservation practices work in concert to provide necessary environmental protection to preserve ecosystem services. Although simulations show that adopted conservation practices on WLEB cropland acres reduce phosphorus losses to surface flows, management opportunities remain to achieve further reductions to total phosphorus losses. An effective way to address surface and subsurface phosphorus losses is better management of the source, method, rate, and timing of phosphorus application. Comprehensive conservation plans in WLEB should consider inclusion of cover crops, because cover crops scavenge carryover nutrients in the soil and provide cover that helps to prevent phosphorus loss during the fall and winter months. Cover crops can also increase the agroecosystem’s provision of ecosystem services, including enhancement of pollinator habitat, wildlife forage, and wildlife cover. Cover crops further provide a source of slow-release nutrients for both soil biota and following crops. These benefits improve soil health, which improves air and water quality. Phosphorus lost via tile drains In the 2003-06 and 2012 conservation conditions, 3.4 and 3.8 million cropped acres in WLEB were treated with tile drainage, respectively. Although adoption of tile drainage increased by
400,000 acres between the two survey periods, average per-acre tile drainage phosphorus loss rates declined. Reductions in phosphorus losses to tile flow pathways were much higher for some acres than others, reflecting both the variability in the level of treatment applied and differences in inherent vulnerabilities of soils that make up those acres (fig 3.24). In the 2003-06 conservation condition, 41 percent of tile-drained acres lost more than 1 pound of phosphorus per acre per year, while in the 2012 conservation condition even though more acres were tile drained, only 36 percent of tile-drained acres lost more than 1 pound of phosphorus per acre per year. The average phosphorus concentration in tile drains in the 2012 conservation condition is 0.56 ppm. Around 18 percent of the tiled acres in WLEB in the 2012 conservation condition have a low level of phosphorus management and average annual phosphorus tile flows of nearly 1.4 ppm (table 3.10). Roughly 2.4 million tile-drained acres have average phosphorus losses in the tiles of less than 0.35 ppm, largely due to moderately high and high levels of phosphorus application management. Comprehensive Phosphorus Application Management: Phosphorus Loss Solutions In WLEB, each field should be managed with the ACT (avoid, control, trap) conservation systems approach. The avoidance portion of the strategy is achieved through responsible phosphorus application management including consideration of the 4Rs. Management practices should also be accurately determined to meet the farmer’s goals and the inherent
0
2
4
6
8
10
12
14
16
18
20
0 10 20 30 40 50 60 70 80 90 100
Aver
age
annu
al lb
s/ac
re
Cumulative percent acres
No Practice 2003-06 Cons. Cond. 2012 Cons. Cond. +2 Pounds per Acre Threshold
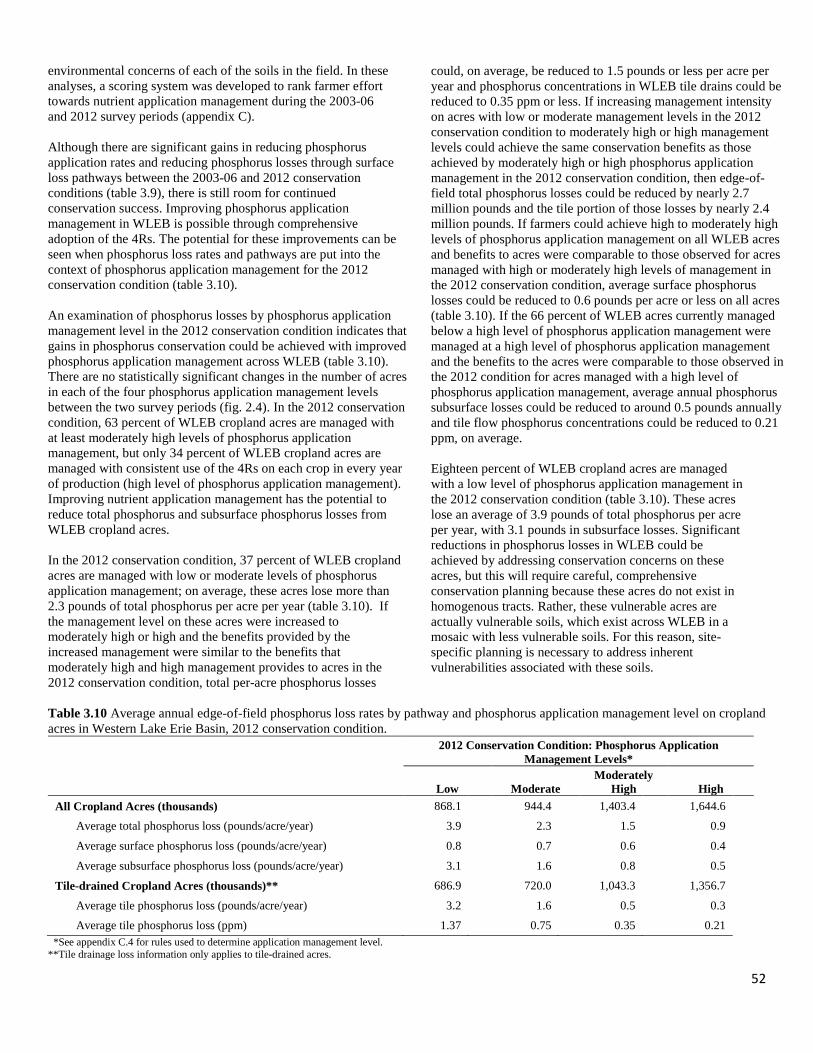
52
environmental concerns of each of the soils in the field. In these analyses, a scoring system was developed to rank farmer effort towards nutrient application management during the 2003-06 and 2012 survey periods (appendix C). Although there are significant gains in reducing phosphorus application rates and reducing phosphorus losses through surface loss pathways between the 2003-06 and 2012 conservation conditions (table 3.9), there is still room for continued conservation success. Improving phosphorus application management in WLEB is possible through comprehensive adoption of the 4Rs. The potential for these improvements can be seen when phosphorus loss rates and pathways are put into the context of phosphorus application management for the 2012 conservation condition (table 3.10). An examination of phosphorus losses by phosphorus application management level in the 2012 conservation condition indicates that gains in phosphorus conservation could be achieved with improved phosphorus application management across WLEB (table 3.10). There are no statistically significant changes in the number of acres in each of the four phosphorus application management levels between the two survey periods (fig. 2.4). In the 2012 conservation condition, 63 percent of WLEB cropland acres are managed with at least moderately high levels of phosphorus application management, but only 34 percent of WLEB cropland acres are managed with consistent use of the 4Rs on each crop in every year of production (high level of phosphorus application management). Improving nutrient application management has the potential to reduce total phosphorus and subsurface phosphorus losses from WLEB cropland acres. In the 2012 conservation condition, 37 percent of WLEB cropland acres are managed with low or moderate levels of phosphorus application management; on average, these acres lose more than 2.3 pounds of total phosphorus per acre per year (table 3.10). If the management level on these acres were increased to moderately high or high and the benefits provided by the increased management were similar to the benefits that moderately high and high management provides to acres in the 2012 conservation condition, total per-acre phosphorus losses
could, on average, be reduced to 1.5 pounds or less per acre per year and phosphorus concentrations in WLEB tile drains could be reduced to 0.35 ppm or less. If increasing management intensity on acres with low or moderate management levels in the 2012 conservation condition to moderately high or high management levels could achieve the same conservation benefits as those achieved by moderately high or high phosphorus application management in the 2012 conservation condition, then edge-of-field total phosphorus losses could be reduced by nearly 2.7 million pounds and the tile portion of those losses by nearly 2.4 million pounds. If farmers could achieve high to moderately high levels of phosphorus application management on all WLEB acres and benefits to acres were comparable to those observed for acres managed with high or moderately high levels of management in the 2012 conservation condition, average surface phosphorus losses could be reduced to 0.6 pounds per acre or less on all acres (table 3.10). If the 66 percent of WLEB acres currently managed below a high level of phosphorus application management were managed at a high level of phosphorus application management and the benefits to the acres were comparable to those observed in the 2012 condition for acres managed with a high level of phosphorus application management, average annual phosphorus subsurface losses could be reduced to around 0.5 pounds annually and tile flow phosphorus concentrations could be reduced to 0.21 ppm, on average. Eighteen percent of WLEB cropland acres are managed with a low level of phosphorus application management in the 2012 conservation condition (table 3.10). These acres lose an average of 3.9 pounds of total phosphorus per acre per year, with 3.1 pounds in subsurface losses. Significant reductions in phosphorus losses in WLEB could be achieved by addressing conservation concerns on these acres, but this will require careful, comprehensive conservation planning because these acres do not exist in homogenous tracts. Rather, these vulnerable acres are actually vulnerable soils, which exist across WLEB in a mosaic with less vulnerable soils. For this reason, site-specific planning is necessary to address inherent vulnerabilities associated with these soils.
Table 3.10 Average annual edge-of-field phosphorus loss rates by pathway and phosphorus application management level on cropland acres in Western Lake Erie Basin, 2012 conservation condition.
2012 Conservation Condition: Phosphorus Application Management Levels*
Low Moderate
Moderately High High
All Cropland Acres (thousands) 868.1 944.4 1,403.4 1,644.6
Average total phosphorus loss (pounds/acre/year) 3.9 2.3 1.5 0.9
Average surface phosphorus loss (pounds/acre/year) 0.8 0.7 0.6 0.4
Average subsurface phosphorus loss (pounds/acre/year) 3.1 1.6 0.8 0.5
Tile-drained Cropland Acres (thousands)** 686.9 720.0 1,043.3 1,356.7
Average tile phosphorus loss (pounds/acre/year) 3.2 1.6 0.5 0.3
Average tile phosphorus loss (ppm) 1.37 0.75 0.35 0.21 *See appendix C.4 for rules used to determine application management level. **Tile drainage loss information only applies to tile-drained acres.
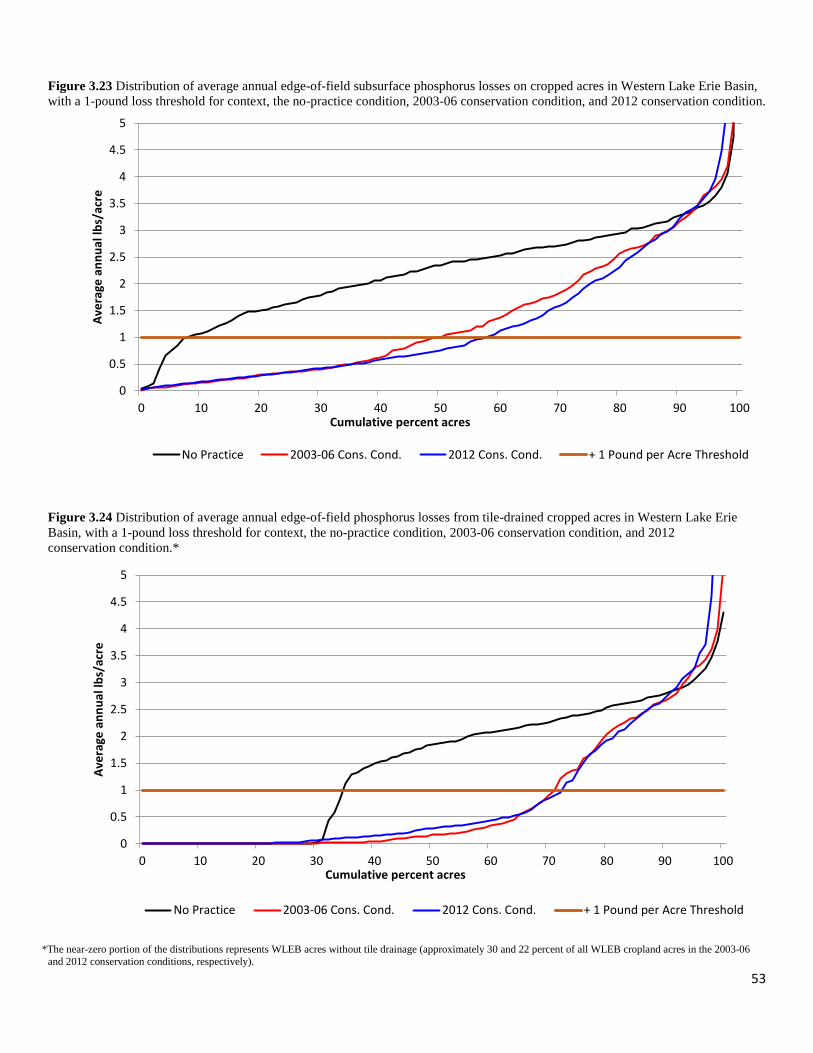
53
Figure 3.23 Distribution of average annual edge-of-field subsurface phosphorus losses on cropped acres in Western Lake Erie Basin, with a 1-pound loss threshold for context, the no-practice condition, 2003-06 conservation condition, and 2012 conservation condition.
Figure 3.24 Distribution of average annual edge-of-field phosphorus losses from tile-drained cropped acres in Western Lake Erie Basin, with a 1-pound loss threshold for context, the no-practice condition, 2003-06 conservation condition, and 2012 conservation condition.*
*The near-zero portion of the distributions represents WLEB acres without tile drainage (approximately 30 and 22 percent of all WLEB cropland acres in the 2003-06
and 2012 conservation conditions, respectively).
0
0.5
1
1.5
2
2.5
3
3.5
4
4.5
5
0 10 20 30 40 50 60 70 80 90 100
Aver
age
annu
al lb
s/ac
re
Cumulative percent acres
No Practice 2003-06 Cons. Cond. 2012 Cons. Cond. + 1 Pound per Acre Threshold
0
0.5
1
1.5
2
2.5
3
3.5
4
4.5
5
0 10 20 30 40 50 60 70 80 90 100
Aver
age
annu
al lb
s/ac
re
Cumulative percent acres
No Practice 2003-06 Cons. Cond. 2012 Cons. Cond. + 1 Pound per Acre Threshold
54
Chapter 4 Assessment of Conservation Treatment Needs Conservation practices reported to be in use in Western Lake Erie Basin (WLEB) during the 2003-06 and 2012 survey periods were evaluated to identify their anticipated long-term impacts on sediment, carbon, and nutrient loss reduction and to estimate outstanding conservation treatment needs. Current treatment levels and outstanding needs are estimated for regional resource concerns that are of particular interest in WLEB, including sediment loss, carbon dynamics, nitrogen loss via subsurface loss pathways, total phosphorus loss, and soluble phosphorus loss. Analyses of nitrogen and phosphorus losses to surface loss pathways and phosphorus losses to subsurface loss pathways are also included. Freshwater systems are particularly sensitive to phosphorus enrichment. Due to ongoing eutrophication concerns in WLEB, particular attention is paid to phosphorus losses, with a discussion on phosphorus losses via both loss pathways and a discussion on both total and soluble phosphorus losses. However, analyses here are limited to conservation practice impacts on nutrient dynamics at the edge of the field and may not directly represent delivery ratios to the streams, rivers, or lakes in WLEB. Resource loss vulnerabilities are site specific and depend on complex interactions of soils, climate, and management practices over time. Therefore, adequate treatment for each resource concern requires site-specific planning and can be achieved only by adopting management and conservation practices that consider and address inherent vulnerability factors associated with each soil in each field. Not all soils require the same level of conservation treatment and a single practice, or even a given suite of practices, will not provide the same conservation benefits to all soils. Acres that contain soils with high inherent vulnerabilities require more treatment than do acres comprised of less vulnerable soils. Soils with characteristics such as steeper slopes and impermeability tend to be more vulnerable to runoff losses, or the surface loss pathway, while flatter and more porous soils are more prone to nutrient losses through leaching, or subsurface flow pathways. Most of the nutrients lost to subsurface pathways are soluble and most eventually return to surface water through drainage ditches, tile drains, natural seeps, and groundwater return flow. Most cropland acres are a mosaic of soils vulnerable to each loss pathway to varying degrees. Similarly, each conservation practice treats concerns related to each pathway to varying degrees, with structural practices being far more effective at reducing losses to the surface pathways and nutrient management being an effective means to reduce both surface and subsurface nutrient losses. Model results suggest that conservation practice adoption in WLEB provides significant benefits towards addressing the five regional resource concerns in both the 2003-06 and 2012 conservation conditions. For the purposes of this analysis,
thresholds were set for each resource concern to represent a reasonable goal by which to estimate conservation achievements (table 4.1). Average annual per-acre loss rates from the simulated 2003-06 and 2012 conservation conditions, are compared to annual per-acre thresholds to determine conservation impacts. These thresholds are not indicative of any current conservation-related policy standards, nor are they meant to suggest appropriate standards for future policies. They are simply a metric by which to measure achievement, determine outstanding needs for each conservation concern or loss pathway, and contextualize potential future reductions. Further, attainment of the thresholds does not ensure that water quality concerns in WLEB would be met. Acres on which average annual losses are below a given threshold may still experience losses larger than the threshold in extreme weather years. Criteria used to establish conservation treatment levels and thresholds used to determine achievement of appropriate treatment levels were refined since the original (henceforth CEAP-1) USDA NRCS CEAP-Cropland National Assessment of the Great Lakes region (appendices C and D, USDA NRCS 2011). Therefore, conservation treatment needs and loss pathways for the 2003-06 conservation condition were reanalyzed alongside the 2012 conservation condition, both according to the improved criteria. Thus, the findings reported here for the 2003-06 survey results differ from those reported in the CEAP-1 analyses. Average annual per-acre loss rates over the 52-year simulations were compared with the loss thresholds to determine outstanding treatment needs. If loss rates at a point were on average below a given threshold, that point was considered to have adequate conservation treatment for that resource concern or loss pathway. A point on which average losses fall below the given threshold may still exceed the loss threshold occasionally, just as a point on which average losses exceed the threshold may not exceed the threshold every year. Loss thresholds for regional resource concerns and loss pathways were as follows (table 4.1): Regional Resource Concerns:
• Sediment: >2 tons per acre per year, • Carbon: >100 pounds per acre per year, • Subsurface nitrogen: >25 pounds per acre per year, • Total phosphorus: >2 pounds per acre per year, and • Soluble phosphorus: >1 pound per acre per year;
Remaining Loss Pathways:
• Surface nitrogen: >15 pounds per acre per year, • Surface phosphorus: >2 pounds per acre per year, and • Subsurface phosphorus: >1 pound per acre per year.
In the 2003-06 and 2012 conservation conditions, 47 and 59 percent of WLEB cropland acres, respectively, have average annual loss rates below the threshold for at least 4 of the 5 regional resource concerns, indicating that on these acres at
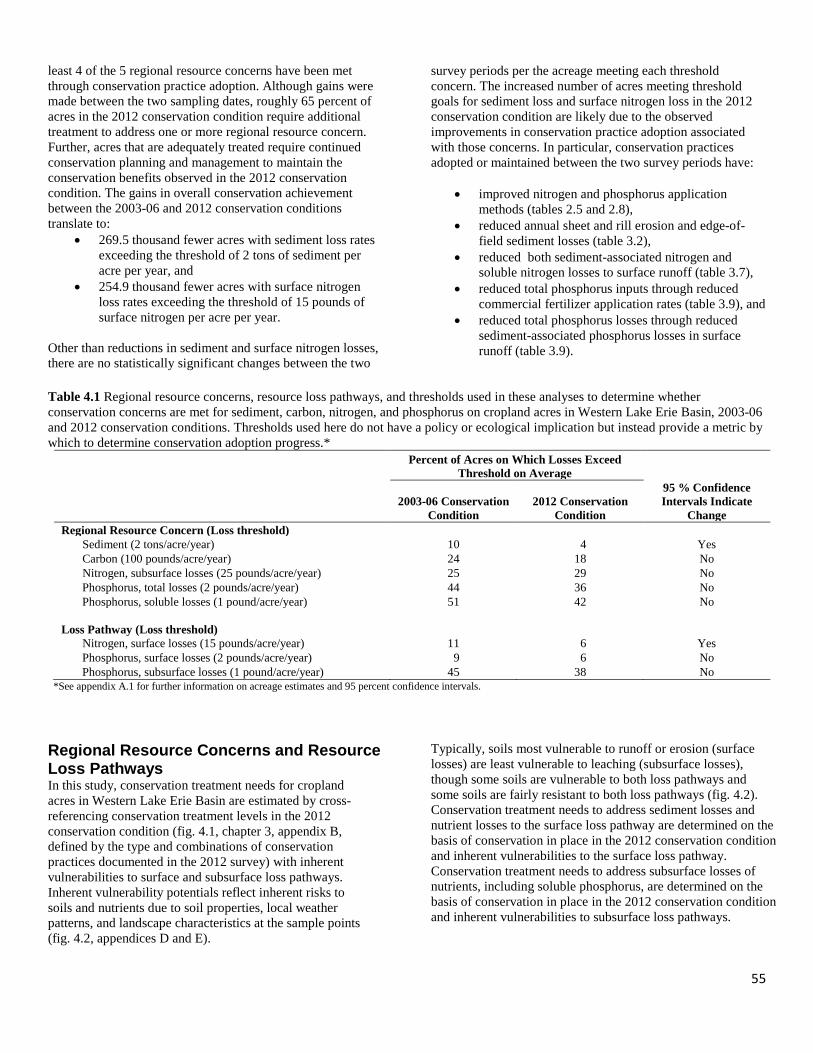
55
least 4 of the 5 regional resource concerns have been met through conservation practice adoption. Although gains were made between the two sampling dates, roughly 65 percent of acres in the 2012 conservation condition require additional treatment to address one or more regional resource concern. Further, acres that are adequately treated require continued conservation planning and management to maintain the conservation benefits observed in the 2012 conservation condition. The gains in overall conservation achievement between the 2003-06 and 2012 conservation conditions translate to:
• 269.5 thousand fewer acres with sediment loss rates exceeding the threshold of 2 tons of sediment per acre per year, and
• 254.9 thousand fewer acres with surface nitrogen loss rates exceeding the threshold of 15 pounds of surface nitrogen per acre per year.
Other than reductions in sediment and surface nitrogen losses, there are no statistically significant changes between the two
survey periods per the acreage meeting each threshold concern. The increased number of acres meeting threshold goals for sediment loss and surface nitrogen loss in the 2012 conservation condition are likely due to the observed improvements in conservation practice adoption associated with those concerns. In particular, conservation practices adopted or maintained between the two survey periods have:
• improved nitrogen and phosphorus application methods (tables 2.5 and 2.8),
• reduced annual sheet and rill erosion and edge-of-field sediment losses (table 3.2),
• reduced both sediment-associated nitrogen and soluble nitrogen losses to surface runoff (table 3.7),
• reduced total phosphorus inputs through reduced commercial fertilizer application rates (table 3.9), and
• reduced total phosphorus losses through reduced sediment-associated phosphorus losses in surface runoff (table 3.9).
Table 4.1 Regional resource concerns, resource loss pathways, and thresholds used in these analyses to determine whether conservation concerns are met for sediment, carbon, nitrogen, and phosphorus on cropland acres in Western Lake Erie Basin, 2003-06 and 2012 conservation conditions. Thresholds used here do not have a policy or ecological implication but instead provide a metric by which to determine conservation adoption progress.*
Percent of Acres on Which Losses Exceed Threshold on Average
2003-06 Conservation Condition
2012 Conservation Condition
95 % Confidence Intervals Indicate
Change Regional Resource Concern (Loss threshold) Sediment (2 tons/acre/year) 10 4 Yes Carbon (100 pounds/acre/year) 24 18 No Nitrogen, subsurface losses (25 pounds/acre/year) 25 29 No Phosphorus, total losses (2 pounds/acre/year) 44 36 No Phosphorus, soluble losses (1 pound/acre/year) 51 42 No Loss Pathway (Loss threshold) Nitrogen, surface losses (15 pounds/acre/year) 11 6 Yes Phosphorus, surface losses (2 pounds/acre/year) 9 6 No Phosphorus, subsurface losses (1 pound/acre/year) 45 38 No
*See appendix A.1 for further information on acreage estimates and 95 percent confidence intervals.
Regional Resource Concerns and Resource Loss Pathways In this study, conservation treatment needs for cropland acres in Western Lake Erie Basin are estimated by cross-referencing conservation treatment levels in the 2012 conservation condition (fig. 4.1, chapter 3, appendix B, defined by the type and combinations of conservation practices documented in the 2012 survey) with inherent vulnerabilities to surface and subsurface loss pathways. Inherent vulnerability potentials reflect inherent risks to soils and nutrients due to soil properties, local weather patterns, and landscape characteristics at the sample points (fig. 4.2, appendices D and E).
Typically, soils most vulnerable to runoff or erosion (surface losses) are least vulnerable to leaching (subsurface losses), though some soils are vulnerable to both loss pathways and some soils are fairly resistant to both loss pathways (fig. 4.2). Conservation treatment needs to address sediment losses and nutrient losses to the surface loss pathway are determined on the basis of conservation in place in the 2012 conservation condition and inherent vulnerabilities to the surface loss pathway. Conservation treatment needs to address subsurface losses of nutrients, including soluble phosphorus, are determined on the basis of conservation in place in the 2012 conservation condition and inherent vulnerabilities to subsurface loss pathways.
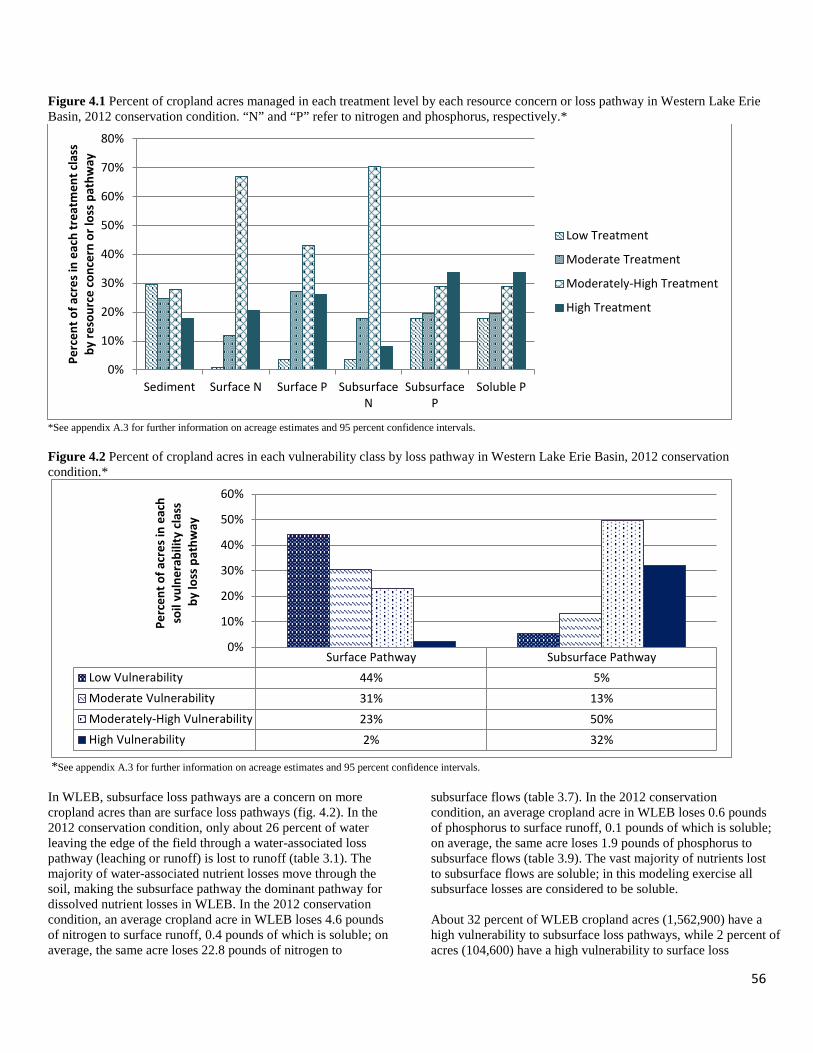
56
Figure 4.1 Percent of cropland acres managed in each treatment level by each resource concern or loss pathway in Western Lake Erie Basin, 2012 conservation condition. “N” and “P” refer to nitrogen and phosphorus, respectively.*
*See appendix A.3 for further information on acreage estimates and 95 percent confidence intervals. Figure 4.2 Percent of cropland acres in each vulnerability class by loss pathway in Western Lake Erie Basin, 2012 conservation condition.*
*See appendix A.3 for further information on acreage estimates and 95 percent confidence intervals. In WLEB, subsurface loss pathways are a concern on more cropland acres than are surface loss pathways (fig. 4.2). In the 2012 conservation condition, only about 26 percent of water leaving the edge of the field through a water-associated loss pathway (leaching or runoff) is lost to runoff (table 3.1). The majority of water-associated nutrient losses move through the soil, making the subsurface pathway the dominant pathway for dissolved nutrient losses in WLEB. In the 2012 conservation condition, an average cropland acre in WLEB loses 4.6 pounds of nitrogen to surface runoff, 0.4 pounds of which is soluble; on average, the same acre loses 22.8 pounds of nitrogen to
subsurface flows (table 3.7). In the 2012 conservation condition, an average cropland acre in WLEB loses 0.6 pounds of phosphorus to surface runoff, 0.1 pounds of which is soluble; on average, the same acre loses 1.9 pounds of phosphorus to subsurface flows (table 3.9). The vast majority of nutrients lost to subsurface flows are soluble; in this modeling exercise all subsurface losses are considered to be soluble. About 32 percent of WLEB cropland acres (1,562,900) have a high vulnerability to subsurface loss pathways, while 2 percent of acres (104,600) have a high vulnerability to surface loss
0%
10%
20%
30%
40%
50%
60%
70%
80%
Sediment Surface N Surface P SubsurfaceN
SubsurfaceP
Soluble P
Perc
ent o
f acr
es in
eac
h tr
eatm
ent c
lass
by
reso
urce
con
cern
or l
oss
path
way
Low Treatment
Moderate Treatment
Moderately-High Treatment
High Treatment
Surface Pathway Subsurface PathwayLow Vulnerability 44% 5%Moderate Vulnerability 31% 13%Moderately-High Vulnerability 23% 50%High Vulnerability 2% 32%
0%
10%
20%
30%
40%
50%
60%
Perc
ent o
f acr
es in
eac
h so
il vu
lner
abili
ty c
lass
by lo
ss p
athw
ay
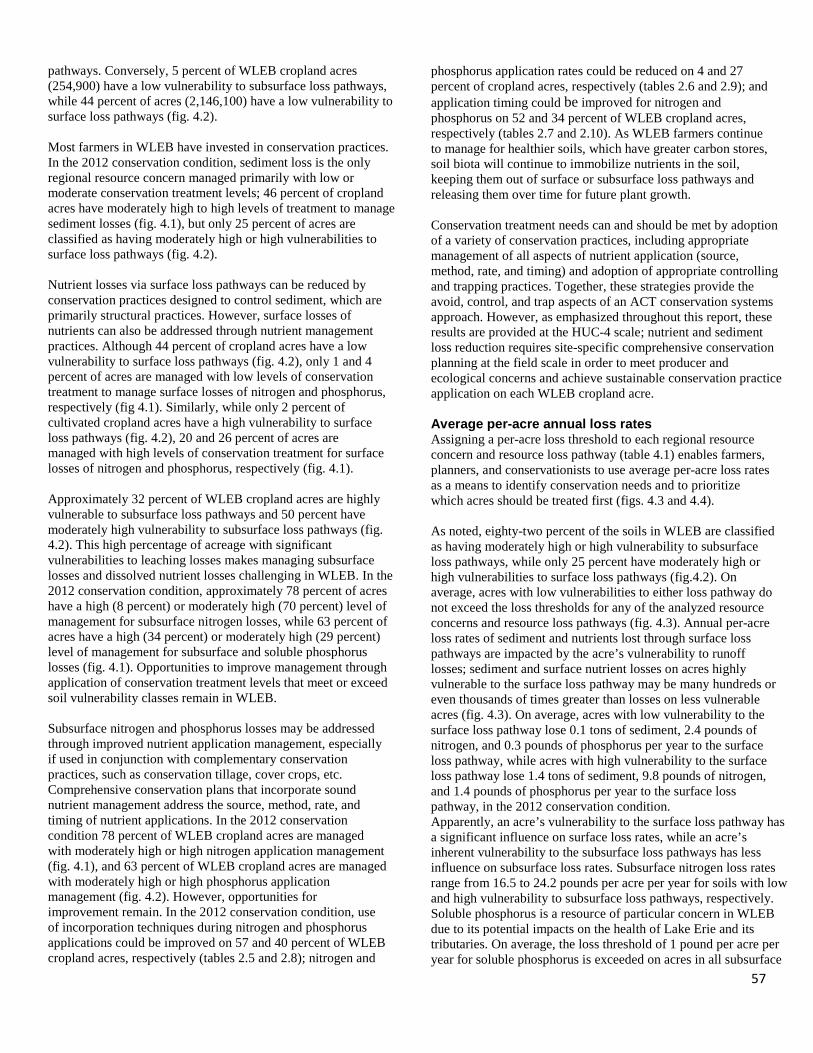
57
pathways. Conversely, 5 percent of WLEB cropland acres (254,900) have a low vulnerability to subsurface loss pathways, while 44 percent of acres (2,146,100) have a low vulnerability to surface loss pathways (fig. 4.2). Most farmers in WLEB have invested in conservation practices. In the 2012 conservation condition, sediment loss is the only regional resource concern managed primarily with low or moderate conservation treatment levels; 46 percent of cropland acres have moderately high to high levels of treatment to manage sediment losses (fig. 4.1), but only 25 percent of acres are classified as having moderately high or high vulnerabilities to surface loss pathways (fig. 4.2). Nutrient losses via surface loss pathways can be reduced by conservation practices designed to control sediment, which are primarily structural practices. However, surface losses of nutrients can also be addressed through nutrient management practices. Although 44 percent of cropland acres have a low vulnerability to surface loss pathways (fig. 4.2), only 1 and 4 percent of acres are managed with low levels of conservation treatment to manage surface losses of nitrogen and phosphorus, respectively (fig 4.1). Similarly, while only 2 percent of cultivated cropland acres have a high vulnerability to surface loss pathways (fig. 4.2), 20 and 26 percent of acres are managed with high levels of conservation treatment for surface losses of nitrogen and phosphorus, respectively (fig. 4.1). Approximately 32 percent of WLEB cropland acres are highly vulnerable to subsurface loss pathways and 50 percent have moderately high vulnerability to subsurface loss pathways (fig. 4.2). This high percentage of acreage with significant vulnerabilities to leaching losses makes managing subsurface losses and dissolved nutrient losses challenging in WLEB. In the 2012 conservation condition, approximately 78 percent of acres have a high (8 percent) or moderately high (70 percent) level of management for subsurface nitrogen losses, while 63 percent of acres have a high (34 percent) or moderately high (29 percent) level of management for subsurface and soluble phosphorus losses (fig. 4.1). Opportunities to improve management through application of conservation treatment levels that meet or exceed soil vulnerability classes remain in WLEB. Subsurface nitrogen and phosphorus losses may be addressed through improved nutrient application management, especially if used in conjunction with complementary conservation practices, such as conservation tillage, cover crops, etc. Comprehensive conservation plans that incorporate sound nutrient management address the source, method, rate, and timing of nutrient applications. In the 2012 conservation condition 78 percent of WLEB cropland acres are managed with moderately high or high nitrogen application management (fig. 4.1), and 63 percent of WLEB cropland acres are managed with moderately high or high phosphorus application management (fig. 4.2). However, opportunities for improvement remain. In the 2012 conservation condition, use of incorporation techniques during nitrogen and phosphorus applications could be improved on 57 and 40 percent of WLEB cropland acres, respectively (tables 2.5 and 2.8); nitrogen and
phosphorus application rates could be reduced on 4 and 27 percent of cropland acres, respectively (tables 2.6 and 2.9); and application timing could be improved for nitrogen and phosphorus on 52 and 34 percent of WLEB cropland acres, respectively (tables 2.7 and 2.10). As WLEB farmers continue to manage for healthier soils, which have greater carbon stores, soil biota will continue to immobilize nutrients in the soil, keeping them out of surface or subsurface loss pathways and releasing them over time for future plant growth. Conservation treatment needs can and should be met by adoption of a variety of conservation practices, including appropriate management of all aspects of nutrient application (source, method, rate, and timing) and adoption of appropriate controlling and trapping practices. Together, these strategies provide the avoid, control, and trap aspects of an ACT conservation systems approach. However, as emphasized throughout this report, these results are provided at the HUC-4 scale; nutrient and sediment loss reduction requires site-specific comprehensive conservation planning at the field scale in order to meet producer and ecological concerns and achieve sustainable conservation practice application on each WLEB cropland acre. Average per-acre annual loss rates Assigning a per-acre loss threshold to each regional resource concern and resource loss pathway (table 4.1) enables farmers, planners, and conservationists to use average per-acre loss rates as a means to identify conservation needs and to prioritize which acres should be treated first (figs. 4.3 and 4.4). As noted, eighty-two percent of the soils in WLEB are classified as having moderately high or high vulnerability to subsurface loss pathways, while only 25 percent have moderately high or high vulnerabilities to surface loss pathways (fig.4.2). On average, acres with low vulnerabilities to either loss pathway do not exceed the loss thresholds for any of the analyzed resource concerns and resource loss pathways (fig. 4.3). Annual per-acre loss rates of sediment and nutrients lost through surface loss pathways are impacted by the acre’s vulnerability to runoff losses; sediment and surface nutrient losses on acres highly vulnerable to the surface loss pathway may be many hundreds or even thousands of times greater than losses on less vulnerable acres (fig. 4.3). On average, acres with low vulnerability to the surface loss pathway lose 0.1 tons of sediment, 2.4 pounds of nitrogen, and 0.3 pounds of phosphorus per year to the surface loss pathway, while acres with high vulnerability to the surface loss pathway lose 1.4 tons of sediment, 9.8 pounds of nitrogen, and 1.4 pounds of phosphorus per year to the surface loss pathway, in the 2012 conservation condition. Apparently, an acre’s vulnerability to the surface loss pathway has a significant influence on surface loss rates, while an acre’s inherent vulnerability to the subsurface loss pathways has less influence on subsurface loss rates. Subsurface nitrogen loss rates range from 16.5 to 24.2 pounds per acre per year for soils with low and high vulnerability to subsurface loss pathways, respectively. Soluble phosphorus is a resource of particular concern in WLEB due to its potential impacts on the health of Lake Erie and its tributaries. On average, the loss threshold of 1 pound per acre per year for soluble phosphorus is exceeded on acres in all subsurface
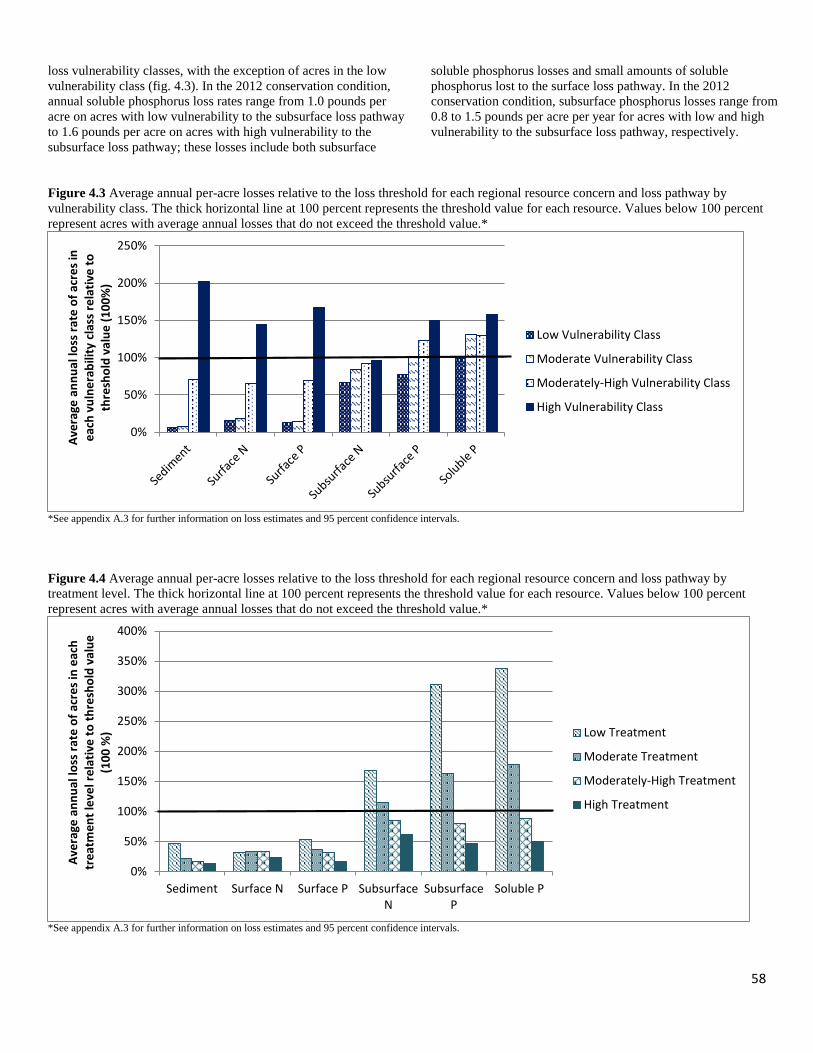
58
loss vulnerability classes, with the exception of acres in the low vulnerability class (fig. 4.3). In the 2012 conservation condition, annual soluble phosphorus loss rates range from 1.0 pounds per acre on acres with low vulnerability to the subsurface loss pathway to 1.6 pounds per acre on acres with high vulnerability to the subsurface loss pathway; these losses include both subsurface
soluble phosphorus losses and small amounts of soluble phosphorus lost to the surface loss pathway. In the 2012 conservation condition, subsurface phosphorus losses range from 0.8 to 1.5 pounds per acre per year for acres with low and high vulnerability to the subsurface loss pathway, respectively.
Figure 4.3 Average annual per-acre losses relative to the loss threshold for each regional resource concern and loss pathway by vulnerability class. The thick horizontal line at 100 percent represents the threshold value for each resource. Values below 100 percent represent acres with average annual losses that do not exceed the threshold value.*
*See appendix A.3 for further information on loss estimates and 95 percent confidence intervals. Figure 4.4 Average annual per-acre losses relative to the loss threshold for each regional resource concern and loss pathway by treatment level. The thick horizontal line at 100 percent represents the threshold value for each resource. Values below 100 percent represent acres with average annual losses that do not exceed the threshold value.*
*See appendix A.3 for further information on loss estimates and 95 percent confidence intervals.
0%
50%
100%
150%
200%
250%
Aver
age
annu
al lo
ss ra
te o
f acr
es in
ea
ch v
ulne
rabi
lity
clas
s re
lativ
e to
th
resh
old
valu
e (1
00%
)
Low Vulnerability Class
Moderate Vulnerability Class
Moderately-High Vulnerability Class
High Vulnerability Class
0%
50%
100%
150%
200%
250%
300%
350%
400%
Sediment Surface N Surface P SubsurfaceN
SubsurfaceP
Soluble P
Aver
age
annu
al lo
ss ra
te o
f acr
es in
eac
h tr
eatm
ent l
evel
rela
tive
to th
resh
old
valu
e (1
00 %
) Low Treatment
Moderate Treatment
Moderately-High Treatment
High Treatment
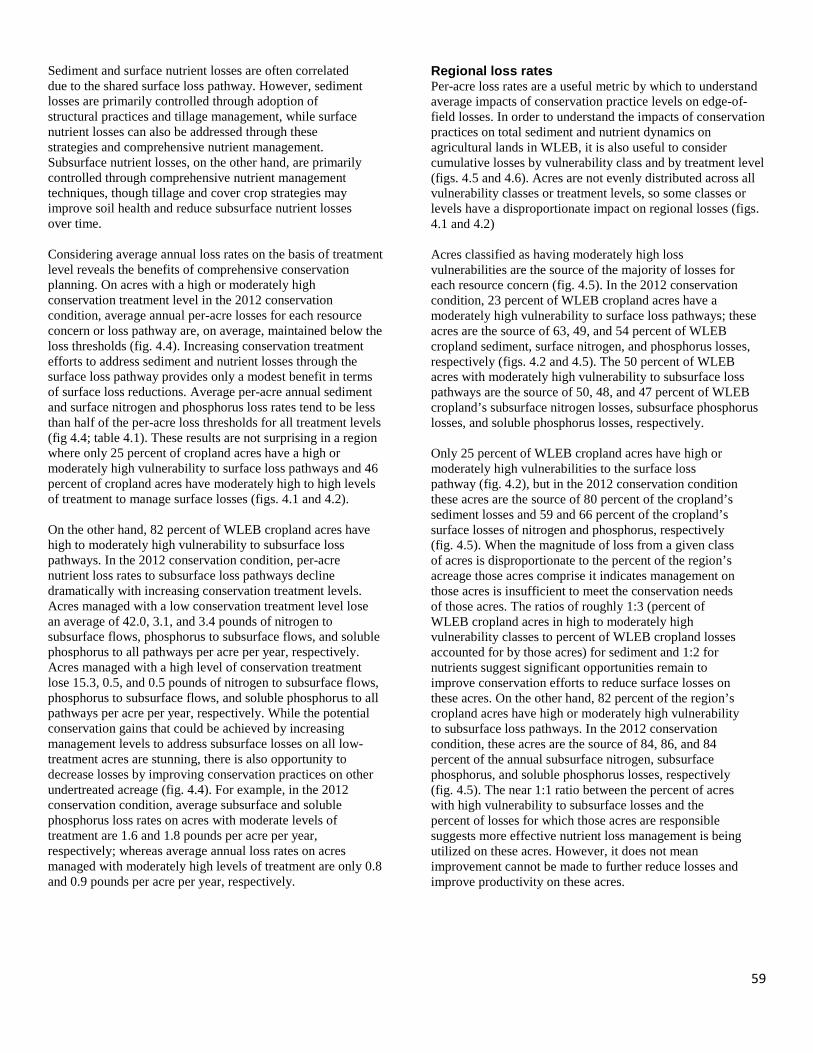
59
Sediment and surface nutrient losses are often correlated due to the shared surface loss pathway. However, sediment losses are primarily controlled through adoption of structural practices and tillage management, while surface nutrient losses can also be addressed through these strategies and comprehensive nutrient management. Subsurface nutrient losses, on the other hand, are primarily controlled through comprehensive nutrient management techniques, though tillage and cover crop strategies may improve soil health and reduce subsurface nutrient losses over time. Considering average annual loss rates on the basis of treatment level reveals the benefits of comprehensive conservation planning. On acres with a high or moderately high conservation treatment level in the 2012 conservation condition, average annual per-acre losses for each resource concern or loss pathway are, on average, maintained below the loss thresholds (fig. 4.4). Increasing conservation treatment efforts to address sediment and nutrient losses through the surface loss pathway provides only a modest benefit in terms of surface loss reductions. Average per-acre annual sediment and surface nitrogen and phosphorus loss rates tend to be less than half of the per-acre loss thresholds for all treatment levels (fig 4.4; table 4.1). These results are not surprising in a region where only 25 percent of cropland acres have a high or moderately high vulnerability to surface loss pathways and 46 percent of cropland acres have moderately high to high levels of treatment to manage surface losses (figs. 4.1 and 4.2). On the other hand, 82 percent of WLEB cropland acres have high to moderately high vulnerability to subsurface loss pathways. In the 2012 conservation condition, per-acre nutrient loss rates to subsurface loss pathways decline dramatically with increasing conservation treatment levels. Acres managed with a low conservation treatment level lose an average of 42.0, 3.1, and 3.4 pounds of nitrogen to subsurface flows, phosphorus to subsurface flows, and soluble phosphorus to all pathways per acre per year, respectively. Acres managed with a high level of conservation treatment lose 15.3, 0.5, and 0.5 pounds of nitrogen to subsurface flows, phosphorus to subsurface flows, and soluble phosphorus to all pathways per acre per year, respectively. While the potential conservation gains that could be achieved by increasing management levels to address subsurface losses on all low-treatment acres are stunning, there is also opportunity to decrease losses by improving conservation practices on other undertreated acreage (fig. 4.4). For example, in the 2012 conservation condition, average subsurface and soluble phosphorus loss rates on acres with moderate levels of treatment are 1.6 and 1.8 pounds per acre per year, respectively; whereas average annual loss rates on acres managed with moderately high levels of treatment are only 0.8 and 0.9 pounds per acre per year, respectively.
Regional loss rates Per-acre loss rates are a useful metric by which to understand average impacts of conservation practice levels on edge-of-field losses. In order to understand the impacts of conservation practices on total sediment and nutrient dynamics on agricultural lands in WLEB, it is also useful to consider cumulative losses by vulnerability class and by treatment level (figs. 4.5 and 4.6). Acres are not evenly distributed across all vulnerability classes or treatment levels, so some classes or levels have a disproportionate impact on regional losses (figs. 4.1 and 4.2) Acres classified as having moderately high loss vulnerabilities are the source of the majority of losses for each resource concern (fig. 4.5). In the 2012 conservation condition, 23 percent of WLEB cropland acres have a moderately high vulnerability to surface loss pathways; these acres are the source of 63, 49, and 54 percent of WLEB cropland sediment, surface nitrogen, and phosphorus losses, respectively (figs. 4.2 and 4.5). The 50 percent of WLEB acres with moderately high vulnerability to subsurface loss pathways are the source of 50, 48, and 47 percent of WLEB cropland’s subsurface nitrogen losses, subsurface phosphorus losses, and soluble phosphorus losses, respectively. Only 25 percent of WLEB cropland acres have high or moderately high vulnerabilities to the surface loss pathway (fig. 4.2), but in the 2012 conservation condition these acres are the source of 80 percent of the cropland’s sediment losses and 59 and 66 percent of the cropland’s surface losses of nitrogen and phosphorus, respectively (fig. 4.5). When the magnitude of loss from a given class of acres is disproportionate to the percent of the region’s acreage those acres comprise it indicates management on those acres is insufficient to meet the conservation needs of those acres. The ratios of roughly 1:3 (percent of WLEB cropland acres in high to moderately high vulnerability classes to percent of WLEB cropland losses accounted for by those acres) for sediment and 1:2 for nutrients suggest significant opportunities remain to improve conservation efforts to reduce surface losses on these acres. On the other hand, 82 percent of the region’s cropland acres have high or moderately high vulnerability to subsurface loss pathways. In the 2012 conservation condition, these acres are the source of 84, 86, and 84 percent of the annual subsurface nitrogen, subsurface phosphorus, and soluble phosphorus losses, respectively (fig. 4.5). The near 1:1 ratio between the percent of acres with high vulnerability to subsurface losses and the percent of losses for which those acres are responsible suggests more effective nutrient loss management is being utilized on these acres. However, it does not mean improvement cannot be made to further reduce losses and improve productivity on these acres.
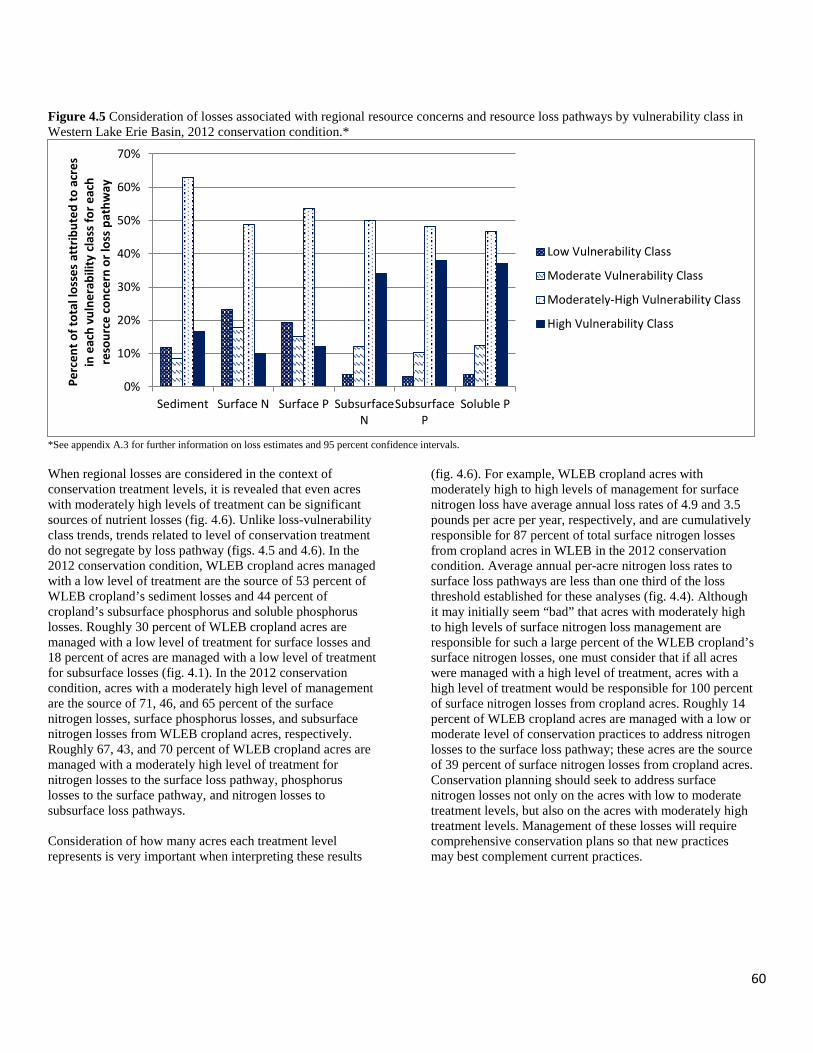
60
Figure 4.5 Consideration of losses associated with regional resource concerns and resource loss pathways by vulnerability class in Western Lake Erie Basin, 2012 conservation condition.*
*See appendix A.3 for further information on loss estimates and 95 percent confidence intervals. When regional losses are considered in the context of conservation treatment levels, it is revealed that even acres with moderately high levels of treatment can be significant sources of nutrient losses (fig. 4.6). Unlike loss-vulnerability class trends, trends related to level of conservation treatment do not segregate by loss pathway (figs. 4.5 and 4.6). In the 2012 conservation condition, WLEB cropland acres managed with a low level of treatment are the source of 53 percent of WLEB cropland’s sediment losses and 44 percent of cropland’s subsurface phosphorus and soluble phosphorus losses. Roughly 30 percent of WLEB cropland acres are managed with a low level of treatment for surface losses and 18 percent of acres are managed with a low level of treatment for subsurface losses (fig. 4.1). In the 2012 conservation condition, acres with a moderately high level of management are the source of 71, 46, and 65 percent of the surface nitrogen losses, surface phosphorus losses, and subsurface nitrogen losses from WLEB cropland acres, respectively. Roughly 67, 43, and 70 percent of WLEB cropland acres are managed with a moderately high level of treatment for nitrogen losses to the surface loss pathway, phosphorus losses to the surface pathway, and nitrogen losses to subsurface loss pathways. Consideration of how many acres each treatment level represents is very important when interpreting these results
(fig. 4.6). For example, WLEB cropland acres with moderately high to high levels of management for surface nitrogen loss have average annual loss rates of 4.9 and 3.5 pounds per acre per year, respectively, and are cumulatively responsible for 87 percent of total surface nitrogen losses from cropland acres in WLEB in the 2012 conservation condition. Average annual per-acre nitrogen loss rates to surface loss pathways are less than one third of the loss threshold established for these analyses (fig. 4.4). Although it may initially seem “bad” that acres with moderately high to high levels of surface nitrogen loss management are responsible for such a large percent of the WLEB cropland’s surface nitrogen losses, one must consider that if all acres were managed with a high level of treatment, acres with a high level of treatment would be responsible for 100 percent of surface nitrogen losses from cropland acres. Roughly 14 percent of WLEB cropland acres are managed with a low or moderate level of conservation practices to address nitrogen losses to the surface loss pathway; these acres are the source of 39 percent of surface nitrogen losses from cropland acres. Conservation planning should seek to address surface nitrogen losses not only on the acres with low to moderate treatment levels, but also on the acres with moderately high treatment levels. Management of these losses will require comprehensive conservation plans so that new practices may best complement current practices.
0%
10%
20%
30%
40%
50%
60%
70%
Sediment Surface N Surface P SubsurfaceN
SubsurfaceP
Soluble P
Perc
ent o
f tot
al lo
sses
att
ribut
ed to
acr
es
in e
ach
vuln
erab
ility
cla
ss fo
r eac
h re
sour
ce c
once
rn o
r los
s pa
thw
ay
Low Vulnerability Class
Moderate Vulnerability Class
Moderately-High Vulnerability Class
High Vulnerability Class
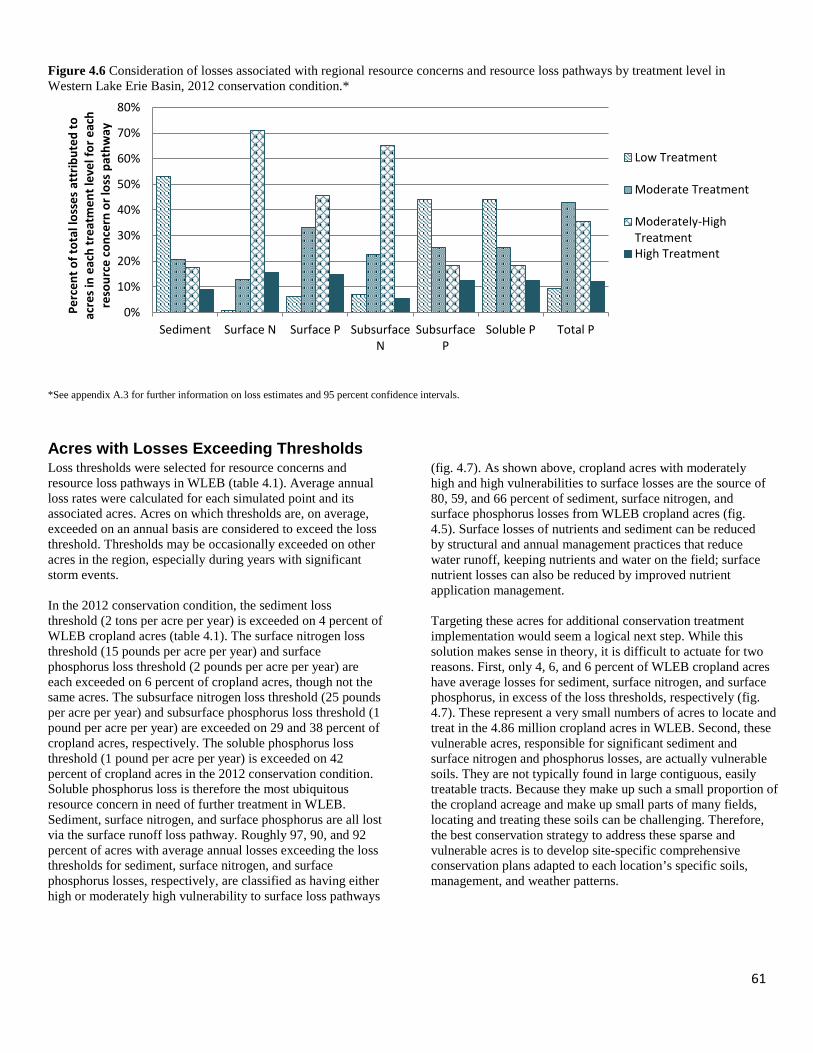
61
Figure 4.6 Consideration of losses associated with regional resource concerns and resource loss pathways by treatment level in Western Lake Erie Basin, 2012 conservation condition.*
*See appendix A.3 for further information on loss estimates and 95 percent confidence intervals. Acres with Losses Exceeding Thresholds Loss thresholds were selected for resource concerns and resource loss pathways in WLEB (table 4.1). Average annual loss rates were calculated for each simulated point and its associated acres. Acres on which thresholds are, on average, exceeded on an annual basis are considered to exceed the loss threshold. Thresholds may be occasionally exceeded on other acres in the region, especially during years with significant storm events. In the 2012 conservation condition, the sediment loss threshold (2 tons per acre per year) is exceeded on 4 percent of WLEB cropland acres (table 4.1). The surface nitrogen loss threshold (15 pounds per acre per year) and surface phosphorus loss threshold (2 pounds per acre per year) are each exceeded on 6 percent of cropland acres, though not the same acres. The subsurface nitrogen loss threshold (25 pounds per acre per year) and subsurface phosphorus loss threshold (1 pound per acre per year) are exceeded on 29 and 38 percent of cropland acres, respectively. The soluble phosphorus loss threshold (1 pound per acre per year) is exceeded on 42 percent of cropland acres in the 2012 conservation condition. Soluble phosphorus loss is therefore the most ubiquitous resource concern in need of further treatment in WLEB. Sediment, surface nitrogen, and surface phosphorus are all lost via the surface runoff loss pathway. Roughly 97, 90, and 92 percent of acres with average annual losses exceeding the loss thresholds for sediment, surface nitrogen, and surface phosphorus losses, respectively, are classified as having either high or moderately high vulnerability to surface loss pathways
(fig. 4.7). As shown above, cropland acres with moderately high and high vulnerabilities to surface losses are the source of 80, 59, and 66 percent of sediment, surface nitrogen, and surface phosphorus losses from WLEB cropland acres (fig. 4.5). Surface losses of nutrients and sediment can be reduced by structural and annual management practices that reduce water runoff, keeping nutrients and water on the field; surface nutrient losses can also be reduced by improved nutrient application management. Targeting these acres for additional conservation treatment implementation would seem a logical next step. While this solution makes sense in theory, it is difficult to actuate for two reasons. First, only 4, 6, and 6 percent of WLEB cropland acres have average losses for sediment, surface nitrogen, and surface phosphorus, in excess of the loss thresholds, respectively (fig. 4.7). These represent a very small numbers of acres to locate and treat in the 4.86 million cropland acres in WLEB. Second, these vulnerable acres, responsible for significant sediment and surface nitrogen and phosphorus losses, are actually vulnerable soils. They are not typically found in large contiguous, easily treatable tracts. Because they make up such a small proportion of the cropland acreage and make up small parts of many fields, locating and treating these soils can be challenging. Therefore, the best conservation strategy to address these sparse and vulnerable acres is to develop site-specific comprehensive conservation plans adapted to each location’s specific soils, management, and weather patterns.
0%
10%
20%
30%
40%
50%
60%
70%
80%
Sediment Surface N Surface P SubsurfaceN
SubsurfaceP
Soluble P Total P
Perc
ent o
f tot
al lo
sses
att
ribut
ed to
ac
res i
n ea
ch tr
eatm
ent l
evel
for e
ach
reso
urce
con
cern
or l
oss
path
way
Low Treatment
Moderate Treatment
Moderately-HighTreatmentHigh Treatment
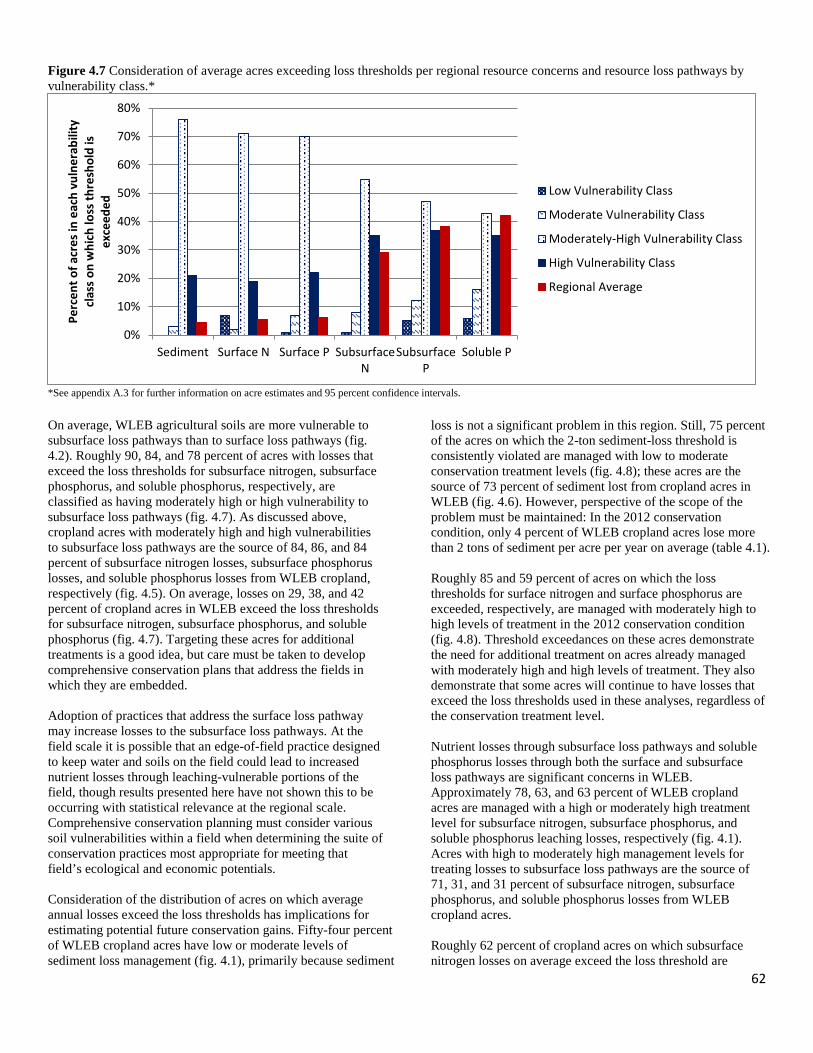
62
Figure 4.7 Consideration of average acres exceeding loss thresholds per regional resource concerns and resource loss pathways by vulnerability class.*
*See appendix A.3 for further information on acre estimates and 95 percent confidence intervals. On average, WLEB agricultural soils are more vulnerable to subsurface loss pathways than to surface loss pathways (fig. 4.2). Roughly 90, 84, and 78 percent of acres with losses that exceed the loss thresholds for subsurface nitrogen, subsurface phosphorus, and soluble phosphorus, respectively, are classified as having moderately high or high vulnerability to subsurface loss pathways (fig. 4.7). As discussed above, cropland acres with moderately high and high vulnerabilities to subsurface loss pathways are the source of 84, 86, and 84 percent of subsurface nitrogen losses, subsurface phosphorus losses, and soluble phosphorus losses from WLEB cropland, respectively (fig. 4.5). On average, losses on 29, 38, and 42 percent of cropland acres in WLEB exceed the loss thresholds for subsurface nitrogen, subsurface phosphorus, and soluble phosphorus (fig. 4.7). Targeting these acres for additional treatments is a good idea, but care must be taken to develop comprehensive conservation plans that address the fields in which they are embedded. Adoption of practices that address the surface loss pathway may increase losses to the subsurface loss pathways. At the field scale it is possible that an edge-of-field practice designed to keep water and soils on the field could lead to increased nutrient losses through leaching-vulnerable portions of the field, though results presented here have not shown this to be occurring with statistical relevance at the regional scale. Comprehensive conservation planning must consider various soil vulnerabilities within a field when determining the suite of conservation practices most appropriate for meeting that field’s ecological and economic potentials. Consideration of the distribution of acres on which average annual losses exceed the loss thresholds has implications for estimating potential future conservation gains. Fifty-four percent of WLEB cropland acres have low or moderate levels of sediment loss management (fig. 4.1), primarily because sediment
loss is not a significant problem in this region. Still, 75 percent of the acres on which the 2-ton sediment-loss threshold is consistently violated are managed with low to moderate conservation treatment levels (fig. 4.8); these acres are the source of 73 percent of sediment lost from cropland acres in WLEB (fig. 4.6). However, perspective of the scope of the problem must be maintained: In the 2012 conservation condition, only 4 percent of WLEB cropland acres lose more than 2 tons of sediment per acre per year on average (table 4.1). Roughly 85 and 59 percent of acres on which the loss thresholds for surface nitrogen and surface phosphorus are exceeded, respectively, are managed with moderately high to high levels of treatment in the 2012 conservation condition (fig. 4.8). Threshold exceedances on these acres demonstrate the need for additional treatment on acres already managed with moderately high and high levels of treatment. They also demonstrate that some acres will continue to have losses that exceed the loss thresholds used in these analyses, regardless of the conservation treatment level. Nutrient losses through subsurface loss pathways and soluble phosphorus losses through both the surface and subsurface loss pathways are significant concerns in WLEB. Approximately 78, 63, and 63 percent of WLEB cropland acres are managed with a high or moderately high treatment level for subsurface nitrogen, subsurface phosphorus, and soluble phosphorus leaching losses, respectively (fig. 4.1). Acres with high to moderately high management levels for treating losses to subsurface loss pathways are the source of 71, 31, and 31 percent of subsurface nitrogen, subsurface phosphorus, and soluble phosphorus losses from WLEB cropland acres. Roughly 62 percent of cropland acres on which subsurface nitrogen losses on average exceed the loss threshold are
0%
10%
20%
30%
40%
50%
60%
70%
80%
Sediment Surface N Surface P SubsurfaceN
SubsurfaceP
Soluble P
Perc
ent o
f acr
es in
eac
h vu
lner
abili
ty
clas
s on
whi
ch lo
ss th
resh
old
is
exce
eded
Low Vulnerability Class
Moderate Vulnerability Class
Moderately-High Vulnerability Class
High Vulnerability Class
Regional Average
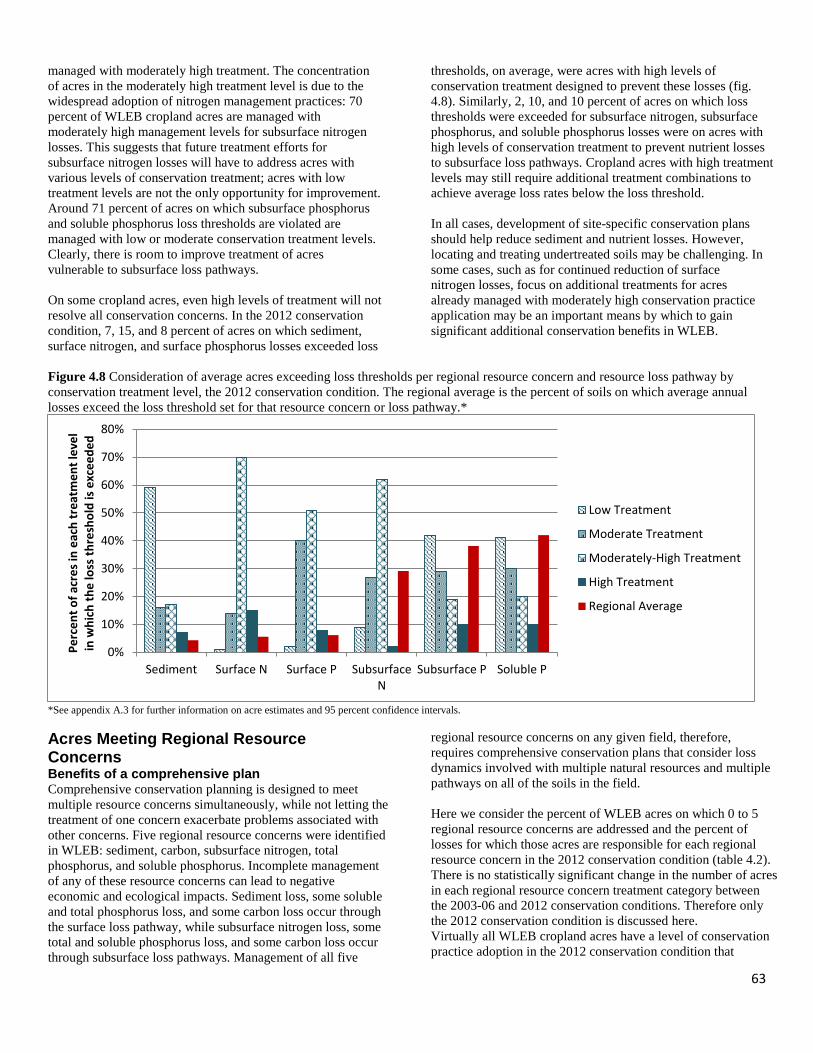
63
managed with moderately high treatment. The concentration of acres in the moderately high treatment level is due to the widespread adoption of nitrogen management practices: 70 percent of WLEB cropland acres are managed with moderately high management levels for subsurface nitrogen losses. This suggests that future treatment efforts for subsurface nitrogen losses will have to address acres with various levels of conservation treatment; acres with low treatment levels are not the only opportunity for improvement. Around 71 percent of acres on which subsurface phosphorus and soluble phosphorus loss thresholds are violated are managed with low or moderate conservation treatment levels. Clearly, there is room to improve treatment of acres vulnerable to subsurface loss pathways. On some cropland acres, even high levels of treatment will not resolve all conservation concerns. In the 2012 conservation condition, 7, 15, and 8 percent of acres on which sediment, surface nitrogen, and surface phosphorus losses exceeded loss
thresholds, on average, were acres with high levels of conservation treatment designed to prevent these losses (fig. 4.8). Similarly, 2, 10, and 10 percent of acres on which loss thresholds were exceeded for subsurface nitrogen, subsurface phosphorus, and soluble phosphorus losses were on acres with high levels of conservation treatment to prevent nutrient losses to subsurface loss pathways. Cropland acres with high treatment levels may still require additional treatment combinations to achieve average loss rates below the loss threshold. In all cases, development of site-specific conservation plans should help reduce sediment and nutrient losses. However, locating and treating undertreated soils may be challenging. In some cases, such as for continued reduction of surface nitrogen losses, focus on additional treatments for acres already managed with moderately high conservation practice application may be an important means by which to gain significant additional conservation benefits in WLEB.
Figure 4.8 Consideration of average acres exceeding loss thresholds per regional resource concern and resource loss pathway by conservation treatment level, the 2012 conservation condition. The regional average is the percent of soils on which average annual losses exceed the loss threshold set for that resource concern or loss pathway.*
*See appendix A.3 for further information on acre estimates and 95 percent confidence intervals.
Acres Meeting Regional Resource Concerns Benefits of a comprehensive plan Comprehensive conservation planning is designed to meet multiple resource concerns simultaneously, while not letting the treatment of one concern exacerbate problems associated with other concerns. Five regional resource concerns were identified in WLEB: sediment, carbon, subsurface nitrogen, total phosphorus, and soluble phosphorus. Incomplete management of any of these resource concerns can lead to negative economic and ecological impacts. Sediment loss, some soluble and total phosphorus loss, and some carbon loss occur through the surface loss pathway, while subsurface nitrogen loss, some total and soluble phosphorus loss, and some carbon loss occur through subsurface loss pathways. Management of all five
regional resource concerns on any given field, therefore, requires comprehensive conservation plans that consider loss dynamics involved with multiple natural resources and multiple pathways on all of the soils in the field. Here we consider the percent of WLEB acres on which 0 to 5 regional resource concerns are addressed and the percent of losses for which those acres are responsible for each regional resource concern in the 2012 conservation condition (table 4.2). There is no statistically significant change in the number of acres in each regional resource concern treatment category between the 2003-06 and 2012 conservation conditions. Therefore only the 2012 conservation condition is discussed here. Virtually all WLEB cropland acres have a level of conservation practice adoption in the 2012 conservation condition that
0%
10%
20%
30%
40%
50%
60%
70%
80%
Sediment Surface N Surface P SubsurfaceN
Subsurface P Soluble P
Perc
ent o
f acr
es in
eac
h tr
eatm
ent l
evel
in
whi
ch th
e lo
ss th
resh
old
is e
xcee
ded
Low Treatment
Moderate Treatment
Moderately-High Treatment
High Treatment
Regional Average
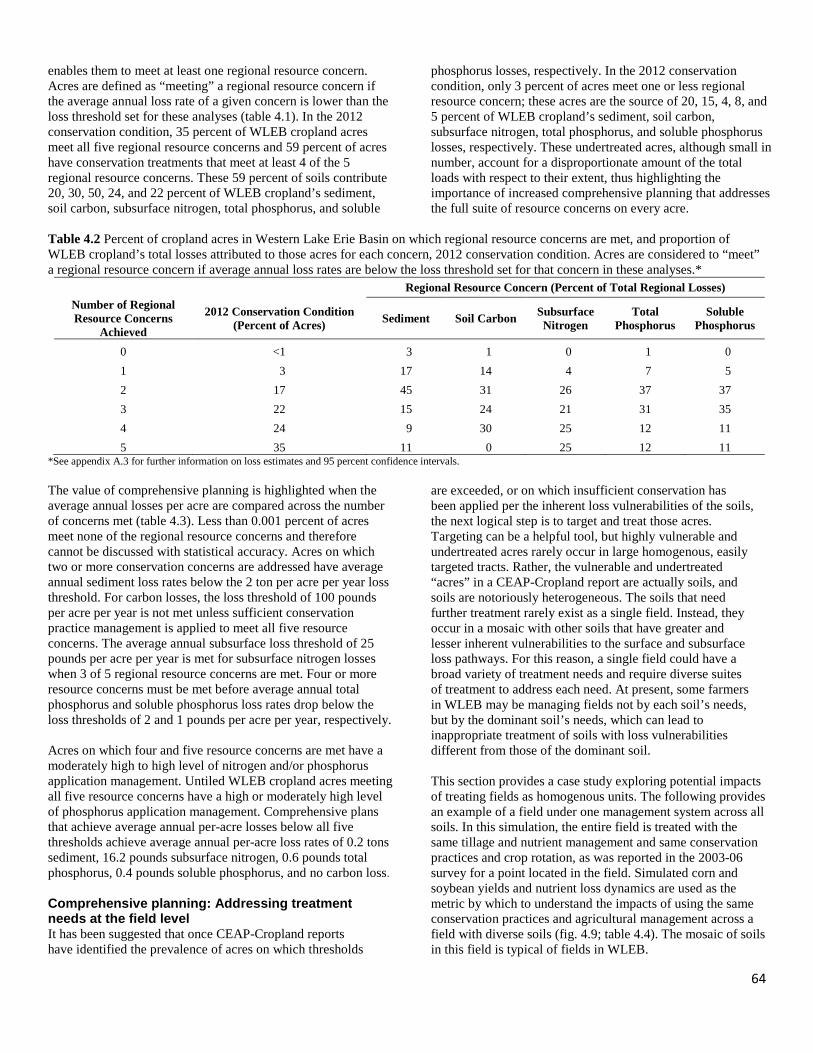
64
enables them to meet at least one regional resource concern. Acres are defined as “meeting” a regional resource concern if the average annual loss rate of a given concern is lower than the loss threshold set for these analyses (table 4.1). In the 2012 conservation condition, 35 percent of WLEB cropland acres meet all five regional resource concerns and 59 percent of acres have conservation treatments that meet at least 4 of the 5 regional resource concerns. These 59 percent of soils contribute 20, 30, 50, 24, and 22 percent of WLEB cropland’s sediment, soil carbon, subsurface nitrogen, total phosphorus, and soluble
phosphorus losses, respectively. In the 2012 conservation condition, only 3 percent of acres meet one or less regional resource concern; these acres are the source of 20, 15, 4, 8, and 5 percent of WLEB cropland’s sediment, soil carbon, subsurface nitrogen, total phosphorus, and soluble phosphorus losses, respectively. These undertreated acres, although small in number, account for a disproportionate amount of the total loads with respect to their extent, thus highlighting the importance of increased comprehensive planning that addresses the full suite of resource concerns on every acre.
Table 4.2 Percent of cropland acres in Western Lake Erie Basin on which regional resource concerns are met, and proportion of WLEB cropland’s total losses attributed to those acres for each concern, 2012 conservation condition. Acres are considered to “meet” a regional resource concern if average annual loss rates are below the loss threshold set for that concern in these analyses.*
Regional Resource Concern (Percent of Total Regional Losses) Number of Regional Resource Concerns
Achieved
2012 Conservation Condition (Percent of Acres) Sediment Soil Carbon Subsurface
Nitrogen Total
Phosphorus Soluble
Phosphorus
0 <1 3 1 0 1 0 1 3 17 14 4 7 5 2 17 45 31 26 37 37 3 22 15 24 21 31 35 4 24 9 30 25 12 11 5 35 11 0 25 12 11
*See appendix A.3 for further information on loss estimates and 95 percent confidence intervals. The value of comprehensive planning is highlighted when the average annual losses per acre are compared across the number of concerns met (table 4.3). Less than 0.001 percent of acres meet none of the regional resource concerns and therefore cannot be discussed with statistical accuracy. Acres on which two or more conservation concerns are addressed have average annual sediment loss rates below the 2 ton per acre per year loss threshold. For carbon losses, the loss threshold of 100 pounds per acre per year is not met unless sufficient conservation practice management is applied to meet all five resource concerns. The average annual subsurface loss threshold of 25 pounds per acre per year is met for subsurface nitrogen losses when 3 of 5 regional resource concerns are met. Four or more resource concerns must be met before average annual total phosphorus and soluble phosphorus loss rates drop below the loss thresholds of 2 and 1 pounds per acre per year, respectively. Acres on which four and five resource concerns are met have a moderately high to high level of nitrogen and/or phosphorus application management. Untiled WLEB cropland acres meeting all five resource concerns have a high or moderately high level of phosphorus application management. Comprehensive plans that achieve average annual per-acre losses below all five thresholds achieve average annual per-acre loss rates of 0.2 tons sediment, 16.2 pounds subsurface nitrogen, 0.6 pounds total phosphorus, 0.4 pounds soluble phosphorus, and no carbon loss. Comprehensive planning: Addressing treatment needs at the field level It has been suggested that once CEAP-Cropland reports have identified the prevalence of acres on which thresholds
are exceeded, or on which insufficient conservation has been applied per the inherent loss vulnerabilities of the soils, the next logical step is to target and treat those acres. Targeting can be a helpful tool, but highly vulnerable and undertreated acres rarely occur in large homogenous, easily targeted tracts. Rather, the vulnerable and undertreated “acres” in a CEAP-Cropland report are actually soils, and soils are notoriously heterogeneous. The soils that need further treatment rarely exist as a single field. Instead, they occur in a mosaic with other soils that have greater and lesser inherent vulnerabilities to the surface and subsurface loss pathways. For this reason, a single field could have a broad variety of treatment needs and require diverse suites of treatment to address each need. At present, some farmers in WLEB may be managing fields not by each soil’s needs, but by the dominant soil’s needs, which can lead to inappropriate treatment of soils with loss vulnerabilities different from those of the dominant soil. This section provides a case study exploring potential impacts of treating fields as homogenous units. The following provides an example of a field under one management system across all soils. In this simulation, the entire field is treated with the same tillage and nutrient management and same conservation practices and crop rotation, as was reported in the 2003-06 survey for a point located in the field. Simulated corn and soybean yields and nutrient loss dynamics are used as the metric by which to understand the impacts of using the same conservation practices and agricultural management across a field with diverse soils (fig. 4.9; table 4.4). The mosaic of soils in this field is typical of fields in WLEB.
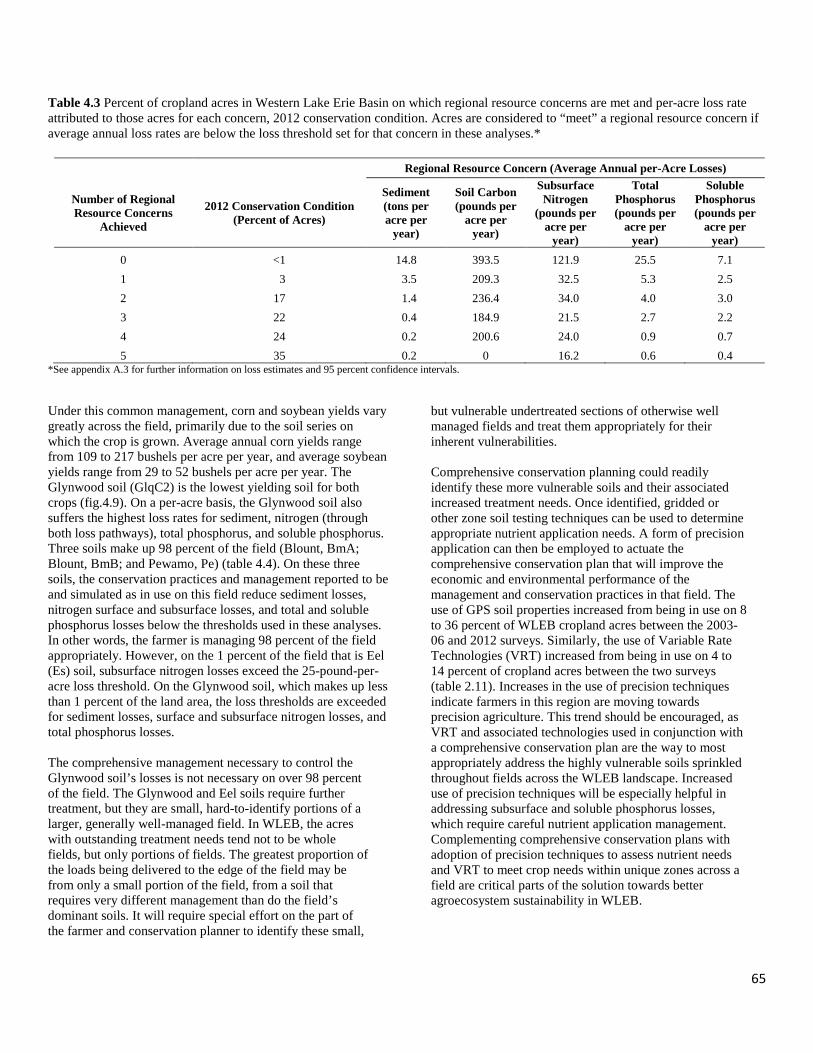
65
Table 4.3 Percent of cropland acres in Western Lake Erie Basin on which regional resource concerns are met and per-acre loss rate attributed to those acres for each concern, 2012 conservation condition. Acres are considered to “meet” a regional resource concern if average annual loss rates are below the loss threshold set for that concern in these analyses.*
Regional Resource Concern (Average Annual per-Acre Losses)
Number of Regional Resource Concerns
Achieved
2012 Conservation Condition (Percent of Acres)
Sediment (tons per acre per
year)
Soil Carbon (pounds per
acre per year)
Subsurface Nitrogen
(pounds per acre per
year)
Total Phosphorus (pounds per
acre per year)
Soluble Phosphorus (pounds per
acre per year)
0 <1 14.8 393.5 121.9 25.5 7.1 1 3 3.5 209.3 32.5 5.3 2.5 2 17 1.4 236.4 34.0 4.0 3.0 3 22 0.4 184.9 21.5 2.7 2.2 4 24 0.2 200.6 24.0 0.9 0.7 5 35 0.2 0 16.2 0.6 0.4
*See appendix A.3 for further information on loss estimates and 95 percent confidence intervals. Under this common management, corn and soybean yields vary greatly across the field, primarily due to the soil series on which the crop is grown. Average annual corn yields range from 109 to 217 bushels per acre per year, and average soybean yields range from 29 to 52 bushels per acre per year. The Glynwood soil (GlqC2) is the lowest yielding soil for both crops (fig.4.9). On a per-acre basis, the Glynwood soil also suffers the highest loss rates for sediment, nitrogen (through both loss pathways), total phosphorus, and soluble phosphorus. Three soils make up 98 percent of the field (Blount, BmA; Blount, BmB; and Pewamo, Pe) (table 4.4). On these three soils, the conservation practices and management reported to be and simulated as in use on this field reduce sediment losses, nitrogen surface and subsurface losses, and total and soluble phosphorus losses below the thresholds used in these analyses. In other words, the farmer is managing 98 percent of the field appropriately. However, on the 1 percent of the field that is Eel (Es) soil, subsurface nitrogen losses exceed the 25-pound-per-acre loss threshold. On the Glynwood soil, which makes up less than 1 percent of the land area, the loss thresholds are exceeded for sediment losses, surface and subsurface nitrogen losses, and total phosphorus losses. The comprehensive management necessary to control the Glynwood soil’s losses is not necessary on over 98 percent of the field. The Glynwood and Eel soils require further treatment, but they are small, hard-to-identify portions of a larger, generally well-managed field. In WLEB, the acres with outstanding treatment needs tend not to be whole fields, but only portions of fields. The greatest proportion of the loads being delivered to the edge of the field may be from only a small portion of the field, from a soil that requires very different management than do the field’s dominant soils. It will require special effort on the part of the farmer and conservation planner to identify these small,
but vulnerable undertreated sections of otherwise well managed fields and treat them appropriately for their inherent vulnerabilities. Comprehensive conservation planning could readily identify these more vulnerable soils and their associated increased treatment needs. Once identified, gridded or other zone soil testing techniques can be used to determine appropriate nutrient application needs. A form of precision application can then be employed to actuate the comprehensive conservation plan that will improve the economic and environmental performance of the management and conservation practices in that field. The use of GPS soil properties increased from being in use on 8 to 36 percent of WLEB cropland acres between the 2003-06 and 2012 surveys. Similarly, the use of Variable Rate Technologies (VRT) increased from being in use on 4 to 14 percent of cropland acres between the two surveys (table 2.11). Increases in the use of precision techniques indicate farmers in this region are moving towards precision agriculture. This trend should be encouraged, as VRT and associated technologies used in conjunction with a comprehensive conservation plan are the way to most appropriately address the highly vulnerable soils sprinkled throughout fields across the WLEB landscape. Increased use of precision techniques will be especially helpful in addressing subsurface and soluble phosphorus losses, which require careful nutrient application management. Complementing comprehensive conservation plans with adoption of precision techniques to assess nutrient needs and VRT to meet crop needs within unique zones across a field are critical parts of the solution towards better agroecosystem sustainability in WLEB.
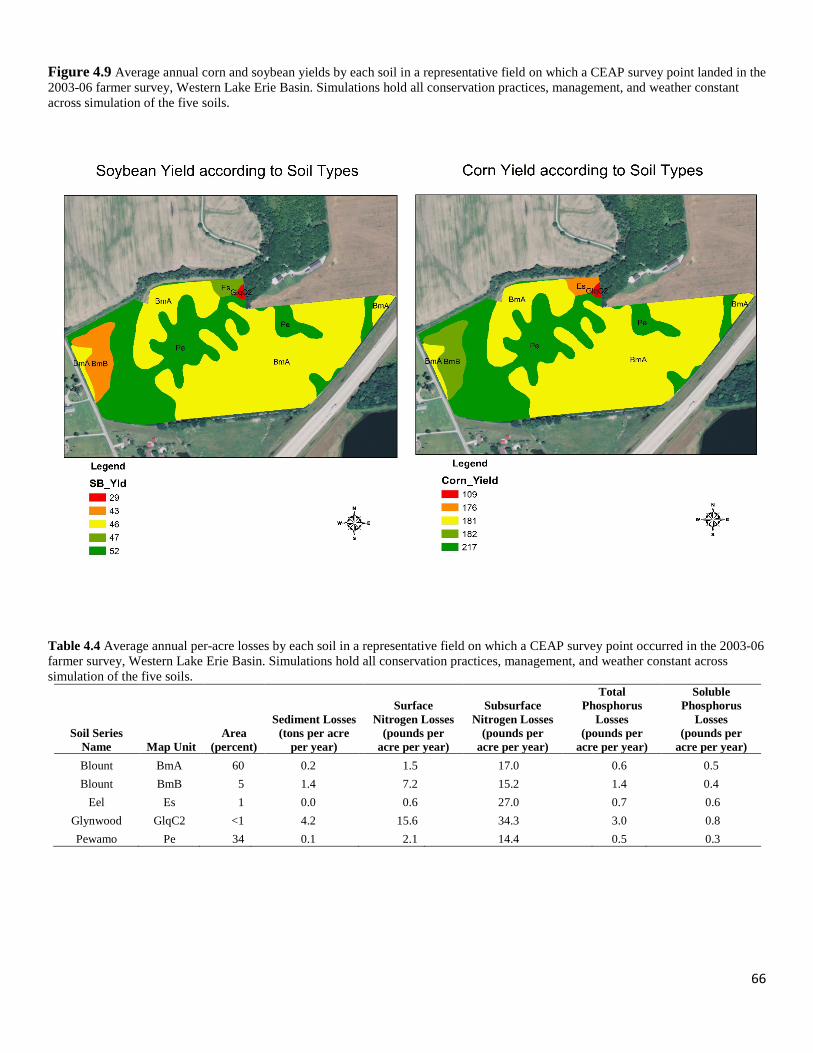
66
Figure 4.9 Average annual corn and soybean yields by each soil in a representative field on which a CEAP survey point landed in the 2003-06 farmer survey, Western Lake Erie Basin. Simulations hold all conservation practices, management, and weather constant across simulation of the five soils.
Table 4.4 Average annual per-acre losses by each soil in a representative field on which a CEAP survey point occurred in the 2003-06 farmer survey, Western Lake Erie Basin. Simulations hold all conservation practices, management, and weather constant across simulation of the five soils.
Soil Series Name Map Unit
Area (percent)
Sediment Losses (tons per acre
per year)
Surface Nitrogen Losses
(pounds per acre per year)
Subsurface Nitrogen Losses
(pounds per acre per year)
Total Phosphorus
Losses (pounds per
acre per year)
Soluble Phosphorus
Losses (pounds per
acre per year) Blount BmA 60 0.2 1.5 17.0 0.6 0.5 Blount BmB 5 1.4 7.2 15.2 1.4 0.4
Eel Es 1 0.0 0.6 27.0 0.7 0.6 Glynwood GlqC2 <1 4.2 15.6 34.3 3.0 0.8 Pewamo Pe 34 0.1 2.1 14.4 0.5 0.3
67
Chapter 5 Exploring Conservation Solutions Although the relatively flat landscapes and preponderance of corn-soybean crop rotations in Western Lake Erie Basin (WLEB) may suggest homogeneity to the casual observer, in actuality WLEB’s croplands are rich in diversity, both in terms of soils and in terms of management. Characteristics of farm fields, farming operations, and farmer goals, preferences, and management ability vary across the basin. These differences contribute to differences in both conservation needs and potential solutions. The conservation strategies simulated here were developed in conjunction with local farmers, producer groups, consultants, researchers, non-profit groups, non-governmental organizations, agronomists, and land use planners in WLEB. As noted throughout this report, there is no universal best conservation practice. Rather, each conservation practice is designed to address particular conservation concerns in particular settings, taking into consideration various aspects related to soils, including the slope, texture, depth, weather, and current and past management practices. Most conservation practices are designed to act in complementarity with other conservation practices. The strategies explored are applied with the goal of maximizing reductions in total and soluble phosphorus loss, per the goals of the Great Lakes Water Quality Reduction Act (GLWQA). Potential impacts of the various strategies on these and other resource concerns are reported here, along with potential impacts on yields. However, analyses presented here are limited to nutrient and sediment dynamics on and at the edge of the field. Instream dynamics and delivery ratios are beyond the scope of this report. Each strategy works well for some acres, or soils, and works less well on other soils, because the simulated strategies are necessarily more generic in their application of practices than a field office conservation practice planner working in close communication with a farmer would be. In these simulated strategies, practices are not applied randomly across the agricultural landscape, as they are in some modeling studies. Rather, practices are applied only on acres where they are appropriate (appendix G). However, because these simulations are at a coarse, regional scale, and farm field needs are site specific, the practices simulated in a given strategy may not be the best practices to meet specific goals and needs on a farmer’s field. Field scale planning is the only way to address the diversity of needs of all of the soils in a farm field. Each comprehensive conservation plan should consist of a suite of complementary conservation practices that address the variety of concerns on a given field, because seldom does a farm field have only one concern. Soil tests and variable rate technologies (VRT) can assist in the development and implementation of comprehensive conservation plans. These strategies are not intended to suggest regional conservation decisions or policy. Rather, analyses provide perspective on
possible tradeoffs associated with widespread adoption of specific conservation strategies. Analyses examine interactions between various conservation gains and productivity for each simulated strategy. A discussion of costs associated with conservation adoption will be presented in a separate report on this region. In 2015, binational phosphorus load reductions were established for Lake Erie in the Great Lakes Water Quality Agreement (GLWQA), Annex 4, Section B. The following binational goals were set: a 40-percent reduction in total phosphorus loading, a 40-percent reduction in soluble loading during the spring months, and a 40-percent reduction in total phosphorus loading during the spring months, relative to loads recorded for 2008. In early 2016, the Governors of Ohio and Michigan and the Premier of the Province of Ontario penned the Western Basin of Lake Erie Collaborative Agreement, in which they agreed to reduce soluble phosphorus loading into Lake Erie by 40 percent relative to 2008 loading rates. Domestic Action plans are slated for development in 2018. Here we present nutrient and sediment dynamics at the edge of the field for each simulated strategy. The ENC strategy, which incorporates erosion control, nutrient management, and cover crops, achieves the highest phosphorus loss reductions. ENC has the potential to provide a 43-percent reduction in total phosphorus and a 27-percent reduction in soluble phosphorus losses at the edge of the field. However, edge-of-field benefits are not directly reflective of reductions to instream loads and delivery ratios. Additionally, although ENC provides better nutrient loss reductions than any other simulated strategy, there are costs associated with its broad-scale implementation. ENC requires intensive inputs in terms of constructing structural practices across WLEB, which may take small portions of agricultural land out of production. ENC requires commitment by farmers to convert to new nutrient management strategies, which may require purchase of new equipment and require learning and accommodation by each and every farmer. ENC also requires establishment of cover crops at every possible time in the crop calendar on all acres, which is costly, and requires fuel inputs, soil testing, and additional management time and inputs. Finally, ubiquitous adoption of ENC would mean accepting yield declines across the basin for both corn and soybeans without increased soil testing and nutrient management adjusted accordingly. The costs and benefits associated with ENC indicate that it may not be feasible to achieve the various 40-percent reduction goals by treating only the live agricultural loads. Additional efforts addressing losses from non-agricultural lands and the legacy sediments in stream beds, stream banks, and ditch banks will be required to meet the goals. In addition to individual field management solutions, landscape-scale or watershed-scale solutions should be considered, including wetland restoration or construction. There is no silver bullet solution. Not only will no single solution meet all conservation needs of all soils in a field, but also no single solution is ideal for every farmer in the region. Simulated strategies and the practices they entail are not referred to as “best management practices” (BMPs) in this
68
report, because the BMPs for a given field must be determined on a site-specific basis. No single BMP will solve all the conservation concerns of WLEB, unless that BMP is development and deployment of site-specific, comprehensive conservation planning, actuated through variable rate technologies and other precision farming techniques. Strategy Simulation, Set-up, and Definitions In the original (henceforth CEAP-1) USDA NRCS CEAP-Cropland National Assessment of the Great Lakes region, impacts of various conservation practice strategies were compared to simulated impacts of converting all agricultural land to “natural conditions” (USDA NRCS 2011). In this “background” simulation, all cropland acres were simulated as grass or tree mixtures without tillage or nutrient inputs. Other researchers have also simulated Western Lake Erie Basin cropland using a hypothetical baseline of “natural conditions” as the point of comparison to determine conservation practice impacts (Bosch et al. 2013). A “natural conditions” strategy is not included in this report. Western Lake Erie Basin is the source of 2.1 percent and 3.3 percent of the Nation’s corn and soybean production, respectively (USDA NRCS 2007a). Cropland in WLEB generates over $3.5 billion in agricultural sales every year. WLEB produces 15 and 19 percent of corn and soybean production in the tri-state area. It is unreasonable to assume that all agricultural land in the region will ever be converted to grasslands or forests, as this would have significant deleterious social and economic impacts regionally, nationally, and possibly globally. The conservation solution strategies are compared against each other, the 2012 conservation condition, and the no-practice condition (NP). In general, conservation solution strategies focus on adoption of structural practices, nutrient management practices, other management practices (e.g. tillage, cover crop adoption, drainage water management), and combinations of these approaches (table 5.1). In the NP condition, WLEB cropland acres are simulated as having no conservation practices in place (appendix B). The NP condition does not simulate a time period prior to conservation practice implementation, but rather, it represents the potential impacts of farming without structural or cultural conservation practices. The NP condition represents a rollback in conservation practice adoption, meant to represent dynamics that would be observed if all conservation practices in place in the 2012 conservation condition were abandoned. The 2012 conservation condition is provided as a reference condition against which to compare conservation potentials of the various strategies. Seven single-approach conservation practice strategies are explored here (table 5.1). The two simulated structural practice strategies are structural erosion control (SEC) and drainage water management (DWM). Two simulated nutrient management strategies include enhanced nutrient management (NM), which improves method, rate, and timing of nutrient applications and enhanced nutrient management with split applications (NMS), which uses splitting strategies to decrease application rates and spread risk across the
growing season. Cover crop adoption is also simulated, both with the use of tillage to terminate the cover crop (CCT) and without tillage termination (CC). Impacts of tillage (TIL) management are also explored. Rules used to apply practices in these conservation strategies are outlined in appendix G. Typically, a comprehensive conservation plan does not use a solitary approach. Instead, a plan includes a suite of conservation practices, intended to reduce nutrient and sediment losses via the ACT (avoid, control, trap) conservation systems approach. Nutrient management practices, which help avoid nutrient losses, are applied in conjunction with structural and tillage practices that control and trap nutrients and sediment before they leave the field. Additionally practices, like tillage management, cover crops, and drainage water management augment the structural and nutrient management practices to more fully address surface and subsurface loss pathways. Four multi-approach strategies simulate adoption of suites of practices. SEC and NM are combined in a strategy representing adoption of structural erosion controls and enhanced nutrient management (ENM). SEC and NMS are combined to simulate structural erosion control with enhanced nutrient management that incorporates split applications (ENS).The inclusion of cover crops as part of a suite of conservation practices is explored in ENC, which applies SEC, NM, and CC to all appropriate acreage. Finally, drainage water management is an important conservation practice in WLEB; here, DWM is combined with ENM as END. In these simulations, the 2012 conservation condition is used as the scaffold on which to apply the strategies. In the simulations, the conservation practices in place in the 2012 conservation condition are supplemented by practices implemented in each strategy. Practices simulated in each strategy are applied to all acres on which the conservation practice is determined to be appropriate (appendix G). The unchanged acres in each strategy continue to be managed as they are in the 2012 conservation condition. It is understandable that the simulated strategies tend to provide enhanced conservation benefits relative to the 2012 conservation condition because the strategies augment practices in use in the 2012 conservation condition. In the simulations including enhanced nutrient management (NM, NMS, ENM, ENS, ENC, and END), treatment rules may make minor changes to method, rate, or timing of nutrient applications to one or more crops on acres with a high conservation treatment level in the 2012 conservation condition. No acres in the 2012 conservation condition were managed with the splitting treatment imposed for both nutrients; therefore, all cropland acres are treated with NMS and ENS. Because certain practices are inappropriate on some acres and because the scenarios were run on the 2012 conservation condition, which includes acres that have already adopted some of the simulated practices, the number of acres simulated as receiving treatment under each strategy varies (table 5.2).
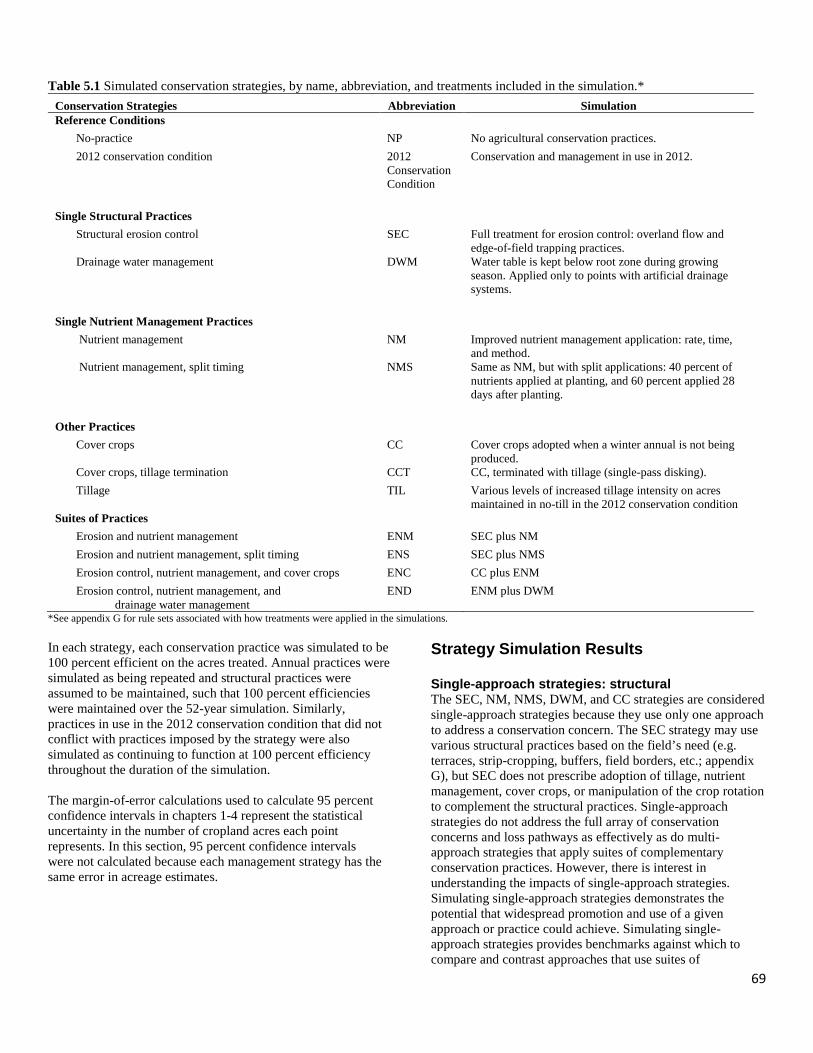
69
Table 5.1 Simulated conservation strategies, by name, abbreviation, and treatments included in the simulation.*
Conservation Strategies Abbreviation Simulation Reference Conditions No-practice NP No agricultural conservation practices. 2012 conservation condition 2012
Conservation Condition
Conservation and management in use in 2012.
Single Structural Practices Structural erosion control SEC Full treatment for erosion control: overland flow and
edge-of-field trapping practices. Drainage water management DWM Water table is kept below root zone during growing
season. Applied only to points with artificial drainage systems.
Single Nutrient Management Practices Nutrient management NM Improved nutrient management application: rate, time,
and method. Nutrient management, split timing NMS Same as NM, but with split applications: 40 percent of
nutrients applied at planting, and 60 percent applied 28 days after planting.
Other Practices Cover crops CC Cover crops adopted when a winter annual is not being
produced. Cover crops, tillage termination CCT CC, terminated with tillage (single-pass disking). Tillage TIL Various levels of increased tillage intensity on acres
maintained in no-till in the 2012 conservation condition Suites of Practices Erosion and nutrient management ENM SEC plus NM Erosion and nutrient management, split timing ENS SEC plus NMS Erosion control, nutrient management, and cover crops ENC CC plus ENM Erosion control, nutrient management, and
drainage water management END ENM plus DWM
*See appendix G for rule sets associated with how treatments were applied in the simulations. In each strategy, each conservation practice was simulated to be 100 percent efficient on the acres treated. Annual practices were simulated as being repeated and structural practices were assumed to be maintained, such that 100 percent efficiencies were maintained over the 52-year simulation. Similarly, practices in use in the 2012 conservation condition that did not conflict with practices imposed by the strategy were also simulated as continuing to function at 100 percent efficiency throughout the duration of the simulation. The margin-of-error calculations used to calculate 95 percent confidence intervals in chapters 1-4 represent the statistical uncertainty in the number of cropland acres each point represents. In this section, 95 percent confidence intervals were not calculated because each management strategy has the same error in acreage estimates.
Strategy Simulation Results Single-approach strategies: structural The SEC, NM, NMS, DWM, and CC strategies are considered single-approach strategies because they use only one approach to address a conservation concern. The SEC strategy may use various structural practices based on the field’s need (e.g. terraces, strip-cropping, buffers, field borders, etc.; appendix G), but SEC does not prescribe adoption of tillage, nutrient management, cover crops, or manipulation of the crop rotation to complement the structural practices. Single-approach strategies do not address the full array of conservation concerns and loss pathways as effectively as do multi-approach strategies that apply suites of complementary conservation practices. However, there is interest in understanding the impacts of single-approach strategies. Simulating single-approach strategies demonstrates the potential that widespread promotion and use of a given approach or practice could achieve. Simulating single-approach strategies provides benchmarks against which to compare and contrast approaches that use suites of
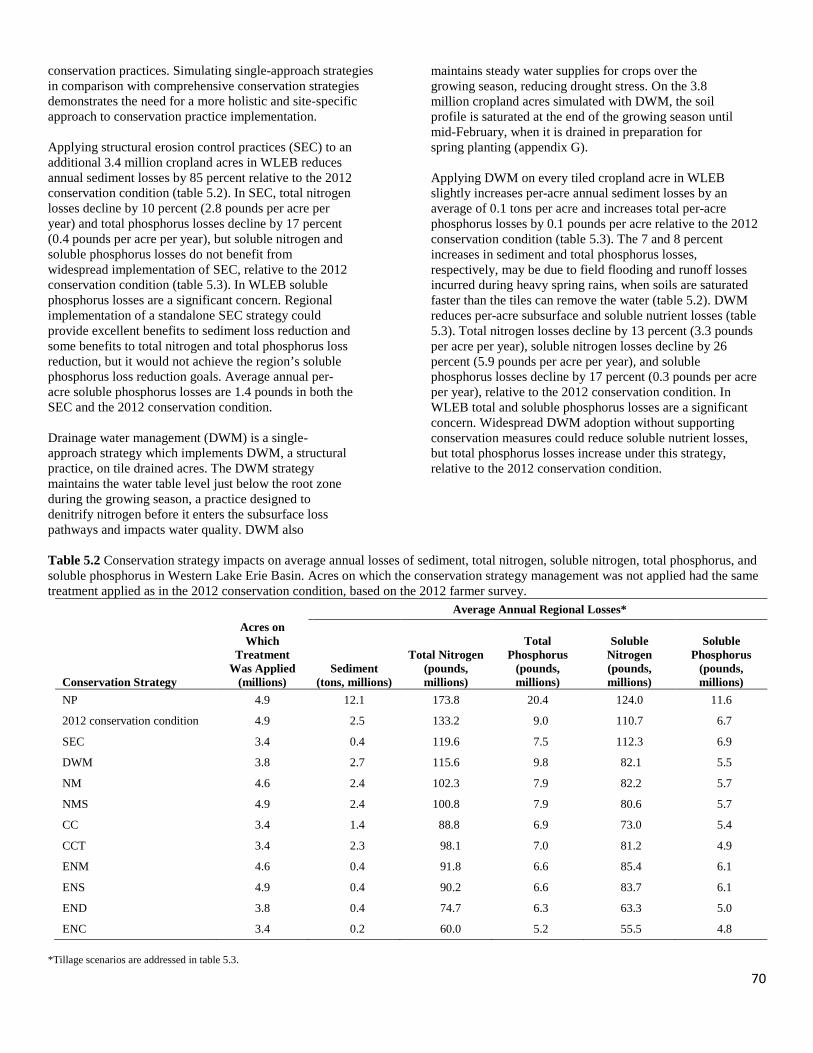
70
conservation practices. Simulating single-approach strategies in comparison with comprehensive conservation strategies demonstrates the need for a more holistic and site-specific approach to conservation practice implementation. Applying structural erosion control practices (SEC) to an additional 3.4 million cropland acres in WLEB reduces annual sediment losses by 85 percent relative to the 2012 conservation condition (table 5.2). In SEC, total nitrogen losses decline by 10 percent (2.8 pounds per acre per year) and total phosphorus losses decline by 17 percent (0.4 pounds per acre per year), but soluble nitrogen and soluble phosphorus losses do not benefit from widespread implementation of SEC, relative to the 2012 conservation condition (table 5.3). In WLEB soluble phosphorus losses are a significant concern. Regional implementation of a standalone SEC strategy could provide excellent benefits to sediment loss reduction and some benefits to total nitrogen and total phosphorus loss reduction, but it would not achieve the region’s soluble phosphorus loss reduction goals. Average annual per-acre soluble phosphorus losses are 1.4 pounds in both the SEC and the 2012 conservation condition. Drainage water management (DWM) is a single-approach strategy which implements DWM, a structural practice, on tile drained acres. The DWM strategy maintains the water table level just below the root zone during the growing season, a practice designed to denitrify nitrogen before it enters the subsurface loss pathways and impacts water quality. DWM also
maintains steady water supplies for crops over the growing season, reducing drought stress. On the 3.8 million cropland acres simulated with DWM, the soil profile is saturated at the end of the growing season until mid-February, when it is drained in preparation for spring planting (appendix G). Applying DWM on every tiled cropland acre in WLEB slightly increases per-acre annual sediment losses by an average of 0.1 tons per acre and increases total per-acre phosphorus losses by 0.1 pounds per acre relative to the 2012 conservation condition (table 5.3). The 7 and 8 percent increases in sediment and total phosphorus losses, respectively, may be due to field flooding and runoff losses incurred during heavy spring rains, when soils are saturated faster than the tiles can remove the water (table 5.2). DWM reduces per-acre subsurface and soluble nutrient losses (table 5.3). Total nitrogen losses decline by 13 percent (3.3 pounds per acre per year), soluble nitrogen losses decline by 26 percent (5.9 pounds per acre per year), and soluble phosphorus losses decline by 17 percent (0.3 pounds per acre per year), relative to the 2012 conservation condition. In WLEB total and soluble phosphorus losses are a significant concern. Widespread DWM adoption without supporting conservation measures could reduce soluble nutrient losses, but total phosphorus losses increase under this strategy, relative to the 2012 conservation condition.
Table 5.2 Conservation strategy impacts on average annual losses of sediment, total nitrogen, soluble nitrogen, total phosphorus, and soluble phosphorus in Western Lake Erie Basin. Acres on which the conservation strategy management was not applied had the same treatment applied as in the 2012 conservation condition, based on the 2012 farmer survey.
Average Annual Regional Losses*
Conservation Strategy
Acres on Which
Treatment Was Applied
(millions) Sediment
(tons, millions)
Total Nitrogen (pounds, millions)
Total Phosphorus
(pounds, millions)
Soluble Nitrogen (pounds, millions)
Soluble Phosphorus
(pounds, millions)
NP 4.9 12.1 173.8 20.4 124.0 11.6
2012 conservation condition 4.9 2.5 133.2 9.0 110.7 6.7
SEC 3.4 0.4 119.6 7.5 112.3 6.9
DWM 3.8 2.7 115.6 9.8 82.1 5.5
NM 4.6 2.4 102.3 7.9 82.2 5.7
NMS 4.9 2.4 100.8 7.9 80.6 5.7
CC 3.4 1.4 88.8 6.9 73.0 5.4
CCT 3.4 2.3 98.1 7.0 81.2 4.9
ENM 4.6 0.4 91.8 6.6 85.4 6.1
ENS 4.9 0.4 90.2 6.6 83.7 6.1
END 3.8 0.4 74.7 6.3 63.3 5.0
ENC 3.4 0.2 60.0 5.2 55.5 4.8 *Tillage scenarios are addressed in table 5.3.
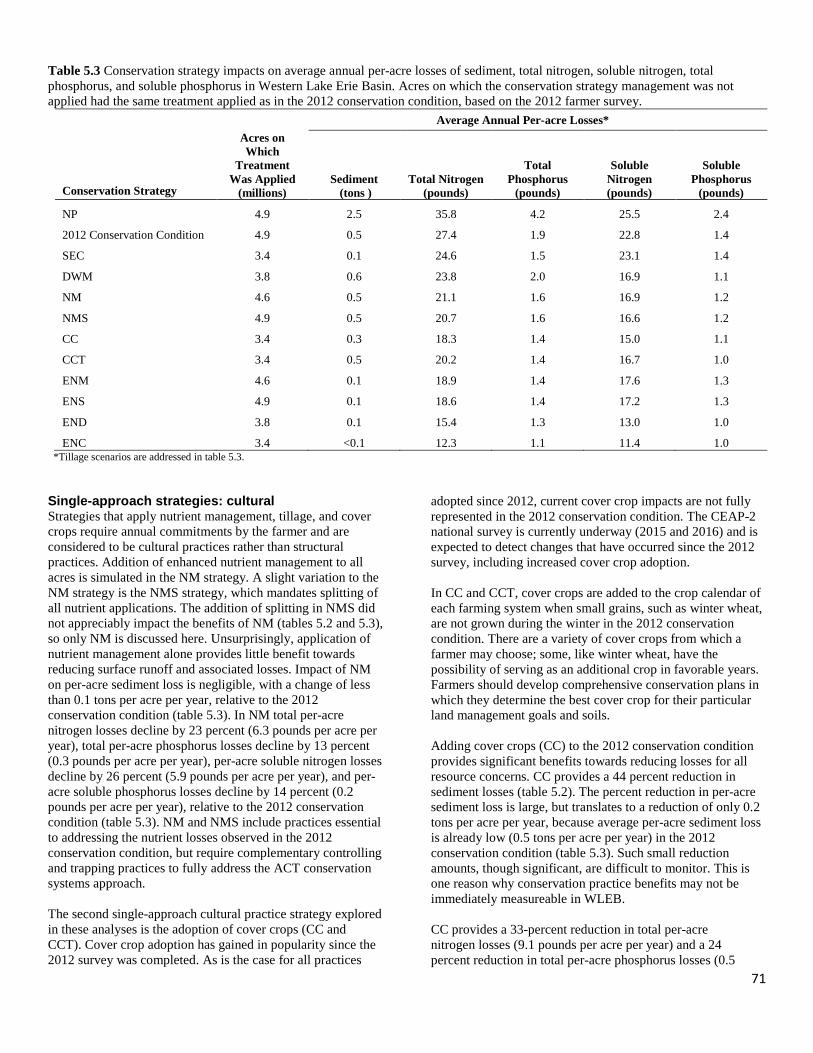
71
Table 5.3 Conservation strategy impacts on average annual per-acre losses of sediment, total nitrogen, soluble nitrogen, total phosphorus, and soluble phosphorus in Western Lake Erie Basin. Acres on which the conservation strategy management was not applied had the same treatment applied as in the 2012 conservation condition, based on the 2012 farmer survey.
Average Annual Per-acre Losses*
Conservation Strategy
Acres on Which
Treatment Was Applied
(millions) Sediment
(tons ) Total Nitrogen
(pounds)
Total Phosphorus
(pounds)
Soluble Nitrogen (pounds)
Soluble Phosphorus
(pounds)
NP 4.9 2.5 35.8 4.2 25.5 2.4
2012 Conservation Condition 4.9 0.5 27.4 1.9 22.8 1.4
SEC 3.4 0.1 24.6 1.5 23.1 1.4
DWM 3.8 0.6 23.8 2.0 16.9 1.1
NM 4.6 0.5 21.1 1.6 16.9 1.2
NMS 4.9 0.5 20.7 1.6 16.6 1.2
CC 3.4 0.3 18.3 1.4 15.0 1.1
CCT 3.4 0.5 20.2 1.4 16.7 1.0
ENM 4.6 0.1 18.9 1.4 17.6 1.3
ENS 4.9 0.1 18.6 1.4 17.2 1.3
END 3.8 0.1 15.4 1.3 13.0 1.0
ENC 3.4 <0.1 12.3 1.1 11.4 1.0 *Tillage scenarios are addressed in table 5.3.
Single-approach strategies: cultural Strategies that apply nutrient management, tillage, and cover crops require annual commitments by the farmer and are considered to be cultural practices rather than structural practices. Addition of enhanced nutrient management to all acres is simulated in the NM strategy. A slight variation to the NM strategy is the NMS strategy, which mandates splitting of all nutrient applications. The addition of splitting in NMS did not appreciably impact the benefits of NM (tables 5.2 and 5.3), so only NM is discussed here. Unsurprisingly, application of nutrient management alone provides little benefit towards reducing surface runoff and associated losses. Impact of NM on per-acre sediment loss is negligible, with a change of less than 0.1 tons per acre per year, relative to the 2012 conservation condition (table 5.3). In NM total per-acre nitrogen losses decline by 23 percent (6.3 pounds per acre per year), total per-acre phosphorus losses decline by 13 percent (0.3 pounds per acre per year), per-acre soluble nitrogen losses decline by 26 percent (5.9 pounds per acre per year), and per-acre soluble phosphorus losses decline by 14 percent (0.2 pounds per acre per year), relative to the 2012 conservation condition (table 5.3). NM and NMS include practices essential to addressing the nutrient losses observed in the 2012 conservation condition, but require complementary controlling and trapping practices to fully address the ACT conservation systems approach. The second single-approach cultural practice strategy explored in these analyses is the adoption of cover crops (CC and CCT). Cover crop adoption has gained in popularity since the 2012 survey was completed. As is the case for all practices
adopted since 2012, current cover crop impacts are not fully represented in the 2012 conservation condition. The CEAP-2 national survey is currently underway (2015 and 2016) and is expected to detect changes that have occurred since the 2012 survey, including increased cover crop adoption. In CC and CCT, cover crops are added to the crop calendar of each farming system when small grains, such as winter wheat, are not grown during the winter in the 2012 conservation condition. There are a variety of cover crops from which a farmer may choose; some, like winter wheat, have the possibility of serving as an additional crop in favorable years. Farmers should develop comprehensive conservation plans in which they determine the best cover crop for their particular land management goals and soils. Adding cover crops (CC) to the 2012 conservation condition provides significant benefits towards reducing losses for all resource concerns. CC provides a 44 percent reduction in sediment losses (table 5.2). The percent reduction in per-acre sediment loss is large, but translates to a reduction of only 0.2 tons per acre per year, because average per-acre sediment loss is already low (0.5 tons per acre per year) in the 2012 conservation condition (table 5.3). Such small reduction amounts, though significant, are difficult to monitor. This is one reason why conservation practice benefits may not be immediately measureable in WLEB. CC provides a 33-percent reduction in total per-acre nitrogen losses (9.1 pounds per acre per year) and a 24 percent reduction in total per-acre phosphorus losses (0.5
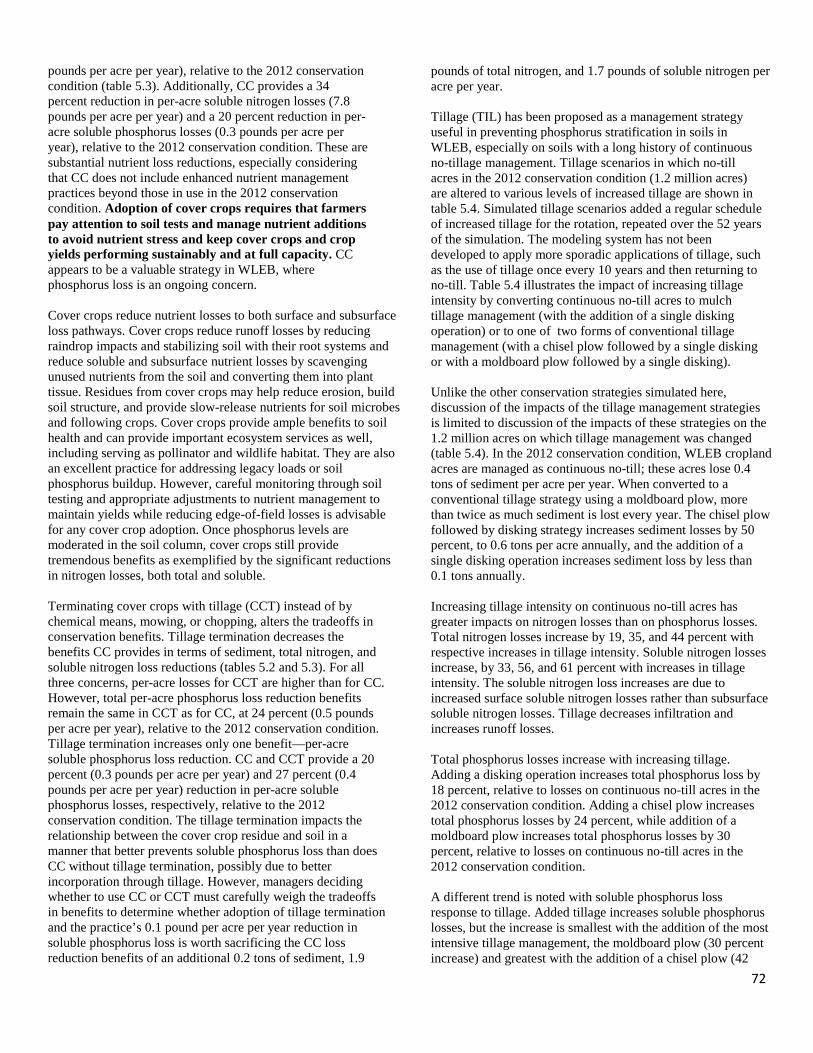
72
pounds per acre per year), relative to the 2012 conservation condition (table 5.3). Additionally, CC provides a 34 percent reduction in per-acre soluble nitrogen losses (7.8 pounds per acre per year) and a 20 percent reduction in per-acre soluble phosphorus losses (0.3 pounds per acre per year), relative to the 2012 conservation condition. These are substantial nutrient loss reductions, especially considering that CC does not include enhanced nutrient management practices beyond those in use in the 2012 conservation condition. Adoption of cover crops requires that farmers pay attention to soil tests and manage nutrient additions to avoid nutrient stress and keep cover crops and crop yields performing sustainably and at full capacity. CC appears to be a valuable strategy in WLEB, where phosphorus loss is an ongoing concern. Cover crops reduce nutrient losses to both surface and subsurface loss pathways. Cover crops reduce runoff losses by reducing raindrop impacts and stabilizing soil with their root systems and reduce soluble and subsurface nutrient losses by scavenging unused nutrients from the soil and converting them into plant tissue. Residues from cover crops may help reduce erosion, build soil structure, and provide slow-release nutrients for soil microbes and following crops. Cover crops provide ample benefits to soil health and can provide important ecosystem services as well, including serving as pollinator and wildlife habitat. They are also an excellent practice for addressing legacy loads or soil phosphorus buildup. However, careful monitoring through soil testing and appropriate adjustments to nutrient management to maintain yields while reducing edge-of-field losses is advisable for any cover crop adoption. Once phosphorus levels are moderated in the soil column, cover crops still provide tremendous benefits as exemplified by the significant reductions in nitrogen losses, both total and soluble. Terminating cover crops with tillage (CCT) instead of by chemical means, mowing, or chopping, alters the tradeoffs in conservation benefits. Tillage termination decreases the benefits CC provides in terms of sediment, total nitrogen, and soluble nitrogen loss reductions (tables 5.2 and 5.3). For all three concerns, per-acre losses for CCT are higher than for CC. However, total per-acre phosphorus loss reduction benefits remain the same in CCT as for CC, at 24 percent (0.5 pounds per acre per year), relative to the 2012 conservation condition. Tillage termination increases only one benefit—per-acre soluble phosphorus loss reduction. CC and CCT provide a 20 percent (0.3 pounds per acre per year) and 27 percent (0.4 pounds per acre per year) reduction in per-acre soluble phosphorus losses, respectively, relative to the 2012 conservation condition. The tillage termination impacts the relationship between the cover crop residue and soil in a manner that better prevents soluble phosphorus loss than does CC without tillage termination, possibly due to better incorporation through tillage. However, managers deciding whether to use CC or CCT must carefully weigh the tradeoffs in benefits to determine whether adoption of tillage termination and the practice’s 0.1 pound per acre per year reduction in soluble phosphorus loss is worth sacrificing the CC loss reduction benefits of an additional 0.2 tons of sediment, 1.9
pounds of total nitrogen, and 1.7 pounds of soluble nitrogen per acre per year. Tillage (TIL) has been proposed as a management strategy useful in preventing phosphorus stratification in soils in WLEB, especially on soils with a long history of continuous no-tillage management. Tillage scenarios in which no-till acres in the 2012 conservation condition (1.2 million acres) are altered to various levels of increased tillage are shown in table 5.4. Simulated tillage scenarios added a regular schedule of increased tillage for the rotation, repeated over the 52 years of the simulation. The modeling system has not been developed to apply more sporadic applications of tillage, such as the use of tillage once every 10 years and then returning to no-till. Table 5.4 illustrates the impact of increasing tillage intensity by converting continuous no-till acres to mulch tillage management (with the addition of a single disking operation) or to one of two forms of conventional tillage management (with a chisel plow followed by a single disking or with a moldboard plow followed by a single disking). Unlike the other conservation strategies simulated here, discussion of the impacts of the tillage management strategies is limited to discussion of the impacts of these strategies on the 1.2 million acres on which tillage management was changed (table 5.4). In the 2012 conservation condition, WLEB cropland acres are managed as continuous no-till; these acres lose 0.4 tons of sediment per acre per year. When converted to a conventional tillage strategy using a moldboard plow, more than twice as much sediment is lost every year. The chisel plow followed by disking strategy increases sediment losses by 50 percent, to 0.6 tons per acre annually, and the addition of a single disking operation increases sediment loss by less than 0.1 tons annually. Increasing tillage intensity on continuous no-till acres has greater impacts on nitrogen losses than on phosphorus losses. Total nitrogen losses increase by 19, 35, and 44 percent with respective increases in tillage intensity. Soluble nitrogen losses increase, by 33, 56, and 61 percent with increases in tillage intensity. The soluble nitrogen loss increases are due to increased surface soluble nitrogen losses rather than subsurface soluble nitrogen losses. Tillage decreases infiltration and increases runoff losses. Total phosphorus losses increase with increasing tillage. Adding a disking operation increases total phosphorus loss by 18 percent, relative to losses on continuous no-till acres in the 2012 conservation condition. Adding a chisel plow increases total phosphorus losses by 24 percent, while addition of a moldboard plow increases total phosphorus losses by 30 percent, relative to losses on continuous no-till acres in the 2012 conservation condition. A different trend is noted with soluble phosphorus loss response to tillage. Added tillage increases soluble phosphorus losses, but the increase is smallest with the addition of the most intensive tillage management, the moldboard plow (30 percent increase) and greatest with the addition of a chisel plow (42

73
percent increase). As with soluble nitrogen losses, nearly all increases in phosphorus losses associated with increased tillage are due to increased surface soluble phosphorus losses. The more complete mixing provided by the moldboard plow strategy slightly reduces subsurface soluble phosphorus losses (by approximately 0.1 pounds). The tillage actions of the chisel plow appear to have an opposite effect, with total soluble phosphorus and subsurface phosphorus losses increasing more than with disking alone. Therefore not only is tillage intensity a factor in altering pathways of phosphorus loss but the mode of action of the tillage implement needs to be considered in conjunction with complementary conservation practices. As was demonstrated with the other single-approach strategies, there are tradeoffs associated with each tillage management decision. Conversion of all continuous no-till acres to more intense tillage decreases all conservation benefits relative to the benefits provided by the continuous no-till acres in the 2012 conservation condition. The majority of
the increases in nutrient losses associated with increased tillage are via the surface loss pathways. Tillage has been suggested as a solution for controlling soluble phosphorus losses especially in soils with highly stratified soil phosphorus levels due to long-term continuous no-till, a practice that may concentrate phosphorus in the upper soil column, making it more vulnerable to loss in the soluble form. The tillage scenarios presented here simulate whole-scale prescriptive conversion in tillage intensities across all WLEB cropland acres maintained as no-till in the 2012 conservation condition. As with any conservation practice, the best practice for one acre may not be the best for an adjacent acre. If it is desirable to maximize nutrient and sediment loss benefits through tillage management, the entire region should be managed with site-specific tillage plans developed as part of comprehensive conservation plans designed to offset any negative effects tillage may have on other resource concerns.
Table 5.4 Tillage intensity impacts on average annual per-acre losses of sediment, total nitrogen, soluble nitrogen, total phosphorus, and soluble phosphorus in Western Lake Erie Basin.
Average Annual per-Acre Losses
Conservation Strategy Sediment
(tons) Total Nitrogen
(pounds)
Total Phosphorus
(pounds) Soluble Nitrogen
(pounds)
Soluble Phosphorus
(pounds) 2012 Current Continuous No-Till 0.4 25.5 1.9 20.1 1.4
Single Disking added 0.5 30.3 2.2 26.8 1.8
Chisel + Disking added 0.6 34.5 2.4 31.5 2.0
Moldboard Plow + Disking added 0.8 36.6 2.5 32.3 1.8
Comparisons of single-approach strategies Scenarios of single-approach strategies serve many useful purposes. These analyses expose the insufficiency of applying single-approach strategies to address varied conservation concerns on diverse soils in diverse agricultural systems. These analyses further demonstrate the comparative strengths and weaknesses of various single-approach strategies, which may be combined in more holistic and comprehensive strategies. Comprehensive conservation solutions require suites of practices designed to address myriad conservation concerns, with consideration given to farmer management decisions, soil vulnerabilities, weather patterns, land use history, soil test results, farmer management capacity, etc. Two main classes of practices are explored in the single-approach strategy simulations: structural practices (SEC and DWM) and cultural practices (NM, NMS, CC, CCT, and TIL). In implementing a plan that incorporates the principles of an avoid, control, trap (ACT) conservation systems approach, a farmer adopts a suite of conservation practices designed to avoid, control, and trap nutrients and sediment before they are lost from the edge of the field. Each single-approach strategy simulated here contributes to part of the ACT conservation systems approach; but suites of complementary practices are
required to address all components of the ACT conservation systems approach. Compared to SEC, NM, and NMS provide greater total nitrogen loss reduction, soluble nitrogen loss reduction, and soluble phosphorus loss reduction, but SEC is more effective at providing sediment and total phosphorus loss reduction than are NM or NMS. SEC’s approach provides the control and trap aspects of the ACT conservation systems approach. SEC practices address the surface loss pathway, slowing surface runoff and allowing sediment and sediment-associated nutrients to remain on the field. DWM provides controlling benefits in the ACT system; DWM is designed to reduce soluble nitrogen losses. NM and NMS provide avoidance benefits in the ACT system, by reducing the risk associated with nutrient losses via application of the 4Rs in nutrient application management (right source, right method, right rate, and right timing of application). Compared to DWM, the NM and NMS strategies are more effective at reducing total nitrogen and total phosphorus losses, but DWM provides about the same reductions to soluble nutrient loss as do NM and NMS. The CC and CCT strategies demonstrate that nutrient losses can be addressed through means other than nutrient
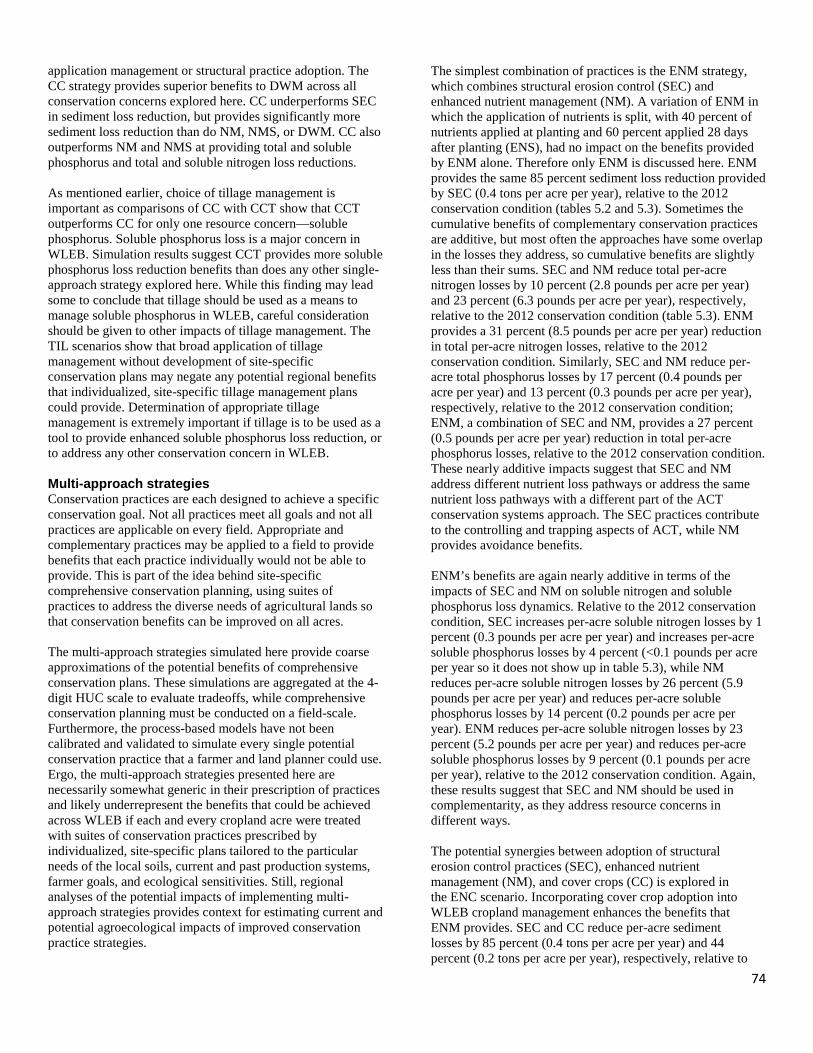
74
application management or structural practice adoption. The CC strategy provides superior benefits to DWM across all conservation concerns explored here. CC underperforms SEC in sediment loss reduction, but provides significantly more sediment loss reduction than do NM, NMS, or DWM. CC also outperforms NM and NMS at providing total and soluble phosphorus and total and soluble nitrogen loss reductions. As mentioned earlier, choice of tillage management is important as comparisons of CC with CCT show that CCT outperforms CC for only one resource concern—soluble phosphorus. Soluble phosphorus loss is a major concern in WLEB. Simulation results suggest CCT provides more soluble phosphorus loss reduction benefits than does any other single-approach strategy explored here. While this finding may lead some to conclude that tillage should be used as a means to manage soluble phosphorus in WLEB, careful consideration should be given to other impacts of tillage management. The TIL scenarios show that broad application of tillage management without development of site-specific conservation plans may negate any potential regional benefits that individualized, site-specific tillage management plans could provide. Determination of appropriate tillage management is extremely important if tillage is to be used as a tool to provide enhanced soluble phosphorus loss reduction, or to address any other conservation concern in WLEB. Multi-approach strategies Conservation practices are each designed to achieve a specific conservation goal. Not all practices meet all goals and not all practices are applicable on every field. Appropriate and complementary practices may be applied to a field to provide benefits that each practice individually would not be able to provide. This is part of the idea behind site-specific comprehensive conservation planning, using suites of practices to address the diverse needs of agricultural lands so that conservation benefits can be improved on all acres. The multi-approach strategies simulated here provide coarse approximations of the potential benefits of comprehensive conservation plans. These simulations are aggregated at the 4-digit HUC scale to evaluate tradeoffs, while comprehensive conservation planning must be conducted on a field-scale. Furthermore, the process-based models have not been calibrated and validated to simulate every single potential conservation practice that a farmer and land planner could use. Ergo, the multi-approach strategies presented here are necessarily somewhat generic in their prescription of practices and likely underrepresent the benefits that could be achieved across WLEB if each and every cropland acre were treated with suites of conservation practices prescribed by individualized, site-specific plans tailored to the particular needs of the local soils, current and past production systems, farmer goals, and ecological sensitivities. Still, regional analyses of the potential impacts of implementing multi-approach strategies provides context for estimating current and potential agroecological impacts of improved conservation practice strategies.
The simplest combination of practices is the ENM strategy, which combines structural erosion control (SEC) and enhanced nutrient management (NM). A variation of ENM in which the application of nutrients is split, with 40 percent of nutrients applied at planting and 60 percent applied 28 days after planting (ENS), had no impact on the benefits provided by ENM alone. Therefore only ENM is discussed here. ENM provides the same 85 percent sediment loss reduction provided by SEC (0.4 tons per acre per year), relative to the 2012 conservation condition (tables 5.2 and 5.3). Sometimes the cumulative benefits of complementary conservation practices are additive, but most often the approaches have some overlap in the losses they address, so cumulative benefits are slightly less than their sums. SEC and NM reduce total per-acre nitrogen losses by 10 percent (2.8 pounds per acre per year) and 23 percent (6.3 pounds per acre per year), respectively, relative to the 2012 conservation condition (table 5.3). ENM provides a 31 percent (8.5 pounds per acre per year) reduction in total per-acre nitrogen losses, relative to the 2012 conservation condition. Similarly, SEC and NM reduce per-acre total phosphorus losses by 17 percent (0.4 pounds per acre per year) and 13 percent (0.3 pounds per acre per year), respectively, relative to the 2012 conservation condition; ENM, a combination of SEC and NM, provides a 27 percent (0.5 pounds per acre per year) reduction in total per-acre phosphorus losses, relative to the 2012 conservation condition. These nearly additive impacts suggest that SEC and NM address different nutrient loss pathways or address the same nutrient loss pathways with a different part of the ACT conservation systems approach. The SEC practices contribute to the controlling and trapping aspects of ACT, while NM provides avoidance benefits. ENM’s benefits are again nearly additive in terms of the impacts of SEC and NM on soluble nitrogen and soluble phosphorus loss dynamics. Relative to the 2012 conservation condition, SEC increases per-acre soluble nitrogen losses by 1 percent (0.3 pounds per acre per year) and increases per-acre soluble phosphorus losses by 4 percent (<0.1 pounds per acre per year so it does not show up in table 5.3), while NM reduces per-acre soluble nitrogen losses by 26 percent (5.9 pounds per acre per year) and reduces per-acre soluble phosphorus losses by 14 percent (0.2 pounds per acre per year). ENM reduces per-acre soluble nitrogen losses by 23 percent (5.2 pounds per acre per year) and reduces per-acre soluble phosphorus losses by 9 percent (0.1 pounds per acre per year), relative to the 2012 conservation condition. Again, these results suggest that SEC and NM should be used in complementarity, as they address resource concerns in different ways. The potential synergies between adoption of structural erosion control practices (SEC), enhanced nutrient management (NM), and cover crops (CC) is explored in the ENC scenario. Incorporating cover crop adoption into WLEB cropland management enhances the benefits that ENM provides. SEC and CC reduce per-acre sediment losses by 85 percent (0.4 tons per acre per year) and 44 percent (0.2 tons per acre per year), respectively, relative to
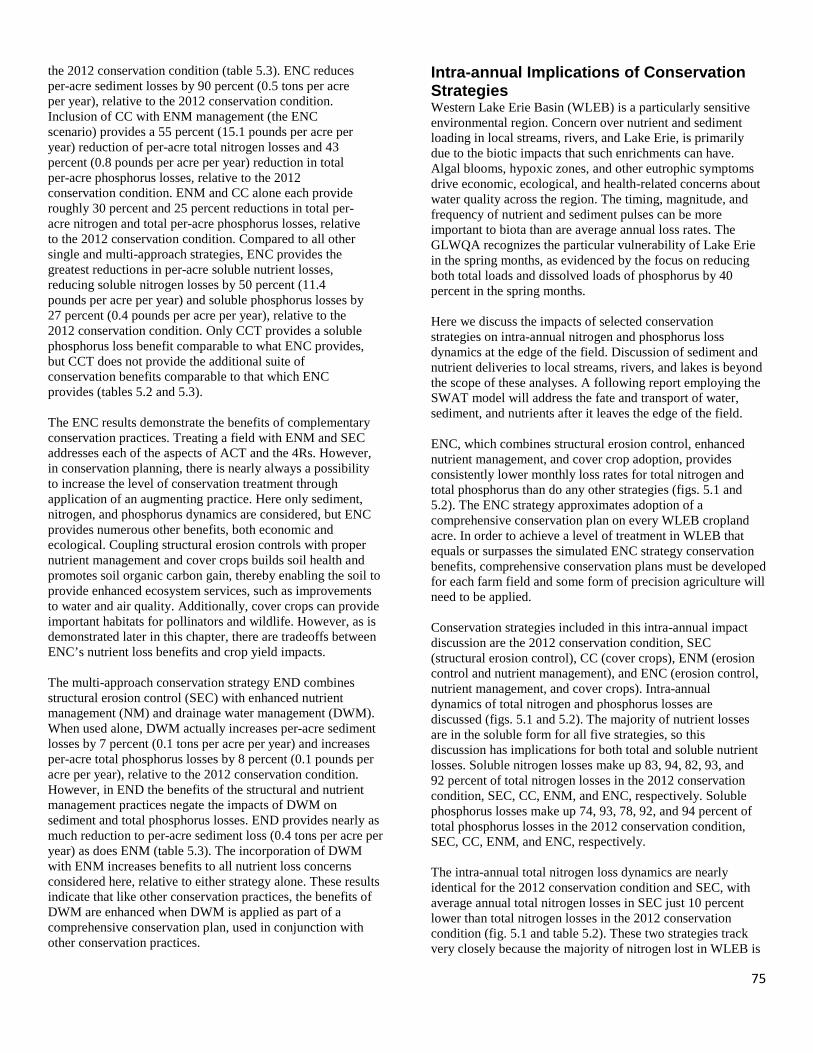
75
the 2012 conservation condition (table 5.3). ENC reduces per-acre sediment losses by 90 percent (0.5 tons per acre per year), relative to the 2012 conservation condition. Inclusion of CC with ENM management (the ENC scenario) provides a 55 percent (15.1 pounds per acre per year) reduction of per-acre total nitrogen losses and 43 percent (0.8 pounds per acre per year) reduction in total per-acre phosphorus losses, relative to the 2012 conservation condition. ENM and CC alone each provide roughly 30 percent and 25 percent reductions in total per-acre nitrogen and total per-acre phosphorus losses, relative to the 2012 conservation condition. Compared to all other single and multi-approach strategies, ENC provides the greatest reductions in per-acre soluble nutrient losses, reducing soluble nitrogen losses by 50 percent (11.4 pounds per acre per year) and soluble phosphorus losses by 27 percent (0.4 pounds per acre per year), relative to the 2012 conservation condition. Only CCT provides a soluble phosphorus loss benefit comparable to what ENC provides, but CCT does not provide the additional suite of conservation benefits comparable to that which ENC provides (tables 5.2 and 5.3). The ENC results demonstrate the benefits of complementary conservation practices. Treating a field with ENM and SEC addresses each of the aspects of ACT and the 4Rs. However, in conservation planning, there is nearly always a possibility to increase the level of conservation treatment through application of an augmenting practice. Here only sediment, nitrogen, and phosphorus dynamics are considered, but ENC provides numerous other benefits, both economic and ecological. Coupling structural erosion controls with proper nutrient management and cover crops builds soil health and promotes soil organic carbon gain, thereby enabling the soil to provide enhanced ecosystem services, such as improvements to water and air quality. Additionally, cover crops can provide important habitats for pollinators and wildlife. However, as is demonstrated later in this chapter, there are tradeoffs between ENC’s nutrient loss benefits and crop yield impacts. The multi-approach conservation strategy END combines structural erosion control (SEC) with enhanced nutrient management (NM) and drainage water management (DWM). When used alone, DWM actually increases per-acre sediment losses by 7 percent (0.1 tons per acre per year) and increases per-acre total phosphorus losses by 8 percent (0.1 pounds per acre per year), relative to the 2012 conservation condition. However, in END the benefits of the structural and nutrient management practices negate the impacts of DWM on sediment and total phosphorus losses. END provides nearly as much reduction to per-acre sediment loss (0.4 tons per acre per year) as does ENM (table 5.3). The incorporation of DWM with ENM increases benefits to all nutrient loss concerns considered here, relative to either strategy alone. These results indicate that like other conservation practices, the benefits of DWM are enhanced when DWM is applied as part of a comprehensive conservation plan, used in conjunction with other conservation practices.
Intra-annual Implications of Conservation Strategies Western Lake Erie Basin (WLEB) is a particularly sensitive environmental region. Concern over nutrient and sediment loading in local streams, rivers, and Lake Erie, is primarily due to the biotic impacts that such enrichments can have. Algal blooms, hypoxic zones, and other eutrophic symptoms drive economic, ecological, and health-related concerns about water quality across the region. The timing, magnitude, and frequency of nutrient and sediment pulses can be more important to biota than are average annual loss rates. The GLWQA recognizes the particular vulnerability of Lake Erie in the spring months, as evidenced by the focus on reducing both total loads and dissolved loads of phosphorus by 40 percent in the spring months. Here we discuss the impacts of selected conservation strategies on intra-annual nitrogen and phosphorus loss dynamics at the edge of the field. Discussion of sediment and nutrient deliveries to local streams, rivers, and lakes is beyond the scope of these analyses. A following report employing the SWAT model will address the fate and transport of water, sediment, and nutrients after it leaves the edge of the field. ENC, which combines structural erosion control, enhanced nutrient management, and cover crop adoption, provides consistently lower monthly loss rates for total nitrogen and total phosphorus than do any other strategies (figs. 5.1 and 5.2). The ENC strategy approximates adoption of a comprehensive conservation plan on every WLEB cropland acre. In order to achieve a level of treatment in WLEB that equals or surpasses the simulated ENC strategy conservation benefits, comprehensive conservation plans must be developed for each farm field and some form of precision agriculture will need to be applied. Conservation strategies included in this intra-annual impact discussion are the 2012 conservation condition, SEC (structural erosion control), CC (cover crops), ENM (erosion control and nutrient management), and ENC (erosion control, nutrient management, and cover crops). Intra-annual dynamics of total nitrogen and phosphorus losses are discussed (figs. 5.1 and 5.2). The majority of nutrient losses are in the soluble form for all five strategies, so this discussion has implications for both total and soluble nutrient losses. Soluble nitrogen losses make up 83, 94, 82, 93, and 92 percent of total nitrogen losses in the 2012 conservation condition, SEC, CC, ENM, and ENC, respectively. Soluble phosphorus losses make up 74, 93, 78, 92, and 94 percent of total phosphorus losses in the 2012 conservation condition, SEC, CC, ENM, and ENC, respectively. The intra-annual total nitrogen loss dynamics are nearly identical for the 2012 conservation condition and SEC, with average annual total nitrogen losses in SEC just 10 percent lower than total nitrogen losses in the 2012 conservation condition (fig. 5.1 and table 5.2). These two strategies track very closely because the majority of nitrogen lost in WLEB is
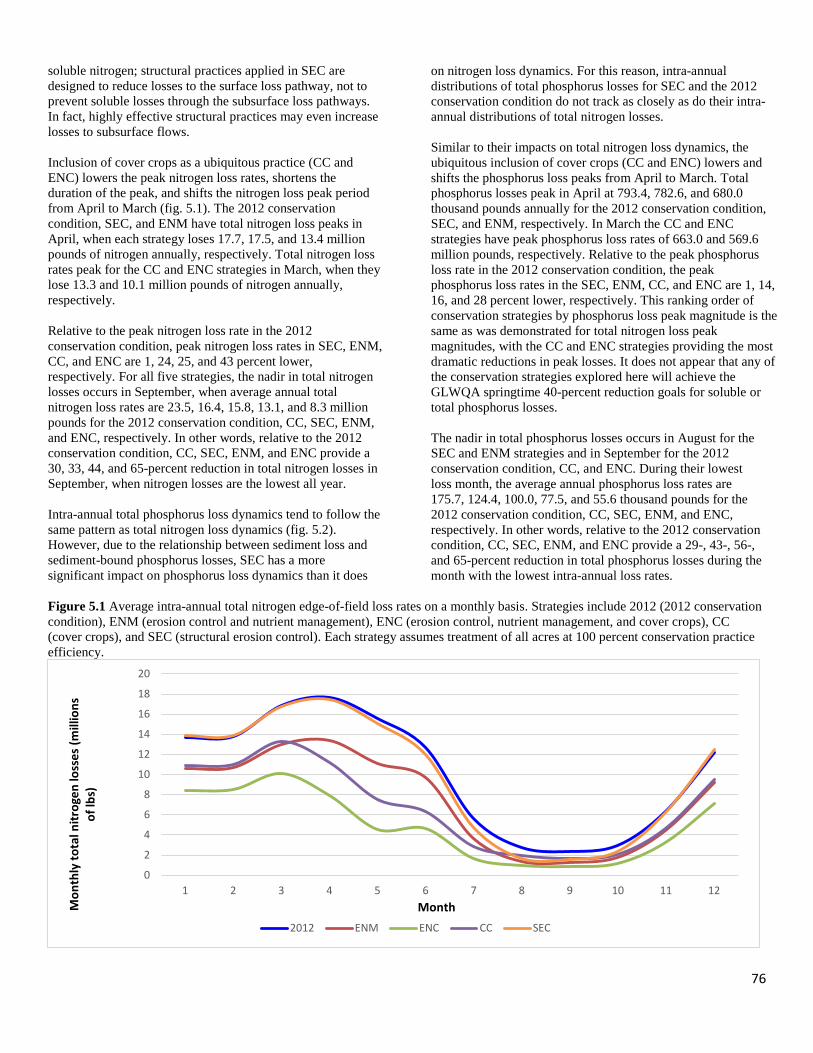
76
soluble nitrogen; structural practices applied in SEC are designed to reduce losses to the surface loss pathway, not to prevent soluble losses through the subsurface loss pathways. In fact, highly effective structural practices may even increase losses to subsurface flows. Inclusion of cover crops as a ubiquitous practice (CC and ENC) lowers the peak nitrogen loss rates, shortens the duration of the peak, and shifts the nitrogen loss peak period from April to March (fig. 5.1). The 2012 conservation condition, SEC, and ENM have total nitrogen loss peaks in April, when each strategy loses 17.7, 17.5, and 13.4 million pounds of nitrogen annually, respectively. Total nitrogen loss rates peak for the CC and ENC strategies in March, when they lose 13.3 and 10.1 million pounds of nitrogen annually, respectively. Relative to the peak nitrogen loss rate in the 2012 conservation condition, peak nitrogen loss rates in SEC, ENM, CC, and ENC are 1, 24, 25, and 43 percent lower, respectively. For all five strategies, the nadir in total nitrogen losses occurs in September, when average annual total nitrogen loss rates are 23.5, 16.4, 15.8, 13.1, and 8.3 million pounds for the 2012 conservation condition, CC, SEC, ENM, and ENC, respectively. In other words, relative to the 2012 conservation condition, CC, SEC, ENM, and ENC provide a 30, 33, 44, and 65-percent reduction in total nitrogen losses in September, when nitrogen losses are the lowest all year. Intra-annual total phosphorus loss dynamics tend to follow the same pattern as total nitrogen loss dynamics (fig. 5.2). However, due to the relationship between sediment loss and sediment-bound phosphorus losses, SEC has a more significant impact on phosphorus loss dynamics than it does
on nitrogen loss dynamics. For this reason, intra-annual distributions of total phosphorus losses for SEC and the 2012 conservation condition do not track as closely as do their intra-annual distributions of total nitrogen losses. Similar to their impacts on total nitrogen loss dynamics, the ubiquitous inclusion of cover crops (CC and ENC) lowers and shifts the phosphorus loss peaks from April to March. Total phosphorus losses peak in April at 793.4, 782.6, and 680.0 thousand pounds annually for the 2012 conservation condition, SEC, and ENM, respectively. In March the CC and ENC strategies have peak phosphorus loss rates of 663.0 and 569.6 million pounds, respectively. Relative to the peak phosphorus loss rate in the 2012 conservation condition, the peak phosphorus loss rates in the SEC, ENM, CC, and ENC are 1, 14, 16, and 28 percent lower, respectively. This ranking order of conservation strategies by phosphorus loss peak magnitude is the same as was demonstrated for total nitrogen loss peak magnitudes, with the CC and ENC strategies providing the most dramatic reductions in peak losses. It does not appear that any of the conservation strategies explored here will achieve the GLWQA springtime 40-percent reduction goals for soluble or total phosphorus losses. The nadir in total phosphorus losses occurs in August for the SEC and ENM strategies and in September for the 2012 conservation condition, CC, and ENC. During their lowest loss month, the average annual phosphorus loss rates are 175.7, 124.4, 100.0, 77.5, and 55.6 thousand pounds for the 2012 conservation condition, CC, SEC, ENM, and ENC, respectively. In other words, relative to the 2012 conservation condition, CC, SEC, ENM, and ENC provide a 29-, 43-, 56-, and 65-percent reduction in total phosphorus losses during the month with the lowest intra-annual loss rates.
Figure 5.1 Average intra-annual total nitrogen edge-of-field loss rates on a monthly basis. Strategies include 2012 (2012 conservation condition), ENM (erosion control and nutrient management), ENC (erosion control, nutrient management, and cover crops), CC (cover crops), and SEC (structural erosion control). Each strategy assumes treatment of all acres at 100 percent conservation practice efficiency.
0
2
4
6
8
10
12
14
16
18
20
1 2 3 4 5 6 7 8 9 10 11 12
Mon
thly
tota
l nitr
ogen
loss
es (m
illio
ns
of lb
s)
Month2012 ENM ENC CC SEC
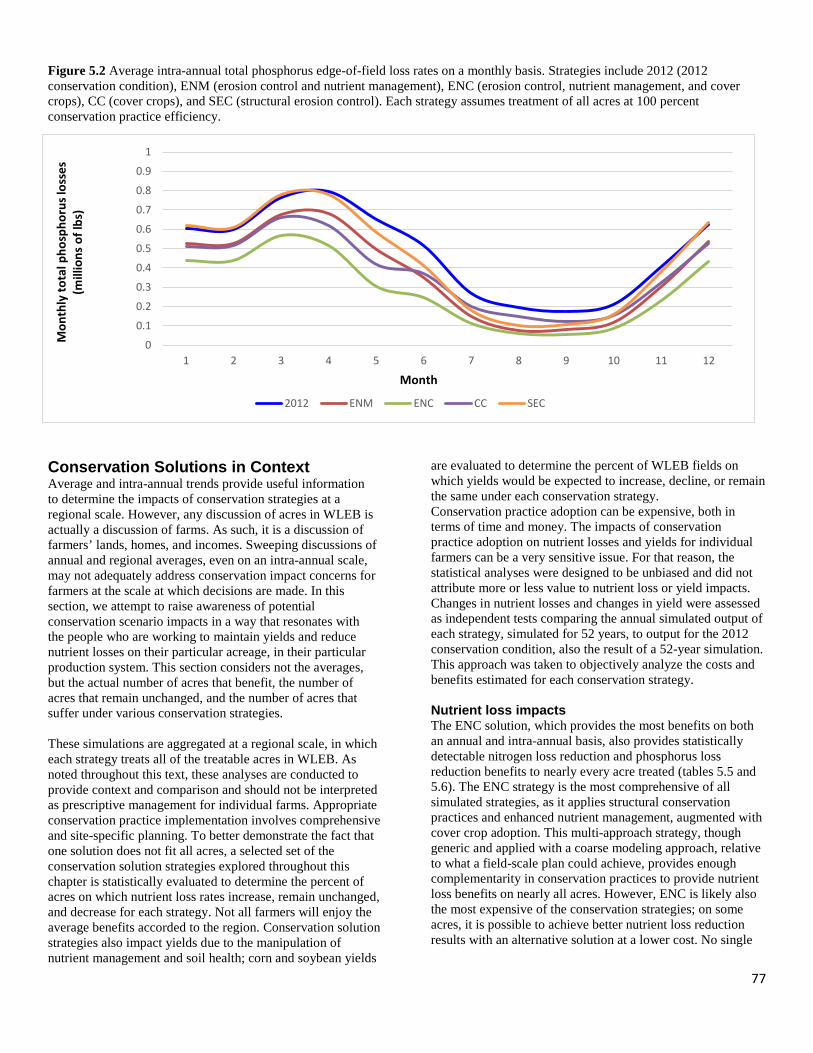
77
Figure 5.2 Average intra-annual total phosphorus edge-of-field loss rates on a monthly basis. Strategies include 2012 (2012 conservation condition), ENM (erosion control and nutrient management), ENC (erosion control, nutrient management, and cover crops), CC (cover crops), and SEC (structural erosion control). Each strategy assumes treatment of all acres at 100 percent conservation practice efficiency.
Conservation Solutions in Context Average and intra-annual trends provide useful information to determine the impacts of conservation strategies at a regional scale. However, any discussion of acres in WLEB is actually a discussion of farms. As such, it is a discussion of farmers’ lands, homes, and incomes. Sweeping discussions of annual and regional averages, even on an intra-annual scale, may not adequately address conservation impact concerns for farmers at the scale at which decisions are made. In this section, we attempt to raise awareness of potential conservation scenario impacts in a way that resonates with the people who are working to maintain yields and reduce nutrient losses on their particular acreage, in their particular production system. This section considers not the averages, but the actual number of acres that benefit, the number of acres that remain unchanged, and the number of acres that suffer under various conservation strategies. These simulations are aggregated at a regional scale, in which each strategy treats all of the treatable acres in WLEB. As noted throughout this text, these analyses are conducted to provide context and comparison and should not be interpreted as prescriptive management for individual farms. Appropriate conservation practice implementation involves comprehensive and site-specific planning. To better demonstrate the fact that one solution does not fit all acres, a selected set of the conservation solution strategies explored throughout this chapter is statistically evaluated to determine the percent of acres on which nutrient loss rates increase, remain unchanged, and decrease for each strategy. Not all farmers will enjoy the average benefits accorded to the region. Conservation solution strategies also impact yields due to the manipulation of nutrient management and soil health; corn and soybean yields
are evaluated to determine the percent of WLEB fields on which yields would be expected to increase, decline, or remain the same under each conservation strategy. Conservation practice adoption can be expensive, both in terms of time and money. The impacts of conservation practice adoption on nutrient losses and yields for individual farmers can be a very sensitive issue. For that reason, the statistical analyses were designed to be unbiased and did not attribute more or less value to nutrient loss or yield impacts. Changes in nutrient losses and changes in yield were assessed as independent tests comparing the annual simulated output of each strategy, simulated for 52 years, to output for the 2012 conservation condition, also the result of a 52-year simulation. This approach was taken to objectively analyze the costs and benefits estimated for each conservation strategy. Nutrient loss impacts The ENC solution, which provides the most benefits on both an annual and intra-annual basis, also provides statistically detectable nitrogen loss reduction and phosphorus loss reduction benefits to nearly every acre treated (tables 5.5 and 5.6). The ENC strategy is the most comprehensive of all simulated strategies, as it applies structural conservation practices and enhanced nutrient management, augmented with cover crop adoption. This multi-approach strategy, though generic and applied with a coarse modeling approach, relative to what a field-scale plan could achieve, provides enough complementarity in conservation practices to provide nutrient loss benefits on nearly all acres. However, ENC is likely also the most expensive of the conservation strategies; on some acres, it is possible to achieve better nutrient loss reduction results with an alternative solution at a lower cost. No single
0
0.1
0.2
0.3
0.4
0.5
0.6
0.7
0.8
0.9
1
1 2 3 4 5 6 7 8 9 10 11 12
Mon
thly
tota
l pho
spho
rus l
osse
s (m
illio
ns o
f lbs
)
Month
2012 ENM ENC CC SEC
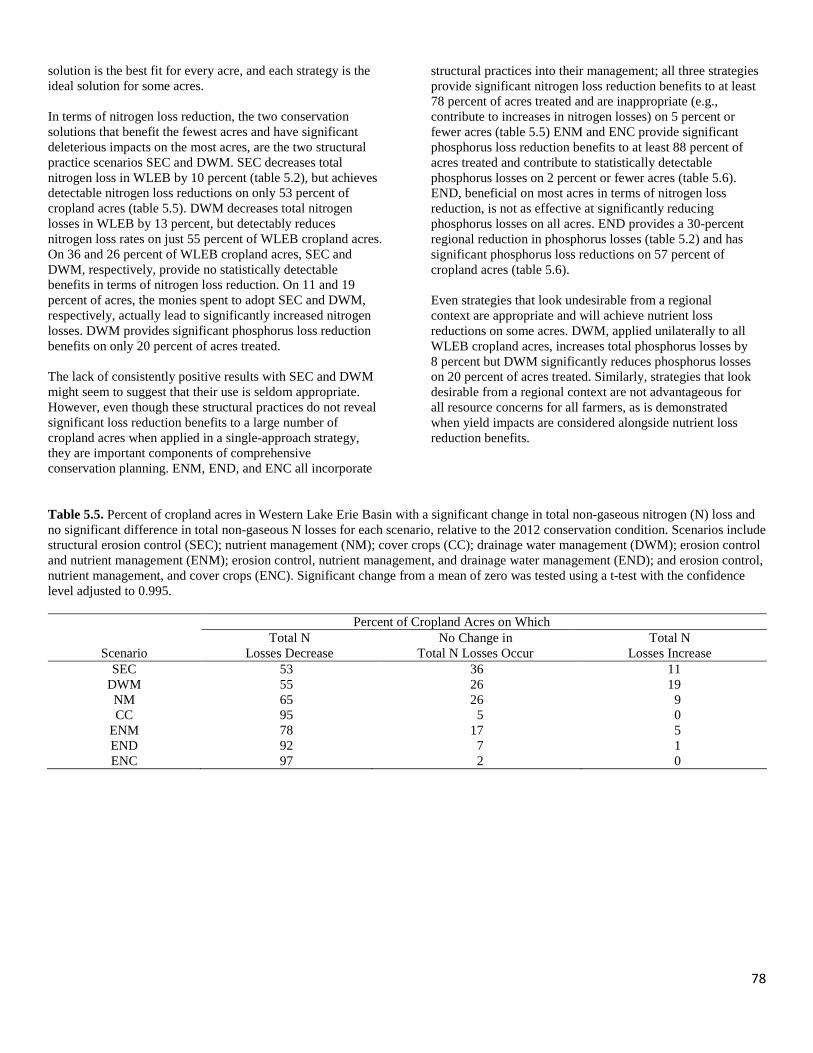
78
solution is the best fit for every acre, and each strategy is the ideal solution for some acres. In terms of nitrogen loss reduction, the two conservation solutions that benefit the fewest acres and have significant deleterious impacts on the most acres, are the two structural practice scenarios SEC and DWM. SEC decreases total nitrogen loss in WLEB by 10 percent (table 5.2), but achieves detectable nitrogen loss reductions on only 53 percent of cropland acres (table 5.5). DWM decreases total nitrogen losses in WLEB by 13 percent, but detectably reduces nitrogen loss rates on just 55 percent of WLEB cropland acres. On 36 and 26 percent of WLEB cropland acres, SEC and DWM, respectively, provide no statistically detectable benefits in terms of nitrogen loss reduction. On 11 and 19 percent of acres, the monies spent to adopt SEC and DWM, respectively, actually lead to significantly increased nitrogen losses. DWM provides significant phosphorus loss reduction benefits on only 20 percent of acres treated. The lack of consistently positive results with SEC and DWM might seem to suggest that their use is seldom appropriate. However, even though these structural practices do not reveal significant loss reduction benefits to a large number of cropland acres when applied in a single-approach strategy, they are important components of comprehensive conservation planning. ENM, END, and ENC all incorporate
structural practices into their management; all three strategies provide significant nitrogen loss reduction benefits to at least 78 percent of acres treated and are inappropriate (e.g., contribute to increases in nitrogen losses) on 5 percent or fewer acres (table 5.5) ENM and ENC provide significant phosphorus loss reduction benefits to at least 88 percent of acres treated and contribute to statistically detectable phosphorus losses on 2 percent or fewer acres (table 5.6). END, beneficial on most acres in terms of nitrogen loss reduction, is not as effective at significantly reducing phosphorus losses on all acres. END provides a 30-percent regional reduction in phosphorus losses (table 5.2) and has significant phosphorus loss reductions on 57 percent of cropland acres (table 5.6). Even strategies that look undesirable from a regional context are appropriate and will achieve nutrient loss reductions on some acres. DWM, applied unilaterally to all WLEB cropland acres, increases total phosphorus losses by 8 percent but DWM significantly reduces phosphorus losses on 20 percent of acres treated. Similarly, strategies that look desirable from a regional context are not advantageous for all resource concerns for all farmers, as is demonstrated when yield impacts are considered alongside nutrient loss reduction benefits.
Table 5.5. Percent of cropland acres in Western Lake Erie Basin with a significant change in total non-gaseous nitrogen (N) loss and no significant difference in total non-gaseous N losses for each scenario, relative to the 2012 conservation condition. Scenarios include structural erosion control (SEC); nutrient management (NM); cover crops (CC); drainage water management (DWM); erosion control and nutrient management (ENM); erosion control, nutrient management, and drainage water management (END); and erosion control, nutrient management, and cover crops (ENC). Significant change from a mean of zero was tested using a t-test with the confidence level adjusted to 0.995.
Percent of Cropland Acres on Which
Scenario Total N
Losses Decrease No Change in
Total N Losses Occur Total N
Losses Increase SEC 53 36 11
DWM 55 26 19 NM 65 26 9 CC 95 5 0
ENM 78 17 5 END 92 7 1 ENC 97 2 0
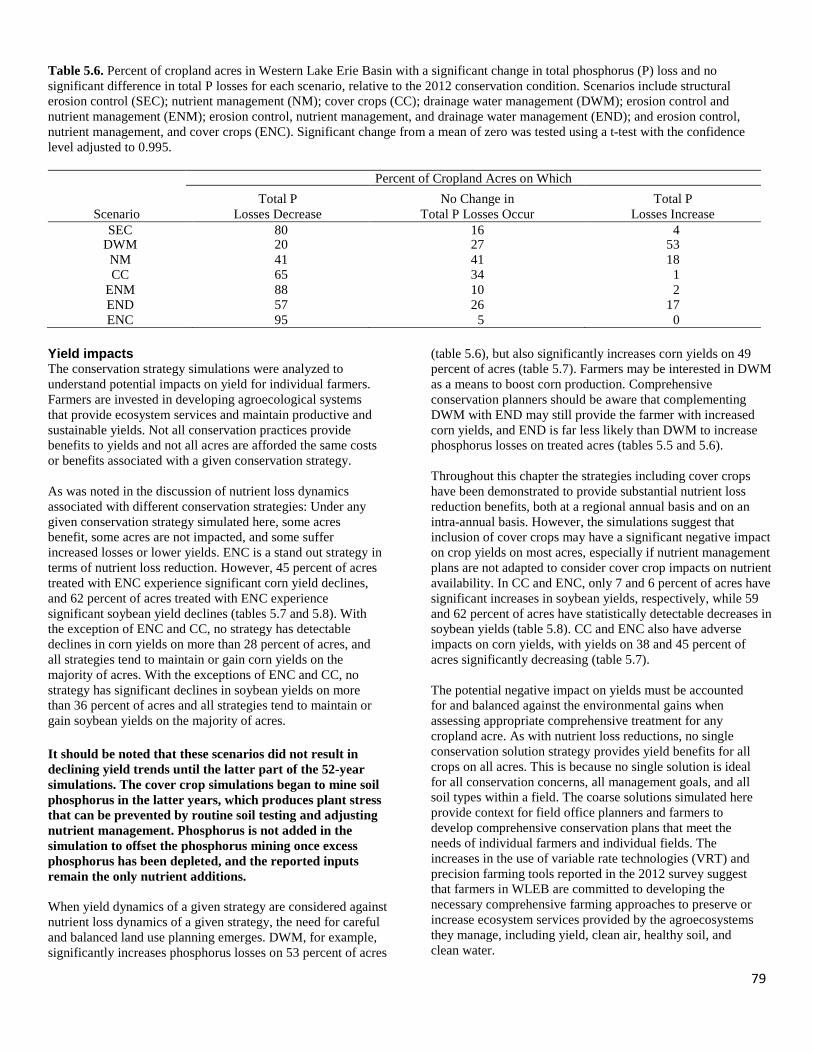
79
Table 5.6. Percent of cropland acres in Western Lake Erie Basin with a significant change in total phosphorus (P) loss and no significant difference in total P losses for each scenario, relative to the 2012 conservation condition. Scenarios include structural erosion control (SEC); nutrient management (NM); cover crops (CC); drainage water management (DWM); erosion control and nutrient management (ENM); erosion control, nutrient management, and drainage water management (END); and erosion control, nutrient management, and cover crops (ENC). Significant change from a mean of zero was tested using a t-test with the confidence level adjusted to 0.995.
Percent of Cropland Acres on Which
Scenario Total P
Losses Decrease No Change in
Total P Losses Occur Total P
Losses Increase SEC 80 16 4
DWM 20 27 53 NM 41 41 18 CC 65 34 1
ENM 88 10 2 END 57 26 17 ENC 95 5 0
Yield impacts The conservation strategy simulations were analyzed to understand potential impacts on yield for individual farmers. Farmers are invested in developing agroecological systems that provide ecosystem services and maintain productive and sustainable yields. Not all conservation practices provide benefits to yields and not all acres are afforded the same costs or benefits associated with a given conservation strategy. As was noted in the discussion of nutrient loss dynamics associated with different conservation strategies: Under any given conservation strategy simulated here, some acres benefit, some acres are not impacted, and some suffer increased losses or lower yields. ENC is a stand out strategy in terms of nutrient loss reduction. However, 45 percent of acres treated with ENC experience significant corn yield declines, and 62 percent of acres treated with ENC experience significant soybean yield declines (tables 5.7 and 5.8). With the exception of ENC and CC, no strategy has detectable declines in corn yields on more than 28 percent of acres, and all strategies tend to maintain or gain corn yields on the majority of acres. With the exceptions of ENC and CC, no strategy has significant declines in soybean yields on more than 36 percent of acres and all strategies tend to maintain or gain soybean yields on the majority of acres. It should be noted that these scenarios did not result in declining yield trends until the latter part of the 52-year simulations. The cover crop simulations began to mine soil phosphorus in the latter years, which produces plant stress that can be prevented by routine soil testing and adjusting nutrient management. Phosphorus is not added in the simulation to offset the phosphorus mining once excess phosphorus has been depleted, and the reported inputs remain the only nutrient additions. When yield dynamics of a given strategy are considered against nutrient loss dynamics of a given strategy, the need for careful and balanced land use planning emerges. DWM, for example, significantly increases phosphorus losses on 53 percent of acres
(table 5.6), but also significantly increases corn yields on 49 percent of acres (table 5.7). Farmers may be interested in DWM as a means to boost corn production. Comprehensive conservation planners should be aware that complementing DWM with END may still provide the farmer with increased corn yields, and END is far less likely than DWM to increase phosphorus losses on treated acres (tables 5.5 and 5.6). Throughout this chapter the strategies including cover crops have been demonstrated to provide substantial nutrient loss reduction benefits, both at a regional annual basis and on an intra-annual basis. However, the simulations suggest that inclusion of cover crops may have a significant negative impact on crop yields on most acres, especially if nutrient management plans are not adapted to consider cover crop impacts on nutrient availability. In CC and ENC, only 7 and 6 percent of acres have significant increases in soybean yields, respectively, while 59 and 62 percent of acres have statistically detectable decreases in soybean yields (table 5.8). CC and ENC also have adverse impacts on corn yields, with yields on 38 and 45 percent of acres significantly decreasing (table 5.7). The potential negative impact on yields must be accounted for and balanced against the environmental gains when assessing appropriate comprehensive treatment for any cropland acre. As with nutrient loss reductions, no single conservation solution strategy provides yield benefits for all crops on all acres. This is because no single solution is ideal for all conservation concerns, all management goals, and all soil types within a field. The coarse solutions simulated here provide context for field office planners and farmers to develop comprehensive conservation plans that meet the needs of individual farmers and individual fields. The increases in the use of variable rate technologies (VRT) and precision farming tools reported in the 2012 survey suggest that farmers in WLEB are committed to developing the necessary comprehensive farming approaches to preserve or increase ecosystem services provided by the agroecosystems they manage, including yield, clean air, healthy soil, and clean water.
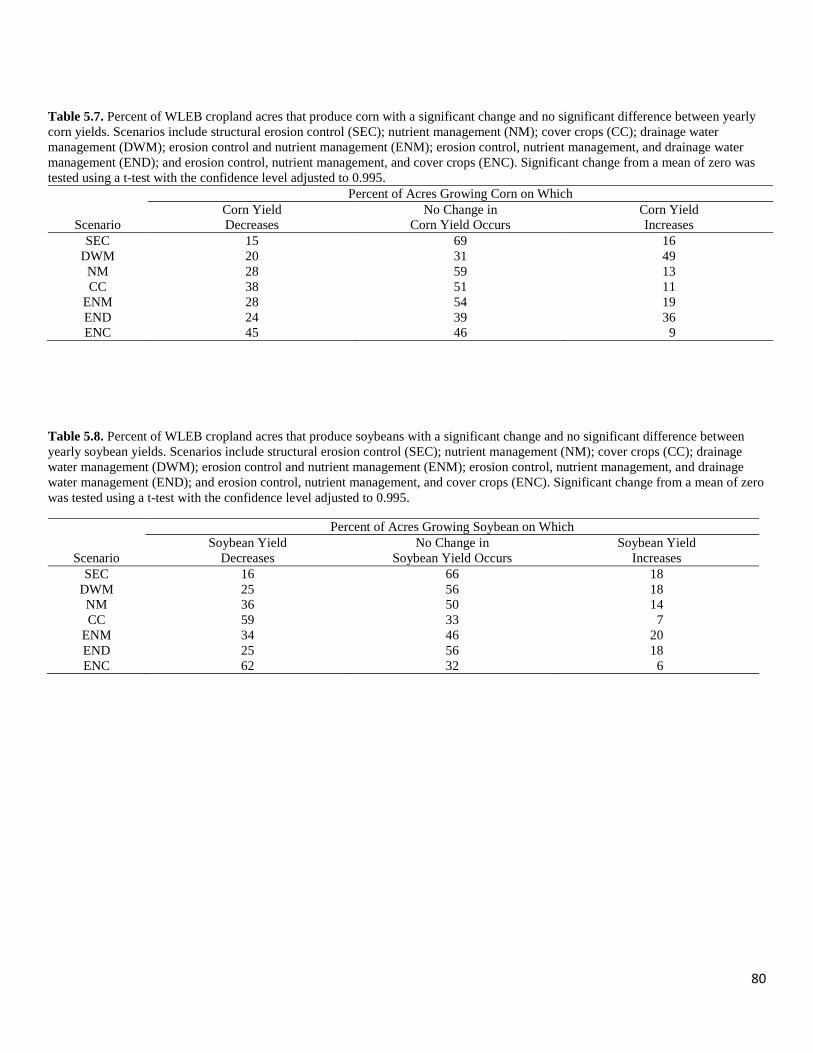
80
Table 5.7. Percent of WLEB cropland acres that produce corn with a significant change and no significant difference between yearly corn yields. Scenarios include structural erosion control (SEC); nutrient management (NM); cover crops (CC); drainage water management (DWM); erosion control and nutrient management (ENM); erosion control, nutrient management, and drainage water management (END); and erosion control, nutrient management, and cover crops (ENC). Significant change from a mean of zero was tested using a t-test with the confidence level adjusted to 0.995.
Percent of Acres Growing Corn on Which
Scenario Corn Yield Decreases
No Change in Corn Yield Occurs
Corn Yield Increases
SEC 15 69 16 DWM 20 31 49 NM 28 59 13 CC 38 51 11
ENM 28 54 19 END 24 39 36 ENC 45 46 9
Table 5.8. Percent of WLEB cropland acres that produce soybeans with a significant change and no significant difference between yearly soybean yields. Scenarios include structural erosion control (SEC); nutrient management (NM); cover crops (CC); drainage water management (DWM); erosion control and nutrient management (ENM); erosion control, nutrient management, and drainage water management (END); and erosion control, nutrient management, and cover crops (ENC). Significant change from a mean of zero was tested using a t-test with the confidence level adjusted to 0.995.
Percent of Acres Growing Soybean on Which
Scenario Soybean Yield
Decreases No Change in
Soybean Yield Occurs Soybean Yield
Increases SEC 16 66 18
DWM 25 56 18 NM 36 50 14 CC 59 33 7
ENM 34 46 20 END 25 56 18 ENC 62 32 6
81
References Andersson, H., L. Bergstrom, B. Ulen, F. Djodjic, and H. Kirchmann. 2015. The role of subsoil as a source or sink for phosphorus
leaching. Journal of Environmental Quality 44:535-544.
Arnold, J.G., R. Srinivasan, R.S. Muttiah, and P.M. Allen. 1999. Continental scale simulation of the hydrologic balance. Journal of the American Water Resources Association 35(5):1037-1052.
ASAE Standards, 49th Ed. 2002a. EP496.2. Agricultural machinery management. St. Joseph, Michigan: ASAE.
ASAE Standards, 49th Ed. 2002b. D497.4 Jan98. Agricultural machinery management data. St. Joseph, Michigan: ASAE.
Baker, D.B., and R.P. Richards. 2002. Phosphorus budgets and riverine phosphorus export in northwestern Ohio watersheds. Journal of Environmental Quality 31:96-108.
Barrios, E. 2007. Soil biota, ecosystem services and land productivity. Ecological Economics 64:269-285.
Chen, D.J., H. Huang, M.P. Hu, and R.A. Dahlgren. 2014. Influence of lag effect, soil release, and climate change on watershed anthropogenic nitrogen inputs and riverine export dynamics. Environmental Science and Technology 48:5863-5690.
Daly C., R.P. Neilson, and D.L. Phillips, 1994: A statistical-topographic model for mapping climatological precipitation over mountainous terrain. Journal of Applied Meteorology and Climatology 33:140–158.
Di Luzio M., G.L. Johnson, C. Daly, Jon K. Eischeid, J.G. Arnold. 2008. Constructing retrospective gridded daily precipitation and temperature datasets for the conterminous United States. Journal of Applied Meteorology and Climatology 47(2):475–497.
Eischeid, Jon K., Phil A. Pasteris, Henry F. Diaz, Marc S. Plantico, and Neal J. Lott. 2000. Creating a serially complete, national daily time series of temperature and precipitation for the western United States. Journal of Applied Meteorology 39 (September):1580-1591.
Franzluebbers, A.J. 2002. Soil organic matter stratification ratio as an indicator of soil quality. Soil and Tillage Research 66:95-106.
Gassman, P.W., J.R. Williams, S. Wang, A. Saleh, E. Osei, L. Hauck, C. Izaurralde, and J. Flowers. 2009. The agricultural policy environmental extender (APEX) model: An emerging tool for landscape and watershed environmental analyses. Technical Report 09-TR 49. CARD, Iowa State University, Ames, IA. Available at: http://www.card.iastate.edu/publications/synopsis.aspx?id=1101.
Gassman, P.W., J.R. Williams, S. Wang, A. Saleh, E. Osei, L. Hauck, C. Izaurralde, and J. Flowers. 2010. The agricultural policy environmental Extender (APEX) model: An emerging tool for landscape and watershed environmental analyses. Transactions of the American Society of Agricultural and Biological Engineers 711-740.
International Joint Commission. 2014. A balanced diet for Lake Erie: Reducing phosphorus loadings and harmful algal blooms. Report of the Lake Erie Ecosystem Priority, Washington, D.C., and Ottawa, Ontario, 100 pp.
Izaurralde, R.C., J.R. Williams, W.B. McGill, N.J. Rosenberg, M.C. Quiroga Jakas. 2006. Simulating soil C dynamics with EPIC: Model description and testing against long-term data. Ecological Modelling 192:362-384.
Jarvie, H.P., A.N. Sharpley, B. Spears, A.R. Buda, L. May, and P.J.A. Kleinman. 2013. Water quality remediation faces unprecedented challenges from “legacy phosphorus.” Environmental Science and Technology 47: 8997-8998.
Kleinman, P.J.A., A.N. Sharpley, A.R. Buda, R.W. McDowell, and A.L. Allen. 2011a. Soil controls on phosphorus runoff: Management barriers and opportunities. Canadian Journal of Soil Science 91:329-338.
Kleinman, P.J.A., A.N. Sharpley, R.W. McDowell, D.N. Flaten, A.R. Buda, L. Tao, L. Bergstrom, and Q. Zhu. 2011b. Managing agricultural phosphorus for water quality protection: Principles for progress. Plant and Soil 349:169-182.
Kott, P.S. 2001. The delete-a-group jackknife. Journal of Official Statistics 17:521-526.
Liu, J., Y. Hu, J. Yang, D. Abdi, and B.J. Cade-Menun. 2014. Investigation of soil legacy phosphorus transformation in long-term agricultural fields using sequential fractionation, P K-edge XANES and solution P NMR spectroscopy. Environmental Science and Technology 49:168-176.
McDowell, R.W., A.N. Sharpley, and P.J.A. Kleinman. 2002. Integrating phosphorus and nitrogen decision management at watershed scales. Journal of the American Water Resources Association 38(2):479-491.
Meals, D.W., S.A. Dressing, and T.E. Davenport. 2010. Lag time in water quality response to best management practices: A review. Journal of Environmental Quality 39:85-96.
82
Ohio Lake Erie Phosphorus Task Force. 2010. Ohio Lake Erie phosphorus task force final report. Ohio Environmental Protection Agency, Division of Surface Water. 109 pp. http://epa.ohio.gov/portals/35/lakeerie/ptaskforce/Task_Force_Final_Report_April_2010.pdf Accessed 30 October, 2015.
Pankhurst, C.E., B.M. Doube, V.V.S.R. Gupta, Eds. 1997. Biological indicators of soil health. CABI, Wallingford, Oxfordshire, 451pp.
Paul, E.A., K. Paustian, E.T. Elliott, C.V. Cole, Eds. 1997. Soil organic matter in temperate agroecosystems. Long Term Experiments in North America. CRC Press, Inc., Boca Raton, Florida, 414 pp.
Reicosky, D.C. 2001. Effects of conservation tillage on soil organic carbon dynamics: Field experiments in the U.S. corn belt. In: Scott, D.E., Mohtar R.H., Steinhart, G.C., eds., Sustaining the global farm. Purdue University and the USDA-ARS National Soil Erosion Research Laboratory, Morris, Minnesota, pp. 481-485.
Richards, R.P., D.B. Baker, and D.J. Eckert. 2002a. Trends in agriculture in the LEASEQ watersheds, 1975-1995. Journal of Environmental Quality 31:17-24.
Richards, R.P., F.G. Calhoun, and G. Matisoff. 2002b. The Lake Erie agricultural systems for environmental quality project: An introduction. Journal of Environmental Quality 31: 6-16.
Schimmelpfennig, D., and R. Ebel. 2011. On the doorstep of the information age: Recent adoption of precision agriculture. Economic Information Bulletin, EIB-80, August, 25 pp.
Sebilo, M., B. Mayer, B. Nicolardot, G. Pinay, and A. Marriotti. 2013. Long-term fate of nitrate fertilizer in agricultural soils. Proceedings of the National Academy of Sciences of the United States of America 110:18185-18189.
Sharpley, A., H.P. Jarvie, A. Buda, L. May, B. Spears, and P. Kleinman. 2013. Phosphorus legacy: Overcoming the effects of past management practices to mitigate future water quality impairment. Journal of Environmental Quality 42:1308-1326.
Sharpley, A., P. Richards, S. Herron, and D. Baker. 2012. Case study comparison between litigated and voluntary nutrient management strategies. Journal of Soil and Water Conservation 67:442-450.
Skaggs, R.W., N.R. Fausey, and R.O. Evans. 2012. Drainage water management. Journal of Soil and Water Conservation 67:167-172A.
Skaggs, R.W., M.A. Youssef, J.W. Gilliam, and R.O. Evans. 2010. Effect of controlled drainage on water and nitrogen balances in drained lands. Transactions of the American Society of Agricultural and Biological Engineers 53:1843-1850.
Tomer, M.D., K.E. Schilling, C.A. Cambardella, P. Jacobson, P. Drobney. 2010. Groundwater nutrient concentrations during prairie reconstruction on an Iowa landscape. Agriculture, Ecosystems, and the Environment 139:206-213.
Tschorke, A. 2008. Great Lakes water quality agreement: Is honesty without accountability or enforcement still enough? Missouri Environmental Law and Policy Review, volume 15, issue 2, article 3.
U.S. Department of Agriculture, Natural Resources Conservation Service (USDA NRCS). 2007a. 2003 National Resources Inventory, http://www.nrcs.usda.gov/nri. U.S. Department of Agriculture, National Agricultural Statistics Service. 2009. 2007 Census of Agriculture. Database.
U.S. Department of Agriculture, Natural Resources Conservation Service (USDA NRCS). 2011. Assessment of the effects of conservation practices on cultivated cropland in the Chesapeake Bay region. 158 pages. http://www.nrcs.usda.gov/Internet/FSE_DOCUMENTS/stelprdb1042076.pdf
Williams, J.R. 1990. The erosion productivity impact calculator (EPIC) model: A case history. Phil. Trans. R. Soc. Lond. 329:421-428.
Williams, J.R., C.A. Jones, and P.T. Dyke. 1984. A modeling approach to determining the relationship between erosion and soil productivity. Transactions of the American Society of Agricultural and Biological Engineers 27(1):129-144.
Williams, J. R., W. L. Harman, M. Magre, U. Kizil, J.A. Lindley, G. Padmanabhan, and E. Wang. 2006. APEX feedlot water quality simulation. Transactions of the American Society of Agricultural and Biological Engineers 49(1):61-73.
Williams, J.R., R.C. Izaurralde, and E.M. Steglich. 2012. Agricultural policy/environmental eXtender model: Theoretical documentation version 0806. Temple, Texas: Texas AgriLife Research, Texas A&M University, Blackland Research and Extension Center. Available at: http://epicapex.tamu.edu/files/2014/10/APEX0806-theoretical-documentation.pdf. Accessed January 22, 2016.
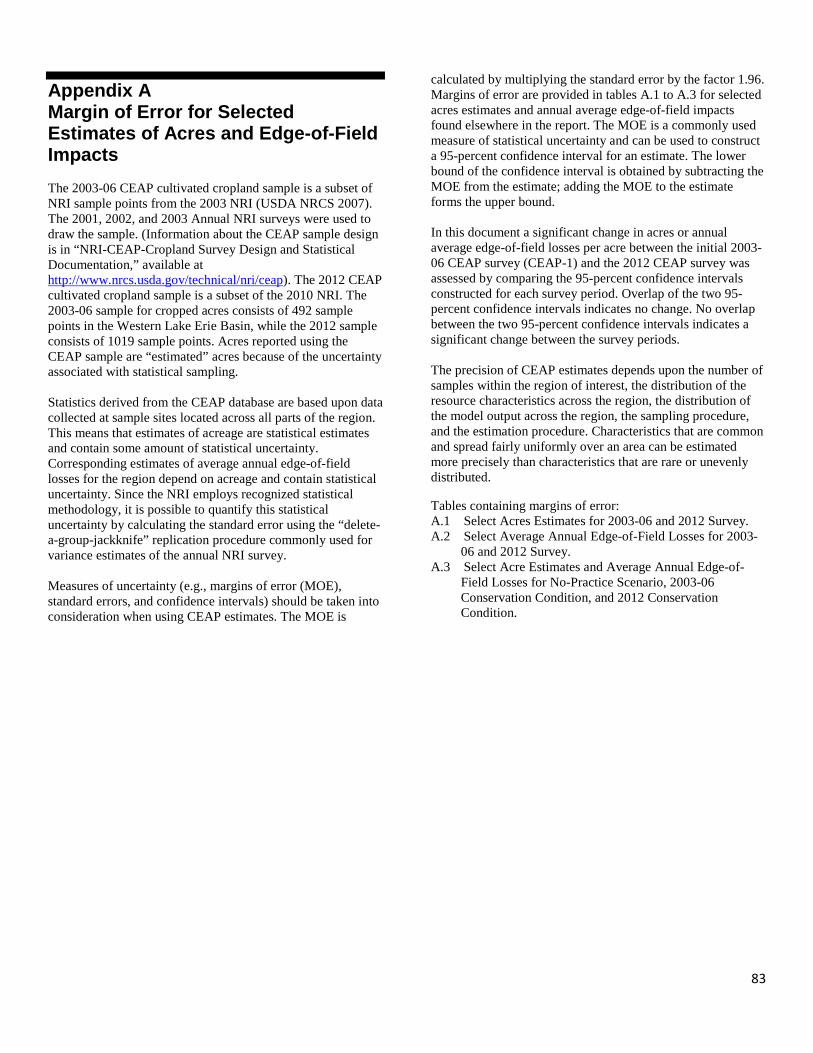
83
Appendix A Margin of Error for Selected Estimates of Acres and Edge-of-Field Impacts The 2003-06 CEAP cultivated cropland sample is a subset of NRI sample points from the 2003 NRI (USDA NRCS 2007). The 2001, 2002, and 2003 Annual NRI surveys were used to draw the sample. (Information about the CEAP sample design is in “NRI-CEAP-Cropland Survey Design and Statistical Documentation,” available at http://www.nrcs.usda.gov/technical/nri/ceap). The 2012 CEAP cultivated cropland sample is a subset of the 2010 NRI. The 2003-06 sample for cropped acres consists of 492 sample points in the Western Lake Erie Basin, while the 2012 sample consists of 1019 sample points. Acres reported using the CEAP sample are “estimated” acres because of the uncertainty associated with statistical sampling. Statistics derived from the CEAP database are based upon data collected at sample sites located across all parts of the region. This means that estimates of acreage are statistical estimates and contain some amount of statistical uncertainty. Corresponding estimates of average annual edge-of-field losses for the region depend on acreage and contain statistical uncertainty. Since the NRI employs recognized statistical methodology, it is possible to quantify this statistical uncertainty by calculating the standard error using the “delete-a-group-jackknife” replication procedure commonly used for variance estimates of the annual NRI survey. Measures of uncertainty (e.g., margins of error (MOE), standard errors, and confidence intervals) should be taken into consideration when using CEAP estimates. The MOE is
calculated by multiplying the standard error by the factor 1.96. Margins of error are provided in tables A.1 to A.3 for selected acres estimates and annual average edge-of-field impacts found elsewhere in the report. The MOE is a commonly used measure of statistical uncertainty and can be used to construct a 95-percent confidence interval for an estimate. The lower bound of the confidence interval is obtained by subtracting the MOE from the estimate; adding the MOE to the estimate forms the upper bound. In this document a significant change in acres or annual average edge-of-field losses per acre between the initial 2003-06 CEAP survey (CEAP-1) and the 2012 CEAP survey was assessed by comparing the 95-percent confidence intervals constructed for each survey period. Overlap of the two 95-percent confidence intervals indicates no change. No overlap between the two 95-percent confidence intervals indicates a significant change between the survey periods. The precision of CEAP estimates depends upon the number of samples within the region of interest, the distribution of the resource characteristics across the region, the distribution of the model output across the region, the sampling procedure, and the estimation procedure. Characteristics that are common and spread fairly uniformly over an area can be estimated more precisely than characteristics that are rare or unevenly distributed.
Tables containing margins of error: A.1 Select Acres Estimates for 2003-06 and 2012 Survey. A.2 Select Average Annual Edge-of-Field Losses for 2003-
06 and 2012 Survey. A.3 Select Acre Estimates and Average Annual Edge-of-
Field Losses for No-Practice Scenario, 2003-06 Conservation Condition, and 2012 Conservation Condition.
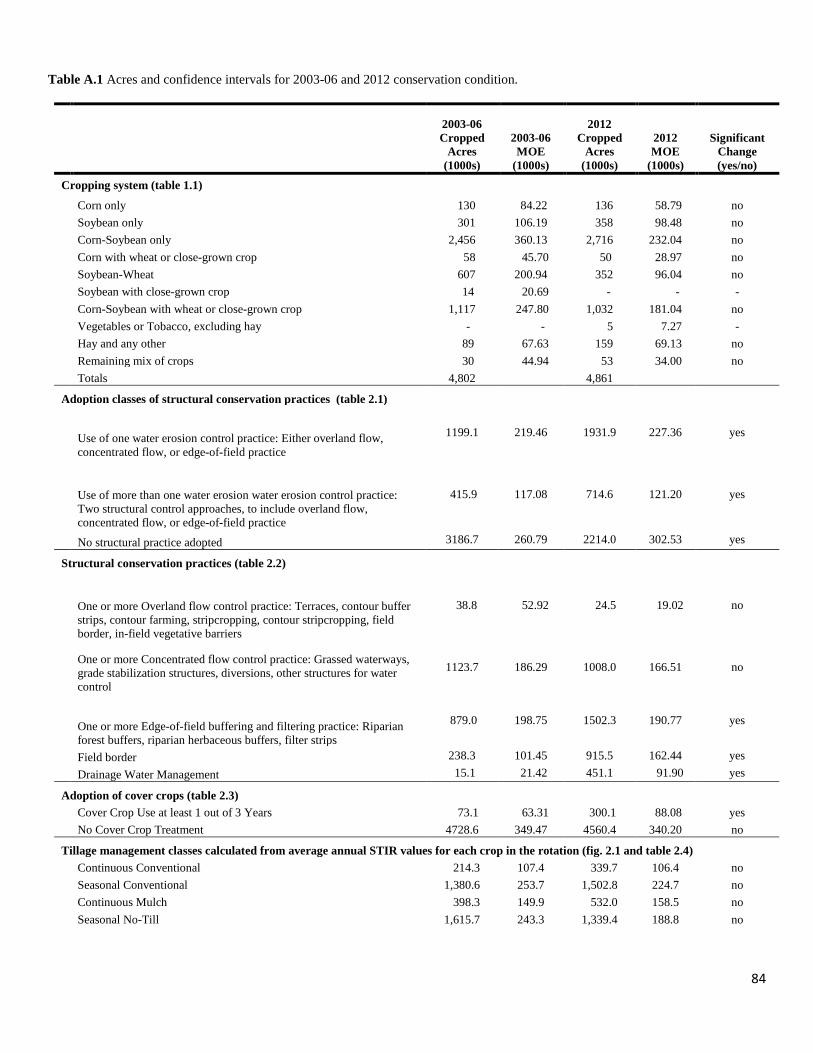
84
Table A.1 Acres and confidence intervals for 2003-06 and 2012 conservation condition.
2003-06 Cropped
Acres (1000s)
2003-06 MOE
(1000s)
2012 Cropped
Acres (1000s)
2012 MOE
(1000s)
Significant Change (yes/no)
Cropping system (table 1.1)
Corn only 130 84.22 136 58.79 no Soybean only 301 106.19 358 98.48 no Corn-Soybean only 2,456 360.13 2,716 232.04 no Corn with wheat or close-grown crop 58 45.70 50 28.97 no Soybean-Wheat 607 200.94 352 96.04 no Soybean with close-grown crop 14 20.69 - - - Corn-Soybean with wheat or close-grown crop 1,117 247.80 1,032 181.04 no Vegetables or Tobacco, excluding hay - - 5 7.27 - Hay and any other 89 67.63 159 69.13 no Remaining mix of crops 30 44.94 53 34.00 no Totals 4,802 4,861
Adoption classes of structural conservation practices (table 2.1)
Use of one water erosion control practice: Either overland flow, concentrated flow, or edge-of-field practice
1199.1 219.46 1931.9 227.36 yes
Use of more than one water erosion water erosion control practice: Two structural control approaches, to include overland flow, concentrated flow, or edge-of-field practice
415.9 117.08 714.6 121.20 yes
No structural practice adopted 3186.7 260.79 2214.0 302.53 yes
Structural conservation practices (table 2.2)
One or more Overland flow control practice: Terraces, contour buffer strips, contour farming, stripcropping, contour stripcropping, field border, in-field vegetative barriers
38.8 52.92 24.5 19.02 no
One or more Concentrated flow control practice: Grassed waterways, grade stabilization structures, diversions, other structures for water control
1123.7 186.29 1008.0 166.51 no
One or more Edge-of-field buffering and filtering practice: Riparian forest buffers, riparian herbaceous buffers, filter strips
879.0 198.75 1502.3 190.77 yes
Field border 238.3 101.45 915.5 162.44 yes Drainage Water Management 15.1 21.42 451.1 91.90 yes
Adoption of cover crops (table 2.3) Cover Crop Use at least 1 out of 3 Years 73.1 63.31 300.1 88.08 yes No Cover Crop Treatment 4728.6 349.47 4560.4 340.20 no
Tillage management classes calculated from average annual STIR values for each crop in the rotation (fig. 2.1 and table 2.4) Continuous Conventional 214.3 107.4 339.7 106.4 no Seasonal Conventional 1,380.6 253.7 1,502.8 224.7 no Continuous Mulch 398.3 149.9 532.0 158.5 no Seasonal No-Till 1,615.7 243.3 1,339.4 188.8 no
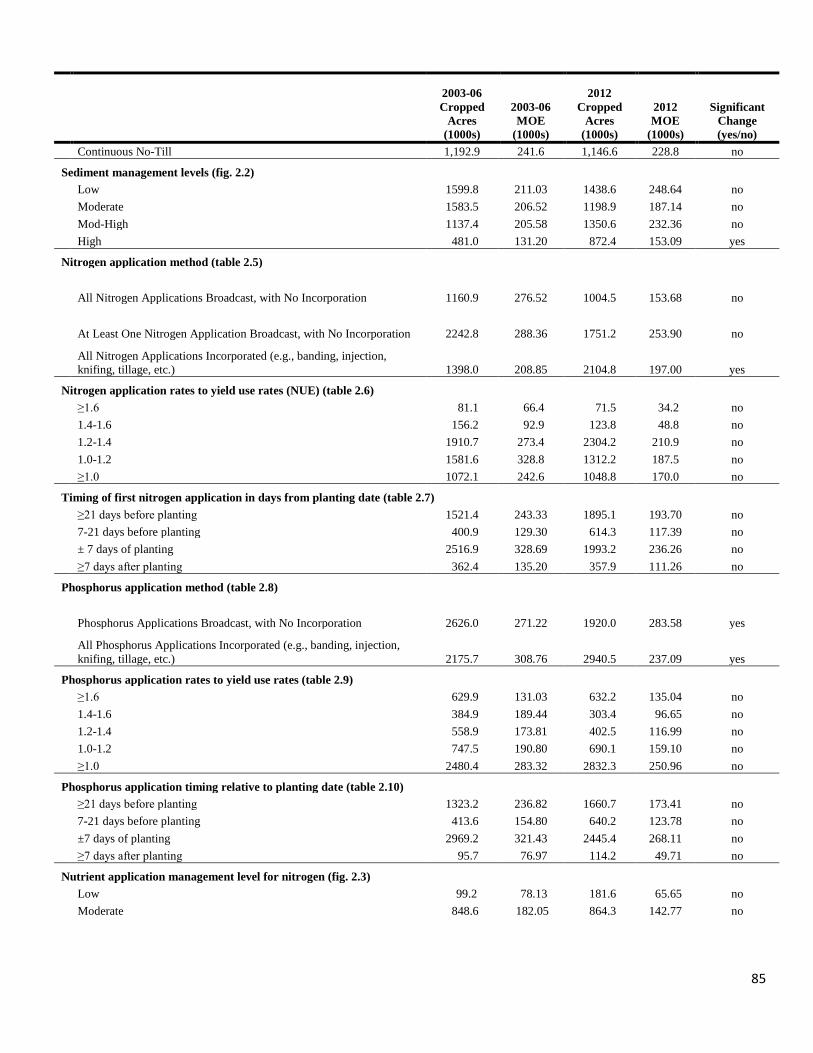
85
2003-06 Cropped
Acres (1000s)
2003-06 MOE
(1000s)
2012 Cropped
Acres (1000s)
2012 MOE
(1000s)
Significant Change (yes/no)
Continuous No-Till 1,192.9 241.6 1,146.6 228.8 no
Sediment management levels (fig. 2.2) Low 1599.8 211.03 1438.6 248.64 no Moderate 1583.5 206.52 1198.9 187.14 no Mod-High 1137.4 205.58 1350.6 232.36 no High 481.0 131.20 872.4 153.09 yes
Nitrogen application method (table 2.5)
All Nitrogen Applications Broadcast, with No Incorporation 1160.9 276.52 1004.5 153.68 no
At Least One Nitrogen Application Broadcast, with No Incorporation 2242.8 288.36 1751.2 253.90 no
All Nitrogen Applications Incorporated (e.g., banding, injection, knifing, tillage, etc.) 1398.0 208.85 2104.8 197.00 yes
Nitrogen application rates to yield use rates (NUE) (table 2.6) ≥1.6 81.1 66.4 71.5 34.2 no 1.4-1.6 156.2 92.9 123.8 48.8 no 1.2-1.4 1910.7 273.4 2304.2 210.9 no 1.0-1.2 1581.6 328.8 1312.2 187.5 no ≥1.0 1072.1 242.6 1048.8 170.0 no
Timing of first nitrogen application in days from planting date (table 2.7) ≥21 days before planting 1521.4 243.33 1895.1 193.70 no 7-21 days before planting 400.9 129.30 614.3 117.39 no ± 7 days of planting 2516.9 328.69 1993.2 236.26 no ≥7 days after planting 362.4 135.20 357.9 111.26 no
Phosphorus application method (table 2.8)
Phosphorus Applications Broadcast, with No Incorporation 2626.0 271.22 1920.0 283.58 yes
All Phosphorus Applications Incorporated (e.g., banding, injection, knifing, tillage, etc.) 2175.7 308.76 2940.5 237.09 yes
Phosphorus application rates to yield use rates (table 2.9) ≥1.6 629.9 131.03 632.2 135.04 no 1.4-1.6 384.9 189.44 303.4 96.65 no 1.2-1.4 558.9 173.81 402.5 116.99 no 1.0-1.2 747.5 190.80 690.1 159.10 no ≥1.0 2480.4 283.32 2832.3 250.96 no
Phosphorus application timing relative to planting date (table 2.10) ≥21 days before planting 1323.2 236.82 1660.7 173.41 no 7-21 days before planting 413.6 154.80 640.2 123.78 no ±7 days of planting 2969.2 321.43 2445.4 268.11 no ≥7 days after planting 95.7 76.97 114.2 49.71 no
Nutrient application management level for nitrogen (fig. 2.3) Low 99.2 78.13 181.6 65.65 no Moderate 848.6 182.05 864.3 142.77 no
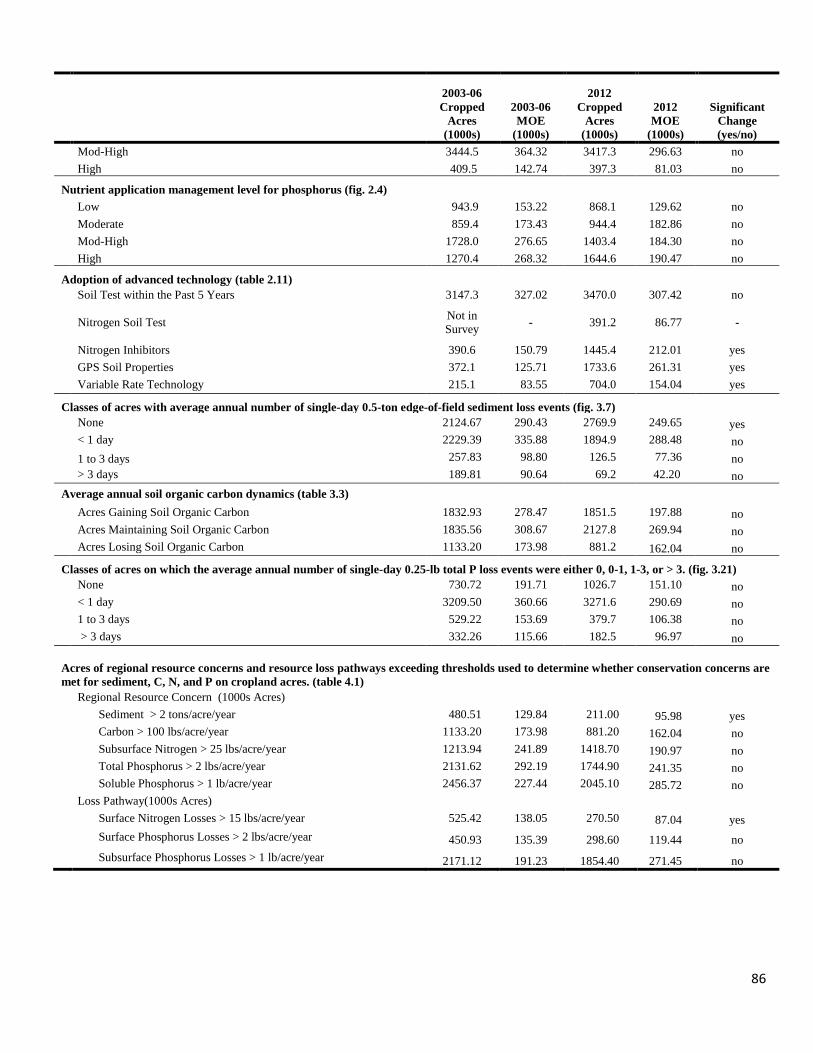
86
2003-06 Cropped
Acres (1000s)
2003-06 MOE
(1000s)
2012 Cropped
Acres (1000s)
2012 MOE
(1000s)
Significant Change (yes/no)
Mod-High 3444.5 364.32 3417.3 296.63 no High 409.5 142.74 397.3 81.03 no
Nutrient application management level for phosphorus (fig. 2.4) Low 943.9 153.22 868.1 129.62 no Moderate 859.4 173.43 944.4 182.86 no Mod-High 1728.0 276.65 1403.4 184.30 no High 1270.4 268.32 1644.6 190.47 no
Adoption of advanced technology (table 2.11) Soil Test within the Past 5 Years 3147.3 327.02 3470.0 307.42 no
Nitrogen Soil Test Not in
Survey - 391.2 86.77 -
Nitrogen Inhibitors 390.6 150.79 1445.4 212.01 yes GPS Soil Properties 372.1 125.71 1733.6 261.31 yes Variable Rate Technology 215.1 83.55 704.0 154.04 yes
Classes of acres with average annual number of single-day 0.5-ton edge-of-field sediment loss events (fig. 3.7) None 2124.67 290.43 2769.9 249.65 yes < 1 day 2229.39 335.88 1894.9 288.48 no 1 to 3 days 257.83 98.80 126.5 77.36 no > 3 days 189.81 90.64 69.2 42.20 no Average annual soil organic carbon dynamics (table 3.3) Acres Gaining Soil Organic Carbon 1832.93 278.47 1851.5 197.88 no Acres Maintaining Soil Organic Carbon 1835.56 308.67 2127.8 269.94 no Acres Losing Soil Organic Carbon 1133.20 173.98 881.2 162.04 no
Classes of acres on which the average annual number of single-day 0.25-lb total P loss events were either 0, 0-1, 1-3, or > 3. (fig. 3.21) None 730.72 191.71 1026.7 151.10 no < 1 day 3209.50 360.66 3271.6 290.69 no 1 to 3 days 529.22 153.69 379.7 106.38 no > 3 days 332.26 115.66 182.5 96.97 no
Acres of regional resource concerns and resource loss pathways exceeding thresholds used to determine whether conservation concerns are met for sediment, C, N, and P on cropland acres. (table 4.1) Regional Resource Concern (1000s Acres) Sediment > 2 tons/acre/year 480.51 129.84 211.00 95.98 yes Carbon > 100 lbs/acre/year 1133.20 173.98 881.20 162.04 no Subsurface Nitrogen > 25 lbs/acre/year 1213.94 241.89 1418.70 190.97 no Total Phosphorus > 2 lbs/acre/year 2131.62 292.19 1744.90 241.35 no Soluble Phosphorus > 1 lb/acre/year 2456.37 227.44 2045.10 285.72 no Loss Pathway(1000s Acres) Surface Nitrogen Losses > 15 lbs/acre/year 525.42 138.05 270.50 87.04 yes
Surface Phosphorus Losses > 2 lbs/acre/year 450.93 135.39 298.60 119.44 no
Subsurface Phosphorus Losses > 1 lb/acre/year 2171.12 191.23 1854.40 271.45 no
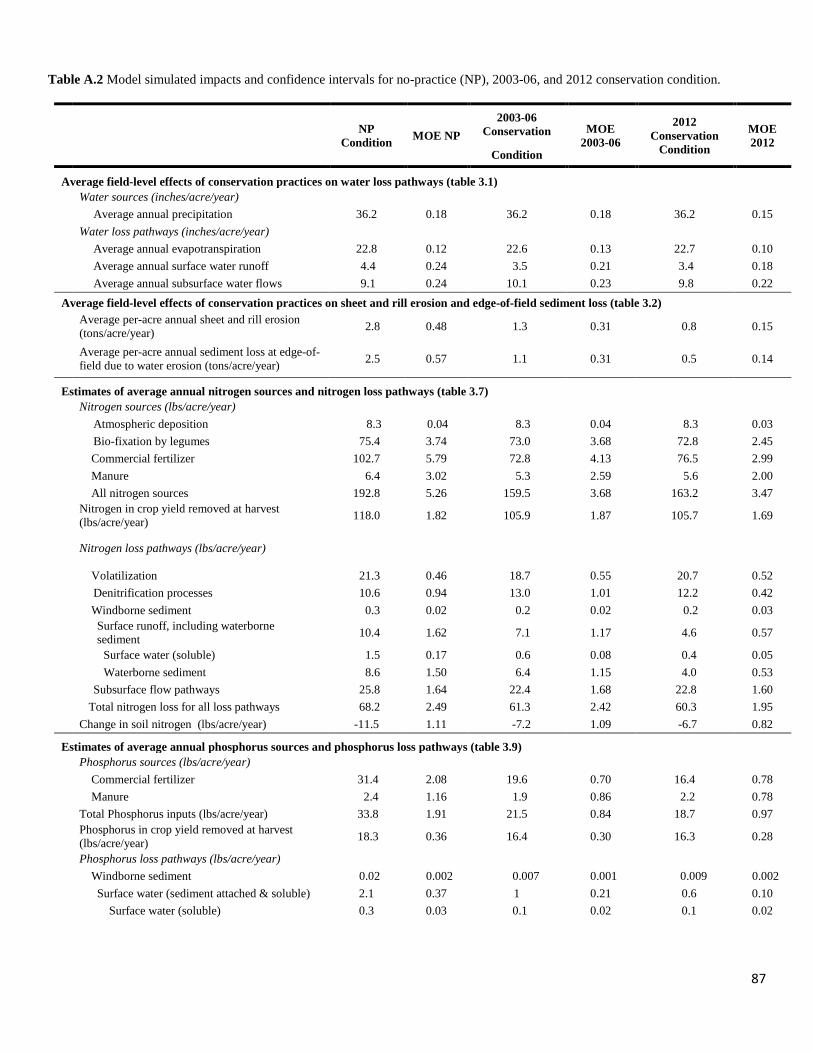
87
Table A.2 Model simulated impacts and confidence intervals for no-practice (NP), 2003-06, and 2012 conservation condition.
NP Condition MOE NP
2003-06 Conservation MOE
2003-06
2012 Conservation
Condition
MOE 2012
Condition
Average field-level effects of conservation practices on water loss pathways (table 3.1) Water sources (inches/acre/year) Average annual precipitation 36.2 0.18 36.2 0.18 36.2 0.15 Water loss pathways (inches/acre/year) Average annual evapotranspiration 22.8 0.12 22.6 0.13 22.7 0.10 Average annual surface water runoff 4.4 0.24 3.5 0.21 3.4 0.18 Average annual subsurface water flows 9.1 0.24 10.1 0.23 9.8 0.22 Average field-level effects of conservation practices on sheet and rill erosion and edge-of-field sediment loss (table 3.2)
Average per-acre annual sheet and rill erosion (tons/acre/year) 2.8 0.48 1.3 0.31 0.8 0.15
Average per-acre annual sediment loss at edge-of-field due to water erosion (tons/acre/year) 2.5 0.57 1.1 0.31 0.5 0.14
Estimates of average annual nitrogen sources and nitrogen loss pathways (table 3.7) Nitrogen sources (lbs/acre/year) Atmospheric deposition 8.3 0.04 8.3 0.04 8.3 0.03 Bio-fixation by legumes 75.4 3.74 73.0 3.68 72.8 2.45 Commercial fertilizer 102.7 5.79 72.8 4.13 76.5 2.99 Manure 6.4 3.02 5.3 2.59 5.6 2.00 All nitrogen sources 192.8 5.26 159.5 3.68 163.2 3.47
Nitrogen in crop yield removed at harvest (lbs/acre/year) 118.0 1.82 105.9 1.87 105.7 1.69
Nitrogen loss pathways (lbs/acre/year)
Volatilization 21.3 0.46 18.7 0.55 20.7 0.52 Denitrification processes 10.6 0.94 13.0 1.01 12.2 0.42 Windborne sediment 0.3 0.02 0.2 0.02 0.2 0.03
Surface runoff, including waterborne sediment 10.4 1.62 7.1 1.17 4.6 0.57
Surface water (soluble) 1.5 0.17 0.6 0.08 0.4 0.05 Waterborne sediment 8.6 1.50 6.4 1.15 4.0 0.53 Subsurface flow pathways 25.8 1.64 22.4 1.68 22.8 1.60 Total nitrogen loss for all loss pathways 68.2 2.49 61.3 2.42 60.3 1.95 Change in soil nitrogen (lbs/acre/year) -11.5 1.11 -7.2 1.09 -6.7 0.82
Estimates of average annual phosphorus sources and phosphorus loss pathways (table 3.9) Phosphorus sources (lbs/acre/year) Commercial fertilizer 31.4 2.08 19.6 0.70 16.4 0.78 Manure 2.4 1.16 1.9 0.86 2.2 0.78 Total Phosphorus inputs (lbs/acre/year) 33.8 1.91 21.5 0.84 18.7 0.97
Phosphorus in crop yield removed at harvest (lbs/acre/year) 18.3 0.36 16.4 0.30 16.3 0.28
Phosphorus loss pathways (lbs/acre/year) Windborne sediment 0.02 0.002 0.007 0.001 0.009 0.002 Surface water (sediment attached & soluble) 2.1 0.37 1 0.21 0.6 0.10 Surface water (soluble) 0.3 0.03 0.1 0.02 0.1 0.02
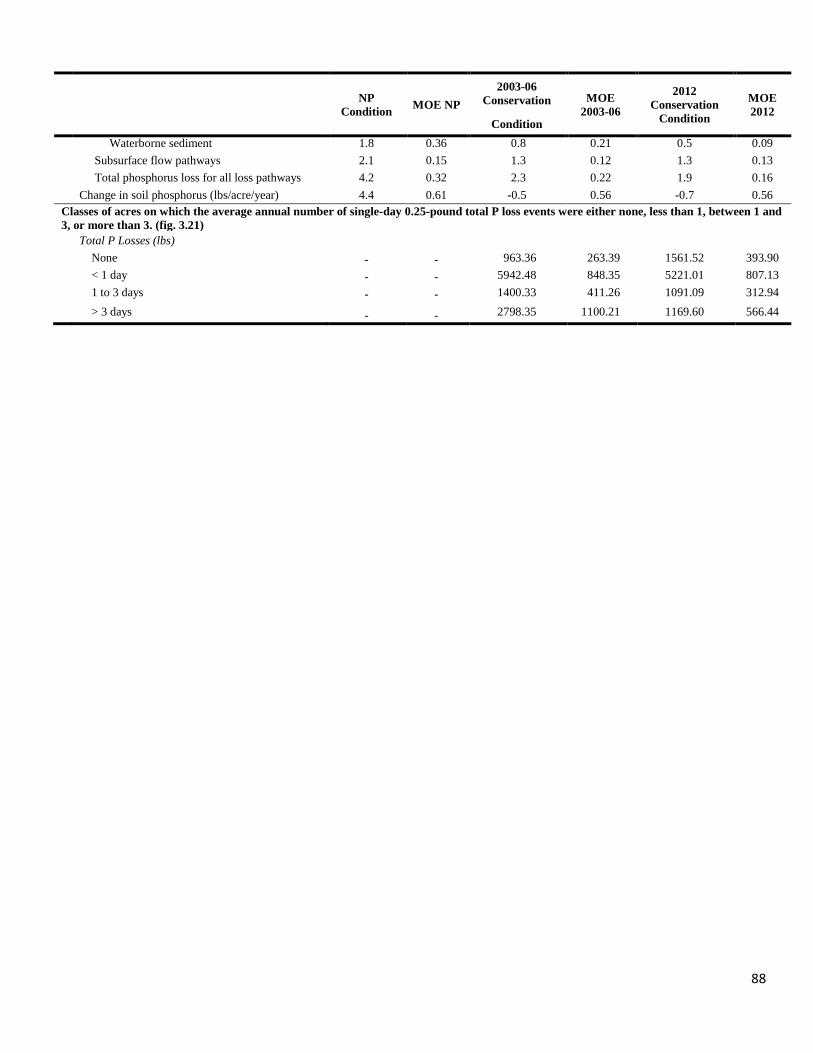
88
NP Condition MOE NP
2003-06 Conservation MOE
2003-06
2012 Conservation
Condition
MOE 2012
Condition
Waterborne sediment 1.8 0.36 0.8 0.21 0.5 0.09 Subsurface flow pathways 2.1 0.15 1.3 0.12 1.3 0.13 Total phosphorus loss for all loss pathways 4.2 0.32 2.3 0.22 1.9 0.16 Change in soil phosphorus (lbs/acre/year) 4.4 0.61 -0.5 0.56 -0.7 0.56 Classes of acres on which the average annual number of single-day 0.25-pound total P loss events were either none, less than 1, between 1 and 3, or more than 3. (fig. 3.21) Total P Losses (lbs) None - - 963.36 263.39 1561.52 393.90 < 1 day - - 5942.48 848.35 5221.01 807.13 1 to 3 days - - 1400.33 411.26 1091.09 312.94
> 3 days - - 2798.35 1100.21 1169.60 566.44
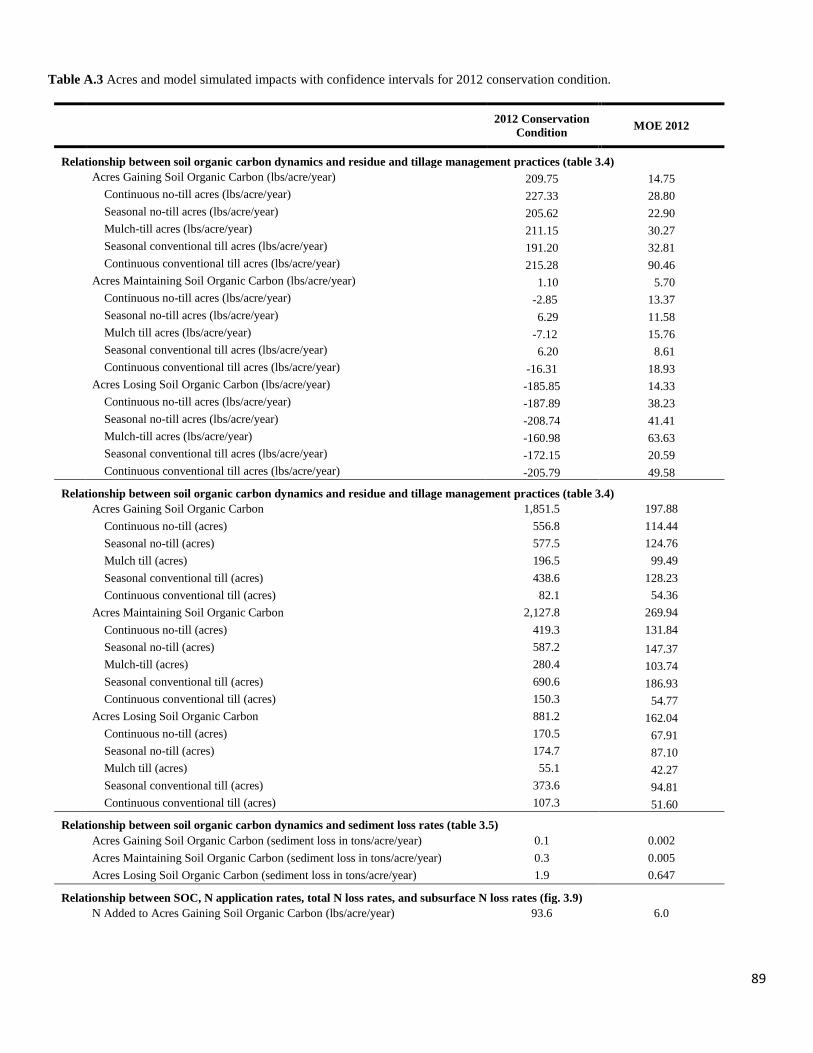
89
Table A.3 Acres and model simulated impacts with confidence intervals for 2012 conservation condition.
2012 Conservation
Condition MOE 2012
Relationship between soil organic carbon dynamics and residue and tillage management practices (table 3.4) Acres Gaining Soil Organic Carbon (lbs/acre/year) 209.75 14.75 Continuous no-till acres (lbs/acre/year) 227.33 28.80 Seasonal no-till acres (lbs/acre/year) 205.62 22.90 Mulch-till acres (lbs/acre/year) 211.15 30.27 Seasonal conventional till acres (lbs/acre/year) 191.20 32.81 Continuous conventional till acres (lbs/acre/year) 215.28 90.46 Acres Maintaining Soil Organic Carbon (lbs/acre/year) 1.10 5.70 Continuous no-till acres (lbs/acre/year) -2.85 13.37 Seasonal no-till acres (lbs/acre/year) 6.29 11.58 Mulch till acres (lbs/acre/year) -7.12 15.76 Seasonal conventional till acres (lbs/acre/year) 6.20 8.61 Continuous conventional till acres (lbs/acre/year) -16.31 18.93 Acres Losing Soil Organic Carbon (lbs/acre/year) -185.85 14.33 Continuous no-till acres (lbs/acre/year) -187.89 38.23 Seasonal no-till acres (lbs/acre/year) -208.74 41.41 Mulch-till acres (lbs/acre/year) -160.98 63.63 Seasonal conventional till acres (lbs/acre/year) -172.15 20.59 Continuous conventional till acres (lbs/acre/year) -205.79 49.58
Relationship between soil organic carbon dynamics and residue and tillage management practices (table 3.4) Acres Gaining Soil Organic Carbon 1,851.5 197.88 Continuous no-till (acres) 556.8 114.44 Seasonal no-till (acres) 577.5 124.76 Mulch till (acres) 196.5 99.49 Seasonal conventional till (acres) 438.6 128.23 Continuous conventional till (acres) 82.1 54.36 Acres Maintaining Soil Organic Carbon 2,127.8 269.94 Continuous no-till (acres) 419.3 131.84 Seasonal no-till (acres) 587.2 147.37 Mulch-till (acres) 280.4 103.74 Seasonal conventional till (acres) 690.6 186.93 Continuous conventional till (acres) 150.3 54.77 Acres Losing Soil Organic Carbon 881.2 162.04 Continuous no-till (acres) 170.5 67.91 Seasonal no-till (acres) 174.7 87.10 Mulch till (acres) 55.1 42.27 Seasonal conventional till (acres) 373.6 94.81 Continuous conventional till (acres) 107.3 51.60
Relationship between soil organic carbon dynamics and sediment loss rates (table 3.5) Acres Gaining Soil Organic Carbon (sediment loss in tons/acre/year) 0.1 0.002 Acres Maintaining Soil Organic Carbon (sediment loss in tons/acre/year) 0.3 0.005 Acres Losing Soil Organic Carbon (sediment loss in tons/acre/year) 1.9 0.647
Relationship between SOC, N application rates, total N loss rates, and subsurface N loss rates (fig. 3.9) N Added to Acres Gaining Soil Organic Carbon (lbs/acre/year) 93.6 6.0
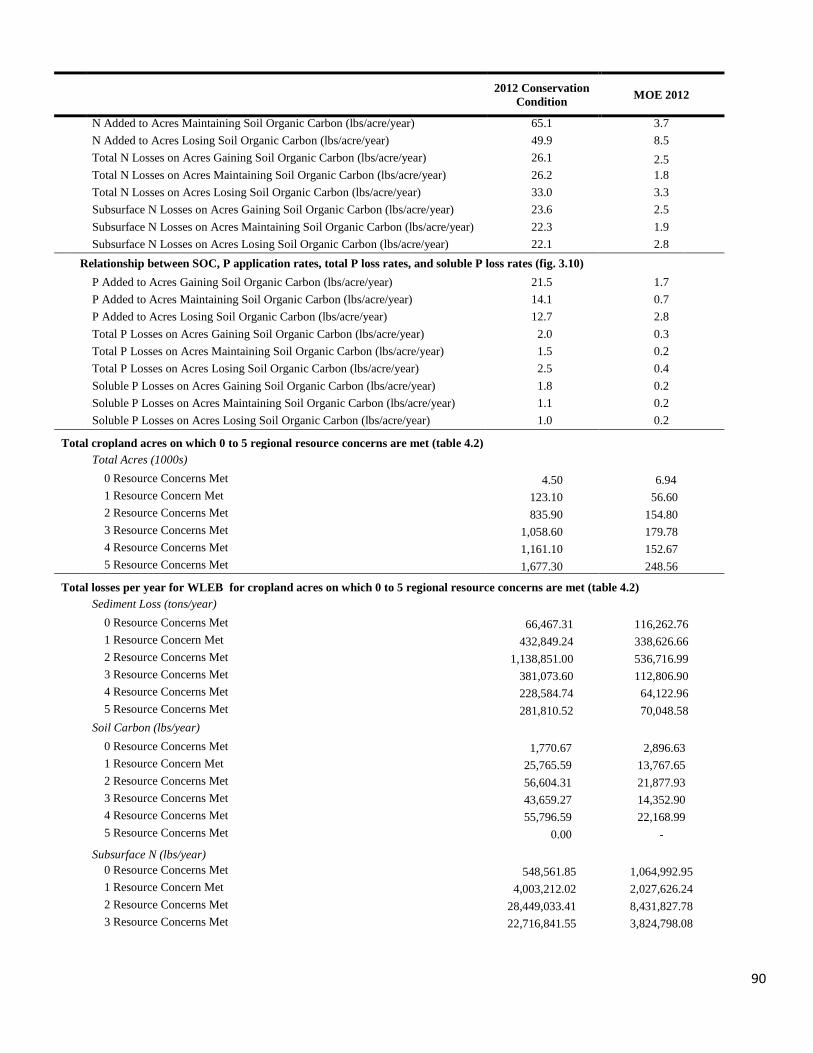
90
2012 Conservation
Condition MOE 2012 N Added to Acres Maintaining Soil Organic Carbon (lbs/acre/year) 65.1 3.7 N Added to Acres Losing Soil Organic Carbon (lbs/acre/year) 49.9 8.5 Total N Losses on Acres Gaining Soil Organic Carbon (lbs/acre/year) 26.1 2.5 Total N Losses on Acres Maintaining Soil Organic Carbon (lbs/acre/year) 26.2 1.8 Total N Losses on Acres Losing Soil Organic Carbon (lbs/acre/year) 33.0 3.3 Subsurface N Losses on Acres Gaining Soil Organic Carbon (lbs/acre/year) 23.6 2.5 Subsurface N Losses on Acres Maintaining Soil Organic Carbon (lbs/acre/year) 22.3 1.9 Subsurface N Losses on Acres Losing Soil Organic Carbon (lbs/acre/year) 22.1 2.8
Relationship between SOC, P application rates, total P loss rates, and soluble P loss rates (fig. 3.10)
P Added to Acres Gaining Soil Organic Carbon (lbs/acre/year) 21.5 1.7 P Added to Acres Maintaining Soil Organic Carbon (lbs/acre/year) 14.1 0.7 P Added to Acres Losing Soil Organic Carbon (lbs/acre/year) 12.7 2.8 Total P Losses on Acres Gaining Soil Organic Carbon (lbs/acre/year) 2.0 0.3 Total P Losses on Acres Maintaining Soil Organic Carbon (lbs/acre/year) 1.5 0.2 Total P Losses on Acres Losing Soil Organic Carbon (lbs/acre/year) 2.5 0.4 Soluble P Losses on Acres Gaining Soil Organic Carbon (lbs/acre/year) 1.8 0.2 Soluble P Losses on Acres Maintaining Soil Organic Carbon (lbs/acre/year) 1.1 0.2 Soluble P Losses on Acres Losing Soil Organic Carbon (lbs/acre/year) 1.0 0.2
Total cropland acres on which 0 to 5 regional resource concerns are met (table 4.2)
Total Acres (1000s)
0 Resource Concerns Met 4.50 6.94 1 Resource Concern Met 123.10 56.60 2 Resource Concerns Met 835.90 154.80 3 Resource Concerns Met 1,058.60 179.78 4 Resource Concerns Met 1,161.10 152.67 5 Resource Concerns Met 1,677.30 248.56
Total losses per year for WLEB for cropland acres on which 0 to 5 regional resource concerns are met (table 4.2) Sediment Loss (tons/year)
0 Resource Concerns Met 66,467.31 116,262.76 1 Resource Concern Met 432,849.24 338,626.66 2 Resource Concerns Met 1,138,851.00 536,716.99 3 Resource Concerns Met 381,073.60 112,806.90 4 Resource Concerns Met 228,584.74 64,122.96 5 Resource Concerns Met 281,810.52 70,048.58
Soil Carbon (lbs/year) 0 Resource Concerns Met 1,770.67 2,896.63 1 Resource Concern Met 25,765.59 13,767.65 2 Resource Concerns Met 56,604.31 21,877.93 3 Resource Concerns Met 43,659.27 14,352.90 4 Resource Concerns Met 55,796.59 22,168.99 5 Resource Concerns Met 0.00 -
Subsurface N (lbs/year) 0 Resource Concerns Met 548,561.85 1,064,992.95 1 Resource Concern Met 4,003,212.02 2,027,626.24 2 Resource Concerns Met 28,449,033.41 8,431,827.78 3 Resource Concerns Met 22,716,841.55 3,824,798.08
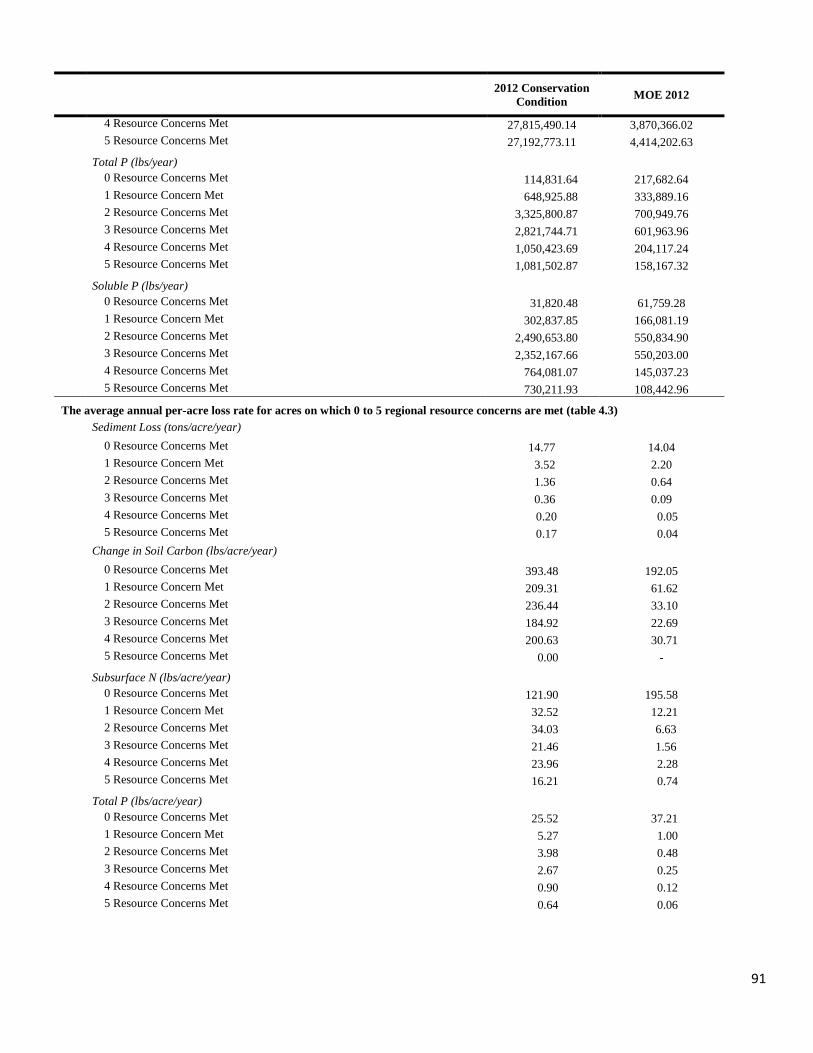
91
2012 Conservation
Condition MOE 2012 4 Resource Concerns Met 27,815,490.14 3,870,366.02 5 Resource Concerns Met 27,192,773.11 4,414,202.63
Total P (lbs/year) 0 Resource Concerns Met 114,831.64 217,682.64 1 Resource Concern Met 648,925.88 333,889.16 2 Resource Concerns Met 3,325,800.87 700,949.76 3 Resource Concerns Met 2,821,744.71 601,963.96 4 Resource Concerns Met 1,050,423.69 204,117.24 5 Resource Concerns Met 1,081,502.87 158,167.32
Soluble P (lbs/year) 0 Resource Concerns Met 31,820.48 61,759.28 1 Resource Concern Met 302,837.85 166,081.19 2 Resource Concerns Met 2,490,653.80 550,834.90 3 Resource Concerns Met 2,352,167.66 550,203.00 4 Resource Concerns Met 764,081.07 145,037.23 5 Resource Concerns Met 730,211.93 108,442.96
The average annual per-acre loss rate for acres on which 0 to 5 regional resource concerns are met (table 4.3) Sediment Loss (tons/acre/year)
0 Resource Concerns Met 14.77 14.04 1 Resource Concern Met 3.52 2.20 2 Resource Concerns Met 1.36 0.64 3 Resource Concerns Met 0.36 0.09 4 Resource Concerns Met 0.20 0.05 5 Resource Concerns Met 0.17 0.04
Change in Soil Carbon (lbs/acre/year) 0 Resource Concerns Met 393.48 192.05 1 Resource Concern Met 209.31 61.62 2 Resource Concerns Met 236.44 33.10 3 Resource Concerns Met 184.92 22.69 4 Resource Concerns Met 200.63 30.71 5 Resource Concerns Met 0.00 -
Subsurface N (lbs/acre/year) 0 Resource Concerns Met 121.90 195.58 1 Resource Concern Met 32.52 12.21 2 Resource Concerns Met 34.03 6.63 3 Resource Concerns Met 21.46 1.56 4 Resource Concerns Met 23.96 2.28 5 Resource Concerns Met 16.21 0.74
Total P (lbs/acre/year) 0 Resource Concerns Met 25.52 37.21 1 Resource Concern Met 5.27 1.00 2 Resource Concerns Met 3.98 0.48 3 Resource Concerns Met 2.67 0.25 4 Resource Concerns Met 0.90 0.12 5 Resource Concerns Met 0.64 0.06
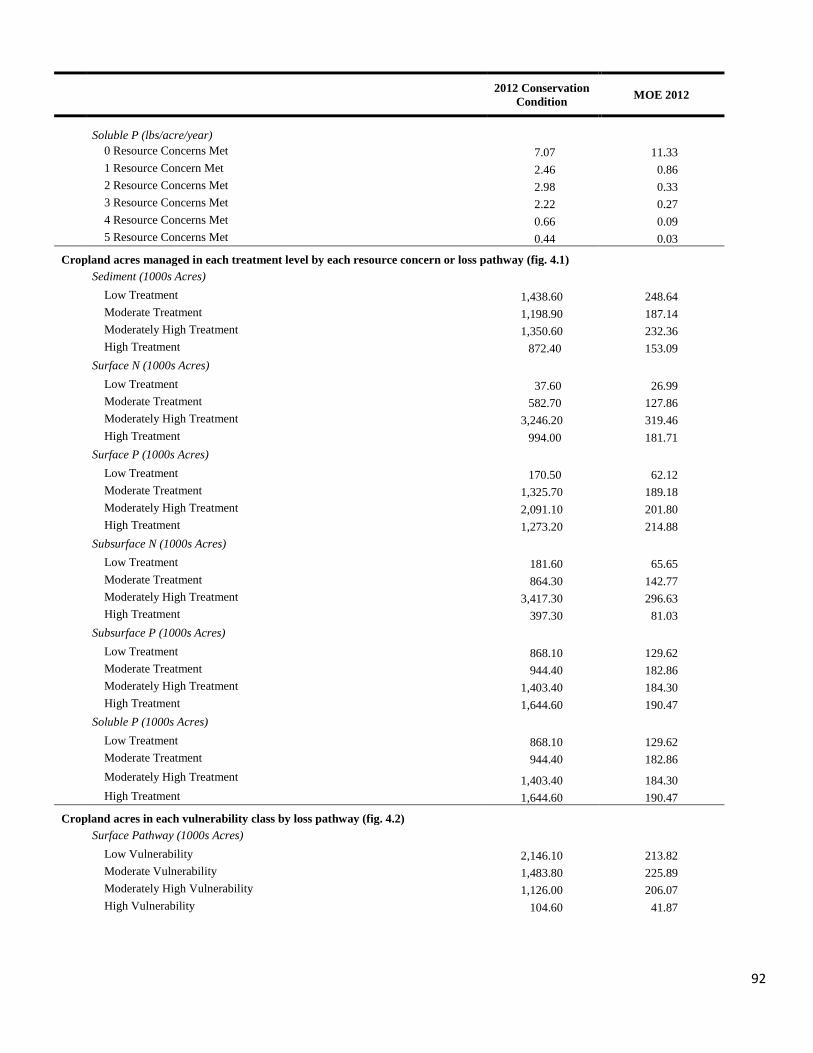
92
2012 Conservation
Condition MOE 2012
Soluble P (lbs/acre/year)
0 Resource Concerns Met 7.07 11.33 1 Resource Concern Met 2.46 0.86 2 Resource Concerns Met 2.98 0.33 3 Resource Concerns Met 2.22 0.27 4 Resource Concerns Met 0.66 0.09 5 Resource Concerns Met 0.44 0.03
Cropland acres managed in each treatment level by each resource concern or loss pathway (fig. 4.1) Sediment (1000s Acres) Low Treatment 1,438.60 248.64 Moderate Treatment 1,198.90 187.14 Moderately High Treatment 1,350.60 232.36 High Treatment 872.40 153.09
Surface N (1000s Acres) Low Treatment 37.60 26.99 Moderate Treatment 582.70 127.86 Moderately High Treatment 3,246.20 319.46 High Treatment 994.00 181.71
Surface P (1000s Acres) Low Treatment 170.50 62.12 Moderate Treatment 1,325.70 189.18 Moderately High Treatment 2,091.10 201.80 High Treatment 1,273.20 214.88
Subsurface N (1000s Acres) Low Treatment 181.60 65.65 Moderate Treatment 864.30 142.77 Moderately High Treatment 3,417.30 296.63 High Treatment 397.30 81.03
Subsurface P (1000s Acres) Low Treatment 868.10 129.62 Moderate Treatment 944.40 182.86 Moderately High Treatment 1,403.40 184.30 High Treatment 1,644.60 190.47
Soluble P (1000s Acres) Low Treatment 868.10 129.62 Moderate Treatment 944.40 182.86
Moderately High Treatment 1,403.40 184.30 High Treatment 1,644.60 190.47
Cropland acres in each vulnerability class by loss pathway (fig. 4.2) Surface Pathway (1000s Acres) Low Vulnerability 2,146.10 213.82 Moderate Vulnerability 1,483.80 225.89 Moderately High Vulnerability 1,126.00 206.07 High Vulnerability 104.60 41.87
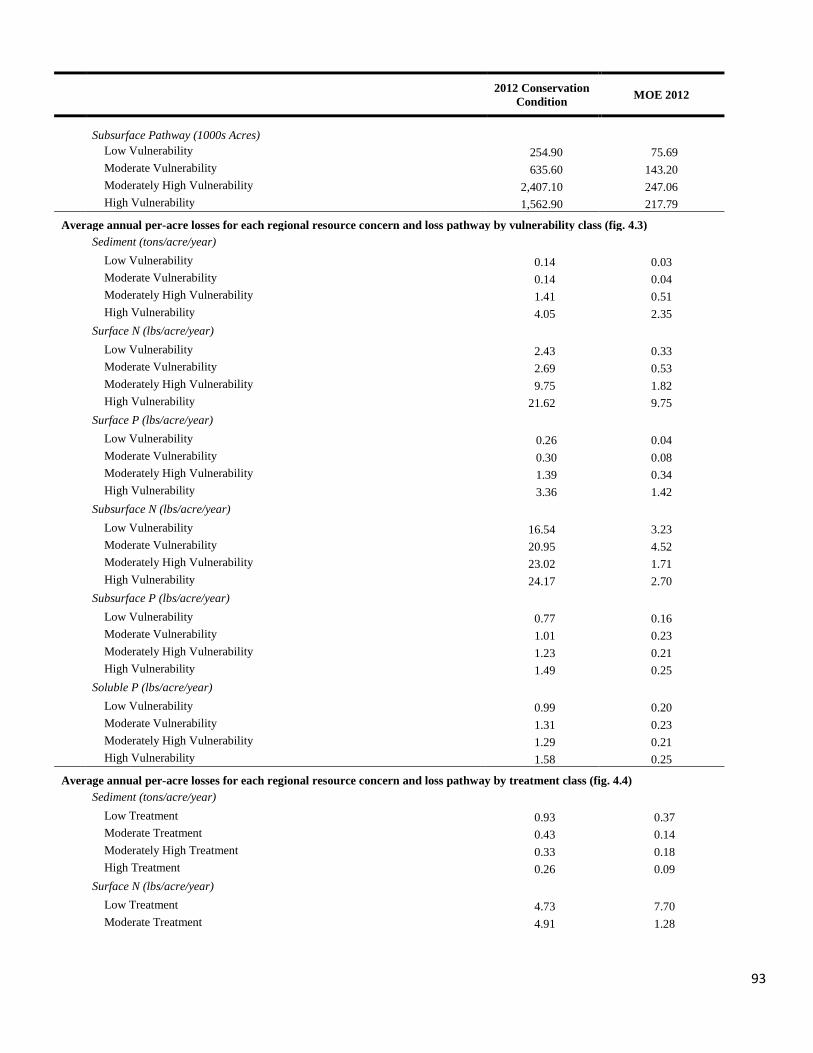
93
2012 Conservation
Condition MOE 2012
Subsurface Pathway (1000s Acres)
Low Vulnerability 254.90 75.69 Moderate Vulnerability 635.60 143.20 Moderately High Vulnerability 2,407.10 247.06 High Vulnerability 1,562.90 217.79
Average annual per-acre losses for each regional resource concern and loss pathway by vulnerability class (fig. 4.3) Sediment (tons/acre/year) Low Vulnerability 0.14 0.03 Moderate Vulnerability 0.14 0.04 Moderately High Vulnerability 1.41 0.51 High Vulnerability 4.05 2.35
Surface N (lbs/acre/year) Low Vulnerability 2.43 0.33 Moderate Vulnerability 2.69 0.53 Moderately High Vulnerability 9.75 1.82 High Vulnerability 21.62 9.75
Surface P (lbs/acre/year) Low Vulnerability 0.26 0.04 Moderate Vulnerability 0.30 0.08 Moderately High Vulnerability 1.39 0.34 High Vulnerability 3.36 1.42
Subsurface N (lbs/acre/year) Low Vulnerability 16.54 3.23 Moderate Vulnerability 20.95 4.52 Moderately High Vulnerability 23.02 1.71 High Vulnerability 24.17 2.70
Subsurface P (lbs/acre/year) Low Vulnerability 0.77 0.16 Moderate Vulnerability 1.01 0.23 Moderately High Vulnerability 1.23 0.21 High Vulnerability 1.49 0.25
Soluble P (lbs/acre/year) Low Vulnerability 0.99 0.20 Moderate Vulnerability 1.31 0.23 Moderately High Vulnerability 1.29 0.21 High Vulnerability 1.58 0.25
Average annual per-acre losses for each regional resource concern and loss pathway by treatment class (fig. 4.4) Sediment (tons/acre/year) Low Treatment 0.93 0.37 Moderate Treatment 0.43 0.14 Moderately High Treatment 0.33 0.18 High Treatment 0.26 0.09
Surface N (lbs/acre/year) Low Treatment 4.73 7.70 Moderate Treatment 4.91 1.28

94
2012 Conservation
Condition MOE 2012 Moderately High Treatment 4.90 0.70 High Treatment 3.53 0.57
Surface P (lbs/acre/year) Low Treatment 1.05 1.15 Moderate Treatment 0.73 0.15 Moderately High Treatment 0.64 0.14 High Treatment 0.34 0.07
Subsurface N (lbs/acre/year) Low Treatment 42.05 11.07 Moderate Treatment 28.88 3.63 Moderately High Treatment 21.09 1.29 High Treatment 15.26 1.74
Subsurface P (lbs/acre/year) Low Treatment 3.11 0.40 Moderate Treatment 1.64 0.33 Moderately High Treatment 0.80 0.11 High Treatment 0.46 0.06
Soluble P (lbs/acre/year) Low Treatment 3.38 0.43 Moderate Treatment 1.78 0.33 Moderately High Treatment 0.88 0.12 High Treatment 0.50 0.06
Total losses per year for WLEB for each regional resource concern and loss pathway by vulnerability class (fig. 4.5) Sediment (tons/year) Low Vulnerability 301,308.94 74,098.38 Moderate Vulnerability 213,298.81 75,431.94 Moderately High Vulnerability 1,591,213.31 578,039.45 High Vulnerability 423,815.37 198,861.96
Surface N (lbs/year) Low Vulnerability 5,215,191.43 865,530.94 Moderate Vulnerability 3,987,934.04 992,941.62 Moderately High Vulnerability 10,980,168.43 2,649,019.96 High Vulnerability 2,261,707.35 893,887.52
Surface P (lbs/year) Low Vulnerability 560,404.10 101,315.13 Moderate Vulnerability 441,708.47 136,402.14 Moderately High Vulnerability 1,560,227.14 428,424.51 High Vulnerability 350,965.67 134,662.06
Subsurface N (lbs/year) Low Vulnerability 4,216,646.23 1,686,698.95 Moderate Vulnerability 13,316,528.53 3,048,919.72 Moderately High Vulnerability 55,411,229.23 6,875,193.57 High Vulnerability 37,781,508.10 6,289,828.84
Subsurface P (lbs/year) Low Vulnerability 196,530.16 58,765.13
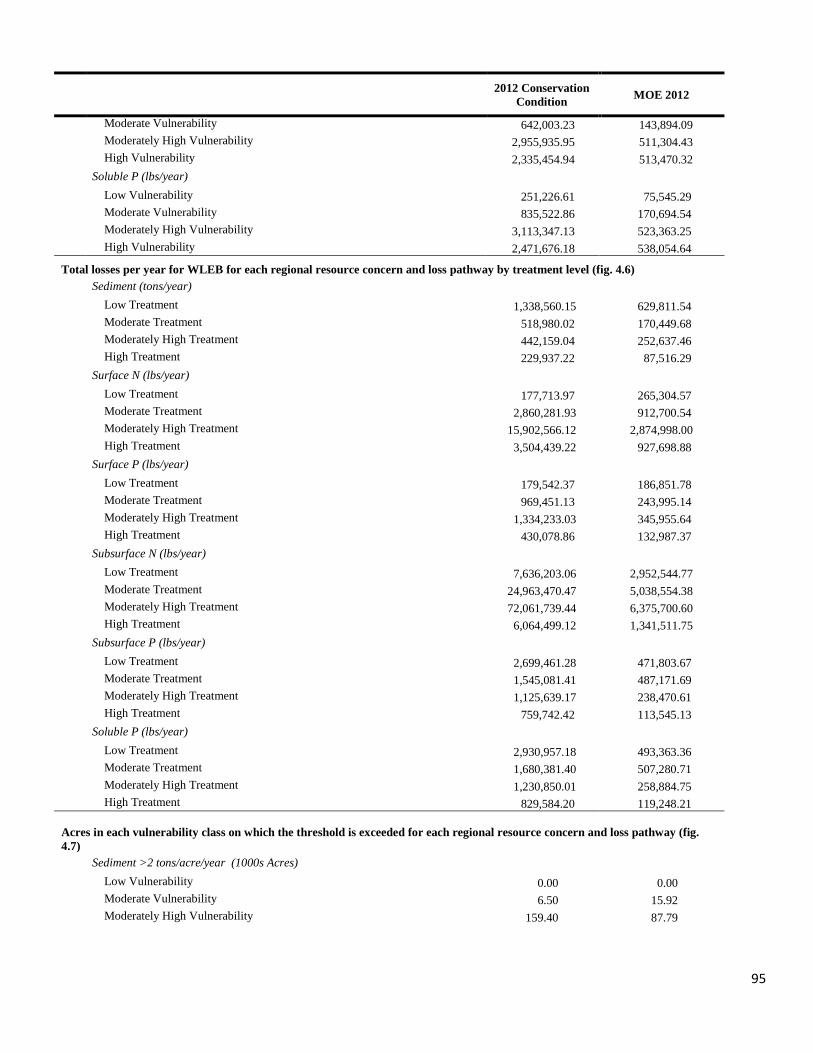
95
2012 Conservation
Condition MOE 2012 Moderate Vulnerability 642,003.23 143,894.09 Moderately High Vulnerability 2,955,935.95 511,304.43 High Vulnerability 2,335,454.94 513,470.32
Soluble P (lbs/year) Low Vulnerability 251,226.61 75,545.29 Moderate Vulnerability 835,522.86 170,694.54 Moderately High Vulnerability 3,113,347.13 523,363.25 High Vulnerability 2,471,676.18 538,054.64
Total losses per year for WLEB for each regional resource concern and loss pathway by treatment level (fig. 4.6) Sediment (tons/year) Low Treatment 1,338,560.15 629,811.54 Moderate Treatment 518,980.02 170,449.68 Moderately High Treatment 442,159.04 252,637.46 High Treatment 229,937.22 87,516.29
Surface N (lbs/year) Low Treatment 177,713.97 265,304.57 Moderate Treatment 2,860,281.93 912,700.54 Moderately High Treatment 15,902,566.12 2,874,998.00 High Treatment 3,504,439.22 927,698.88
Surface P (lbs/year) Low Treatment 179,542.37 186,851.78 Moderate Treatment 969,451.13 243,995.14 Moderately High Treatment 1,334,233.03 345,955.64 High Treatment 430,078.86 132,987.37
Subsurface N (lbs/year) Low Treatment 7,636,203.06 2,952,544.77 Moderate Treatment 24,963,470.47 5,038,554.38 Moderately High Treatment 72,061,739.44 6,375,700.60 High Treatment 6,064,499.12 1,341,511.75
Subsurface P (lbs/year) Low Treatment 2,699,461.28 471,803.67 Moderate Treatment 1,545,081.41 487,171.69 Moderately High Treatment 1,125,639.17 238,470.61 High Treatment 759,742.42 113,545.13
Soluble P (lbs/year) Low Treatment 2,930,957.18 493,363.36 Moderate Treatment 1,680,381.40 507,280.71 Moderately High Treatment 1,230,850.01 258,884.75 High Treatment 829,584.20 119,248.21
Acres in each vulnerability class on which the threshold is exceeded for each regional resource concern and loss pathway (fig. 4.7) Sediment >2 tons/acre/year (1000s Acres) Low Vulnerability 0.00 0.00 Moderate Vulnerability 6.50 15.92 Moderately High Vulnerability 159.40 87.79
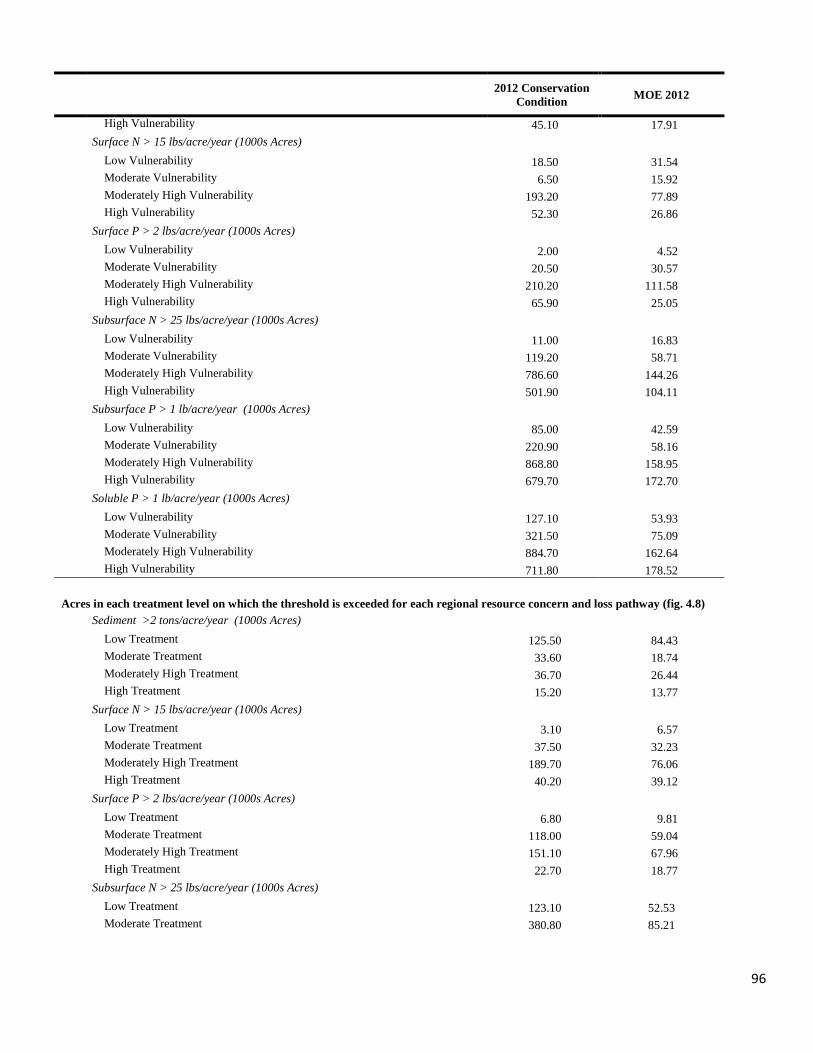
96
2012 Conservation
Condition MOE 2012 High Vulnerability 45.10 17.91
Surface N > 15 lbs/acre/year (1000s Acres) Low Vulnerability 18.50 31.54 Moderate Vulnerability 6.50 15.92 Moderately High Vulnerability 193.20 77.89 High Vulnerability 52.30 26.86
Surface P > 2 lbs/acre/year (1000s Acres) Low Vulnerability 2.00 4.52 Moderate Vulnerability 20.50 30.57 Moderately High Vulnerability 210.20 111.58 High Vulnerability 65.90 25.05
Subsurface N > 25 lbs/acre/year (1000s Acres) Low Vulnerability 11.00 16.83 Moderate Vulnerability 119.20 58.71 Moderately High Vulnerability 786.60 144.26 High Vulnerability 501.90 104.11
Subsurface P > 1 lb/acre/year (1000s Acres) Low Vulnerability 85.00 42.59 Moderate Vulnerability 220.90 58.16 Moderately High Vulnerability 868.80 158.95 High Vulnerability 679.70 172.70
Soluble P > 1 lb/acre/year (1000s Acres) Low Vulnerability 127.10 53.93 Moderate Vulnerability 321.50 75.09 Moderately High Vulnerability 884.70 162.64 High Vulnerability 711.80 178.52
Acres in each treatment level on which the threshold is exceeded for each regional resource concern and loss pathway (fig. 4.8) Sediment >2 tons/acre/year (1000s Acres) Low Treatment 125.50 84.43 Moderate Treatment 33.60 18.74 Moderately High Treatment 36.70 26.44 High Treatment 15.20 13.77
Surface N > 15 lbs/acre/year (1000s Acres) Low Treatment 3.10 6.57 Moderate Treatment 37.50 32.23 Moderately High Treatment 189.70 76.06 High Treatment 40.20 39.12
Surface P > 2 lbs/acre/year (1000s Acres) Low Treatment 6.80 9.81 Moderate Treatment 118.00 59.04 Moderately High Treatment 151.10 67.96 High Treatment 22.70 18.77
Subsurface N > 25 lbs/acre/year (1000s Acres) Low Treatment 123.10 52.53 Moderate Treatment 380.80 85.21
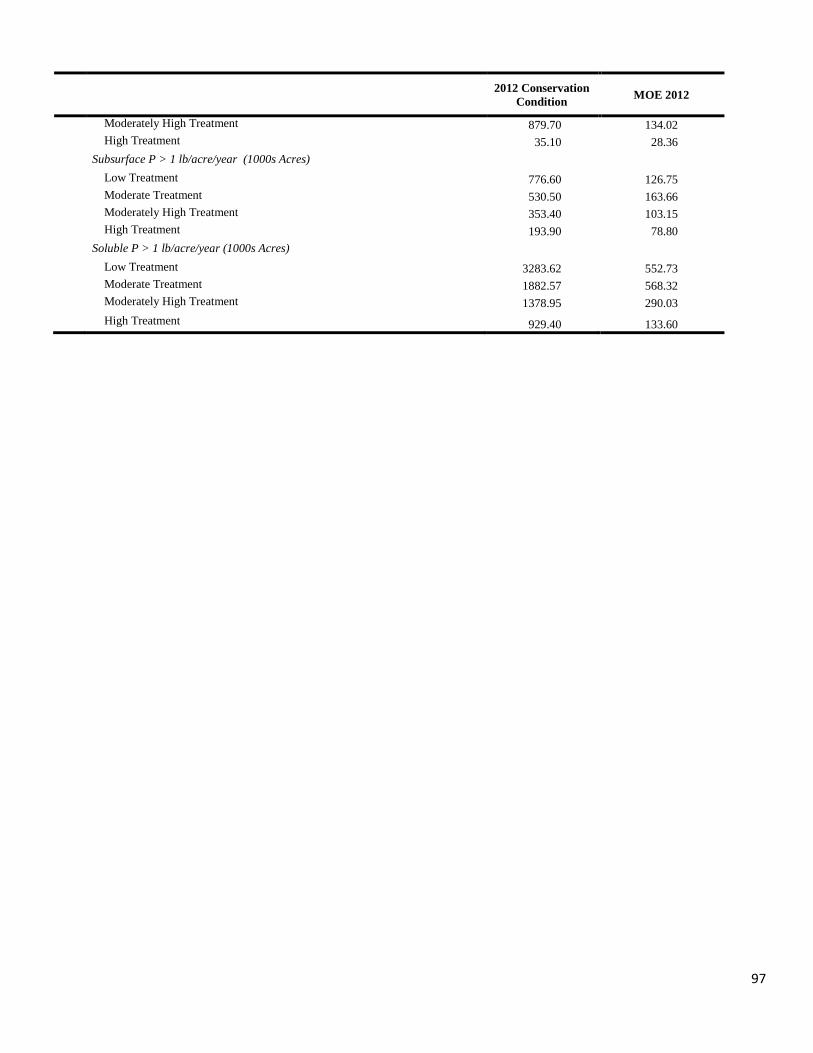
97
2012 Conservation
Condition MOE 2012 Moderately High Treatment 879.70 134.02 High Treatment 35.10 28.36
Subsurface P > 1 lb/acre/year (1000s Acres) Low Treatment 776.60 126.75 Moderate Treatment 530.50 163.66 Moderately High Treatment 353.40 103.15 High Treatment 193.90 78.80
Soluble P > 1 lb/acre/year (1000s Acres) Low Treatment 3283.62 552.73 Moderate Treatment 1882.57 568.32 Moderately High Treatment 1378.95 290.03
High Treatment 929.40 133.60
98
APPENDIX B The No-Practice Scenario Simulating the No-Practice Scenario The purpose of the no-practice scenario is to provide an estimate of sediment, nutrient, and pesticide loss from farm fields under conditions without the use of conservation practices. The benefits of conservation practices in use within the region were estimated by contrasting model output from the no-practice scenario to model output from the baseline conservation condition (2003–06). The only difference between the no-practice scenario and the baseline conservation condition is that the conservation practices are removed or their effects are reversed in the no-practice scenario simulations. There were usually several alternatives that could be used to represent “no practices.” The no-practice representations derived for use in this study conformed to the following guidelines. • Consistency: It is impossible to determine what an
individual farmer would be doing if he or she had not adopted certain practices, so it is important to represent all practices on all sample points in a consistent manner that is based on the intended purpose of each practice.
• Simplicity: Complex rules for assigning “no-practice”
activities lead to complex explanations that are difficult to substantiate and sometimes difficult to explain and accept. Complexity would not only complicate the modeling process but also hamper the interpretation of results.
• Historical context avoided: The no-practice scenario is a
technological step backward for conservation, not a chronological step back to a prior era when conservation practices were not used. Although the advent of certain conservation technologies can be dated, the adoption of technology is gradual, regionally diverse, and ongoing. It is also important to retain the overall crop mix in the region, as it in part reflects today’s market forces. Therefore, moving the clock back to the 1950s (or any other time period) for agriculture is not the goal of the no-practice scenario. Taking away the conservation ethic is the goal.
• Moderation: The no-practice scenario should provide a
reasonable level of “poor” conservation so that a believable benefit can be determined, where warranted, but not so severe as to generate exaggerated conservation gains by simulating the worst-case condition. Tremendous benefits could be generated if, for example, nutrients were applied at twice the recommended rates with poor timing or application methods in the no-practice simulation. Similarly, large erosion benefits could be calculated if the no-practice representation for tillage was fall plowing with moldboard plows and heavy disking, which was once common but today would generally be considered economically inefficient.
• Maintenance of crop yield or efficacy. It is impossible
to avoid small changes in crop yields, but care was taken
to avoid no-practice representations that would significantly change crop yields and regional production capabilities. The same guideline was followed for pest control—the suite of pesticides used was not adjusted in the no-practice scenario because of the likelihood that alternative pesticides would not be as effective and would result in lower yields under actual conditions.
A deliberate effort was made to adhere to these guidelines to the same degree for all conservation practices so that the overall level of representation would be equally moderate for all practices. Table B.1 summarizes the adjustments to conservation practices used in simulation of the no-practice scenario. No-practice representation of structural practices The no-practice field condition for structural practices is simply the removal of the structural practices from the modeling process. In addition, the soil condition is change from Good” to “Poor” for the determination of the runoff curve number for erosion prediction. Overland flow. This group includes such practices as terraces and contouring which slow the flow of water across the field. For the practices affecting overland flow of water and therefore the P factor of the USLE-based equations, the P factor was increased to 1. Slope length is also changed for practices such as terraces to reflect the absence of these slope-interrupting practices. Concentrated flow. This group of practices is designed to address channelized flow and includes grassed waterways and grade stabilization structures. These practices are designed to prevent areas of concentrated flow from developing gullies or to stabilize gullies that have developed. The no-practice protocol for these practices removes the structure or waterway and replaces it with a “ditch” as a separate subarea. This ditch, or channel, represents a gully; however, the only sediment contributions from the gully will come from downcutting. Headcutting and sloughing of the sides are not simulated in APEX. Edge of field. These practices include buffers, filters, and other practices that occur outside the primary production area and act to mitigate the losses from the field. The no-practice protocol removes these areas and their management. When the practices are removed, the slope length is also restored to the undisturbed length that it would be if the practices were not in place. (When simulating a buffer in APEX, the slope length reported in the NRI is adjusted.)
Wind control. Practices such as windbreaks or shelterbelts, cross wind ridges, stripcropping or trap strips, and hedgerows are examples of practices used for wind control. The unsheltered distance reflects the dimensions of the field as modeled, 400 meters or 1,312 feet. Any practices reducing the unsheltered distance are removed and the unsheltered distance set to 400 meters.
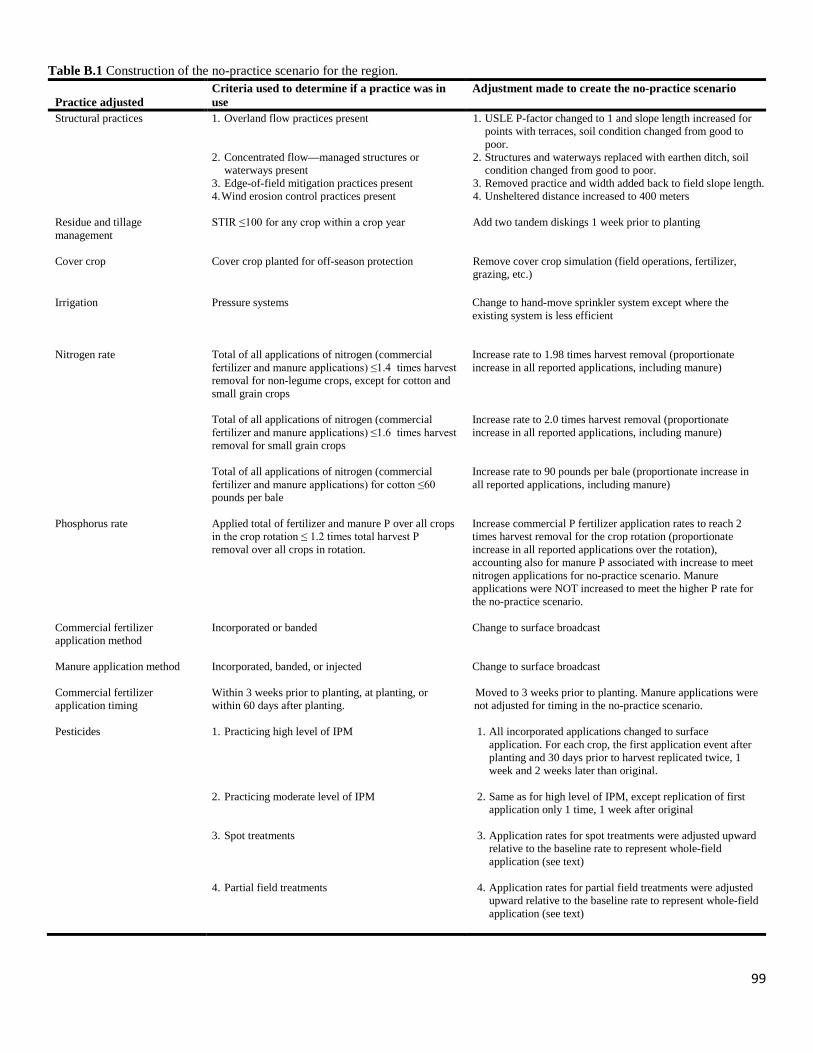
99
Table B.1 Construction of the no-practice scenario for the region. Practice adjusted
Criteria used to determine if a practice was in use
Adjustment made to create the no-practice scenario
Structural practices 1. Overland flow practices present 2. Concentrated flow—managed structures or
waterways present 3. Edge-of-field mitigation practices present 4. Wind erosion control practices present
1. USLE P-factor changed to 1 and slope length increased for points with terraces, soil condition changed from good to poor.
2. Structures and waterways replaced with earthen ditch, soil condition changed from good to poor.
3. Removed practice and width added back to field slope length. 4. Unsheltered distance increased to 400 meters
Residue and tillage management
STIR ≤100 for any crop within a crop year
Add two tandem diskings 1 week prior to planting
Cover crop
Cover crop planted for off-season protection Remove cover crop simulation (field operations, fertilizer, grazing, etc.)
Irrigation Pressure systems
Change to hand-move sprinkler system except where the existing system is less efficient
Nitrogen rate
Total of all applications of nitrogen (commercial fertilizer and manure applications) ≤1.4 times harvest removal for non-legume crops, except for cotton and small grain crops Total of all applications of nitrogen (commercial fertilizer and manure applications) ≤1.6 times harvest removal for small grain crops Total of all applications of nitrogen (commercial fertilizer and manure applications) for cotton ≤60 pounds per bale
Increase rate to 1.98 times harvest removal (proportionate increase in all reported applications, including manure) Increase rate to 2.0 times harvest removal (proportionate increase in all reported applications, including manure) Increase rate to 90 pounds per bale (proportionate increase in all reported applications, including manure)
Phosphorus rate Applied total of fertilizer and manure P over all crops in the crop rotation ≤ 1.2 times total harvest P removal over all crops in rotation.
Increase commercial P fertilizer application rates to reach 2 times harvest removal for the crop rotation (proportionate increase in all reported applications over the rotation), accounting also for manure P associated with increase to meet nitrogen applications for no-practice scenario. Manure applications were NOT increased to meet the higher P rate for the no-practice scenario.
Commercial fertilizer application method
Incorporated or banded
Change to surface broadcast
Manure application method Incorporated, banded, or injected
Change to surface broadcast
Commercial fertilizer application timing
Within 3 weeks prior to planting, at planting, or within 60 days after planting.
Moved to 3 weeks prior to planting. Manure applications were not adjusted for timing in the no-practice scenario.
Pesticides
1. Practicing high level of IPM 2. Practicing moderate level of IPM 3. Spot treatments 4. Partial field treatments
1. All incorporated applications changed to surface application. For each crop, the first application event after planting and 30 days prior to harvest replicated twice, 1 week and 2 weeks later than original.
2. Same as for high level of IPM, except replication of first
application only 1 time, 1 week after original
3. Application rates for spot treatments were adjusted upward relative to the baseline rate to represent whole-field application (see text)
4. Application rates for partial field treatments were adjusted
upward relative to the baseline rate to represent whole-field application (see text)
100
No-practice representation of conservation tillage The no-practice tillage protocols are designed to remove the benefits of conservation tillage. For all crops grown with some kind of reduced tillage, including cover crops, the no-practice scenario simulates conventional tillage, based on the STIR (Soil Tillage Intensity Rating) value. Conventional tillage for the purpose of estimating conservation benefits is defined as any crop grown with a STIR value above 80. (To put this in context, no-till or direct seed systems have a STIR of less than 20, and that value is part of the technical standard for Residue Management, No-Till/Strip Till/Direct Seed [NRCS Practice Standard 329]). Those crops grown with a STIR value of less than 80 in the baseline conservation condition had tillage operations added in the no-practice scenario. Simulating conventional tillage for crops with a STIR value of less than 80 requires the introduction of additional tillage operations in the field operations schedule. For the no-practice scenario, two consecutive tandem disk operations were added prior to planting. In addition to adding tillage, the hydrologic condition for assignment of the runoff curve number was changed from good to poor on all points receiving additional tillage. Points that are conventionally tilled for all crops in the baseline condition scenario are also modeled with a “poor“ hydrologic condition curve number. The most common type of tillage operation in the survey was disking, and the most common disk used was a tandem disk for nearly all crops, in all parts of the region, and for both dryland and irrigated agriculture. The tandem disk has a STIR value of 39 for a single use. Two consecutive disking operations will add 78 to the existing tillage intensity, which allows for more than 90 percent of the crops to exceed a STIR of 80 and yet maintain the unique suite and timing of operations for each crop in the rotation. These additional two tillage operations were inserted in the simulation one week prior to planting, one of the least vulnerable times for tillage operations because it is close to the time when vegetation will begin to provide cover and protection. No-practice representation of cover crops The no-practice protocol for this practice removes the planting of the crop and all associated management practices such as tillage and fertilization. In a few cases the cover crops were grazed; when the cover crops were removed so were the grazing operations. No-practice representation of irrigation practices The no-practice irrigation protocols were designed to remove the benefits of better water management and the increased efficiencies of modern irrigation systems. Irrigation efficiencies are represented in APEX by a combination of three coefficients that recognize water losses from the water source to the field, evaporation losses with sprinkler systems, percolation losses below the root-zone during irrigation, and runoff at the lower end of the field. These coefficients are
combined to form an overall system efficiency that varies with soil type and land slope. The quantity of water applied for all scenarios was simulated in APEX using an “auto-irrigation” procedure that applied irrigation water when the degree of plant stress exceeded a threshold. “Auto-irrigation” amounts were determined within pre-set single event minimums and maximums, and an annual maximum irrigation amount. APEX also used a pre-determined minimum number of days before another irrigation event regardless of plant stress. In the no-practice representation, all conservation practices, such as Irrigation Water Management and Irrigation Land Leveling, were removed and samples with pressurized systems, such as center pivot, side roll, and low flow (drip), were changed to “hand move sprinklers,” which represents an early form of pressure system. The “Big Gun” systems, which comprise 9.1 percent of the irrigated acres, are by and large already less efficient than the “hand move sprinklers,” and most were not converted. However, 1.3 percent of the irrigated acres served by “Big Gun” systems are more efficient than the “hand move sprinklers,” and these were converted in the no-practice representation. “Open discharge” gravity systems are used on approximately 5,300 acres or 2.5 percent of the irrigated area. The no-practice representation of gravity systems would use a ditch system with portals which is more efficient than the open discharge configuration, so these also were not converted. For the no-practice scenario, the percentage of irrigated acreage with hand-move lines with impact sprinkler heads was increased to 89.7 percent (from 43.9 percent in the baseline conservation condition); 7.8 percent retained the Big Gun systems that were in use, and 2.5 percent were simulated with open discharge flood irrigation. No-practice representation of nutrient management practices The no-practice nutrient management protocols are designed to remove the benefits of proper nutrient management techniques. The NRCS Nutrient Management standard (590) allows a variety of methods to reduce nutrient losses while supplying a sufficient amount of nutrient to meet realistic yield goals. The standard addresses nutrient loss in one of two primary ways: (1) by altering rates, form, timing, and methods of application, or (2) by installing buffers, filters, or erosion or runoff control practices to reduce mechanisms of loss. The latter method is covered by the structural practices protocols for the no-practice scenario. The goals of the nutrient management no-practice protocols are to alter three of the four basic aspects of nutrient application—rate, timing, and method. The form of application was not addressed because of the inability to determine if proper form was being applied.
101
Nitrogen rate. For the no-practice scenario, the amount of commercial nitrogen fertilizer applied was— • increased to 1.98 times harvest removal for non-legume
crops receiving less than or equal to 1.40 times the amount of nitrogen removed at harvest in the baseline scenario, except for cotton and small grain crops;
• increased to 2.0 times harvest removal for small grain crops receiving less than or equal to 1.60 times the amount of nitrogen removed at harvest in the baseline scenario; and
• increased to 90 pounds per bale for cotton crops receiving less than 60 pounds of nitrogen per bale in the baseline scenario.
The ratio of 1.98 for the increased nitrogen rate was determined by the average rate-to-yield-removal ratio for crops exceeding the application-removal ratio of 1.4. Where nitrogen was applied in multiple applications, each application was increased proportionately. For sites receiving manure, the threshold for identifying good management was the total nitrogen application rate, both manure and fertilizer, and both fertilizer and manure were increased proportionately to reach the no-practice scenario rate. The assessment for using appropriate nitrogen application rates was made on an average annual basis for each crop in the rotation using average annual model output on nitrogen removed with the yield at harvest in the baseline conservation condition scenario. Phosphorus rate. The threshold for identifying proper phosphorus application rates was 1.2 times the amount of phosphorus taken up by all the crops in rotation and removed at harvest. The lower threshold for phosphorus was used because phosphorus is not lost through volatilization to the atmosphere and much less is lost through other pathways owing to strong bonding of phosphorus to soil particles. For the no-practice scenario, the amount of commercial phosphorus fertilizer applied was increased to 2 times the harvest removal rate. For crops receiving manure, any increase in phosphorus from manure added to meet the nitrogen criteria for no-practice was taken into account in setting the no-practice application rate. However, no adjustment was made to manure applied at rates below the P threshold because the appropriate manure rate was based on the nitrogen level in the manure. The ratio of 2 for the increased phosphorus rate was determined by the average rate-to-yield-removal ratio for crops with phosphorus applications exceeding 1.2 times the amount of phosphorus taken up by all the crops in rotation and removed at harvest. Multiple commercial phosphorus fertilizer applications were increased proportionately to meet the threshold. Timing of application. Nutrients applied closest to the time when a plant needs them are the most efficiently utilized and least likely to be lost to the surrounding environment. All commercial fertilizer applications occurring within 3 weeks prior to planting, at planting, or within 60 days after planting
7 The APEX model can simulate pesticide applications, but it does not currently include a pest population model that would allow simulation of the effectiveness of pest management practices. Thus, the relative effectiveness of
were moved back to 3 weeks prior to planting for the no-practice scenario. For example, split applications that occur within 60 days after planting are moved to a single application 3 weeks before planting. Timing of manure applications was not adjusted in the no-practice scenario. Method of application. Nutrient applications, including manure applications, which were incorporated or banded were changed to a surface broadcast application method. No-practice representation of pesticide management practices Pesticide management for conservation purposes is a combination of three types of interrelated management activities: 1. A mix of soil erosion control practices that retain
pesticide residues within the field boundaries. 2. Pesticide use and application practices that minimize the
risk that pesticide residues pose to the surrounding environment.
3. Practice of Integrated Pest Management (IPM), including partial field applications and spot treatment.
The first activity is covered by the no-practice representation of structural practices and residue and tillage management. The second activity, for the most part, cannot be simulated in large-scale regional modeling because of the difficulty in assuring that any changes in the types of pesticides applied or in the method or timing of application would provide sufficient protection against pests to maintain crop yields.7 Farmers, of course, have such options, and environmentally conscientious farmers make tradeoffs to reduce environmental risk. But without better information on the nature of the pest problem both at the field level and in the surrounding area, modelers have to resort to prescriptive and generalized approaches to simulate alternative pesticides and application techniques, which would inevitably be inappropriate for many, if not most, of the acres simulated. The no-practice representation for pesticide management is therefore based on the third type of activity—practicing IPM. One of the choices for methods of pesticide application on the survey was “spot treatment.” Typically, spot treatments apply to a small area within a field and are often treated using a hand-held sprayer. Spot treatment is an IPM practice, as it requires scouting to determine what part of the field to treat and avoids treatment of parts of the field that do not have the pest problem. The reported rate of application for spot treatments was the rate per acre treated. For the baseline simulation, it was assumed that all spot treatments covered 5 percent of the field. Since the APEX model run and associated acreage weight for the sample point represented the whole field, the application rate was adjusted downward to 5 percent of the per-acre rate reported for the baseline scenario. For the no-practice scenario, the rate as originally reported was used,
pesticide substitution or changes in other pest management practices cannot be evaluated.
102
simulating treatment of the entire field rather than 5 percent of the field. In the region, there were four sample points with spot treatments, representing less than 1 percent of cropped acres. Partial field treatments were simulated in a manner similar to spot treatments. For the baseline scenario, application rates were reduced proportionately according to how much of the field was treated. For the no-practice scenario, the rate as reported in the survey was used, simulating treatment of the entire field. However, this adjustment for the no-practice scenario was only done for partial field treatments less than one-third of the field, as larger partial field treatments could have been for reasons unrelated to IPM. In the region, there were eight sample points with partial field treatments, representing about 1 percent of cropped acres. The IPM indicator, described in the previous chapter, was used to adjust pesticide application methods and to increase the frequency of applications to represent “no IPM practice.” For samples classified as having either high or moderate IPM use, all soil-incorporated pesticide applications in the baseline condition were changed to surface applications in the no-practice scenario. For high IPM cases, the first application event between planting and 30 days before harvest was replicated twice for each crop, one week and two weeks after its original application. For moderate IPM cases, the first application event was replicated one time for each crop, one week after its original application.
No-practice representation of land in long-term conserving cover The no-practice representation of land in long-term conserving cover is cultivated cropping with no conservation practices in use. For each CRP sample point, a set of cropping simulations was developed to represent the probable mix of management that would be applied to the point if it were cropped. Cropped sample points were matched to each CRP sample point on the basis of slope, soil texture, soil hydrologic group, and geographic proximity. The cropped sample points that matched most closely were used to represent the cropped condition that would be expected at each CRP sample point if the field had not been enrolled in CRP. In most cases, seven “donor” points were used to represent the crops that were grown and the various management activities to represent crops and management for the CRP sample point “as if” the acres had not been enrolled in CRP. The crops and management activities of each donor crop sample were combined with the site and soil characteristics of the CRP point for the no-practice representation of land in long-term conserving cover.
103
Appendix C Criteria and Scoring for Treatment Levels C.1. Sediment and Erosion control The sediment scoring shown in table F1 assigns mitigation points for sediment conserving conservation practices for each method of mitigating sediment loss: Avoid, Control, and Trap (ACT). These points provide a means to evaluate the differences between treatment levels. They are combined with nutrient application scoring in loss matrices for surface loss of nitrogen and phosphorus. Each mitigation technique (Avoid, Control, Trap) addressed by a conservation practice is scored on a scale of 20 points for a maximum score for any individual practice of 60 points. The point assignment is based on professional opinions of NRCS conservationists and based on a practices’ relative ability to control sediment loss for that mitigation technique. Two practices may receive the same score and one may be generally recognized as more efficient in certain situations, but both are highly effective in their mitigation of losses. For example, no-till and terraces both score 20 points for controlling sediment runoff losses. Terraces are physical barriers that slow runoff and help control concentrate flow. However, terraces do not reduce rainfall impact; soil may be dislodged and may move between
terraces, especially if crop residue is not present on the soil surface. The residue cover from no-till provides a physical barrier to raindrop impact and reduces dislodging of soil particles and subsequent erosion. When applied correctly, terraces and no-till practices complement each other to reduce erosion to acceptable levels on most land suitable for crop production. Sediment Treatment Level Criteria: The scores for each practice in Table C.1 are summed. Annual practices, such as tillage type, are averaged for the rotation before adding to the sum of the more permanent structural practices. Point criteria for the treatment levels are as follows:
Low: Less than 40 points
Moderate: Less than 60 points
Moderately High: Less than 80 points
High: Greater than or equal to 80 points
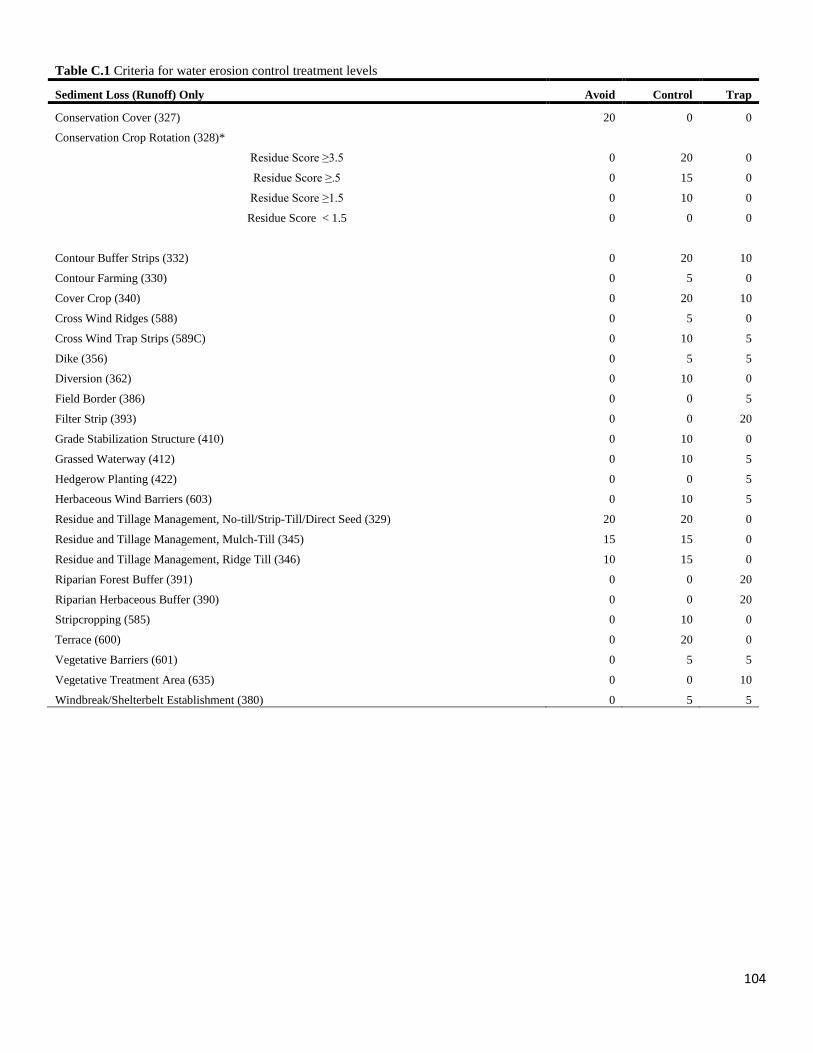
104
Table C.1 Criteria for water erosion control treatment levels
Sediment Loss (Runoff) Only Avoid Control Trap
Conservation Cover (327) 20 0 0
Conservation Crop Rotation (328)*
Residue Score ≥3.5 0 20 0
Residue Score ≥.5 0 15 0
Residue Score ≥1.5 0 10 0
Residue Score < 1.5 0 0 0
Contour Buffer Strips (332) 0 20 10
Contour Farming (330) 0 5 0
Cover Crop (340) 0 20 10
Cross Wind Ridges (588) 0 5 0
Cross Wind Trap Strips (589C) 0 10 5
Dike (356) 0 5 5
Diversion (362) 0 10 0
Field Border (386) 0 0 5
Filter Strip (393) 0 0 20
Grade Stabilization Structure (410) 0 10 0
Grassed Waterway (412) 0 10 5
Hedgerow Planting (422) 0 0 5
Herbaceous Wind Barriers (603) 0 10 5
Residue and Tillage Management, No-till/Strip-Till/Direct Seed (329) 20 20 0
Residue and Tillage Management, Mulch-Till (345) 15 15 0
Residue and Tillage Management, Ridge Till (346) 10 15 0
Riparian Forest Buffer (391) 0 0 20
Riparian Herbaceous Buffer (390) 0 0 20
Stripcropping (585) 0 10 0
Terrace (600) 0 20 0
Vegetative Barriers (601) 0 5 5
Vegetative Treatment Area (635) 0 0 10
Windbreak/Shelterbelt Establishment (380) 0 5 5
105
Appendix D Nutrient Management, Nitrogen and Phosphorus Scoring Method Table D1 shows the scoring system for nitrogen and phosphorus application management treatment levels. Scores for nitrogen are for each crop and crop year and averaged over the rotation length. For phosphorus, the scores are based on the entire rotation. Scoring for phosphorus timing and method are based on the lowest score for all applications. Maximum score for both nutrients is 60. Rate and timing have a maximum of 20 each and proper method plus split application of nutrients can add an additional 30 timing points for nitrogen, 10 timing points for phosphorus. Proper application method can add 10 points for each nutrient. For incorporation with the sediment scores to address nitrogen and phosphorus surface runoff management levels, each sediment and erosion mitigation pathway (Avoid, Control, Trap) is adjusted to a maximum of 20 points so its scoring scale is equivalent to that for the maximum scores for rate, timing, and method plus split application scores from nutrient application management. These scores (application management and runoff management) are summed for the nutrient management runoff levels. For example, the maximum score for avoiding sediment when all practices are summed is 40, so all avoid scores are halved. The maximum for control mitigation is 100, so the total control score is divided by 5, and that for trapping is 80, the score total trap score is divided by 4. In CEAP-1 (2003 to 2006) approximately 3% of the acres had a control score exceeding
100. Further investigation in these few points indicated they occurred on very complex landscapes and therefore they were not used in the development of the nutrient runoff scoring protocols. Nitrogen and Phosphorus Application Management Levels
Low: Equal or Less than 15 points
Moderate: Equal or Less than 30 points
Moderately High: Less than 45 points
High: Greater than or equal to 45 points
Nitrogen and Phosphorus Runoff Management levels
Low: Less than 20 points
Moderate: Less than 40 points
Moderately High: Less than 60 points
High: Greater than or equal to 60 points
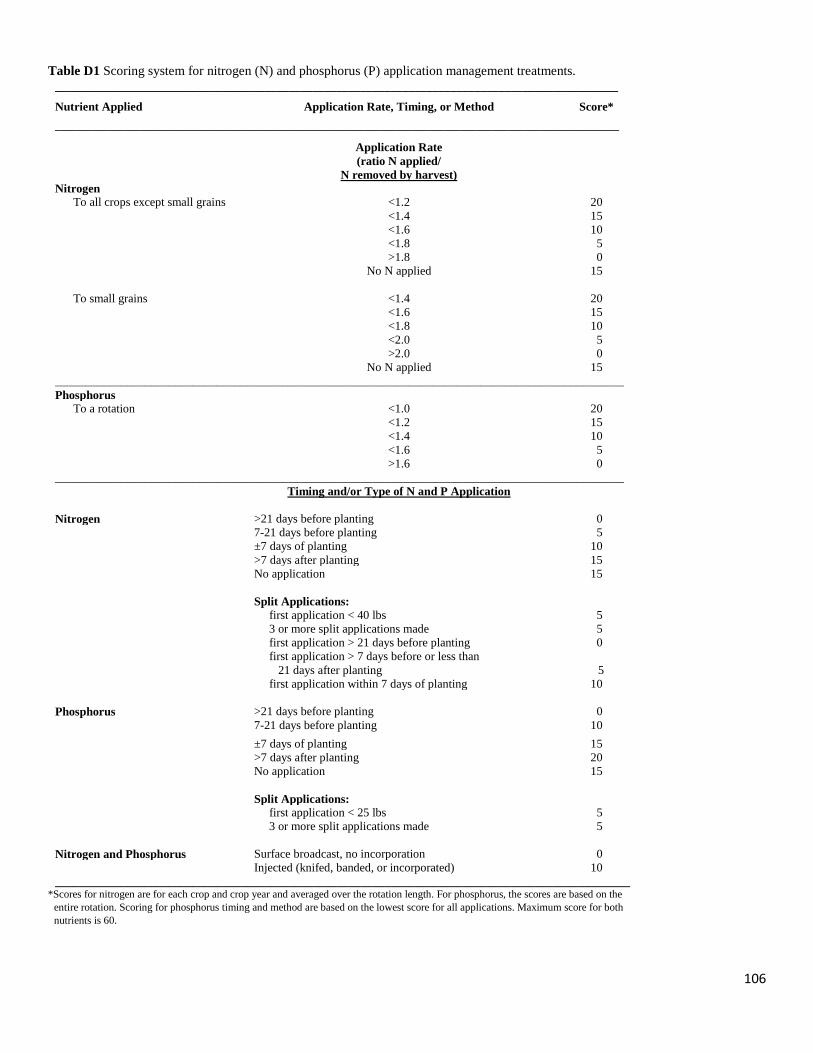
106
Table D1 Scoring system for nitrogen (N) and phosphorus (P) application management treatments. ______________________________________________________________________________________________
Nutrient Applied Application Rate, Timing, or Method Score* __________________________________________________________________________________________________________
Application Rate (ratio N applied/
N removed by harvest)
Nitrogen To all crops except small grains <1.2 20 <1.4 15 <1.6 10 <1.8 5 >1.8 0 No N applied 15 To small grains <1.4 20 <1.6 15 <1.8 10 <2.0 5 >2.0 0 No N applied 15 _______________________________________________________________________________________________ Phosphorus To a rotation <1.0 20 <1.2 15 <1.4 10 <1.6 5 >1.6 0 _______________________________________________________________________________________________
Timing and/or Type of N and P Application
Nitrogen >21 days before planting 0 7-21 days before planting 5 ±7 days of planting 10 >7 days after planting 15 No application 15 Split Applications: first application < 40 lbs 5 3 or more split applications made 5 first application > 21 days before planting 0 first application > 7 days before or less than
21 days after planting
5 first application within 7 days of planting 10 Phosphorus >21 days before planting 0 7-21 days before planting 10 ±7 days of planting 15 >7 days after planting 20 No application 15 Split Applications: first application < 25 lbs 5 3 or more split applications made 5 Nitrogen and Phosphorus Surface broadcast, no incorporation 0 Injected (knifed, banded, or incorporated) 10 ________________________________________________________________________________________________
*Scores for nitrogen are for each crop and crop year and averaged over the rotation length. For phosphorus, the scores are based on the entire rotation. Scoring for phosphorus timing and method are based on the lowest score for all applications. Maximum score for both nutrients is 60.
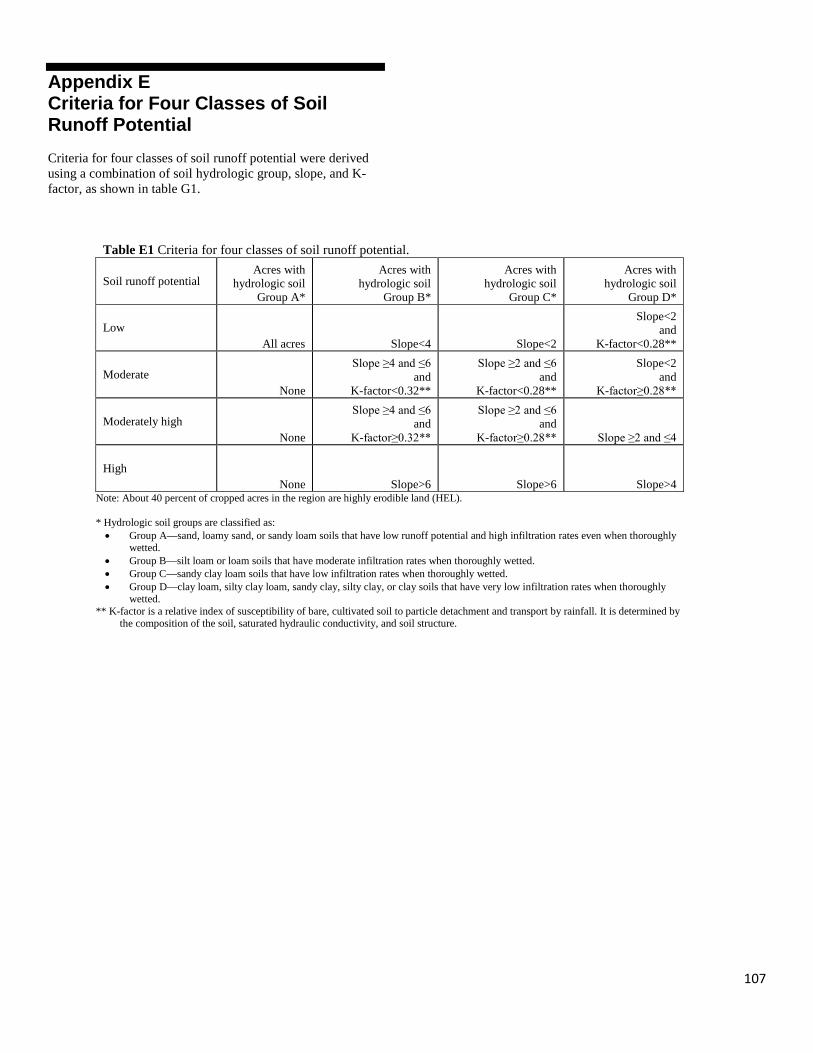
107
Appendix E Criteria for Four Classes of Soil Runoff Potential Criteria for four classes of soil runoff potential were derived using a combination of soil hydrologic group, slope, and K-factor, as shown in table G1.
Table E1 Criteria for four classes of soil runoff potential.
Soil runoff potential Acres with
hydrologic soil Group A*
Acres with hydrologic soil
Group B*
Acres with hydrologic soil
Group C*
Acres with hydrologic soil
Group D*
Low All acres Slope<4 Slope<2
Slope<2 and
K-factor<0.28**
Moderate None
Slope ≥4 and ≤6 and
K-factor<0.32**
Slope ≥2 and ≤6 and
K-factor<0.28**
Slope<2 and
K-factor≥0.28**
Moderately high None
Slope ≥4 and ≤6 and
K-factor≥0.32**
Slope ≥2 and ≤6 and
K-factor≥0.28** Slope ≥2 and ≤4
High None Slope>6 Slope>6 Slope>4
Note: About 40 percent of cropped acres in the region are highly erodible land (HEL). * Hydrologic soil groups are classified as: • Group A—sand, loamy sand, or sandy loam soils that have low runoff potential and high infiltration rates even when thoroughly
wetted. • Group B—silt loam or loam soils that have moderate infiltration rates when thoroughly wetted. • Group C—sandy clay loam soils that have low infiltration rates when thoroughly wetted. • Group D—clay loam, silty clay loam, sandy clay, silty clay, or clay soils that have very low infiltration rates when thoroughly
wetted. ** K-factor is a relative index of susceptibility of bare, cultivated soil to particle detachment and transport by rainfall. It is determined by
the composition of the soil, saturated hydraulic conductivity, and soil structure.
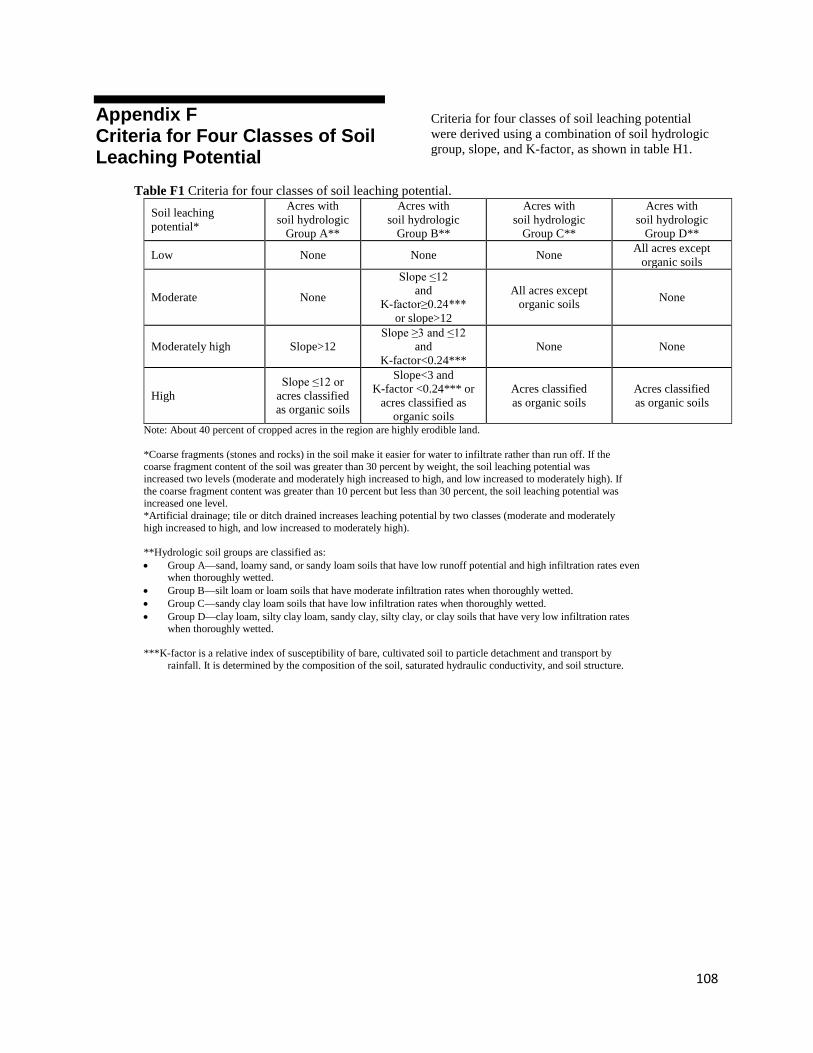
108
Appendix F Criteria for Four Classes of Soil Leaching Potential
Criteria for four classes of soil leaching potential were derived using a combination of soil hydrologic group, slope, and K-factor, as shown in table H1.
Table F1 Criteria for four classes of soil leaching potential.
Soil leaching potential*
Acres with soil hydrologic
Group A**
Acres with soil hydrologic
Group B**
Acres with soil hydrologic
Group C**
Acres with soil hydrologic
Group D**
Low None None None All acres except organic soils
Moderate None
Slope ≤12 and
K-factor≥0.24*** or slope>12
All acres except organic soils None
Moderately high Slope>12 Slope ≥3 and ≤12
and K-factor<0.24***
None None
High Slope ≤12 or
acres classified as organic soils
Slope<3 and K-factor <0.24*** or
acres classified as organic soils
Acres classified as organic soils
Acres classified as organic soils
Note: About 40 percent of cropped acres in the region are highly erodible land. *Coarse fragments (stones and rocks) in the soil make it easier for water to infiltrate rather than run off. If the coarse fragment content of the soil was greater than 30 percent by weight, the soil leaching potential was increased two levels (moderate and moderately high increased to high, and low increased to moderately high). If the coarse fragment content was greater than 10 percent but less than 30 percent, the soil leaching potential was increased one level. *Artificial drainage; tile or ditch drained increases leaching potential by two classes (moderate and moderately high increased to high, and low increased to moderately high). **Hydrologic soil groups are classified as: • Group A—sand, loamy sand, or sandy loam soils that have low runoff potential and high infiltration rates even
when thoroughly wetted. • Group B—silt loam or loam soils that have moderate infiltration rates when thoroughly wetted. • Group C—sandy clay loam soils that have low infiltration rates when thoroughly wetted. • Group D—clay loam, silty clay loam, sandy clay, silty clay, or clay soils that have very low infiltration rates
when thoroughly wetted. ***K-factor is a relative index of susceptibility of bare, cultivated soil to particle detachment and transport by
rainfall. It is determined by the composition of the soil, saturated hydraulic conductivity, and soil structure.
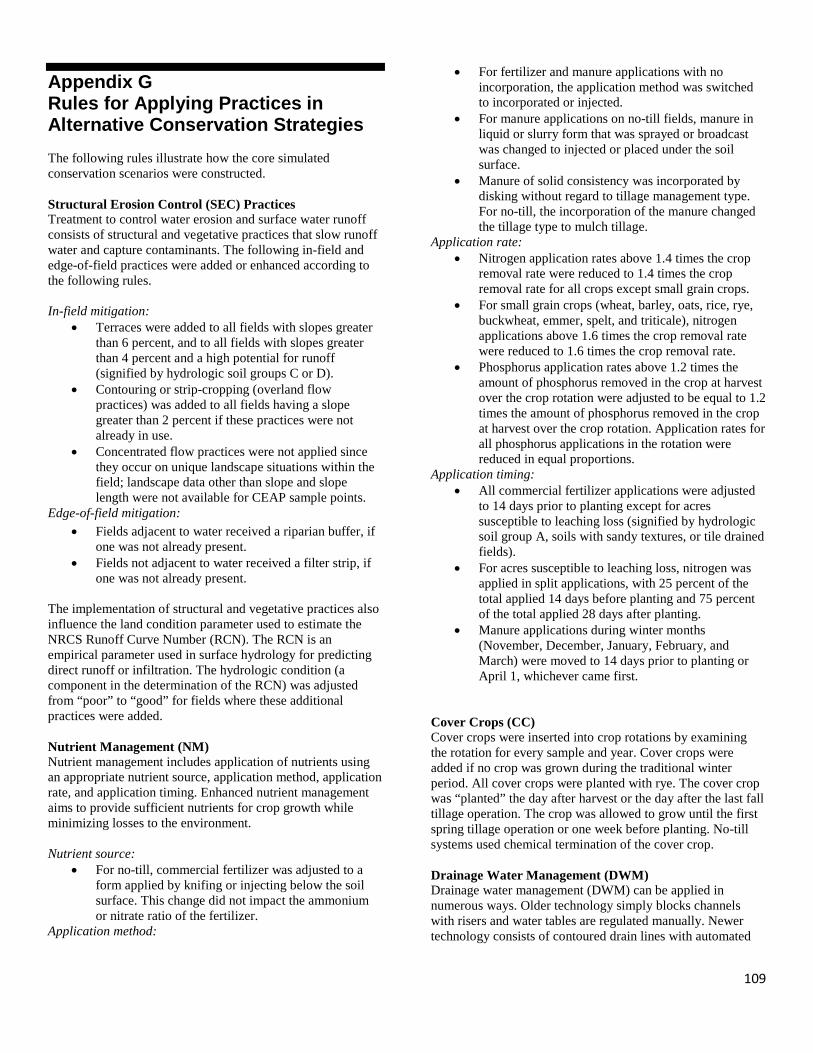
109
Appendix G Rules for Applying Practices in Alternative Conservation Strategies The following rules illustrate how the core simulated conservation scenarios were constructed. Structural Erosion Control (SEC) Practices Treatment to control water erosion and surface water runoff consists of structural and vegetative practices that slow runoff water and capture contaminants. The following in-field and edge-of-field practices were added or enhanced according to the following rules. In-field mitigation:
• Terraces were added to all fields with slopes greater than 6 percent, and to all fields with slopes greater than 4 percent and a high potential for runoff (signified by hydrologic soil groups C or D).
• Contouring or strip-cropping (overland flow practices) was added to all fields having a slope greater than 2 percent if these practices were not already in use.
• Concentrated flow practices were not applied since they occur on unique landscape situations within the field; landscape data other than slope and slope length were not available for CEAP sample points.
Edge-of-field mitigation: • Fields adjacent to water received a riparian buffer, if
one was not already present. • Fields not adjacent to water received a filter strip, if
one was not already present.
The implementation of structural and vegetative practices also influence the land condition parameter used to estimate the NRCS Runoff Curve Number (RCN). The RCN is an empirical parameter used in surface hydrology for predicting direct runoff or infiltration. The hydrologic condition (a component in the determination of the RCN) was adjusted from “poor” to “good” for fields where these additional practices were added. Nutrient Management (NM) Nutrient management includes application of nutrients using an appropriate nutrient source, application method, application rate, and application timing. Enhanced nutrient management aims to provide sufficient nutrients for crop growth while minimizing losses to the environment. Nutrient source:
• For no-till, commercial fertilizer was adjusted to a form applied by knifing or injecting below the soil surface. This change did not impact the ammonium or nitrate ratio of the fertilizer.
Application method:
• For fertilizer and manure applications with no incorporation, the application method was switched to incorporated or injected.
• For manure applications on no-till fields, manure in liquid or slurry form that was sprayed or broadcast was changed to injected or placed under the soil surface.
• Manure of solid consistency was incorporated by disking without regard to tillage management type. For no-till, the incorporation of the manure changed the tillage type to mulch tillage.
Application rate: • Nitrogen application rates above 1.4 times the crop
removal rate were reduced to 1.4 times the crop removal rate for all crops except small grain crops.
• For small grain crops (wheat, barley, oats, rice, rye, buckwheat, emmer, spelt, and triticale), nitrogen applications above 1.6 times the crop removal rate were reduced to 1.6 times the crop removal rate.
• Phosphorus application rates above 1.2 times the amount of phosphorus removed in the crop at harvest over the crop rotation were adjusted to be equal to 1.2 times the amount of phosphorus removed in the crop at harvest over the crop rotation. Application rates for all phosphorus applications in the rotation were reduced in equal proportions.
Application timing: • All commercial fertilizer applications were adjusted
to 14 days prior to planting except for acres susceptible to leaching loss (signified by hydrologic soil group A, soils with sandy textures, or tile drained fields).
• For acres susceptible to leaching loss, nitrogen was applied in split applications, with 25 percent of the total applied 14 days before planting and 75 percent of the total applied 28 days after planting.
• Manure applications during winter months (November, December, January, February, and March) were moved to 14 days prior to planting or April 1, whichever came first.
Cover Crops (CC) Cover crops were inserted into crop rotations by examining the rotation for every sample and year. Cover crops were added if no crop was grown during the traditional winter period. All cover crops were planted with rye. The cover crop was “planted” the day after harvest or the day after the last fall tillage operation. The crop was allowed to grow until the first spring tillage operation or one week before planting. No-till systems used chemical termination of the cover crop. Drainage Water Management (DWM) Drainage water management (DWM) can be applied in numerous ways. Older technology simply blocks channels with risers and water tables are regulated manually. Newer technology consists of contoured drain lines with automated

110
control structures that minimize labor. The DWM strategy was designed to simulate the latter. DWM was applied only to fields with existing artificial drainage as noted in the survey. No additional drain lines were added. Water tables were maintained below the root zone throughout the growing season and changed as crop roots developed and rooting depth increased. After fall harvest until February 14th, soils on the surface were maintained in a saturated but not ponded condition. On February 15th, soils were drained in preparation for field operations associated with spring planting. If a winter annual was planted for cover or grain, DWM was not applied. If a perennial plant was being grown, DWB was not applied.