natural ionizing radiation and health - ngu
TRANSCRIPT

The Norwegian Academyof Science and Letters
Natural Ionizing Radiation and Health
Proceedings from a symposium held at the Norwegian Academy of Science and Letters,Oslo 6-7 June 2001
Edited byB. Bølviken, Geological Survey of Norway,Trondheim, Norway
2002

Det Norske Videnskaps-Akademi 2002
The Norwegian Academy of Science and LettersDrammensveien 78N-0271 OsloE-mail: [email protected]
Supported byGeological Survey of NorwayLaborel Norwegian Cancer SocietyNorwegian Radiation Protection Authority
This book is also available from the home pages of the Norwegian Academy ofScience and Letters (http://www.dnva.no/) and of the Geological Survey of Norway (http://www.ngu.no/)
Printed in Norway 2002 by AIT Otta AS

Contents
Preface . . . . . . . . . . . . . . . . . . . . . . . . . . . . . . . . . . . . . . . . . . . . . . . . 7
Earlier Proceedings . . . . . . . . . . . . . . . . . . . . . . . . . . . . . . . . . . . . . . 8
L. E. HolmThe UNSCEAR 2000/2001 reports . . . . . . . . . . . . . . . . . . . . . . . . . . 9
J. ValentinInternational Commission on Radiological Protection (ICRP):On risks and actions . . . . . . . . . . . . . . . . . . . . . . . . . . . . . . . . . . . . . . 17
P. Schmidt-Thomé, M. Lahti and G. GaálApplication of airborne radiometric surveys in the mapping of areaswith high natural or anthropogenic radiation . . . . . . . . . . . . . . . . . . . 25
B. Frengstad, A. K. Skrede, J. R. Krog, T. Strand, B. Lind and D. BanksRadon in potable groundwater: examples from Norway . . . . . . . . . . 32
G. Åkerblom, N. Hagberg, L. Mjønes and A.HeibergHigh indoor radon concentrations at some Swedish waterworks . . . . 45
T. Strand, C. Lunder Jensen, A. Heiberg, L. Ruden and K. ÅnestadRadon concentrations in Norwegian dwellings (Abstract) . . . . . . . . . 55
L. MjønesProposal for a new radon programme for Sweden. The Swedish Radon 2000 Commision report . . . . . . . . . . . . . . . . . . . . . . . . . . . . . 57
B. Salbu and O. C. Lind Advanced techniques for the determination of solid state uranium speciation . . . . . . . . . . . . . . . . . . . . . . . . . . . . . . . . . . . . . . . . . . . . . . 62
H. E. Krokan and G. SlupphaugDamage and repair of DNA in mammalian cells – emphasis on oxidative processes . . . . . . . . . . . . . . . . . . . . . . . . . . . . . . . . . . . . . . . 74
5

E. O. PettersenLow-dose hypersensitivity and adaptive responses to radiation . . . . 92
S.C. Darby, D. Hill and R. DollRadon: a likely carcinogen at all exposures . . . . . . . . . . . . . . . . . . . . 103
D. L. Henshaw and J.E. AllenIs indoor radon linked to leukaemia in chlildren and adults? – A review of the evidence . . . . . . . . . . . . . . . . . . . . . . . . . . . . . . . . . . 127
B. BølvikenEcological analyses: radioactive elements versus nasopharyngeal carcinoma and multiple sclerosis . . . . . . . . . . . . . . . . . . . . . . . . . . . . 148
T. Haldorsen, J. B. Reitan and U. TvetenCancer incidence among Norwegian airline crew . . . . . . . . . . . . . . . 158
H. Stigum, T. Strand and P. MagnusShould radon be removed from homes? A cost-effect analysis. (Abstract) . . . . . . . . . . . . . . . . . . . . . . . . . . . . . . . . . . . . . . . . . . . . . . 165
T. Ramsøy and T. Bjørnstad, T.Radioactive deposits associated with gas condensate production and treatment. . . . . . . . . . . . . . . . . . . . . . . . . . . . . . . . . . . . . . . . . . . . 167
D. R. Olsen Small doses of radiation during radiotherapy . . . . . . . . . . . . . . . . . . 171

7
Preface
This book contains a collection of papers presented at the symposium “Nat-ural Ionizing Radiation and Health” held in Oslo June 5-6, 2001. The meetingwas number 13 in a series of symposia organized from 1980 on by the Com-mittee for Geomedicine of the Norwegian Academy of Science and Letters.Since 1986 these symposia have been arranged in collaboration with theworking group “Soil Science and Geomedicine” of the International Union ofSoil Science. Titles of the previous symposia in this series are listed on p. 8.
The present volume is dedicated to the initiator of this series of meetings,the late Professor, Dr. J. Låg, who served as a chairman of all the 12 previ-ous symposia and editor of the “Green Books” following every meeting. Dr.Låg, born in 1915, was Professor of Soil Science at the AgriculturalUniversity of Norway during the period 1949-1985. He was among themost prominent soil scientists of his generation and made significant con-tributions to several scientific disciplines. During his later years much of hiswork was devoted to the field Geomedicine, which he promoted inter-nationally through his book with this title published by CRC Press in 1990.
Professor Låg’s achievements were a great inspiration to those of us con-tinuing and further developing the work on geomedicine. We consider thepresent symposium series to be an important contribution to the future workin this area and intend to continue holding such meetings on topical issuesin geomedicine. Our current definition of this field of science is the follow-ing: “Geomedicine is the science dealing with the influence of natural envi-ronmental factors on human and animal health”. This means that geomed-icine includes the field named “Medical geology”.
This symposium would hardly have been possible without financial sup-port from various sources. We are grateful for contributions from the Geo-logical Survey of Norway, Laborel, the Norwegian Cancer Society and theNorwegian Radiation Protection Authority.
Eiliv SteinnesNorwegian University of Science and Technology, TrondheimChairman, Geomedical Committee of the Norwegian Academy of Science and LettersE-mail: [email protected]

Proceedings from earlier geomedical symposia arranged by the Norwegian Academy of Science and Letters
Editor 1980-2000: J. Låg, Agricultural University of Norway
1980. Geomedical aspects in present and future research.
1984. Geomedical research in relation to geochemical registrations.
1987. Geomedical consequences of chemical composition of freshwater.
1987. Commercial fertilizers and geomedical problems.
1998. Health problems in connection with radiation from radioactive mat-ter in fertilizers, soils and rocks.
1990. Excess and deficiency of trace elements in relation to human and an-imal health in Arctic and Subarctic regions.
1991. Human and animal health in relation to circulation processes of sele-nium and cadmium.
1992. Chemical climatology and geomedical problems.
1994. Geomedical problems related to aluminium, iron and manganese.
1996. Chemical data as a basis for geomedical investigations.
1997. Some geomedical consequences of nitrogen circulation processes
2000. Geomedical problems in developing countries.

9
The UNSCEAR 2000/2001 reports
L.E. Holm
Swedish Radiation Protection Authority, SE-171 16 Stockholm, SwedenE-mail: [email protected]
Abstract
The United Nations Scientific Committee on the Effects of Atomic Radiation (UN-
SCEAR) assesses levels and health effects of exposure to ionizing radiation. Last year
the Committee published its 2000 Report. Ten scientific annexes to the Report are exten-
sive reviews and assessments of exposures from natural background, medical and occu-
pational radiation; radiation-associated cancer risks; DNA repair; effects at low doses;
effects of radiation in combination with other agents; and an assessment of the radiolog-
ical consequences of the Chernobyl accident. Recently the Committee adopted its 2001
Report on hereditary effects of radiation.
Radiation exposure has been associated with most forms of leukemia and with cancers
of many organs. There is no convincing scientific evidence that cancer risk from radiation
exposure disappears at very low doses. UNSCEAR estimates that lifetime cancer mortality
risk after 1 Sv is about 12 %. This estimate could be reduced by 50 % for chronic exposures
and low doses. The total risk of hereditary effects is 0.3-0.5 % Sv-1 to the first generation
following radiation. The Chernobyl accident caused severe radiation effects: 134 workers
suffered from radiation sickness, 30 of whom died in the first months, and large territories
were contaminated with released radionuclides. Over 1800 thyroid cancers have been re-
ported in individuals exposed in childhood in the severely contaminated areas of Belarus,
the Russian Federation and Ukraine. Apart from this increase in thyroid cancer, no radia-
tion-associated increase in leukemia or other cancers has so far been detected.
Introduction
Man-made radionuclides are released to the environment from nuclear en-ergy production and from uses of radionuclides in medicine, agricultureand industry. People are also exposed to radiation from medical or occupa-tional exposures, as well as from natural sources of radiation. UNSCEAR

10
was established in 1955 and is the body within the United Nations systemwith a mandate from the General Assembly to assess and report levels andhealth effects of exposure to ionizing radiation. UNSCEAR is the major in-ternational body, which reviews the exposure of the world population to allsources of radiation under normal circumstances as well as after accidents.The Committee’s publications form the scientific basis on which interna-tional and national agencies develop appropriate radiation protection stan-dards for workers, patients and the general public.
Since its establishment, UNSCEAR has reported yearly to the GeneralAssembly and submitted every few years comprehensive reports with de-tailed scientific annexes on the sources and biological effects of ionizing ra-diation. The Committee’s latest assessments were published in its 2000 Re-ports [1]. In April 2001, the Committee adopted its 2001 Report on heredi-tary effects of radiation [2].
Sources of Radiation Exposure
Exposures from natural radiation are the largest component of all exposuresfor most people, and form the baseline upon which exposures from man-made sources are added [1]. The average annual effective dose from natur-al radiation is about 2.4 mSv, one third being due to external exposure andtwo thirds to internal exposure. Half of the total exposure comes from radonand its decay products. The level of exposure varies around the world, usu-ally by a factor of about three, although at many locations typical levels ofnatural radiation exposure exceed the average levels by a factor of 10.
The use of ionizing radiation and radioactive substances causes addition-al radiation exposure. Some activities enhance the existing background ex-posure, e.g. mining. Atmospheric testing of nuclear weapons resulted in thelargest release of radionuclides into the environment from man-madesources. The maximum annual dose occurred in 1963 and was on average0.2 mSv for the world population. Since no further atmospheric test has oc-curred since 1980, the annual doses have decreased to small fractions of thenatural radiation.
Today about 20% of the world’s electrical energy is generated by nuclearfission. Nuclear installations release radioactive materials into the environ-ment and produce radioactive waste during operation and decommission-ing. The annual effective doses to individuals living in the vicinity of the in-stallations are of the order of 0.01 mSv, although certain individuals resid-ing near nuclear installations or nuclear test sites may be subject to higherexposures. More significant releases occur in the event of an accident. Inthe first year after the Chernobyl accident doses of up to 0.8 mSv were esti-mated in eastern and central Europe.

11
The use of radiation in medicine is the largest, and a growing, man-madesource of exposure to ionizing radiation. The largest portion of the medicalradiation exposures comes from diagnostic X-rays. Most of these occur inindustrialized countries, having 25% of the world’s population. There, theaverage annual effective dose is 1.2 mSv from all diagnostic examinationscompared to 0.02 mSv or less in developing countries, the world averagebeing 0.4 mSv. Much, and optimally most, of the effective doses from med-ical uses of radiation is offset by direct benefits to the examined or treatedpatients.
Radiation exposure also occurs as a result of occupational activities. Theaverage annual effective doses to workers have declined over the past 20years. At present the average dose to all workers exposed to man-madesources is 0.6 mSv per year, with 1.8 mSv to monitored workers in the nu-clear fuel cycle installations, 0.5 mSv to workers involved with other indus-trial uses of radiation and 0.3 mSv to medical staff. The doses to workersexposed to natural sources of radiation have been less thoroughly studied,and are on average 1.8 mSv. The average annual doses are 0.7 mSv to coalminers, 2.7 mSv to other miners and 3 mSv to aircrew. Further attentionneeds to be given to the evaluation of occupational exposures arising fromnatural sources.
Health Effects
Information on the biological effects of radiation exposure comes fromstudies of humans (epidemiology), studies of animals and plants (experi-mental radiobiology) and studies of cells (cellular and molecular biology).The key to understanding the health effects of radiation is the interactionbetween these sources of information [1,2].
Damage to DNA in the nucleus is the main initiating event by which ra-diation causes long-term damage to organs and tissues of the body. Double-strand breaks in DNA are regarded as the most likely candidate for causingcritical damage. Single radiation tracks have the potential to cause double-strand breaks and in the absence of 100% efficient repair could result inlong-term damage, even at low doses. Damage to other cellular components(epigenetic changes) may influence the functioning of the cell and progres-sion to the malignant state.
Proto-oncogenes and tumour-suppressor genes control a complex arrayof biochemical pathways involved in interaction, growth, mitogenesis,apoptosis, genomic stability, and differentiation. Mutation of these genescan compromise these controls and contribute to the multi-stage develop-ment of cancer. Much knowledge about the multi-stage nature of carcino-genesis remains to be learned. Although the concept of sequential, interact-

12
ing gene mutations as the driving force for neoplasia is established, there isa lack of understanding of the interplay between these events and the con-sequences for cellular behaviour. Uncertainty also exists about the contribu-tion made to malignant development of epigenetic events.
The judgement as to whether there might be a threshold level of exposurebelow which biological response does not occur can be guided by mechanis-tic considerations. Such a threshold could occur only if repair processes weretotally effective in that dose range or if a single track were unable to producean effect. The absence of consistent indications of significant departures fromlinearity of carcinogenic response at low doses in cellular endpoints (chromo-some aberrations, gene mutation, cell transformation), the activity of wellcharacterized error-prone DNA repair pathways, and the evidence on sponta-neous double-strand breaks in mammalian cells argue against processes thatmight provide for a dose threshold for radiation effects.
Radiation-associated cancer in humans is studied in exposed popula-tions, such that excess cancers may be identified. These populations includesurvivors of the atomic bombings, medically irradiated patients, those oc-cupationally exposed, individuals exposed to radionuclides released intothe environment, and some people exposed to elevated levels of naturalbackground radiation. Since the Committee’s assessment of the risks of ra-diation-induced cancer in the UNSCEAR 1994 Report [3], additional im-portant information has become available from epidemiological studies.
Radiation can cause cancer in almost any tissue or organ in the body, al-though some sites are much more vulnerable than others. A clearer under-standing of physiological modifying factors, such as sex and age, has de-veloped over the last few years. Although differences in the absolute risk oftumour induction with sex are not large and vary with site, for most solidcancers the absolute risk is higher in women than in men. People who wereyoung at the time of radiation exposure, have higher relative and absoluterisks than older people, but again this varies by site. Further follow-up ofradiation-exposed cohorts has demonstrated that excess cancers continue tooccur long time after radiation exposure, and therefore, great uncertaintiesexist in the projection of lifetime risks.
The Life Span Study cohort of the A-bomb survivors in Japan continuesto be a primary source of epidemiological data on radiation effects, includ-ing some 86,500 individuals of both sexes and all the full span of ages withdata for a wide range of doses. The results of this study provide the prima-ry basis for estimating the risk of radiation-induced cancer. Among 86,500individuals in the Life Span Study of the survivors, there were more than7,578 deaths from solid tumours during 1950-1990. Of these, 334 can be at-tributed to radiation exposure. In the same period, 87 out of 249 leukaemiadeaths can be attributed to radiation exposure. This means that about 5% ofthe cancer deaths can be linked to radiation.

13
The cancer incidence and mortality data are broadly similar, both demon-strating statistically significant effects for all solid cancers combined, aswell as for cancers of the stomach, colon, liver, lung, breast, ovary andbladder individually. The incidence data also provide evidence of radiationrisks for thyroid cancer and non-melanoma skin cancers. Statistically sig-nificant risks have not been observed for cancers of the rectum, gallbladder,pancreas, larynx, uterine cervix, uterine corpus, prostate, kidney or renalpelvis. Associations with radiation exposure are noted for several types ofleukaemia, but not for lymphoma or multiple myeloma. The numbers ofsolid tumours associated with radiation exposure are not sufficient to permitdetailed analysis of the dose-response relationship for specific sites or typesof cancer. For all solid tumours together the slope of the dose-responsecurve is linear up to about 3 Sv, but the dose-response curve for leukaemiais best described by a linear-quadratic function. Statistically significantrisks for cancer in the Life Span Study are seen at organ doses above about100 mSv.
Data for the Japanese A-bomb survivors are consistent with a linear orlinear-quadratic dose response over a wide range of doses, but quantifyingrisks at low doses are less certain because of limited statistical precision orother methodological problems. Longer follow-up of cohorts with a widerange of doses will provide more essential information at low doses, butepidemiology alone cannot resolve the issue of whether or not there are lowdose thresholds. However, the inability to detect increased risks at very lowdoses does not indicate that they do not exist.
Studies of populations exposed to medical, occupational or environmen-tal radiation provide information on issues that cannot be addressed by theatomic bomb survivor data, such as the effects of chronic low doses or high-LET radiation, highly fractionated doses, and variability among popula-tions. For some cancer sites, including leukaemia, breast, thyroid, bone andliver, very useful results come from investigations other than the Life SpanStudy. Risk estimates derived from those studies generally agree well withthose from the Life Span Study.
The Committee has concluded that even low doses of radiation may actas mutational initiators of neoplasia, and that anti-tumorigenic defences areunlikely to show low-dose dependency. In general, tumorigenic responsedoes not, therefore, appear to be a complex function of increasing dose. Thesimplest representation is a linear relationship, which is consistent withmost of the available mechanistic and quantitative data. There may be dif-ferences in response for different types of tumours, and statistical variationsin each data set are inevitable. A departure from linearity is noted forleukaemia data, for which a linear-quadratic function is used. Skin cancerand some cancers induced by alpha emitters may have virtual thresholds.Because of the multi-step nature of the tumorigenesis process, linear or lin-
14
ear-quadratic functions are used for representational purposes only in eval-uating possible radiation risks. The actual response may involve multipleand competing processes that cannot yet be separately distinguished.
Based on the available epidemiological data, the Committee has derivedrisk estimates for radiation-induced cancer. For a population of all ages andboth genders with an acute dose of 1 Sv (low-LET), the Committee esti-mates the lifetime risk for solid cancer mortality at about 12%. This esti-mate could be reduced by 50% for chronic exposures. Cancer incidencerisks can be taken as being roughly twice those for mortality. Risks esti-mates for individuals being exposed as children might be twice the esti-mates for a population exposed at all ages. The experience of the Japaneseatomic bomb survivors provides compelling evidence for linearity in esti-mating excess risks of solid cancers; therefore, as a first approximation, lin-ear extrapolation of the estimates at 1 Sv could be used for estimating solidcancer risks at lower doses. This new risk estimate is similar to that pub-lished in the UNSCEAR 1994 Report [3].
Radiation exposure has also the potential for causing hereditary effects inthe offspring of people exposed to radiation. Such effects were oncethought to threaten the future of the human race by increasing the rate ofnatural mutation. However, hereditary effects have yet to be detected in hu-man populations exposed to radiation, although they are known to occur inother species. This year the Committee adopted its 2001 Report with an an-nex specifically dedicated to an assessment of the hereditary effects of radi-ation exposure. The Committee estimates the total risk of hereditary effectsat 0.3-0.5% Sv-1 to the first generation following radiation, or less than onetenth of the risk of fatal carcinogenesis following irradiation.
The Chernobyl accident
The accident at the Chernobyl nuclear power plant in 1986 is the most seri-ous accident involving exposure to ionizing radiation. The accident causedmany severe effects: 134 workers suffered from radiation sickness, 28 diedin the first three months and another two soon afterwards. Large territorieswere contaminated, and deposition of released radionuclides was measur-able in many countries of the Northern Hemisphere. A majority of the epi-demiological studies completed to date are descriptive. Individual dosime-try is not available, and it is difficult to determine whether or not suspectedeffects are radiation-related. Reliable estimates of cancer risks can, conse-quently, not be given. The reconstruction of individual doses is thereforecrucial for future research.
A total of 1800 thyroid cancers have been reported in individuals ex-posed in childhood in the severely contaminated areas of Belorus, the

15
Russian Federation and Ukraine. If the current trend continues, many morecases may occur in future decades, especially in individuals who were ex-posed at young ages. Notwithstanding problems associated with screening,these cancers were most likely caused by radiation exposures at the time ofthe accident. Apart from this increase in thyroid cancer, no increase inleukemia or other cancers has been detected. However, the accident causedserious social and psychological disruptions in the lives of those affected,but there has been no increase of non-malignant disorders that can be di-rectly related to the radiation. Although the most highly exposed individu-als are at an increased risk of radiation-associated effects, the great majori-ty of the population is not likely to experience serious health consequencesof radiation from the Chernobyl accident.
There is a tendency to attribute increases in the rates of all cancers to theChernobyl accident. However, increased rates were also observed beforethe accident. Moreover, a general increase in mortality has been reported inrecent years in most areas of the former USSR, and this must be taken intoaccount when interpreting the results of the Chernobyl-related studies.
The Chernobyl accident might shed light on the late effects of protractedexposure, but given the low doses received by the majority of exposed indi-viduals, any increase in cancer incidence or mortality will be difficult to de-tect in epidemiological studies. Many health problems other than cancerhave been noted in the populations, but they are less likely to be related toradiation exposure. From a scientific point of view, there is a need to evalu-ate and understand the technical causes and health effects of the accident.From a human point of view, there is also an obligation to provide an ob-jective analysis of the health consequences of the accident.
REFERENCES
[1] UNITED NATIONS, 2000. Sources and Effects of Ionizing Radiation.United Nations Scientific Committee on the Effects of Atomic Radia-tion, UNSCEAR 2000 Report to the General Assembly, with scientificannexes. United Nations sales publications No. E.00.IX.3 (Volume I:Sources) and No. E.00.IX.4 (Volume II: Effects). United Nations, NewYork, 1220 pp.
[2] UNITED NATIONS, 2001. Sources and Effects of Ionizing Radiation.United Nations Scientific Committee on the Effects of Atomic Radia-tion, UNSCEAR 2001 Report to the General Assembly, with scientificannex. In press.
[3] UNITED NATIONS, 1994. Sources and Effects of Ionizing Radiation.United Nations Scientific Committee on the Effects of Atomic Radia-

16
tion, 1994 Report to the General Assembly, with scientific annexes.United Nations sales publication E.94.IX. I 1. United Nations, NewYork, 272 pp.
17
International Commission on Radiological Protection(ICRP): On risks and actions
J. Valentin
ICRP, SE-171 16 Stockholm, SwedenE-mail: [email protected]
Abstract
ICRP is a charity offering recommendations and advice on radiological protection. ICRP
regards the linear, no-threshold dose response model as the currently most credible ap-
proximation of the unknown true dose response relationship for low doses and dose
rates. This puts ICRP in an intermediate position in terms of predicted risk. Its current
three-tier system of protection, justification-optimisation-limits, emphasises optimisa-
tion for the collective good before individual dose limitation. Thus, utilitarian criteria are
given more weight than egalitarian ones. The next set of fundamental ICRP recommen-
dations is likely to appear sometime around 2005. ICRP has proposed a shift of empha-
sis towards egalitarian limitation of doses, including a somewhat less anthropocentric
view of protection of the environment than earlier, and the proposal was distributed for
world-wide consultation by the International Radiation Protection Association, IRPA.
Updated and more detailed ideas are being developed on the basis of the consultation re-
sults. These will be circulated through IRPA before final adoption of the new recommen-
dations
Introduction
The International Commission on Radiological Protection, ICRP, was estab-lished in 1928 by the International Society of Radiology. Its mission is, ac-cording to its Constitution, to advance for the public benefit the science of ra-diological protection, in particular by providing recommendations and guid-ance on all aspects of protection against ionizing radiation. These recommen-dations are published in the Commission’s journal, Annals of the ICRP.
The Commission aims at providing an appropriate standard of protectionfor man, without unduly limiting the beneficial practices giving rise to radi-ation (ICRP, 1991). Medical uses of radiation of course provide excellentexamples of this inherent dualism in radiological protection.

The Commission has four standing Committees on (1) radiation effects;(2) doses from radiation exposure; (3) protection in medicine; and (4) ap-plication of ICRP recommendations. New ICRP documents are drafted byTask Groups and Working Parties and reviewed by the Committees beforeapproval by the Commission.
Radiation risk components: Doses
For basic dose statistics and assessments of biological and medical effectsof radiation, ICRP primarily draws on the recurrent reports of the UnitedNations Scientific Committee on the Effects of Atomic Radiation, UN-SCEAR.
Volume I of their most recent full report (UNSCEAR, 2000a) indicatesaverage annual doses of radiation as summarised in Table 1. The Table illu-minates two facts that are often not appreciated by the layman: (a), naturalsources constitute the dominating cause of exposures to radiation; and (b),the biggest man-made source is medical use of radiation.
UNSCEAR (1993) estimated that the average annual effective dose percaput from radiotherapy (i.e. the dose due to scatter radiation outside thetarget area) was 0.3 mSv. No estimate of the average dose due to radiother-apy was included in the 2000 UNSCEAR report. The distribution of suchdoses in the population is bimodal with no dose to most people but severalhundred mSv to patients undergoing radiotherapy.
Radiation risk components: Effects
Basically, radiation effects comprise (1) deterministic effects (such as se-vere burns) that occur with certainty after doses high enough to cause majorcell killing, and (2) stochastic effects that are considered to occur more orless in proportion to dose at all dose levels. In embryos and fetuses, the ef-fect pattern reflects the special conditions during pregnancy. Mental retar-dation is one of the effects observed after high fetal doses.
The exact nature and shape of the dose-response relationship for stochas-tic effects are often discussed. UNSCEAR (2000b) notes that stochastic ef-fects are initiated primarily as a multi-stage sequence of damage to DNA.Low dose radiation is a minor competing contributor to such damage. Muchof the damage is single-strand breaks that are effectively repaired, but radi-ation also induces double-strand breaks, the repair of which is error-prone.
Because of this, at the cellular level the initial induction of damage due tolow doses of radiation is almost certainly proportional to the dose, with nothreshold. Direct observations of cellular or animal systems usually indi-
18

cate an apparent linear or linear-quadratic dose response, but statistical lim-itations often preclude firm conclusions at levels of dose below about 100mSv. A few studies appear to provide significant information at such doselevels, but their conflicting results indicate that the systems are complexand heterogeneous.
Table 1. Average annual effective doses per caput
Source Dose (mSv/year)
Natural background 2.4Diagnostic medicine 0.4 (0.02 – 1.2)1
Atmospheric weapons testing 0.005Chernobyl accident 0.001Nuclear fuel cycle 0.0001Occupational exposure 0.001 (1.3)2
1 Global value (least developed countries – highly industrialised countries)2 Global value (worker average)
UNSCEAR (2000b) concludes that a risk of tumour induction proportionalto the dose remains the most plausible approximation of low-dose response.Epidemiological evidence indicates that the risk of fatal solid cancers athigh doses is about 11% per Sv (9% for men, 13% for women, confidenceinterval about 5-20%). The risk at low dose is estimated to be about half ofthis value (confidence interval about 2-10%). Leukaemias show a linear-quadratic dose response with a risk of 1% at 1 Sv, 0.05% at 0.1 Sv. TheICRP (1991) estimates of the risk of fatal cancer (4% per Sv for occupa-tionally exposed persons and 5% per Sv for members of the public) are sim-ilar to these numbers.
UNSCEAR (2000b) discusses modifying factors such as apoptosis andimmune surveillance, and concludes that such factors may affect the rate ofcancer, but do not cause any threshold. Hormesis is sometimes claimed tobe a reason not to bother about radiation protection at low doses. ICRP re-gards hormesis as a transient response occurring at doses that ICRP consid-ers as being of no practical relevance for protection purposes. Genomic in-stability provides increasing insight into the mechanism of cancer induc-tion, and therefore indirectly into prevention and curing, but does not reflectadditional new risks.
The UNSCEAR (2000b) report also discusses problems with so-calledecological correlation studies in epidemiology, and concludes that suchstudies are open to so serious bias by confounding factors that they cannotbe used to estimate radiation risk. Furthermore, the report points out that
19

many childhood thyroid cancers in the wake of the Chernobyl accident areobviously radiation induced, but states that the exact mechanisms and lev-els of risk are still poorly understood.
The current principles of protection
Since no dose is regarded as safe, dose limits cannot delineate dangerousfrom safe and are not efficient as tools to minimise radiation risks. Instead,ICRP has devised a three-tier system of radiation protection:
Justification of the practice or intervention at hand – No additional doseshould be tolerated unless there is an associated benefit that outweighs therisk.
Optimisation of protection – Doses are to be kept as low as reasonablyachievable; i.e. usually far below the dose limits.
Limitation of doses – Dose limits are primarily needed to ensure equi-table distribution of risk, and may be useful as a regulatory instrument.
Many additional aspects and complications should be considered. Theseinclude the exposure conditions (practice or intervention), the source of ex-posure (public, occupational, medical), and the probability of incurring anexposure (near-certain or potential, with human factors as an importantcomponent of safety considerations).
The principles of justification and optimisation aim at doing more goodthan harm and at maximising the margin of good over harm. Thus, they sat-isfy the conditions of utilitarian ethics, in that actions are judged by theirconsequences. The aim of dose limitation is to ensure that no individual isexposed to undue harm. This is a case of deontological ethics, according towhich some duties are imperative
Activities of ICRP
ICRP Committee 1 on radiation effects considers the risk of induction ofcancer and heritable disease (stochastic effects) together with the underly-ing mechanisms of radiation action. The Committee also considers therisks, severity, and mechanism of induction of tissue/organ damage and de-velopmental effects (deterministic effects). It has three current Task Groupson (1) epidemiology and dose response at low doses; (2) radiation effectson the embryo and fetus; and (3) evaluation of relative biological efficiency(RBE) for deterministic and stochastic effects.
ICRP Committee 2 on doses from radiation exposure is concerned withthe development of dose coefficients for the assessment of internal and ex-ternal radiation exposure. This Committee also develops reference bioki-
20

netic and dosimetric models and reference data for workers and members ofthe public. It has some five Task Groups, interacting in a complex fashion toachieve a further revision of the publication on ‘Reference Man’, a revisionof the alimentary (gastrointestinal) tract model, a technical reference docu-ment on the use of the lung model in ICRP Publication 66 (1994), anatom-ically more realistic phantoms, dose calculations for new reference phan-toms, and further revision of internal dose coefficients and addition of ex-ternal dose coefficients. ICRP Committees 1 and 2 are jointly reviewingradon dosimetry in order to resolve the difference between dosimetric andepidemiological approaches.
ICRP Committee 3 on protection in medicine is concerned with protec-tion of persons and unborn children when ionizing radiation is used formedical diagnosis, therapy, or biomedical research. This Committee is alsoconcerned with assessment of the medical consequences of accidental ex-posures. It has recently produced reports on interventional radiology, onsafety in radiotherapy, and on computed tomography. Its standing TaskGroup on radiopharmaceuticals continuously adds new information to theweb site of ICRP. The Committee has just started a Task Group on the re-lease of nuclear medicine patients from designated clinics.
ICRP Committee 4 on the application of ICRP recommendations pro-vides advice on the application of the recommended system of protection inall its facets for occupational and public exposure. It also acts as the majorpoint of contact with other international organisations and professional so-cieties concerned with protection against ionizing radiation. This Commit-tee, having just concluded its work on ICRP Publications 81 and 82 on sol-id waste disposal and on prolonged exposures, is now launching three TaskGroups on (1) characterising individual members of the public for radiolog-ical protection purposes; (2) optimisation and ‘stakeholder’ involvement;and (3) radiological protection in space flight.
The recent activities in ICRP Committee 3 merit some extra words.World-wide, collective doses to patients from diagnostic and therapeuticprocedures are increasing. Much of the increase observed is clearly justifiedon clinical grounds, particularly in developing countries.
However, there are also some problems. Indiscriminate referral, wherepatients are subjected to examinations (or, more rarely, treatments) that arenot clinically required, leads to increased collective doses due to exposureof too many persons. The other major class of problems comprises unnec-essarily high doses per procedure. Non-optimised equipment or methodswill of course generate such unnecessary doses, and inadequate or insuffi-cient training of staff will aggravate the problems.
Earlier ICRP guidance concerning medical radiation described abovecould be classified as dealing with the system, the installation, the equip-ment, and the various groups of patients or other persons exposed to radia-
21

tion. This logical organisation of the material works for most current usersof ICRP reports, but it may also be useful to provide specific guidance ontopical problems, cutting information in another direction. Such problem-oriented guidance may be particularly relevant for medical staff directly in-volved in the care of patients as well as for health physicists and engineers‘at the shop floor’ in hospitals and clinics.
Future Recommendations of ICRP
The present general recommendations of ICRP (ICRP, 1991) were adoptedin 1990. Traditionally, such recommendations are revised every 15 years orso. Accordingly, ICRP plans to issue recapitulated and/or consolidated newrecommendations around 2005.
Some of the problems involved are mentioned below. Firstly, all dose limits for the public are not very helpful. They refer to a
sum of contributions from many sources, but not all sources and not neces-sarily the most important ones. Collective dose can also be problematic.This is not so much due to ICRP or the concept itself, but to misuse in thatsome people stretch the concept far beyond what is sensible. ICRP feelsthat the unlimited aggregation of collective dose over time and space into asingle value is unhelpful. This should not be misconstrued; collective dosesshould not be ignored on the sole ground that individual doses are small.However, information must be provided fairly, and this means that the pre-sentation of collective dose contributed by wide ranges of individual doseshould be separated into blocks of limited ranges of dose and time.
Secondly, ICRP recommendations are logical but overwhelmingly com-plex.
Thirdly, there is an increasing awareness that radiological protection ofthe environment may need to be considered in its own right, not only inso-far as man is concerned because radiation is transported through the envi-ronment. ICRP (1990) claimed that the standard of environmental controlneeded to protect man to the degree currently thought desirable will ensurethat other species are not put at risk, and that individual members of non-human species might be harmed, but not to the extent of endangering wholespecies.
As it stands, this statement is no more than an unsubstantiated declara-tion of a belief. Actually, the statement is probably correct in most cases,and proper attention to the environment is unlikely to change existing dis-charge authorisations. But ICRP needs a comprehensive system, one that isin line with control of other pollutants, which is transparent, and with prop-er scientific references. ICRP recently launched a Task Group on this prob-lem, directly under the Main Commission. The Task Group will presum-
22

ably refer frequently to the 1992 Rio Declaration on sustainable develop-ment, and perhaps at the end of the day ICRP will be turning its statementupside down, saying that the standard of control needed to protect the envi-ronment will ensure that man is not put at risk.
Taking all of these problems into account, ICRP is collaborating with theInternational Radiation Protection Association (IRPA) to ensure a compre-hensive discussion among peers all over the world of possible basic con-cepts for the new recommendations (Clarke, 1999). Some features of theoriginal ‘Controllable Dose’ proposal follow:• A Controllable Dose is defined as the dose, or the sum of doses, to an in-
dividual from a particular source that can reasonably be controlled bywhatever means.
• The significance of a Controllable Dose would be judged by its magni-tude, the benefit to the exposed person, and the ease of reducing or pre-venting the dose. In principle, similar actions would be attempted for dos-es of similar size, no matter what the source. (This in fact resembles thecurrent system in many ways, but the advice would be organised muchmore transparently).
• Protection would be focused on the individual rather than the collective(the number exposed in ‘critical groups’ would still be an issue, andworkforce doses would need to be treated much the same way as today topreclude ‘dilution’ of doses).
• Significantly higher doses than some tens of mSv would only be sus-tained in accidents and life-saving medical procedures.
• The intentional delivery of high doses in medicine, as in radiotherapy andat least some interventional procedures, would be outside the scope of‘Controllable Dose’.
In contrast to the current scheme of justification – optimisation – limitation,the proposed system would focus on individual limitation, followed by op-timisation of protection against the resulting doses. It would be emphasisedthat justification is a societal / political exercise involving more than justhealth physics.
The consultation on these ideas indicated wide-spread support for theaims of the proposal, but, of course, many comments on how these aimswould be achieved. ICRP is now developing more detailed proposals, tak-ing all of the IRPA comments into account. A progress report recently ap-peared (ICRP, 2001). In due course, ICRP will again consult the scientificcommunity with more specific proposals for new recommendations.
23

REFERENCES
Clarke RH, 1999. Control of low-level radiation exposure: time for achange? J. Radiol. Prot. 19: 107-115.
ICRP, 1991. 1990 Recommendations ofthe International Commission onRadiological Protection. Oxford: Pergamon Press; ICRP Publication 60;Ann. ICRP 21(1-3).
ICRP, 2001. A report on progress towards new recommendations: Acommunication from the International Commission on Radiolog-ical Protection. J. Radiol. Prot. 21: 113-123.
UNSCEAR, 1993. Sources and Effects of Ionizing Radiation. 1993Report to the General Assembly, with scientific annexes. UnitedNations, New York.
UNSCEAR, 2000a. Sources and Effects of Ionizing Radiation. 2000Report to the General Assembly, with scientific annexes. Volume I:Sources. United Nations, New York.
UNSCEAR, 2000b. Sources and Effects of Ionizing Radiation. 2000Report to the General Assembly, with scientific annexes. VolumeII: Effects. United Nations, New York.
24

Application of airborne radiometric surveys in the mapping of areas with high natural
or anthropogenic ionizing radiation
P. Schmidt-Thomé, M. Lahti and G. Gaál
Geological Survey of FinlandP.O. Box 96, FIN-02151 Espoo, FinlandE-mail: [email protected]
Abstract
This paper presents results of an airborne gamma-ray survey over a uranium-mining dis-
trict in Southeast Germany. The AERA project (Assessment of Environmental Risks by
Airborne Geophysical Techniques validated by geophysical field measurements) was
conducted as a part of an EC funded environmental research project in the 4th framework
programme. The Geological Survey of Finland conducted the airborne measurements
with three different geophysical methods in August-September 1999. The results show
that the gamma-ray method mapped effectively the environmental impacts of uranium
mining. Radiometric data revealed new information of known contaminated sites, but
also indicated previously unknown contaminations. Areas that show increased radiation
caused by e.g. uranium mining, transport and processing are presented on thematic maps.
The increased uranium concentrations and the background levels are validated and cali-
brated by soil sampling.
Introduction
The AERA project is a pioneer project that combines airborne multisensorsurveys to assess environmental risks, which are later followed up by geo-physical ground checks at selected sites. The Geological Survey of Finland(GTK) coordinated the project. The GTK multisensor technique includessimultaneous measurements with magnetic, gamma ray and dual frequencyelectromagnetic systems. The GTK has 50 years of experience in aerogeo-physical geological mapping and ore prospecting and has now applied thisknowledge for the first time to survey environmental contaminations. Thetest site of the AERA project is located in Zwickau in Saxony, SoutheastGermany. The survey area was selected because heavy mining and industri-
25

al activities have taken place in the region over the last centuries. Some ofthese activities have caused considerable environmental impacts, all ofwhich are well examined and documented. The environmental impactscomprise uranium, black coal and nickel mining as well as industrial andmilitary activities including deposition of various types of waste.
Uranium mining in Eastern Germany
Right after World War II, the Soviet Union started exploration and miningof uranium in the Ore Mountains in Saxony and Thuringia. East Germanysoon became the third largest uranium producer in the world; a total amountof 231 000 t of uranium was produced during 1946-1991. The mining wasconducted both underground and in open pits. The ventilation of the minesoften resulted in atmospheric transport of radon and other contaminants toresidential and agricultural areas. Pumped groundwater from the mines wasoften released directly to rivers and creeks. According to Diehl (2000) thesediments of the rivers in the Ronneburg area show concentrations of urani-um and radium over natural background values. The region has a thousandyear long history of mining activities. Many old mines and tunnels providepathways for radon transport from bedrock to residential areas.
The decommissioning comprises refilling of the open pits with wasterock from the surrounding stockpiles. The underground mines are also de-commissioned and flooded. The uranium ore was processed mainly in twoplants, one in Zwickau and one in Ronneburg. The tailings were depositedin large ponds close to the plants. The remediation of the tailing ponds com-prises dehydrating and covering with geo-textiles and clean soil. The seep-age waters are collected and treated.
Airborne gamma-ray measurements
Gamma-ray measurements have primarily been developed for uranium ex-ploration purposes. Nowadays the method is mainly applied for geologicalmapping and exploration of other types of economic minerals. Gamma-raymeasurements may also be applied in environmental monitoring such asmapping of radioactive contamination from fallout of nuclear accidents andplumes from power plants (Grasty, 1998). Such measurements indicatevariations in the radioactivity of 0.5-1.0 metres thick surface layers of theearth. The results are presented as total radiation and equivalent concentra-tions of uranium, thorium and potassium. It is also possible to determine theamount of anthropogenic radioactivity from the radiation spectrum (Grasty& Multala, 1991).
26

The measurements were conducted with a Cessna Caravan I aircraft. Theradiation measuring equipment is a gamma-ray spectrometer that consistsof 5 NaI crystals. The crystal package installed in the Cessna Caravan has atotal volume of 20.5 litres, the spectrometer records 256 channels of spec-tral data in the range of 0.01-3.0 MeV. Three additional windows recordgamma rays of K40, Bi214 from the uranium decay series and Tl208 from thethorium decay series. The overall radioactivity level is recorded with a totalcount window. The registrations are done once per second, which leads to asampling distance of 50-60 m at a flying speed of 180 km/h. The flying al-titude in this project was 100 feet.
Results of the airborne the gamma-ray survey
Results of the gamma-ray measurements are plotted as maps of total radiationas well as concentrations of uranium, thorium and potassium. The total countand uranium maps show the impacts of uranium mining. The uranium map inFigure 1 indicates the uranium waste deposits (stockpiles in Ronneburg andSchlema and tailing ponds Culmitzsch, Trünzig and Helmsdorf) as well asyellow cake process plants (Crossen, Seelingstädt). Also the overbanks ofZwickauer Mulde River show a clear uranium anomaly. Maps of potassiumand thorium concentrations provide information of geological features, butthe potassium map apparently also indicates effects of fertilizing.
The measured radiation total counts were converted to radiation doserates (Figure 2.). The results were compared to Wismut’s monitoring datafrom 1993. The conversion of gamma ray measurements to biological doserates is based on a mathematical model.
Validating and calibrating airborne data with soil sampling
Compared with airborne measurements, systematic soil sampling andground surveying are slow and expensive methods. Especially the identifi-cation of scattered unknown contaminated spots in large areas by groundsurveying is very costly. Airborne gamma-ray measurements are a fast andreliable way of surveying and monitoring radioactive elements. The gam-ma-ray measurements provide reliable data for uranium, thorium and potas-sium concentrations in the top decimetres of the earth. One objective of theAERA-project was to assess the accuracy of the airborne gamma-ray mea-surements. Topsoil samples were collected from sites with interesting air-borne anomalies and from suitable background reference sites. The sam-pling sites comprised flooded banks of the river Zwickauer Mulde, agricul-tural fields and black coal stockpiles in Oelsnitz.
27

The overbanks of the Zwickauer Mulde river show a clear uraniumanomaly, which can be traced throughout the whole test area. The anomalystrength increases near Crossen, a former process plant in Zwickau. Theuranium anomaly is stronger in the flood plains than in the riverbed itselfbecause the radioactive particles have been transported during floods anddeposited at the overbanks. Samples were collected both from the sedi-ments of the active channels and from the banks. The uranium contents ofthese samples vary between 7 and 66 mg/kg. The readings in airborne ura-nium data are 10-18 mg/kg). The airborne measurements apparently under-estimate high uranium concentrations, because the calibration is normallyperformed over a homogeneous half space. Anomalies will show up aspeaks superimposed on the background reading.
28
10 km
ZWICKAUERMULDE RIVER
N
M1: Mulde 1 (N=5) 34 mgU/kgM2: Mulde 2 (N=4) 25 "O1: Oels 1 (N=3) 65 "O2: Oels 2 (N=2) 4 "Z: Zwick (N=6) 5 "
Figure 1. Results of an air-borne gamma-ray survey in Zwickau, Saxony, Germany.The mean uranium contents (mgU/kg) inN samples of surface overbank sedimentsare given at selected spots indicated bycircles.
Figure 2. Dose rates (Gy/h) estimatedfrom airborne measurements of totalgamma-ray counts. Doses above back-ground occur in 40 % of the area, half ofwhich has natural geological factors asthe underlying cause. The highest doseswere found near process plants, tailingponds and stockpiles. 1% of the area hastoo high doses for urbanization.

The potassium map (not shown here) displays an anomaly on farmedfields southwest of Zwickau. The equivalent potassium concentrations hereare some 50 % higher than those from other agricultural areas. Samples oftopsoil were collected in order to validate this anomaly. The samples fromthe anomalous fields south of Zwickau show potassium concentrations of25,900 – 43,400 mg/kg while the reference samples contain 13,600 –23,600 mg/kg. The concentration of phosphorous was 1,130 – 3,710 mg/kgfor Zwickau samples and 688 –1,140 mg/kg for reference samples. This isinterpreted as an effect of more intensive use of fertilizers in the fields nearZwickau than in the reference fields. The determined concentrations matchvery well with the readings of airborne potassium data. The airborne read-ings of the higher concentrations in Zwickau are 25, 000 – 43, 000 mg/kg.
In Oelsnitz, black coal mining has taken place during centuries, andstockpiles with waste rock are located around the town. One stockpile dif-fers from the others showing high uranium values in the airborne measure-ments. Soil samples taken from this stockpile produced 76-168 mgU/kg,while other stockpiles showed 3-4 mg/kg. Values from the airborne mea-surements are, respectively, 17 – 51 mg/kg and 2 – 4 mg/kg. In other words,the low values match very well, while airborne measurements underesti-mate the high values.
Hazards for uranium miners and residents
Uranium mining and milling have many environmental impacts. Stock-piles, tailings and other waste deposits may contaminate the environmentby release of radium, radon, uranium and other heavy metals, which are ina more mobile form than originally in the bedrock. Chemicals used in en-richment processes and oxidation products such as sulphuric acid may alsocause serious contamination.
In early years of uranium mining, the health precautions were poor andworkers were exposed to high doses of ionizing radiation due to inhalationof radioactive dusts and radon gas. According to Diehl (2000), the radonconcentrations in Wismut’s mines were typically 100 000 Bq/m3, withpeaks of even 1.5 million Bq/m3. In the 1970’s the health protection wasimproved including a reduction of radiation dose rates to tolerable levels.
Analysis of health data in the East German uranium mining areas showedsignificantly increased lung cancer incidence rates for men. In cities locatedvery close to mines, increased lung cancer risks were also found forwomen. For example, in the population of the Thuringian uranium miningdistrict the lung cancer risk is estimated to be 15 per 1000.
Waste rock from uranium mining was in many cases used for road andrailroad construction, thereby dispersing radioactive material over large ar-
29

eas. The Saxonian Hartsteinwerke Oelsnitz have, for example, processed7.58 million tonnes material with uranium concentrations of up to 100 g pertonne. Baukombinat Zwickau used 14.4 million tonnes of wastes from theCrossen uranium mill for road construction. This material had uraniumconcentrations up to 150 g per tonne and radium contents up to 1.3 Bq/g.
The AERA project could clearly identify some of the areas were tailingscontaining uranium were used for construction purposes. The most interest-ing is a former military site where the contamination found by the AERAproject has lead to postponing the planning of new settlements.
Tailings from uranium mining have also been used for construction pur-poses in other countries. In the US such tailings were used for foundationsof homes, resulting in high indoor radon exposures and increased lung can-cer risks. In Eastern Siberia, tailings sands from a uranium mine at Baley(Chita region) were used for the construction of apartment buildings andkindergartens. Radon concentrations in these buildings exceed the 200Bq/m3 standard up to 37-fold (Diehl, 2000).
Conclusion
Airborne gamma ray measurements provide a good method for quick sur-veys of small and large areas with natural ionizing radiation or radioactivecontaminations. The method is also useful for monitoring remediationworks. Radioactive background levels are measured with a high precision.Soil sampling for calibration purposes is required in areas with higher con-taminations because the airborne measurement system tends to underesti-mate high radiation values from small spots.
REFERENCES
Diehl, Peter 2000. Uranium mining in Eastern Germany: The WISMUTLegacy, available at http://www.antenna.nl/wise/uranium/uwis.html(15.12. 2000).
Federal Ministry of Economics and Technology, Public Relations Division.Wismut, An ecological challenge, Berlin 2000.
Federal Ministry of Economics, Documentation No. 370, Wismut, Progressin Decommissioning and Rehabilitation, Köln 1995.
Federal Ministry of Economics, Documentation No. 335, Wismut, State ofDecommissioning and Remediation, Bonn 1993.
Grasty, R.L. 1998. Airborne gamma-ray spectrometer surveying. AirborneGeophysics, I.A.G.E. Week-end course, 16th&17th May, 1998 at GalwayBay Golf & Country Club Hotel, Oranmore, Ireland.
30

Grasty, R.L. and Multala, J. 1991. A correlation technique for separatingnatural and man-made airborne gamma-ray spectra. In: Current Re-search, Part D, Geological Survey of Canada, Paper 90-1D, p. 111-116.
Rangelov, R.; Hetu, R.; Grant, J.A. and Grasty, R.L. 1990. MonitoringMan-made radiation by airborne gamma-ray spectrometry, Kozloduyarea, Bulgaria. Geological Survey of Canada, Department of Energy,mines and resources.
31

Radon in potable groundwater:examples from Norway
B. Frengstad1,2, A. K. Skrede3, J. R. Krog2,T. Strand4, B. Lind5 andD. Banks6
1 Department of Geology and Mineral Resources Engineering, NorwegianUniversity of Science and Technology, N-7491 Trondheim, Norway.
2 Geological Survey of Norway, N-7491 Trondheim, Norway. 3 NorwegianWater Resources and Energy Directorate, P.O. Box 5091, Majorstua,
N-0301 Oslo, Norway. 4 The Norwegian Radiation Protection Authority,P.O. Box 55, N-1345 Østerås, Norway. 5 The Norwegian Radiation Protection Authority, Polar Environmental Centre, N-9296 Tromsø,
Norway. 6 Holymoor Consultancy, 86 Holymoor Road, Holymoorside,Chesterfield, Derbyshire, S42 7DX, United Kingdom.
E-mail: [email protected]
Abstract
Radon in potable groundwater contributes to radon concentrations in indoor air when de-
gassed and may also have a health impact when ingested. During the 1990s, several surveys
of radon concentrations in Norwegian groundwater have been carried out, including a na-
tionwide study by the Norwegian Radiation Protection Authority and the Geological Sur-
vey of Norway. 222 of 1601 (13.9 %) investigated boreholes in Precambrian and Palaeo-
zoic crystalline bedrock yielded water with radon concentrations in excess of the recom-
mended action level of 500 Bq/l. The highest levels are usually found in granites (up to 20
000 Bq/l), but concentrations vary considerably between boreholes within each lithology.
Groundwater in superficial Quaternary sediments typically has radon concentrations well
below the recommended action level. Several effective methods exist for removal of radon
from water.
Introduction: Radon in Groundwater
Radon is a naturally occurring radioactive gas. As a member of Group VIIIof the periodic table, it is essentially chemically inert. It occurs as three nat-ural isotopes (see Table 1), derived from three different radioactive decaychains, commencing with 238U, 232Th and 235U. Of the three radon isotopes,222Rn is that most commonly discussed in the context of health risks (and isreferred to hereafter simply as «radon»). This isotope has a half-life of 3.8
32

33
Fig. 1. Apparatus for the preparation of curative drinking water for homes and hos-pitals. Advertisement from the 1920s.
days, and can thus persist long enough in water and household air to pose ahealth risk. 220Rn (thoron) has a much shorter half-life and is commonly re-garded as less problematic. However, in some situations (e.g. enclosedspaces in permeable thorium-rich rocks, especially e.g. buildings with in-door wells), thoron can conceivably also be a health issue.
Table 1. Half-lives of the three natural isotopes of Radon.
Isotope Common name Half-life Decay chain commencing with
222Rn Radon 3.8 days 238U220Rn Thoron 54.5 seconds 232Th219Rn Actinon 3.92 seconds 235U
Radon is important in the context of potable groundwater, because the ele-ments thorium and uranium are abundant in some groundwater-bearingrocks, such as granites (e.g. arithmetic mean values of 50.2 ppm and 9.9ppm respectively in the Norwegian Iddefjord granite (Killeen and Heier,1975)), and also because radon has a high solubility in water. As with mostgases, solubility decreases with increasing temperature (51 vol. % at 0°Cand 13 vol. % at 60°C).
Although, today, exposure to radon is associated with health risks (e.g.lung cancer), the element was not always perceived thus. Radon was, not solong ago, considered a desirable, «invigorating» component of mineral wa-ters and spas. For example, the spa at Badgastein in Austria was (and stillis) famed for its natural radon-containing mineral waters (at concentrationsof up to 3990 Bq/l). At Bath Spa, in England, a funnel-shaped «inhalitori-um» was constructed above the mineral water springs so that patients (as re-cently as the mid-20th Century) could breath in the degassed radon from thewater. It was even possible to purchase domestic radonating kits, whereby aradium mineral would release a supplementary dose of radon to domesticdrinking water (Albu et al. 1997, see Fig. 1).
Sources of Radon in Groundwater
It might be supposed that radon in groundwater could be derived from twodifferent sources:
(i) radioactive decay of dissolved radium (the immediate precursor toradon in the decay chain).
34

(ii) direct release of radon from the mineral matrix from minerals contain-ing members of the uranium/thorium decay series.
In fact, in most waters, concentrations of radon are far in excess of thosethat one would expect from mere equilibrium decay of dissolved radium (arather insoluble element). It is thus believed that radon in groundwater isdominantly derived from mineral sources in aquifer grains or wall rock offractures. Concentrations of radon in groundwater thus largely depend onsix factors (Nelson et al. 1983, Michel 1990, Ball et al. 1991, Albu et al.1997):
(i) hydrodynamic factors (e.g. whether groundwater is flowing slowlyenough to approach an equilibrium between mineral and dissolvedphases)
(ii) geometric factors. Equilibrium radon concentrations are believed to beinversely proportional to the aperture of a groundwater-bearing frac-ture.
(iii) the uranium (or strictly speaking, the radium) content of the aquiferhost rock (or fracture mineralisation)
(iv) the mineralogy of the phases containing the radium and uranium(v) possibilities for degassing of radon prior to point of abstraction.(vi) concentrations of dissolved radium in groundwater
Figure 2 shows the correlation between dissolved radon and dissolved ura-
35
1 10 100
1000
1000
0
1e-007
1e-006
1e-005
0.0001
0.001
0.01
0.1
1
10
Rn
U
(Bq/l)
(mg/
l) n=476
Fig. 2. X-Y plot of radon versus uranium concentrations in Norwegian bedrockgroundwater (From Frengstad et al., 2000). Note the log scales.

nium in Norwegian bedrock groundwater. The correlation is not due to dis-solved uranium decaying to release radon gas. Rather, both parameters areultimately derived from the same uranium-bearing minerals in the aquifermatrix. In other words, uranium-rich granites will often contain groundwa-ter with both high levels of dissolved uranium and dissolved radon.
Exposure Mechanisms
The most obvious pathway for exposure to radon in groundwater is by in-gestion (drinking). Some studies have indicated a possible link betweenradon in water and gastric cancer (Mose et al. 1990), although this has yetto be conclusively proven. Swedjemark (1993) has estimated doses derivedfrom radon in drinking water and believes that the dose from the ingestionpathway is most significant in young children (Table 2).
Table 2. The effective radiation dose from radon in household water.The proportion of the dose derived from aerated (and inhaled) radon iscompared with the proportion derived from digestion of the water forinfants, children and adults. Total dose should not exceed 1 mSv pr.year on a life-time average. Source: Swedjemark (1993).
Radon in Target Group Inhalation dose Ingestion dose Sum dosewater [Bq/l] [mSv/year] [mSv/year] [mSv/year]
100 Infants 1 year 0,4 0,7 1,1Children 10 years 0,4 0,15 0,55Adults 0,4 0,05 0,45
1000 Infants 1 year 4 7 11Children 10 years 4 1,5 5,5Adults 4 0,5 4,5
When radon-rich groundwater enters a home, there is also potential for de-gassing of radon from water to household air, especially as the water heatsup and the radon becomes less soluble. In particular, radon is degassed ex-tremely effectively in household appliances such as dish-washing machinesand shower units. Figure 3 indicates that, on turning on a shower (whichutilises radon-rich groundwater), concentrations of radon in the air increasevery rapidly. After the shower has been turned off, radon concentrations inair fall only slowly and persist above recommended maximum levels for along time.
The Norwegian Radiation Protection Authority has recommended an ac-tion level of 500 Bq/l for radon in domestic water, and 200 Bq/m3 in house-hold air (NRPA, 1995).
36

Surveys in Norway
Probably the earliest investigations of radon in Norwegian groundwaterwere carried out by Staw et al. (1989) and Strand & Lind (1992). This wasfollowed by the Geological Survey’s pilot project in 1992-93 where around30 water samples were collected from wells in south-eastern Norway andTrøndelag (Banks et al. 1995a,b). In this study the Iddefjord Granite aquiferwas demonstrated to contain a number of boreholes yielding water with dis-turbingly high radon concentrations. A larger (150 samples) project contin-ued this work in the counties of Hordaland and Vestfold, again demonstrat-ing that radon can be a problem-parameter in Norwegian crystallinebedrock groundwater (Reimann et al. 1996, Morland et al. 1997). Samplingof wells in Quaternary superficial deposits (sands, gravels, tills – see below)was published by Morland et al. (1998). During the period 1996-1999, theGeological Survey of Norway supported the national groundwater qualitymapping project, SPAGBIFF (Systematisk Prøvetaking Av Grunnvanns-Brønner i Fast Fjell), where radon was one of the parameters determined(by the Norwegian Radiation Protection Agency, NRPA). During this pro-ject, some 1600 quality-controlled samples of water from boreholes/wells/
37
Fig. 3. Effect of Rn-containing shower water (4200 Bq Rn/l) on the concentration ofRn in the bathroom air. (After Strand and Lind, 1992).

springs in crystalline bedrock were analysed, together with 72 samples ofgroundwater from Quaternary superficial deposits. Results of SPAGBIFFare published by Banks et al. (1998a,b, 2000) and Frengstad et al. (2000,2001). NRPA continued to receive groundwater samples and a total ofabout 3500 samples have been analysed for radon (Strand et al., 1998).
Radon in Groundwater in Superficial Deposits
Studies by Morland et al. (1998) and Banks et al. (1998b) have involvedsampling and analysis of groundwaters from wells and boreholes in Quater-nary superficial deposits (loose sands, gravels, tills etc.) in Norway. Theseaquifers are important because they support high-yielding wells and formthe basis for many of Norway’s largest public groundwater works.
Although the authors of these studies were able to identify a tentativecorrelation between radon concentrations in groundwater and the composi-tion of the underlying crystalline bedrock, the concentrations were typical-ly significantly below the recommended action level of 500 Bq/l (Fig. 4).
38
0.1
1
10
100
1000
10000#31 #2 #10 #56 #265 #11 No. of
samples
1 2 3 4 5 6
Rado
n (B
q/l)
Fig. 4. Boxplots for concentrations of radon in water. (1) Ground water from Qua-ternary deposits. (waterworks supplying >1000 persons), (2) groundwater fromcrystalline bedrock (waterworks supplying >1000 persons). (3-6) Groundwaterfrom boreholes in crystalline bedrock in the counties of (3) Trøndelag, (4) Horda-land, (5) Vestfold, and (6) Østfold (Iddefjord granite). Data from Reimann et al.(1996), Morland et al. (1997, 1998), Banks et al. (2000). For an explanation of theBoxplot, see Appendix A.

It is thus, in a Norwegian context, groundwater from crystalline bedrockthat poses a potential radon health risk, rather than groundwater from su-perficial deposits. The reason for this is probably that intensive chemicaland mechanical weathering have removed most of the uranium-containingminerals from Quaternary sands and gravels (which are overwhelminglydominated by quartz clasts), while in the glacially scoured, fresh bedrock,uranium mineralisation persists.
Radon in Groundwater in Crystalline Bedrock – LithologicalDependence
During the aforementioned SPAGBIFF study (Banks et al. 1998a), the dis-tribution of radon concentrations in 1601 sampled crystalline bedrockgroundwaters was plotted on cumulative frequency diagrams. The diagramsindicate a highly skewed (supposedly log-normal) distribution, the bulk ofthe samples having modest radon concentrations but with a significantnumber of high outliers (up to 20,000 Bq/l). Some 13.9 % of the samplesexceed the recommended action level of 500 Bq/l (Figure 5).
When the data set was split into different lithological units, clear differ-
39
1 10 100
1000
1000
0
1000
00
0.010.1
2102550759098
99.999.99
Freq
uenc
y [%
]
Rock-corr Quat-corr Granite Anorthosite
Radon [Bq/l]
Fig. 5. Cumulative frequency distribution diagram for radon.❑ the Rock-corr (n=1601) data set of groundwater from crystalline bedrock bore-
holes,■ the Quat-corr (n=72) data set of Quaternary sedimentary groundwater,+ Precambrian granites (n=76, subset of Rock-corr) and ▲ Precambrian anorthosites (n=34, subset of Rock-corr).
The arrow on the diagram show the Norwegian recommended action level for Rnin potable water (500 Bq/l).

ences began to emerge. While, for each individual lithology, one could stillfind a wide range of values, exhibiting a heavily skewed pattern on the cu-mulative frequency distribution curve, the position of the curve differs be-tween differing lithologies. For example, the anorthosites of the Egersundarea exhibit a median radon concentration of < 10 Bq/l, whilst the Iddefjordgranite of south-eastern Norway has a median of some 700 Bq/l.
Because of the range of values present in each lithology (depending, pre-sumably, largely on local hydrodynamic and mineralogical factors), it is notpossible to predict that a specific well drilled in a particular formation willnot have a problem with radon, nor is it possible to state that all wells in, forexample, the Iddefjord granite will have a problem. It is, however, possibleto predict the probability of a given lithology giving rise to a potential prob-lem. For example, in the Iddefjord Granite, we can say (on the basis ofSPAGBIFF data) that there is a 70 % chance that a well will yield water ex-ceeding the recommended action level of 500 Bq/l radon.
Time-Dependence of Radon Concentrations
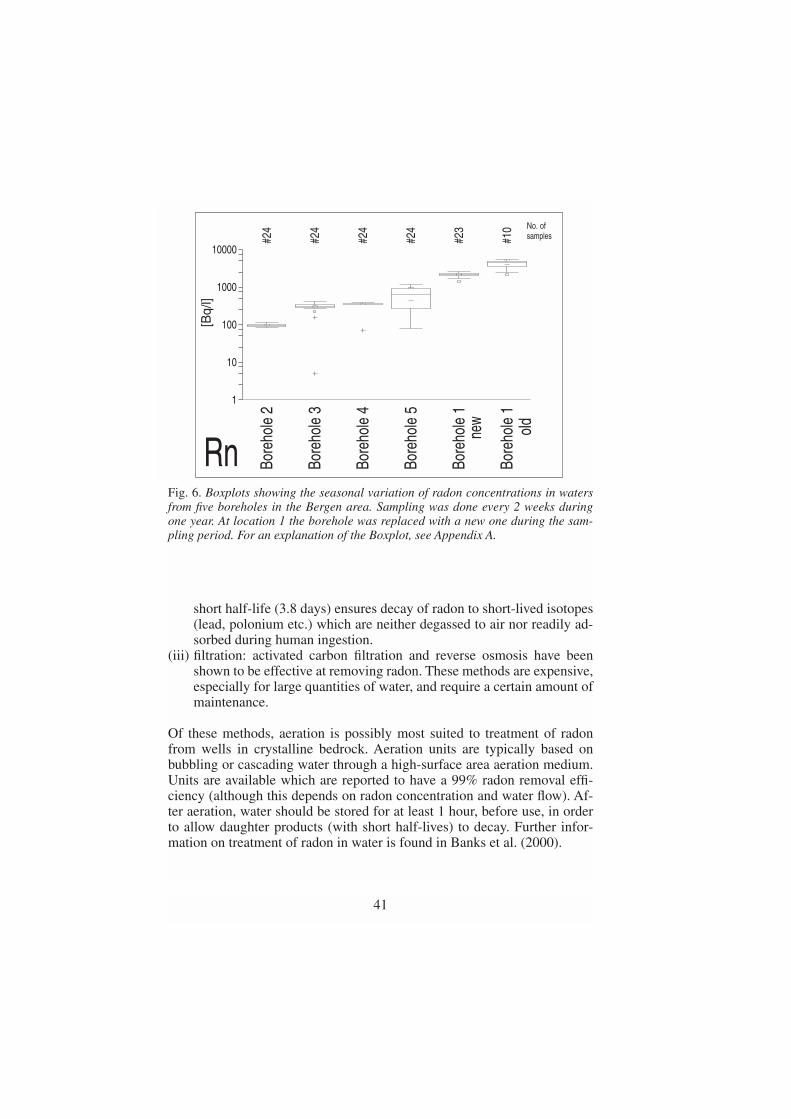
In 1999, five boreholes in crystalline bedrock in the Bergen area of Norwaywere sampled every two weeks, throughout a period of one year, to deter-mine the time-variability of radon concentrations in groundwater (Nilssen,2001). The five selected boreholes span a range of radon concentrationsfrom modest (<100 Bq/l) to high (c. 5000 Bq/l). Results are shown in Fig-ure 6. It will be noted that radon concentrations in four of the boreholes aresurprisingly stable. In borehole 5, they are subject to major fluctuations cor-relating with rainfall events. Close inspection of the borehole revealed that,during strong rain, surface run-off water is running directly into the bore-hole, diluting the radon-containing groundwater.
It is naturally difficult to draw general conclusions from this study, butone might expect unstable radon concentrations in boreholes whose waterhas a low residence time compared with the half-life of radon.
Removal of Radon in Potable Groundwater
There exist a number of methods for treating radon-containing water, ofwhich several are reported to have a removal efficiency of over 95%. Themethods are essentially based on one (or a combination) of the following:
(i) aeration: to remove radon from water to the gas phase prior to entry tothe household
(ii) storage: a storage period which is significant in comparison to radon’s
40
short half-life (3.8 days) ensures decay of radon to short-lived isotopes(lead, polonium etc.) which are neither degassed to air nor readily ad-sorbed during human ingestion.
(iii) filtration: activated carbon filtration and reverse osmosis have beenshown to be effective at removing radon. These methods are expensive,especially for large quantities of water, and require a certain amount ofmaintenance.
Of these methods, aeration is possibly most suited to treatment of radonfrom wells in crystalline bedrock. Aeration units are typically based onbubbling or cascading water through a high-surface area aeration medium.Units are available which are reported to have a 99% radon removal effi-ciency (although this depends on radon concentration and water flow). Af-ter aeration, water should be stored for at least 1 hour, before use, in orderto allow daughter products (with short half-lives) to decay. Further infor-mation on treatment of radon in water is found in Banks et al. (2000).
41
1
10
100
1000
10000
#24
Bore
hole
2
#24
Bore
hole
3
#24
Bore
hole
4
#24
Bore
hole
5
#23
Bore
hole
1
#10
Bore
hole
1
Rn
[Bq/
l]No. ofsamples
new
old
Fig. 6. Boxplots showing the seasonal variation of radon concentrations in watersfrom five boreholes in the Bergen area. Sampling was done every 2 weeks duringone year. At location 1 the borehole was replaced with a new one during the sam-pling period. For an explanation of the Boxplot, see Appendix A.

Conclusions
Radon in drinking water may give doses of concern by ingestion, especial-ly in young children. Through showers and washing machines, radon inhousehold water is also released to the indoor air, which may subsequentlybe inhaled.
Radon is ubiquitous in Norwegian crystalline bedrock groundwaters.The radon concentrations vary significantly between boreholes in the samelithology, possibly largely due to hydrodynamic factors. The highest levelsof radon in groundwater are found in uranium-rich granites, but high levelsare found in most other lithologies as well. Precambrian anorthosites is theonly investigated lithological group where the probability of finding radonconcentrations above the recommended action level is almost nil. We thusrecommend that every household, whose potable water is derived frombedrock aquifers, requisition a water analysis.
Surveys of groundwater from Quaternary sand and gravel deposits revealthat radon is not a major problem in these aquifers. It is such aquifers whichsupport the majority of larger public groundwater supply works in Norway.
An investigation of 5 boreholes in the Bergen area suggests that radonconcentrations in bedrock groundwater are rather stable through the year.However, in cases where water residence times are low, some degree offluctuation might be expected.
There exist several methods for removing radon from water, of which acombination of aeration and subsequent short storage seems to be the mostefficient.
Appendix A
The boxplot provides a graphical data summary where median, quartiles,spread, and data outliers are displayed. The box contains the mid 50 % ofall data where the median value is marked with a line that divides the box.The brackets above and below this line denote a robust 95 % confidence in-terval on the median. The upper and lower ends of the box (called «hinges»)represent the 75 % quartile and the 25 % quartile, respectively. Lines(called «whiskers») are drawn from the ends of the box towards the maxi-mum and minimum values, respectively, each containing about 25 % of alldata. The whiskers extend up to 1.5 times the length of the box and outlyingdata points are plotted as crosses (near outliers) and squares (far outliers).Boxplot is a useful presentation technique for comparison of differentdatasets and for revealing skewness of the distribution and outlying datapoints.
42

REFERENCES
Albu M, Banks D and Nash H 1997. Mineral and Thermal GroundwaterResources. Chapman and Hall, London, 447 pp.
Ball TK, Cameron DG, Colman TB and Roberts PD 1991. Behaviour ofradon in the geological environment: a review. Quarterly Journal of En-gineering Geology (London), 24: 169-182.
Banks D, Røyset O, Strand T and Skarphagen H 1995a. Radioelement (U,Th, Rn) concentrations in Norwegian bedrock groundwaters. Environ-mental Geology, 25: 165-180.
Banks D, Reimann C, Røyset O, Skarphagen H and Sæther OM 1995b.Natural concentrations of major and trace elements in some Norwegianbedrock groundwaters. Applied Geochemistry, 10: 1-16.
Banks D, Frengstad B, Midtgård AK, Krog JR and Strand T 1998a. Thechemistry of Norwegian groundwaters. I. The distribution of radon, ma-jor and minor elements in 1604 crystalline bedrock groundwaters. Sci-ence of the Total Environment, 222: 71-91.
Banks D, Midtgård AK, Frengstad B, Krog JR and Strand T 1998b.The chemistry of Norwegian groundwaters. II. The chemistry of72 groundwaters from Quaternary sedimentary aquifers. Scienceof the Total Environment, 222: 93-105.
Banks D, Frengstad B, Midtgård AK, Krog JR, Strand T, Siewers Uand Lind B 2000. Grunnvann–ikke bare vann [Groundwater – notjust water – in Norwegian]. Gråsteinen 6, Trondheim, 60 pp.
Frengstad B, Skrede AKM, Banks D, Krog JR and Siewers U2000.The chemistry of Norwegian groundwaters: III. The distrib-ution of trace elements in 476 crystalline bedrock groundwaters,as analysed by ICP-MS techniques. Science of the Total Environ-ment, 246: 21-40.
Frengstad B, Banks D and Siewers J 2001. The Chemistry of Nor-wegian Groundwaters: IV. The pH-dependence of element con-centrations in crystalline bedrock groundwaters. Science of theTotal Environment, 277:101-117.
Killeen PG and Heier KS 1974. A uranium and thorium enrichedprovince of the Fennoscandian shield in southern Norway.Geochimica et Cosmochimica Acta, 39: 1515-1524.
Michel J 1990. Relationship of radium and radon with geologicalformations. In C.R. Cothern and P. Rebers (Editors) Radon, Radi-um and Uranium in Drinking Water. Lewis Publishers, Chelsea,Michigan, 1-16.
Morland G, Reimann C, Strand T, Skarphagen H, Banks D, Bjorvatn K,Hall GEM and Siewers U 1997. The hydrogeochemistry of Norwegianbedrock groundwater – selected parameters (pH, F-, Rn, U, Th, B, Na,
43

Ca) in samples from Vestfold and Hordaland, Norway. Norges geolo-giske undersøkelse Bulletin, 432: 103-117.
Morland G, Strand T, Furuhaug L, Skarphagen H and Banks D 1998.Radon concentrations in groundwater from Quaternary sedimen-tary aquifers in relation to underlying bedrock geology. GroundWater, 36 (7): 143-146.
Mose DG, Mushrush GW and Chrosniak C 1990. Indoor radon and wellwater radon in Virginia and Maryland. Archives of Environmental Cont-aminant Toxicology, 19: 952-956.
Nelson PH, Rachiele R and Smith A 1983. Transport of radon in flowingboreholes at Stripa, Sweden. Journal of Geophysical Research, 88(B3):2395-2405.
Nilssen RSA 2001. Radon i grunnvann fra borebrønner i fjell. Jevnligemålinger fra fem lokaliteter i Bergen og Os. (In Norwegian). Radon ingroundwater from bedrock boreholes. Regular measurements from fivelocalities in Bergen and Os. Thesis, Department of Geology, Universityof Bergen, 92pp
Norwegian Radiation Protection Authority 1995. Anbefalte tiltaksnivåer forradon I bo- og arbeidsmiljø. (In Norwegian). Recommended action lev-els for radon in the home and work-place. Statens strålevern, Østerås,Norway Brochure no. 5
Reimann C, Hall GEM, Siewers U, Bjorvatn K, Morland G, Skarphagen Hand Strand, T 1996. Radon, fluoride and 62 elements as determined byICP-MS in 145 Norwegian hard rock groundwater samples. Science ofthe Total Environment, 192: 1-19.
Staw J 1989. Måling av radon 222 i grunnvann: Borebrønner i fjell i Nord-Trøndelag [Measurements of radon 222 in groundwater: Drilled wells inhardrock in Nord Trøndelag county, Norway – in Norwegian]. Norgesgeologiske undersøkelse Report 89.094.
Strand T and Lind B 1992. Radon in tap water from drilled wells in Nor-way. Proceedings. International Symposium on Radon and Radon Re-duction Technology, 22-25/9/92, Minneapolis, USA.
Strand T, Lind B and Thommesen G 1998. Naturlig radioaktivitet i hush-oldningsvann fra borebrønner i Norge [Natural radioactivity in potablewater from drilled wells in Norway – In Norwegian] Norsk Veterinær-tidsskrift, 110(10): 662-665.
Swedjemark GA 1993. Radon och radium i vatten. Underlag för bestäm-melser. [Radon and radium in water. Basis for regulations – in Swedish].Swedish Radiation Protection Institute report, 93-34, Stockholm, 10 pp.
44

High indoor radon concentrations at some Swedish waterworks
G. Åkerblom,.1, N. Hagberg.1, L. Mjönes1 and A. Heiberg, A.2
1Swedish Radiation Protection Authority, SE-171 16 Stockholm, Sweden2Norwegian Radiation Protection Authority, P.O. Box 55, N-2345 Österås,
NorwayE-post: [email protected]
Abstract
High indoor radon concentrations are rather common in buildings used for water treat-
ment. When raw water is processed in an open system, radon escapes from the water to
the indoor air of the buildings. The staff of the waterworks often have their offices in the
building where the water is processed. If large volumes of water are processed, evaporat-
ed radon may reach the workplaces. Indoor radon concentration may in this way be very
high, even if the radon concentration of the raw water is moderate. Groundwaters from
aquifers in bedrock and soil as well as surface water that have been infiltrated through
deposits of sand or gravel, may cause high indoor radon levels. However, in surface wa-
ter taken directly from lakes or rivers the radon concentrations are too low to cause prob-
lems. Three waterworks in central Sweden have been studied, Ludvika, Fredriksberg and
Kolbäck. The radon concentrations in the raw water of these waterworks range from 85
Bq/l to 300 Bq/l. Average indoor radon concentrations exceeding 17,000 Bq/m3 have
been found in the waterworks at Ludvika with peaks of almost 37,000 Bq/m3. In Kol-
bäck, radon concentrations up to 56,000 Bq/m3 have been detected. It is quite possible
that employees at waterworks can receive doses exceeding 20 mSv per year (calculated
according to the ICRP dose conversion convention). The paper reports data for radon and
gamma radiation at the waterworks and discusses methods for reducing the indoor radon
concentrations.
Introduction
At waterworks, large volumes of water are usually treated. The water isnormally aired, often in open systems, and chloride and other chemicals areadded. Radon dissolved in the water is inevitably released to the indoor airof the waterworks.
In Sweden, about 50 per cent of the drinking water is surface water, 25
45
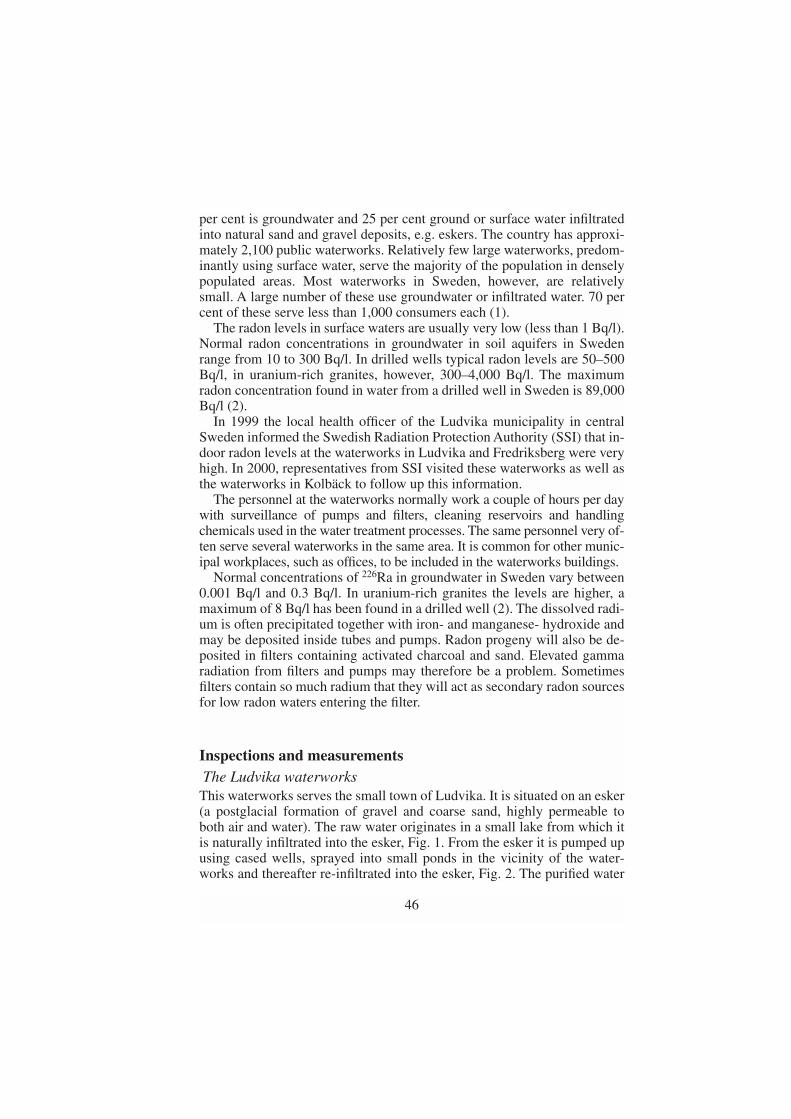
per cent is groundwater and 25 per cent ground or surface water infiltratedinto natural sand and gravel deposits, e.g. eskers. The country has approxi-mately 2,100 public waterworks. Relatively few large waterworks, predom-inantly using surface water, serve the majority of the population in denselypopulated areas. Most waterworks in Sweden, however, are relativelysmall. A large number of these use groundwater or infiltrated water. 70 percent of these serve less than 1,000 consumers each (1).
The radon levels in surface waters are usually very low (less than 1 Bq/l).Normal radon concentrations in groundwater in soil aquifers in Swedenrange from 10 to 300 Bq/l. In drilled wells typical radon levels are 50–500Bq/l, in uranium-rich granites, however, 300–4,000 Bq/l. The maximumradon concentration found in water from a drilled well in Sweden is 89,000Bq/l (2).
In 1999 the local health officer of the Ludvika municipality in centralSweden informed the Swedish Radiation Protection Authority (SSI) that in-door radon levels at the waterworks in Ludvika and Fredriksberg were veryhigh. In 2000, representatives from SSI visited these waterworks as well asthe waterworks in Kolbäck to follow up this information.
The personnel at the waterworks normally work a couple of hours per daywith surveillance of pumps and filters, cleaning reservoirs and handlingchemicals used in the water treatment processes. The same personnel very of-ten serve several waterworks in the same area. It is common for other munic-ipal workplaces, such as offices, to be included in the waterworks buildings.
Normal concentrations of 226Ra in groundwater in Sweden vary between0.001 Bq/l and 0.3 Bq/l. In uranium-rich granites the levels are higher, amaximum of 8 Bq/l has been found in a drilled well (2). The dissolved radi-um is often precipitated together with iron- and manganese- hydroxide andmay be deposited inside tubes and pumps. Radon progeny will also be de-posited in filters containing activated charcoal and sand. Elevated gammaradiation from filters and pumps may therefore be a problem. Sometimesfilters contain so much radium that they will act as secondary radon sourcesfor low radon waters entering the filter.
Inspections and measurementsThe Ludvika waterworks
This waterworks serves the small town of Ludvika. It is situated on an esker(a postglacial formation of gravel and coarse sand, highly permeable toboth air and water). The raw water originates in a small lake from which itis naturally infiltrated into the esker, Fig. 1. From the esker it is pumped upusing cased wells, sprayed into small ponds in the vicinity of the water-works and thereafter re-infiltrated into the esker, Fig. 2. The purified water
46
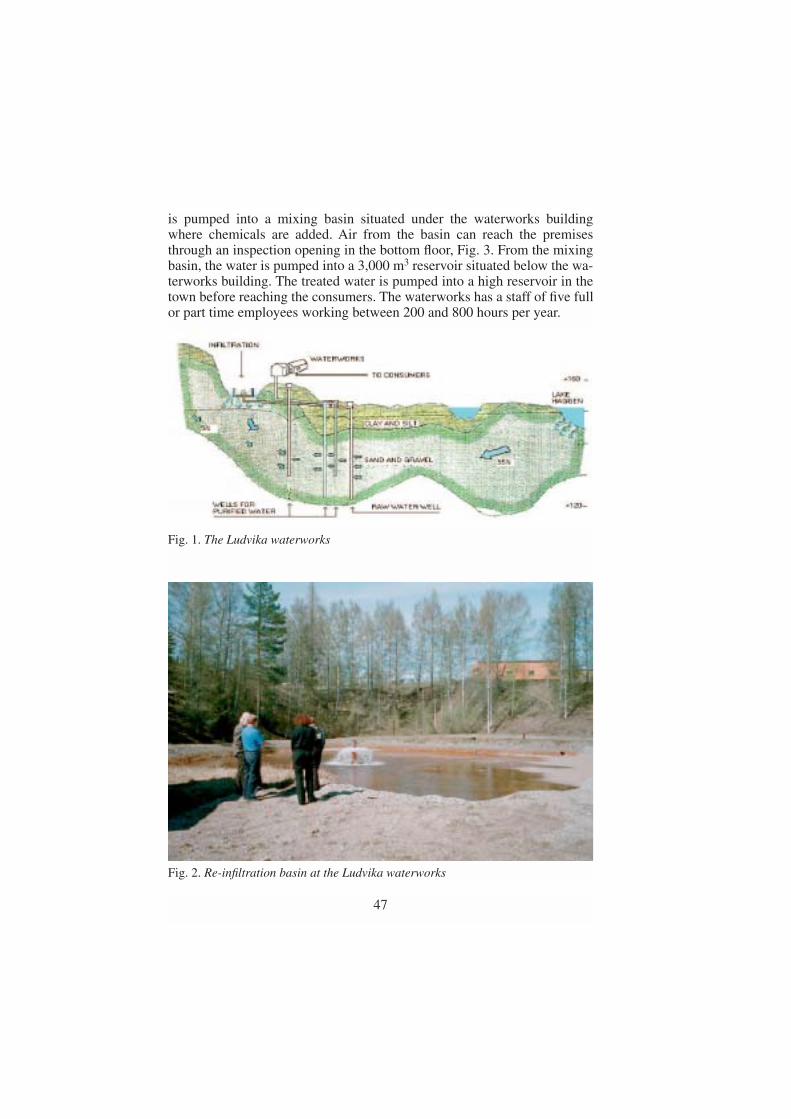
is pumped into a mixing basin situated under the waterworks buildingwhere chemicals are added. Air from the basin can reach the premisesthrough an inspection opening in the bottom floor, Fig. 3. From the mixingbasin, the water is pumped into a 3,000 m3 reservoir situated below the wa-terworks building. The treated water is pumped into a high reservoir in thetown before reaching the consumers. The waterworks has a staff of five fullor part time employees working between 200 and 800 hours per year.
47
Fig. 1. The Ludvika waterworks
Fig. 2. Re-infiltration basin at the Ludvika waterworks

On average, 6,000 m3 of water passes the waterworks per day. The radonconcentration is found to be 85 Bq/l in the raw water and 75 Bq/l in thetreated water. According to the measurements performed by the municipalhealth authorities the average indoor radon levels in different rooms in thewaterworks building varied from 1,200 Bq/m3 to 18,000 Bq/m3. Maximumvalues exceeding 35,000 Bq/m3 have been recorded, see Table 1.
Table 1. Radon gas concentrations (Bq/m3) in different parts of the wa-terworks building in Ludvika according to measurements performedby the municipal authorities
Location Before remedial Before remedial Aftermeasures measures remedialAverage Maximum measures
Control room 4,250 10,860Above mixing basin 17,870 36,900 40Cellar outside reservoir 8,150 100Canteen 1,200 40
48
Fig. 3. Inspection opening to the mixing chamber

The water is transported in a closed system until it reaches the mixing basinand the reservoir. The water flow in the mixing basin is turbulent and radonis released from the open water surface to the air in the room situated abovethe mixing basin from where it spreads to other parts of the waterworksbuilding. The reservoir is covered with a concrete roof. In the reservoir,radon is released from the water surface to the air contained between thewater surface and the roof. When the water surface in the reservoir is raisedas water is pumped in, the radon-rich air is forced via the mixing basin upinto the building. This is the reason why the radon concentrations in thebuilding vary so much, see Fig. 4.
To reduce the indoor radon levels, a supply/exhaust ventilation systemhas been installed with a local extraction point (430 litres of air per second)just above the water surface in the mixing basin, see Fig. 3. As can be seenfrom Table 1 and Fig. 4, the remedial measures have been quite successful.The indoor radon levels are now 40–100 Bq/m3.
The Fredriksberg waterworksThe waterworks supplies the village of Fredriksberg and the neighbouringarea with drinking water. It is situated on the shore of a small lake. The rawwater rises into cased wells from an esker on a small island in the lake andit is pumped into the waterworks. The raw water is not aired or further fil-tered before it reaches the waterworks. In the plant, potassium perman-ganate and soda are added, after which the water is aired and flocculation
49
0
100
200
300
400
500
600
700
800
900
1000
10:50 11:00 11:10 11:20 11:30 11:40 11:50 12:00 12:10
Ventilation started
Fig. 4. An example of time variations in the radon content in air close to the mixingchamber at the Ludvika waterworks

takes place in open basins. The flocculent precipitate is removed by an opencontact filter. As a result, open water surfaces are exposed in the main hallof the waterworks with consequent release of radon into the indoor air. Thewater is then treated in closed sand filters and stored in a reservoir situatedbelow the waterworks building, until it is pumped into the distribution sys-tem. Apart from the main water treatment hall, the building also contains asmall laboratory and an office. The door between the main hall and otherparts of the building is normally closed.
Two people work regularly at the waterworks, normally spending aboutfive hours per day, corresponding to about 1,000 hours per year.
600–700 m3 of water are treated per day. The radon concentration of theraw water was earlier found to be 110 Bq/l. Samples taken after the sand fil-ters and from the outgoing water contained 40 Bq/l and 15 Bq/l, respective-ly, while arbitrary samples from the distribution network contained 35 Bq/l.
Before any remedial measures, the average radon concentration in the inthe air of the main waterworks hall was 11,200 Bq/m3 and 7,000 Bq/m3 in thelaboratory. With the new ventilation system, having the extraction point justabove the water surface of the open contact filter, the radon levels in the mainhall and the laboratory were reduced to below 400 Bq/m3. In very cold weath-er, however, the temperature in the building becomes too low and the ventila-tion system has to be temporarily shut off, leading to increased radon levels.
During the visit of SSI personnel, we made measurements in the mainhall and the laboratory using continuous radon gas monitors, see Fig. 5. Thedoors to the plant had been closed for several days prior to our visit and theventilation system had been shut off.
50
0
2000
4000
6000
8000
10000
12000
14:10 14:20 14:30 14:40 14:50 15:00 15:10 15:20 15:30 15:40 15:50
Bg/m
3
Water filtration started 14:50
Ventilationstarted 15:30
Fig. 5. Time variations in the contents of radon in air in the main hall at theFredriksberg waterworks
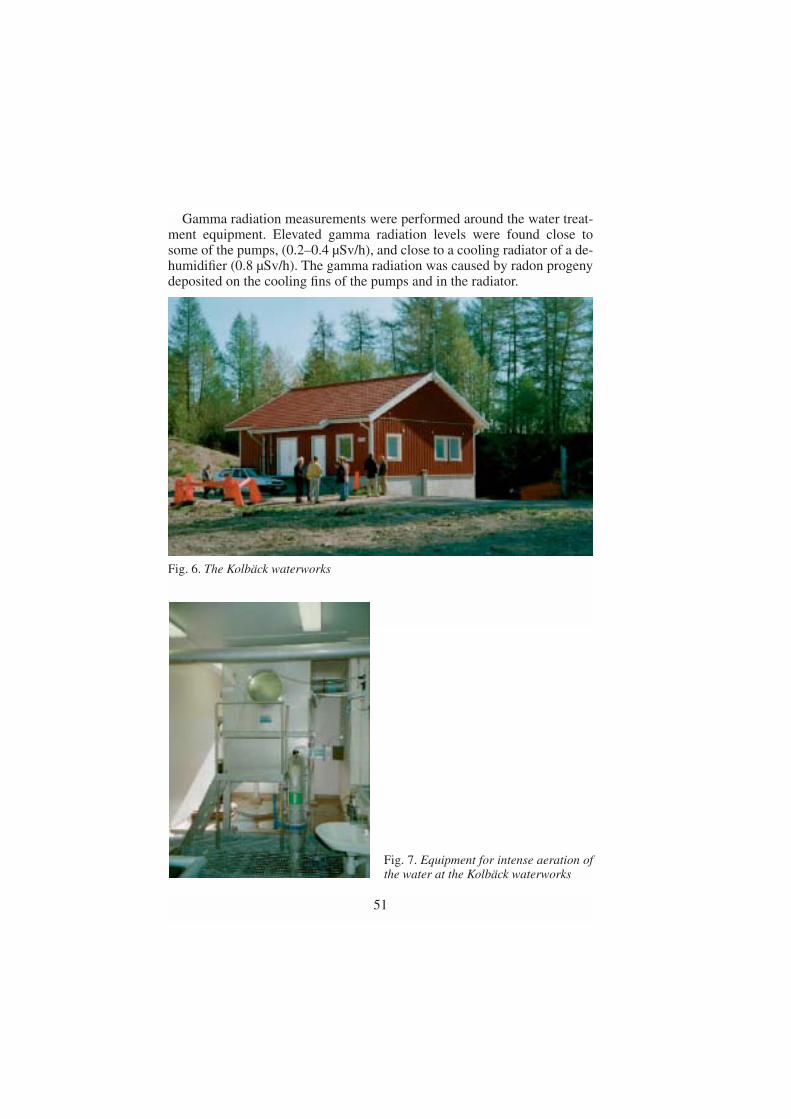
Gamma radiation measurements were performed around the water treat-ment equipment. Elevated gamma radiation levels were found close tosome of the pumps, (0.2–0.4 µSv/h), and close to a cooling radiator of a de-humidifier (0.8 µSv/h). The gamma radiation was caused by radon progenydeposited on the cooling fins of the pumps and in the radiator.
51
Fig. 6. The Kolbäck waterworks
Fig. 7. Equipment for intense aeration ofthe water at the Kolbäck waterworks

The Kolbäck waterworks This waterworks supplies drinking water to the village of Kolbäck and thesurrounding area. The waterworks is situated at the edge of a very long es-ker, Strömsholmsåsen, running through Kolbäck. The raw water is broughtup in cased wells directly from the esker into the waterworks for treatmentand subsequent distribution to the customers. The treatment plant was fin-ished in 2000, see Fig. 6. Before that, the water was distributed from an oldwaterworks situated close to the new one. In the old plant the water waspumped through a closed system directly into the pipeline network withoutairing or any other treatment. The radon concentration of the water wasthen 200–300 Bq/l. Since Sweden has an action level of 100 Bq/l for radonin public drinking water, the municipal authority had to take remedial ac-tion to reduce the radon level in the distributed water and a new plant wasbuilt.
Equipment for intense aeration of the raw water, supplying 5,500 m3 airper hour, was installed in the new waterworks building, Fig. 7. After airing,the water is stored in a 150 m3 reservoir situated under the building. In di-rect connection to the main hall of the waterworks there are a small controlroom and an office. Normally, the door between the water treatment halland the rest of the building is closed.
The average throughput is about 1,500 m3 water per day. The radon con-centration of the raw water is 200–300 Bq/l. After passing the airing equip-ment, the radon concentration was found to be 90 Bq/l. The radon concen-tration of the distributed water is about 50 Bq/l.
When the new plant was put in operation, the radon concentration in theair in the main hall was monitored. Since the concentration was found to behigh, some preliminary action was taken, including installing an additionalfan to increase the ventilation rate and some sealing work to prevent thepassage of radon from the reservoir. Measurements performed by the mu-nicipal authorities showed radon concentrations exceeding 40,000 Bq/m3 inthe main hall prior to the installation of the additional fan. Fig. 8 shows theeffect of the preliminary measures by which the concentration was reducedfrom 40,000 to less than 10,000 Bq/m3 during the period 27 April to 3 May2000. In connection with our visit to the plant the ventilation was shut off inorder to monitor the highest values. During the period 5–9 May 2000, themean concentration was around 30,000 Bq/m3 . The short time variationsreflect the effect of pumping the water in and out from the reservoir belowthe building. During our visit, supplementary measurements were takenconfirming the values obtained by the municipality and advice was given onhow further to reduce the radon level.
52

Gamma radiation measurements were performed near the water treat-ment equipment and filters but no elevated levels were found.
Five employees work at the plant. Normally one person performs main-tenance and supervision about half an hour per day, five days a week. Thetotal working time per year is estimated to be about 1,000 hours.
Conclusion
The study shows that in waterworks there is a substantial risk for high in-door radon concentrations when large volumes of groundwater or artificial-ly infiltrated surface water are treated indoors in open systems. The radonconcentration in the raw water does not necessarily have to be high for theindoor radon levels to exceed 400 Bq/m3, which is the action level for radonat workplaces in Sweden. Radon can be forced into the premises bychanges in the water level in an enclosed reservoir. This can also give rise tosubstantial diurnal variations in the indoor radon concentration. The exam-
53
Fig. 8. Results of radon gas measurements in the main hall at the Kolbäck water-works
26 27 28 29 30 31 32 33 34 35 36 37 38 39April May
Bq/m3
50 000
40 000
30 000
20 000
10 000
0

ples show that it is important to control the release of radon from open wa-ter surfaces to the indoor air. In the Ludvika waterworks the problem wassuccessfully solved by introducing a ventilation system with a suction pointimmediately above the open water surface at a small shaft connecting thereservoir with the building. In the Fredriksberg waterworks the open sur-faces of the filters are a problem. In the Kolbäck waterworks the indoor airradon levels were very high, even though the aerating device was entirelycontained. Most of the radon that entered the building was released fromthe already treated water in the reservoir in the same way as in Ludvika.
It is obvious that even well designed water treatment systems may havehigh radon levels in the waterworks buildings. We recommend that indoorradon levels be measured in all premises where large volumes of ground-water or artificially infiltrated surface water are treated. Measurementsshould also be made in neighbouring premises. Installed mitigation systemsshould be checked regularly and the measurements should be repeatedevery second year or so. There is a risk for high indoor radon concentra-tions at all workplaces where large volumes of groundwater are used ortreated indoors. Possible examples of other workplaces where similar prob-lems could occur are breweries, indoor swimming-pools, food processingindustries and laundries.
An estimation of the dose (according to the ICRP dose conversion con-vention), shows that it is quite possible that employees at waterworks couldreceive doses exceeding 20 mSv per year.
REFERENCES
This work has also been presented at the Third International Symposium onNaturally Occurring Radioactive Mterials, NORM III, Brussels, 17–21September, 2001.
1. Hult, A. The drinking water in Sweden. (In Swedish, with a summary inEnglish). VA FORSK Rapport 98–15. The Swedish Food Administra-tion, 1998.
2. Nordic 2000. Naturally Occurring Radioactivity in the Nordic Countries– Recommendations. The Radiation Protection Authorities in Denmark,Finland, Iceland, Norway and Sweden. ISBN 91-89230-00-0, 2000.Available as a pdf-file from www.ssi.se.
54

Radon concentrations in Norwegian dwellings
T. Strand, C. Lunder Jensen, A. Heiberg, L. Ruden and K. Ånestad
Norwegian Radiation Protection Authority, P.O.Box 55, N-1332 Østerås,Norway.
E-mail: [email protected]
A nation-wide survey of radon concentrations in Norwegian dwellings wasundertaken in the period 1987-89. In this survey, radon measurements weremade by CR-39 etched track detectors (six months integration time) in themain bedroom of approximately 7500 randomly selected dwellings builtbefore 1980. The annual average radon concentration in Norwegian bed-rooms was calculated to 51 Bq/m3, and 3.7 % of the results exceeded 200Bq/m3. In a large proportions of single-family houses (including detached,semi-detached, row and terraced houses), the living room and the kitchenare located on the ground floor while the bedrooms are on the first floor. Inmost cases the radon concentration is higher on the ground floor than on thefirst floor, and there may also be differences between bedrooms and otherrooms on the same floor owing to different ventilation conditions. An addi-tional factor, that could have influenced the measurements, was that thewinters 87-89 were considerably warmer than normal. Based on these con-siderations, the annual average radon concentration in Norwegiandwellings was estimated to be between 55 and 65 Bq/m3, and it was furtherestimated that close to 5 % of the housing stock exceeded 200 Bq/m3.
In the period between October 2000 and May 2002 measurements ofradon were performed in approximately 29,000 dwellings in Norway. Inthis survey, 114 out of the 435 municipalities of Norway participated. Ineach municipality measurements were made in between 2% and 10% of thehousing stock, depending on the size of the municipality and the populationdensity. However, the dwellings were randomly selected and it is assumedthat there is no bias owing to the sampling procedure in the municipalitiesthat participated. The measurements were made by etched track detectors(CR-39), one in each dwelling. The results show that there are significantgeographical variations, both between municipalities and within each mu-nicipality. The population weighted annual mean radon concentration wascalculated to 89 Bq/m3. 9 % and 3 % of the dwellings had higher levels than200 Bq/m3 and 400 Bq/m3, respectively. By comparing these results munic-
55

ipality by municipality with the results of the nation-wide survey 87-89, itwas concluded that the mean radon concentration in the present housingstock is 70-75 % higher than twenty years ago.
A more detailed presentation and discussion of the results will be sub-mitted for publication in an international journal by the end of 2002. A briefdiscussion of the results have been published in the report series of the Nor-wegian Radiation Protection Authority (Strand et al 2001).
REFERENCES
Strand T, Green B M R, Lomas P R, 1982. Radon i Norwegian Dwellings.Radiat. Prot. Dosim. 45 (1/4), p. 503-508,
Strand T, Ånestad K, Ruden L, Ramberg G B, Lunder Jensen C, HeibergWiig A and Thommesen G, 2001 Indoor Radon Survey in 114 Munici-palities of Norway. Short Presentation of the Results. Report 2001:6,Norwegian Radiation Protection Authority,.
56

Proposal for a new radon programme for Sweden.The Swedish Radon 2000 Commission’s report
L. Mjönes
Swedish Radiation Protection Authority, SE-171 16 Stockholm, SwedenE-mail: [email protected]
Introduction
In 1999 the Swedish Minister of Environment appointed a commission toinvestigate the radon problem in Sweden and propose cost-effective actionsto reduce the radon levels in drinking water and indoor air of dwellings,pre-schools and schools . The proposals of the commission fall into threecategories: 1) a prospective environmental-quality standard regarding radonin indoor air, 2) an expanded system of grants for measures against highradon concentrations, and 3) an extensive information campaign and train-ing programme.
Environmental-quality standard for radon in indoor air
In order to protect human health the Commission proposes a Government-defined environmental-quality standard relating to radon in indoor air indwellings, pre-schools, schools, etc. After a final date specified in the stan-dard (20 years from now for single-family dwellings), the compulsory max-imum limit of 400 Bq/m3 for radon-gas concentration will apply. Thismeans that property-owners who ( despite the generous grants available) have failed to measure their radon concentrations and reduce excessivelevels if necessary, may be punished by a fine. The municipalities alreadyhave legal justification in the Swedish Environmental Code for obligingproperty-owners to implement radon-reducing measures if concentrationsexceed the action level of 400 Bq/m3. However, measurements may bemade compulsory only where elevated radon concentrations are suspected.The novelty of the environmental-quality standard is that it pressures themunicipalities to perform their supervisory function properly.
57
Grant system for reducing radon contents in indoor air anddrinking water
A new system of grants for radon-reducing measures is proposed. For sin-gle-family dwellings, the homeowner receives 65% of a reasonable cost ofmeasures during the first ten years. The maximum level of grant for this pe-riod is set at SEK 25,000 (2.500 EUR). In the subsequent five-year period,the grant is set at 50% of the costs, up to a maximum of SEK 15,000, and inthe last five years at 25%, up to a maximum of SEK 10,000.
The Commission proposes that measures be undertaken in relation to theradon source. The execution of such measures should be supervised by thecounty administrative boards. The current supervision by the municipalitieshas not worked particularly well, since many municipalities lack personnelwith adequate skills. It will be simpler to maintain the requisite skills at 21county administrative boards than at 289 municipalities.
A grant system is also proposed for measures to reduce radon in multi-family dwellings. The system is intended to include both residential unitswith renting rights and flats with tenant-ownership rights. Grants are pro-vided at 50% of reasonable cost. The grants are temporary and scheduled toexpire on the final date specified in the environmental-quality standard (aten-year limit is proposed for multi-family dwellings). A grant system isalso proposed for measures against high radon levels in schools, pre-schools, after-school recreation centres, etc. In this case grants will corre-spond to 25% of reasonable costs. Also these grants are temporary and dueto expire on the closing date proposed in the environmental-quality stan-dard (five years). Finally, a temporary (five-year) grant is proposed for mea-sures against high radon contents in drinking water, at a rate of 50% of areasonable cost, but maximum SEK 5,000.
The Commission proposes setting up a national data register for radoncontents in indoor air, at the National Land Survey. This register should belinked to the property-data system. Companies that carry out the measure-ments would report their results directly to the register. A national registerfor the contents of radon in soil and water should be run by the GeologicalSurvey of Sweden (SGU). Swedish estate agents will be obliged to informprospective property buyers of radon levels in houses for sale.
Improved provision of information and extensive training programme
The Swedish Radiation Protection Authority (SSI) and other relevant publicagencies are requested to draw up revised information material on radon. Aradon portal on the Internet will be created to collect information on radon
58

issues. In co-operation with the other public agencies concerned, SSI willdevelop a training programme on radon, radon-risk assessments and anti-radon measures for municipal officers.
Implications of the proposal
The aggregate costs of measuring radon in homes, schools and pre-schoolsare estimated at SEK 800 million, of which measurements in single-familyhomes account for SEK 500 million. The estimated costs of abatementamount to SEK 2.8 billion, of which measures in single-family homes makeup the greater part (SEK 2.3 billion). In addition, there will be increasedcosts of energy for installations such as fans etc. amounting to around SEK10 million a year and, in due course, maintenance costs (replacement offans etc) totalling roughly the same amount annually. The municipalitiesare expected to incur roughly a 30% increase in the workload for theirhealth protection, the cost of which is estimated at about SEK 10 million ayear.
Public finances will rise to roughly SEK 110 million a year to be spent onradon grants during the first ten years. State expenditure will then fallsharply to around SEK 30 million annually in years 10–15 and SEK 7 mil-lion in the last five-year period.
Property-owners will have to cover costs of radon measurements and,where radon concentrations exceed 400 Bq/m3, of radon mitigation. At pre-sent, it costs SEK 200–500 to measure the radon concentration in a home.The cost of mitigation varies, depending on the radon source and design ofthe building. Remediation of a single-family dwelling with soil-radon prob-lems normally costs SEK 10,000–25,000. If building materials are the mainsource of radon, installation of a mechanical ventilation system is requiredin most cases. This usually costs SEK 20,000–60,000 per house. Reducingradon concentrations in flats in multi-family dwellings normally costs SEK5,000–20,000 per flat.
Reservations from three property-owner representatives
Experts from the Swedish Association of Private House-Owners (SAPHO),the Swedish Federation for Rental Property Owners (SFRP) and the Na-tional Federation of Tenants’ Savings and Building Societies (HSB) haveexpressed reservations against parts of the Commission’s proposals. Thespokesman from the SAPHO is critical to those portions that involve apply-ing coercive measures against individual property-owners, such as compul-sory measurement of radon at the property-owner’s expense. He concludes:
59

‘It is no reasonable proportion between the objectives to be attained and themeans one has to adopt. Measures against radon should, therefore, be re-stricted to the provision of information and grants that can induce property-owners to take remedial action against radon on a voluntary basis.’
HSB’s representative calls for a comprehensive approach in assessingdomestic risk. He questions whether it is reasonable to measure radon in allresidential buildings, and he too concludes that there is no reasonable pro-portion between the objectives that may conceivably be attained and themeans that public authorities are prepared to adopt.
The representative of the SFRP states that the best way of utilising soci-ety’s resources in health problems is to concentrate on vigorous measuresto combat smoking, which would also reduce the risks caused by radon.She, too, is opposed to the parts of the proposal that permit coercive mea-sures against property-owners, considering that the same time limit formeasurements and remediation should apply to multi-family dwellings asto single-family dwellings, i.e. 20 years.
SSI’s role in future anti-radon efforts
The Commission proposes bolstering SSI’s official role. The Authorityshould continue to head the co-ordination group for agencies responsiblefor radon issues. The group’s position should be strengthened and SSI’srole clarified. SSI should retain its overall responsibility for issuing infor-mation about radon, and in collaboration with the other public agencies de-velop information material concerning radon. The Commission proposesthat SSI also be responsible for establishing and running a ‘radon portal’ onthe Internet. This portal should contain instructional and information mate-rial, as well as links to radon registers, the relevant agencies’ websites, etc.
SSI should have the overall responsibility for training with respect toradon, and also have direct responsibility for training in health hazards andmeasuring technology. The National Board of Housing, Building and Plan-ning is in charge of training in structural-engineering measures for both ex-isting and newly erected buildings. The Geological Survey of Sweden(SGU) should be responsible for training with respect to soil radon. Coursefees for municipal officers should be subsidised by the government. SSIshould be responsible for developing Internet-based teaching material for abasic course about radon and introductory courses for special training pro-grammes in measuring techniques, radon in water and structural-engineer-ing measures to reduce high radon concentrations.
SSI needs to issue measurement protocols for radon in indoor air atworkplaces and directions for selecting homes in carrying out measure-ments in multi-family dwellings. The measurement protocol for domestic
60

radon levels needs reviewing. A standard method of measuring radon indrinking water needs establishing (a proposal has been submitted to the Na-tional Food Administration).
The Commission proposes making the National Land Survey and SGUresponsible for radon registers for buildings, underground and water. Theagency group for radon issues will determine the detailed configuration ofthe registers. The National Board of Health and Welfare will be responsiblefor collecting data on previous Rn measurements.
Two new positions for radon issues at SSI are proposed. One is neededfor co-ordination and organisation of training activities. The other is neces-sary for management of the radon portal and administrative tasks stemmingfrom the increase in the agency’s radon-related activities.
REFERENCE
Proposal for a New Radon Programme for Sweden, – The Swedish Radon2000 Commission’s Report. SOU 001:7, The Swedish Government Of-fices, Stockholm, Sweden 2001.
61

Advanced techniques for the determination of solid state uranium speciation
B. Salbu and O. C. Lind
Isotope Laboratory, Department of soil and water sciences,Agricultural University of Norway, 1432 Ås, Norway.
E-mail:[email protected]
Abstract
Uranium released to the environment may be present in different physico-chemical
forms, ranging from ionic species to particles and fragments. Following releases from
nuclear events such as nuclear weapon tests or use of depleted uranium munitions, and
from nuclear accidents associated with explosions or fires, uranium is predominantly
present as particles, mainly fuel particles. To assess long-term impact from uranium con-
tamination, information on the source term is essential, i.e. activity concentrations and
isotopic ratios as well as the particle size distribution, crystallographic structures and ox-
idation states influencing particle weathering rates and the subsequent mobilisation and
biological uptake. The activity concentrations, the isotopic ratios and the particle compo-
sition will depend on the source in question, while particle characteristics will also de-
pend on the release scenario, dispersion processes and deposition conditions. Thus, the
present paper focuses on advanced techniques such as mass spectrometry utilised for de-
termination of uranium isotopic ratios, and on electron microscopy and synchrotron radi-
ation based X-ray micro-techniques for characterisation of particles and solid-state spe-
ciation of uranium in particles. Results from research obtained during several years at the
author’s laboratory are presented to illustrate the usefulness of the techniques.
Introduction
To assess long-term environmental impact of actinide contamination in-cluding uranium (U), information on the source term is essential. Usuallysource term characteristics are restricted to inventory estimates, activitylevels or activity concentrations of released or deposited actinides and oth-er associated radionuclides. However, information on activity or isotopic
62

ratios is essential to distinguish between multiple sources, for instance todistinguish U-particles associated with the use of depleted uranium muni-tions from U-particles originating from natural sources in the environment(Danesi et al. 2003 (a,b), Salbu et al. 2003). Furthermore, information onspeciation, including solid state speciation is essential for assessing the mo-bility and bioavailability of actinides like U as well as associated radionu-clides in various ecosystems (Salbu et al., 2000a).
A significant fraction of actinides including U released by high tempera-ture nuclear events, such as nuclear weapons tests in Maralinga, Australia(Cooper et al., 1994), Mururoa, French Polynesia (Danesi et al., 1998),Nevada test site, US and Marshall Islands (Crocker et al., 1966;), or the useof depleted uranium (DU) munitions in Kosovo (Danesi et al. 2003), andfollowing the nuclear explosion in the Chernobyl reactor (Devell et al.1986, Loschilov et al. 1992), or the fire in the Windscale nuclear reactor(Chamberlain and Dunster, 1958) is associated with fuel particles. U-parti-cles have also been released under low temperature conditions such as at-mospheric emission from the Windscale reactor during normal operationsin the early 1950s (Jakeman, 1986; Salbu et al. 1994). Thus, man-made Uparticles have been released from nuclear sources more frequently thanusually anticipated.
Particles containing actinides are formed due to critical or subcritical de-struction of fuel matrices (e.g., explosions, fires, corrosion processes). Fol-lowing high temperature accidental scenarios associated with nuclear in-stallations (i. e. Chernobyl accident) a range of different uranium fuel parti-cles has been observed, varying in composition, crystallographic structures(Salbu et al., 1998). Furthermore, the oxidation state of U in fuel particlesdepended on the release scenario; apparently reduced U were released dur-ing the explosions, while oxidised U from were released during the subse-quent reactor fire (Salbu et al., 2000b; 2001). Following low temperaturereleases (i. e. pre-fire Windscale releases), however, flake-like uranium fuelparticles significantly different from those collected at Chernobyl havebeen identified (Salbu et al., 1994). Therefore, the activity concentrationand activity or isotopic ratios of matrix elements and refractory elementsreflecting burn-up (e.g. lanthanides, actinides) are source-specific, whileparticle characteristics like crystallographic structures and oxidation statesof matrix elements also depends on specific release conditions.
U particles represent point sources and the particle size distribution is es-sential for the potential of transfer to man via inhalation, as demonstratedfor respiratory DU particles observed in Kosovo (Danesi et al. 2003). Afterdeposition in the environment, weathering of U-particles occurs and U aswell as associated radionuclides are mobilised with time. Thus, the transferof mobilised radionuclides within the ecosystem will be delayed untilweathering takes place. The weathering rate will depend on the initial parti-
63

cle composition (e. g. UO2-fuel), structural changes occurring during theevent (e. g. transformation from UO2 to U3O8) and transformation process-es taking place after deposition depending on soil pH, red/ox conditionsand microbial activities (Kashparov et al. 1999). Unless the impact ofparticle weathering is taken into account, assessment of mobilisation,ecosystem transfer and long term consequences of radionuclide releasesmay suffer from large uncertainties. Thus, the present work focuses on ana-lytical techniques applicable for determination of low level activity concen-tration of U to distinguish U isotopic ratios and on advanced techniquessuch as electron microscopy and synchrotron radiation based X-ray micro-techniques for characterisation of particles including solid state speciationof uranium in particles released from a source and deposited in the environ-ment.
Analytical strategies –pre-analysis handling of samples
In environmental samples, U may be present in different physico-chemicalforms, ranging from ionic species to particles. To obtain information on Uspecies, different fractionation techniques must be applied during samplingin situ, at site or shortly after sampling and prior to analysis (Salbu 2000a).To separate U-particles from air, cascade impactors with membranes hav-ing different cut-off levels (µm to mm) are frequently used. For U in waters,filtration (0.45 µm) and tangential flow systems (nm to µm range mem-branes) should be applied to distinguish ionic species, colloidal and partic-ulate material.
U particles represent a radioanalytical challenge as samples collectedmay not be representative of the bulk (Bunzl et al., 1997), sample dissolu-tion may be incomplete (Oughton et al., 1993) and consequently contami-nation inventories may be underestimated. In contaminated areas portabledetectors can be utilized to identify hot spots. For contaminated soils andsediments, biological material and filters from air or water fractionationprocedures, autoradiography images are useful to locate radioactive parti-cles. In autoradiography dried samples collected from hot spots are thinlyspread on plastic foils and a radiation sensitive film is placed in close con-tact for varying time of exposure. Alternatively, phosphor image plates canbe applied, being a more efficient technique, as demonstrated in Figure 1for U particles released from the Chernobyl reactor. Hot spots reflect parti-cles and further separations of subsamples using radiation detectors andlight microscopes are needed prior to the use of EM-techniques.
64

Determination of low-level U and U isotope ratios by mass spec-trometryPrior to measurements, it is essential to obtain fully dissolutions of U in thesamples (Oughton et al., 1993). Furthermore, radiochemical separations ofU are usually needed to avoid interferences from other actinides. For thedetermination of very low concentration of specific actinide isotopes, andthereby isotopic ratios, different mass spectrometry systems using a varietyof ion sources can be utilised. Among these are inductively coupled plasma(ICP-MS), thermal ionisation (TIMS), secondary ionisation sources(SIMS), and accelerator mass spectrometry (AMS); ICP-MS being mostcommonly used and AMS being most sensitive. During recent years, MStechniques have increasingly been applied to determination of U and ac-tinides in environmental samples (e.g., Yamamoto et al., 1996).
Inductively coupled plasma emission – mass spectrometry (ICP-MS)In ICP-MS, samples are introduced by means of a nebulizer,graphite furnace or by means of a laser (laser ablation). Although itis assumed that samples are fully ionised in the plasma (6000 –8000K) before being transferred into the mass spectrometer particlediscrimination may occur using nebulizer systems for sample intro-duction. By scanning the mass range within milliseconds, the ICP-MS, especially using sector instruments, acts as a sensitive multiele-
65
Fig. 1. Digital phosphor imaging of soil from within the 30-km zone to the west ofChernobyl.

mental technique (Becker et al., 1997). Thus, the isotopic ratios areutilised for source identification («fingerprint»). ICP-MS has proveduseful for distinguishing between low-levels of nuclear weapon de-rived 239Pu and nuclear fuel cycle derived 240Pu (Oughton et al.1999), while ICP-MS and SIMS have been successfully used to dis-tinguish between depleted uranium particles and U originated fromnatural sources (Salbu, et al, in press, Danesi et al, in press (a,b)). Byinterfacing for instance chromatographic separation systems (e. g.,LC or HPLC) with ICP-MS, the combined system should be wellsuited for actinide speciation studies.
Accelerator mass spectrometry (AMS)Among MS techniques, AMS offers almost unparalleled resolution, preci-sion and ultra low-level detection limits (from 104 to 106 atoms). Prior toanalysis, homogeneous solid metallic or metal oxide samples containingthe actinide of interest together with a suitable isotopic tracer must be pre-pared. The ion source is produced by spluttering the solid sample with Cs+
ions and injecting the negative ions into the accelerator. Then, the beam isaccelerated towards a high voltage positive potential, stripped of outer elec-trons, accelerated as positively charged ions (up to 13+) and the isotopesare separated according to mass/charge in a high magnetic field beforecounting. The technique has been developed to enable measurement of ac-tinides and has recently been applied successfully to measurement of 240Pu/232Pu isotope ratios in low-level environmental samples (Ougthon et al.,1999). Thus, AMS represents a potential extreme sensitive technique for thedetermination of low-level U isotopes.
Characterisation of particles and colloids by electron microscopyTransmission electron microscopy (TEM)For colloidal radioactive material, transmission electron microscopy(TEM) can be utilised for structure and elemental analysis. For water sam-ples, droplets are transferred to formvar coated grids and dried under anUV-lamp and electron dense structures can be recognised, when comparedto blank (distilled water). By interfacing X-ray microanalysis (XRMA) ele-mental distributions can be obtained. Using TEM, colloidal material withparticle sizes close to 20 nm and pseudocolloids in the range of 100 nmhave been identified in effluents from La Hague, France and Sellafield, UK(Salbu et al., 2000a).
66

Scanning electron microscopy (SEM) and X-ray microanalysis(XRMA)Following autoradiography and non-destructive radiation measurementtechniques (e.g., gamma-and beta-spectrometry), individual particles canbe localised using light microscopy and mounted on stubs, tape or capillar-ies prior to structure analysis by SEM and XRMA (Fig. 2a). UsingBackscattered Electron Imaging (BEI) mode, bright areas reflect the pres-ence of high atomic number elements on particle surfaces (Fig 2b), whilethe distribution of elements is obtained by using X-ray mapping (Fig 2c).XRMA provides also semi-quantitative information on the elemental com-position on the particle surfaces (Fig. 2d). These techniques have been
67
0 5 1010 1515 2020
Energy (keV)Energy (keV)
0
5
10
15
20
Countounts
U
U
U
UU
U
U
UU
a b
c d
Fig. 2. Scanning electron microscopy of a depleted uranium particle from soils col-lected North of the Chernobyl power plant, Ukraine: a) (upper left) SecondaryElectron Imaging (SEI) mode reflecting the morphological structure of particles, b)(upper right) Backscattered Electron Imaging (BEI) mode, bright areas reflect highatomic number elements, c) (lower left) X-ray mapping of uranium in SEI mode d)(lower right) elemental analysis by XRMA. (Bar 100 µm).
utilised to characterise different types of radioactive particles, e. g. flakelikeuranium fuel particles released at low temperature conditions from Wind-scale, UK, and large aggregates of fuel granulates as well as crystalline andamorphous single fuel particles released at high temperature from the Cher-nobyl reactor (Salbu et al., 1994). Although all these particles are U-fuelparticles, their behaviour in the environment is expected to be different; thetransport of spheres are quite different from flakes, the weathering rates ofamorphous structures are significantly higher than that of crystalline phas-es. Unless these processes are taken into account, model predictions on en-vironmental behaviour such as soil-plant transfer may suffer from large un-certainties.
Synchrotron radiation (SR) based X-ray micro-techniques
Following autoradiography, radioactivity measurements and electron mi-croscopy, further particle characteristics are obtained by synchrotron radia-tion X-ray techniques using 2. generation syn-chrotron radiation source(e.g. HASYLAB, Germany) or 3. generation synchrotron radiation source(e.g. ESRF, France). The SR-based techniques include X-ray absorption (µ-XAS) to mography to determine the 3 D distribution of elements such asU, X-ray micro diffraction ((-XRD) to determine the crystallographic struc-ture and X-ray absorption near edge spectrometry (µ-XANES) to determinethe oxidation state of U (Adams et al., 1998).
Micro-tomography and micro-imagingTo obtain information on the 3 D distribution of U in individual particles,µ-XAS-tomography has been performed at ESRF (Salbu et al., 2000b).Each individual particle was mounted on a glass capillary and placed on atomography stage with 8 degrees of freedom for alignment and rotation.The sample was rotated around a horizontal axis to obtain the highest reso-lution in the plane of reconstruction. During rotation, images were recordedat 17 keV with a high resolution, cooled CCD-based X-ray detector with aresolution of 0.6 µm. Monochromator tuning allows also images to be ob-tained as a function of incident photon energy to perform XANES imaging(2D oxidation state mapping). Using µ-XAS-tomography, the 3 D distribu-tion of U in a fuel particle released during fire in the Chernobyl reactor isshown in Figure 3. The tomographic reconstruction and computerised slic-ing of the 3-D image demonstrated that U was inhomogeneously distributedwithin the particles.
68

µ-XAS, µ-XRF, µ-XRD and µ-XANES Information on the composition (µ-XAS, µ-XRF), crystallographic struc-ture (µ-XRD) and oxidation states of elements (µ-XANES ) contained in aparticle on a submicrometer scale was obtained by using a high intensity X-ray microbeam; the hard X-ray radiation from the undulator passingthrough a Si monochromator was focused by a Fresnel Zone Plate to a spotof about 1.5 µm vertically and 5 µm horizontally on a sample at 0.7 m dis-tance. The fixed exit double crystal monochromator allowed tuning of theenergy over absorption edges, while keeping the beam position on the sam-ple. The absolute flux at the beamspot on the sample was 109 photons/s at17 keV. Long working distance optical microscope and high resolution X-ray CCD camera were used to position the sample in the focused X-raybeam. To calibrate the results obtained, standards well defined with respectto crystallographic structures and oxidation states were applied Umet, UO2,U3O8, and UO2(CH3COO)2
. H2O). The absorption spectra (µ-XAS,µ-XANES) were recorded with pindiodes, while the fluorescence (µ-XRF)spectra were recorded using a Si(Li) energy dispersive detector (Salbu et al.2001).
69
a b
Fig. 3. a: µ-XAS-tomography of an oxidised fuel particle released from the Cher-nobyl reactor during the fire. b: computerised slicing of the 3-D image of the oxi-dised fuel particle (Salbu et al., 2001).

µ-XRDIn micro-diffraction, the particles and standards were exposed for 3-10 min at different energies between 17 keV and 25 keV. Debye-Scherrer-rings were recorded at 200 mm distance from the sampleusing a Fujitsu image plate (Salbu et al., 2001). The plate was opti-cally scanned with a Molecular Dynamics scanner to yield informa-tion on the diameter of the Debye-Scherrer-rings. The µ-XRD resultsdemonstrated that U in the UO2 fuel particles released from theChernobyl reactor during the fire were oxidised to U3O8 or/andU2O5.
µ-XANESThe µ-XANES spectra of particles and standards were obtained byscanning the X-ray energy over the U LIII absorption edge, and mea-suring the incident and transmitted beam intensity (I0, I) with pin-diodes (Salbu et al., 2000b). By determining the inflection point en-ergy as a function of photon energy for the standards, a correlationbetween the inflection point energy and oxidation state was estab-lished. By performing µ-XANES images, i. e. positioning the X-raymicrobeam at various locations (pixels) across the particle and deter-mining the inflection point of the XANES profile within each pixel,the 2D distribution of the oxidation state of U within the particlescould be attained. As illustrated in Figure 4, a U particle releasedduring the reactor fire was characterised by a UO2-core surroundedby oxidised U (U3O8 layers). In contrast, U particles released duringthe initial explosion was characterised by a UO2-core surrounded byapparently reduced U, probably due to interaction with carbon fromthe moderator (Salbu et al., 2001).
70
Fig. 4. 2 D µ-XANES imaging of an oxidised fuel particle released from the Cher-nobyl reactor during the fire. The particle has a UO2-core surrounded by an oxi-dised U2O5 /U3O8 surface layer (Salbu et al., 2001).

Conclusions
To assess the impact of radioactive contamination for man and the environ-ment, information on the source term including the physico-chemical formsis needed. To distinguish between U in man-made source from U originat-ing from natural sources, the determination of isotopic ratio is essential.Being more sensitive than alpha-spectrometry, mass spectrometry tech-niques are highly useful for identifying sources (fingerprints). For very lowlevels of specific isotopes, AMS should be utilised.
As particle characteristics such as crystallographic structures and oxida-tion states influence the weathering and mobilisation of matrix elements aswell as of radionuclides associated with radioactive particles, advancedtechniques such as SEM and SR based X-ray micro-techniques are highlyuseful. As previously demonstrated, particle composition, size distributionand shape depend on sources in question, while the crystallographic struc-tures and oxidation states of uranium in fuel particles released from theChernobyl reactor depended on the release conditions. As these particlecharacteristics are essential for the environmental behaviour, the describedadvanced techniques should be utilised more frequently within radioecolo-gy providing information relevant for dose and impact assessments.
REFERENCES
Adams, F., Janssens, K., & Snigirev, A. (1998). Microscopic X-ray fluores-cence analysis and related methods with laboratory and synchrotron ra-diation sources. J. Anal. Atomic Spec. 13, 319-331.
Becker, J.S. and Dietze, J. (1997). Double-focusing sector field inductivelycoupled plasma mass spectrometry for highly sensitive multi-elementaland isotopic analysis. J. Anal. Atomic Spec. 12, 881-889.
Bunzl, K. (1997). Probability of detecting hot particles in environmentalsamples by sample splitting, Analyst 122, 653-656.
Chamberlain, A.C., and Dunster, H.J. (1958). Deposition of radioactivity innorth-west England from the accident at Windscale. Nature, 182, 629-630.
Cooper, M., Burns, P., Tracy, B., Wilks, M., Williams, G., (1994). Charac-terisation of plutonium contamination at the former nuclear weaponstesting range at Maralinga in South Australia, J. Radioanal. Nucl. Chem.177, 161-184.
Crocker, G.R., O’Connor, J.D., and Freiling E.C. (1966). Physical and Ra-diochemical Properties of Fallout Particles. Health Phys., 12, 1099-1104.
Danesi, P. R., De Regge, P., La Rosa, J., M. Makarewicz,M., J. Moreno, J.,
71

Z. Radecki, Z., E., & Zeiller E. (1998) Residual plutonium isotopes andamericium in the terrestrial environment at the former nuclear test sitesof Mururoa and Fangataufa”, Proceedings 7th Intern. Conf, “Low levelmeasurements of actinides and long-lived radionuclides in biologicaland Environmental samples”, Salt Lake City.
Danesi, P. R., Bleise, A., Burkart, W., Cabianca, T., Campbell, M. J.,Makarewicz, M., Moreno, J. (2003a). Isotopic composition and origin ofUranium and Plutonium in selected soil samples collected in Kosovo.Journal of Environmental Radioactivity 64, 143–154.
Danesi, P. R., Markowicz, A., Chinea-Cano, E., Burkart, W. Donohue, D.,Ruedenauer, F., and Salbu, B., (2003b). Depleted uranium particles inselected Kosovo samples. Journal of Environmental Radioactivity 64,143–154.
Devell, L., Tovedal, M., Bergström, U., Applegren, A., Chussler, J. and An-dersson, L., Initial observations of Fallout from the reactor accident ofChernobyl, Nature, 321, 817 (1986).
Jakeman, D. (1986). Notes of the level of radioactive contamination in theSellafield area arising from discharges in the Early 1950s. UKAEA,AEEW Report 2104, Atomic Energy Establishment, Winfrith.
Kashparov, V. A., Oughton, D. H., Protsak, V. P., Zvarisch, S. I., Protsak, V.P. and Levchuk, S. E. (1999). Kinetics of fuel particle weathering and90Sr mobility in the Chernobyl 30 km exclusion zone. Health Physics,76: 251-259.
Loschilov, N.A. Kashparov, V.A., Polakov, V.D., Protsak, V.P., Yudin, E.B.,Zhurba, M.A. and Parshakov, A.E. (1992). Nuclear-Physical Propertiesof hot particles formed as a result of accident at ChNPP. Radiochemistry,4, 113 (in Russian).
Oughton, D.H., Salbu, B., Brand, T.L., Day, J.P., and Aarkrog, A. (1993).Under-determination of strontium-90 in soils containing particles of ir-radiated uranium oxide fuel. Analyst, 118, 1101-1105.
Oughton, D.H., Fifield, L.K., Day, J.P., Cresswell, R.C., Skipperud, diTada, M.L., Salbu, B., Strand, P., Drozcho, E., and Y. Mokrov, Y. (2000).Plutonium from Mayak: Measurement of Isotope Ratios and ActivitiesUsing Accelerator Mass Spectrometry. Environ. Sc. Technol. 34, 1938-1945.
Salbu, B., Krekling, T., Oughton, D.H., Østby, G., Kashparov, V.A., Brand,T.L., and Day, J.P., Hot particles in accidental releases from Chernobyland Windscale Nuclear installations. Analyst 119, 125-130 (1994).
Salbu, B., Krekling, T., and Oughton, D. H. (1998). Characterisation of Ra-dioactive Particles in the Environment. Analyst, 123, 843-849.
Salbu, B. (2000a). Speciation of Radionuclides. In: (Ed. R.A Myers). Ency-lopedia of Analytical Chemistry. John Wiley & Sons, Ltd, Chichester,UK, 12993-13016.
72

Salbu, B., Janssens, K., Krekling, T., Simionovici, A., Drakopoulos, M.,Raven, C., Snigireva, I., Snigirev, A., Lind, O.C., Oughton, D.H.,Adams, F. and Kashparov, V.A. (2000b) µ-XAS-tomography and µ-XANES for characterisation of fuel particles. ESRF Highlights 1999.European Synchrotron Research Facility, Grenoble, France.
Salbu, B., Krekling, T., Lind, O. C., Oughton, D. H., Drakopoulos, M.,Simionovici, A., Snigireva, I., Snigirev, A., Weitkamp, T., Adams, F.,Janssens, K. and Kashparov, V.A. (2001). High energy X-ray mi-croscopy for characterisation of fuel particles. Nucl. Instr. and Meth. A,467 (21), 1249-1252.
Salbu, B., Janssens, K:, Lind, O.C., Proost, K., and Danesi, P.R. (2003).Oxidation states of uranium in DU particles from Kosovo. Journal of En-vironmental Radioactivity 64, 167–173.
Yamamoto, M., Tsumara, A., Katayama, Y., & Tsukatani, T. (1996). Pluto-nium isotopic composition in soil from the former Semipalatinsk nu-clear test site. Radiochimica Acta, 72, 209-215.
73

Damage and repair of DNA in mammalian cells – emphasis on oxidative processes
H. E. Krokan and G. Slupphaug
Institute of Cancer Research and Molecular Biology, Norwegian Universityof Science and Technology, N-7489 Trondheim, Norway
E-mail: [email protected]
Abstract
The integrity of the genetic material, DNA, is continuously challenged by spontaneous
decay, e.g. depurination leading to loss of bases, deamination leading to mutagenic base
changes in DNA, damage from environmental chemicals, e.g. tobacco-specific ni-
trosamines, combustion products and drugs, as well as ultraviolet light and ionizing radi-
ation. Unless repaired, DNA damage may lead to inheritable disease, cancer and ageing.
The major repair mechanisms are base excision repair, nucleotide excision repair, mis-
match repair, recombinational repair and DNA end-joining. These mechanisms are inte-
grated with other cellular processes such as cell cycle regulation, transcription and repli-
cation and even use some common proteins. Ionising radiation causes a wide range of
base damage, as well as single strand breaks and double strand breaks in DNA. Proper
handling of such damage requires several repair mechanisms, as well as other defence
mechanisms.
Introduction
Genomes are damaged by environmental agents, spontaneous decay andreplication errors (Lindahl, 1993, Lindahl and Wood, 1999, Krokan et al.,1997, 2000). Genetic changes cause inheritable disease, cancer and prema-ture ageing. Ionizing radiation cause base damage, as well as single strandand double strand breaks in DNA. These types of damage require differentrepair mechanisms. All cancer cells carry mutations in genes involved ingrowth control, and most are genetically unstable. More than 104 DNA le-sions occur in each cell each day and defective DNA repair increases therisk of cancer (Lindahl, 1993). Furthermore, DNA repair is intimately inte-grated with cell cycle regulation, transcription and replication and use inpart common factors. Some 130 human DNA repair genes have been iden-
74
tified (Wood et al., 2001), but the real number is possibly twice as high,since less than 50% of known and putative genes have an identified func-tion. Adding genes involved in processes closely integrated with DNA re-pair probably increases the number of relevant genes several-fold. Only afraction of these have been identified and even fewer studied at the func-tional level. Protein-protein interactions and essential protein modifica-tions, e.g. phosphorylations, further increase the complexity of repairmechanisms.
The association between defects in DNA repair and cancer was estab-lished by James Cleaver in 1968. However, for approximately 25 years itwas thought that only rare syndromes, such as xeroderma pigmentosum(XP), Cockayne syndrome (CS) and ataxia teleangiectasia (AT) were asso-ciated with DNA repair defects (deBoer and Hoeijmakers, 2000). More re-cently, it has become clear that some of the most common hereditary formsof cancer are also associated with defects in DNA repair or processes inte-grated with and required for efficient DNA repair. These include hereditarynonpolyposis colon cancer (HNPCC), (Fishel et al., 1993) and early onsetbreast cancer (Cantor et al., 2001). In early onset breast cancer eitherBRCA1 or BRCA2 are mutated. These genes are required for repair of dou-ble strand breaks in DNA (Cantor et al., 2001, Khanna and Jackson, 2001).Thus, defects in the excision systems NER and MMR, as well as translesionsynthesis (TLS) and DNA double strand break repair, are all associatedwith increased cancer risk. These observations have dramatically increasedthe general interest in DNA repair
Cells handle damage by two principally very different mechanisms; a) true repair mechanisms that restore DNA in an essentially error-freemanner; and b) damage tolerance mechanisms, which may be either error-prone or error-free. In the latter, the damage is initially tolerated and by-passed by the replication machinery, and only repaired later. This mecha-nism includes recombination repair, which is essentially error free, andtranslesion synthesis (TLS) which is error prone. In TLS, recently discov-ered DNA polymerases copy the damaged DNA, but with reduced fidelity.This process is therefore error prone and mutagenic (Baynton and Fuchs,2000). The true repair mechanisms include direct repair, excision repair andrepair of double strand breaks (DSBs), by homologous recombination (HR)or non-homologous end joining (NHEJ). The best example of direct repairis demethylation of O6-methylguanine by O6-methylguanine-DNA methyl-transferase (MGMT). This restores normal guanine in DNA in a one-stepreaction in which the methyl group is transferred to a cysteine residue inMGMT, which thereby becomes enzymatically inactivated (Kaina et al.,2001). The excision repair mechanisms include base excision repair (BER),nucleotide excision repair (NER) and mismatch-repair (MMR). For all ofthese, the damaged strand is incised and a part including the damage re-
75

moved. The complementary strand is then used for resynthesis of the miss-ing segment in the damaged strand.
Nucleotide excision repair
Three known syndromes are associated with defects in NER; xerodermapigmentosum (XP), Cockayne syndrome (CS) and trichthiodystrophy(TTD). These are all rare syndromes which have been comprehensively dis-cussed elsewhere (deBoer and Hoeijmakers, 2000). Among these, only XPis cancer prone whereas the others cause developmental abnormalities andother phenotypic changes such as short stature. The NER pathway recog-nises lesions that cause major distortion of the DNA helix, such as pyrimi-dine dimers and benz(a)pyrene adducts (deBoer and Hoeijmakers, 2001). Itmay not have a role in repair of damage caused by ionizing radiation. InNER, the damaged strand is cleaved on both sides of the lesion, releasingan oligonucleotide of approximately 30 nucleotides containing the damage.The gap is then filled and sealed. NER requires at least 25 polypetides andtwo subpathways have been identified; global genome repair (GGR) andtranscription coupled repair (TCR). In TCR, a transcription complex thathas stalled at a site of damage in a strand undergoing transcription is re-moved and factors involved in TCR are recruited. Two proteins, Cockaynesyndrom protein A (CSA) and Cockayne syndrom protein B (CSB) are re-quired for initiation of TCR, but not for GGR. Mutations in the genes forCSA or CSB cause Cockayne syndrome, which is characterised by defi-cient TCR, but proficient GGR. GGR does not require CSA or CSB. InGGR, damage is recognised by XPC in complex with HR23B. Subsequentsteps are common for TCR and GGR. XP may be caused by mutations in atleast 7 different genes (XPA through XPG) required for NER, giving rise tosomewhat different phenotypes. In addition, an XP-variant (XP-V) exists,and this disease is not caused by NER but instead a defect in translesionsynthesis (TLS) (Masutani et al., 1999, reviewed in deBoer and Hoeijmak-ers, 2001). In XP-V the gene for the moderately error prone DNA poly-merase η (“eta”) (which can bypass thymine dimers) is inactivated by mu-tation. DNA polymerase ( has the capacity to insert AA with relatively highfidelity when bypassing a thymine dimer. In XP-V its function is probablyreplaced by the much more error prone DNA polymerase ι (“iota”) whichintroduces mutations (Tissier et al., 2000).
76

Mismatch repair (MMR)
Mismatches in DNA occur mostly as a result of replication errors, especial-ly in microsatellites containing repeats, e.g. dinucleotide repeats. A hall-mark of defect in MMR is therefore microsatellite instability. In Es-cherichia coli, three proteins are uniquely involved in recognising the mis-match and initiating degradation of the DNA-segment containing the mis-matched base or bases. These are MutH, MutS and MutL. Mammalian cellscontain several homologues of MutH and MutL, but apparently not ofMutS. Several other E. coli proteins, also used for other purposes, are re-quired to complete MMR. Hereditary non-polyposis colon cancer (HN-PCC) in man is caused by mutations in genes for mismatch repair (MMR),most commonly in the genes hMSH2 (45%), hMLH1 (45%) and hPMS1/2(10%). Furthermore, mutations in these MMR-genes are also observed in10-12% of sporadic colon cancers, the significance of which is not yetknown. MMR is not thought to be involved in repair of damage induced byionising radiation (Jiricny et al., 2000).
Base excision repair (BER)
The last of the excision repair systems, BER, is now reasonably well under-stood as far as genes/proteins involved and mechanism of repair is con-cerned (Figure 1). Although BER probably is responsible for repair of amajority of cellular DNA damages (reviewed in Lindahl, 1993, Krokan etal., 1997, 2000), the functional significance of BER in prevention of diseaseremains unclear. The BER-pathway is the main mechanism for removal ofendogenous DNA lesions that cause minor helix distortions (Lindahl 1993).In addition, BER is required for repair of similar types of base damagecaused by environmental agents, such as alkylations from nitrosamines andbase damage from ionising radiation. Endogenous sources of damage in-clude DNA damage caused by hydrolytic processes, such as hydrolyticdeamination of cytosine, adenine and guanine and hydrolytic base loss(mostly purines), oxidation by reactive oxygen species (e.g. hydroxyl radi-cals), as well as endogenous alkylating agents such as S-adenosylmethion-ine (SAM), (Krokan et al., 1997, 2000).
The BER pathway is initiated by non-enzymatic base loss, or by a DNAglycosylase. Each DNA glycosylase is specific for a limited number ofdamaged bases (Krokan et al., 1997, 2000, Lindahl and Wood 1999). DNAglycosylases are either monofunctional and remove the base only, leavingan intact abasic site (e.g. uracil-DNA glycosylase and alkylpurine-DNAglycosylase), or are bifunctional because they in addition to the glycosylaseactivity have a lyase activity, which cleaves DNA 3’ of the abasic site (AP-
77

site). At least 8 different human DNA glycosylases have been identified(Table I). Subsequent to base removal, repair is completed by short patchrepair (one nucleotide gap), or long patch repair (2-8 nucleotide gap), (Pas-cucci et al., 1999, Matsumoto et al., 1999). These mechanisms largely usedifferent enzymes and accessory proteins (Fig. 1).
Table 1. Human DNA glycosylases identified
Name Lyase Chrom. Preferred substrates Localization
hUNG1 No Mitochondria 12q24.1 Uracil (ssDNA>dsDNA)hUNG2 No Nuclei “ “hSMUG1 No Nuclei? 12q13.1-q14 5OH-MeUracil and UracilhTDG No Nuclei 12q24.1 U:G>(C:G<T:GhMBD4 No Not known 3q21 U or T in U/TpG:5meCCpG hMPG No Nuclei/mit? 16p (tel) 3meA, 7MeA, 3meG, 7meG,
8-oxoG, hpx, εA, /εG, A, GhOGG1 Yes Nuclei/mit 3p25 Me-fapyG:C>fapyG:C>
8oxoG:C>8oxoG:ThMYH Yes? Nuclei/mit p32.1-p34.3 A:G, A:8oxoG (removes A)hNTH1 Yes Nuclei (+mit?) 16p13.2-13.13 T/C-glycol, dihydrouracil, fapy
The steps involve formation of a single stranded gap, filling of the gap byDNA synthesis, and ligation. The choice of pathway is at least in part deter-mined by the nature of the DNA glycosylase (Fortini et al., 1999) and thenature of the resultant AP-site, but may also depend on the timing in the cellcycle and subnuclear localisation of the process (Otterlei et al., 1999).Thus, the long patch pathway requires a number of factors that are also usedin DNA replication, such as DNA pol δ or ε apparently stimulated by DNApol δ or ε FEN1, PCNA, DNA ligase 1 and possibly RPA (reviewed inKrokan et al., 2000). At least for removal of misincorporated uracil, the re-pair process takes place in replication foci (Otterlei et al., 1999) and resultsfrom mice with targeted deletion in the Ung-gene strongly implicates theUng-protein in this process (Nilsen et al., 2000). Short patch repair does notrequire PCNA or FEN1 and uses DNA polymerase β and DNA ligase IIIstimulated by XRCC1 (Kubota et al., 1996). This information is largelyderived from successful in vitro reconstitution experiments in a number oflaboratories with purified factors or cell extracts (for a methods description,see Frosina et al., 1999).
The choice of pathway may be of special importance for repair of oxi-dised bases, as these often appear in clusters in combination with strand
78

79
Fig. 1. Alternative BER pathways. A, B: Short-patch BER initiated by bifunctional(hOGG1) or monofunctional (UNG) glycosylase, respectively. Unmodified AP-sitesresults in a one-nucleotide repair patch generated by a common ligation step. C: Reduced or oxidised AP-sites are processed via the PCNA-dependent pathway,and involves cleavage of a 2-8 nucleotide “flap” by FEN1.
G
TGTG CC A C G AC
•o•o •o•o •o•o •o•o •o•o •o•o
•o•o•o•o•o•o•o•o•o•o •o•o
OH
HO
G T U C G TC A G G AC
•o•o •o•o •o•o •o•o •o•o •o•o
•o•o•o•o•o•o•o•o•o•o •o•o
OH
HO
hOGG1bifunctional
hUNG2monofunctional
G T C G TC A C G AC
•o•o •o•o •o•o •o•o •o•o
•o•o•o•o•o•o•o•o•o•o •o•o
OHHO
HN Enz
3’-β-lyase
G T C G TC A C G AC
•o•o •o•o •o•o •o•o •o•o
•o•o•o•o•o•o•o•o•o•o •o•o
OH
HO
O
3’-trimming by HAP1 or Polβ
G T C G TC A C G AC
•o•o •o•o •o•o •o•o •o•o
•••o•o•o•o•o•o•o•o•o•o •o•o
OH
HO
O
OH
PolβXRCC1
G T C G TC A C G AC
•o•o •o•o •o•o •o•o •o•o
•••o•o•o•o•o•o•o•o•o•o •o•o
OH•o
OH
G
LigIIIαPolβXRCC1
G T C G TC A G G AC
•o•o •o•o•o•o
•o•o •o•o •o•o
•••o•o•o•o•o•o•o•o•o•o •o•o
OH
Unmodified AP-sites:
OH
HAP1, Polβ
G T C G TC A G G AC
•o•o •o•o•o•o
•o•o •o•o •o•o
•••o•o•o•o•o•o•o•o•o•o •o•o
OH
OH
Polβ , (HAP1)
OH
G T C G TC A G G AC
•o•o •o•o •o•o •o•o •o•o
•o•o•o•o•o•o•o•o•o•o •o•o
OH•o
OH
OH
C
PolβXRCC1
G T C G TC A G G AC
•o•o •o•o •o•o •o•o •o•o ••
•••o•o•o•o•o•o•o•o•o•o •o•o
OH•o
OH
C
Modified AP-sites:
G T C G T TC A G G A AC
•o•o •o•o •o•o •o•o •o•o •o•o ••
•o•o•o•o•o•o•o•o•o•o•o•o •o•o
OHOH
G T TC A G G A AC
•o•oC G
G
T•o•o
•o•o•o•o•o•o•o•o•o•o•o•o •o•o
OH
C
C
oo o o
OH
G
G
T TC
C
A G G A AC
•o•oC GT •
o•o•o•o•o•o•o•o•o•o•o•o •o•o
Coo o o
G T TC A G G A AC
•o•oC G T
•o•o
•o•o•o•o•o•o•o•o•o•o•o•o •o•o
OH
Coo o o
o
8oxoG U
G T C G TC A C G AC
•o•o •o•o •o•o •o•o •o•o ••
•o•o•o•o•o•o•o•o•o•o •o•o
OH•oG
HO
HO
HO
HO
HOHO
HO
HO
HO
HO
HO
HO
OH
HO
•o•o
•o•oOH
•o•oOH
OH
OH
•o•o
Short Patch Long Patch
Misincorporationsexcised by HAP1
8oxoG
Misincorporationsexcised by HAP1
G T C G TC A G G AC
•o•o •o•o •o•o •o•o •o•o ••
•o•o•o•o•o•o•o•o•o•o •o•o
OH•oC
HO
A B C

breaks. Interestingly, the known glycosylases directed against oxidisedbases are all bifunctional. Thus the DNA backbone is cleaved 3’- to the AP-site, and the baseless sugar is retained on the 3’- end and subsequently re-moved by HAP1 or Polβ. The lack of an 5’-dRP end apparently prevents 5’-3’ strand displacement during the polymerisation step, and occurs viasingle-nucleotide insertion. This mechanism avoids polymerisation acrossneighbouring strand breaks, which otherwise would have resulted in a dou-ble-strand break.
While the large number of damaged bases from endogenous sources andthe high conservation of the BER pathways suggest an important role forBER in maintenance of the DNA integrity, the significance of BER in pre-vention of disease is still not known. So far, search for inactivating muta-tions in BER-enzymes in human disease has given some indications on mu-tations in BER-proteins in cancer, but unlike other repair deficiencies nodistinct condition has so far been associated with defective BER. Possiblyan association with one distinct condition would be unlikely, consideringthe wide range of damage that is repaired by BER. DNA pol β mutants havebeen identified and may be associated with lung cancer (Bhattacharyyaetal., 1999). Furthermore, dominant negative mutants of DNA pol β havebeen identified in human cancer (Bhattacharyya and Banerjee, 1997). Un-fortunately, these interesting results appear not to have been followed up innew or expanded studies. As described below, mutations in the gene for 8-oxoguanine-DNA glycosylase (hOGG1) may also be associated with can-cer. In addition, promoter mutations in the UNG-gene so far only observedin cancer cells have also recently been reported. Mutations/allelic variationsin the human UNG-gene have also been reported, but are not specific tocancer cells (Kvaløy et al., 2001). Thus, while mutations in the BER genesmay not be common, subtle yet important BER-defects at the regulatorylevels may be more common. This may include unbalanced expression ofBER-proteins (reviewed in Frosina 2000), incorrect post-translational mod-ification or processing (not studied) and disrupted intracellular transport.Disrupted subcellular localisation of AP-endonuclease (HAP1) was report-ed to be quite frequent in colon cancer (Kakolyris et al., 1997) as well as inlung cancer, where nuclear localisation is associated with better prognosis(Kakolyris et al., 1999).
Repair of damage induced by ionising radiation and oxidativestress by BER, homologous recombination (HR) and non-homologues end joining (NHEJ)
Damage to DNA by ionizing radiation or oxidative stress comprises oxidativedamage to bases, sugar and single strand or double strand breaks in DNA. Inaddition, adjacent single strand breaks in opposite strands may be converted
80

81
Fig. 2. A wide range of oxidised and ring-fragmented nitrogen bases are formed byendogenous reactive oxygen species (ROS) or by ionising- or UV-radiation.
1, N6-ethenoadenine
N
N
N
R N
N
3,N4-ethenocytosine
N
N
N
O
N
N
O
H2NN
NO
8-oxoguanine
N
N
O
NH2
N HC O
2,5-amino 5-formamidopyrimidine
Thymine glycol
N
N
O
O
CH3
OH
OH
N
N
NH2
NH2
N HC O
4,6-diamino 5-formamidopyrimidine
H2N
N
N
OH
NH2
N HC O
H2N
2,6-diamino 4-hydroxy-5-formamidopyrimidine
N
N
OH
5-hydroxycytosine
O
NH2
N
N
5,6-dihydrothymine
O
O
CH3H N
N
5-hydroxy-5,6-dihydrothymine
O
OHCH3
H H
O
Uracil glycol
N
N
O
O OH
OH
Isodialuric acid
N
N
O
O OH
O
5,6-dihydrouracil
N
N
O
O H
H
5-hydroxy-5,6-dihydrouracil
N
N
O
O H
OH
5-hydroxyuracil
N
N
O
O
OH
5-hydroxyuracil
N
N
O
O
CHO N
N
O
O
CH2OH
5-hydroxymethyluracil
O
N
N
Urea
N
N
O
O
CH3
Methyltartronylurea
HO COOHN
NO
5-hydroxyhydantoin
O
OH
Cyclobutanepyrimidine dimer
N
N
O
O
CH3N
N
O
O
H3C
to double strand breaks upon replication. DSBs are lethal unless repaired.Base damage may be mutagenic, cytotoxic or both. DNA may be damageddue to direct hits from the ionising rays, or as secondary damage from radi-cals generated by the radiation. The generation of these is outlined in Table 2.

Table 2. Formation and deactivation of reactive oxygen species (ROS)
Generation of ROS:1. H2O → H2O
+ + e-
2. H2O+ + H2O → •OH + H3O
+ Hydroxyl radical
3. •OH + •OH → H2O2 Hydrogen peroxide
4. eaq + O2 → •O2- Superoxide radical
5. 2 O2- + 2 H+ → O2 + H2O2
Protection against ROS:Superoxide dismutases (cytoplasm and mitochondria):2O2• + 2H + → H2O2 + O2
Catalase removes hydrogen peroxide:2H2O2 → 2H2O + O2
Induction and repair of oxidative base damageThe mechanism of induction of damage, as well as structural changes inbases after exposure to oxidative stress have been comprehensively re-viewed recently (Dizdaroglu, 1999). More than 20 different types of basedamage after exposure to oxidative stress have been identified. Most ofthese are shown in figure 2. Repair of base damage, when known, is by theBER route. The most prevalent damage to purines is 8-hydroxyguanine, ormore commonly named 8-oxoguanine, while the most common damage topyrimidines is the formation of thymine glycol. The mechanism of induc-tion of base damage involves the action of free radicals and other reactiveoxygen species (ROS). These are generated when water is ionised by the ra-diation. Enzymatic mechanisms to detoxify ROS also are present in cellsand constitute a primary defence (Table 2). Furthermore, enzymatic hydrol-ysis of oxidised purine nucleoside triphosphates such as 8-oxo-dGTP, 8-oxo-dATP avoids errors caused by their misincorporation during DNAreplication (Sakai et al., 2001). Repair of DNA damage caused by ROS is asecondary defence mechanism. In the case of 8-oxoguanine a hydroxyl rad-ical, which is highly reactive, first reacts with guanine to form a C8-OH-adduct radical. Then the loss of an electron (e-) and proton (H+) generates8-oxoguanine. The C8-OH-adduct radical may also be reduced by uptakeof an electron and a proton forming 7-hydro-8-hydroxyguanine which issubsequently converted to 2,6-diamino-4-hydroxy-5-formamidopyrimidine
82

(FaPy), a second major oxidation product of guanine (Dizdaroglu, 1999).Generation of oxidised pyrimidines, such as thymine glycol, also resultsfrom radical attacks. First, reaction with a hydroxy radical yields 5-hy-droxy-6-yl-radical. In the absence of oxygen, loss of an electron followedby uptake of water and loss of a proton generates thymine glycol. In thepresence of oxygen, uptake of oxygen at position 6 first yields a 5-hydroxy-6 peroxyl radical which is converted to thymine glycol through loss of aproton and O2
.- and reaction with water. Several uracil-analogues are gener-ated from cytosines after exposure to ionising radiation or ROS from othersources. These analogues include, among others, alloxan, isodialuric acidand 5-hydroxyuracil (Fig. 2).
Studies on repair of base oxidative base damage have so far concentratedon major products, all of which are repaired by BER. 8-oxoguanine in thetemplate may lead to GC→TA transversion due to the altered base-pairingproperties of 8-oxoguanine (Lindahl, 1993, Lindahl and Wood, 1999). Mu-tations in the gene hOGG1 that encodes an 8-oxoG-DNA glycosylase (Au-debert et al., 2000a) as well as loss of heterozygosity (LOH) at this locus(Wikman et a., 2000) have been associated with lung cancer. Furthermore,missense mutations have been identified in approximately 4% of clear cellcarcinomas of the kidney (Audebert et al., 2000b). The studies on the muta-tions in the hOGG1 gene and association with various cancer forms (lung,kidney) possibly represent the strongest link between BER and cancer sofar. hOGG1 comes in seven splice forms (Nishioka et al., 1999), althoughtwo (hOGG1-1a and hOGG1-1b) are the most abundant forms at the tran-script level (Arai et al., 1997). hOGG1-1a is a nuclear protein and hOGG1-1b mitochondrial. hOGG1 is a bifunctional glycosylase that removes 8-ox-oguanine, as well as FaPy, and cleaves the damaged strand 3’ of the de-oxyribose resulting from the glycosylase activity. hOGG1 removes 8-ox-oguanine and FaPy residues with the highest efficiency when in pair withcytosine, and is followed by strand cleavage via beta-elimination. However,significant removal of 8-oxoG from mispairs (8-oxoG: T >G >A) is alsoobserved, but essentially without an associated strand cleavage. Interesting-ly, assays with abasic site DNA showed that strand cleavage was dependenton the presence of C in the opposite strand, irrespective of the prior removalof an 8-oxoG residue. Thus strand incisions are made only if repair com-pletion results in correct base insertion, whereas excision from mispairspreserves strand continuity and hence allows for error-free correction by apostreplicational repair mechanism (Bjørås et al., 1997). If an 8-oxogua-nine in the template generated by an oxidative attack results in incorpora-tion of dAMP during replication, the human MutY homologue hMYH re-moves adenine, thus initiating the BER process which may (or may not) re-sult in incorporation of the correct nucleotide, dCMP. If the incorrectdAMP is again incorporated, the cycle may if necessary be repeated until
83
dCMP is incorporated. Oxidative stress may also oxidise dGTP to 8-ox-odGTP, which can be misincorporated opposite of adenine in the templatestrand. This potential misincorporation is minimised by an 8-oxodGTPase(in E. coli MutT) which efficiently degrades 8-oxodGTP to 8-oxodGMP.The human orthologue is called hMTH1 (human MutT homologue 1).Thus, the cell prevents 8-oxoguanine-induced mutations both at the DNAlevel by DNA glycosylases (hOGG1 and hMYH) and the dNTP level(hMTH1). In addition, it has been demonstrated that other mechanismscontribute to removal of 8-oxoguanine in DNA. Thus, it has been demon-strated that the removal of 8-OxoG in a wild-type mouse embryonal fibrob-last (MEF) cell line is faster in the transcribed strand (TS) than in the non-transcribed strand (NTS), indicating TCR of 8-OxoG in murine cells. Fur-thermore, in a MEF cell line from a gene targeted mouse deficient in Ogg1(ogg1(-/-)), 8-OxoG was not removed from the NTS whereas there was stillefficient 8-OxoG repair in the TS. Introduction of Ogg1 protein in theOgg1-deficient cell line restored the ability to remove 8-OxoG in the NTS.Thus, TCR is involved in removal of 8-oxoguanine from the TS, but not inthe NTS (La Page et al., 2000a). This backup system may explain the lack amutagenic phenotype of knockout mice deficient in Ogg1-activity (Klung-land et al., 1999). TCR of 8-oxoguanine has been demonstrated to requireXPG, TFIIH, and CSB proteins. Furthermore, defective TCR results in en-hanced mutation frequencies at 8-oxoguanine. In addition, 8-oxoguaninealso blocks transcription by RNA polymerase II and this may be the signalrequired for release of the polymerase and recruitment of repair factors (LaPage et al., 2000b).
Oxidised pyrimidines, such as thymine glycol are also repaired by BER.Thymine glycol and some related bases are removed by the bifunctionalDNA glycosylase hNTH1, a homologue of bacterial Nth (Eide et al., 2001).Interestingly, XPG strongly stimulated removal of thymine glycol byhNTH1, demonstrating yet another function of XPG. The XPG proteinstimulates the binding of HsNTH protein to its substrate and increases itsglycosylase/AP lyase activity by a factor of approximately 2 through directinteraction between the two proteins (Bessho, 1999). Several oxidised cy-tosines, e.g. isodialuric acid, 5-hydroxyracil and alloxan, have structures re-sembling uracil and are in fact removed by human uracil-DNA glycosylasefrom the UNG gene (Dizdaroglu et al., 1996). Although the rate of removalof these derivatives is slow compared with the preferred substrate, uracil, itis approximately as fast as the removal of various oxidised substrates byother DNA glycosylases (Krokan et al., 1997). However, the possible phys-iological significance of UNG-protein in removal of oxidation products re-mains to be determined.
84

Table 3. Ataxia teleangiectasia: increased sensitivity to ionising radia-tion
Characteristics:• Incidence 1 in 300,000, autosomal recessive• Progressive cerebellar ataxia, teleangiectasies, immune deficiency• High risk of lymphoma or leukemia• Increased sensitivity to ionising radiation • Heterozygotes (1 in 550) have increased risk of cancer, especially in
breast
Genetics:• ATM gene in 11q22-23 mutated, large gene, 66 exons, > 300 mutations
known• 4 complementation groups, but all mutated in the ATM gene• Several chromosomal aberrations in AT (chromatid gaps, breaks, translo-
cations)• Normal ATM-protein senses double-stranded DNA breaks, activates cell
cycle check points and modulates several processes, also involved inmeioses
Repair of double strand breaks by homologous recombination (HR)and non-homologous end joining (NHEJ) Double strand breaks (DSBs) are generated by a variety of genotoxicagents, including ionising radiation and radiomimetic chemicals. In addi-tion, they can be generated when advancing DNA replication complexes ar-rive at single stranded breaks in the template. They are also generated as in-termediates during certain site-specific recombination processes (reviewedin Jackson, 2001). A single unrepaired cellular DSB can result in cell death,thus their repair is very important. Mammalian cells deal with DSB usingseveral mechanisms. These include signalling of damage, repair by at leasttwo different systems, cell cycle arrest, apoptosis and apparently adaptivesurvival responses.
In mammalian cells, the repair of DNA double-strand breaks (DSBs) oc-curs by both homologous and non-homologous mechanisms. Several arti-cles and reviews have suggested that NHEJ is much more frequent than re-pair by HR. However, the mechanism of repair may be cell cell-cycle de-pendent. Thus, more recent research indicates that HR may be the predom-inant mechanism after completion of the S-phase when an identical copy ofthe DNA strand, the sister chromatid, is available, In G1, only the homolo-gous chromosome is available and this may be harder to find, thus NHEJmay be the preferred mechanism of repair in G1 (reviewed in Hoeijmakers,2001, Pastink et al., 2001). The sister chromatid is apparently preferred
85

2-3 orders of magnitude to a homologous or heterologous chromosome(Johnson and Jasin, 2001). Whereas HR is essentially error free, NHEJ mayinvolve loss or gain of a few nucleotides.
HR and NHEJ are very different mechanisms and they require largelydifferent protein factors. However, both require the ATM-protein encodedby the ATM gene for damage recognition and probably for recruitment ofrepair factors. Inactivating mutations in ATM cause ataxia teleangiectasia, arare syndrome characterised by highly increased sensitivity to ionising ra-diation, cerebellar degeneration, teleangiectasias, increased cancer risk andimmunodeficiency (Table 3). ATM and ATR (ataxia teleangiectasia relatedprotein) are very large protein kinases which together with DNA-PKcs arerequired for phosphorylation of histone H2AX in the DNA domain next tothe DSB over a distance of a megadalton. This phosphorylation takes placewithin 1-3 min after damage induction and may produce a chromatin staterequired for repair. H2AX rapidly forms nuclear foci at the break site andRAD50, RAD51 and BRCA1 are later recruited to such foci (Paull et al.,2000).
In HR the complex RAD50/MRE11/NBS1 has a 5’-3’ exonuclease activ-ity that digest several nucleotides from both strands, preparing DNA forstrand invasion (Fig. 3), (Hoeijmakers, 2001). RPA may promote assemblyof RAD51 (a RecA homologue) nucleofilament on the protruding ends. Thenucleofilament may also include the related proteins XRCC2, XRCC3 andRAD51B, C and D. RAD52 stimulates the assembly. RAD54, a DNA-de-pendent ATPase that interacts with RAD51, has been shown to induce su-percoiling and may stimulate recombination indirectly by displacing his-tones and/or other proteins packaging the DNA into chromatin (Ristic et al.,2001). This process also requires BRCA2 that may be involved in nucleartranslocation of RAD51 and BRCA1. Having set up the damaged DNA forstrand invasion, an intact double stranded sister chromatid is identified andis used as template for copying damaged regions by DNA synthesis frombroken ends. The Holliday junctions are resolved by resolvases, and theprocess completed by ligation (Hoeijmakers, 2001).
NHEJ is apparently the preferred process in G1 cells in which no sisterchromatid is available. As mentioned, the homologous chromosome is inef-ficiently used in HR, relative to the sister chromatid. In template-indepen-dent repair by NHEJ, the ends of DSB are joined, but not without frequenterrors in the form of loss or gain of a few nucleotides. NHEJ requires theKU70-KU80 complex that binds to the broken ends. KU70 and KU80 areregulatory subunits of DNA-dependent protein kinase (DNA-PK) whichalso contains a 460-kDa catalytic subunit (DNA-PKCS). Exactly how thecomplex functions in NHEJ is not clear, but one role is presumably to ap-proximate the ends and to protect them from degradation. DNA-PK alsohas other functions, e.g. S-phase checkpoint arrest following irradiation.
86

87
Ku and DNA-PK
bind DNA ends
Rad50/Mre11/NBS1-
complex fills gap
XRCC4/LigIVpolishes and
seals
Strands are
repaired (error-
prone)
Rad50/Mre11/NBS1-
complex resects 5’ends.
3’ends protected by RPA
Rad51 binds 3’-ends
� �
Homologous strands
are synthesised
Repair is finalised by
DNA ligase and resolvases
(error-free)
Rad51/52/54 facilitates
homology search and
branch migration
A B
Fig. 3. Mechanisms of DSB repair. A: In non-homologous end-joining the two endsare rejoined directly by end-binding protein heterodimer Ku70/80 and DNA-PKCS.XRCC4/ligase4 covalently seals the break. DNA-ends that require processing beforeligation, are digested by the Rad50/Mre11/Nbs1-complex, and generally result inminor deletions in the DNA. B: Homologous recombination is less understood, butinvolves digestion of the 5’-ends and formation of a 3’-nucleoprotein filament con-taining Rad51/52/54 and accessory proteins. This filament invades a homologoussequence of a sister-chromatid, which is then used as a template for proper healingof the broken ends by DNA-synthesis. Finally, the so-called Holliday-junction is re-solved by resolvases.

Ligation is carried out by the XRCC4-Ligase4 complex (Hoeijmakers,2001).
In conclusion, repair of DSBs in DNA is starting to become understood,although the information on the proteins involved and their mechanisms ofaction are far from complete. Many proteins are conserved from bacteria toman, but the repair process is much more complicated in man than in bacte-ria, e.g. many homologues of bacterial RecA are present in mammaliancells. Given the importance of repair of DSB in prevention of cell death, aswell as prevention of cancer development it should be a matter of high pri-ority.
AcknowledgementThis work was supported by The Research Council of Norway, The Norwe-gian Cancer Society, The Cancer Fund at the Regional Hospital in Trond-heim and The Svanhild and Arne Must Fund for Medical Research.
REFERENCES
Arai K, Morishita K, Shinmura K, Kohno T, Kim SR, Nohmi T, TaniwakiM, Ohwada S, Yokota J, 1997. Cloning of a human homolog of the yeastOGG1 gene that is involved in the repair of oxidative DNA damage.Oncogene, 14:2857-2861.
Audebert M, Chevillard S, Levalois C, Gyapay G, Vieillefond A, Kli-janienko J, Vielh P, El Naggar AK, Oudard, S, Boiteux S, Radicella JP,2000. Alterations of the DNA repair gene OGG1 in human clear cell car-cinomas of the kidney. Cancer Res., 60:4740-4744.Audebert, M., Radi-cella, J.P. and Dizdaroglu, M., 2000. Effect of single mutations in theOGG1 gene found in human tumors on the substrate specificity of theOgg1 protein. Nucleic Acids Res., 28: 2672-2678.
Baynton K, Fuchs RP, 2000. Lesions in DNA: hurdles for polymerases.Trends Biochem. Sci., 25:74-79
Bessho T, 1999. Nucleotide excision repair 3’ endonuclease XPG stimu-lates the activity of base excision repair enzyme thymine glycol DNAglycosylase. Nucleic Acids Res., 27:979-978.
Bhattacharyya N, Banerjee S, 1997. A variant of DNA polymerase ( acts asa dominant negative mutant. Proc. Natl. Acad. Sci. U S A., 94:10324-10329.
Bhattacharyya N, Chen HC, Comhair S, Erzurum SC, Banerjee S, 1999.Variant forms of DNA polymerase β in primary lung carcinomas. DNACell Biol., 18: 549-554.
88

Bjøras M, Luna L, Johnsen B, Hoff E, Haug T, Rognes T, Seeberg E, 1997.Opposite base-dependent reactions of a human base excision repair en-zyme on DNA containing 7,8-dihydro-8-oxoguanine and abasic sites.EMBO J., 16:6314-6322.
Cantor SB, Bell DW, Ganesan S, Kass EM, Drapkin R, Grossman S,Wahrer DC, Sgroi DC, Lane WS, Haber DA, Livingston DM, 2001.BACH1, a novel helicase-like protein, interacts directly with BRCA1and contributes to its DNA repair function. Cell, 105:149-160.
Cleaver JE, 1968. Defective repair replication of DNA in xeroderma pig-mentosum. Nature, 218:652-656.de Boer J, Hoeijmakers, JH, 2000. Nucleotide excision repair and humansyndromes. Carcinogenesis, 21:453-460.
Dizdaroglu M, 1999. Mechanisms of oxidative damage: Lesions and theirmeasurement. In «Advances in DNA Damage and Repair», edited byDizdaroglu and
Karakaya; Kluwer Academic/Plenum Publishers, New York, pp 67-87.Eide L, Luna L, Gustad EC, Henderson PT, Essigmann JM, Demple B, See-
berg E, 2001. Human endonuclease III acts preferentially on DNA dam-age opposite guanine residues in DNA. Biochemistry, 40:6653-6659.
Fishel R, Lescoe, MK, Rao MR, Copeland NG, Jenkins NA, Garber J, KaneM, Kolodner R, 1993. The human mutator gene homolog MSH2 and itsassociation with hereditary nonpolyposis colon cancer. Cell, 75:1027-1038.
Fortini P, Parlanti E, Sidorkina OM, Laval J, Dogliotti E, 1999. The type ofDNA glycosylase determines the base excision repair pathway in mam-malian cells. J. Biol. Chem., 274:15230-15236.
Frosina G, 2000. Overexpression of enzymes that repair endogenous dam-age to DNA. Eur. J. Biochem., 267:2135-2149.
Frosina G, Cappelli E, Fortini P Dogliotti E, 1999. In vitro base excision re-pair assay using mammalian cell extracts. Methods Mol. Biol., 113:301-315.
Hoeijmakers JH, 2001. Genome maintenance mechanisms for preventingcancer. Nature, 411:366-374.
Jackson SP, 2001. Detecting, signalling and repairing DNA double-strandbreaks. Biochem. Soc. Trans., 29:655-661.
Jiricny J, Nystrom-Lahti M, 2000. Mismatch repair defects in cancer. Curr.Opin. Genet. Dev., 10:157-161.
Johnson RD, Jasin M, 2001. Double-strand-break-induced homologous re-combination in mammalian cells. Biochem. Soc. Trans., 29:196-201.
Kaina B, Ochs K, Grosch S, Fritz G, Lips J, Tomicic M, Dunkern T, Christ-mann M, 2001. BER, MGMT, and MMR in defense against alkylation-induced genotoxicity and apoptosis. Prog. Nucleic Acid Res. Mol. Biol.,68:41-54.
89

Kakolyris S, Giatromanolaki A, Koukourakis M, Kaklamanis L, KanavarosP, Hickson ID, Barzilay G, Georgoulias V, Gatter KC, Harris AL, 1999.Nuclear localization of human AP endonuclease 1 (HAP1/Ref-1) associ-ates with prognosis in early operable non-small cell lung cancer(NSCLC). J. Pathol., 189:351-357.
Kakolyris S, Kaklamanis L, Engels K, Turley H, Hickson ID, Gatter KC,Harris AL, 1997. Human apurinic endonuclease 1 expression in a col-orectal adenoma-carcinoma sequence. Cancer Res., 57:1794-1797.
Khanna KK, Jackson SP, 2001. DNA double-strand breaks: signaling, re-pair and the cancer connection. Nat. Genet., 27:247-254.
Klungland A, Rosewell I, Hollenbach S, Larsen E, Daly G, Epe B, SeebergE, Lindahl T, Barnes DE, 1999. Accumulation of premutagenic DNA le-sions in mice defective in removal of oxidative base damage. Proc. Natl.Acad. Sci. U S A, 96:13300-13305.
Krokan HE, Nilsen H, Skorpen F, Otterlei M, Slupphaug G, 2000. Base ex-cision repair of DNA in mammalian cells. FEBS Lett., 476:73-77.
Krokan HE, Standal R, Slupphaug, G, 1997. DNA glycosylases in the baseexcision repair of DNA. Biochem. J., 325:1-16.
Kubota Y, Nash R, A, Klungland A, Schär P, Barnes DE, Lindahl T, 1996.Reconstitution of DNA base excision-repair with purified human pro-teins: interaction between DNA polymerase ( and the XRCC1 protein.EMBO J., 15:6662-6670.
Kvaløy K, Nilsen H, Steinsbekk KS, Nedal A, Monterotti B, Akbari M,Krokan HE, 2001. Sequence variation in the human uracil-DNA glyco-sylase (UNG) gene. Mutat. Res., 461:325-338.
Le Page F, Klungland A, Barnes DE, Sarasin A, Boiteux S, 2000. Tran-scription coupled repair of 8-oxoguanine in murine cells: the ogg1 pro-tein is required for repair in nontranscribed sequences but not in tran-scribed sequences. Proc. Natl. Acad. Sci. USA, 97:8397-8402.
Le Page F, Kwoh EE, Avrutskaya A, Gentil A, Leadon SA, Sarasin A,Cooper PK, 2000. Transcription-coupled repair of 8-oxoguanine: re-quirement for XPG, TFIIH, and CSB and implications for Cockaynesyndrome. Cell, 101:159-171.
Lindahl T, 1993. Instability and decay of the primary structure of DNA. Na-ture, 362:709-715.
Lindahl T, Wood RD, 1999. Quality control by DNA repair. Science,286:1897-1905.
Masutani C, Kusumoto R, Yamada A, Dohmae N, Yokoi M, Yuasa M, Ara-ki M, Iwai S, Takio K, Hanaoka F, 1999. The XPV (xeroderma pigmen-tosum variant) gene encodes human DNA polymerase (. Nature,399:700-704.
Matsumoto Y, Kim K, Hurwitz J, Gary R, Levin DS, Tomkinson AE, ParkMS, 1999. Reconstitution of proliferating cell nuclear antigen-depen-
90
dent repair of apurinic/apyrimidinic sites with purified human proteins.J. Biol. Chem., 274: 33703-33708.
Nilsen H, Rosewell I, Robins P, Skjelbred CF, Andersen S, Slupphaug G,Daly G, Krokan HE, Lindahl T, Barnes DE, 2000. Uracil-DNA glycosy-lase (UNG)-deficient mice reveal a primary role of the enzyme duringDNA replication. Mol. Cell, 5:1059-1065.
Nishioka K, Ohtsubo T, Oda H, Fujiwara T, Kang D, Sugimachi K,Nakabeppu Y, 1999. Protein Expression and differential intracellular lo-calization of two major forms of human 8-oxoguanine DNA glycosylaseencoded by alternatively spliced OGG1 mRNAs. Mol. Biol. Cell.,10:1637-1652.
Otterlei M, Warbrick E, Slupphaug G, Nagelhus TA, Haug T, Akbari M,Aas PA, Steinsbekk K, Bakke O,Krokan HE, 1999. Postreplicative BaseExcision Repair in Replication Foci. EMBO J., 18:3834-3844.
Pascucci B, Stucki M, Jonsson, ZO, Dogliotti E, Hübscher U, 1999. Longpatch base excision repair with purified human proteins. DNA ligase I aspatch size mediator for DNA polymerases ( and (. J. Biol. Chem.,274:33696-33702.
Pastink A, Eeken JC, Lohman PH, 2001. Genomic integrity and the repairof double-strand DNA breaks. Mutat. Res., 480-481:37-50.
Paull TT, Rogakou EP, Yamazaki V, Kirchgessner CU, Gellert M, BonnerWM, 2000. A critical role for histone H2AX in recruitment of repair fac-tors to nuclear foci after DNA damage. Curr. Biol., 10:886-895.
Ristic D, Wyman C, Paulusma C, Kanaar R, 2001. The architecture of thehuman Rad54-DNA complex provides evidence for protein transloca-tion along DNA. Proc Natl. Acad. Sci. U S A, 98:8454-6840.
Sakai Y, Furuichi M, Takahashi M, Mishima M, Iwai S, Shirakawa M,Nakabeppu Y., 2002. A molecular basis for the selective recognition of2-hydroxy-dATP and 8-Oxo-dGTP by human MTH1. J. Biol. Chem., (inpress).
Tissier A, Frank EG, McDonald JP, Iwai S, Hanaoka F, Woodgate R, 2000.Misinsertion and bypass of thymine-thymine dimers by human DNApolymerase (. EMBO J., 19:5259-5266.
Wikman H, Risch A, Klimek, F, Schmezer P, Spiegelhalder B, DienemannH, Kayser K, Schulz V, Drings P, Bartsch H, 2000. hOGG1 polymor-phism and loss of heterozygosity (LOH): significance for lung cancersusceptibility in a caucasian population. Int. J. Cancer, 88:932-937.
91

Low-dose hypersensitivity and adaptive responses to radiation
E. O. Pettersen
Research Section for Biophysics, Department of Physics,The University of Oslo,
P. O. Box 1048, Blindern N-0316 Oslo, NorwayE-mail: [email protected]
Abstract
Radiation doses below 0.3 Gy induce surprisingly large effects in most cells of human
origin. Often as much as 5 % of the irradiated cells are inactivated by 0.3 Gy, while
slightly higher doses, i.e. up to 1 Gy, may induce less cell inactivation. Thus, there is in-
creasing survival with increasing doses over a small dose range up to about 1 Gy for
many cell types. This phenomenon is usually considered to be a result of adaptation.
Adaptation is, however, best illustrated by giving the cells an initial small dose of 0.3Gy
a few hours before irradiation. Hypersensitivity is then absent. In the present paper hy-
persensitivity and adaptation are discussed on basis of observations in the literature
showing that small radiation doses may counteract cancer in some cases. A hypothesis is
presented and discussed which takes these aspects into consideration to explain possible
mechanisms for such protection. The main idea is that hypersensitivity may represent a
protection against cancer development, since some of the cells killed by ultra-low radia-
tion doses may have a burden of DNA damage before irradiation, for example due to
metabolic and thermal processes.
Adaptive response as induced by a small priming radiation dose
The term adaptive responses to ionizing radiation usually means that thecellular sensitivity to a dose of radiation decreases if the cells are given asmall radiation dose (5-40 cGy) a few hours prior to irradiation (Olivieri etal. 1984; Skov 1999a). In some reports priming has been observed even atlower radiation doses and with negative correlation to the priming dose (Caiand Liu 1990). The priming radiation dose protects not only against subse-quent irradiation, but also against subsequent treatment with DNA-damag-ing chemicals (Wolff et al. 1988; Wolff 1992; Caney et al. 1999). The prim-
92

ing dose obviously activates processes in the cells that tend to change theirsensitivity to a subsequent radiation dose. It has been reported that small ra-diation doses at the dose level which induces priming, involve increasedDNA-repair (Ikushima et al. 1996), but also induction of several stressgenes in p53-competent cells (Amundson et al. 1999) and repression of agene which is not repressed by high radiation doses (Robson et al. 1999).
Adaptive responses have been seen with several types of endpoints, likechromosomal abberrations (Olivieri et al. 1984), cell survival (Shadley andDai 1992; Marples and Joiner 1995) and carcinogenesis (UNSCEAR1994).
Different laboratories have presented different data for adaptive effects.This is probably due to variations between different cell lines concerningadaptive responses (Raaphorst and Boyden 1999). In a recent paperRaaphorst and Boyden (1999) report that the adaptive response does notseem to be related to cell radiosensitivity or to whether or not cells originatefrom normal or from cancer tissue.
The adaptive response is obviously depending on protein synthesis. Fol-lowing the priming dose, it takes several hours before a significant adaptiveeffect can be observed (Shadley et al. 1987), and if protein synthesis is in-hibited with cycloheximide, no adaptive effect is seen (Youngblom et al.1989).
Low-dose hypersensitivity and induced radio-resistance
These terms refer to the observation that cell survival is more reduced perdose increment for small radiation doses (less than 50 cGy of X- or γ-rays)than for larger doses. On a dose response curve there is a steep initial slope,followed by a flat region (or in some cases even an increased survival withincreasing dose over a small dose region), then a shoulder and a subsequentsteeper region (Marples and Joiner 1993, Lambin et al. 1993) (Fig. 1). Thismeans that radiation response to acute irradiation is dose dependent, with ahypersensitive region for doses below about 20 cGy and lower sensitivityfor larger doses. In other words, small acute doses (below about 20 cGy) aremore lethal per absorbed energy unit than larger doses.
This effect is not due to variations of radiation response of cells in differ-ent phases of the cell cycle (Marples and Joiner 1993; Lambin et al. 1994;Short et al. 1999, Chadwick and Leenhouts 1998 and Wouters and Skars-gard 1998). The low-dose hypersensitivity is overcome by a priming doseof 0.05 to 1 Gy given 6 hours prior to the challenge dose (Marples and Join-er 1995). It is also overcome if the cells are given a pre-treatment with hy-drogen peroxide (Marples and Joiner 1995). A standing theory is that theadaptive responses operate via reactive oxygen species (Feinendegen
93

1999). It probably involves repair of DNA and that protein synthesis isneeded, since the effect is counteracted if the protein synthesis inhibitor cy-cloheximide is present during a 6 hours interval between doses (Marplesand Joiner 1995).
The variation in radiosensitivity in various phases of the cell cycle is seenin the part of the cell survival curve above 50cGy (Skarsgard et al. 1994).
Adaptive response versus hormesis
There has been some confusion about the two terms adaptive responses andradiation hormesis. These terms are not synonymous.
Adaptive responses relate to an increased ability of cells and organismsto resist radiation damage following a priming radiation dose. Still, thewell-being of the cells is not better after the priming dose than before the ir-radiation.
With radiation hormesis, however, the response is different. By a hormet-ic effect most researchers mean that the cell or organism appear to have im-proved, for example in growth, survival or some other characteristics afterlow-level radiation as compared to the situation before. (Mossman andLedesma 1999). Hormesis might, for example, improve the activity of theimmune system during its recovery from a small radiation dose (Macklisand Beresford 1991). It can even be argued that an adaptive effect may en-tail hormesis although this is not necessarily so (Feinendegen 1999). In-duced radioresistance, as observed by the change of slope of the dose re-sponse curve at doses above 5-40 cGy, is probably not the effect of horme-sis (Skov 1999b).
A problem with the term hormetic effect using this interpretation, is that allorganisms are under constant background irradiation. Although this radiationlevel is usually very low, it is not zero. All organisms may, therefore, experi-ence a hormetic effect even at the ordinary background level of irradiation.
Is it possible to explain how low-dose radiation can protectagainst cancer?
Large radiation doses (i.e. >50-100mSv) undoubtedly have carcinogenic ef-fects (e.g. Thompson et al. 1994), although such effects are much smallerthan most people seem to believe. The excess relative risk, meaning the ra-tio of the cancer frequency between exposed and non-exposed persons wasfound to be less than 1.6 in all tested cancers of A-bomb survivors. Theyhad all been exposed to radiation doses in the order of of 1 Sv (Thompsonet al 1984). This indicates improved radio-resistance at high radiation dos-
94

es. The repair induced by a priming dose can be of the “SOS”-type like thatfound in some procaryotes (Macklis and Beresford 1991, Wolff 1989). Mis-repair would, however, result from the challenge dose or from a great firstdose and not from the priming dose, making it likely that a large radiationdose such as 1 Sv may cause cancer.
It is far from clear that small radiation doses have carcinogenic effects.The guidelines from the International Commission on Radiological Protec-tion (ICRP) are based on the so-called linear, non-threshold (LNT) modelstating that cancer incidence increases linearly with dose. The commissionargues that this is still the best estimate even at small doses (e.g. low-level
95
Fig. 1. Cell survival of Chinese hamster lung cells, V79, as measured by cells abili-ty to form macroscopic colonies following radiation with 240 kVp X-rays and d(4)-Be neutrons (closed symbols). The lines represent fits to the data of mathematicalmodels. (From Lambin et al. 1993)

radiation – LLR) (Clarke 1996). There are, however, many reports indicat-ing that small doses of radiation may not have carcinogenic effects andeven be protective. In some studies on cell cultures, for example, it has beenobserved that neoplastic transformation is counteracted by a small primingdose, even to a level below the spontaneous rate (Azzam et al. 1996).
There are also epidemiological studies indicating that low-dose radiationdoes not induce cancer, and even give some protection against certain typesof cancer (see Fig. 2 and e.g Cohen 1998, 1999). This theme has been dis-cussed during many years, and it is difficult to draw any final conclusion(Walinder 1987; Tubiana 1999). It is important that observations on cancerincidence are interpreted in the light of cellular responses.
Both the adaptive effect and the induced radio-resistance involve protec-tion at the cellular level. The adaptive response is due to a stimulation of ra-diation repair processes, thus protecting cells against the inactivating effectof the «test» dose. Furthermore, cell growth is stimulated by small radiationdoses, an effect also seen in various tissues of animals given repeated smalldose fractions or protracted low dose rate irradiation. However, in manycases cancer incidence is reduced by small doses. One can argue that thereis a contradiction between these various effects, since increased rate of cellproduction is typically a process that should be expected to enhance and notto counteract development of cancer. Generally, cells that have lethal DNAdamage, are no problem with respect to later cancer development. Cells thatare able to repair DNA damage have a possibility of erroneous repair and asubsequent activation of oncogenes or inactivation of tumour suppressorgenes. (Alberts et al. 1994). Thus, on basis of such reasoning one shouldnot expect decreased cancer induction following activation of a process thatenable cells to increase cell survival by increased repair.
There are, however, several alternative explanations of how small radia-tion doses may protect against cancer, although cells are hypersensitive tosuch doses. Feinendegen (1999) presents, for example, a calculation of theextra, fixed DNA damage resulting from a 10-times increase of backgroundradiation of 1 to 10 mGy per year. He argues that this would mean an extra10-7 to 10-6 fixed DNA damage per cell per day, while normal metabolismand reactive oxygen species produce 10-1. Thus, if the extra, continuous ra-diation in fact induces repair or defence processes protecting individualcells or tissue against DNA damage in general, protection against cancerdevelopment will also be a result.
On the other hand, small acute single doses of X- or γ-rays will producedamages in a very short time. Many of these will be double-strand breaks ofthe DNA. Under normal conditions cells have to cope with almost 106 dam-ages due to reactive oxygen species produced by normal metabolic activity(Feinendegen 1999). The DNA double strand breaks induced by the acute,low radiation dose may be sufficient to activate induced resistance, which
96
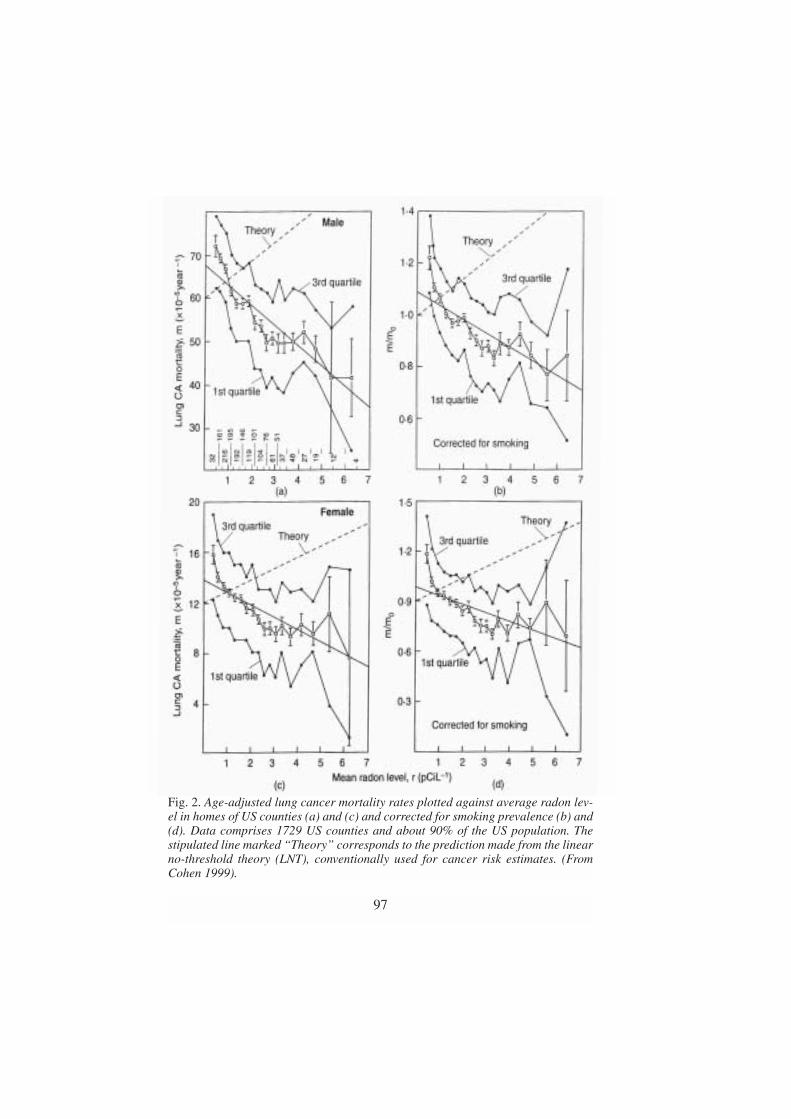
97
Fig. 2. Age-adjusted lung cancer mortality rates plotted against average radon lev-el in homes of US counties (a) and (c) and corrected for smoking prevalence (b) and(d). Data comprises 1729 US counties and about 90% of the US population. Thestipulated line marked “Theory” corresponds to the prediction made from the linearno-threshold theory (LNT), conventionally used for cancer risk estimates. (FromCohen 1999).

may protect cells even against damage due to metabolism and therebyagainst cancer development.
Alternatively, there may, however, be a protection against cancer by low-level radiation even without any repair of DNA damage following such dos-es. The low-dose hypersensitivity means that damaged cells tend to losetheir clonogenic potential. The very steep cell survival curve at such lowdoses (an initial α-value 50-700 times larger than the α-component of theremainder of the irradiated population (Wouters and Skarsgard 1998)) im-ply that cell death is the preferred endpoint for damaged cells in the initialdose range. There have been various speculations regarding the nature ofthis cell death. However, with respect to protection against cancer develop-ment the nature, or the mechanism, of the radiation-induced cell death doesnot necessarily be of any importance. The crucial point is probably that afew cells are losing their clonogenic potential due to the low-dose radiation.Since cells of normal and cancer origin may have the same hypersensitivity(Raaphorst and Boyden 1999; Alsbeith et al. 1999), this probably affectsnormal, unharmed cells as well as cells having a mutation or a misrepairedDNA damage of some kind, which could represent a potential for later can-cer development. If cells killed by low-dose radiation are replaced by cellshaving a relatively intact DNA and therefore a smaller potential for cancerdevelopment, the cell killing and replacement process may inevitably repre-sent a small protection against cancer. The benefit thus depends on two cel-lular consequences of the small dose: The few unharmed cells that arekilled and replaced, are of no danger to the organism. On the other hand thefew cells with DNA damage caused by metabolic or other processes thatwere killed by the low-dose radiation and replaced with unharmed cells,would mean that the over-all potential for later cancer development in theorganism as a whole would be reduced. Thus, low dose radiation may havea washing-effect on the tissues with respect to cancer development, i.e. itwashes away loci of potential danger for cancer development. The effect oflow-dose radiation on highly differentiated cells without possibility of pro-liferation or replacement by stem cells is of little consequence for the or-ganism, since such cells maintain their function even after relatively highdoses of radiation.
This seems to turn the logic in Clarke’s argument (1996) upside-down:“First and foremost, there is unlikely to be a threshold in the dose-responsecurve. DNA repair of double strand breaks is not error free.” By inducingsudden cell kill instead of repair in some cells having previously misre-paired DNA, and having these cells replaced with newly produced, un-harmed cells, low-level radiation may result in an over-all protectionagainst cancer.
At larger radiation doses the situation is different. For cells of repopulatingtissues, the initial steepness of the survival curve as analysed by the two-com-
98

ponent model, is often in the range αs � 10 or higher (Lambin et al. 1996;Short et al. 1999). If the survival curve had followed this steep slope up to adose of for example 0.5 Gy, cell survival would be less than 1%. Thus, if cellsat the dose level of 0.5 Gy, maintained the same radiosensitivity as for verylow doses, even 0.5 Gy would be sufficient to destroy the function of manytissues. When given to the body as a whole, this would most certainly belethal. The logic consequence is that cells activate regulatory processes at thisdose level, which increase cell survival enormously, even though this increas-es the danger of later cancer development. In order to avoid sudden damageor death it is better for the organism as a whole to take the chance of a laterdisease. While tissues can well tolerate a sudden loss of a few cells, they can-not afford sudden loss of a major fraction of the cells.
Thus, the effect of small and large doses of radiation may be dualistic: Inregenerating tissues, small doses may induce a sudden loss of a few cells,which have to be replaced from the pool of stem cells, but may protectagainst cancer in the long run. Large doses result in repair (and misrepair)and stimulated cell proliferation, which is life-saving in the short run, butslightly carcinogenic in the long run. Different tissues of the same bodymay respond differently to radiation at both dose levels.
In conclusion, various hypotheses try to explain reports of serious devia-tions from the conventional risk calculations following low-level radiation.They all have to be tested mechanistically in each step before a final evalu-ation. The reports on such deviations should be taken seriously, since theymay be more easily explained from a cellular point of view, than predictedfrom the conventional LNT theory.
REFERENCES
Alberts B, Bray D, Lewis J, Raff M, Roberts K and Watson, JD, 1994 Themolecular Biology of the Cell, Chapter 24; “Cancer” (pp1255-1294)Garland Publishing Inc. NewYork & London 1294 pp.
Alsbeith G, Fertil B, Bonvier J, Malaise EP and Raaphorst GP, 1999: Hy-persensitivity to low single doses and split-dose recovery: two manifes-tations of induced resistance that might be related. International Journalof Radiation Biology, 73: 837-846.
Amundson SA, Do, KT and Fornace AJ, 1999: Induction of stress genes bylow doses of gamma rays. Radiation Research, 152: 225-231.
Azzam EI, Toledo SM, Raaphorst GP and Mitchel REJ, 1996: Low-doseionizing radiation decreases the frequency of neoplastic transfomation toa level below the spontaneous rate in C3H 10T1/2 cells. Radiation Re-
99

search, 146: 369-373.Cai L, and Liu S-Z, 1990: Induction of cytogenetic adaptive response of so-
matic and germ cells in vivo and in vitro by low-dose X-irradiation. In-ternational Journal of Radiation Biology, 58: 187-194.
Caney C, Bulmer JT, Singh G, Lukka H and Rainbow AJ, 1999: Pre-expo-sure of human squamous carcinoma cells to low-doses of (-rays leads toan increased resistance to subsequent low-dose cisplatin treatment. In-ternational Journal of Radiation Biology, 75: 963-972.
Chadwick KH and Leenhouts HP, 1998: Low-dose radiation sensitivity anda subpopulation of sensitive cells. Radiation Research, 149: 523-524.
Clarke RH, 1996: Developments in the work of the ICRP of importance forradiation protection. The Uranium Institute, 21st Annual Symposium: 1-8.
Cohen BL, 1998: Validity of the linear no-threshold theory of radiation car-cinogenesis at low doses. The Uranium Institute, 23rd Annual Sympo-sium, 10th-11th September 1998: 1-12.
Cohen BL, 1999: Validity of the linear no-threshold theory of radiation car-cinogenesis at low doses. Nuclear Energy, 38: 157-166.
Feinendegen LE, 1999: The role of adaptive responses following exposureto ionizing radiation. Human & experimental toxicology, 18: 426-432.
Ikushima T, Aritomi H and Morisita J, 1996: Radioadaptive response:Effi-cient repair of radiation-induced DNA damage in adapted cells. Muta-tion Research, 358: 193-198.
Lambin P, Marples B, Fertil B, Malaise EP and Joiner MC, 1993: Hyper-sensitivity of a human tumour cell line to very low radiation doses. In-ternational Journal of Radiation Biology, 63: 639-650.
Lambin P, Fertil B, Malaise EP and Joiner MC, 1994: Multiphasic survivalcurves for cells of human tumor cell lines: induced repair or hypersensi-tive subpopulation? Radiation Research, 138: S32-S36.
Lambin P, Malaise EP and Joiner MC, 1996: Might intrinsic radioresistanceof human tumour cells be induced by radiation? International Journal ofRadiation Biology, 69: 279-290.
Macklis RM and Beresford B, 1991: Radiation hormesis. The Journal ofNuclear Medicine, 32: 350-359.
Marples B, and Joiner MC, 1995: The elimination of low-dose hypersensi-tivity in chinese hamster V79-379A cells by pretreatment with X rays orhydrogen peroxide. Radiation Research, 141: 160-169.
Marples B, and Joiner MC, 1993 The response of Chinese hamster V79cells to low radiation doses: evidence of enhanced sensitivity of thewhole cell population. Radiation Research, 133, 41-51.
Mossman KL and Ledesma LM, 1999: Radiation exposure and adaptiveprocesses. Belle Newsletter, 7: 16-19.
Olivieri G, Bodycote J, Wolff S, 1984: Adaptive response of human lynphocytes
100

to low concentrations of radioactive thymidine. Science, 233: 594-597.Raaphorst GP and Boyden S, 1999: Adaptive response and its variation in
human normal and tumour cells. International Journal of Radiation Bi-ology, 75: 865-873.
Robson T, Joiner MC, Wilson GD, McCullough W, Price ME, Logan I,Jones H, McKeown SR and Hirst DG, 1999: A novel human stress re-sponse-related gene with potential role in induced radioresistance. Radi-ation Research, 152: 451-461.
Shadley JD, Afzal V and Wolff S, 1987: Characterization of the adaptive re-sponse to ionizing radiation induced by low doses of X-rays to humanlymphocytes. Radiation Research, 111: 511-517.
Shadley JD and Dai G, 1992: Cytogenetic and survival adaptive responsesin G1 phase human lynphocytes. Radiation Research, 265: 273-281.
Short S, Mayes C, Woodcock M, Johns H and Joiner MC, 1999 Low dosehypersensitivity in the T98G human glioblastoma cell line. Internation-al Journal of Radiation Biology & Related Studies in Physics, Chemistry& Medicine, 75: 847-855.
Short SC, Mitchell SA, Boulton P, Woodcock M and Joiner MC, 1999: Theresponse of human glioma cells lines to low-dose radiation exposure. In-ternational Journal of Radiation Biology, 75: 1341-1348.
Skarsgard LD, Skwarchuk MW and Wouters BG, 1994: The survival ofasynchronous V79 cells at low radiation doses: Modeling the responseof mixed cell populations. Radiation Research, 138: S72-S75.
Skov KA, 1999a: Radioresponsiveness at low doses: hyper-radiosensitivityand increased radioresistance in mammalian cells. Mutation Research,430: 241-253.
Skov KA, 1999b: Invited response to issues associated with adaptive re-sponse: Perspectives from studies in mammalian cells on the response tolow radiation doses or to cisplatin. Belle newsletter, 7: 26-30.
Thompson DE, Mabuchi K, Ron E, Soda M, Tokunaga M, Ochikubo S,Sugimoto S, Ikeda T, Terasaki M, Izumi S and Preston DL, 1994: Cancerincidence in atomic bomb survivors. Part II: Solid tumors, 1958-1987.Radiation Research, 137: S17-S67.
Tubiana M, 1999: Carcinogenic effects of weak radiation doses. CancerRadiotherapie 3: 203-214.
United Nations Scientific Committee on the Effects of Atomic Radiation(UNSCEAR). Sources and effects of Ionizing Radiation, UNSCEAR1994 Report to the General Assembly, with Scientific Annexes. NewYork: United Nations, 1994.
Walinder G, 1987 Epistemiological problems in assessing cancer risks atlow radiation doses. Health Physics, 52: 675-678.
Wolff S, Afzal V, Wiencke JK, Olivieri G and Michaeli A, 1988: Human
101

lymphocytes exposed to low doses of ionizing radiations become refrac-tory to high doses of radiation, as well as chemical mutagens that inducedouble-strand breaks in DNA. International Journal of Radiation Biolo-gy, 53: 39-48.
Wolff S, 1989: Are radiation-induced effects hormetic? Health Physics,245: 575-621.
Wolff S, 1992: Failla memorial lecture: Is radiation all bad? The search foradaptation. Radiation Research, 131: 117-123.
Wouters BG and Skarsgard LD, 1998: Response to the letter to the editor“Low-dose radiation sensitivity and a subpopulation of sensitive cells byK.H. Chadwick and H.P. Leenhouts. Radiation Research, 149: 524-525.
Youngblom JH, Wiencke JK and Wolff S, 1989: Inhibition of the adaptiveresponse of human lymphocytes to very low doses of ionizing radiationby the protein synthesis inhibitor cycloheximide. Mutation Research,227: 257-261.
102

Radon: a likely carcinogen at all exposures
S. Darby, D. Hill and R. Doll
Clinical Trial Service Unit and Epidemiological Studies UnitUniversity of Oxford Harkness Building Radcliffe Infirmary
Oxford OX2 6HE United KingdomE-mail: [email protected]
Abstract
Radon is a well-established lung carcinogen that has been extensively studied. Very high
concentrations can occur in some underground mines. Concentrations also tend to build
up in homes. Epidemiological studies of radon-exposed miners and of residential radon
and lung cancer are reviewed. Quantitative estimates of the risk of lung cancer, based on
the experience of the miners, are applied to residential radon exposures in the United
Kingdom. Strategies for the prevention of lung cancer induced by residential radon are
discussed. Estimates are uncertain, but residential radon is probably responsible for
about 2000 lung cancer deaths per year in the United Kingdom, or around 6% of the to-
tal, making it the second biggest cause after smoking. Over 80% of the deaths are esti-
mated to occur at ages less than 75 and over 80% in smokers or ex-smokers. Around 90%
of radon-induced deaths in the United Kingdom probably occur as a result of exposures
to radon concentrations below the currently recommended action level of 200 Bq m-3.
Further work is needed to obtain more reliable estimates of the risk of lung cancer asso-
ciated with residential radon and on the cost-effectiveness of various intervention strate-
gies before the most appropriate policies can be developed for managing exposure to this
natural carcinogen.
Introduction
Radon-222 is a chemically inert radioactive gas with a half-life of 3.8 days,giving rise to a series of short-lived progeny (Fig. 1). It arises from the de-cay chain of uranium-238 ,which is present throughout the earth’s crust,and seeps out of rocks, soil and water. If radon itself is inhaled, some willbe absorbed through the lung, but the majority will be exhaled. However,the progeny are solid and form into small molecular clusters or attach to
103

aerosols in the air and these may be deposited on the bronchial epithelium.Two of the short-lived progeny in the commonest decay chain, polonium-218 and polonium-214, decay by emitting alpha particles.
These have a limited range of penetration into tissues but are highly ef-fective at causing genetic damage in the cells they reach.
Radon concentrations in outdoor air are usually very low, but concentra-tions build up in situations where it is unable to disperse. Some of the high-est concentrations occur in underground mines of igneous rocks, especiallyuranium mines, where it may enter the air directly from the ore, or bebrought into the mine dissolved in water. However, appreciable concentra-tions may also occur in homes, where the principal source is usually thesubsoil, although under some circumstances appreciable exposure may oc-
104
Fig. 1. The radon decay chain. An arrow pointing downward indicates decay by al-pha-particle emission; an arrow pointing to the right indicates decay by beta-parti-cle emission. The historical names for the nuclides are in parentheses below themodern ones. Most decay takes place along the chain marked with thick arrows. Thesmall percentage of decay along the chains marked with thin arrows is shown atcritical points. The end of the chain, lead-206 is stable, not radioactive. Half-livesof each isotope are shown as seconds (s), minutes(m), days(d) or years(y). Based on[1]

cur from building materials or from radon dissolved in water. Residentialradon levels are very variable, depending on local conditions and in manycountries there is a variation of two orders of magnitude or more in the con-centrations commonly observed. In the great majority of countries radon isthe principal source of exposure of the general population to ionizing radi-ation [2], and substantial efforts are being directed towards estimating itseffect in the general population. Residential radon concentrations can usu-ally be reduced through relatively simple measures, and several countriesnow have recommended control strategies.
The BEIR VI Committee published a comprehensive report on the healtheffects of radon in 1999 [1]. Its effects have been reviewed twice by the In-ternational Agency for Research on Cancer [3,4], which led to its classifica-tion as a human carcinogen (group 1), and other reviews have also beenpublished recently [5]. The present article draws on these reports and sum-marizes the quantitative evidence relating to lung cancer in radon-exposedminers and recent work studying directly the risk of residential radon. Italso describes the implications of the risks seen in radon-exposed minersfor the general population of the UK and describes current strategies for theprevention of radon-induced lung cancer.
Lung cancer in radon-exposed miners
It was appreciated as early as the 1500s that metal miners in the Erz moun-tains in central Europe had a very high mortality rate from respiratory dis-ease. However, it was not until early in the 20th century that the disease wasestablished as being lung cancer and not until the 1920s, when high levelsof radon were identified in these mines, that radon was first postulated asthe cause. Support for this postulate was by no means universal, however,and alternative causal theories were also popular, including the effects ofdust exposure and metals in the ore, and an increased susceptibility result-ing from inbreeding in the small mining communities. It was only in the1950s and 1960s, when studies of igneous rock miners in other areas, whowere also exposed to high radon levels, also revealed unusually high lungcancer rates, that radon was generally accepted as the cause. Since thattime, ventilation and other measures have been used to reduce radon levelsin most affected mines that continue to operate. This has reduced the risk ofoccupationally-induced cancer from radon, although it still remains an is-sue both for those who are currently employed in affected mines and forthose who have been employed in the past.
Studies have been carried out of the mortality patterns of several groupsof radon-exposed miners and these form the major body of available evi-dence concerning the consequences of exposure to radon and its decay
105

products. At present, results have been published of eleven major studies,covering a total of over 60,000 miners in Europe, north America, Asia andAustralia, among whom over 2,500 deaths from lung cancer have occurred.
106
Table 1. Lung cancer mortality in cohort studies of underground miners occupationally exposed to radon
Study and Type of Number of Mean Mean Number Percentage 95%reference mine exposed total duration of lung increase in confid.
miners WLM of cancer age-specific interv.exposure deaths risk of lung (years) cancer
perWLMa
Yunnan, China [7] Tin 13,649 286.0 12.9 936 0.16 0.1-0.2W. Bohemia,CzechRepublic [8] Uranium 4,320 196.8 6.7 701 0.34 0.2-0.6Colorado,USAb [9] Uranium 3,347 578.6 3.9 334 0.42 0.3-0.7Ontario,Canadac [10] Uranium 21,346 31.0 3.0 285 0.89 0.5-1.5Newfoundland,Canada [11] Fluorspar 1,751 388.4 4.8 112 0.76 0.4-1.3Malmberget,Sweden [12] Iron 1,294 80.6 18.2 79 0.95 0.1-4.1New Mexico,USA [13] Uranium 3,457 110.9 5.6 68 1.72 0.6-6.7Beaverlodge,Canada [14] Uranium 6,895 21.2 1.7 56 2.21 0.9-5.6France [15] Uranium 1,769 59.4 7.2 45 0.36 0.0-1.2Port Radium,Canada [16] Uranium 1,420 243.0 1.2 39 0.19 0.1-0.6Radium Hill,Australia [17] Uranium 1,457 7.6 1.1 31 5.06 1.0-12.2
Totald 60,606 164.4 5.7 2,674
a The working level (WL) is defined as any combination of the short-lived radon progeny in one litre ofair that results in the ultimate release of 1.3 x 10⁵ MeV of potential (-particle energy. Exposure to thisconcentration for 170 h (or twice this concentration for half as long, etc.) is defined as a working levelmonth (WLM). An individual living in a house with a radon concentration of 20 Bq m-3 will be exposedto 0.08 WLM per year.
b Totals given exclude data above 3200 WLM. c Values given include all uranium miners, including thosewith previous gold mining experience.
d Totals adjusted for miners and lung cancers included in both Colorado and New Mexico studies.Source: BEIR VI Committee [1]

These studies all include quantitative information on the radon exposuresreceived by the men and many of them also include information on unex-posed workers, e.g. surface workers, as an internal comparison group. Eightof the studies are of uranium miners; the remainder are of miners of tin,fluorspar or iron. In contrast to the findings for lung cancer, there is little ev-idence of any association between radon exposure and mortality from othercancers [6] or other diseases [1] in the same miners.
In each of the eleven studies, there was a close correlation between radonexposure and lung cancer risk, with miners who had higher exposures ex-periencing a greater increase in risk than those who had lower exposures,and in every study the relationship was so strong that it was unlikely to bedue to chance (Table 1). Although the size of the radon-related increase var-ied by more than an order of magnitude between the different studies,analysis of the information in the individual studies revealed some clearsystematic trends in risk. The relative risk of lung cancer (i.e. the propor-tionate increase in the age-specific risk of lung cancer) rose linearly with in-creasing cumulative exposure, both overall and in the region <600 WLM,
107
Fig. 2. Relative risk (RR) of lung cancer with cumulative radon exposure in the co-hort studies of underground miners occupationally exposed to radon (based on[18]).
which is of greatest interest when considering the effects of residential ex-posures (Fig. 2).
After allowing for a minimum latent period of around five years betweenexposure and death, the percentage increase in risk was higher in the periodaround 10 years after exposure, than at 20 or 30 years after exposure. In ad-dition, the percentage increase in lung cancer risk was also greater in indi-viduals who were aged around 50 than in individuals who were agedaround 60 or 70. Finally, mines where the radon concentrations were rela-tively low, had a larger percentage increase in risk per unit exposure thanmines with higher radon concentrations or, equivalently, a given total expo-sure was associated with a greater increase in risk if it was received over alonger rather than a shorter time period.
In view of the variations in the risk per unit exposure with time since ex-posure, age, and radon concentration, it is difficult to combine the results ofthe different studies appropriately using just the information published bythe individual studies. To overcome this difficulty, the individual data fromthe eleven studies were collated centrally, and a combined analysis carriedout by the BEIR VI Committee [1]. After extensive technical investigationsthe preferred form of the model relating radon exposure to risk of deathfrom lung cancer was:
R=100βw*ϕageγz , (1)
where R is the percentage increase in the risk of death from lung cancer fora person of a certain age with a given history of exposure to radon; β is theparameter relating lung cancer risk to history of radon exposure; w* repre-sents the radon exposure and takes the form of a weighted average,
w* = (w5-14+θ15-24w15-24+θ25+w25+) ( 2)
with w5-14, w15-24, and w25+ representing the exposure incurred during theperiods 5-14, 15-24, and 25+ years prior to the current age. The coefficientof w5-14 is equal to one, while θ15-24 and θ25+ represent the contributions torisk from exposures received 15-24 years and 25+ years previously, com-pared to exposures received in the period 5-14 years previously. The para-meter ϕage represents the modifying effect of age, while the parameter γzrepresents the modifying effect of either radon concentration or of exposureduration. Estimates of the parameters β, θ15-24, θ25+, ϕage, and γz for both theexposure-age-duration and the exposure-age-concentration formulation ofthe model are given in Table 2.
In most of the miner populations that have been studied, the majority ofthe men would have been cigarette smokers and, in most cases, this willhave had an effect on their lung cancer risk that is even greater than that
108

from their radon exposure. The effect of radon exposure can be expected todiffer between smokers and non-smokers, depending on the way in whichthe risks of smoking and radon exposure act jointly. Unfortunately, nosmoking information is available for five of the miners’ studies. Among thesix studies for which some smoking information is available, 2798 lifelong
109
Table 2. Parameter estimates from BEIR VI [1] preferred models incombined analysis of eleven studies of underground miners occupa-tionally exposed to radon. See text for description of models
Exposure-age-duration modela Exposure-age-concentrationmodel
β x 100b,c 0.55d β x 100b,c 7.68d
Time-since-exposure windows Time since-exposure windows
θ 5-14 1.00 θ 5-14 1.00θ 15-24 0.72 θ 15-24 0.78θ 25+ 0.44 θ 25+ 0.51
Attained age (years) Attained age (years)
φ <55 1.00 φ <55 1.00φ 55-64 0.52 φ 55-64 0.57φ 65-74 0.28 φ 65-74 0.29φ 75+ 0.13 φ 75+ 0.09
Duration of exposure (years) Concentration of exposure (WLc)
γ <5 1.00 γ <0.5 1.00γ 5-14 2.78 γ 0.5-1.0 0.49γ 15-24 4.42 γ 1.0-3.0 0.37γ 25-34 6.62 γ 3.0-5.0 0.32γ 35+ 10.2 γ 5.0-15.0 0.17
γ 15.0+ 0.11
aRisk projections for the US were carried out by the BEIR VI Committee for bothmodels and shown to give very similar results. In the present paper projectionsbased on the exposure-age-concentration model are given. bUnits are WLM-1. cSee Table 1 for definition of WLM and WL. d When separate estimates are requiredfor smokers and non-smokers these are 0.50 for ever-smokers and 1.1 for neversmokers in the exposure-age-duration model, and 6.90 for ever smokers and 15.3for never-smokers in the exposure-age-concentration model.

non-smokers could be identified, who between them had experienced 64lung cancers.
This was not enough to carry out a full analysis, but the relationship be-tween the relative risk of lung cancer and cumulative radon exposure couldbe compared in lifelong non-smokers and others. In both groups the rela-tionship between the relative risk of lung cancer and cumulative radon ex-posure was approximately linear, but the relative risk per unit exposurewas considerably greater among the lifelong non-smokers than among thecurrent and ex-smokers (Fig. 3). To allow for this, a higher value of β wasrecommended in equation (1) above for non-smokers and a slightly lowervalue for smokers, when separate estimates were required for lifelong non-smokers and current or previous smokers (see Table 2 for parameter val-ues).
110
Fig. 3. Relative risk (RR) of lung cancer with cumulative radon exposure amonglifelong non-smokers and others in the six cohort studies of underground miners forwhich smoking information was available (based on [18]). Although the increase inrelative risk per unit exposure is higher for never smokers than for smokers, the in-crease in absolute risk will be higher for smokers, as they have much higher rates oflung cancer.

Lung cancer from residential radon
Average exposures received by the miners are an order of magnitude or sogreater than average indoor exposures and their average duration of expo-sure was less than six years (Table 1). The miners were almost all adultmales, the information about both their radon exposure and their smokinghabits is crude and subject to error, and their conditions of exposure differsubstantially from those in homes, with the miners carrying out substantialamounts of heavy work in an atmosphere polluted by dust and fumes. Thereis, therefore, great uncertainly in applying risk estimates derived from stud-ies in miners to the effects of residential radon, and direct estimates of therisks of residential radon are needed. At the present time, 14 major studiesof residential radon have been published (Table 3). These are case-controlstudies, in which detailed residential and smoking histories have been gath-ered for a series of individuals with lung cancer and a series of control sub-jects, who had not developed the disease. The radon concentration has thenbeen measured over a period of several months in the air of the subject’spresent and previous homes using passive alpha track detectors and theweighted average radon concentration during an appropriate time periodhas been calculated. To date, most of the studies have had inadequate pow-er to detect a risk on their own, although a weighted average of the pub-lished results is indicative of a risk (estimated relative risk at 100 Bq m-3
compared with 0 Bq m-3 1.06, 95% confidence interval 1.01-1.10, see Table3).
Most of the estimates shown in the main body of Table 3 have been ob-tained using standard statistical methodology for case-control studies inwhich it is assumed that the average radon concentration to which an indi-vidual has been exposed, can be assessed without error. However, this as-sumption is usually violated in two different ways.
Firstly, in most of the studies there are some time-periods for which it isnot possible to obtain a radon measurement, for example, because the homepreviously occupied by the subject had been demolished. Radon concentra-tions for such missing periods need to be estimated in the analysis.
Secondly, even where it has been possible to obtain a measurement, themeasured value will be subject to uncertainty in the sense that repeatedmeasurements in the same home vary with a coefficient of variation ofaround 50% [23,28].
These two different sources of uncertainty will have different effects onthe results of an analysis that has been carried out using standard techniques[34]. Missing values that have been replaced by estimates will cause confi-dence intervals to be wider than they would otherwise have been, and areundoubtedly a contributing factor in the low power of the case-control stud-ies in shown in Table 3. In contrast, the presence of uncertainty in measured
111

residential radon concentrations will cause the estimated effect of the radonusing standard techniques of analysis to be biased towards zero. For two ofthe case-control studies shown in Table 3, analyses have been carried outthat take this bias into account [23,28]. For these studies, the estimated rel-ative risks of lung cancer at 100 Bq m-3 compared with 0 Bq m-3 using thestandard methods were 1.10 (95% confidence interval 1.01, 1.22) and 1.08(0.97, 1.20), while the estimates taking account of measurement uncertain-ty were somewhat higher, at 1.17 (1.03, 1.37) and 1.12 (0.95, 1.33).
Rather than measuring the current concentration of radon in the air of allthe homes of interest, an alternative method of assessing residential radonhistories is to estimate an individual’s cumulative radon exposure. This canbe done by estimating the accumulation of the long-lived radon decay prod-uct Pb-210 implanted in the glass surface of an object, such as a pictureframe, that has been on display in all the subject’s homes for a substantialperiod of time. The long-lived Pb-210 in turn gives risk to a shorter livedproduct, Po-210, which can be measured using passive alpha track detec-tors. From this measurement an estimate can be made of the cumulativeradon exposure in the rooms where the glass object has been kept. The un-certainties associated with this method of estimating radon histories havenot yet been fully documented, but it should avoid the difficulties caused bymissing measurements in subjects’ previous home and also the problem thatin some countries residential radon concentrations may have changed sys-tematically over time, for example because of a tendency to reduce indoorventilation rates [35], which would mean that air concentrations measuredat the present time would be systematically biased compared with previousvalues. At the present time only one study has published a risk estimatebased on cumulative exposure histories from surface monitors [29]: thisgave an estimated relative risk at 100 Bq m-3 compared with 0 Bq m-3 of1.63 (95% confidence interval 1.07, 2.93), while the same study failed toshow any positive relation using conventional air monitors, with estimatedrelative risk at 100 Bq m-3 compared with 0 Bq m-3 0.85 (0.73, 1.00).
Despite the uncertainties that affect the results of the case-control studiesof residential radon, the risks suggested by them are in good agreementwith the estimated risks based on the studies of miners (Figure 4). Howev-er, public perception of residential radon has been confused, especially inthe United States, by the wide publicity given to an ecological study inwhich average residential radon concentrations in several hundred UScounties have been correlated with the county-specific lung cancer inci-dence rates after adjusting at the county level for various other factors thatmight affect lung cancer risk including smoking habits [37]. The results ofthe ecologic study show a negative association at the county level betweenresidential radon exposure and lung cancer risk, and are clearly out of linewith the results of both the miners studies and the case-control studies of
112

residential radon. There is ample evidence to suggest that the results of theecological study are incorrect, and it can be shown theoretically that adjust-ing for smoking at the county level will not remove the effect of this factor,which is responsible for the majority of cases of lung cancer [38]. For fur-ther discussion of this topic, see [1,4,39,40].
Table 3. Estimates of relative risk (RR) at 100 Bq m-3 compared with 0Bq m-3 and 95% confidence intervals (CI) in epidemiological studies ofresidential radon and lung cancer based on at least 100 cases of lungcancer and direct measurements of radon using α-track monitorsa
Study and Cases of Control RRb 95% CI b
reference lung subjectscancer
New Jersey, USA [19] 480b 442b 1.49b (0.89-1.89)b
Shenyang, China [20] 308b 356b 0.95b (undefined-1.08)b
Stockholm, Sweden [21] 201b 378b 1.16b (0.89-1.92)b
Swedish nationwide [22,23] 1281b 2576b 1.10b (1.01-1.22)b
1.17b (1.03-1.37)b
Winnipeg, Canada [24] 738b 738b 0.98b (0.87-1.27)b
Missouri, USA I [25] 538b 1183b 1.08b (0.95-1.24)b
South Finland [26] 164b 331b 1.80b (0.90-3.50)b
Finnish nationwide [27] 517b 517b 1.11b (0.94-1.31)b
South-West England [28] 982b 3185b 1.08b (0.97-1.20)b
1.12c (0.95-1.33)b
Missouri, USA II [29] 247d 299d 0.85d (0.73-1.00)d
372e 471e 1.63e (1.07-2.93)e
Iowa, USA [30] 413b 614b 1.24b (0.95-1.92)b
Western Germany [31] 1449b 2297b 0.97f (0.82-1.14)b
1.09g (0.86-1.38)b
Eastern Germany [32] 1053b 1667b 1.11f (1.00-1.27)b
1.27g (1.00-1.60)b
Swedish never-smokers [33] 258b 487b 1.28b (0.95-2.05)b
Totalh 1.06b (1.01-1.10)b
a Based on [4] with additions. b Assuming 50% coefficient of variation in measuredradon concentration. c Assuming 50% coefficient of variation in measured radonconcentrations and allowing for uncertainties in estimates of missing values. d
Analysis based on air monitors. e Analysis based on surface monitors. f Entire study.g High radon areas h Total is weighted average of all studies. Where two estimatesare given for a study the first entry has been used.
113

Implications for the UK of risks seen in radon-exposed miners
Despite the uncertainties in extrapolating from the experience of radon-ex-posed miners to the effects of residential radon, the most appropriate ap-proach at present to estimating the likely numbers of deaths caused byradon, both by itself and in conjunction with smoking, is from the BEIR VICommittee’s preferred model. In order to understand the implications of theBEIR VI model for the United Kingdom, it has been combined with UKdata on smoking habits, population size, numbers of deaths from lung can-cer for males and females in different age groups, and lung cancer ratesamong lifelong non-smokers. As survival after a diagnosis of lung cancer isvery poor [41], projections for lung cancer incidence would be very similarto those given here for mortality.
114
Table 4: Causes attributed to the lung cancer deaths occurring eachyear in the United Kingdom
Cause Lung Percentagecancer attributeddeaths
Not caused by active smoking or by residential radon 3,351 9.6
Caused by radon but not by smoking 349 1.0
Caused by smoking and radon(avoidance of either of which would have avoided that particular lung cancer) 1,926 5.5
Caused by smoking and not by radon 29,332 83.9
Total no. of lung cancer deaths 34,958 100.0
Calculation based on 1998 UK national data for numbers of lung cancer deaths,population size and smoking habits [42,43]. Lung cancer death rate in lifelong non-smokers taken from a US prospective study of mortality [44], adjusted for the loweraverage radon level in the UK. Average radon exposure assumed to be 20 Bq m-3
[45]. BEIR VI exposure/age/concentration model with submultiplicative joint effectof smoking and radon assumed for radon risks. Additional assumptions are thoseused in the BEIR VI Committee’s projections [1].
6.5 due to residential radon
89.4 due toactive smoking
}
}

These calculations suggest that of the 34,958 lung cancer deaths that oc-curred in the UK during 1998, 2275, or 6.5% of the total, were caused byradon (Table 4). Of these, only 349 (1.0% of all lung cancer deaths) can beattributed to radon acting alone, while the remaining 1926 (5.5% of all lungcancer deaths) were caused by both radon and smoking in the sense that thelung cancer could have been avoided by avoiding either smoking or radonexposure. Lung cancer in the UK is primarily attributable to smoking andlung cancer rates are higher in males than in females; as a result, 62% of thedeaths attributable to radon are projected to have occurred in males, withonly 38% in females (Table 5). It is likely that two thirds of the deaths oc-curred in individuals between the ages of 55 and 75, with the remainder ap-proximately equally divided between individuals aged 35-54 and 75+. Very
115
Fig. 4. Summary relative risks (RR) from meta-analysis of published data from case-control studies of residential radon [36], pooled analysis of cohort studies of minersoccupationally exposed to radon [18], and an ecologic study of 1601 US counties[37]: the negative slope in the ecologic study is approximately 10 times its standarderror (figure based on [1]).

few radon-attributable deaths are likely to occur in individuals under theage of 35.
Personal risks will not be uniformly distributed throughout the popula-tion and will be determined by both smoking status and residential radonconcentration. The likely extent of this variation can be seen when lungcancer mortality rates for individuals with different smoking habits and res-idential radon concentrations are considered in conjunction with the BEIRVI risk models. The best estimate of lung cancer mortality rates in lifelongnon-smokers are those obtained from the American Cancer Society’sprospective study [44]. These have been adjusted, according to the BEIR VImodel, to take into account the lower average residential radon concentra-tions of 20 Bq m-3 in the UK [45] compared with 46 Bq m-3 in the US [2].At 20 Bq m-3 the cumulative risk to age 85 of death from lung cancer innon-smokers is estimated to be 0.8% (Table 6). This would be reduced onlyvery slightly, to 0.7%, if the residential radon concentration were, hypothet-ically, brought down to zero, and would rise to 1.4% at 200 Bq m-3, the lev-el at which it is recommended in the UK that action be taken to reduceradon levels, and further to 2.2% at 400 Bq m-3.
Table 5: Lung cancer deaths attributable to residential radon in theUnited Kingdom each year by age and sex
Age Males Females Total
<35 1.5 1.5 3 (<1%)35-54 224 161 385 (17%)55-74 962 554 1516 (67%)75+ 218 153 371 (16%)
All ages 1405 (62%) 869 (38%) 2275 (100%)
For continuing cigarette smokers, estimates of the age-specific lung cancerdeath rate are available from a recent study of smoking and lung cancer inthe UK [46]. These suggest that the cumulative risk of death from lung can-cer by age 85 is around 30% for individuals whose residential radon con-centrations are equal to the UK average, but rises substantially, to around40% for those exposed at 200 Bq m-3 and to 49% for those exposed at 400Bq m-3. For the entire population, which consists of a mixture of lifelongnon-smokers, current smokers and ex-smokers, the estimates lie in betweenthose for lifelong non-smokers and current cigarette smokers (Table 6). Es-timates are lower for females than for males, reflecting the fact that in theUK women have smoked less in the past than men, so that current lung can-cer rates for the country as a whole are lower in women than in men.
116

The number of deaths attributable to radon at each level of concentration isdetermined by not only these individual risks, but also by the distribution ofresidential radon concentrations throughout the country. For the UK, resi-dential radon levels have been shown to follow a log-normal distribution af-ter allowance for the radon level in outside air, which is around 4 Bq m-3
and varies relatively little (Fig. 5). These data suggest that less than 1% ofhomes in the UK have a radon concentration of above 200 Bq m-3. Conse-quently, the proportion of the lung cancer deaths attributable to radon thatoccur as a result of exposure to residential radon concentrations of 200 Bqm-3 or more, is only around 10%, with another 13% occurring at concentra-tions in the range 100-199 Bq m-3 (Table 7). In contrast, over one third ofradon-attributable deaths are estimated to occur with radon concentrationsof less than 25 Bq m-3, and around 20% each at levels in the ranges of 25-49 Bq m-3 and 50-99 Bq m-3.
117
Fig. 5. Log-normal probability plot of residential radon concentrations from the UKnational survey [45], adjusted for the outside air concentration (i.e. concentrationsless than or equal to 4.1 Bq m-3 are set to 4.1 Bq m-3, and 4 Bq m-3 is then subtract-ed from all concentrations. Solid line indicates best fitting straight line. Figurebased on [47].

Table 6. Effect of various residential radon concentrations on the cu-mulative risk (%) of death from lung cancer to age 85
Residential radon concentration (Bq m-3)
0 20a 100 200 400
Lifelong non-smoker 0.7 0.8 1.0 1.4 2.2Cigarette smoker 29.1 30.4 34.8 40.0 49.3Whole population:Males 9.8 10.4 12.4 14.8 19.6Females 4.4 4.7 5.7 7.0 9.5
Based on the BEIR VI exposure/age/concentration model for radon risks with submultiplica-tive joint effect of smoking and radon (lifelong non-smokers and cigarette smokers) or no ad-justment for smoking (whole population) [1]. Lung cancer death rates based on 1988 UK na-tional data [42] for whole population, a US prospective study [44] for lifelong non-smokers(with adjustment for the lower average radon concentration in the UK compared with the US),and a recent study of UK lung cancers for cigarette smokers [46]. If, for one particular catego-ry, the lung cancer rates per 105 in all the five year age groups before age 85 add up to c, thenthe cumulative risk by age 85 is 1-exp(-5c/105). Thus, cumulative risks depend only on age-specific lung cancer rates and not on competing causes of death.a UK average residential radon concentration.
Prevention of lung cancer from residential radon
A recent international survey of radon legislation and national guidelines[48] has shown that most European and many non-European countries nowhave recommended procedures for controlling levels of indoor radon. Somecountries also have guidelines against radon incorporated into their build-ing codes and recommended construction techniques. In most cases theguidelines are formulated in terms of action levels for dwellings and work-places, above which it is advised that remedial measures be taken. Theseaction levels vary between countries, from 150 to 1000 Bq m-3.
The identification of existing homes with radon concentrations abovesuch action levels is the necessary first step towards reducing the risks thatindividuals living in them for long periods are likely to experience (Table6). With this in mind the UK government has offered free radon measure-ments for all homes in areas in England estimated to have more than a 5%chance of having a radon level above the UK action level for dwellings of200 Bq m-3. Up to a third of those approached took advantage of this poli-cy, and around 400,000 measurements were carried out as a result [49].
However, only around 10-20% of those living in homes that were identi-fied to be above 200 Bq m-3 took any radon remedial action [50,51]. Cur-rent UK government efforts have therefore been directed towards support-
118

ing local authority led initiatives that will increase this percentage, such asadditional publicity materials and training for local authority staff and localbuilders. Pilot studies have demonstrated that an approximate doubling ofthe percentage taking radon remedial measures can then be achieved [51].
In considering both the benefits and the costs of radon remediation pro-grammes targeted at homes or other buildings above a specified action lev-el, it is useful to be able to make comparisons with other health related in-terventions. The methodological framework now considered appropriate inthe economic evaluation of health interventions is cost-effectiveness analy-sis, in which all the direct costs associated with an intervention are dividedby the additional health benefits (such as life-years gained) to obtain a costper unit of health gain, which can then be compared with that for other in-terventions [52,53]. For radon remediation the data needed for such a mod-el include the per cent of homes over the action level, the cost of identifyingthese homes, the per cent of these homes where radon remediation is in factcarried out, the cost of radon remediation, the risk of lung cancer per unitradon exposure, the average cost of treatment per lung cancer case, thenumber of life-years gained per lung cancer case avoided, and also discountrates for ongoing costs associated with radon remediation and for life-yearsgained.
In the UK, cost-effectiveness studies using this framework have beencarried out for interventions to reduce radon concentrations above the ac-tion level in both homes and schools for the county of Northamptonshire[54,55]. For homes, a societal cost-effectiveness ratio of £13,250 ($20,385)per life-year gained was estimated using 1997 prices. The cost of radon re-mediation is born by the home owner in the UK, and a survey carried out aspart of this study found that the average cost of radon remediation inNorthamptonshire was £533 ($820). The figure of £13,250 took the per-centage of homes above 200 Bq m-3 to be 6.3% and the percentage of suchhouseholds where remediation work was carried out at 11%, as these werethe values observed in Northamptonshire. The cost-effectiveness ratiowould, however, decrease if either of these values were to increase. A sensi-tivity analysis demonstrated that if either the percentage of affected house-holds who actually remediated, increased to 30% or the percent of homesover 200 Bq m-3 increased to 15% (as is the case for several areas of the UK[56]), then the cost-effectiveness ratio would decrease to around £5000($7692) per life-year gained. In the UK, interventions to prevent diseasethat have cost-effectiveness ratios of less than £10,000 ($15,385) per lifeyear saved, have often been adopted as Government funded measures (in-cluding the national breast cancer screening programme and the secondaryprevention of heart disease using statins and many interventions with cost-effectiveness ratios in excess of this range are currently in practice [54]. Inthe schools study, the cost effectiveness ratio was estimated at £7550
119

($11,615), again at 1997 prices. Once again, this is within the range forhealth interventions that have often been adopted, although it was found tobe less favourable than several of the lung cancer prevention programmestargeted at smoking cessation, which have been shown to have cost-effec-tiveness ratios per life-year gained of under £1,000 ($1,539) [55].
If a substantial proportion of the radon attributable deaths are to beavoided, something more will have to be done beyond reducing the levels inhomes with concentrations above 200 Bq m-3, which account for only 10%of the total (Table 7). The practicability of reducing radon levels in homeswith lower radon concentrations consequently needs to be considered. Oneway in which this might eventually be achieved would be by requiringradon protection measures in all new dwellings. Several countries, includ-ing the UK, have recently adopted legislation regarding protective measuresin new dwellings [57]. These are aimed specifically at reducing the proba-bility that a new home will have a radon concentration above the current ac-tion level of 200 Bq m-3 and have therefore been introduced only in ‘radonaffected’ areas, where more than 3% of measurements in existing dwellingshave been found to be above this level. By requiring protection measuresfor all new homes, this legislation will clearly have an impact on the entiredistribution of residential radon concentrations within these areas, as wellas on the proportion above the action level. One study [58], again inNorthamptonshire, has concluded that the installation of radon protectionmeasures in all new dwellings in the ‘radon affected’ parts of the county hasa cost per unit of radiation exposure avoided, similar to that for the currentpolicy aimed at remediating existing dwellings above the action level.However, full economic cost-effectiveness analyses have not yet been pub-lished, either of the policies recently introduced in the UK or of a policy ofrequiring low-cost basic radon protection such as ensuring that the damp-proof barrier is radon-proof and that its edges and any joins in it are appro-priately sealed, in all new dwellings.
Conclusion
Radon is an established carcinogen and ubiquitous air pollutant. Evidencefrom heavily exposed miners and theoretical considerations both suggestthat its carcinogenic effects are likely to vary linearly with exposure with-out any threshold. Quantitative analysis indicates that in the UK, the US[1], and also many other countries, radon is the second most importantcause of lung cancer after smoking. It probably causes over a hundred thou-sand lung cancer deaths worldwide each year, considerably more than thenumber thought to be caused by passive smoking.
120

121
Table 7: Lung cancer deaths attributable to residential radon in theUnited Kingdom each year by residential radon concentration
Range residential radon Percentage of Deaths attributable to residential radonconcentrations (Bq m-3) homes in range Number Percent
0-24 75.3 812 35.725-49 14.9 492 21.650-99 6.8 445 19.6
100-199 2.3 296 13.0200+ 0.7 230 10.1
Total 100.0 2275 100.0
Radon deserves attention because residential radon levels can usually be re-duced, often by relatively simple and cheap intervention measures, raising,at least in principle, the prospect of reducing the number of radon-induceddeaths through preventive measures. However, informed discussion on thistopic can take place only if precise, unbiased estimates of the risk associat-ed with a given radon concentration are available, together with good infor-mation about factors that modify the risk. Several countries have introducedradon-control strategies, yet at present these are often aimed at the smallproportion of the population with very high exposures. In contrast, relative-ly little attention has been directed towards the effects of lower radon con-centrations, although the typical log-normal distribution of residentialradon concentrations means that this is where the bulk of radon-induceddeaths are likely to occur. One reason for this may be that direct evidence ofthe carcinogenic risk attached to residential radon is at present weak, as themajority of studies of the effects of residential radon have low power. Atpresent efforts are underway to pool together the data from the existingstudies of residential radon and to explore further the possibilities of deriv-ing estimates of lung cancer risk based on cumulative residential radon ex-posure as recorded in glass objects, and these should provide firmer evi-dence. Additional insight may also arise from work aimed at further eluci-dating the mechanism of radon carcinogenesis (see [1] for a review). Tocomplement these scientific endeavours additional economic work evaluat-ing the cost-effectiveness of various intervention strategies is desirable.

Acknowledgements
This work was supported by the European Commision and the ImperialCancer Research Fund. We thank the many persons who read drafts of thispaper and made helpful and constructive comments, and Mrs C Harwoodfor secretarial assistance.
This paper is reproduced from Annal of Oncology 12: 1341-1351, 2001with permission.
REFERENCES
1. National Research Council. Committee on Health Risks of Exposure toRadon: BEIR VI. Health Effects of Exposure to Radon. Washington,D.C.: National Academy Press 1999.
2. United Nations Scientific Committee on the Effects of Atomic Radia-tion. Sources and Effects of Ionizing Radiation. UNSCEAR 2000 Re-port to the General Assembly, with Scientific Annexes. Vol. I: Sources.New York: United Nations 2000.
3. International Agency for Research on Cancer. IARC Monographs onthe Evaluation of Carcinogenic Risks to Humans. Vol 43. Man-madeMineral Fibres and Radon. Lyon: IARC 1988.
4. International Agency for Research on Cancer. IARC Monographs onthe Evaluation of Carcinogenic Risks to Humans. Vol 78. Ionizing Ra-diation. Part 2. Some Internally Deposited Radionuclides. Lyon: IARC2001.
5. Samet JM, Eradze GR. Radon and lung cancer risk: taking stock at themillennium. Environ Health Perspect 2000; 108(Suppl 4): 635-41.
6. Darby SC, Whitley E, Howe GR et al. Radon and cancers other thanlung cancer in underground miners: a collaborative analysis of 11 stud-ies. J. Natl. Cancer Inst 1995: 87: 378-84.
7. Xiang-Zhen X, Lubin JH, Jun-Yao L et al. A cohort study in southernChina of tin miners exposed to radon and radon decay products. HealthPhys 1993; 64: 120-31.
8. Tomas #ek L, Plac#ek V. Radon exposure and lung cancer risk: Czech Co-hort Study. Radiat Res 1999; 152: S59-S63.
9. Roscoe RJ. An update of mortality from all causes among white urani-um miners from the Colorado Plateau Study Group. Am J Indust Med1997; 31: 211-22.
10. Kusiak RA, Ritchie AC, Muller J, Springer J. Mortality from lung can-cer in Ontario uranium miners. Brit J Industr Med 1993; 50: 920-8.
122
11. Morrison HI, Semenciw RM, Mao Y, Wigle DT. Cancer mortalityamong a group of fluorspar miners exposed to radon progeny. Am JEpidemiol 1988; 128: 1266-75.
12. Radford EP, St Clair Renard KG. Lung cancer in Swedish iron minersexposed to low doses of radon daughters. N Engl J Med 1984; 310:1485-94.
13. Samet JM, Pathak DR, Morgan MV et al. Silicosis and lung cancer riskin underground uranium miners. Health Phys 1994, 4: 450-3.
14. Howe GR, Stager RH. Risk of lung cancer mortality after exposure toradon decay products in the Beaverlodge cohort based on revised ex-posure estimates. Radiat Res 1996; 146: 37-42.
15. Tirmarche M, Raphalen A, Allin F et al. Mortality of a cohort ofFrench uranium miners exposed to relatively low radon concentrations.Br J Cancer 1993; 67: 1090-7.
16. Howe GR, Nair RC, Newcombe HB et al. (1987) Lung cancer mortali-ty (1950-80) in relation to radon daughter exposure in a cohort ofworkers at the Eldorado Port radium uranium mine: possible modifica-tion of risk by exposure rate. J Natl Cancer Inst 1987; 79: 1255-60.
17. Woodward A, Roder D, McMichael AJ et al. Radon daughter expo-sures at the Radium Hill uranium mine and lung cancer rates amongformer workers, 1952-87. Cancer Causes and Control 1991; 2: 213-20.
18. Lubin JH, Boice JD Jr, Edling C et al. Lung cancer in radon-exposedminers and estimation of risk from indoor exposure. J Natl Cancer Inst1995; 87: 817-27.
19. Schoenberg JB, Klotz JB, Wilcox HB et al. Case-control study of resi-dential radon and lung cancer among New Jersey women. Cancer Re-search 1990; 50: 6520-4.
20. Blot WJ, Xu Z-Y, Boice JD Jr et al. Indoor radon and lung cancer inChina. J Natl Cancer Inst 1990; 82: 1025-30.
21. Pershagen G, Lian Z-H, Hrubec Z et al. (1992) Residential radon expo-sure and lung cancer in Swedish women. Health Phys 1992; 63: 179-86.
22. Pershagen G, Åkerblom G, Axelson O et al. Residential radon expo-sure and lung cancer in Sweden. N Engl J Med 1994; 330: 159-64.
23. Lagarde F. Pershagen G, Åkerblom G et al. Residential radon and lungcancer in Sweden: risk analysis accounting for random error in the ex-posure assessment. Health Phys 1997; 72: 269-72.
24. Létourneau EG, Krewski D, Choi NW et al. Case-control study of res-idential radon and lung cancer in Winnipeg, Manitoba, Canada. Am JEpidemiol 1994; 140: 310-22.
25. Alavanja MCR, Brownson RC, Lubin JH et al. Residential radon expo-sure and lung cancer among nonsmoking women. J Natl Cancer Inst1994; 86: 1829-37.
123

26. Ruosteenoja E, Mäkeläinen I, Rytömaa T et al. Radon and lung cancerin Finland. Health Phys 1996; 71: 185-9.
27. Auvinen A, Mäkeläinen I, Hakama M et al. Indoor radon exposure andrisk of lung cancer: a nested case-control study in Finland. J Natl Can-cer Inst 1996; 88: 966-72 and Erratum. J Natl Cancer Inst 1998; 90:401-2.
28. Darby SC, Whitley E, Silcocks P et al. Risk of lung cancer associatedwith residential radon exposure in south-west England: a case-controlstudy. Br J. Cancer 1998; 78: 394-408.
29. Alavanja MCR, Lubin JH, Mahaffey JA, Browson RC. Residentialradon exposure and risk of lung cancer in Missouri. Am J PublicHealth 1999; 89: 1042-8.
30. Field RW, Steck DJ, Smith BJ et al. Residential radon gas exposure andlung cancer: the Iowa radon lung cancer study. Am J Epidemiol 2000;151: 1091-1102
31. Kreienbrock L, Kreuzer M, Gerken M et al. Case-control study on lungcancer and residential radon in Western Germany. Am J Epidemiol2001; 153: 42-52.
32. Wichmann HE, Gerken M, Wellmann J et al. Lungenkrebsrisiko durchradon in der Bundesrepublik Dutschland (Ost). Ecomed, Lansberg/Lech: Theringen und Sachsen 1999.
33. Lagarde F, Axelsson G, Damber L et al. Residential radon and lungcancer among never-smokers in Sweden. Epidemiology 2001; (inpress)
34. Cox DR, Darby SC, Reeves GK, Whitley E. The effects of measure-ment errors with particular reference to a study of exposure to residen-tial radon. In Ron E, Hoffman FO (eds): Uncertainties in RadiationDosimetry and Their Impact on Dose-Response Analyses. USA: Na-tional Cancer Institute 1999.
35. Hubbard LM, Swedjemark GA. Challenges in comparing radon datasets from the same Swedish houses: 1955-1990. Indoor Air 1993; 3:361-8.
36. Lubin JH, Boice JD Jr. Lung cancer risk from residential radon: meta-analysis of eight epidemiologic studies. J Natl Cancer Inst 1997; 89: 49-57.
37. Cohen BL. Test of the linear-no threshold theory of radiation carcino-genesis for inhaled radon decay products. Health Phys 1995: 68; 157-74
38. Lubin JH. On the discrepancy between epidemiologic studies in indi-viduals of lung cancer and residential radon and Cohen’s ecologic re-gression. Health Phys 1998; 75(1): 4-10.
124

39. Lagarde F, Pershagen G. Parallel analyses of individual and ecologicdata on residential radon, cofactors, and lung cancer in Sweden. Am JEpidemiol 1999; 149: 268-74.
40. Darby S, Deo H, Doll R. A parallel analysis of individual and ecologi-cal data on residential radon and lung cancer in south-west England. JR Statist Soc A 2001; 164(1): 193-203.
41. Reeves GK, Beral V, Bull D, Quinn M. Estimating relative survivalamong people registered with cancer in England and Wales. B J Cancer1999; 79: 18-22.
42. World Health Organization. Mortality statistics for the United King-dom, 1950-1998 http://www.who.int/whosis/mort
43. Office for National Statistics. Results from the 1998 general householdsurvey. London: Stationery Office 2000.
44. Peto R, Lopez A, Boreham J et al. Mortality from tobacco in developedcountries: indirect estimation from national vital statistics. Lancet1992; 339: 1268-78.
45. Wrixon AD, Green BM, Lomas PR et al. Natural radiation exposure inUK dwellings. In National Radiological Protection Board reportNRPB-R190. London: HMSO 1988.
46. Peto R, Darby S, Deo et al. Smoking, smoking cessation, and lung can-cer in the UK since 1950: combination of national statistics with twocase-control studies. BMJ 2000; 321: 323-9.
47. Gunby JA, Darby SC, Miles JC et al. Factors affecting indoor radonconcentrations in the United Kingdom. Health Phys 1993; 64: 2-12.
48. Åkerblom G. Radon Legislation and National Guidelines. Report No.99: 18. Stockholm: Swedish Radiation Protection Institute 1999
49. Bradley EJ, Lomas PR, Green BMR, Smithard J. Radon in Buildingsin England: 1997 review. NRPB Report R293. Chilton: National Radi-ological Protection Board 1997.
50. Bradley EJ. Responses to radon remediation advice. In Proceedings ofthe Ninth International Congress of the International Radiation Protec-tion Association, Vienna, Austria 1996; 4-798 to 4-800.
51. Thomas A, Hobson J. Review and Evaluation of the Radon Remedia-tion Pilot Programme. Department of the Environment, Transport andthe Regions Report No. DETR/RAS/00.004. London: Department ofthe Environment, Transport and the Regions 2000.
52. Gold MR, Siegel JE, Russell LB, Weinstein MC. Cost-Effectiveness inHealth and Medicine. New York: OUP 1996.
53. Drummond MF, Stoddart GL, Torrance GW. Methods for the Evalua-tion of Health Care Programmes. Oxford: OUP 1997.
54. Kennedy CA, Gray AM, Denman AR, Phillips PS. A cost-effectivenessanalysis of a residential radon remediation programme in the UnitedKingdom. Br J Cancer 1999; 81(7): 1243-7.
125
55. Kennedy CA, Gray AM. The cost-effectiveness of radon-induced lungcancer prevention in schools. Int J Environ Health Res 2000; 10: 181-90.
56. Lomas PR, Green BMR, Miles JCH, Kendall GM. Radon Atlas ofEngland. NRPB-R290. Chilton: National Radiological ProtectionBoard 1996.
57. Building Research Establishment. Radon: guidance on protective mea-sures for new dwellings. London: Construction Research Communica-tions 1999
58. Denman AR, Phillips PS, Tornberg R. A comparison of the costs andbenefits of radon remediation programmes in new and existing housesin Northamptonshire. J Environ Management 2000; 59: 21-30.
126

Is indoor radon linked to leukaemia in children and adults? – A review of the evidence
D. L Henshaw and J. E Allen
H H Wills Physics Laboratory, University of Bristol, Tyndall Avenue,Bristol, BS8 1TL, UK,
E-mail: [email protected]
Abstract
The evidence linking indoor radon exposure to childhood and adult leukaemia is re-
viewed. At the UK average indoor exposure of 20 Bq m-3, it is estimated that the radon de-
rived equivalent dose accrued to the fetus is 106 µSv. The equivalent dose rate to adult
bone marrow is ~130 µSv y-1. Standard radiation risk factors suggest that 5% of childhood
and 4% of adult leukaemia is linked to radon at 20 Bq m-3 exposure. Geographical studies
generally support such a link at about this magnitude. A number of case-control studies
have been carried out but these in general have not had enough resolving power to deter-
mine a link between radon and leukaemia at the level suggested by radiation risk factors.
Introduction
Radon causes lung cancer in uranium miners and for many years this wasthe only clear example that exposure to natural ionizing radiation can leadto cancer in humans. There is now strong evidence that radon may causelung cancer in the general population at elevated levels indoors, but whetherthis occurs at average domestic levels remains unproven. Information onthe risk of childhood leukaemia following exposure to ionizing radiationcomes from a number of sources, notably the Japanese atomic bomb sur-vivors (BEIR V 1990). Risk assessment based on extrapolation of theJapanese data, suggests that a measurable proportion of childhoodleukaemia in the population may be attributed to background radiation. Ifthis is the case, then we have reason to assume that radon and its decayproducts will also cause leukaemia. Radon and its decay products, however,
127
may be especially important since they emit high LET alpha-radiation.Such radiation (alpha-particles) has been shown to induce both genomic in-stability and bystander effects in haemopoietic stem cells.
This paper will discuss the arguments that a link between radon and bothchildhood and adult leukaemia is expected on grounds of risk assessmentand will review the attempts to establish whether such a link exists in prac-tice. An earlier review has been given by Little (1999), and a detailed dis-cussion may be found in BEIR VI (1999), chapter 4.
Radon derived radiation dose to bone marrow
In radiation dosimetry, considerable effort has been made to model theradon-derived dose to the lung and the risk of lung cancer (BEIR VI, 1999).Here the dose arises primarily from the inhalation of the alpha-emitting de-cay products 218Po and 214Po, which exist in air in aerosol form (Fig. 1). Forleukaemogenesis the target cells are the haemopoietic stem cells whichoriginate in the yolk sac and colonise the bone marrow during fetal devel-opment. In this case we need to consider both the behaviour of 222Rn in itsown right as well as that of its decay products. We also need to take accountof 220Rn (thoron) due to the comparatively long half-life of the decay prod-uct 212Pb (10.6 h) decaying to the alpha-emitter 212Po. In this case we arenot interested in the details of the tracheo-bronchial deposition of inhaledradon decay products, but rather in their transport around the body, oncethey have entered the bloodstream (Pohl and Pohl-Rühling 1967).
When inhaled, 222Rn is distributed around the body according to its solu-bility, which is 0.41 in blood but 16 times greater at 6.3 in body fat (Nuss-baum and Hursch 1958). Following birth, fat progressively ingrows in bonemarrow in the form of fat cells up to 100 µm diameter (Allen et al. 1995).Radon therefore dissolves preferentially in fat allowing a proportion of thealpha-particle energy from the decay of radon and its decay products to bedeposited in the surrounding haemopoietic tissue. At Bristol we have car-ried out detailed modelling of the radon and thoron derived dose to the fe-tus, the child and adult. The fetal dose is particularly relevant because manyif not all cases of childhood leukaemia (acute lymphoblastic leukaemia,ALL) are thought to be initiated in utero (Ford et a.l 1993, 1997; Gale et al.1998; Weimels et al. 1999).
Fig. 2 shows a histological section of fetal bone marrow taken at 35weeks gestation. The structure of marrow spaces is unlike that in the adultand there is a complete absence of fat cells. By about 14 weeks gestation,the evolving marrow contains haemopoietic stem cells. The number densityand spatial distribution of these cells in human fetal bone marrow has re-cently been mapped (Allen and Henshaw 2001). Fig. 3 shows a schematic
128

diagram illustrating the natural alpha-particle irradiation of fetal bone mar-row. The main contributions to radiation dose are from radon and its decayproducts in bone and marrow and from 210Po emissions in bone. Table 1shows estimates of the equivalent dose to fetal bone marrow during gesta-tion at various radon concentrations. The accrued dose in utero at meanradon exposures of 20, 42 and 1,000 Bq m-3 is respectively 106, 150 and1960 µSv.
129
Fig. 1. (a) Growth of 222Rn decay product aerosols (b) 222Rn short-lived radionu-clide decay chain

130
Fig. 2. Fetal bone marrow in lumbar vertebra at 35 weeks gestation. B, bone; M,marrow; CC, calcified cartilage.
Fig. 3. Schematic diagram to show possible paths of alpha-particles from the decayof naturally-occurring alpha-radionuclides.

In adults, a detailed analysis was carried out by Richardson et al. (1991).The age dependent equivalent dose from radon and its decay products isgiven in Fig. 4. In the neonatal period the dose rate is relatively small but inchildhood it rises rapidly reaching a peak at age six. These features reflectthe age dependent variation in the deposition of inhaled radionuclides tak-ing account of lung development in early years. From age 20 onwards theincreasing dose rate is due to the continued ingrowth of fat in marrow(Allen et al. 1995). The presence of fat cells in marrow is illustrated in Fig.5, which shows a histological section of bone marrow from a lumbar verte-bra of an 81-year old female Caucasian.
The above analysis concerns equivalent dose rate to haemopoietic tissueas a whole. Microdosimetric considerations suggest that a high LET alpha-particle traversing a stem cell deposits around 0.5 Gy of energy resulting inqualitatively different damage to that from low LET (gamma and beta) ra-diation (Goodhead 1988) and leading to around a 10% chance of cell sur-vival. The recent evidence concerning genomic instability and the by-stander effect in haemopoietic stem cells suggests that single alpha-particletraversals through cells may have a much greater effect in introducing celldamage at environmental exposures than has hitherto been assumed (Kad-him et al. 1992, Mothersill and Seymour 1998, Prise et al. 1998, Wright1998). This is particularly important in the fetus, where only a few cells re-ceive alpha-particle hits during gestation.
Table 1. Radon and thoron derived equivalent dose to the human fetus atthree representative indoor levels: 20 Bq m-3 (UK average); 42 Bq m-3
(world average) and 1,000 Bq m-3. After Henshaw et al. (1994).
Radionuclide Dose, µSv Commentat
20 Bq m-3 42 Bq m-3 1000 Bq m-3
Pure 222Rn 12 25 600 Fat free marrow222Rn decay products 1 2 50 No transfer of
bismuth220Rn decay products 23 48 1150 Transfer of 212Pb210Po in fetal skeleton 70 75 160 Measured at 20
Bq m-3, scaled forhigher exposures
Total 106 150 1960
131

132
Fig. 4. Estimated mean values for the equivalent dose rate to haemopoietic marrowestimated from birth to 70 years old, at 20 Bq m-3 radon exposure.
Fig. 5. Adult bone marrow in lumbar vertebra of an 81 year old female caucasian.

Initial findings
Lucie (1989) reported a statistically significant geographical association inGreat Britain between domestic radon exposure and the incidence of acutemyeloid leukaemia in adults. No association with gamma radiation wasfound. Henshaw et al. (1990) extended this approach using internationaldata from 14 countries. They showed a series of correlations between do-mestic radon exposure, as estimated from national surveys, and the inci-dence of leukaemia in adults and children. In children, a significant correla-tion was shown for all cancers combined (Fig. 6), for leukaemia and forseveral specific childhood cancers. In adults, significant correlations werefound for acute myeloid leukaemia (AML) and for melanoma and kidneycancer. Weak and largely insignificant correlations were found with back-ground gamma radiation. The gradient of this correlation indicates that ifcausal, only 6% of all childhood cancer is linked to radon at the UK averageindoor radon exposure of 20 Bq m-3. The data suggest a percentage link ofaround 5% and 10% for childhood and adult leukaemia, respectively.
There is a further feature of these geographical associations. In the UK,Henshaw et al. found statistically significant positive correlations for radonversus prostatic cancer and malignant melanoma, but simultaneously a sta-tistically significant inverse (negative) correlation versus background gam-ma radiation. A similar though weaker effect is seen for adult and childhoodleukaemia (Table 2). The correlation coefficient between radon and back-ground gamma radiation in the UK is close to zero – i.e. they are uncorre-lated. Why should the effect shown in Table 2 occur? It is generally agreedthat geographical correlations should be treated with caution. Is this a mereartefact, evidence for an antagonistic interaction between radon and gammaradiation, or simply mutual confounding of the two radiation types?
The dose rate from natural background gamma radiation is such thatevery stem cell receives one ionizing ‘hit’ per year. On a DNA scale, ion-ization from gamma rays is relatively weak and usually results in DNA sin-gle strand breaks (SSBs) which are readily repairable. On the other hand,alpha-particles are highly ionizing on a DNA scale with typically 20 ioniz-ing events across a 2 nm DNA double strand (Goodhead 1988). This causesa double strand break (DSB), which is difficult or impossible to repair.However, at natural exposures a very small number of stem cells are tra-versed by an alpha-particle, and in view of the significant differences inLET a mutual (interacting) effect of alpha-particles and gamma rays isthought unlikely (D T Goodhead personal communication). On the otherhand, a weak negative correlation with gamma rays could occur by con-founding with radon, since the variation in gamma ray exposures across theUK is relatively small, whereas for radon far larger variations occur.
133

Leukaemia and radiation risk estimates
Radiation risk factors have been used to estimate the proportion ofleukaemia in the population that may be linked to background radiation(COMARE 1996). Overall, 14% of childhood leukaemia has been attrib-uted to natural high LET radiation. When account is taken of the dose tobone marrow from the various naturally occurring alpha-radionuclides(Richardson et al 1991, NRPB R276, 1995, Table 5.6), 5% of childhoodleukaemia and 4% of adult leukaemia may be linked to radon in the UK.Coincidentally, therefore, the magnitude of the radon-leukaemia link inchildren derived from risk factors shows agreement with the geographicalobservations (Henshaw et al. 1990), but for adults the magnitude of the sug-gested link is lower.
For childhood and adult leukaemia, these risk estimates suggest that fordomestic radon exposures of 20, 100 and 200 Bq m-3, the respective relativerisks compared to zero radon are around 1.05 and 1.04, 1.25 and 1.20, and1.5 and 1.4. These values also indicate the statistical resolving power re-quired for an epidemiological study designed to test the magnitude of thissuggested radon link. Thus, epidemiological studies of radon and
134
0 20 40 60 80 100 120
Radon concentration, Bq m-3
Canada Denmark
FinlandFrance
West Germany
Italy
Japan
Norway
Poland
Switzerland
Sweden
UK
USA
15
14
13
12
11
10
9
0
Inci
denc
e pe
r 10
0,00
0 pe
r ye
ar.
//
Fig. 6. International incidence of all childhood cancers combined vs. radon concen-tration in indoor air.

leukaemia can be seen as an experimental test of the magnitude of theradon/leukaemia link suggested by standard radiation risk factors. To besuccessful such studies must have the required resolving power.
135
Table 2. Correlation coefficients for radon contents in indoor air and out-door gamma radiation versus prostatic cancer, malignant melanoma andleukaemia in the UK
Data set Correlation CoefficientRn γ-radiation Rn/γ
Prostate cancer mortality*(54 counties)Fractionalmortality AM 0.53 (p<0.001) -0.49 (p<0.001) 0.73 (p<0.001)Fractionalmortality GM 0.58 (p<0.001) -0.55 (p<0.001) 0.83 (p<0.001)
Melanomamortality*(45 counties)Male 0.43 (p<0.01) -0.55 (p<0.001) 0.63 (p<0.001)Female 0.41 (p<0.01) -0.62 (p<0.001) 0.62 (p<0.001)
Leukemia”Adult AML 0.44 (p<0.05) -0.27 (ns) 0.46 (p<0.05)Adult ALL 0.67 (p<0.001) -0.21 (ns) –Childhood ALL 0.65 (p<0.005) -0.13 (ns) –All countries 0.65 (p<0.02) -0.42 (ns) 0.68 (p<0.01)5 countries ‡ 0.54 (ns) -0.01 (ns) 0.95 (p<0.01)
* Data courtesy of the MRC Environmental Epidemiology Unit, University of Southampton.Spearman rank correlation coefficients.
† Data from Henshaw et al, (1990) Pearson’s product moment correlation coefficient,(myeloid leukaemia).
‡ Data from Henshaw et al, (1990) using only those countries recommended by Butland et al,1990, Pearsons product moment correlation coefficient, (myeloid leukaemia).
” Data from Alexander et al. (1990)AM = Arithmetic mean; GM = Geometric mean; ns = not significant at the 95% confidence
level

Assessment of Radon Exposure
The methods of measurement of radon gas concentration are well estab-lished and relatively straightforward. Indoor radon levels are known to havesubstantial diurnal, seasonal and annual variations, and also depend oncharacteristics of the premises and of lifestyle such as the presence of dou-ble glazing and the use of heating. To determine the mean exposure toradon the preferred method is to use an integrating plastic track detectorhoused in a small diffusion chamber. For estimations of exposure with re-spect to the recommended annual limit (200 Bq m-3 in the UK), two detec-tors, one in the bedroom and one in the living area, exposed for threemonths are considered adequate. For epidemiological studies it would seemessential that the detectors be exposed for even longer periods. In the stud-ies summarised in Tables 3 and 4 below some have measured radon in cur-rent as well as previous homes of cases and controls.
The concentration of radon gas, however, may not be an adequate mea-sure of decay product exposure. The ratio of radon decay product concen-tration in air compared to the radon gas concentration (expressed in termsof the relative concentration of their alpha-particle energies, PAEC) canvary significantly, as can the fraction of decay products which are in small-ion form and unattached to aerosols (the so-called unattached fraction). Inthe case of lung dosimetry, Yu et al. (2001) have addressed this problem bydesigning a detector which estimates the bronchial dose from radon decayproducts in air. In principle, this could also be used to estimate bone mar-row dose. An additional consideration for bone marrow dosimetry is thethoron concentration in room air. This is not currently estimated inleukaemia studies.
In a number of studies, radon exposure in the homes of leukaemia caseshave been estimated relative to those in neighbourhood houses (in the UK,the average radon concentration by postcode). On such a small scale theseestimates are unreliable, see Fig. 7, which shows how radon concentrationsmay vary from less than 100 to over 1200 Bq m-3 in a row of identicallybuilt houses. In other studies, local geological features have been used toestimate radon exposure of leukaemia cases. Friis et al. (1999) found thatground level radon is a poor indicator of indoor radon. However, Kohli et al.(2000) used ground level radon as a measure of temporal exposure to radon,which demonstrated a significant association with childhood leukaemia.This study is discussed in more detail below.
Epidemiological studies of radon and leukaemia
Table 3 shows the main published papers on relationships between radonand leukaemia. The papers are listed in chronological order and include
136
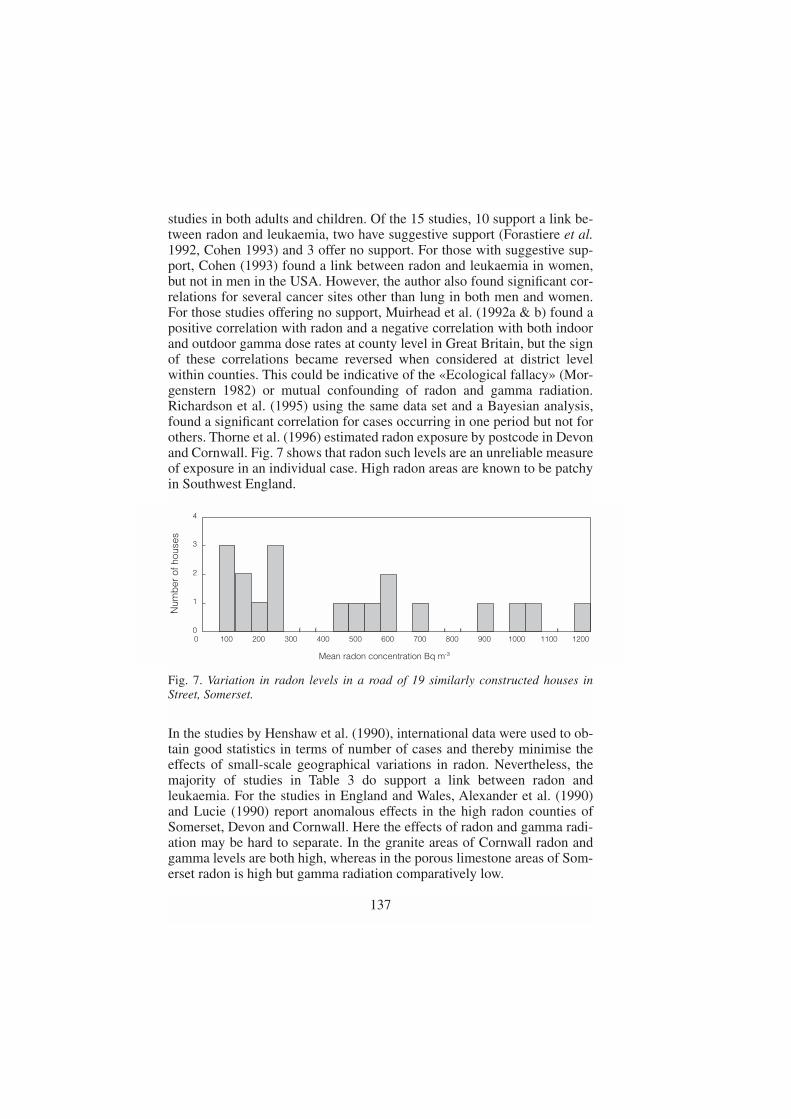
studies in both adults and children. Of the 15 studies, 10 support a link be-tween radon and leukaemia, two have suggestive support (Forastiere et al.1992, Cohen 1993) and 3 offer no support. For those with suggestive sup-port, Cohen (1993) found a link between radon and leukaemia in women,but not in men in the USA. However, the author also found significant cor-relations for several cancer sites other than lung in both men and women.For those studies offering no support, Muirhead et al. (1992a & b) found apositive correlation with radon and a negative correlation with both indoorand outdoor gamma dose rates at county level in Great Britain, but the signof these correlations became reversed when considered at district levelwithin counties. This could be indicative of the «Ecological fallacy» (Mor-genstern 1982) or mutual confounding of radon and gamma radiation.Richardson et al. (1995) using the same data set and a Bayesian analysis,found a significant correlation for cases occurring in one period but not forothers. Thorne et al. (1996) estimated radon exposure by postcode in Devonand Cornwall. Fig. 7 shows that radon such levels are an unreliable measureof exposure in an individual case. High radon areas are known to be patchyin Southwest England.
In the studies by Henshaw et al. (1990), international data were used to ob-tain good statistics in terms of number of cases and thereby minimise theeffects of small-scale geographical variations in radon. Nevertheless, themajority of studies in Table 3 do support a link between radon andleukaemia. For the studies in England and Wales, Alexander et al. (1990)and Lucie (1990) report anomalous effects in the high radon counties ofSomerset, Devon and Cornwall. Here the effects of radon and gamma radi-ation may be hard to separate. In the granite areas of Cornwall radon andgamma levels are both high, whereas in the porous limestone areas of Som-erset radon is high but gamma radiation comparatively low.
137
00
1
2
3
4
100 200 300 400 500 600 700 800 900 1000 1100 1200
Mean radon concentration Bq m-3
Num
ber
of h
ouse
s
Fig. 7. Variation in radon levels in a road of 19 similarly constructed houses inStreet, Somerset.
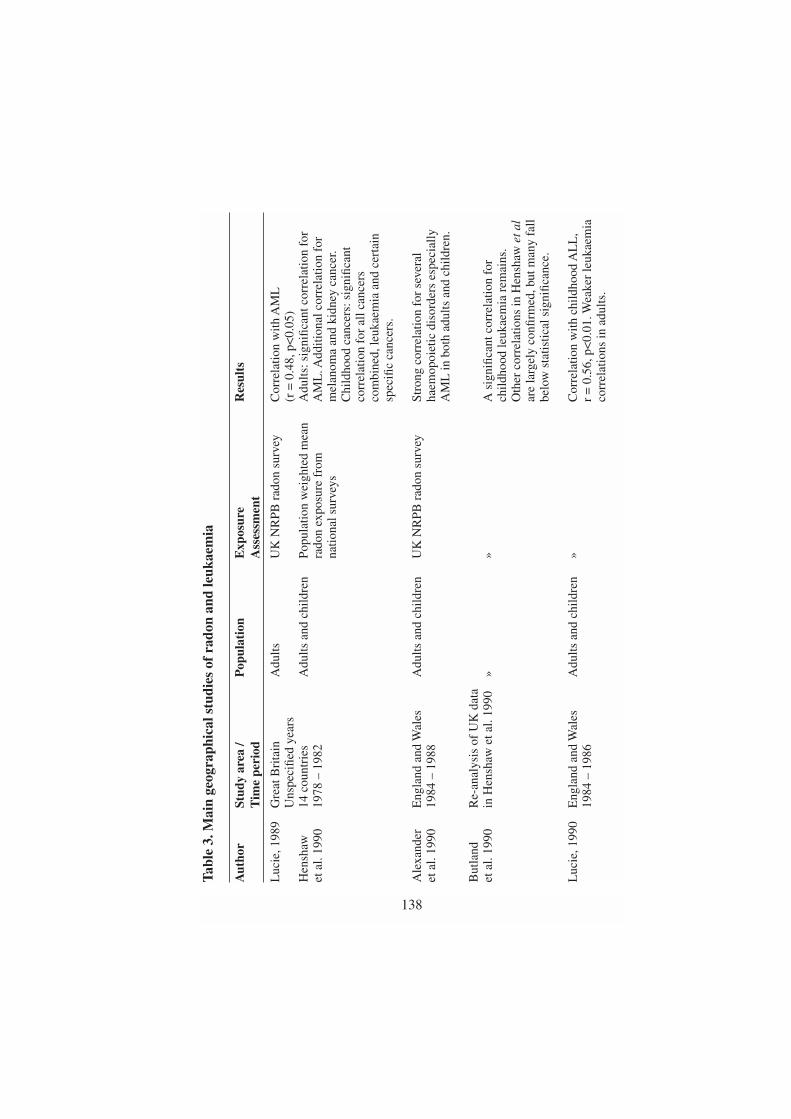
138
Tabl
e 3.
Mai
n ge
ogra
phic
al s
tudi
es o
f ra
don
and
leuk
aem
ia
Aut
hor
Stud
y ar
ea /
Pop
ulat
ion
Exp
osur
e R
esul
tsT
ime
peri
odA
sses
smen
t
Luc
ie,1
989
Gre
at B
rita
inA
dults
UK
NR
PB r
adon
sur
vey
Cor
rela
tion
with
AM
LU
nspe
cifie
d ye
ars
(r =
0.4
8,p<
0.05
)H
ensh
aw
14 c
ount
ries
Adu
lts a
nd c
hild
ren
Popu
latio
n w
eigh
ted
mea
nA
dults
:sig
nific
ant c
orre
latio
n fo
ret
al.
1990
1978
– 1
982
rado
n ex
posu
re f
rom
A
ML
. Add
ition
al c
orre
latio
n fo
rna
tiona
l sur
veys
mel
anom
a an
d ki
dney
can
cer.
Chi
ldho
od c
ance
rs:s
igni
fican
t co
rrel
atio
n fo
r al
l can
cers
co
mbi
ned,
leuk
aem
ia a
nd c
erta
in
spec
ific
canc
ers.
Ale
xand
er
Eng
land
and
Wal
esA
dults
and
chi
ldre
nU
K N
RPB
rad
on s
urve
ySt
rong
cor
rela
tion
for
seve
ral
et a
l. 19
9019
84 –
198
8ha
emop
oiet
ic d
isor
ders
esp
ecia
lly
AM
L in
bot
h ad
ults
and
chi
ldre
n.
But
land
R
e-an
alys
is o
f U
K d
ata
et a
l. 19
90in
Hen
shaw
et a
l. 19
90»
»A
sig
nific
ant c
orre
latio
n fo
r ch
ildho
od le
ukae
mia
rem
ains
.O
ther
cor
rela
tions
in H
ensh
aw e
t al
are
larg
ely
confi
rmed
,but
man
y fa
ll be
low
sta
tistic
al s
igni
fican
ce.
Luc
ie,1
990
Eng
land
and
Wal
esA
dults
and
chi
ldre
n»
Cor
rela
tion
with
chi
ldho
od A
LL
,19
84 –
198
6r
= 0
.56,
p<0.
01. W
eake
r le
ukae
mia
corr
elat
ions
in a
dults
.

139
Mui
rhea
d E
ngla
nd a
nd W
ales
»»
Sign
ifica
nt p
ositi
ve c
orre
latio
ns w
ithet
al.
1991
;199
2ch
ildho
od le
ukae
mia
at c
ount
y le
vel,
but a
neg
ativ
e co
rrel
atio
n fo
r di
stri
cts
with
in c
ount
ies.
Coh
en,1
993
USA
Adu
ltsU
S co
unty
rad
onC
orre
latio
n w
ith le
ukae
mia
inun
spec
ified
yea
rsm
easu
rem
ents
wom
en b
ut n
ot in
men
. Sig
nific
ant
corr
elat
ion
for
seve
ral o
ther
no
n-lu
ng c
ance
r si
tes.
Ric
hard
son
Gre
at B
rita
in
Chi
ldre
n»
Sign
ifica
nt c
orre
latio
n fo
r AL
L f
oret
al.
1995
1969
– 1
983
time
peri
od 1
974
– 19
78,n
ot f
ound
for
othe
r tim
e pe
riod
s.
Lym
an e
t al.
Flor
ida,
USA
Adu
ltsR
adiu
m in
gro
undw
ater
Cor
rela
tion
with
rad
ium
in
1986
1981
used
as
a su
rrog
ate
for
grou
ndw
ater
:ra
don
expo
sure
(1)
tota
l leu
kaem
ia,r
= 0
.56
(p<
0.01
)(2
) AM
L,r
= 0
.45
(p<
0.05
)H
igh
vs. l
ow r
adiu
m,R
R =
2.0
Col
lman
N
orth
Car
olin
a,U
SAC
hild
ren
Rad
on in
gro
undw
ater
H
igh
vs. l
ow r
adon
:et
al.
1991
1950
– 1
979
used
as
a m
easu
re o
f al
l can
cers
RR
= 1
.23
dom
estic
exp
osur
e.(9
5% C
I =
1.1
1 –
1.37
)le
ukae
mia
RR
= 1
.33
(95%
CI
= 1
.13
– 1.
57)

140
Tabl
e 3.
(co
nt’d
)
Aut
hor
Stud
y ar
ea /
Pop
ulat
ion
Exp
osur
e R
esul
tsT
ime
peri
odA
sses
smen
t
Vie
l,19
93Fr
ance
,41
Adu
ltsFr
ench
nat
iona
l sur
vey
Cor
rela
tion
with
AM
L,f
or u
pper
adm
inis
trat
ive
area
san
d lo
wer
tert
iles:
1984
– 1
986
(1)
univ
aria
te a
naly
sis
OR
= 1
.11
(95%
CI
= 1
.00
– 1.
24)
(2)
mul
tivar
iate
ana
lysi
sO
R +
1.4
1 (9
5% C
I =
1.2
5 –
1.62
)
Fora
stie
re
Vite
rbo,
Ital
yA
dult
men
157
9 G
eolo
gica
l fea
ture
s us
edE
xces
s m
yelo
id le
ukae
mia
s of
et a
l. 19
9219
80 –
198
6ca
ses1
10 m
orta
lity
to a
sses
s in
door
rad
on
bord
erlin
e si
gnifi
canc
e:hi
ghca
ses
wer
e ly
mph
atic
le
vels
vs. l
ow r
adon
,OR
= 2
.3,(
95%
CI
and
haem
opoi
etic
=
0.9
– 6
.1).
Sig
nific
ant
OR
for
cond
ition
ski
dney
can
cer,
incr
ease
for
mel
amon
aof
bor
derl
ine
sign
ifica
nce
Hof
fman
E
llwei
ler,
Ger
man
yC
hild
ren
Hig
h co
ncen
trat
ions
of
7 ca
ses
of c
hild
hood
leuk
aem
ia v
set
al.
1993
1970
– 1
989
uran
ium
in s
ub-s
oil
2.3
expe
cted
Tho
rne
Dev
on a
nd C
ornw
all,
Chi
ldre
nR
adon
exp
osur
e es
timat
ed
Non
-sig
nific
ant e
xces
s fo
r AM
L.
et a
l. 19
96
UK
. 197
6 –
1985
301
canc
er c
ases
by p
ostc
ode
Sign
ifica
nt e
xces
s fo
r ne
urob
last
oma.
Koh
li Ö
ster
götla
nd,
Chi
ldre
nG
roun
d le
vel r
adon
use
d Fo
r hi
gh r
adon
,RR
= 5
.67
et a
l. 20
00Sw
eden
53,1
46 c
ance
r ca
ses
as a
sur
roga
te f
or in
door
(9
5% C
I =
1.0
6 –
43)
1979
– 1
995
rado
n ex
posu
reFo
r m
ediu
m v
s. lo
w r
adon
,RR
=
4.64
( 9
5% C
I =
1.2
9- 2
8.26
).
Stro
nger
ass
ocia
tion
with
con
tinue
d re
side
nce
in h
igh
risk
are
a.
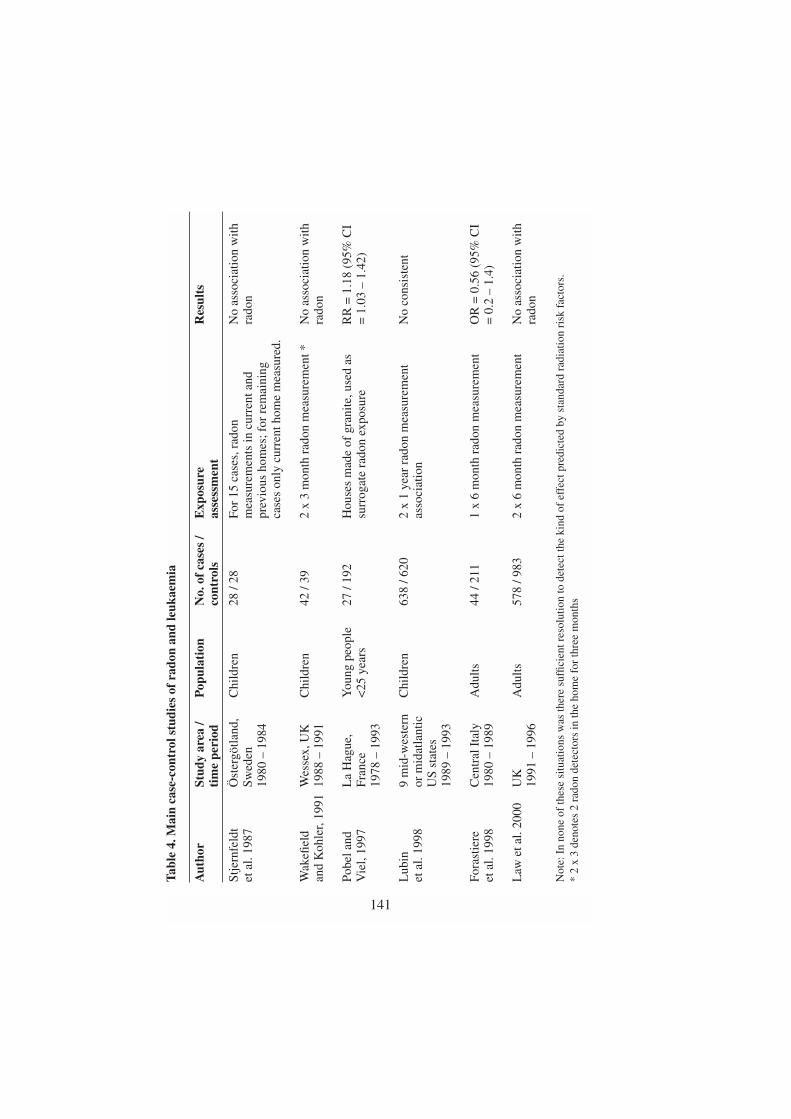
141
Tabl
e 4.
Mai
n ca
se-c
ontr
ol s
tudi
es o
f ra
don
and
leuk
aem
ia
Aut
hor
Stud
y ar
ea /
Pop
ulat
ion
No.
of
case
s /
Exp
osur
eR
esul
tsti
me
peri
odco
ntro
lsas
sess
men
t
Stje
rnfe
ldt
Öst
ergö
tland
,C
hild
ren
28 /
28Fo
r 15
cas
es,r
adon
No
asso
ciat
ion
with
et
al.
1987
Swed
enm
easu
rem
ents
in c
urre
nt a
ndra
don
1980
– 1
984
prev
ious
hom
es; f
or r
emai
ning
case
s on
ly c
urre
nt h
ome
mea
sure
d.
Wak
efiel
d W
esse
x,U
KC
hild
ren
42 /
392
x 3
mon
th r
adon
mea
sure
men
t *N
o as
soci
atio
n w
ithan
d K
ohle
r,19
9119
88 –
199
1ra
don
Pobe
l and
L
a H
ague
,Y
oung
peo
ple
27 /
192
Hou
ses
mad
e of
gra
nite
,use
d as
R
R =
1.1
8 (9
5% C
I V
iel,
1997
Fran
ce<
25 y
ears
surr
ogat
e ra
don
expo
sure
= 1
.03
– 1.
42)
1978
– 1
993
Lub
in
9 m
id-w
este
rn
Chi
ldre
n63
8 / 6
202
x 1
year
rad
on m
easu
rem
ent
No
cons
iste
nt
et a
l. 19
98or
mid
atla
ntic
as
soci
atio
nU
S st
ates
19
89 –
199
3
Fora
stie
re
Cen
tral
Ita
lyA
dults
44 /
211
1 x
6 m
onth
rad
on m
easu
rem
ent
OR
= 0
.56
(95%
CI
et a
l. 19
9819
80 –
198
9=
0.2
– 1
.4)
Law
et a
l. 20
00U
KA
dults
578
/ 983
2 x
6 m
onth
rad
on m
easu
rem
ent
No
asso
ciat
ion
with
1991
– 1
996
rado
n
Not
e:In
non
e of
thes
e si
tuat
ions
was
ther
e su
ffici
ent r
esol
utio
n to
det
ect t
he k
ind
of e
ffec
t pre
dict
ed b
y st
anda
rd r
adia
tion
risk
fac
tors
.*
2 x
3 de
note
s 2
rado
n de
tect
ors
in th
e ho
me
for
thre
e m
onth
s
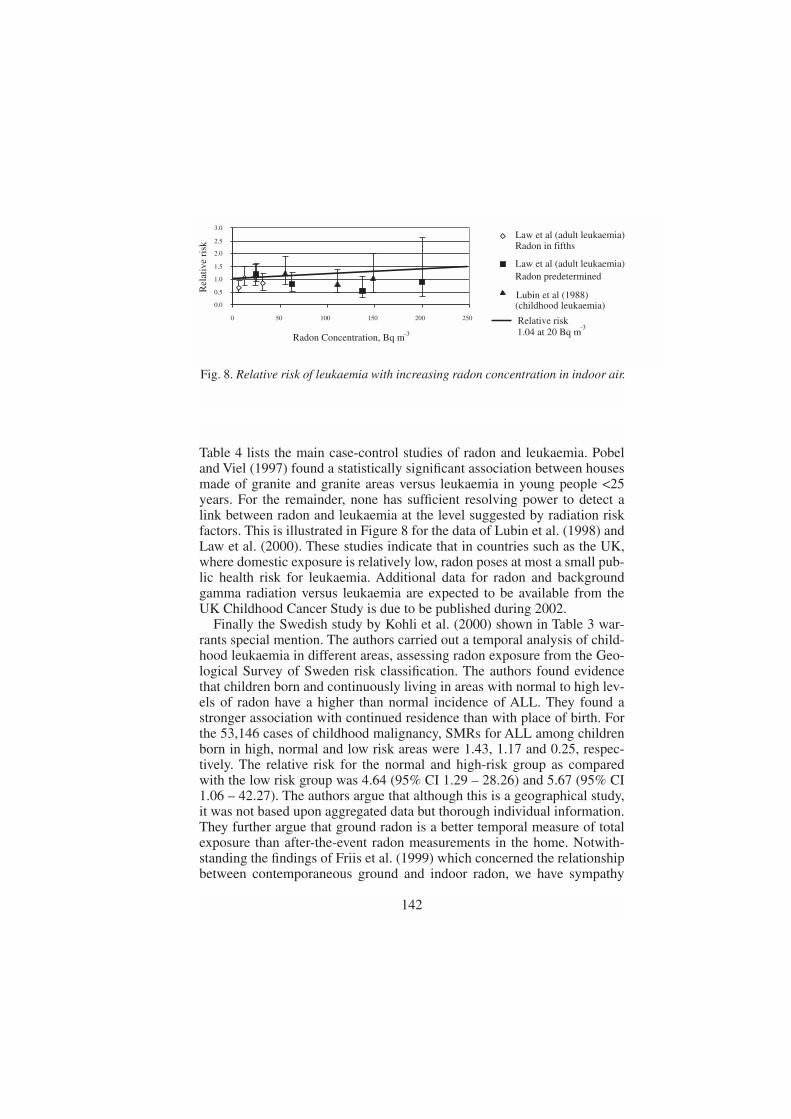
142
0.0
0.5
1.0
1.5
2.0
2.5
3.0
0 50 100 150 200 250
Radon Concentration, Bq m-3
Radon in fifthsLaw et al (adult leukaemia)
Law et al (adult leukaemia)Radon predetermined
Lubin et al (1988)(childhood leukaemia)
Relative risk1.04 at 20 Bq m
-3
Rel
ativ
e ri
sk
Fig. 8. Relative risk of leukaemia with increasing radon concentration in indoor air.
Table 4 lists the main case-control studies of radon and leukaemia. Pobeland Viel (1997) found a statistically significant association between housesmade of granite and granite areas versus leukaemia in young people <25years. For the remainder, none has sufficient resolving power to detect alink between radon and leukaemia at the level suggested by radiation riskfactors. This is illustrated in Figure 8 for the data of Lubin et al. (1998) andLaw et al. (2000). These studies indicate that in countries such as the UK,where domestic exposure is relatively low, radon poses at most a small pub-lic health risk for leukaemia. Additional data for radon and backgroundgamma radiation versus leukaemia are expected to be available from theUK Childhood Cancer Study is due to be published during 2002.
Finally the Swedish study by Kohli et al. (2000) shown in Table 3 war-rants special mention. The authors carried out a temporal analysis of child-hood leukaemia in different areas, assessing radon exposure from the Geo-logical Survey of Sweden risk classification. The authors found evidencethat children born and continuously living in areas with normal to high lev-els of radon have a higher than normal incidence of ALL. They found astronger association with continued residence than with place of birth. Forthe 53,146 cases of childhood malignancy, SMRs for ALL among childrenborn in high, normal and low risk areas were 1.43, 1.17 and 0.25, respec-tively. The relative risk for the normal and high-risk group as comparedwith the low risk group was 4.64 (95% CI 1.29 – 28.26) and 5.67 (95% CI1.06 – 42.27). The authors argue that although this is a geographical study,it was not based upon aggregated data but thorough individual information.They further argue that ground radon is a better temporal measure of totalexposure than after-the-event radon measurements in the home. Notwith-standing the findings of Friis et al. (1999) which concerned the relationshipbetween contemporaneous ground and indoor radon, we have sympathy

with this view. As indicated earlier there is strong evidence that the initiat-ing step in childhood leukaemia is present at birth. Apart from possible ge-netic factors, this emphasises the importance of in utero exposure andtherefore the movements of the expectant mother. After-the-event radonmeasurements in the home may not adequately describe exposure condi-tions during initiation and progression of childhood leukaemia.
Discussion and Conclusion
Geographical studies show a degree of consistency of support for a link be-tween radon and leukaemia in both adults and children at about the levelpredicted from standard radiation risk factors. It is generally agreed that ge-ographical studies should be treated with caution. A number of case-controlstudies of radon and leukaemia have been carried out of which one has re-ported a link with radon, when the presence of granite is used as a surrogatefor exposure. Other studies have reported no link, but none of these had suf-ficient resolving power to detect the excess risk suggested by the radiationrisk factors. Kohli et al. (2000) showed a strong association between radonand childhood leukaemia especially with continued residence in areas ofhigh radon levels. Although this was a geographical study, it was not basedupon aggregated data but thorough individual information. The authors ar-gue that ground radon is a better temporal measure of total exposure thanafter-the-event radon measurements in the home.
Further studies of radon and leukaemia are warranted both to test the pre-dictions of radiation risk analysis and to help determine whether the phe-nomena of genomic instability and the bystander effect impact on risk atnatural exposures to high LET radiation. They are also warranted in view ofthe public health implications in areas and countries with high radon expo-sures. Future studies must address resolving power and the question of howbest to assess exposure to radon, thoron, their decay products and gammaradiation at the time of initiation and progression of leukaemia.
Acknowledgements
This work was supported by the Foundation for Children with Leukaemia,Medical Research Council Programme Grant number 8319972 and the De-partment of Health.
143

REFERENCES
Allen JE, Henshaw DL, Keitch PA, Fews AP and Eatough JP, 1995. Fatcells in red bone marrow of human rib: their size and spatial distributionwith respect to the radon-derived dose to the haemopoietic tissue. Inter-national Journal of Radiation Biology. 68 (6): 669-678.
Allen JE and Henshaw DL, 2001. An in situ study of CD34+ cells in humanfetal bone marrow. British Journal of Haematology. 114 (in press).
Alexander FE, McKinney PA and Cartwright RA, 1990. Radon andleukaemia.. The Lancet, 335: 1336-7.
BEIR V, Committee on Biological Effects of Ionising Radiation, 1990.Health effects of exposure to low levels of ionising radiation. Washing-ton DC, NAS/NRC, National academy Press.
BEIR VI, Committee on the Biological Effects of Ionising Radiation, 1999.Health effects of exposure to radon. National Research Council, Nation-al Academy Press, Washington, D.C.
Butland BK, Nuirhead CR and Draper GJ, 1990. Radon and leukaemia. TheLancet, 335: 1338-1339.
Cohen BL, 1993. Relationship between exposure to radon and varioustypes of cancer. Health Physics, 65: 529-531.
Collman GW, Loomis DP and Sandler DP, 1991. Childhood cancer mortal-ity and radon concentration in drinking water in North Carolina. BritishJournal of Cancer, 63: 626-629.
Committee on Medical Aspects of Radiation in the Environment (CO-MARE) 4th Report, 1996. The incidence of cancer and leukaemia inyoung people in the vicinity of the Sellafield site, West Cumbria: Furtherstudies and an update of the situation since the publication of the reportof the Black Advisory Group in 1984, p62, HMSO (UK).
Forastiere F, Quercia A, Cavariana F, Miceli M, Perucci CA and Axelson O,1992. Cancer risk and radon exposure. The Lancet, 339: 1115.
Forastiere F, Sperati A, Cherubini G, Miceli M, Biggeri A, Axelson O,1998. Adult myeloid leukaemia, geology and domestic exposure toradon and γ radiation: a case-control study in central Italy. Occupationaland Environmental Medicine, 55: 106-110.
Ford AM, Pombo-de-Oliveira MS, McCarthy KP, MacLean JM, CarricoKC, Vincent RF and Greaves M, 1997. Monoclonal origin of concordantT-cell malignancy in identical twins. Blood, 89, No.1, 281-285
Friis L, Carter N, Nordman O, Simeonids A and Järdo S, 1999. Variation ofa geologically based risk map: are the indoor radon concentrations high-er in higher risk areas? Health Physics, 77(5): 541-544.
144

Gale KB, Ford AM, Repp R, Borkhardt, Keller C, Eden OB and GreavesMF, 1997. Backtracking leukaemia to birth: Identification of clonotypicgene fusion sequences in neonatal blood spots. Proceedings of the Na-tional Academy of Science, USA, 94, 13950-13954
Goodhead DT, 1988, Spatial and temporal distribution of energy. HealthPhysics, 55: 231-240.
Goodhead DT 2001. Personal communication. MRC Radiation & GenomeStability Unit, Harwell, UK.
Henshaw DL, Eatough JP, Richardson RB, 1990. Radon: A causative factorin the induction of myeloid leukaemia and other cancers in adults andchildren? The Lancet, 335: 1008-1012.
Henshaw DL, Allen JE, Keitch PA, Salmon PL and Oyedepo C, The mi-crodistribution of 210Po with respect to bone surfaces in adults, childrenand fetal tissues at natural exposure levels In: Health Effects of Internal-ly Deposited Radionuclides: Emphasis on Radium and Thorium (Eds: Gvan Kaick, A Karaoglou & A M Kellerer) Published by World ScientificEUR 15877 EN, ISBN: 981-02-2015-4, (1995).
Hoffmann W, Kranefield A and Schmitz-Feuerhake I, 1993. Radium-226contaminated drinking water: hypothesis on exposure pathway in a pop-ulation with elevated childhood leukaemia. Environmental Health Per-spectives, Supplement 101: 113-115.
Kadhim MA, Macdonald DA, Goodhead DT, Lorimore SA, Marsden SJand Wright EG, 1992. Transmission of chromosomal instability after po-lutonium α-particle irradiation. Nature, 355 (1992) 738-740.
Kohli S, Brage HN and Löfman O, 2000. Childhood leukaemia in areaswith different radon levels: a spatial and temporal analysis using GIS.Journal of Epidemiology & Community Health, 54: 822-826.
Law GR, Kane EV, Roman E, Smith A and Cartwright R, 2000. Res-idential radon exposure and adult acute leukaemia. The Lancet –Research Letters, 355: 1888.
Little J, 1999. Epidemiology of Childhood Cancer. International Agencyfor Research on Cancer: Lyon, France, IARC publication no. 149.
Lubin JH, Linet MS, Boice Jr JD, Buckley J, Conrath SM, Hatch EE, Klein-erman RA, Tarone RE, Wacholder S and Robison LL, 1998. Case-controlstudy of childhood acute lymphoblastic leukaemia and residential radonexposure. Journal of the National Cancer Institute, 90(4): 294-300.
Lucie NP, 1989. Radon exposure and leukaemia. The Lancet, ii: 99-100.Lucie NP, 1990. Radon and acute lymphoblastic leukaemia. Leukaemia and
Lymphoma, 1: 213-216.Lyman GH, Lyman CG and Johnson W, 1985. Association of leukaemia
with radium groundwater contamination. Journal of the American Med-ical Association, 254, No.5, 621-626
145

Morgenstern, H. 1982. Uses of ecological analysis in epidemiological re-search. American Journal of Public Health 72, 1336-1344.
Mothersill C and Seymour CB, 1998. Cell-cell contact during gamma irra-diation is not required to induce a bystander effect in normal human ker-atinocytes: evidence for release of a signalling controlling survival intothe medium. Radiation Research, 149: 256-262
Muirhead CR, Butland BK, Green BMR and Draper GJ, 1992a. Childhoodleukaemia and natural radiation in Britain. The Lancet, 337: 503-504.
Muirhead CR, Butland BK, Green BMR and Draper GJ, 1992b. An analy-sis of childhood leukaemia and natural radiation in Britain. RadiationProtection Dosimetry, 45: 657-660.
National Radiological Protection Board, NRPB-R276, 1995, Risks ofLeukaemia and other Cancers in Seascale from All Sources of IonisingRadiation Exposure. NRPB, Chilton, UK.
Nussbaum, E and Hursh, JB, 1958. Radon solubility in fatty acids andtriglycerides. J. Phys. Chem., 62, 81-84.
Pobel D and Viel J F, 1997. Case-control study of leukaemia among youngpeople near La Hague nuclear reprocessing plant: the environmental hy-pothesis revisited. British Medical Journal, 314: 101-106.
Pohl E and Pohl-Rühling J, 1967. The radiation dose received by inhalationof air containing 222Rn, 220Rn and 212Pb and their decay products. Anaisda Academia Brasileira de Ciências, 39, 393-404.
Prise KM, Belyakov OV, Folkard M and Michael BD, 1998. Studies of by-stander effects in human fibroblasts using a charged particle microbeam.International Journal of Radiation Biology, 74, 793-798.
Richardson RB, Eatough JP and Henshaw DL, 1991. Dose to red bone mar-row from natural radon and thoron exposure. British Journal of Radiolo-gy, 64: 608-624.
Richardson S, Monfort C, Green M, Draper G and Muirhead C, 1995. Spa-tial variation of natural radiation and leukaemia incidence in GreatBritain. Statistics in Medicine, 14: 2487-2501.
Stjernfeldt M, Samuelsson L and Ludvigsson J, 1987. Radiation indwellings and cancer in children. Paediatric Haematology and Oncolo-gy, 4: 55-61.
Thorne R, Foreman NK and Mott MG, 1996. Radon in Devon and Corn-wall and paediatric malignancies. European Journal of Cancer, 32A,No.2: 282-285.
VIEL, J. F., 1993, Radon exposure and leukaemia in childhood. Internation-al Journal of Epidemiology, 22, 627-31.
Wakefield M and Kohler JA, 1991. Indoor radon and childhood cancer. TheLancet, 338: 1537-1538.
146

Weimels JL, Cazzaniga G, Daniotti M, Eden OB, Addison GM, Masera G,Saha V, Biondi A and Greaves MF, 1999. Prenatal origin of acute lym-phoblastic leukaemia in children. The Lancet, 354, 1499-1503.
Wright EG, 1998. Radiation-induced genomic instability in haemopoieticcells. International Journal of Radiation Biology, 74, No.6: 681-687
Yu KN, Lau BMF, Guan ZJ, Lo TY and Young ECM, 2000. Bronchial Rndose survey for residences. Journal of Environmental Radioactivity, 54:221-229.
147

Ecological analyses: radioactive elements versusnasopharyngeal carcinoma and multiple sclerosis
B. Bølviken
Geological Survey of Norway, 7491 Trondheim, NorwayE-mail: [email protected]
Abstract
Comparisons of epidemiological and geochemical maps revealed that in a region in
South-Eastern China exceptionally high rates of nasopharyngeal carcinoma (NPC) coin-
cide with anomalous contents of U and Th in soils. In Norway statistical analyses show
that high rates of multiple sclerosis (MS) are associated with high levels of Rn in indoor
air. Based on these observations it is suggested that high contents of radioactive elements
in soil or air may be risk factors in NPC and MS. Some general comments are given on
the use of ecological analysis in epidemiology together with a discussion of possible
pathways of chemical substances from environment to human beings. It is concluded that
enviromental data have a potential for disclosing hitherto unknown geomedical associ-
ations, which may lead to the formulation of etiological hypotheses.
Introduction
Many examples of correlations between diseases and the chemical environ-ment have been disclosed throughout the history of medicine, of which thecausal ones between dental health and fluorine and between goitre and io-dine probably are the best known. In our times there is a potential for find-ing additional association of this type, since new data on the chemical prop-erties of the environment are being disclosed in many countries. For exam-ple, radiation protection authorities study spatial distributions of the radoncontent in indoor air. Such data have long been of interest in connectionwith incidence of lung cancer. Geological surveys and private industry per-form geochemical mapping based on chemical analyses of samples of a va-riety of materials, such as waters, soils and stream sediments. This type ofmapping is normally used as a tool in mineral exploration, but since manyelements are often determined, the data may also be applied in other fields,
148
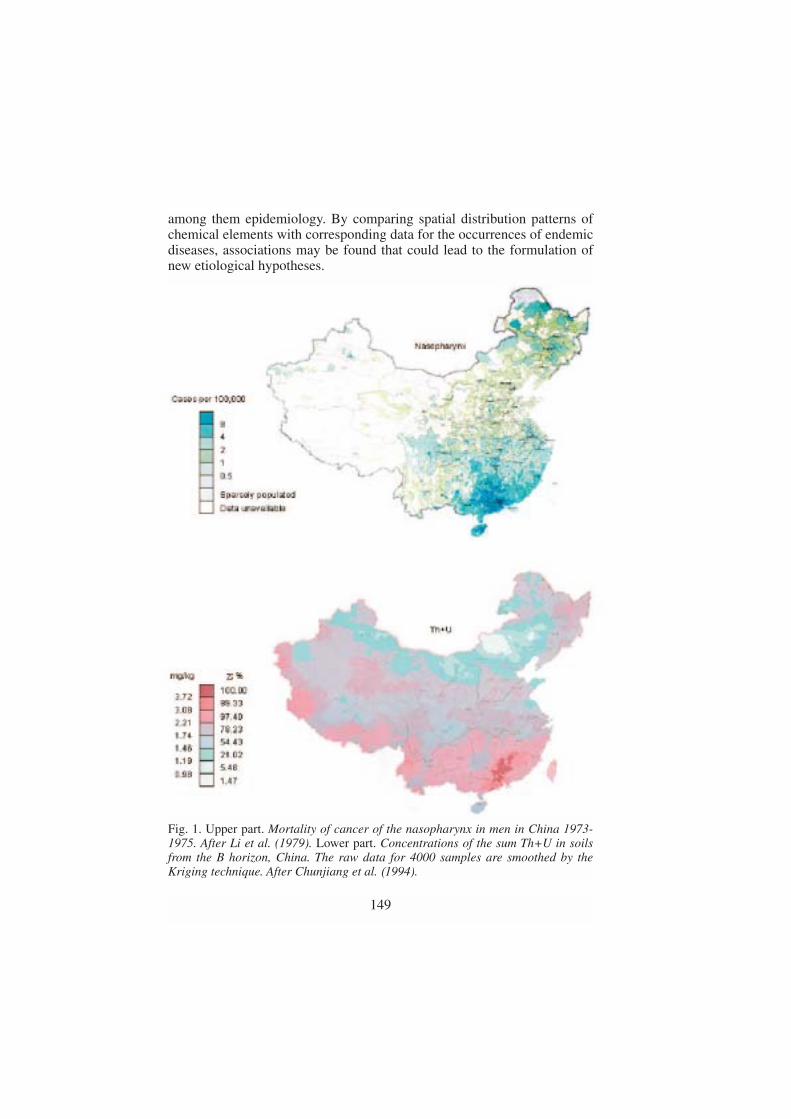
among them epidemiology. By comparing spatial distribution patterns ofchemical elements with corresponding data for the occurrences of endemicdiseases, associations may be found that could lead to the formulation ofnew etiological hypotheses.
149
Fig. 1. Upper part. Mortality of cancer of the nasopharynx in men in China 1973-1975. After Li et al. (1979). Lower part. Concentrations of the sum Th+U in soilsfrom the B horizon, China. The raw data for 4000 samples are smoothed by theKriging technique. After Chunjiang et al. (1994).

This paper reports on two such cases involving radioactive elements,Case History 1 about nasopharyngeal carcinoma (NPC) in China, and CaseHistory 2 about multiple sclerosis (MS) in Norway. Towards the end of thepaper some viewpoints are given on the use of ecological analysis in epi-demiology and of possible pathways from environment to human beings.
Case History 1. Nasopharyngeal carcinoma (NPC) in ChinaNPC is a malignant disease in the respiratory tract. The disease is very rarein most places, but in parts of South-Eastern China it is the most commontype of cancer with incidence rates about 100 fold those in most Caucasianpopulations (Muir et al.1987). The aetiology of NPC is not completely un-derstood, but it is thought to be determined by an interplay of three factors,namely (1) a genetic element, (2) the Epstein–Barr virus and (3) one ormore properties of the environment (Ho 1972). Many attempts have beenmade to find the environmental agents. As a result of this research con-sumption of salted fish and other kinds of preserved foods has attracted at-tention (Yu 1990). However, convincing evidence that these are the only en-vironmental factors of interest has not been produced. It is, therefore, stilldesirable to look for additional possibilities.
Epidemiological maps of China show that the NPC rates depict an irreg-ular pattern with exceptionally high rates in South East China in relation tothose in the rest of the country. Comparison of the epidemiological mapsfor NPC with maps showing the contents of Th and U in soils, reveals thatthe areas with the highest NPC rates in the south-east of the country alsohave anomalously high contents of radioactive elements in soil, especiallyTh, but also U (Fig. 1). The area with high NPC is further characterized bylow contents of Mg, Ca and Sr (not shown here), see Zeng et al. (1994),Bølviken et al. (1997a); Bølviken (2000).
Case History 2. Multiple sclerosis (MS) in NorwayMS is a serious disorder that implies demyelination in the central nerve sys-tem resulting in motor weakness. Norway belongs to the countries whereMS is most prevalent. The aetiology of MS is not completely understood,but it is widely accepted as being multifactorial, i.e. due to three main typesof agent: (1) a genetic element, (2) a virus and (3) one or more external en-vironmental factors (Mathews et al. 1991)
Westlund (1982) published rates for the sum of MS-related deaths anddisabilities for Norwegian municipalities . Based on these data, Brørvik(1984) estimated age and sex adjusted total rates for each of 73 rural mu-nicipality aggregates spread over the country. Bølviken (1998) andBølviken et al. (1997b, 2003) compared these rates with various environ-
150

mental parameters, of which contents of Rn in indoor air and the fall out ofmarine salts are referred here.
Data for municipality aggregates were used in these comparisons, be-cause the population of some of the municipalities in Norway are too smallto produce reliable data for rare diseases. Only rural municipalities wereused in order to emphasize the effects from natural conditions and reducethose from socio-economic factors such as moving.
The MS incidence rates in the rural municipality aggregates depict a sys-tematic distribution pattern (Fig.2), showing low incidences along the coastand in Northern Norway, and high incidences in the inland of SouthernNorway east of the main mountain range.
The concentration of Rn in indoor air has been determined by Strand et al(1991) in 7500 randomly selected Norwegian houses using the nucleartrack method for 6-month periods during 1987 to 1989. From these data thearithmetic mean of Rn concentrations (Bq/m3) were computed for each ofthe 73 rural municipality aggregates (Fig 3).
Municipal aggregate values for annual fallout of Mg were calculated fromprecipitation data published by the Norwegian Institute of Meteorology(Førland 1993) and interpolated values of Mg concentrations in precipitationrecorded at 40 stations distributed throughout Norway (NILU 1995) (Fig. 4).
The statistical co-variations between the epidemiological and the envi-ronmental data were analysed with a method of spatially moving correla-tion (Bølviken et al. 1997b). A circular window is drawn around an obser-vation point on a map of digitised data in such a way that it encompassesthe n-1 nearest points on the map (Fig. 5). The Spearman rank correlationcoefficient for epidemiological versus environmental data is then calculatedfor the n observation points within the window. The obtained value is plot-ted as a symbol located at the central point of the window. A new circularwindow encompassing the n-1 closest neighbours is then defined aroundanother observation point on the map, and the correlation coefficient is cal-culated and plotted in the same way as for the first window. This procedureis repeated for all possible window positions (in this case 73). The resultingmap shows the spatial distribution of the correlation coefficient for the mu-tually overlapping windows. At heterogeneous density of the observationpoints the size of the circle will vary over the map, but the degree of free-dom (n-2) will be constant for all windows independent of position. Thenumber of observation points (n) within the window is chosen by the oper-ator as a compromise between a good resolution (low n) and an acceptableprecision (high n). In this case n was chosen to be 25. Significance tests ofthe obtained correlation coefficients were done by comparing with resultsof 1000 simulations using permuted data..
In the western parts of southern Norway there are significant positivecorrelations (p<0.01) for MS versus the contents of radon in indoor air
151
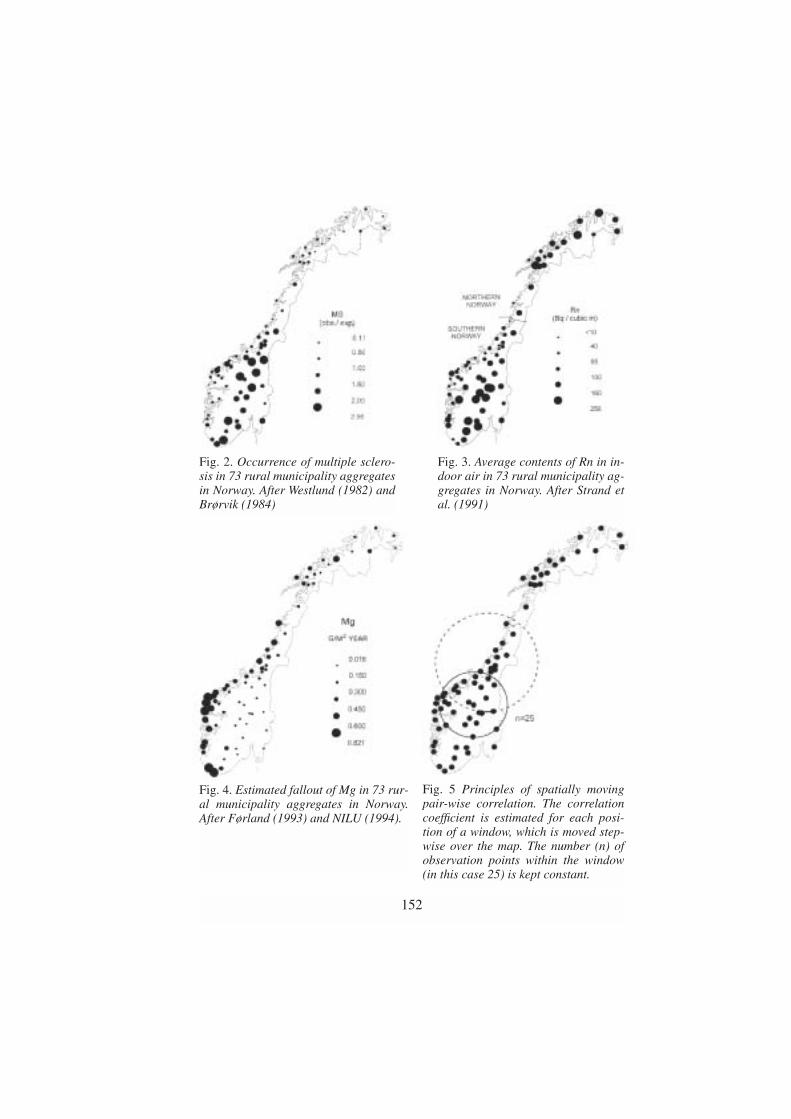
152
Fig. 2. Occurrence of multiple sclero-sis in 73 rural municipality aggregatesin Norway. After Westlund (1982) andBrørvik (1984)
Fig. 3. Average contents of Rn in in-door air in 73 rural municipality ag-gregates in Norway. After Strand etal. (1991)
Fig. 4. Estimated fallout of Mg in 73 rur-al municipality aggregates in Norway.After Førland (1993) and NILU (1994).
Fig. 5 Principles of spatially movingpair-wise correlation. The correlationcoefficient is estimated for each posi-tion of a window, which is moved step-wise over the map. The number (n) ofobservation points within the window(in this case 25) is kept constant.

(Fig 6), and inverse (negative) correlations (p<0.01) for rates of MS versusfallout of Mg (Fig 7). (Bølviken et al. 2003). There are no similar correla-tions in Northern Norway.
Comments on the observed associations
The associations found for NSP in China and MS in Norway have certainsimilarities. In both cases high incidence rates of the disease coincide withhigh levels of radioactive elements and low levels of Mg. These features areno proof of causal relationships, but suggest, nevertheless, that a possiblerole of these elements in the development of the diseases should be furtherstudied. Rn may in both cases be a harmful agent, while a possible benefi-cial effect of Mg could perhaps be an indirect one.
Låg (1968) showed that in Norway fallout of airborne marine elements,such as Mg, might replace exchangeable alkaline earths in the upper humiclayer of soils, producing a pattern of increasing Ca from coast to inland.Reimann et al. (2000) demonstrated similar effects of Mg on Ba contents insoil, and Bjerk et al. (1999) indicated that ion exchange between marine
153
Fig. 6. Spatially moving correlation formunicipal rates of multiple sclerosis(Westlund 1982) versus Rn in indoor air(Strand et al. 1991). See also Figs. 2 and3.
Fig. 7. Spatially moving correlation formunicipal rates of multiple sclerosis(Westlund 1982) versus atmosphericfallout of Mg (Førland 1993 and NILU1994). See also Figs. 2 and 4.

cations and Chernobyl-derived 137Cs is more pronounced along the coastthan inland. The Rn progeny Ra may perhaps behave similarly to the men-tioned heavy alkalis and alkaline earths.
Problems involved in the use of ecological analysis
It has been shown that the results of ecological analysis for groups of per-sons are not always valid for individuals. This is the so-called ecologicalfallacy; see for example Morgenstern (1982). In addition, non-consideredparameters (confounders) might dominate in the analysis. Many re-searchers, therefore, state that ecological analysis may be misleading andshould be used with great care, preferably only after an etiological hypoth-esis is formulated.
Some comments to these objections are given below:(1) Medical history has several cases of a successful early application of
ecological analysis. The classical example is Snow’s work in London inthe 19th century. Snow plotted the known cases of cholera in the city onmaps and pointed thereby to the existence of a waterborne pathogenicfactor, that consequently could be offset by dismounting certain waterpumps (Rosenberg 1962).
(2) It is better to run the risk of an ecological fallacy than to lose new im-portant information. Serious consequences of possible ecological fal-lacies may be avoided by suitable follow-up work (e.g. case controlstudies) before any intervention is realized. Possible confounders maythen also be defined, leading to the disclosure of the real factors.
(3) Ecological studies should be used to generate hypotheses, rather than totest these. Ecological fallacies and confounders may even be a greaterproblem in the testing than in the formulation of a hypothesis, becausein the testing, corroboration of a suggested hypothesis may easily bemisjudged as proof of causality.
Possible pathways from environment to humans
The natural environment may influence the health status within populationgroups in many different ways. A list of some important mechanisms is giv-en below. However, the combined effect of these mechanisms may be verycomplex. The individual cause-and-effect functions are not-linear, sincevarious agents may act synergistic or antagonistic in relation to each other,depending on the circumstances.(1) The health of human beings may be influenced through the intake of
drinking water, which may contain a variety of harmful or beneficial
154

constituents of local origin, such as particles, dissolved salts and micro-organisms.
(2) Food consumption is another pathway from environment to humans.This environmental impact is greatest in populations living close to na-ture, but even in industrialized countries some foodstuff such as vegeta-bles, fruit and milk may be produced locally in the region of consump-tion, reflecting properties of the local geochemistry.
(3) Inhaled air contains dust particles and vapour with dissolved salts.Some of this material could be anthropogenic, but in many places thebulk may be natural, reflecting the composition of near and remote wa-ters and other geological and biological materials. Constituents in theair may be taken up directly through skin and lung epithelium or enterthe digestion tract after having been retained in respiratory organs andmoved up through the trachea (Wagner 1980).
(4) Intake of soil is an important pathway from the environment to grassinganimals. It has been shown, however, that accidental or deliberate in-gestion of soil (geophagia) is a realistic possibility also for human be-ings (Thornton 1984, Smith 2001).
(5) Natural ionizing radiation may influence the health of human beingsdepending on local conditions, since the content of radioactive ele-ments in the basement, the water and air vary both locally and regional-ly. In countries with climates where heating is common, the indoor airmay be enriched in Rn to concentrations far above the natural ones, seefor example the present paper, BEIR V (1990), Strand et al. (2001).
(6) The natural environment may influence the health of human beingsthrough complex pathways, for example through intermediate hosts ofharmful micro-organisms. Malaria and bilharziasis provide well-known examples of such problems.
(7) Viruses are involved in the pathogenesis of many diseases. Some virusmay have an impact on human beings early in life, and then a latent pe-riod during which it may be reactivated by various factors, such asstress and ultraviolet radiation (Oakley et al. 1997). This points to thepossibility that latent virus may be reactivated also by various proper-ties of the natural geochemical environment.
Conclusion
Empirical data indicate that the field of geomedicine (also called medicalgeology) has a potential for disclosing hitherto unknown associations be-tween spatial distributions of diseases and qualities of the environment.Such associations may animate new perspectives in epidemiological re-search. Even though associations alone cannot prove any causal relation-
155
ships, they may lead to the generation of etiological hypotheses, which canbe tested by case control studies or other epidemiological methods.
REFERENCES
BEIR V. (1990) Health effects of exposure to low levels of ionizing radia-tion. Committee on Biological Effects of Ionizing Radiations, Washing-ton D.C: National Research Council. National Academy Press, 421 p.
Bjerk T, Steinnes E, Varskog P. (1999) Retention of radiocesium in naturaltopsoil in Norway. In: Strand P, Jølle T. (eds.) The 4th International Con-ference on Environmental Radioactivity in the Arctic. Norwegian Radia-tion Protection Authority, Oslo, pp 213-215.
Brørvik K (1984) Selen og multippel sklerose i Noreg. In Norwegian. (Se-lenium and multiple sclerosis in Norway). Geological Survey of Nor-way, Open File Report 84.114, 42 pp.
Bølviken B. (1998) Geomedisin. In Norwegian with an English summary.Norwegian Journal of Epidemiology 8, 7-17.
Bølviken B. (2000) Relationships between nasopharyngeal carcinoma andradioactive elements in soils in China. Medical Hypotheses. 55, 513-516.
Bølviken B, Flaten TP, Zeng C (1997a) Relations between nasopharyngealcarcinoma and magnesium and other alkaline earth elements in soils inChina. Medical Hypotheses 48, 21-25.
Bølviken B, Nilsen R, Ukkelberg Å. (1997a) A new method for spatiallymoving correlation analysis in geomedicine. Environmental Geochem-istry and Health 18, 143-153.
Bølviken B, Celius E G, Nilsen R, Strand T. (2003) Radon: a possible riskfactor in multiple sclerosis. Neuroepidemiology. 22 87-94.
Chunjiang Z. (chief editor) (1994) National Environmental ProtectionAgency of the People’s Republic of China, China. National Environ-mental Monitoring Centre. The atlas of soil environmental backgroundvalue in the People’s Republic of China. Shanghai: China Environmen-tal Science Press.
Førland EJ. (1993) Precipitation normals 1961-1990. Norwegian Meteoro-logical Institute, Report 39/1993, 63 pp.
Ho JHC. (1972) Nasopharyngeal carcinoma (NPC). Advanced Cancer Re-search 15, 57-92.
Li J. et al. (1979) Atlas of cancer mortality in the People’s Republic ofChina. 1st edition. China Map Press, Shanghai.
Låg J. (1968) Relationships between the chemical composition of the pre-cipitation and the contents of exchangeable ions in the humus layer ofnatural soils. Acta Agricultura Scandinavica 18, 148-152.
156

Matthews WB, Compton A, Allen IV, Martyn C. (Eds.) (1991) McAlpine’sMultiple Sclerosis. Edinburgh: Churchill Livingstone.
Morgenstern H. (1982) Uses of ecological analysis in epidemiological re-search. American Journal of Public Health 72, 1336-1344.
Muir C, Waterhouse J, Mack T, Powel J, Whelan S. (1987) Cancer Inci-dence in Five Continents, Volume V (IARC Scientific Publications No88) Lyon: International Agency for Research on Cancer.
NILU (1994) Norwegian Institute of Air Research: Content of magnesiumin precipitation. Data on magnetic tape.
Oakley C, Epstein JB, Sherlock CH. (1997) Reactivation of oral herpessimplex virus. Oral Surgery, Oral Medicine and Oral Pathology 84, 272-278.
Reimann C, Banks D, Galina K. (2000) Processes influencing the chemicalcomposition of the O-horizon of podzols along a 500-km north-southprofile from the coast of the Barents Sea to the Arctic Circle. Geoderma95, 113-139.
Rosenberg CE. (1962) The cholera years. The University of Chicago Press.Smith B. (2001) Geophagia. Earthwise. British Geological Survey, Issue
17, 24-25.Strand T, Green BMR, Lomås PR, Magnus K, Stranden E. (1991) Radon i
norske boliger (Radon in Norwegian dwellings). In Norwegian with anEnglish abstract. National Institute of Radiation Hygiene, Østerås, Nor-way, 24 pp.
Strand T, Ånestad K, Ruden L, Ramberg GB, Lunder Jensen C, HeibergWiig A, Thommesen G. (2001) Kartlegging av radon i 114 kommuner.In Norwegian. (Mapping of radon in 114 municipalities.) NorwegianRadiation Protection Board, Open File Report 6.
Thornton I. (1984) Environmental geochemistry and health in the UnitedKingdom. In: Låg J. (ed.) Geochemical research in relation to geochem-ical registrations. The Norwegian Academy of Science and Letters/ Uni-versitetsforlaget, 125-136.
Wagner JC. (1980) The pneumoconiosis due to mineral dusts. Journal of theGeological Society 137, 537-545.
Westlund K. (1982) Recent statistical data on multiple sclerosis and someother diseases in Norway. Nordic Council of Arctic Medical Research32, 19-29.
Yu MC. (1990) Diet and nasopharyngeal carcinoma. Progress in Clinicaland Biological Research 346, 93-105.
Zheng YM, Tuppin P, Hubert A, Jeannel D, Pan YJ, Zeng Y, de The G.(1994) Environmental and dietary risk factors for nasopharyngeal carci-noma: a case -control study in Zangwu County, Guangxi, China. BritishJournal of Cancer 69, 508-514.
157

Cancer incidence among Norwegianairline crew
T. Haldorsen1, J. B. Reitan2 and U. Tveten3
1 The Cancer Registry of Norway, 2 Norwegian Radiation Protection Authority, 3 Institute for Energy Technology.
E-mail: [email protected]
Introduction
For many years there has been a discussion on small doses of ionizing radi-ation and health effects. Results from epidemiological studies are neededfor that discussion. But there are difficulties in performing such studies,some of the interesting diseases are very rare in the general population andlarge populations are needed for demonstrating small effects. Another prob-lem is estimation of doses, it may be difficult to make reliable estimates ofthe doses for the persons included. One way of achieving materials are tolook at groups that have some occupational exposure to ionizing radiation.Airline crew is such a group.
Jet planes were introduced in commercial air traffic around 1960. Sincethen many new types of jets have been introduced and an increasing part ofthe routes are served by jet planes. These have higher cruising altitude thanpropellers. This means that aircraft crew by time have been more exposedto cosmic radiation at work. The exposure is within the limits of the regu-lations for occupationally exposed persons and the annual doses may becompared to that of natural background radiation. But even if the doses arevery small it may be interesting to study cancer incidence among airlinecrew to have empirical input to the discussion of health effects of low dosesof ionizing radiation.
In later years studies of cancer incidence among airline crew have beenperformed by Pukkala et al. (1995), Grayson et al. (1996), Band et al.(1996), Gundestrup et al. (1999), Rafnsson et al. (2000, 2001). AmongFinnish cabin attendants an excess risk of breast cancer was found (Pukkalaet al. 1995). In the Canadian and Danish studies there were indications ofan excess leukemia risk for pilots (Band et al. 1996, Gundestrup et al.1999).
The present project has been a collaboration between three different in-stitutions. The results we present have been published elsewhere (Tveten et
158

al. 2000, Haldorsen et al. 2000, Haldorsen et al. 2001). The first article pre-sents the procedure for estimation of doses for pilots. The others give re-sults on cancer incidence among Norwegian pilots and cabin crew.
Material
The cohorts were established with information from the files of the CivilAviation Administration that authorize both pilots and cabin crew for serv-ing on a commercial airplane. More details were found on the aviation ca-reer of the pilots that have to renew their licence every 6 or 12 months.Among pilots are also included flight engineers and helicopter pilots. Thepilot cohort included all persons who had valid licenses as commercial pi-lots between 1946 and 1994. For the pilots the files contained informationof type of license , type of aircraft, dates for renewal of license, cumulativeflight hours and information on smoking habits. The flight hours recordedare the so called block hours, measuring the time from leaving a gate to en-tering the gate at arrival. The cabin cohort included all persons with a cab-in crew license between 1950 and 1994. The cabin crew renew their licenceevery fifth year, every second year before 1983.
For each pilot we knew annual block hours and what type of plane theywere flying. If we had doserate per hour for each plane, this could be multi-plied by block hours to produce an estimate of annual dose. Time tables ofSAS gave all flight legs served and type of planes that were used. For eachtype of plane the distribution of time on different flight leg duration was es-timated. A selection of routes representing different flight leg durations wasfound. For these routes the doses were estimated by CARI, a computer pro-gram from Federal Aviation Administration in the United States. Importantinput to this program is the flight profiles on the various routes. Members ofthe Pilots Association were consulted about flight profiles. The doses fromthe program were weighted by the distribution for time on different flightleg durations to produce an average dose rate for each plane. For planes notused by SAS a simpler method was used. For these, members of the PilotsAssociation suggested typical routes where the planes had been used andCARI estimates were made for these. The estimated dose rates for theplanes varied between 0.03 µSv/h to 4.3 µSv/h.
The average block hours per year was below 500, and the estimated an-nual doses for pilots were very seldom above 2-3 mSv.
To keep track of persons after they were included in the cohorts, we usedthe population registries of Norway. These also supplied the fertility histo-ry of women born after 1934. The Cancer Registry of Norway is popula-tion-based and have registered incident cases of cancer since 1953. All in-habitants of Norway have since 1960 had a unique identification number,and this was used for linkage of the data sources.
159

Results
About 3700 men were included in the cohort of pilots, data on 63 female pi-lots are not presented due to the small number. The cohort of cabin crew isabout the same size as the pilots. The follow-up included more than 70 000person years for both cohorts. For pilots this is slightly above the corre-sponding Canadian and Danish studies. Our cabin cohort is about 3 timeslarger than the Finnish one. In both cohorts there were some emigration. In-dividual follow-up of these persons stop at the date of emigration.
For cancer incidence we report the number of observed cases in the co-horts, the expected number of cases given the person years in the cohort andincidence rates by age and calendar periods in the general population. Stan-dardised Incidence Ratio (SIR) is computed as ratio of observed to expect-ed. For the SIR a 95% confidence interval is presented. For all cancer com-bined, only men serving as cabin crew had a cancer incidence significantlydifferent from that of the general population (Table1).
Given the exposure to cosmic radiation, the cancer sites most convinc-ingly related to ionizing radition should be considered. That is leukemiawhen excluding chronic lymphatic leukemia, thyroid cancer and breast can-cer among women.
For the cohorts combined there are 3 cases of leukemia versus 5.4 ex-pected (Table 1). Combining the cohorts we also found less cases than ex-pected of thyroid cancer (Table 1).
The comparison to the general population should be supplemented withanalyses within the cohorts. For the pilots we have estimates of dose andcan use this in the tabulation. Combining leukemia and thyroid cancer, thecases are not found in the upper categories by dose (Table 2).
For the cabin crew we have to use duration of employment as a proxy forexposure. There is an increase in SIRs by duration but this is far from sig-nificant since it based on only 5 cases (Table 3).
Leukemia and thyroid cancer are rare diseases and more informativemight be the figures for breast cancer. There were 38 cases versus 34.0 ex-pected (Table 1). There was no indication of an increasing trend in SIRs byduration of employment (Table 3).
Number of children and age at first birth are well known risk factors forbreast cancer. In an internal analysis we adjusted for these two variables aswell as age and calendar period. But the estimates of the effect of durationof employment changed little from the external analysis. There was no ef-fect of length of employment before 26 years old, a variable included to testharmful effect of exposure at young age (Table 4). The analysis was re-stricted to persons with complete information on fertility and included 30cases of breast cancer.
Looking at the types of cancer more closely related to ionizing radiation
160
we did not among Norwegian airline crew find any effect of their exposureto cosmic radiation.
But for both cohorts we found excess risk for malignant melanoma andnon-melanoma skin cancer (Table 1). This has also been found in otherstudies of airline crew. Ionizing radiation has been very seldom discusssedin connection to malignant melanoma, it has been discussed in connectionto non-melanoma skin cancer but usually for much higher doses than airlinecrew experience. Solar radiation is a risk factor for these cancers. We do nothave data to prove that airline crew are more exposed to the sun at theirleisure time than the general population.. Later studies in Norway indicatean excess risk of these cancers in the upper social class, presumely con-nected to leisure time activities. So far leisure time activities are our sug-gestion for explanation of the excess risk for these cancers.
Even if Civil Aviation Administration had taken care of data back to1950, the precision in our results are limited. Studies on cancer incidenceamong aircraft crew have also been undertaken in the other Nordic coun-tries. Both for pilots and cabin crew there will be performed pooled analy-ses of the Nordic material.
REFERENCES
Band PR, Le ND, Fang R, et al. Cohort study of Air Canada pilots: mortal-ity, cancer incidence, and leukemia risk. Am J Epidemiol 1996; 143:137-143.
Grayson JK, Lyons TJ. Cancer incidence in United States Air Force air-crew, 1975-89. Aviat Space Environ Med 1996; 67: 101-104
Gundestrup M, Storm HH. Radiation-induced acute myeloid leukaemia andother cancers in commercial jet cockpit crew: a population-based study.Lancet 1999; 354: 2029-2031.
Haldorsen T, Reitan JB, Tveten U. Cancer incidence among Norwegian air-line pilots. Scand J Work Environ Health 2000; 26: 106-111.
Haldorsen T, Reitan JB, Tveten U. Cancer incidence among Norwegian air-line cabin attendants. Int J Epidemiol 2001; 30: 825-830.
Pukkala E, Auvinen A, Wahlberg G. Incidence of cancer among Finnish air-line cabin attendants, 1967-92. BMJ 1995; 311: 649-652.
Rafnsson V, Hrafnkelsson J, Tulinius H. Incidence of cancer among com-mercial airline pilots. Occup Environ Med 2000; 57: 175-179.
Rafnsson V, Tulinius H, Jónasson JG, Hrafnkelsson J. Risk of breast cancerin female flight attendants: a population-based study (Iceland). CancerCauses Control 2001; 12: 95-101.
Tveten U, Haldorsen T, Reitan J. Cosmic radiation and airline pilots: Expo-sure pattern as a function of aircraft type. Radiat Prot Dosim 2000; 87:157-165.
161
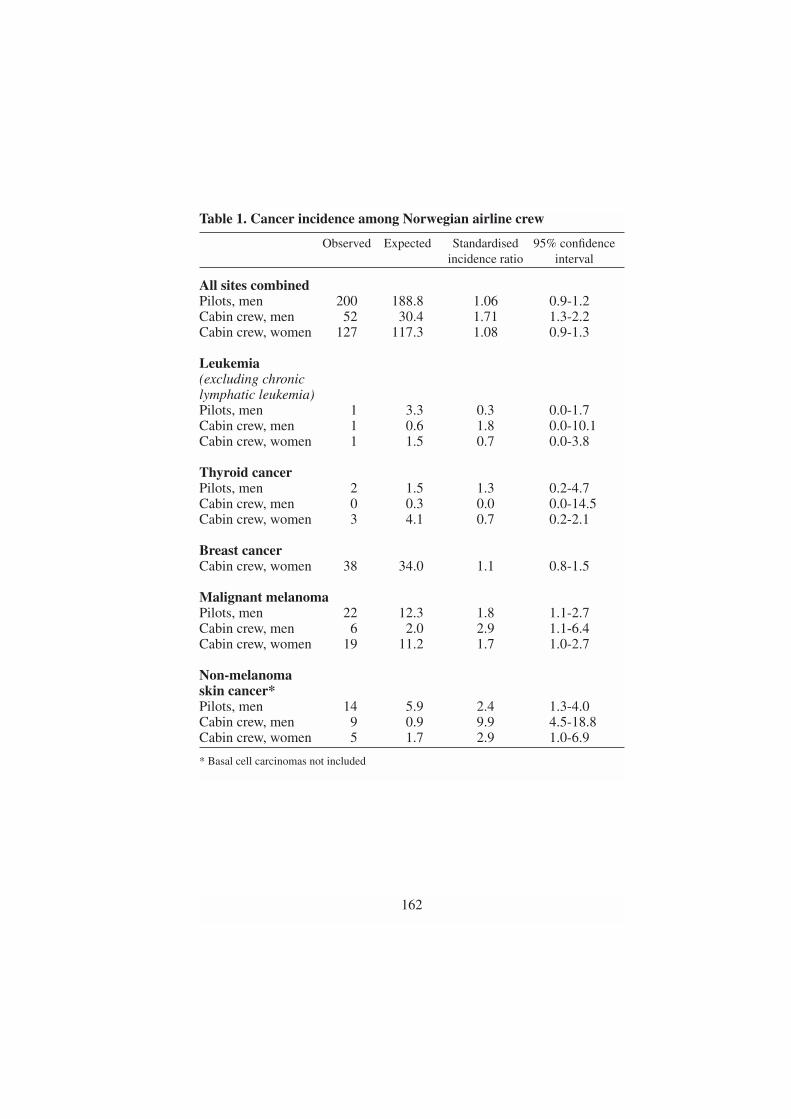
Table 1. Cancer incidence among Norwegian airline crew
Observed Expected Standardised 95% confidenceincidence ratio interval
All sites combinedPilots, men 200 188.8 1.06 0.9-1.2Cabin crew, men 52 30.4 1.71 1.3-2.2Cabin crew, women 127 117.3 1.08 0.9-1.3
Leukemia(excluding chronic lymphatic leukemia)Pilots, men 1 3.3 0.3 0.0-1.7Cabin crew, men 1 0.6 1.8 0.0-10.1Cabin crew, women 1 1.5 0.7 0.0-3.8
Thyroid cancerPilots, men 2 1.5 1.3 0.2-4.7Cabin crew, men 0 0.3 0.0 0.0-14.5Cabin crew, women 3 4.1 0.7 0.2-2.1
Breast cancerCabin crew, women 38 34.0 1.1 0.8-1.5
Malignant melanomaPilots, men 22 12.3 1.8 1.1-2.7Cabin crew, men 6 2.0 2.9 1.1-6.4Cabin crew, women 19 11.2 1.7 1.0-2.7
Non-melanomaskin cancer*Pilots, men 14 5.9 2.4 1.3-4.0Cabin crew, men 9 0.9 9.9 4.5-18.8Cabin crew, women 5 1.7 2.9 1.0-6.9
* Basal cell carcinomas not included
162

Table 2. Trend by cumulative dose for leukemia* and thyroid cancercombined, pilots
Observed Expected Standardised 95% confidence incidence ratio interval
0-1 mSv 2 2.6 0.8 0.1-2.711-10 mSv 1 1.1 0.9 0.0-4.9110-20 mSv 0 0.7 0.0 0.0-5.1120+ mSv 0 0.3 0.0 0.0-11.1
* Excluding chronic lymphatic leukemia
Table 3. Trend by duration of employment, cabin crew
Observed Expected Standardised 95% confidence incidence ratio interval
Leukemia* and thyroid cancercombined< 5 years 2 3.2 0.6 0.1-2.25-14 years 2 2.4 0.8 0.1-3.015+ years 1 0.8 1.3 0.0-7.4
Breast cancer (women only)< 5 years 19 15.7 1.2 0.7-1.95-14 years 14 13.0 1.1 0.6-1.815+ years 5 5.3 0.9 0.3-2.2
* Excluding chronic lymphatic leukemia
163

Table 4. Adjusted* rate ratios for length of employment and length ofemployment before the age of 26 from multivariate analysis of breastcancer incidence
Length of employment (years) Rate ratio 95% confidence interval
Total0–4 1.0 Reference5–14 1.1 0.4–2.615+ 1.0 0.3–3.0
Before age 26 years 0 0.4 0.1–1.90–1 1.4 0.4–4.51–2 0.9 0.2–2.82–3 1.2 0.5–3.03+ 1.0 Reference
* Adjusted for attained age, calendar period, number of children and age at first birth.
164

Should radon be removed from homes?A cost-effect analysis
H. Stigum1, T. Strand2 and P. Magnus1
1 Department of Epidemiology, National Institute of Public Health,0462 Oslo, Norway,
2 Norwegian Radiation Protection Authority ,1345 Østerås, NorwayE-mail: [email protected]
Radon is a radioactive gas that may leak into buildings from the ground.Studies of underground miners have shown that radon exposure is a riskfactor for lung cancer. Case-control studies from the general population in-dicate a risk also at the lower radon levels found in homes. The radon con-centration in homes may be reduced by simple ventilation procedures, or bymore costly changes in the construction.
An intervention against radon exposure in homes may consist of locatinghomes with high radon exposure (above 200 Bq m-3) and improving these,and protecting future houses. The purpose of this paper is to calculate thecosts and the effects of this intervention.
We performed a cost-effect analysis from the perspective of the society,followed by an uncertainty and sensitivity analysis. The direct costs con-sists of measurement, improvement and added construction costs in futurehomes, minus treatment costs for those that would become ill without theintervention. The number of lung cancers caused by radon exposure wascalculated from the observed number of lung cancers times the attributablefraction of lung cancers due to radon. The latter was calculated from the rel-ative risk of lung cancer for a given radon level and the number of homeswith this radon level. The relative risk of lung cancer is assumed to increas-es linearly with the radon level, with RR=1.23 (range 1.05-1.6) at 150Bq/m3. The distribution of radon levels in Norwegian homes is lognormalwith median=38 Bq/m3, mean=74.5 Bq/m3 , and 7.6 % above 200 Bq/m3.All costs and effects are presented as total present values discounted at 3%per year. In the uncertainty analysis, the simultanous effect of uncertainty inthe parameters on the cost-effect ratio is estimated, as well as the sensitivi-ty of the cost-effect ratio towards variation in each parameter.
The preventable attributable fraction of radon on lung cancer was 3.8%(95% uncertany interval: 0.6%, 8.3%). In cumulative present values the in-
165
tervention would cost $ 238 (145, 310) million and save 892 (133, 1981)lives, each life saved costs $ 0.27 (0.09, 0.9) million. The cost-effect ratiowas sensitive to the radon risk, the radon exposure distribution, and the la-tency period of lung cancer. Together these three parameters explained 90%of the variation in the cost-effect ratio.
The uncertainty in the estimated cost per life is large, mainly due to un-certainty in the risk of lung cancer from radon. Based on estimates fromroad construction, the Norwegian society has been willing to pay $ 1.4 mil-lion to save a life. This is above the upper uncertainty limit of the cost perlife. The intervention against radon in homes therefore seems recommend-able.
166

Radioactive deposits associated with gas condensate production and treatment
T. Ramsøy and T. Bjørnstad
Institute for Energy Technology, P.O. Box 40, N-2027 KjellerE-mail: [email protected]
Abstract
The existence of an ”invisible” 210Pb and progeny containing scale in tubes, valves, sep-
arators, tanks etc. is generally little known in the petroleum industry. Radioactivity above
the exemption level has however been measured in such equipment in the North Sea and
elsewhere. A general survey program for 210Pb and progeny should be implemented in
order to reveal the extent of the problem.
Introduction
Production and enrichment of naturally occurring radioactive material(NORM) in the petroleum industry has attracted increasing attention duringthe last 15 years as a potential health hazard problem. The radioactivity isusually associated with precipitates (scales) and sludge in production tub-ing, pumps, valves, separators, settling tanks etc. wherever water is beingtransported or treated. 226Ra and 228Ra are the most well known radioactiveconstituents in scale. This presentation will focus on a different type of lowspecific activity deposit, “lead scale”. Lead scale contains the long-lived ra-dionuclide 210Pb (half-life = 22.3 y) and the shorter-lived progeny 210Bi and210Po.
Formation and transport of lead scale
Low specific activity deposits containing 210Pb have been found in connec-tion with gas production in the Norwegian sector of the North Sea. Lead de-posits can be transported through the production system either supported bythe noble gas 222Rn (where 210Pb is produced in the decay of 222Rn) or un-supported (as 210Pb).
Deposits formed by the first mechanism are most likely to be found at lo-
167

cations where the gas is retained for some time and in equipment that onlytreats gas or condensate. This may result in transport of 222Rn (and thereby210Pb) over long distances. The deposit consists mainly of an “invisible”layer, which in practice is a surface contamination of the steel material.
The deposits formed by the second mechanism may consist of inactiveelementary lead or various lead compounds, which in most cases have beenfound to be very thin. Deposits from unsupported lead have been observedon equipment, which has been in contact with produced water. The lead isfound in the form of metallic lead or as chemical compounds such as leadsulphide (galena). It is expected that stable lead act as a carrier in theprocess. It has been observed that in the water phase unsupported lead istransported with brine. Lead sulphide is thought to form by a reaction withH2S. The specific radioactivity of the lead or lead compounds is often quitehigh, in the order of kBq per gram. The mechanisms for transport and set-tling is not well understood, but are assumed to be as indicated in Fig.1.
The data on the existence of lead scale is relatively scarce. Some infor-mation have however been gathered. Lead scale has however also beenfound at installations in the Norwegian sector (Fig.2). The lead scale prob-ably constituted from lead sulphide transported in the water phase. It maybe interesting to note that we find sulphate scale and lead scale in the near-well zone whereas equipment topside and in the upper part of the produc-tion string contains only lead scale. The specific activity of the lead depositis typically 20 Bq/g in this case, and that is above the exemption limit.
Detection and classification
For measurement of 210Pb one can take advantage of the weak low energygamma ray emitted for laboratory measurements using high-resolutiongamma spectrometry. The gamma radiation is however too weak to be de-tectable with hand-held instruments as for example Geiger-Müller coun-ters. On-site measurements therefore must rely on detection of the beta ra-diation from decay of the daughter 210Bi.
The aim of the measurements is usually to decide whether the scale is ex-empted or should be treated as radioactive material and subsequently ra-dioactive waste. The exemption levels to be applied in the Norwegian sec-tor have been put down by the Norwegian Radiation Protection Authority.A deposit should be regarded radioactive if the specific activity of any oneof the nuclides 226Ra, 228Ra or 210Pb exceeds 10 Bq/g.
The challenge for the industry is to determine on-site whether the compo-nent should be treated as radioactive or not. The criterion for a method to beused on-site is that it is simple to perform without long training. The equipmentshould be commercially available off-the-shelf. The method must of coursehave sufficient reliability to ensure that radioactive deposits are detected.
168

A method based on measurement of beta radiation from 210Bi has beenproposed. The equipment required for this is a standard beta-sensitive cont-amination monitor with a suitable probe. As such instruments only give theinstrument specific reading counts per second, a calibration with scale stan-dards must be undertaken. Such standards have been made available for theoil companies.
Consequences for the industry
Although not a big problem under ordinary operations, it may become oneduring service operations and decommissioning. The deposits of 210Pb andprogeny may be invisible, i.e. they exist as a mono- or a few- atomic layeron the steel surface with a relatively high surface activity. In such cases,necessary cleaning operations may not be implemented. This is clearly un-fortunate in cases where the equipment is re-used in other industries (i.e. forinstance in the water supply industry).
169
Fig. 1.a. Generation 222Rn from 226Ra-containing scale and transport in a gas sys-tem. b. Simultaneous dissolution of 210Pb from 226Ra-containing scale and emana-tion of 222Rn from the same scale and further transport in a water system

Radiation dose to personnel on- or offshore from 210Pb deposits are ex-pected to be negligible. There is, however, a certain risk for inhalation ofairborne particles released during operation like cutting or welding of cont-aminated equipment. Intake can effectively be avoided using protective de-vices such as a dust mask and by a good working practise.
170
Fig. 2. Occurrence of 210Ph-scale at an installation on the Norwegian shelf
Small doses of radiation during radiotherapy
D. R. Olsen
Centre for Research and Training in Radiotherapy,The Norwegian Radium Hospital, Oslo
E-mail: [email protected]
Abstract
Treatment of cancer by radiation is usually performed applying doses of ~2 Gy, given in
10 to 40 fractions. Consequently, the biological effects and their underlying molecular
and genetic mechanisms have been regarded as distinct different from the effects and
mechanisms relevant for low dose environmental exposure. Novel radiobiological insight
has revealed that effects commonly observed at lower dose levels may be utilised in im-
proving the therapeutic ratio in radiotherapy, i.e. the ratio between tumour and late toxi-
city of normal tissues and organs.
Introduction
Ionizing radiation is not only known to cause cancer, it has also been usedfor a century to treat cancer. To day, approximately 45% of all cancer pa-tients are cured from their disease; 22% due to surgery, 12% by radiothera-py, an additional 6% by combined radiotherapy and surgery, and 5% bychemotherapy. Still, almost 20% of the patients die due to failure of localtumour control (1). A report from the Swedish Council on Technology As-sessment in Health Care (2), demonstrated that an increase in 5-year sur-vival of 10 % could be achieved if established research results were imple-mented into clinical practice and routine. Although radiotherapy by nomeans is a novelty among cancer treatment strategies, this modality pos-sesses still large potentials with respect to those patients who currently ex-perience local failure.
The “Achilles-heal” of all current cancer treatment strategies is the latetoxicity following treatment. Optimisation strategies in radiotherapy aimstherefore at providing high local tumour control rates, and at the same timerestrict the frequency and severity of late normal tissue effects to an accept-able level. Optimisation of radiotherapy follows in general two differentstrategies: (a) biological optimisation, i.e. dividing the total dose into small-
171

er fraction sizes thereby allowing repair of radiation damage in normal tis-sue to a larger extent than in tumour tissue, and (b) physical optimisation,i.e. confine the high dose volume to that of the tumour tissue and micro-scopic disease, by applying numerous irradiation photon beams and a“cross fire” approach (1). Traditionally, irradiation of tumour tissue hasbeen performed using daily fractions of 2 Gy, whilst normal tissue has re-ceived either approximately the same dose or 2-3 cGy. However, new treat-ment strategies aim at giving multiple fractions per day of 0.7-1.5 Gy to tu-mour tissue and 0.1-0.7 Gy to larger volumes of normal tissues and organs.The biological consequences of this altered treatment strategy with respectto late toxicity is, however, not obvious.
Radiation induced apoptosis:
The traditional explanation for cell kill following irradiation is based on in-direct and direct damage of DNA, which during mitosis results in cell inac-tivation if not appropriately repaired. However, newer research in cell biol-ogy reveals that cellular inactivation may occur as a result of a diversity ofprocesses. One of those which lately have gained particular interest in radi-ation biology, is the form of cell death named apoptosis. This process is reg-ulated in numerous ways, e.g. by inhibition or blocking of protein synthe-sis. The apoptotic process is triggered at the G1 restriction point in the G1
172
Dose (Gy)0 20 40 60 80 100
0
20
40
60
80
100
tumour respons
normal tissue respons
tumour
normaltissue
Respons (
%)
Fig. 1. Dose response relationships for tumors and normal tissue. The greater thedistance between the two curves, the larger is the therapeutic ratio.

phase of the cell cycle. Apoptosis may be induced by a number of stressfactors, including radiation.
Apoptosis has been recognised as a major component in cell death innormal tissues, and as a crucial mechanism in the organogenesis of the foe-tus. However, apoptosis has not been seen in late reacting normal tissue.Moreover, tumour cells may undergo apoptosis, which may represent a sig-nificant component of the treatment response. The amount of mitotic cellkill due to irradiation has been suggested to be linear-quadratic dependentof the dose, D:
SF = e –(α•D+β•D2) (eq. 1)
where α and β are radiosensitivity parameters and SF is the cell survivingfraction. Equation (1) is often referred to as the LQ-model.
This model does not take into account different modes of cell inactiva-tion, and does not differ between the mitotic component and the apoptoticcomponent of the cell inactivation following irradiation. Following themodelling work of Ling and co-workers (3), a new model for cell survivalfollowing fractionated irradiation was established (4):
SFn = [Fa•e–ε•D + (1 – Fa)]n • e–(α•D+β•D)2•n (2)
Here, SFn is the surviving fraction after n treatment fractions, ε is the sensi-tivity with respect to radiation induced apopotisis, and Fa is the maximumapoptotic fraction that possibly can be induced by radiation.
The ratio between the surviving fraction of normal tissue cells and tu-mour cells may be denoted the “biological effect ratio” BR, and may repre-sent an indicator of the local tumour control vs. normal tissue toxicity fol-lowing irradiation. BR may be calculated based on published data for tu-mour tissue, both with respect to mitotic as well as apoptotic cell kill. Asapoptosis has not been reported for late sequela, the only contribution tonormal cell inactivation resulting in late toxicity, arises from calculations ofmitotic cell kill. Figure 2 shows that the biological effect ratio increases asthe dose per fraction decreases, and increases with increasing maximumapoptotic component. This indicate that when the treatment is divided intoa larger number of fractions, each of smaller dose, relatively fewer tumourcells will undergo mitotic cell inactivation and more will proceed throughthe cell cycle entering G1 where p53 at the G1 restriction point may triggerapoptosis of the cell.
It has been documented through numerous clinical studies that an im-proved therapeutic ratio (biological effect ratio between normal tissue andtumour tissue) is achieved as the dose per fraction is reduced. However, themechanism behind this effect has previously not been fully understood. The
173

recent results indicate that apoptosis may represent an important contribu-tion to this mechanism. Moreover, new treatment strategies may emphasiseon stimulating apoptosis in combination with fractionated radiotherapy.
Radiation hypersensitivity:
Studies by Mike Joiner (5) and others have shown that cell survival, pre-dicted by the LQ formalism (eq. 2), is vastly overestimated compared to ex-perimental data for dose levels between 0.3-0.7 Gy. This effect, which hasbeen named radiation hypersensitivity, has also recently been observed in aclinical study conducted by Turreson and Joiner (6), where the incidence ofskin erythema was investigated with respect to variable dose per fraction.
They conclude that the tolerance was reduced at doses per fraction lowerthan 2 Gy, and higher than 3 Gy. Also, Joiner et al has proposed a modifica-tion of the conventional LQ-formalism (eq. 1) to account for the radiationhypersensitivity (6(, named the hypersensitivity model. The hypersensitivi-ty model predicts the actual cell survival with greater precision, especiallyin the low dose region than the conventional LQ model.
The observation of radiation hypersensitivity in low dose regions may
174
Dose pr. fraction (Gy)0 1 2 3 4
2
1
3
4
Fa=0.9
Fa=0.3
Bio
logi
cal e
ffect
rat
io -
BR
Figure 2. Calculated ratio between normal tissue and tumour cell survival, calcu-lated for a fractionated radiotherapy scheme using α/β of 3 for normal tissue, 10 fortumour; ε=0.3 for tumour tissue and 0 for normal cells (4).

have significant clinical impact, not only with respect to erythema of theskin, but also with respect to soft tissues. Modern therapy techniques applymultiple photon beams, often 4-10 beams, directed towards the tumour vol-ume. The immediate consequence is that most soft tissue areas included inthe irradiated areas, but not included in the “cross fire”-area (i.e. the highdose irradiated areas), receives doses of 0.3-0.7 Gy. This dose level corre-
175
Dose (Gy)0 5 10
0.01
0.1
1
Dose (Gy)0.0 0.5 1.0 1.5
0.5
0.6
0.7
0.8
0.9
1
cell survival predictedby conventionalLQ model
region ofhypersensitivity
Sur
vivi
ng fr
actio
n -
SF
SF
Fig. 3. Illustration of cell survival curves calculated using the conventional LQ for-malism, and the hypersensitivity model published by Joiner et al. (16)
Fig. 4. CT image of the pelvic, showing a 4 beam irradiation technique for ca.cervix. Areas within the beams, but not included in the “cross fire’’ -region will re-ceive 0.3-0.7 Gy. Photon beam borders are marked with white lines.

sponds to the region of radiation hypersensitivity, and may result in in-creased frequency of normal tissue late toxicity compared to what is pre-dicted by conventional LQ-formalism. Figure 5 show the biological effect,converted into total treatment dose, given as 2Gy-fractions (i.e. standardfractionated irradiation), taking into account the radiation hypersensitivityusing the hypersensitivity model (5). The figure shows an increased biolog-ical effect of doses per fraction less than 0.6 Gy. In current treatment strate-gies, normal tissues and organs are usually spared by distributing the doseto a larger volume and to dose levels of 0.3-0.7 Gy. Consequently, radiationhypersensitivity may cause a substantially larger biological effect in normaltissue than expected. Physical optimisation the way it’s currently develop-ing, may therefore not be in accordance with the criteria of biological opti-misation.
176
Dose per fraction (Gy)
0.25 0.50 0.75 1.00 1.25 1.50 1.75 2.00 2.25
50
45
55
60
65
70
75
80
85
70 Gy equivalent
50 Gy equivalent
Bio
logi
cal e
ffec
t cor
resp
ondi
ngto
tota
l dos
e in
2 G
y-fr
actio
ns
Fig. 5. The biological effect of a fractionated regime of 50 and 70 Gy, taking into ac-count radiation hypersensitivity, given i 2Gy- equivalent total dose.
REFERENCES
1. Bruland, Ø.B., Olsen, D.R. Stråleterapi mot år 2000: Langs nye veiereller «paa gjengrodde stier». Kreftnytt, 1:4-8, 1997.
2. Einhorn, J. Strålbehandling vid cancer. SBU-report 129, 1996.3. Ling, C.C., Chen, C.H., Fuks, Z. An equation for the dose response of
radiation-induced apoptosis: possible incorporation with the LQ model.Radiother. Oncol. 33:17-22, 1994.
4. Olsen, D.R. Calculation of the biological effect of fractionated radio-therapy: the importance of radiation-induced apoptosis. Br. J. Radiol.68:1230-1236, 1995.
5. Joiner, M. Induced radioresistance: an overview and historical perspec-tives. Int. J. Radiat. Biol. 65:79-84, 1994.
6. Turesson, I., Joiner, M. Clinical evidence of hypersensitivity to low dos-es in radiotherapy. Radiother. Oncol. 40:1-3, 1996.
177