natural gas growth: which industry players benefit the most?
TRANSCRIPT
THE MONTHLY JOURNAL FOR PRODUCERS, PIPELINES, DISTRIBUTORS AND END USERS
Natural Gas Growth: Which Industry Players Benefit the Most?
he fundamentals for continuedgas use growth T in the U.S. economy are strong. U.S. petroleum use was 32.2 quads (or quadrillion BTUs) in 1986, compared to 32.8 quads by 1991, a 2-percent increase (see Figures 1 and 2). How does this compare with natural gas use? For the same time period, gas use increased by 15 percent, a seven-
and -a-half-times faster pace.
Since 1986, when the US. gas market demand bottorned out at 16.2 trillion cubic feet a year, the pace of natural gas consumption has grown dramati- cally. The gas usage levels rose 15 percent over the next five years and exceeded 19 trillion cubic feet by 199 1 . For the first nine months of 1992, U S . gas use was 4 percent ahead of 1991 levels. The American Gas Association expects 1992 gas demand to exceed 20 trillion cubic feet. Behind this increase in gas use are three fundamentals:
1. Market-oriented gas pricing, due to easing of regulatory restrictions on gas sales, and open-access transport;
2. Recognition that both U.S. gas resources and Canada's exportable surplus are plentiful; and
3. Environmental- rgaret M. Carson is direcfor protection initia- :ompetitiveana/ysis forEnron tives and price- rp., Houston.
Copyright 0 1993 by Executive Enterprises
Margaret M. Carson competitiveness of gas-versus-oil fuel use in industrial, electric utility, and commercial ser- vices markets.
As an example of plentiful resources, the recent
l o t h e r F e a t u r e s Restructuring Developments-Contracts
New Features in Long-Term Contracts from Order 636 John C. Herbert 6
The Reversal of Order 636 Richard G. Smead 11
EBBs: Producers Want FERC Involved a Lot Robert E. Willett 14 EBBs: Trust Us, Say the Pipelines Robert E. Willett 16
Regulatory Reform Critical under 636 Jonathan D. Schneider 18
Restructuring Developments-Pipelines
Restructuring Developrnents-EBBS
Restructuring Developrnents-FERC Practice
= C o I u m a s LDCs
Pipeline Competition Threatens GRI Funding Plan Frederick Moring 22
State Regulation ' Rate-Setting To Make Integrated Resource
Planning Work William H. Smith, Jr. 25
More Royalties To Be Applied to Take-or-Pay Settlements Michael J. Henke 29
EXECLTWE ENTERPHISES, Lhjc.
Litigation
Printed on recycled paper. @
Natura l G a s Growth: Which i n d u s t r y Players Benefit the Most? (Continued frgm page 1)
cubic feet, and Enron's recent estimate of Lower-Forty-Eight gas resources reaches 1,303 trillion cubic feet.
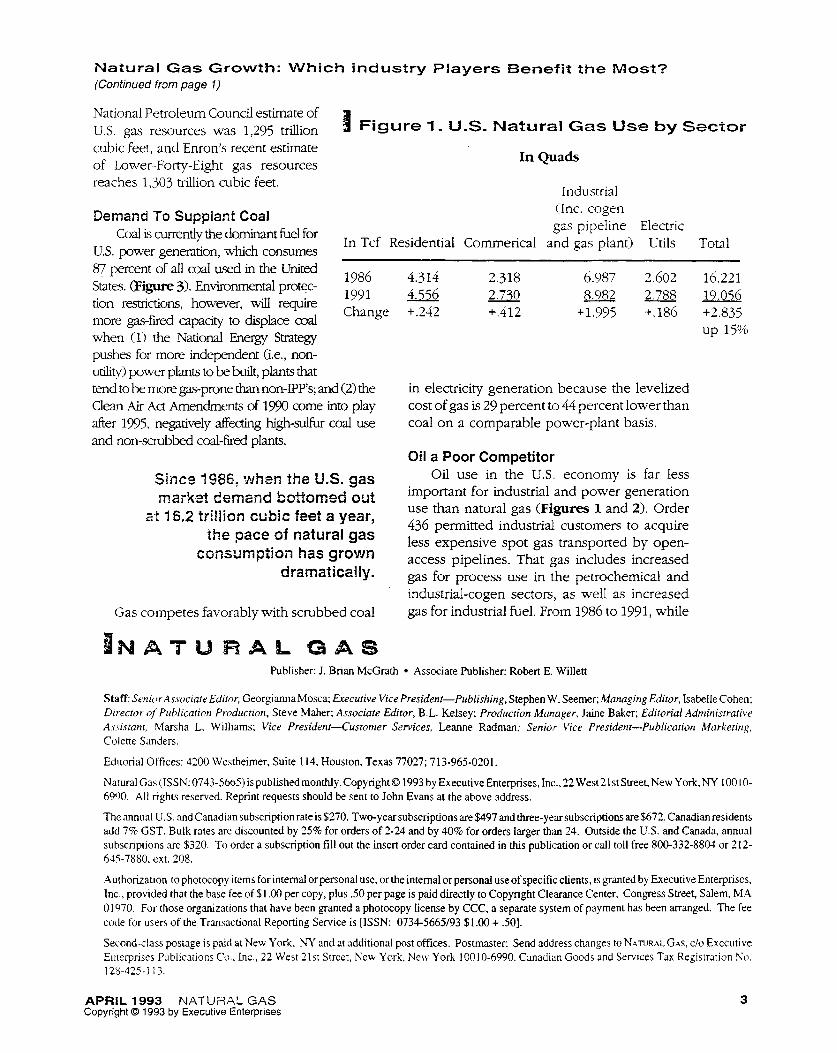
In Quads
Industrial (Inc. cogen gas pipeline Electric Demand To Supplant Coal
Coal is currently the dominant he1 for US. power genention, which consumes 87 percent of all c d used in the United
In Tcf Residential Comerical and gas plant) Utils Total
, I / U W
1991 Change
States. (Figure 3). Envimnmefital protec- tion restrictions, however, will require more gas-fired capacity to displace coal when (1) the National Energy Strategy pushes for more independent (i.e., non- utjl~tyl power plants to be built, plants that tend to be more gas-prone than non-IPP's; and (2) the Clean Air Act Amendments of 1990 come into play after 1775, negatively affecting high-& coal use and non-scrubbed coal-fired plants.
S i n e 1986, when t he 14.5. gas market demand bs'riomed out
at 15.2 trillion cubic feet a year, the pace of natural gas
c o i3 s u m pt i 0 rr has g r ovm dramatically.
Gas competes favorably with scrubbed coal
4.314 2.318 6.987 2.602 16.221 27.30 8.982 2788 19.056
+.242 +.412 +1.995 +.is6 +2.835 up 15%
in electricity generation because the levelized cost of gas is 27 percent to 44 percent lower than coal on a comparable power-plant basis.
Oil a Poor Competitor Oil use in the U.S. economy is far less
important for industrial and power generation use than natural gas (Figures 1 and 2). Order 436 permitted industrial customers to acquire less expensive spot gas transported by open- access pipelines. That gas includes increased gas for process use in the petrochemical and industrial-cogen sectors, as well as increased gas for industrial fuel. From 1986 to 1991, while
Publisher: J. Brian McGrath Associate Publisher: Robert E. Willen
Staff: Senicir AssociateEdiror, GeorgiannaMosca; Erecutive Vice President-Publishing, Stephen W. Seemer; Managing Editor, Isabelle Cohen; Director of Publication Producrion, Steve Maher; Associate Editor, B.L. Kelsey; Production Munager, Jaine Baker; Editoriul Administrative A.oistant, Marsha L. Williams; Vice President-Customer Services, Leanne Radman; Senior Vice President-Publication Marketing. Colette Sanders.
Editorial Offices: 4200 Westheimer, Suite 114, Houston, Texas 77027; 713-965-0201.
NaturalGas (ISSN:0743-5665)ispublishedmonthly.CopyrightO 1993 by ExecutiveEnterprises, Inc.,22West21stStreet, New York,NY 10010- 6990. All rights reserved. Reprint requests should be sent to John Evans at the above address.
The 'annual U.S. and Canadian subscription rate is $270. Two-year subscriptions are $497 and three-year subscriptions are $672. Canadian residents add 7% GST. Bulk rates are discounted by 25% for orders of 2-24 and by 40% for orders larger than 24. Outside the U.S. and Canada, annual subscriptions are $320. To order a subscription fill out the insert order card contained in this publication or call toll free 800-332-8804 or 212-
Authorization to photocopy items for internal or personal USC, or the internal or personal use ofspecific clients, is granted by Executive Enterpriscs, Inc., provided that the base fee of $ I .OO per copy, plus S O per page is paid directly to Copyright Clearance Center. Congress Street, Salem, MA 0 1970. For those organizations that have been granted a photocopy license by CCC, a separate system of payment has been manged. The fee code for users of the Transactional Reporting Service is [ISSN: 0734-5665/93 $1.00 + 501.
Second-class postage is paid at New York, NY and at additional post offices. Postmaster. Send address changes to hT4TURAL GAS, c/o Executive Enreprises Publications Co., Lnc., 22 West 21st Street, New York, New York 10010-6990. Canadian Goods and Services Tax Regisuadon No. 128-325- I 1.3.
645-7880. ext. 208.
APRIL 1993 NATUZAL GAS Copyright 8 1993 by Executive Enterprises
3
electric-utility gas use rose, oil use declined at a fast pace (i.e., a 274-billion-cubic-foot equiva- lent decline for oil use versus a 186-billion- cubic-foot increase for gas).
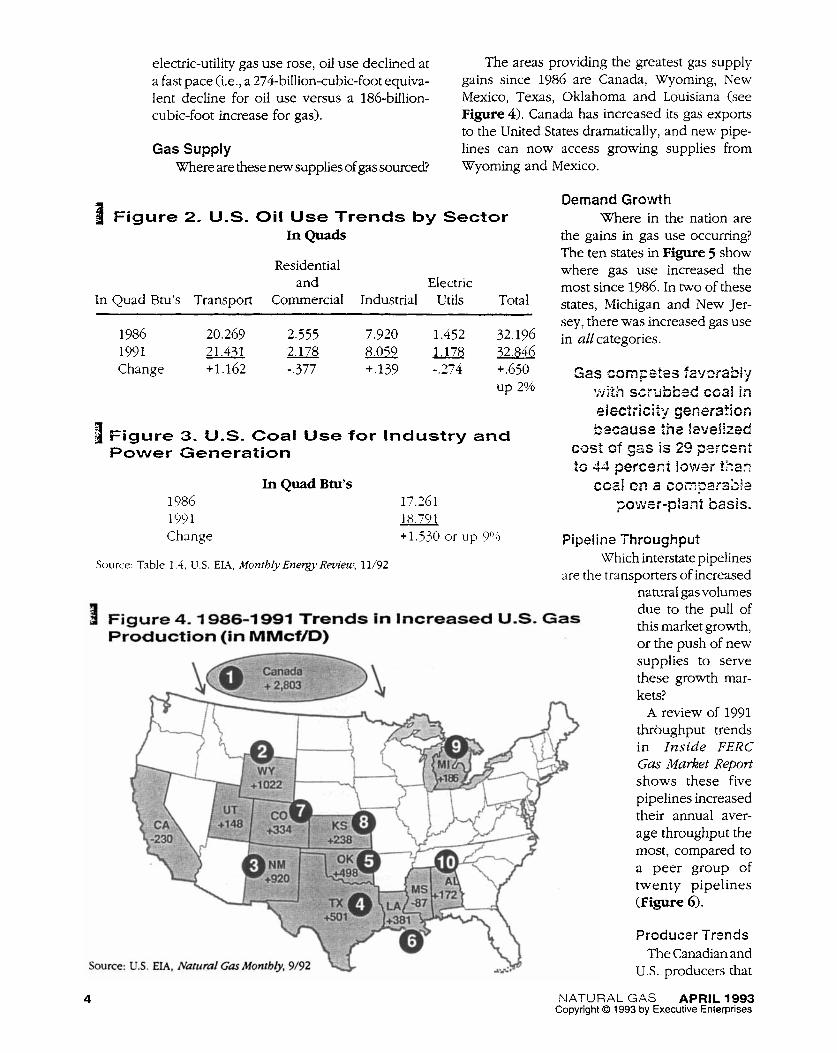
Gas Supply
The areas providing the greatest gas supply gains since 1986 are Canada, Wyoming, New Mexico, Texas, Oklahoma and Louisiana (see Figure 4). Canada has increased its gas exports to the United States dramatically, and new pipe- lines can now access growing supplies from Wyoming and Mexico. Where are these new supplies of gas sourced?
1 Figure 2. US. Oil Use Trends by S e c t o r hQuads
Residential
In Quad Btu’s Transport Commercial Industrial Utils Total and Electric
1986 20.269 2.555 7.920 1.452 32.196 1991 21 A31 2178 m - 1.178 52.846 Change +1.162 -.377 +.139 -.274 +.6jO
up 2%
Figure 3. U.S. Coal Use f o r Industry and Power &eneration
In Quad Btu’s 1986 17.261 1991 18 791 Change +1.530 or up 9 O ’ O
Source: Table 1.4, U.S. EM, Monthly Energy Review, 11/92
Demand Growth Where in the nation are
the gains in gas use occurring? The ten states in Figure 5 show where gas use increased the most since 1986. In IWO of these states, Michigan and New Jer- sey, there was increased gas use in all categories.
Pipeline Throughput Which interstate pipelines
are rhe transporters of increased natural gas volumes due to the pull of this market growth, or the push of new
4 Figure 4.1986-4 9 9 1 Trends in Increased U.S. Gas Production (in MMcWD)
supplies to serve these growth mar- kets?
A review of 1991 throughput trends in Inside FERC Gas Market Report shows these five pipelines increased their annual aver- age throughput the most, compared to a peer group of twenty pipelines (Figure 6).
Source: U S . EM, Natural Gas Monthly, 9/92
4
Producer Trends The Canadian and
U.S. producers that
NATURAL GAS APRIL 1993 Copyright Q 1993 by Executive Enterprises
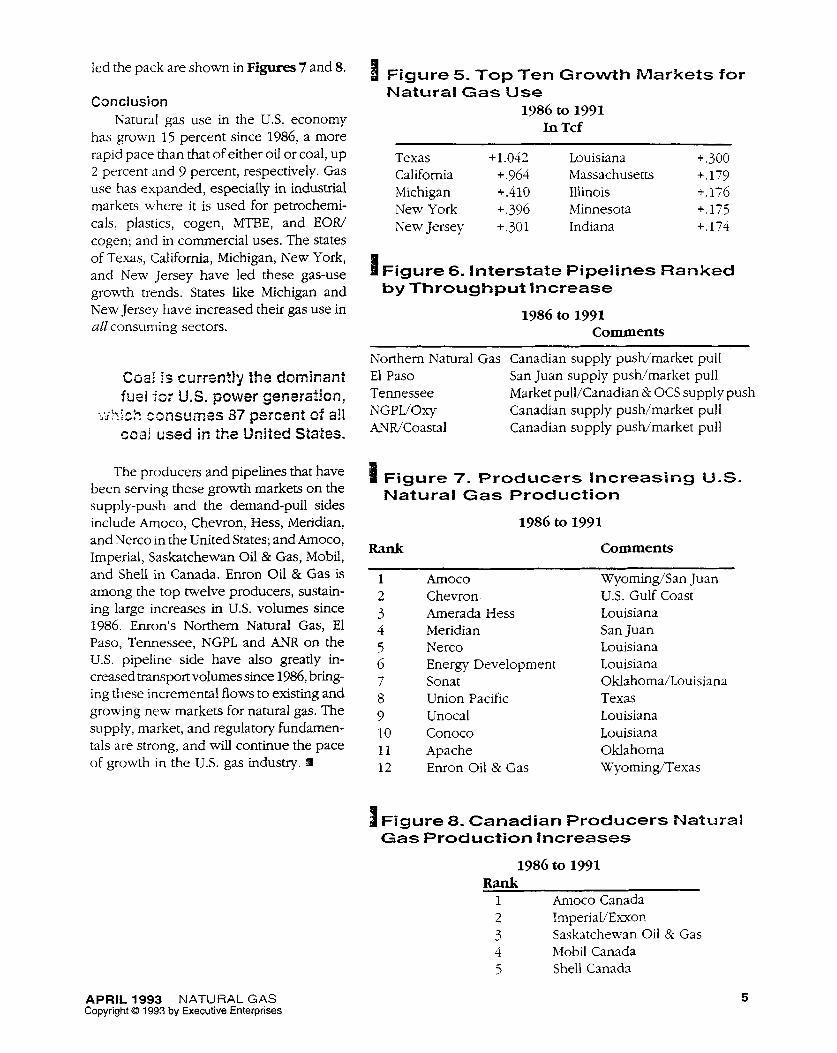
I Figure 5. ~ o p Ten ~ r o w t h hlarkets for led the pack are shown in Figures 7 and 8.
Condusion Natural gas use in the U.S. economy
has grown 15 percent since 1986, a more rapid pace than that of either oil or coal, up 2 percent and 9 percent, respectively. Gas use has expanded, especially in industrial markets where it is used for petrochemi- cals, plastics, cogen, MTBE, and EOW cogen; and in commercial uses. The states of Texas, California, Michigan, New York, and New Jersey have led these gas-use growth trends. States like Michigan and New Jersey have increased their gas use in all consuming sectors.
Natural G a s - U s e 1986 to 1991
In Tcf
Texas +LO42 Louisiana +.300 California +.964 Massachusetts +.179 Michigan +.410 Illinois i.176
New Jersey +.301 Indiana +.174 New York +.396 Minnesota +.175
Figure 6- I n t e r s t a t e Pipelines Ranked by Throughput I n c r e a s e
1986 to 1991 Comments
Northern Natural Gas Canadian supply pusl-dmarket pull El Paso San Juan supply pusldmarket pull Tennessee Market pull/Canadian & OCS supply push
Canadian supply push/market pull N G P L ' O ~ AN WCoastal Canadian supply puswmarket pull
C ~ a i is currsntly the dominant h e ! j~: U.S. power generation,
.;i>::ck cmsu~p.es 37 percent cf ail m a ! usad in the United States.
-rhe producers and pipelines that have Figure 7. P r o d u c e r s Increasing U-S. been serving these growth markets on the supply-push and the demand-pull sides include Amoco, Chevron, Hess, Meridian,
Natural Gas Production
1386 to 1991 and Nerco in the United States; a n d h o c o , Imperial, Saskatchewan Oil & Gas, Mobil, and Shell in Canada. Enron Oil & Gas is among the top twelve producers, sustain- ing large increases in U.S. volumes since 1986. Enron's Northern Natural Gas, El Paso, Tennessee, NGPL and ANR on the U.S. pipeline side have also greatly in- creased transport volumes since 1986, bring- ing these incremental flows to existing and growing new markets for natural gas. The supply, market, and regulatory fundamen- tals are strong, and will continue the pace of growth in the U.S. gas industry. 41
Rank Comments
1 2 3 4 5 6 7 8 9 10 11 12
Amoco Chevron Amerada Hess Meridian Nerco Energy Development Sonat Union Pacific Unocal Conoco Apache Enron Oil & Gas
Wyoming/San Juan U.S. Gulf Coast Louisiana San Juan Louisiana Louisiana Oklahoma/Louisiana Texas Louisiana Louisiana Oklahoma Wyoming/Texas
1 Figure 8. Canadian P r o d u c e r s Natural
1986 to 1991
Gas P r o d u c t i o n Increases
Rank 1 h o c o Canada 2 TmperiaVExxon 3 Saskatchewan Oil & Gas 4 Mobil Canada 5 Shell Canada
APRIL 1993 NATURAL GAS Copyright 0 1993 by Executive Enterprises
5