natural gas distribution sector report 2017 - gazbir.org.tr · while 210 districts were provided...
TRANSCRIPT


Investments
1
As of the end of 2017, within the natural gas distribution sector, 72 natural gas distribution companies made networkinvestments of 21.5 billion TL in total. Thanks to the investments, Turkey’s natural gas distribution network has extended to130.585 km and the length of the network has increased by 12% compared to 2016.
2017 TOTAL
STEEL PIPELINE 1.040 KM 11.800 KM
POLYETHYLENE (PE) PIPELINE
6.500 KM 80.130 KM
SERVICE PIPELINE 4.238 KM 38.655 KM
TOTAL 11.778 KM 130.585 KM 10
50
With the 2017 network investments,there was a growth of 10%in the distribution network.
In 2017, the distribution companies made network investments at the amount of1.75 billion Turkish Liras. Thanks to these investments, a total of 11.778-km networkwas built in 2017. The number of service pipelines rose to 3.307.520 with an increaseof 245.571 in the previous year.
%

Investments
2
The length of network in total increased by 42.2% compared to 2013 due to the investments of38.846 km in total made in the last 4 years. 30% of the network investments in question weremade in 2017. Between 2014-2017 while the minimum network investment was made in 2014,the maximum network investment was made in 2017.
2013 2014 2015 2016 2017
140
120
100
80
60
16
14
12
10
8
In the last 4-year period when the network investments increased, there was an increase, too,in the number of subscribers and of districts where natural gas supplies are provided. In the last4 years, the number of subscribers increased by 44% and the number of districts where naturalgas is provided increased by 48%.
Total Network Length and Growth Rate
91.739 KM
2013 Network Length
In 2014, a network investment of 7.324 KM
was made.
In 2015, the network grew by 9.8%.
In 2016, a network investment of 9.145 KM
was made.
Due to the investment of 11.778 km in 2017, the
network grew by 10.1%.
99.063 KM
109.662 KM
118.807 KM
130.585 KM
2014
2015
2016
2017
Network Length-Thousand KM
Million-Number of Subscribers
Total Network Length
Number of Subscribers
In the last 4-year period, with the investments, the network length –
supply – number of subscribers
increased in parallel. (Between %40- %50)
Due to the investments in 2017, the Subscribers – Active
Users and the Network increased by 9-10%.
Network: %10,1Number of Subscribers: %9
Active Subscribers: %9,7
Total Network Length

Expansions
3
While 210 districts were provided with natural gas in the last 10 years, in 2017, 101 districts and towns were provided with naturalgas. As of the end of 2017, 78 provinces and 426 districts and towns use natural gas in Turkey.
100
80
60
40
20
0 2007 2008 2009 2010 2011 2012 2013 2014 2015 2016 2017
38 36 24 22 19 10 22 8 8 28 101
Number of Districts Provided with Supply Between 2007-2017While the annual averagenumber of districts in Turkeywhich were provided withnatural gas was 21 in the last10 year period, the number ofdistricts and towns increased4,5 times in 2017.
The average annual number of districts provided with natural gas supply in Turkey (21)
In 2017, approximately 500 million TL was invested in the districts and towns within the scope of the expansions. Due to thisinvestment, natural gas distribution network reached to new 2.3 million citizens. In the agenda of 2018 expansion investments,there are 98 districts and towns. In 2018, the investments are projected to be in the amount of approximately 700 million TL, andthe number of citizens that the distribution network will reach is estimated to increase by 2,5 million, reaching to a total of 64.5million persons.
When the expansion investments are completed, 81 provinces and 554 districts and towns in Turkey will use natural gas.
98 30
2018 2019 Target
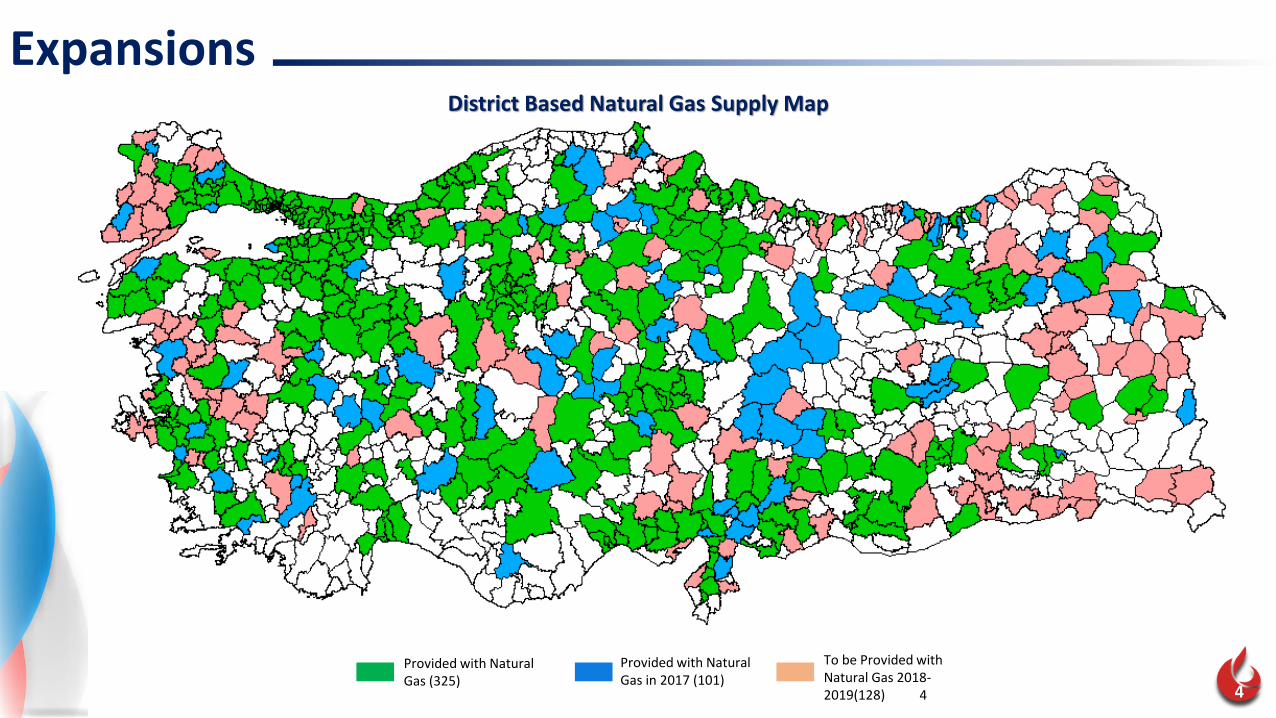
Expansions
4
District Based Natural Gas Supply Map
Provided with NaturalGas (325)
Provided with Natural Gas in 2017 (101)
To be Provided with Natural Gas 2018-2019(128) 4

Number of Subscribers
5
As of the end of 2017, the number of natural gas total subscribers in total reached to 14.162.930. The number of subscribersincreased to 13.610.325 and of eligible consumer rose to 552.605. In 2017, 1.162.691 new subscribers were included to Turkey’snatural gas distribution system.
2013 2014 2015 2016 2017
16.000.000
14.000.000
12.000.000
10.000.000
8.000.000
6.000.000
4.000.000
2.000.000
0
Number of Subscribers Between 2013-2017
9.856.324 11.198.821 12.119.612 14.162.93013.000.672
The difference in the number of
Subscribers Between 2013-2017:4.306.606
Growth:44 %
The number of eligible consumers
increased by 33% in the last 5 years.
Subscriber
Eligible Consumer
While there was about 677.181 inclusion of subscriber between 2007-2017, in the last 4-year period, theinclusion was above the Turkey average. In 2017, 72% more than the Turkey average of subscribers wasincluded.

Number of Subscribers
6
The maximum number of subscribers in 2017 was the month of November during which182.252 (16% of inclusion in 2017) subscribers was included in the natural gasdistribution system. 33% of the subscribers was included in the first half of 2017 and theremaining 67% was included in the second half of the year. Istanbul, which is the provincewith the maximum number of new subscribers, is followed by Izmir and Bursa.yılında Türkiye’nin 76 ilinde doğal gaz dağıtım sistemine ortalama 14.821 yeni abone dahilolmuştur. 2016 yılı ile kıyaslandığında il bazlı ortalama abone alımı %31 artış göstermiştir.2017 yılında 57 ilde ortalamanın altında abone alımı gerçekleşirken, 19 ilde Türkiyeortalamasının üzerinde abone alımı gerçekleşmiştir.
9%
3%
5%
5%
6%
5%
6%
8%10%
15%
16%
12%
2017 Monthly Percentages of
Subscriber Inclusion2016
2017
10.227
14.821 Change
+%45
First 10 Provinces Maximum Subscriber Inclusion in 2017
İstanbul212.250
İzmir79.485
Bursa53.964
Ankara52.805
Gaziantep39.361
Kocaeli34.409
Konya34.281
Samsun25.443
Kayseri25.323
Tekirdağ23.364
Average of Province Based Subscriber
Inclusion
January
Feb.
March
April
May
June
July
AugustSeptember
October
November
December

Number of Subscribers
7
Heat Map of Province Based Subscriber Inclusion in 2017
212.250 16.000 10.000 6.000 919

Penetration
8
In 2017, the population of Turkey increased by 995.654 people (1.25%) to 80.810.525 compared to the previous year. As of the end of2017, 61.901.502 citizens accessed the natural gas distribution network through investments of distribution companies. The numberof citizens who accessed the distribution network increased by 2.394.246 (4%) compared to 2016. In 2017, the number of citizenswho had access to the distribution network but could not use the natural gas distribution service fell by 13.8% to 1.294.220. As of theend of 2017, the population using natural gas increased by 9.7% and reached to 49.607.282.
90.000.000
80.000.000
70.000.000
60.000.000
50.000.000
40.000.000
30.000.000
20.000.000
10.000.000
0 Population of
Turkey
Population reached by Natural Gas Distribution
Network
Population Using Natural Gas*
Population Using Natural Gas Actively
61
.90
1.5
02
59
.50
7.2
56
49
.60
7.2
82
45
.24
0.8
32
47
.96
2.6
50
43
.10
0.8
00
2016 2017
79
.81
4.8
71
80
.81
0.5
25
995.654 (%1,2)
2.394.246 (%4)
4.366.450 (%10) 4.861.850 (%11)
Population Using Natural Gas
increased by 14.6 Million (42%) in the
last 5 years.
Number of Persons not Using Natural
Gas Actively decreased by 14.6
million (37%) in 2017.
*Population Signing the Natural Gas Supply
Agreement

Consumption
9
In 2017, 53.3 billion m3 of natural gas was consumed inTurkey. Compared to 2016, the natural gas consumptionincreased by 16%. The reasons of this increase are;
%23%15 %72016
11.2312017
13.3012016
16.7302017
20.485
201614.095
201715.078
RESIDENTAL POWER PLANTS INDUSTRY
Transformation-Conversion
Residental
Service
Industry
Other
%39
%25
%28
%2
%6
2017 SectorialConsumptionPercentages
Residental PowerPlant
Industry Other Service
94% of the NG consumed in the Transformation-
Conversion Sector was consumed in Power
Plants..Sectorial Consumption Between 2011-2017
• The increase in the number of subscribers
• Colder temperature in the first 4 monthscompared to 2016
• The advantages of natural gas compared to otherenergy resources

Consumption
10
In 2017, the natural gas consumption in residences increased by 14.5% to 13.3 billion m3 compared to 2016. Thereasons for the increase of consumption in residences are the temperature below-normal season in the first 4months of the year and the increase in the number of residential subscribers. The increase mostly occurred inthe first 4 months of 2017.
14,1 °C 13,6 °C
Difference-0,5 °C
20172016
AverageTemperature
of Turkey
3.000
2.500
2.000
1.500
1.000
500
0
30
25
20
15
10
5
0 Jan Feb Mar Apr May June July Aug Sep Oct Nov Dec
Million-m3 Temperature-° C2017-2016 Residental Consumption and Temperature Chart
The changes in the number of subscribers take effect in thenext year. New subscribers do not use natural gas in fullcapacity. Therefore, while 850.000 subscribers involved inthe system in 2016 affected 2017 average, it is estimatedthat 1.1 million residential subscribers included in thedistribution system will have an effect on 2018.
The first 4 months of 2017 were 2°C colder
than those of 2016 and there was an
increase of 2 BCM in demand in residences
December 2017 was 5°C hotter than December 2016; so, there was a
decrease of 400 MCM in demand in residences.
2017 2016 Ave. Temp 2017 Ave. Temp 2016

Consumption
11
The average consumption per residence in Turkey was 1032 m3. Compared to 2016, the consumption perresidence increased by 10.5% (934 m3 in 2016). While the maximum average consumption per residence wasin Ardahan (1636 m3), the province with minimum average consumption per residence (820 m3) was Antalya.
• Ankara 1099 m3
• Kocaeli 1016 m3
• İzmir 1004 m3
• İstanbul 948 m3
• Bursa 901 m3
In 2017, theconsumption perresidence in 64 of 77provinces where naturalgas is distributed washigher than the Turkey’saverage. Compared to2016, in 2017, theaverage consumptionper residence increasedin 66 provinces butdecreased in 8provinces.
1083m3
869 m3
887 m3
856 m3
890 m3
Province 2017 2016
Consumption per residence in 5 provinces with maximum subscribers in 2017;
%1,55
%17
%14
%10,7
%1,14
1050
1000
950
900
850
800
0 2013 2014 2015 2016 2017
Average Consumption per Residence Between 2013-2017
10
06
m3
86
5 m
3
94
5 m
3
93
4 m
3
10
32
m3
5 Provinces with maximum avg. consumption per residence
• Ardahan 1636 m3
• Karabük 1517 m3
• Kars 1488 m3
• Van 1457 m3
• Bayburt 1348 m3
1544 m3
1297 m3
1395 m3
1388m3
1273m3
Province 2017 2016
%6
%17
%7
%5
%5,9
Change
5 Provinces with minimum avg. Consumption per residence
2017 2016
• Antalya 820 m3
• Bursa 901 m3
• Kırşehir 926 m3
• Mersin 942 m3
• İstanbul 948 m3
701 m3
890 m3
834 m3
750 m3
857 m3
%17,0
%1,2
%11,0
%25,4
%10,7
ChangeProvince
Change

Consumption
12
Province Based Consumption per Residence Map

Consumption
13
In 2017, the amount of natural gas consumed in power plants increased by 22.5% to 20.4 billion m3, compared to 2016. The reasons ofthis increase include;
• The price advantage of natural gas
• 2017 was a dry year
• The increase in demand due to thecold winter
Amount of Total Rainfall Between 2015-2017 - billion m3
71.232 64.184 47.170
2015 2016 2017
Million-m3
30.000
25.000
20.000
15.000
10.000
5.000
0
60
50
40
30
20
10
0
Share(%)
21
.05
3
23
.44
2
19
.01
0
16
.73
0
20
.48
4
2013 2014 2015 2016
2013-2017 Power Plants Consumption and Natural Gas Total Consumption Share
2017
Share of NG in PowerGeneration
Share of PowerPlants in NG Consumption

Consumption
14
In 2017, 15.1 billion m3 natural gas was consumed in the industrial sector. The industrial consumption increased 7% in 2017 comparedto 2016. In the Marmara region whose nearly all provinces are among the 25 most industrial cities of Turkey, 7 billion m3 natural gaswas consumed in the industrial facilities. Marmara region has a share of 46% in the industrial consumption in 2017. In the Aegeanregion which is also industrially developed, 3.2 billion m3 natural gas was consumed in 2017. The natural gas consumed in theindustrial sector of the Aegean region has a share of 21% in the total consumption.
Region Consumption Share in industrialconsumption
Central Anatolia 1,89 billion m3 %13
Mediterranean 1,66 billion m3 %11
Black Sea 882 billion m3 %6
South EasternAnatolia
312 billion m3 %2
Eastern Anatolia 130 billion m3 %1
In the province based industrial consumption ratings, Kocaeli ranks first with a consumption of 1.65 billion m3. It is followed byIstanbul with 1.36 billion m3 consumption and Izmir with 1.33 billion consumptions in the industry sector.
18.000
15.000
12.000
9.000
6.000
3.000
0
2013 2014 2015 2016 2017
2013-2017 Industrial Sector Consumption
11.52812.376
13.965 13.547
15.078

Consumption
15
*Values are specified in Million m3
Sector 2016 2017 Change (%)
1. Transformation/Conversion Sector 16.730,30 20.484,20 22%
1.1. Power Plants 12.570,41 19.309,90 54%
1.2. Autoproducer Power Plants 3.490,31 297,39 -91%
1.3. Heat and Electricity (CHP) Plants 33,20 58,21 75%
1.4. Autoproducer Heat and Electricity Plants 361,36 744,76 106%
1.5. Heat Plants 25,62 0,00 -100%
1.6. Autoproducer Heat Plants 249,34 10,78 -96%
1.7. Other Conversion Sector Consumers 0,06 63,18 98619%
2. Energy Sector 289,54 503,60 74%
2.1. Oil Refineries 179,40 180,70 1%
2.2. Blast Furnaces 37,34 306,12 720%
2.3. Electricity, CHP and Heat Plants consumed as fuel 5,28 10,53 99%
2.4. Other Energy Sector Consumers 67,52 6,25 -91%
3. Transportation Sector 82,30 141,50 72%
3.1. Vehicle Fuel 81,12 83,43 3%
3.2. Pipeline Transportation 0,06 56,70 92851%
3.3. Other Transportation Sector Consumers 1,08 1,34 24%
4. Industrial Sector 14.095,12 15.078,16 7%
4.1. Wood Products Processing 199,99 195,21 -2%
4.10. Chemistry (including Petrochemistry) 2.435,06 2.593,89 7%
4.11. Mining and quarrying 109,79 140,38 28%
4.12. Machinery Industry 63,37 67,29 6%
4.13. Textile, Leather and Clothing Industry 787,00 802,37 2%
4.14. Tobacco and Tobacco Products 17,96 12,70 -29%
4.15. Transportation Vehicles Industry (Automotive, Aircraft Industry, etc.)
163,03 150,31 -8%
4.16. OSB's 3.259,82 3.792,53 16%
4.17. Other Industrial Sector Consumers 958,58 1.058,41 10%
4.2. Alcohol and Alcohol Products 19,93 19,87 0%
4.3. Non-metallic Minerals (Glass, ceramics, cement, etc.) 1.717,80 1.786,70 4%
4.4. Iron and Steel 1.286,43 1.518,93 18%
4.5. Production and Processing of Non-ferrous Metals (Chromium, Copper, etc.)
585,21 450,05 -23%
4.6. Food and Beverages 1.080,50 1.139,74 5%
4.7. Fertilizer 588,50 493,40 -16%
4.8. Construction (Construction products, road construction) 547,71 600,56 10%
4.9. Paper, Cellulose and Printing 274,44 255,82 -7%
Sector 2016 2017 Change (%)
5. Service Sector 3.096,55 3.874,30 25%
5.1. Business 1.411,90 1.835,06 30%
5.2. Government Offices 1.430,18 1.720,92 20%
5.3. Other Service Sector Consumers 254,47 318,28 25%
6.1. Housing 11.617,75 13.301,49 14%
6.2. Agriculture/ Forestry 17,87 20,46 14%
6.3. Livestock (balıkçılık, kümes ve ahır hayvancılığı, vs.) 50,21 58,62 17%
6.4. Other Non-Specified Sector Consumers 34,80 40,42 16%
7.1. Losses 4,09 4,04 -1%
Grand Total 45.993,82 53.359,21 16%

Prices
16
In 2017, the average annual expenditure of natural gas ofa residence was 1.220 Turkish Lira. Natural gas is 42%cheaper than the closest fuel source.
300
250
200
150
100
50
0
Jan. Feb. March April May June July August Sept. Oct. Nov.
271 20
2017 Average Monthly Natural Gas Expenditure of Residences -TL
Dec.
213 175 112 52 21 18 21 46 106 165
7000
6000
5000
4000
3000
2000
1000
0
LPG
-Bu
lkG
as
Fuel
-Oil
Nat
ura
l Gas
Imp
ort
Co
al
Lign
ite
+18
mm
1.7
37
TL
1.8
09
TL
2.1
72
TL
2.9
99
TL
4.2
33
TL
LPG
-Bo
ttle
dG
as
Elec
tric
ity-
Res
iden
tal
1.2
20
TL
5.6
58
TL
6.1
47
TL
Lign
ite
+20
mm
When the annual fuel costs are compared, it is observedthat natural gas has the minimum fuel cost of 1.220TL/year and LPG- Bottled Gas has the maximum fuel costof 6.147 TL/year.
In 2017, natural gas is 517 TL cheaper than
the closest fuel.
2017 Natural Gas and Other Fuel Sources Expenditure Comparison -TL
In November and December 2017, natural gas bills
decreased by 20- 25% due to the high
temperature in Turkey
* This study was carried out based on a residence of 100 m2 and productivity factors.

Natural Gas and Environment
17
In 2017, 13.610.325 subscribers consumed 13,3billion m3 natural gas in Turkey. According to thecalculations made by considering that theresidences which do not have natural gas prefercoal and other fuels, carbon emission of allresidences in 2017 is 66.3 million ton in Turkey.
100
80
60
40
20
0
51,5
29,8
36,5 96,7
Carbon Emission if All Residences Used Natural Gas
2017 Residences CarbonEmission
Carbon Emission if All Residences used Coal
2017 Carbon Emission ValuesMillion Ton
It is possible to decrease our carbon
emission (of residences) by 23%
(14.8 million ton) by extending the use of
natural gas in residences in Turkey.
66,3 Million Ton
The use of natural gas in residences
instead of coal provided a carbon emission saving of 30.4 million ton in
residences, in 2017.
30.4 Million Ton Carbon Emission Saving Equivalents
In 2017, the average carbon emission of a residence usingnatural gas was 2.2 ton. If coal and other fuels had beenpreferred, the average carbon emission per residence wouldhave been about 4.3 ton. Due to the natural gas, the carbonemission was 50% less per residence.
2,1 Ton Carbon
Emission Saving
Equivalences
Use of 16 bottles of 45 kg propane gas
Emission value of a four-door mid-range vehicle driving 10.000 km/year
Emission saving of 71 LED lamps (for 1 year)
Carbon emission value that 100 trees can clean in a year

2018 at a Glance
18
• It is estimated that, in 2018, the distribution companies will invest approximately1.7 billion TL. Nearly 700 Million TL of this investment will be used for expansion.
• As of 2018, the natural gas service will have reached 524 districts and towns of81 provinces of Turkey once Hakkari, Şırnak and Artvin have been provided withthe natural gas supply
• Within the scope of the expansion, natural gas will be provided to new 98 districtsand towns.
• In 2018, the distribution network will also reach new 2.5 million citizens and atotal of 64.5 million citizens will benefit from natural gas distribution service.
• According to the calculations, the total demand of natural gas of Turkey in 2018 is51.9 billion m3.
• It is estimated that the total number of subscribers will be more than 15 millionand the consumptions of the residences will be about 13 billion m3.

Gazbir Gazbir_Ege Plaza İş Merkezi Konya Yolu (Mevlana Bulvarı) No:182/B Kat:22 Ofis:97 06520 Balgat, Çankaya / ANKARA
For your questions, suggestions and [email protected]
This report was written by GAZBİR by using the data of EMRA, TurkStat and Turkish State Meteorological Service. Cannot be use without reference.
www.linkedin.com/company/gazbir www.twitter.com/gazbir_