“natural gas and the impact on pulverized coal …€œnatural gas and the impact on pulverized...
TRANSCRIPT

“Natural Gas and the Impact on Pulverized Coal Injection in
Blast Furnace Operations”
Dr. Joseph J. Poveromo
Raw Materials & Ironmaking Global Consulting
Bethlehem, PA
610-974-9553

Topics • Latest results on use of natural gas in NAFTA blast
furnace operations,
• Progress with “co-injection” of natural gas and coal injection in NAFTA BF operations,
• Limits of coke replacement with injectants in BF operation,
• Global prospects for increased use of natural gas

Decreasing Natural gas Prices Promote Increased Use of Blast Furnace Natural
Gas Injection • Mainly a USA
phenomena:


Blast Furnace Natural Gas Injection • Lower natural gas prices lead to increased
injection of natural gas in blast furnaces,
• In 2013, all but 1 of 29 of NAFTA blast furnaces are injecting gas while 45 % are co injecting with gas and PCI, while one coal injection system (to serve 2 BF’s) remains idle
• Natural gas is cheaper than coal at many but not all BF sites; continued use of coal maximizes total coke replacement

NAFTA Blast Furnace Reductant Rates
• Weighted (by Production Rate) Averages of Reductants by AISI BF’s
• Hot Metal # of Reductant Usage, kg/tHM • Production, Operating Coke Coal Oil Gas Tar COG • M tonnes BF’s Lump Nut Total
• 1990 55.55 60 454 1 455 1 12 23 3 0 • 1995 61.00 51 402 8 410 34 13 38 1 1 • 2001 51.92 45 395 24 419 59 9 17 3 2 • 2004 52.75 38 366 26 392 58 10 35 4 2 • 2007 47.85 35 377 28 405 65 9 27 2 2 • 2008 44.80 35 379 29 408 62 9 32 0 2 • 2010 41.80 33 376 32 409 73 2 39 0 1 • 2011 43.70 32 364 36 400 69 1 50 0 1 • 2012 44.10 32 364 34 398 52 0 65 0 0 • 2013 33.10 29 362 31 394 57 0 62 0 1 • * 9 months

Limits of BF Natural Gas Injection:
• Replacement ratios of BF injectants: • (Kg of coke replaced per kg of injectant) • Natural gas 1.3 – 1.4 • Fuel oil 1.1 – 1.2 • Coal 0.9 - 1.0
• Natural gas suppresses raceway (combustion
zone) flame temperature more than oil or coal

Limits of BF Natural Gas Injection
• Typical BF Raceway Flame Temperatures Range from 3400 F to 4000 F,
• Research by Gas Research Institute/Charles Rivers Associates showed that smaller BF’s could operate at 3100 – 3400 F range,
• Increased oxygen enrichment can restore flame temperature but upper limit of oxygen enrichment set by BF top temperature as well as practical limits: cost of O2, excess hot metal production,
• Typical NG injection limit: 100 to 125 kg/ton of hot metal
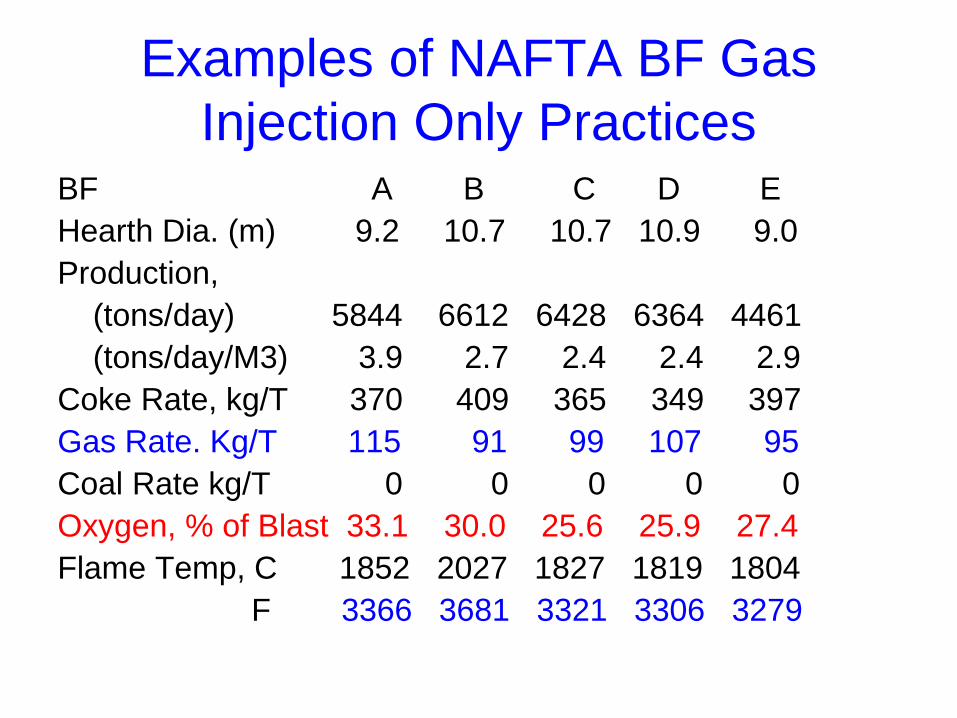
Examples of NAFTA BF Gas Injection Only Practices
BF A B C D E Hearth Dia. (m) 9.2 10.7 10.7 10.9 9.0 Production, (tons/day) 5844 6612 6428 6364 4461 (tons/day/M3) 3.9 2.7 2.4 2.4 2.9 Coke Rate, kg/T 370 409 365 349 397 Gas Rate. Kg/T 115 91 99 107 95 Coal Rate kg/T 0 0 0 0 0 Oxygen, % of Blast 33.1 30.0 25.6 25.9 27.4 Flame Temp, C 1852 2027 1827 1819 1804 F 3366 3681 3321 3306 3279

Examples of NAFTA BF Gas Coal Co -Injection Practices
BF F G H I J K Hearth Dia. (m) 10.2 8.5 13.7 9.2 9.7 11.7 Production, (tons/day) 4585 3446 8234 5764 5831 7332 (tons/day/M3) 2.2 2.2 2.0 3.2 2.5 2.3 Coke Rate, kg/T 428 376 336 357 422 345 Gas Rate. Kg/T 37 23 30 70 71 34 Coal Rate kg/T 71 111 151 83 5 144 Oxygen, % of Blast 25.7 24.3 26.3 30.9 25.7 26.6 Flame Temp, C 2096 2092 2133 2091 1932 2160 F 3805 3798 3871 3796 3279 3920

Global prospects for increased use of natural gas

Global shale gas reserves for 2012
(trillion cubic meters) • 36.1 China;
• 24.4 U.S; • 21.9 Argentina; • 19.3 Mexico; • 13.7 South Africa; • 11.6 Australia; • 11.0 Canada; • 8.2 Libya; • 6.5 Algeria • 6.4 Brazil; • 5.3 Poland.


Challenges to global shale gas production
• Major environment risks : • o Water consumption during the hydraulic fracturing process • Effects on bio diversity • Channeling away from agriculture uses • o Treatment and disposal of Waste Water • Proper secure storage on site • Infrastructure to recycle or treatment for discharge or reuse • o Groundwater Contamination from fracturing fluid • Accidentals spills • Leakages • Higher scale leading to higher risks
• Some wells at least in China could be more complex and
deeper. Economics for drilling these wells have not been clearly established

Challenges to global shale gas production
• Gas prices have fallen in US but in ROW it remain linked to oil indexed prices. It does not appear that it will follow the US path very soon,
• In the US, gas prices have decoupled from oil prices... .. . but what about other regions?
• In Europe, it is a mix of oil indexed gas prices ( from Statoil and Gazprom) and some hub prices from Qatar mirroring current spot prices. But the average gas prices remain very high. In the medium term, this is unlikely to change.

Challenges to global shale gas production
• In China gas prices remain stubbornly linked to oil indexed prices despite pressure from buyers. There is talk about reforming these to reflect the current spot prices but it could take a number of years before shale gas imports and local shale gas production to start before prices align to market levels in the US.
• • In Brazil, the situation is no different from Europe and China.
• Key Point – In USA landowners control mineral and gas ownership; elsewhere globally the State controls mineral and energy resources

Challenges to global shale gas production
• In the US at least, the ready gas pipeline and distribution infrastructure was available. Therefore it has been possible to increase gas supplies relatively easily.
• • In other regions like India, Brazil, Indonesia, Mexico the pipeline infrastructure is underdeveloped. Meeting the large growing production would require building new pipeline infrastructure which is inherently very capital intensive and potentially slow with burdens of permitting process


Thank You for Your Attention!
Special Acknowledgement to Hatch for use of material in slides
4, 13-18

Appendix - slides from 2012 presentation

Impact of Blast Furnace Process Improvements on Met Coke Demand
Global Trends in BF Operations That Reduce Met Coke Demand:
• Concentrate Production in Largest , Most Efficient Furnaces,
• Incremental Increases in Injection of Coal, Gas, Plastics, other reductants,
• Improvements in Sinter, Pellet Properties
- Declining iron ore grades will increase BF slag volumes and coke rates
Overall: expect 3-5 % decrease in specific coke
consumption over 5 year period
Gas Based Shaft Furnace Direct Reduction
• Now economically feasible in USA, • Nucor building 2.5 MTPY DRI plant in Louisiana to ship DRI to existing EAF plants; planning second plant;
• SeverstalNA has been planning DRI plant,
• Other EAF flat rolled mini mills studying gas based DRI projects

Gas Based Shaft Furnace Direct Reduction
• Major initial impact:
elimination of imported merchant pig iron (Brazil, Russia, Ukraine)
No further expansion of coal based DRI, hot metal or pig iron nugget projects in USA,
IDI, Mesabi Nugget plants will continue but further plants less likely

Alternate Steelmaking Production Route: EAF Steelmaking based on Ore Based
Metallics • Gas Based Shaft Furnace Direct Reduction -
Longer range impact: • Shift towards DRI/EAF steel production route:
o Continued expansion by current EAF flat rolled steel companies: e. g. expansion at Severstal Columbus helped Severstal divest BF/BOF plants
o Switch to DRI/EAF steel production by current BF/BOF producers: less likely due to capital constraints

Prospect for Large Scale Smelting Reduction to Replace Blast Furnace
Ironmaking,
• Objectives: eliminate coke, sinter, pellet facilities with hot metal process to feed existing BOF steel plants

HOT METAL =======================
coke coal-based --------------------------- Blast Smelting- RHF/ RHF Furnace Reduction SAF Pellets/lump fines pellets/ fines fines sinter lump Mini- Corex IDI ITmk3 Blast Furnace large scale Fastmelt Finex Redsmelt Low CO2 HIsmelt Blast Furnace CCF/HIsmelt Primus (multiple Cupola AISI hearth) - scrap DIOS - waste oxides small scale - EAF feed, waste oxides OxyCup Romelt, AusIron, Tecnored

Prospect for Large Scale Smelting Reduction to Replace Blast Furnace
Ironmaking,
• Corex, Finex processes only ones to reach commercial status:
global production < 10 MTPY Corex, Finex processes have very high
capital costs; high operating costs; adopted in niche situations only

Conclusions • NAFTA met coke demand decreasing due to: - increased BF natural gas injection - expansion of EAF flat rolled minimills, now being
fed by gas based DRI plants Globally, BF/BOF steelmaking will remain dominant but
specific coke consumption will decrease with increased scale, injection rates and burden property improvements.
Smelting reduction processes will have limited impact
globally in next 5 years