native hawaiian homeownership · native hawaiian homeownership ... ancient land rights held by the...
TRANSCRIPT

Native Hawaiian Homeownership Hoʻokahua Waiwai (Economic Self-Sufficiency) Fact Sheet, Vol.2016, No. 1
Research Division Special Projects Unit
June 2016
© Kamakanaokealoha Aquino

Page 2: Native Hawaiian Homeownership, 2016
1
The Significance of a Home
The location of a home was an important consideration for
Native Hawaiians in the 18th century. A kahuna, or expert,
determined whether an area was hospitable or suitable for
living. Hawaiian scholar David Malo (1851) highlighted the
significance of a house as a means of securing well-being for
the ʻohana (family). It was an indication of prosperity.
A home was also viewed as a living member of the family
and community. A kahuna would conduct a dedication
ceremony at the completion of a building by performing a
moku (navel-cutting ceremony), similar to one given to a
child at birth. A prayer and cutting of the thatch by the
doorway represented severing the piko (navel-chord) of the
house, thereby making it habitable (Handy, Emory, Bryan,
Buck and Wise, 1965). These dedication ceremonies are
still practiced today.
The Hawaiian Constitution of 1840 “served to codify the
ancient land rights held by the möʻï, aliʻi, and
makaʻāinana” (Beamer 2014, p. 129). The 1848 Māhele and
the 1850 Kuleana Act allowed fee simple titles to land,
which affected land tenure and the relationship between the
ʻā ina (land) and Native Hawaiians. Since the mid-1800’s,
the well-being of Native Hawaiians has declined within their
own homeland due to the drastic impact in the political and
economic landscape brought about by the introduction of
foreign concepts. The overthrow of the Hawaiian
government in 1893 further displaced Hawaiians from their
land and allowed valuable land to be owned by foreign
investors.
OFFICE OF HAWAIIAN AFFAIRS RESEARCH DIVISION
Increasing the number of Native Hawaiian Homeowners
One of the priorities under the Office of Hawaiian Affairs
(OHA) 2010-2018 strategic plan is to increase Hoʻokahua
Waiwai (Economic Self-sufficiency) for Native Hawaiians.
One indicator of economic self-sufficiency is
homeownership and OHA’s desired results under the
strategic plan aims to increase the percentage of Native
Hawaiian owner-occupied houses from 56.62% in 2008 to
58% in 2018.
This factsheet provides the context of Native Hawaiian
homeownership in Hawaiʻi. It begins by highlighting trends
over time in owner-occupied housing units, household
income and housing costs. This section is followed by an
analysis of the differences between counties including
financial conditions of households and the physical
characteristics of housing units. Next, a larger housing
context is provided through an analysis of the impact of the
real estate market in Hawaiʻi and the impact of the
Hawaiian Homes Commission Act of 1920 (HHCA). This
report concludes by summarizing the status of Native
Hawaiian homeownership.
OHA Research Disclaimer. The data presented have been vetted for accuracy; however, there is no warranty that it is error-free. The data itself
does not represent or confer any legal rights of any kind. Please use suggested citation and report discrepancies to the OHA Research Division.
CONTENTS PAGE
Introduction 2
Native Hawaiian Owner-occupied Units 3
Differences by County 6
Real Estate in Hawaiʻi 9
Hawaiian Homes Commission Act of 1920 10
The Case for Native Hawaiians 11
Definitions & References 12
Hale Māmalu, Kalihi, Oʻahu, Hawaiʻi. © Wahineʻaipöhaku Tong, 2015

Native Hawaiian Homeownership, 2016, Page 3
Native Hawaiian Owner-occupied Housing Units
In 2009, the Native Hawaiian homeownership rate drastically decreased by 5.4 percentage points, while the state decreased by only 2.4 percentage points.
While the percent of Native Hawaiian owner-occupied housing units decreased in 2014 from 56.7% to 52.9%, the
percent of Native Hawaiian renters increased correspondingly from 43.3% to 47.1% (ACS 1-Year Estimate 2014).
Table 1. State of Hawaiʻi and Native Hawaiian Homeownership Indicators, 2014
Indicators State
Population Native
Hawaiian % of NH to
State Population Difference
Population 1,419,561 295,409 20.8% -
Households 450,769 71,006 15.7% -
Average Household Size 3.05 3.55 - +0.50
Average Family Size 3.61 4.06 - +0.45
Owner-occupied Housing Units 255,375 37,564 14.7% -
% of Owner-occupied Housing Units 56.7% 52.9% - -3.8% points
Average Household Size of Owner-occupied units 3.21 3.77 - +0.56
Housing Units with a Mortgage 168,221 27,246 16.1% -
% of Housing Units with a Mortgage 65.8% 72.5% - 6.7% points
Housing Units without a Mortgage 87,154 10,318 11.8% -
% of Housing Units without a Mortgage 34.1% 27.4% - -6.7% points
% of Cost-burdened Households 40.6% 35.3% - -5.3% points
Source: ACS 2014 1-Year Estimate, S0201.
This section summarizes indicators of homeownership within the Hawaiʻi population as a whole and Native Hawaiians as a
subgroup. Table 1 highlights those homeownership indicators of the State and Native Hawaiian population in 2014, while
Figure 1 highlights the homeownership rates between 2005 to 2014. The homeownership rate is computed by dividing the
number of owner-occupied units by the total number of occupied units. In 2014, the Native Hawaiian population in
Hawaiʻi was estimated at 295,409, with a median age of 29 years old, compared to 38 years old for the state population.
15.7% of households in
Hawaiʻi are Native
Hawaiian.
Native Hawaiians have
larger household and
family sizes than the
state population.
72.5% of Native
Hawaiian homeowners
have a mortgage, which
is 6.7 percentage points
higher than the state
population as a whole.
Figure 1. Homeownership Rate, 2005-2014
59.7%59.5% 59.6%
59.1%
56.7%
58.0%
56.8% 56.9%
56.2%
56.7%
55.3%
53.8%54.1%
56.6%
51.2%
56.6%
55.0%55.4%
56.7%
52.9%
50%
52%
54%
56%
58%
60%
2005 2006 2007 2008 2009 2010 2011 2012 2013 2014
State Population
Native Hawaiian
Source: ACS 1-Year Estimates 2005-2014, S0201. Note: The y-axis does not start at 0.
In 2014, the percent of Native Hawaiian owner-occupied housing units decreased by 3.8 percentage
points to 52.9%; while the level for the state population increased by 0.5 percentage points.
OFFICE OF HAWAIIAN AFFAIRS RESEARCH DIVISION

Page 4: Native Hawaiian Homeownership, 2016
Trends in Finances
After the Great Recession, there were stricter mortgage lending and down payment requirements, combined with job loss,
and a rapid increase in home prices (DBEDT, 2015a). Income and housing costs are two primary determinants of owning a
home. Figure 2 features the median household income which includes the income of the householder and all people 15
years and older. Figure 3 focuses on median selected monthly owner costs with mortgage. Monthly owner costs include
payments on mortgage, real estate taxes, insurance, utilities and fuels.
Native Hawaiian households with mortgages have lower median monthly housing costs than the state population. This
difference reflects the costs affordable for the Native Hawaiian population with lower average incomes and related to
the geographic locations of where Native Hawaiians reside.
In 2014, the median monthly housing costs with mortgage for Native Hawaiian households was 87.3% of the total state
population’s median cost.
Figure 2. Median Household Income, 2005-2014
$58,112
$61,160
$63,746
$67,214
$64,098 $63,030
$61,821
$66,259
$68,020
$69,592
$52,310
$55,177
$61,603
$66,353
$57,782
$59,755 $59,532 $60,415
$65,688
$62,852
$50,000
$52,000
$54,000
$56,000
$58,000
$60,000
$62,000
$64,000
$66,000
$68,000
$70,000
2005 2006 2007 2008 2009 2010 2011 2012 2013 2014
State Population
Native Hawaiian
Source: ACS 1-Year Estimates 2005-2014, S0201. Note: The y-axis does not start at 0.
Figure 3. Median Selected Monthly Owner Costs with Mortgage, 2005-2014
$1,763
$1,959
$2,099
$2,265 $2,282 $2,240
$2,221 $2,244
$2,220
$2,173
$1,566
$1,798 $1,771
$2,018
$1,940
$1,993 $1,983 $2,005
$1,960
$1,898
$1,500
$1,600
$1,700
$1,800
$1,900
$2,000
$2,100
$2,200
$2,300
2005 2006 2007 2008 2009 2010 2011 2012 2013 2014
State Population
Native Hawaiian
Source: ACS 1-Year Estimates 2005-2014, S0201. Note: The y-axis does not start at 0.
In 2009, the median household income for Native Hawaiians decreased 12.9%, as compared to a decrease of 4.6% for
the overall state population.
In 2008, the median household income for Native Hawaiians peaked at $66,353, while the median
selected monthly owner costs for Native Hawaiians with a mortgage also peaked at $2,018, just before
the Great Recession.
OFFICE OF HAWAIIAN AFFAIRS RESEARCH DIVISION

Native Hawaiian Homeownership, 2016, Page 5
Housing Costs
Cost-burdened households refer to households that pay 30% or more of their income towards housing related expenses and
may experience difficulty paying for necessities such as food, clothing, transportation, and medical expenses. Figure 4
shows the percent of cost-burdened households with a mortgage. Figure 5 depicts the median home value of the state
population and Native Hawaiians. Median home value refers to the estimated value of a house if it were for sale at that
time.
30.1%
34.7% 34.1%
49.5% 49.4%50.2%
49.2%48.2%
43.7%
40.6%
27.8%
35.6%
32.0%
51.4%
44.3%
49.8%
42.6%
47.0%
39.5%
35.3%
25%
30%
35%
40%
45%
50%
55%
2005 2006 2007 2008 2009 2010 2011 2012 2013 2014
State Population
Native Hawaiian
Figure 4. Percent of Cost-Burdened Housing Units with a Mortgage, 2005-2014
Source: ACS 1-Year Estimates 2005-2014, S0201. Note: The y-axis does not start at 0.
Figure 5. Median Home Value, 2005-2014
$453,600
$529,700
$555,400 $560,200
$517,600 $525,400
$487,400 $496,600 $500,000
$528,000
$367,600
$464,200 $476,700
$505,800
$453,900 $443,900
$399,300
$378,100
$403,700
$432,200
$350,000
$400,000
$450,000
$500,000
$550,000
$600,000
2005 2006 2007 2008 2009 2010 2011 2012 2013 2014
State Population
Native Hawaiian
Source: ACS 1-Year Estimates 2005-2014, S0201. Note: The y-axis does not start at 0.
In 2008, there was a substantial increase of cost-burdened households with mortgages in the state population (15.4
percentage points) and an even greater increase for the Native Hawaiian population (19.4 percentage points).
Between 2009 and 2011, the percentage of cost-burdened Native Hawaiian households fluctuated 5 to 7 percentage
points, but remained lower than the overall state population percentage.
Native Hawaiians reside in homes with a lower median home value. The highest median home value among Native
Hawaiians was $505,800 in 2008, while the highest median home value in the state was $560,200 of the same year.
From 2012 to 2014, Native Hawaiian cost-burdened households decreased 11.7 percentage
points to 35.3%, while Native Hawaiian median home value increased 14% to $432,200.
OFFICE OF HAWAIIAN AFFAIRS RESEARCH DIVISION
Page 6: Native Hawaiian Homeownership, 2016
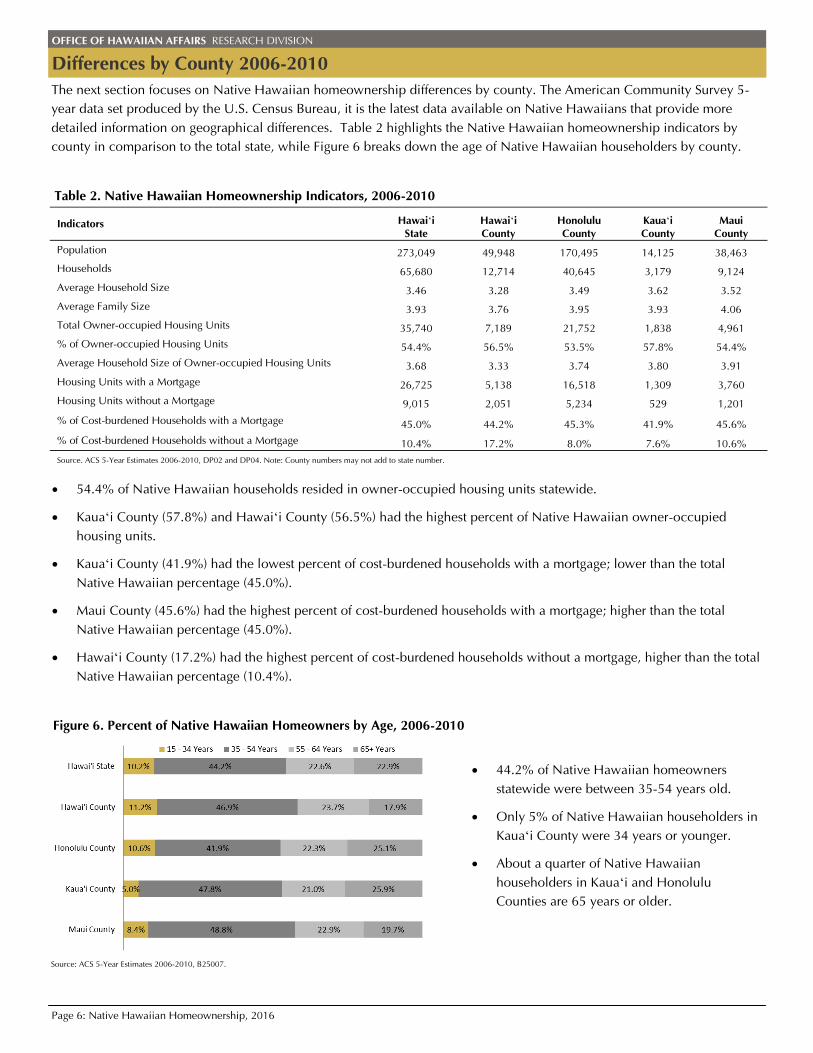
Differences by County 2006-2010
The next section focuses on Native Hawaiian homeownership differences by county. The American Community Survey 5-
year data set produced by the U.S. Census Bureau, it is the latest data available on Native Hawaiians that provide more
detailed information on geographical differences. Table 2 highlights the Native Hawaiian homeownership indicators by
county in comparison to the total state, while Figure 6 breaks down the age of Native Hawaiian householders by county.
Table 2. Native Hawaiian Homeownership Indicators, 2006-2010
Indicators Hawaiʻi State
Hawaiʻi County
Honolulu County
Kauaʻi County
Maui County
Population 273,049 49,948 170,495 14,125 38,463
Households 65,680 12,714 40,645 3,179 9,124
Average Household Size 3.46 3.28 3.49 3.62 3.52
Average Family Size 3.93 3.76 3.95 3.93 4.06
Total Owner-occupied Housing Units 35,740 7,189 21,752 1,838 4,961
% of Owner-occupied Housing Units 54.4% 56.5% 53.5% 57.8% 54.4%
Average Household Size of Owner-occupied Housing Units 3.68 3.33 3.74 3.80 3.91
Housing Units with a Mortgage 26,725 5,138 16,518 1,309 3,760
Housing Units without a Mortgage 9,015 2,051 5,234 529 1,201
% of Cost-burdened Households with a Mortgage 45.0% 44.2% 45.3% 41.9% 45.6%
% of Cost-burdened Households without a Mortgage 10.4% 17.2% 8.0% 7.6% 10.6%
Source. ACS 5-Year Estimates 2006-2010, DP02 and DP04. Note: County numbers may not add to state number.
54.4% of Native Hawaiian households resided in owner-occupied housing units statewide.
Kauaʻi County (57.8%) and Hawaiʻi County (56.5%) had the highest percent of Native Hawaiian owner-occupied
housing units.
Kauaʻi County (41.9%) had the lowest percent of cost-burdened households with a mortgage; lower than the total
Native Hawaiian percentage (45.0%).
Maui County (45.6%) had the highest percent of cost-burdened households with a mortgage; higher than the total
Native Hawaiian percentage (45.0%).
Hawaiʻi County (17.2%) had the highest percent of cost-burdened households without a mortgage, higher than the total
Native Hawaiian percentage (10.4%).
44.2% of Native Hawaiian homeowners
statewide were between 35-54 years old.
Only 5% of Native Hawaiian householders in
Kauaʻi County were 34 years or younger.
About a quarter of Native Hawaiian
householders in Kauaʻi and Honolulu
Counties are 65 years or older.
OFFICE OF HAWAIIAN AFFAIRS RESEARCH DIVISION
Figure 6. Percent of Native Hawaiian Homeowners by Age, 2006-2010
Source: ACS 5-Year Estimates 2006-2010, B25007.

Native Hawaiian Homeownership, 2016, Page 7
Financial Conditions
The financial conditions of homeowners also differ by county. Figure 7 provides data on the median household income of
Native Hawaiian owner-occupied units, while Figure 8 focuses on the median home value. Figures 9 and 10 highlight the
differences between the median selected monthly owner costs, with and without mortgages respectively. This data provides
specific information on owner-occupied units, and does not include Native Hawaiian renter-occupied housing units.
The total population of Honolulu County had the
highest median income of $89,947, surpassing the total
state median household income.
Native Hawaiians in Hawaiʻi ($67,268) and Kauaʻi
($73,750) Counties were the only counties with median
household incomes higher than the total median
household income of their respective county
population.
Figure 7. Median Household Income of Owner-occupied Units, 2006-2010
Source: ACS 5-Year Estimates 2006-2010, B25119.
Figure 9. Median Home Value, 2006-2010
Source: ACS 5-Year Estimates 2006-2010, DP04.
Figure 8. Median Selected Monthly Owner Costs with Mortgage, 2006-2010
Source: ACS 5-Year Estimates 2006-2010, DP04.
Figure 10. Median Selected Monthly Owner Costs without Mortgage, 2006-2010
Source: ACS 5-Year Estimates 2006-2010, DP04.
Hawaiʻi County had the lowest median home value of
$320,300, $41,100 less than the state value of $361,400.
There is a large difference of $122,600 in Maui County
between Native Hawaiian home value and that of the
total Maui County population.
The total population of Maui County ($2,379) had the
highest owner costs, while Native Hawaiians in
Honolulu County ($2,178) had the highest Native
Hawaiian owner costs with mortgage.
The total population of Hawaiʻi County ($1,691) had
the lowest owner costs, while Native Hawaiians in
Hawaiʻi County ($1,455) had the lowest Native
Hawaiian owner costs with mortgage.
Native Hawaiians in Maui County ($330) had the
lowest owner costs without mortgages, while the
total population in Honolulu County ($485) had the
highest costs.
Native Hawaiians in Hawaiʻi County had the lowest household income, owner costs with
mortgages, and home value between 2006-2010.
OFFICE OF HAWAIIAN AFFAIRS RESEARCH DIVISION

Page 8: Native Hawaiian Homeownership, 2016
Physical Housing Characteristics
Table 3. Number and Percent of Native Hawaiian Owner-occupied Units by Bedrooms, 2006-2010
No Bedroom
1 Bedroom
2 Bedrooms
3 Bedrooms
4 Bedrooms
5+ Bedrooms
Owner-occupied Units
# % # % # % # % # % # % # %
Hawaiʻi State 35,740 100% 303 0.8% 1,030 2.9% 5,242 14.7% 17,662 49.4% 7,853 22.0% 3,650 10.2%
Hawaiʻi County 7,189 100% 155 2.2% 217 3.0% 986 13.7% 4,110 57.2% 1,192 16.6% 529 7.4%
Honolulu County 21,752 100% 89 0.4% 630 2.9% 3,264 15.0% 9,753 44.9% 5,439 25.0% 2,577 11.8%
Kauai County 1,838 100% 8 0.4% 87 4.7% 212 11.5% 1,133 61.6% 321 17.5% 77 4.2%
Maui County 4,961 100% 51 1.0% 96 1.9% 780 15.7% 2,666 53.7% 901 18.2% 467 9.4%
Source: ACS 2006-2010 5-Year Estimates, B25042.
Table 4. Number and Percent of Native Hawaiian Owner-occupied Units by Facility Conditions, 2006-2010
Hawaiʻi County
Honolulu County
Kauaʻi County
Maui County
Hawaiʻi State
# % # % # % # % # %
Lacking complete kitchen facilities 393 100% 73 18.6% 153 38.9% 75 19.0% 92 23.4%
Lacking complete plumbing facilities 383 100% 198 51.6% 81 21.1% 32 8.4% 72 18.8%
Source: ACS 2006-2010 5-Year Estimates, B25049, B25053.
Honolulu County (39%) had the highest percent of Native Hawaiians living in owner-occupied units lacking
complete kitchen facilities.
Hawaiʻi County (52%) had the highest percent of Native Hawaiians living in owner-occupied units lacking complete
plumbing facilities.
Some of the physical characteristics of a house include the number of bedrooms, the year the home was built, and facilities
such as the kitchen and plumbing. These attributes help to assess the physical quality of the house and the housing
expenses. Table 3 presents a breakdown by the number and percent of Native Hawaiian owner-occupied units by
bedrooms. Bedrooms refer to the count of rooms designed to be used as bedrooms if the house was for sale or rent. A house
consisting of only one room is classified as having no bedrooms. Figure 11 depicts Native Hawaiian owner-occupied units
by the year they were built and Table 4 reports on facility conditions. A complete kitchen facility includes a sink with a
faucet, a stove or range, and a refrigerator, while a complete plumbing facility includes a hot and cold running water, a
flush toilet and a bathtub or shower.
70.5% of Native Hawaiian owner-occupied units
statewide were built prior to 1989.
75.6% Native Hawaiian owner-occupied units in
Honolulu County were built prior to 1990.
After 1990, there was an increase of Native
Hawaiian owner-occupied units in Kauaʻi County
(41.7%), Maui County (38.1%), and Hawaiʻi
County (35.6%).
82.0% of Native Hawaiian owner-occupied units had at least three bedrooms.
37.0% of Native Hawaiian owner-occupied units in Honolulu County had 4 or more bedroms.
OFFICE OF HAWAIIAN AFFAIRS RESEARCH DIVISION
Figure 11. Percent of Native Hawaiian Owner-occupied Units by Year Built, 2006-2010
Source: ACS 5-Year Estimates 2006-2010, B25036.

Native Hawaiian Homeownership, 2016, Page 9
Real Estate in Hawaiʻi
Honolulu County had the
largest percent of local buyers
(84.7%), while Maui County
had the lowest percent of
local buyers (48%).
Maui County had the largest
percent of buyers from the
Continental United States
(44.9%), while Honolulu
County had the lowest
percent (11.7%).
Kauaʻi County had the lowest
percent of foreign buyers
(2.4%), while Maui County
had the highest percent
(7.1%) .
Residential Home Sales in Hawaiʻi: Trends and Characteristics report (DBEDT, 2015b) summarized the characteristics of
buyers from January 2008 to September 2015; the report beaks down the number of sales and average prices of homes by
county and sub-county. Figure 12 shows the number of home sales in Hawaiʻi and the percentage of local, continental
United States, and foreign buyers, while Figure 13 displays the average home prices. A total of 139,998 homes in Hawaiʻi
were sold between January 2008 and September 2015; 72.5% of buyers were local, 23.5% came from the continental
United States and 4% from foreign countries.
Maui County had the highest average price of
homes purchased by foreign buyers
($883,842) and continental United States
buyers ($753,919).
Hawaiʻi County had the lowest average price
of a home paid by a local buyer ($274,469).
Area Total Local Continental U.S. Foreign
State $526,326 $478,189 $630,390 $785,604
Honolulu County $542,676 $521,224 $615,054 $808566
Hawaiʻi County $379,248 $274,469 $512,052 $584,834
Kauaʻi County $580,170 $478,548 $710,090 $561,998
Maui County $627,162 $470,817 $753,919 $883,842
Source: Residential Home Sales in Hawaii: Trends and Characteristics, p. 5, by Research and Economic Analysis
Figure 13. Average Home Prices, January 2008-September 2015
Honolulu County had the largest percent of
local buyers and the highest local average
price between 2008 and 2015.
Maui County had the largest percent of
foreign buyers and the highest foreign
average price between 2008 and 2015.
OFFICE OF HAWAIIAN AFFAIRS RESEARCH DIVISION
Area Total Local Continental U.S. Foreign
# % # % # % # %
State 139,998 100% 101,496 72.5% 32,838 23.5% 5,664 4%
Honolulu County 85,860 100% 72,686 84.7% 10,044 11.7% 3,130 3.6%
Hawaiʻi County 26,348 100% 15,001 56.9% 10,456 39.7% 891 3.4%
Kauaʻi County 7,038 100% 3,841 54.6% 3,028 43% 169 2.4%
Maui County 20,752 100% 9,968 48% 9,310 44.9% 1,474 7.1%
Source: Residential Home Sales in Hawaii: Trends and Characteristics, p. 5, by Research and Economic Analysis Division, 2015, Honolulu:
Figure 12. Percent and Number of Home Sales, January 2008-September 2015

Page 10: Native Hawaiian Homeownership, 2016
The Impact of the Hawaiian Homes Commission Act of 1920
Championed by Prince Jonah Kuhio Kalanianaʻole, the
Hawaiian Homes Commission Act of 1920 (HHCA) was an
act passed by the U.S. Congress to enable “native
Hawaiians to return to their lands in order to fully support
self-sufficiency for native Hawaiians and the self-
determination of native Hawaiians in the administration of
this Act, and the preservation of the values, traditions and
culture of native Hawaiians” (HHCA, 1920).
As a condition of statehood in 1959, the State of Hawaiʻi
agreed to administer the Act and included it in the state
constitution. The Department of Hawaiian Home Lands
(DHHL) was created to oversee 200,000 acres set aside for
native Hawaiian homesteading for residential, agricultural,
and pastoral use. In order to be eligible for a lease, one
must be at least 18 years old and have not less than one-
half (50%) Hawaiian ancestry. Successors to the lease must
be related and have at least 25% Hawaiian
ancestry.
The Department of Hawaiian Home Lands
The Native American Housing Assistance and Self
Determination Act (NAHASDA) of 1996 provides
housing assistance to Native Americans through the
U.S. Department of Housing and Urban
Development (HUD). In 2000, it was amended to
include housing assistance for Native Hawaiians
and designated DHHL as the recipient. It has been
DHHL’s major source of federal funding.
As of June 30, 2014, DHHL leased 9,838 residential,
agricultural, and pastoral properties. Residential leases
comprised about 85% of the total leases (DHHL Annual
Report, 2015a), however it does not include housing units
located on agricultural and pastoral lands. Based on the
ACS 2014 data, it is estimated that DHHL provides about
3.2% of the total owner-occupied housing units in Hawaiʻi
and about 22.1% of owner-occupied housing units among
Native Hawaiians.
Beneficiaries
A 2014 DHHL Beneficiaries Study Lessee Report (2015b)
surveyed lessees and undivided interest lessees. Undivided
interest lessees are those who were awarded a lease in a
project area, but do not yet have a house that is move-in
ready. From 2008 to 2014, the number of leases increased
4.5% from 9,236 leases in 2008 to 9,654 leases in 2014.
The median age of lessees was 62 years, the median
household income was $59,600, and more than 75% of
lessees needed to repair their homes but could not afford it.
Undivided interest lessees had a median age of 55, younger
than traditional lessees; almost half rented their current
residence; and majority wanted a house that was ready to
be occupied.
Since 2008, applicants has increased by 33%, where 41%
preferred to have a homestead on Oʻahu, a ready to move-
in single-family dwelling with 3-4 bedrooms and 2
bathrooms (DHHL, 2015c). There was a total of 22,576
residential applications on the waiting list as of June 30,
2015.
OFFICE OF HAWAIIAN AFFAIRS RESEARCH DIVISION
Kapolei, Oʻahu, Hawaiʻi.
The Department of Hawaiian Home Lands, Kapolei, Oʻahu, Hawaiʻi.
© Kamakanaokealoha Aquino
© Ed Gross/The Image Group LLC

Native Hawaiian Homeownership, 2016, Page 11
The Case for Native Hawaiians
Papakölea, Oʻahu, Hawaiʻi.
Native Hawaiians lived a lifestyle that ensured adequate
resources to provide economic self-sufficiency, until their
political power and resources were disenfranchised by
political and economic forces in the 1800s. For over a
century, the results greatly affected the lifestyle and
resources of Native Hawaiians and the continued means
towards economic self-sufficiency. As a result, Native
Hawaiian homeownership became a strategic goal of the
Office of Hawaiian Affairs. This factsheet provided an
overview of Native Hawaiian homeownership and
highlighted the trends and differences from 2005-2014.
From 2013 to 2014, the percent of Native Hawaiian
homeowners decreased, while there was an increase
of Native Hawaiian renters.
Population growth such as military presence, domestic
migration, immigration from abroad, foreign investments,
and vacation rentals have all impacted homeownership
rates (DEBDT, 2015a). The Native Hawaiian population
was younger, while family and household sizes continued
to surpass the average size for the state population.
Income did not increase as fast as housing prices
(DEBDT, 2015a; HHFDC, 2011).
Although a smaller percent of Native Hawaiians are cost-
burdened and on average, pay lower monthly owner costs,
the affordability of a home suited for their needs remains an
issue. Hostetter (2014) concluded that after the Great
Recession, that the greatest disparity in income is Per Capita
Income (PCI) between Native Hawaiians and the state
population. PCI is based on the total income of a group
divided by the total number of members of that group.
When PCI is analyzed, a substantially large disparity is
revealed, leading to higher poverty rates.
Honolulu County accounts for a majority of
residential housing units in Hawaiʻi and increased
rapidly over the years (DBEDT, 2015a).
In addition to the state trends, it is also important to highlight
the differences between each county in Hawaiʻi. It is also
interesting to note, that the population in the other counties
is projected to grow faster than Honolulu (DBEDT, 2015a).
Counties like Kauaʻi and Maui have larger household and
family sizes. Although Honolulu County accounted for a
majority of homes, Honolulu had the lowest homeownership
rate compared to the higher rates in Hawaiʻi and Kauaʻi
Counties (HHFDC, 2011).
For almost a century, the Hawaiian Homes
Commission Act of 1920 and the Department of
Hawaiian Home Lands has contributed greatly to
homeownership in Hawaiʻi for Native Hawaiians.
Although there is a growing demand as evidenced by the
wait list of Native Hawaiians, the supply of DHHL homes
face the same challenges as other residential construction
(DBEDT, 2015a). In addition to providing homes, DHHL has
also focused on community development and provided
funding for several community projects and initiatives that
address culture, education, health, employment and social
welfare. A focus on community development has positive
impacts on mental well-being (Maqbool, Viveiros, and Ault,
2015).
Between 2015 and 2025, an estimated demand of
65,000 new housing units is projected in Hawaiʻi
(DBEDT, 2015a).
How and if this will be met depends on several factors.
Demand depends on population growth, household
formation, changes in the number of families, income
distributions (HHFDC, 2011), the availability of land,
financing for the project, the permitting process (DBEDT,
2015a) and other requirements . Viveiros (2015) indicated
that “housing is an important social determinant” that relates
to the quality, location and cost of housing that will impact
residents (p. 2).
OFFICE OF HAWAIIAN AFFAIRS RESEARCH DIVISION
© Ed Gross/The Image Group LLC http://www.papakolea.org/

Page 12: Native Hawaiian Homeownership, 2016
Definitions & References Average Family size Measured by dividing the number of people in families by the total number of families.
Average Household Size of Owner-occupied Unit
Measured by dividing the number of people living in owner-occupied
housing units by the total number of owner-occupied housing units.
Bedrooms
The count of rooms designated to be used as bedrooms, as if the number of
rooms listed as bedrooms, if the house were on market for sale or rent. A
housing unit consisting of only one room is classified as having no bedroom.
Homeownership Rate
Computed by dividing the number of owner-occupied units by the total
number of occupied units.
Householder
A person or one of the people in whose name the home is owned by.
Household Income
Income of the householder and all people 15 years and older in the
household, related or not to the householder.
Households
All people occupying the house.
Kitchen Facilities
A unit must include a sink with a faucet, a stove or range, and a refrigerator to
be a complete kitchen facility.
Median Home Value
Computed by dividing the number of owner-occupied units by the total
number of occupied units.
Mortgage
All forms of debt, where the property is pledged as security for repayment of
the debt, including deeds of trust; trust deeds; contracts to purchase; land
contracts; junior mortgages; and home equity loans.
Native Hawaiian
Any descendant of the aboriginal peoples inhabiting the Hawaiian Islands
which exercised sovereignty and subsisted in the Hawaiian Islands in 1778,
and which peoples thereafter have continued to reside in Hawaiʻi. Native
Hawaiians who self-identified as Native Hawaiian alone or in any
combination in U.S. Census surveys (code #062). Using “n” in native
Hawaiian is any native Hawaiian who is at least 50% blood quantum
according to the Hawaiian Homes Commission Act 1920, as amended.
Per Capita Income (PCI)
The mean income computed for every man, woman and child in a particular
group including those living in group quarters. It is derived by dividing the
aggregate income of a particular group by the total population in that group.
Plumbing Facilities
A unit must include a hot and cold running water, a flush toilet and a bathtub
or shower to be a complete plumbing facility.
Beamer, K. (2014). Nö Mā kou Ka Mana Liberating the Nation. Honolulu,
HI: Kamehameha Publishing.
Department of Hawaiian Home Lands. (2015a). Annual Report 2014.
Honolulu, HI: Department of Hawaiian Home Lands.
Department of Hawaiian Home Lands. (2015b). DHHL Beneficiaries Study
Lessee Report 2014. Honolulu, HI: SMS Research.
Department of Hawaiian Home Lands. (2015c). DHHL Beneficiaries Study
Applicant Report 2014. Honolulu, HI: SMS Research.
Handy, E.S., Emory, K.P., Bryan, E.H., Buck, P.H. & Wise, J.H. (1965).
Ancient Hawaiian Civilization: A Series of Lectures Delivered at
the Kamehameha Schools. Rutland, VT: Charles E. Tuttle Com
pany.
Hawaiʻi Housing Finance and Development Corporation. (2011). Hawaiʻi
Housing Planning Study. Honolulu, HI: SMS Research.
Hawaiʻi State Department of Business, Economic Development and Tour
ism. (2015a). Measuring Housing Demand in Hawaiʻi, 2015-
2025. Honolulu, HI: Research and Economic Analysis Division.
Hawaiʻi State Department of Business, Economic Development and
Tourism. (2015b). Residential Home Sales in Hawaiʻi, Trends
and Characteristics. Honolulu, HI: Research and Economic
Analysis Division.
Hosetter, C.J. (2014). Income Inequality and Native Hawaiian Communities
in the Wake of the Great Recession: 2005-2013, (Hookahua
Waiwai Economic Self-Sufficiency Fact Sheet, Vol. 2014, No. 2).
Honolulu, HI: Office of Hawaiian Affairs.
Malo, D. (1851). Hawaiian Antiquities: Moolelo Hawaii (2nd ed.). Honolu
lu, HI: Bernice P. Bishop Museum Press.
Maqbool, N., Viveiros, J., and Ault, M. (2015). The Impacts of Affordable
Housing on Health: A Research Summary. Washington, DC:
National Housing Conference.
Mikelsons, M. and Eschbach, K. (1996). Housing Problems and Needs of
Native Hawaiians. Retrieved from https://www.huduser.gov/
portal/publications/hsgspec/hawaiian.html.
Viveiros, J. (2015). Affordable Housing’s Place in Health Care. Washington,
DC: National Housing Conference.
SUGGESTED CITATION
Aquino, K. M. (2016). Native Hawaiian Homeownership. Hoʻokahua Waiwai (Economic Self-Sufficiency) Fact Sheet, Vol. 2016, No. 1. Honolulu, HI: Office of Hawaiian Affairs.
OFFICE OF HAWAIIAN AFFAIRS RESEARCH DIVISION