national weather digest three late...
TRANSCRIPT
NATIONAL WEATHER DIGEST
THREE LATE SPRING FRONTS IN THE CARIBBEAN
by
W. K. Henry Texas A&M University
College Station, TX
ABSTRACT
The analysis and weather of three late-spring fronts in the western Caribbean Sea is discussed. The difference in analysis of three countries is highlighted, not in terms of correctness of analysis but in relation to the usefulness of the analysis to the problem of the forecast for their area. The synoptic map should be analyzed to enable the forecaster to make the best possible forecast, not to meet worldwide standards or criteria.
1. INTRODUCTION
During April 1977, two cold fronts invaded the Caribbean Sea, and another front followed in May. On the , average, 1.3 fronts leave the Gulf of Mexico and move into the Caribbean in April, and 0.7 in May. Therefore, these fronts were not unexpected nor considered rare events. Fronts have penetrated as far south as 15 degrees North during April and May. However, these three fronts present the opportunity of obtaining a better understanding of the behavior of fronts in the subtropics late in the season.
The purposes of this short paper are to:
a. Illustrate the difference in perspective of different weather services. b. Describe some of the weather caused by these three fronts.
2. FRONTAL ANALYSES
the frontal situation as analyzed by ihe National Meteorological Center (NMC) of the National Weather Service (NWS) of the United States along with
18
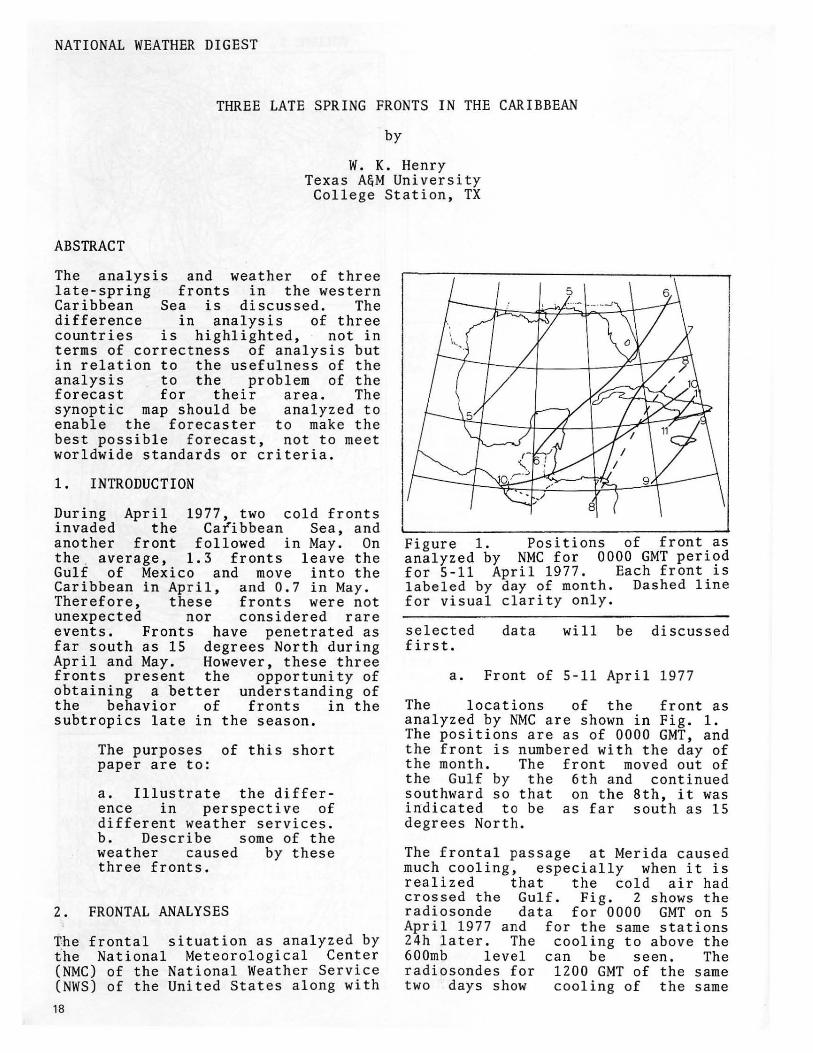
Figure 1. Positions of front as analyzed by NMC for 0000 GMT period for 5-11 April 1977. Each front is labeled by day of month. Dashed line for visual clarity only.
selected first.
data will be discussed
a. Front of 5-11 April 1977
The locations of the front as analyzed by NMC are shown in Fig. 1. The positions are as of 0000 GMT, and the front is numbered with the day of the month. The front moved out of the Gulf by the 6th and continued southward so that on the 8th, it was indicated to be as far south as 15 degrees North.
The frontal passage at Merida caused much cooling, especially when it is realized that the cold air had crossed the Gulf. Fig. 2 shows the radiosonde data for 0000 GMT on 5 April 1977 and for the same stations 24h later. The cooling to above the 600mb level can be seen. The radiosondes for 1200 GMT of the same two days show cooling of the same
'" ... ) " J .. ,
'" " " 1.,/ '" '"
" r '" ) .. r ''''' OOGMT OO~ e .. n II""
Figure 2. Radiosonde data for Merida, Mexico for 0000 GMT, 5 and 6 April 1977. The a and - are temperature and dewpoint for 5 April, and and + are temperature and dewpoint for 6 April, at 0000 GMT. Base diagram is the Skew T-Log P.
magnitude. easterly to levels. The Fig. 2.
The winds shifted from northerly in the lower
winds are included in
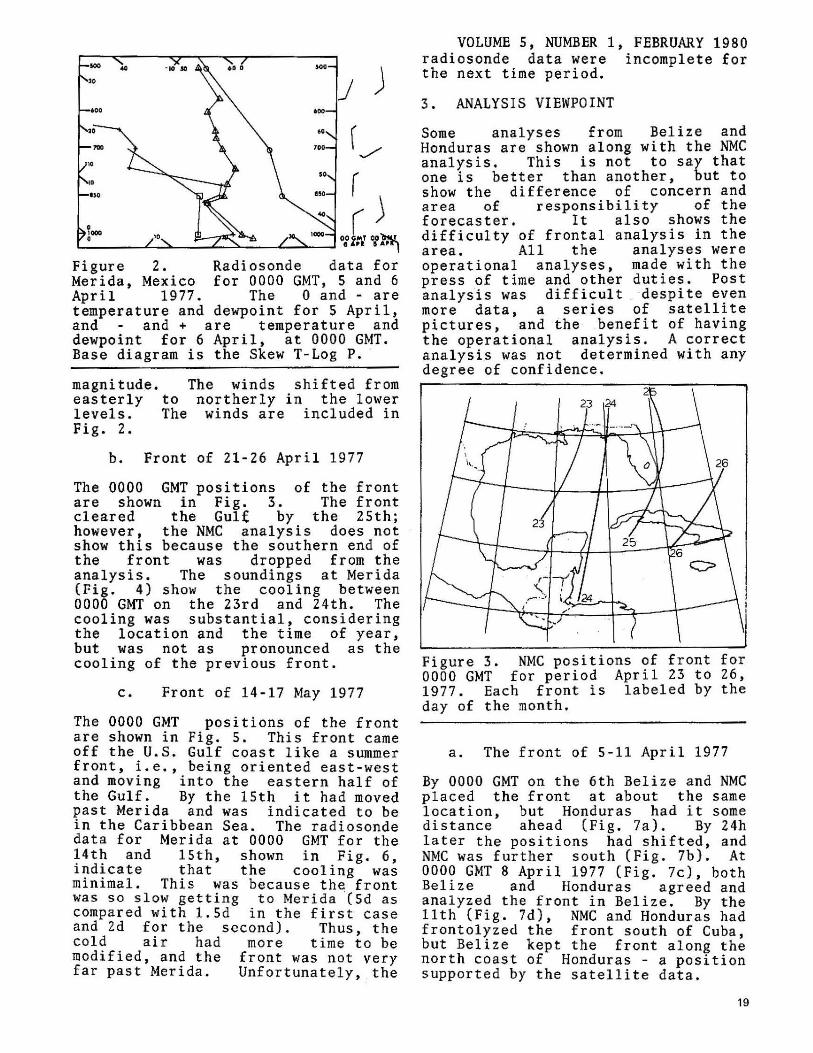
b. Front of 21-26 April 1977
The 0000 GMT positions of the front are shown in Fig. 3. The front cleared the Gul£ by the 25th; however, the NMC analysis does not show this because the southern end of the front was dropped from the analysis. The soundings at Merida (Fig. 4) show the cooling between 0000 GMT on the 23rd and 24th. The cooling was substantial, considering the location and the time of year, but was not as pronounced as the cooling of the previous front.
c. Front of 14-17 May 1977
The 0000 GMT positions of the front are shown in Fig. 5. This front came off the U.S. Gulf coast like a summer front, i.e., being oriented east-west and moving into the eastern half of the Gulf. By the 15th it had moved past Merida and was indicated to be in the Caribbean Sea. The radiosonde data for Merida at 0000 GMT for the 14th and 15th, shown in Fig. 6, indicate that the cooling was minimal. This was because the front was so slow getting to Merida '(Sd as compared with 1.5d in the first case and 2d for the second). Thus, the cold air had more time to be modified, and the front was not very far past Merida. Unfortunately, the
VOLUME 5, NUMBER I, FEBRUARY 1980 radiosonde data were incomplete for the next time period.
3. ANALYSIS VIEWPOINT
Some analyses from Belize and Honduras are shown along with the NMC analysis. This is not to say that one is better than another, but to show the difference of concern and area of responsibility of the forecaster. It also shows the difficulty of frontal analysis in the area. All the analyses were operational analyses, made with the press of time and other duties. Post analysis was difficult despite even more data, a series of satellite pictures, and the benefit of having the operational analysis. A correct analysis was not determined with any degree of confidence.
Figure 3. NMC positions of front for 0000 GMT for period April 23 to 26, 1977. Each front is labeled by the day of the month.
a. The front of 5-11 April 1977
By 0000 GMT on the 6th Belize and NMC placed the front at about the same location, but Honduras had it some distance ahead (Fig. 7a). By 24h later the positions had shifted, and N~IC was further south (Fig. 7b). At 0000 GMT 8 April 1977 (Fig. 7c), both Belize and Honduras agreed and analyzed the front in Belize. By the 11th (Fig. 7d), NMC and Honduras had frontolyzed the front south of Cuba, but Belize kept the front along the north coast of Honduras - a position supported by the satellite data.
19

NATIONAL WEATHER DIGEST r-......----.;;r--~-r----,,---,. ~
""V'
...
.. so 1000 ~ /'
L~ __ ..L-":' __ ..L~"""':=-..L'-':'_--' 00 GMTOO GMt Z. "~It a:I ",.
Figure 4. Radiosonde data for Merida, Mexico for 0000 GMT for 23 and 24 Apr il 1977. The 0 and - are temperature and dewpoint for 23 April, and the and + are temperature and dewpoint for the 24th.
Figure 5. NMC positions of front for 0000 GMT for period 14-17 May 1977. Each front is labeled by day of month. Dashed line for visual clari ty only. ( ... ~
" ... " \ , .. roo
-" \ .. (
" r ... H' I
" &DC ~(M' 15 MAl' ,. MAY
Figure 6. Radiosonde data for Merida, Mexico for 0000 GMT for 14 and 15 May 1977. The 0 and - are temperature and dewpoint for 14 May, and the - and + are temperature and dewpoint for 15 May. Base diagram is the Skew T-Log P. 20
b. The front of 21-26 April 1977
This front was not as strong as the previous front, as indicated by the Merida radiosonde data (Figs. 2, 4) . Thus, it was harder to find and did not cause as much of a change in the weather. By 0000 GMT 23 April a large difference of opinion had occurred (Fig. 8a). By the 24th Belize had broken continuity and relocated the front to the north (Fig. 8b). (My analysis is with Belize and their forward position, and I think it was a mistake for Belize to read just northward). By the 25th NMC frontolyzed the front in the Caribbean, but the other two kept the front until after the 0000 GMT analysis of the 26th (Figs. Be, 8d) before they dropped it.
4. THE WEATHER PATTERN IN BELIZE
Historically the driest month in Belize is February for the coastal areas and March for the interior. In April the northwest part receives less than SOmm of rainfall, and a small area to the southeast receives more than 100mm. The dry season ends during the last part of April, and 100mm or more of rain falls over most of the country in May.
The primary weather event associated with a front in the lower latitudes is rainfall. The 20 rain gages of the Meteorological Service of Belize are not uniformly spaced across the country (efforts are being made to even the spacing) nor are they haphazardly spaced. Rain gages are in areas where people live so the spacing of gages reflects the population pattern. The daily rainfall is measured about 0800 local time which is 1300 GMT. The morning period 1300-1700 GMT has the lowest hourly rates with the heavier rainfall in late evening and night time. The 0000 GMT map time is the middle of the daily rain period .
a. The front of 5-11 April 1977
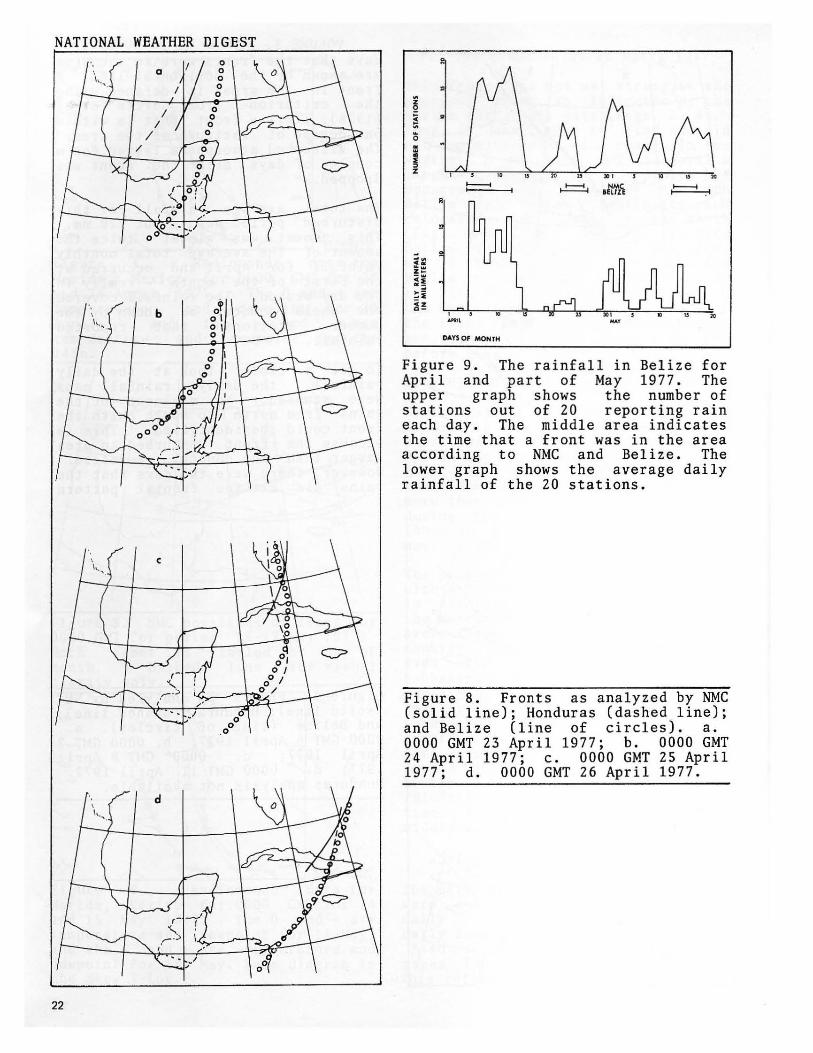
The daily data from the 20 rain gages were averaged to give an average daily rainfall for Belize. These daily averages are plotted in Fig. 9.
Also in Fig. 9 is the number of gages (out of 20) which had rain. This reflects the area covered. The

VOLUME 5, NUMBER 1, FEBRUARY 1980 days that the fronts were in the area are shown by the horizontal line. A front in the area is defined using the criterion from Garcia e t al (1978); i.e. a front that is within one degree of latitude of the area. The disturbed atmosphere lasted for a couple of days after the front was dropped.
The total average rainfall for this disturbed period was about 120 mm. This amount was almost twice the amount of the average total monthly rainfall for April and occurred at the first of the month - really in the dry season. The rainfall covered the whole country as shown by the number stations that reported rainfall.
To get a closer look at the daily rainfall, the daily rainfall maps were studied. No movement of the rains from north to south with the front could be identified. This is because the front disturbed an area larger than the country of Belize. However, there were two days that the rains did fit the frontal pattern
Figure 7. Fronts as analyzed by NMC (solid line); Honduras (d'ashed line); and Belize (line of circles). a. 0000 GMT 6 April 1977; b. 0000 GMT 7 April 1977; c. 0000 GMT 8 April 1977; d. 0000 GMT 11 April 1977. Honduras analysis not available.
21
NATIONAL WEATHER DIGEST
22
DAYS Of MONTH
Figure 9. The rainfall in Belize for April and part of May 1977. The upper graph shows the number of stations out of 20 reporting rain each day. The middle area indicates the time that a front was in the area according to NMC and Belize. The lower graph shows the average daily rainfall of the 20 stations.
Figure 8. Fronts as analyzed by NMC (solid line); Honduras (dashed line); and Belize (line of circles). a. 0000 GMT 23 April 1977; b. 0000 GMT 24 April 1977; c. 0000 GMT 2S April 1977; d. 0000 GMT 26 April 1977.

rather well. One is on 6 April (Fig. lOa). Fig. 10 shows the area receiving 25mm of rainfall for the 24h period. The area was determined by using both the reported rainfall amounts and the satellite data. GOES satellite pictures were used, and the pictures were available every 30 min.
The taller and larger cloud masses were assumed to be those most likely to produce rain. The areas they covered were added to the area determined from the rain gage data. Five stations had more than 25mm of rainfall, and one reported 75mm. The rainfall data reported by sixteen of the twenty stations agreed with the satellite picture.
, ... .... . \ "-..' I ____ .J
2
I
I 250
I I I I
/
/ ' ,
/ I , ,
I
VOLUME 5, NUMBER 1, FEBRUARY 1980 At the end of the period, on 12 April (Fig. lOb), the rainfall patterns (rain gage plus satellite) of 25mm of rain were aligned more east-west with the front as it was last analyzed on the 11th. The large rains were distributed over a larger area with one station having more than 75mm. All except one station reported rain, and it was in the southern end of the country.
b. The front of 23-26 April 1977
Fig. 9 shows that there was not much rainfall associated with this front. However, the atmosphere was disturbed enough to cause rain at several
Figure 10. Rainfall for 6 April 1977. The amount represents the 24h total rainfall (mm) from 8: 00 A.M. (1300 GMT) of the 5th to the same time of the 6t~. Spaces between stations were estimated from satellite data. Front is for the 6th at 0000 GMT as analyzed by NMC. Fig. lOb. same, except for 12 April 1977. None of the services had a front on the map at 0000 GMT 12 April. The front is the author's, using data and satellite.
23

NATIONAL WEATHER DIGEST stations. The next two rainy periods are not associated with fronts. (Fronts are not the only cause of rain in the subtropics.)
c. The front of 14-17 May 1977
As shown in Fig. 9, there was some disturbance Df the atmosphere and some rain. This front was weak but did cause some local activity. During the evening of 19 May, I was on Cay Corker, a small island off the coast of Belize. To the north, over the ocean, was a thunderstorm. I could see precipitation falling from it onto the ocean. Some rain did fall at Cay Ambergis which was about lSkm north of Cay Corker . I sat on a pier on the east side of the island, watched the storm, and noted how calm the wind and water were. About midnight (0500 GMT) the wind started blowing from the north at an estimated 15kt. It continued for 5h then became a weak easterly wind, more characteristic of the wind of this area. The satellite p i cture in Fig. 11 shows the thunderstorm and a broken line of clouds extending to the east. I am sure that the thunderstorm and the north wind were caused by the weak front which was dropped from the NMC analysis two days previously, but which was still on both the Belize and Honduras analyses.
5. SUMMARY
The analysis of fronts in the
90 W 80W
20
Figur e 11. Satellite picture (GOES) f or 0145 GMT 19 May 1977 . The arrow point s t o the small thunderstorm wh i ch is east of Cay Ambergis and north of Cay Corker.
24
subtropics is a tough assignment. The sparse data over the ocean, the data from mountainous regions, and a poor communication system handicap the analyst.
It was not proven in this paper, as only three examples were shown, but NMC usually assumes frontolysis occurs soon after fronts enter the Caribbean Sea. The front is not expected to return to the shores of the U.S.A. (however a few do) so it is not a forecast problem . It should be noted that with the current computerized forecast methods used in the United States, fronts are not considered. The current models do not extend t his far south, and no computerized forecast was made for this area . However, to the forecaster i n the Caribbean, the front is app roaching his area of responsibility, and thus, he tends to keep the front on his map, and move it further south. To him, the front is an important factor for his forecas.t.
As stated previously, this is not an attempt to say that one analysis is right and another is wrong. It does reaffirm the often forgotten concept in these days of the computerized centralized facility that the analysis (area covered, type, and detail) should be for the forecaster to make a better forecast, and anything that he can draw on the map that helps accomplish that purpose should be entered.
The front is important because it may cause heavy rainfall. Frontal rainfall in January, February, and March amounts to rain in the dry season. In April and May any front entering the subtropics helps to end the dry season. The threat of heavy rainfall and floods exist if the front persists over the area.
6. ACKNOWLEDGEMENT
This research was supported by the Atmospheric Section, Nat i onal Science Foundation, Grant number ATM 76-22282. The review and suggestions of Dr. Dusan Djuric and Dr. A.H. Thompson were appreciated. The help of Mr . Ken Lesley of Belize and Sr. Pedro Cortez Quiraz of Honduras proved invaluable.