national urban development and housing framework, 2008-2010
TRANSCRIPT

National Urban Development and Housing Framework
2008-2010
Chapter I
Introduction
A BACKGROUND AND OBJECTIVES
An updated National Urban Development and Housing Framework (NUDHF) is mandated by
the Urban Development and Housing Act of 1992 (RA 7279) and is designed to provide a
macro framework for urban development and housing. The new framework (NUDHF 2008-
2010) consists of policy statements and strategies that shall guide the Philippine
government’s efforts towards improving the performance and efficiency of the country’s
urban system.
The preparation of the new policy framework builds on the previous two NUDHFs (1993-
1998 and 1999-2004). It is based on policy and program directions set by the Philippine
government as contained, in part, in several plan documents and pronouncements made by
the President. Of particular significance are: (a) the development action agenda outlined in
the President’s State of the Nation Address of 2006 and 2008; (b) the Medium Term
Philippine Development Plan (MTPDP) 2004-2010; (c) the President’s priority programs and
projects; (d) the National Urban Policy Agenda (NUPA) of 2000; (e) National Framework for
Physical Planning 2001-2030; (f) Asian Development Bank/GHK Infrastructure Planning
Framework; (g) Family-based Actions for Children and their Environs in the Slums –
Millennium Development Goals (FACES-MDG); (h) various Comprehensive Land Use Plans
(CLUPs); and (i) initiatives on urban development by national agencies like the Department
of Interior and Local Government (DILG), and in respect to the formulation of a National
Land Use Code and the creation of a proposed Department for Housing and Urban
Development (DHUD). Also, in view of the Housing and Urban Development Coordinating
Council’s (HUDCC) collaboration with international organizations such as the Cities
Alliance, the NUDHF 2008-2010 is consistent with the key initiatives of these entities (e.g.,
the Cities Development Strategies and Cities Without Slums).
In the context of developments and policy changes that may have transpired in recent years,
and in accordance with the terms of reference, the NUDHF 2008-2010 is designed to achieve
the following specific objectives:
Review the policy frameworks proposed by the previous NUDHFs with a view
towards determining their effectiveness and limitations given current socio-economic
and political realities;
Assess the institutional environment and the role of Local Government Units (LGUs)
and concerned agencies at various levels in housing and urban development, taking
stock of institutional changes that have taken place;

2
Identify current and prospective issues and problems that may be encountered in the
implementation of programs and policies formulated in NUDHF 2008-2010;
Formulate strategies that will contribute towards the achievement of the Millennium
Development Goals (MDG), enhance the participation of women in the development
process, and cooperation among LGUs and other institutions;
Recommend effective strategies/mechanisms for advocacy, capacity building,
feedback and monitoring, as well as for financing urban development programs.
It is also useful to point out that while the NUDHF focuses on strategies and actions that can
be pursued in the short term (2008-2010), as a framework, it extends its perspective and
analysis beyond this period. This is necessary, particularly because we are dealing with urban
developments and phenomena that take place over a protracted period of time.
B MAIN FEATURES OF NUDHF 2008-2010
While the strategies and policies to be presented in NUDHF 2008-2010 are intended to
complement existing policies as defined in current policy and plan documents (such as the
previous NUDHFs, the MTPDP and the NUPA), a number of features that may distinguish
NUDHF 2008-2010 from previous policy frameworks may usefully be noted at the outset:
First, unlike previous policy documents which tend to be comprehensive as far as sectoral
coverage is concerned (and assume the availability of a large amount of resources), NUDHF
2008-2010 is more strategic in character. It is premised on the assumption that resources for
urban development are severely limited. For this reason, key urban development issues have
to be identified and specific courses of actions have to be prioritized.
Second, in the analysis of the performance of the current urban system, the focus is on
“drivers” (rather than “symptoms”) of key issues and problems. It is noteworthy that in many
local plan documents and frameworks, the factors that underlie existing conditions described
are not sufficiently identified and explained. The identification of these underlying factors is
key to the formulation of urban development and housing policies and programs
Third, while previous policy frameworks tend to gloss over implementation issues and
institutional parameters, NUDHF 2008-2010 assesses the capacity of current institutional
arrangements to carryout the recommended strategies.
C THE BASIC APPROACH
The basic approach that was used in the formulation of NUDHF 2008-2010 built upon the
strategic considerations of an earlier study,1 and is illustrated in Figure 1.1. As elaborated in
the sections that follow, the preparation of the policy framework was guided by a number of
sequential steps:
1Douglas Weber, Arturo Corpuz and Chris Pablo, Towards a National Development Framework for the
Philippines: Strategic Considerations, September, 2003.

3
1. Defining and Describing the Current Urban System
Assessment of the current urban system largely entailed the documentation of trends
in urbanization and urban growth, the development issues and concerns associated
with such trends, as well as the current state of physical development, and social
infrastructure with particular focus on housing, slums and squatter communities, and
urban expansion. The performance of the urban system in terms of its contribution to
the country’s economic growth and in terms of such concerns as poverty alleviation,
employment generation, transportation efficiency, shelter provision and delivery of
other basic services (e.g., health, education, water, waste collection, information and
communications technology, etc.) was likewise evaluated. As previously noted, this
assessment, in part, served as the basis for the formulation of a guiding vision for the
urban sector.
Figure 1. The Basic Approach
Figure 1.1: Basic Approach on the NUDHF 2008-2010
2. Understanding the Urban System
a. Identification of the Drivers of the Urban System
In the context of the assessment of the current state of the urban system, key
drivers of such a system were identified. Emphasis was given on drivers, i.e.,
the “causes” rather than the “symptoms” of urban development problems and
concerns. As noted in other documents, such drivers are both external and
Defining and describing
the current urban system:
1. Trends
2. Issues & Problems
3. Performance
Understanding the urban system:
1. Drivers
2. Policies
3. Institutional environment
Determining the strategic
implications:
NATIONAL URBAN
DEVELOPMENT AND HOUSING
FRAMEWORK
A
B
C

4
internal. External drivers are those originating in the international
environment. They include globalization factors, increased competition from
international markets, the magnitude of foreign direct investments, etc.
Although there is not much that the Philippines can do to influence these
factors, anticipation and foresight may be important to mitigate their possible
adverse impacts on the urban system.
On the other hand, internal drivers include such phenomena as rapid national
and urban population growth, skill levels of existing supply of labor, the state
of physical infrastructure, fiscal and institutional constraints, internal access
and linkages, etc. All these factors could critically affect the performance and
efficiency of the country’s urban system.
b. Assessment of Urban Development and Housing Policies
Following the identification of the drivers of the urban system, the impacts
and influence of urbanization and urban development policies (both explicit
and implicit) were similarly assessed. The existing explicit urbanization and
urban development policies of the national government are well defined in
various plan and policy documents (e.g., the MTPDP, the current NUDHF, the
NUPA), and include such programs as industrial dispersal, the creation of
economic zones (ECOZONES), establishment of secondary urban centers, the
delineation of metropolitan areas, the creation of super-regions and other
related policies. Local level policies are mostly contained in the
Comprehensive Land Use Plans (CLUPS) and Comprehensive Development
Plans (CDPs) of LGUs. They include innovative housing programs, waste
disposal schemes, land use and transportation policies, pollution control
measures, and other related programs.
On the other hand, there are implicit policies which, although not directly
intended to make an impact on urban development and housing, may have a
considerable influence on the growth and development of urban areas.
Examples include policies on land conversion which could lead to the decline
of the supply of urban land for various purposes (e.g. socialized housing),
trade policies which tend to be protective of certain manufacturing products,
and other sectoral programs which may not be consistent with the objectives
of explicit urban development policies.
Attention was also be given to housing policies and programs that must form
an integral component of urban development. Such policies may be
categorized into those pertaining to (a) direct housing provision (e.g.,
socialized housing, slum upgrading, sites and services, resettlement, etc. and
(b) indirect housing provision (housing and development guarantees, licenses,
etc.) and housing finance (loans, subsidies, other innovative schemes).
c. Assessment of the Institutional Set-up and Environment
This phase looked into various options in resolving fundamental issues and
addressing critical gaps in policy and plan formulation on one hand, and plan
implementation, on the other. Probably the most critical issue that was

5
examined in respect to the institutional environment of urban development
programs relates to the vertical and horizontal linkages among institutions
performing functions relevant to housing and urban development. The role of
the HUDCC in enhancing these linkages was also assessed.
A related issue that was evaluated is the need to synchronize area-based plans
and programs with sectoral priorities. The CLUPs and the CDPs of the LGUs
are area-based and geographic in orientation. However, they have to reckon
with a budgeting and implementation system that is heavily sectoral in
character. A similar institutional dilemma is the frequent lack of consistency
between development concerns at the metropolitan level on one hand, and
sectoral and LGU priorities, on the other. Alternative policy options in
resolving these institutional issues are presented in this NUDHF document.
3. Determining Strategic Implications
The strategic implications of all these – the current state of the Philippine urban
system, its external and internal drivers, explicit and implicit policies for urban
development, issues in its institutional environment – were then assessed. In the
context of the Millennium Development Goals and other development objectives of
the country, a policy framework and specific policy recommendations for action in
the short and medium-term, and at three levels were then crafted:
Urban development and housing policies, programs and financing schemes at
the national level, and the role of HUDCC and other stakeholders in the
formulation and implementation such policies;
Urban development and housing policies, coping mechanisms and financing
strategies at the metropolitan and the role of metropolitan structures in the
management of urban areas.
Urban development and housing policies, coping mechanisms and financing
strategies at the local level and the role of LGUs in the management of urban
areas.
D ACTIVITIES AND METHODOLOGY
The following activities were part of the methodology utilized in the preparation of NUDHF
2008-2010:
1. Documents Review
Policies, frameworks and guidelines as contained in various plan and policy
documents were reviewed. This necessarily included evaluation of the effectiveness
and limitations of the previous NUDHFs. Key documents reviewed also covered the
following:
Medium-term Philippine Development Plan
National Framework for Physical Planning

6
National Urban and Housing Framework, 1993-1998; 1999-2004
National Urban Policy Agenda, 2000
Millennium Development Goals
ADB/GHK Infrastructure Planning Framework
FACES-MDG documents
Cities Alliance documents
Draft Legislations on the Proposed National Land Use Code
Draft Bills on the Proposed Creation of the Department of Housing and Urban
Development
Executive Order No. 561: Formation of the “Super” Regions and Mandate of
the Super-regional Development Champions
2. Design of Draft Framework and Strategic Plan
Partly based on the documents review, a draft design and strategic plan for NUDHF
2008-2010 was formulated. This draft design served as a working document for the
subsequent focus group discussions and consultation workshops.
3. Conduct of Focus Group Discussions and Consultation Workshop
Draft reports of the NUDHF were presented during an HUDCC-organized focus
group discussion and during a workshop of LGU representatives to allow
participation and generate ideas on urban development and housing concerns from
various stakeholders. The comments made after the presentation to the LGU officials
and the results of the focus group discussion are considered and integrated in
finalizing the strategic recommendations embodied in this report.
4. Crafting of the NUDHF
Results of the focus group discussion and the consultation workshop, as well as of the
review of documents were important inputs for the crafting of the NUDHF. As
previously indicated, the NUDHF includes a policy framework and an action agenda,
as well as recommendations for advocacy, capacity building and financing strategies.

7
Chapter II
The Current Urban System in the Philippines
A TRENDS IN URBANIZATION AND URBAN GROWTH
One of the significant phenomena that has characterized the development process in the
Philippines has been the explosive and unabated growth of urban areas. In the early part of
the post-war period in 1950, just a little more than 5 million, or about one-fourth (27.1
percent) of Filipinos were found residing in urban areas. Four decades later, the country’s
urban population surged to well over 29 million, or almost one-half (48.8 percent) of the
country’s total population. By 2005, the urban population totalled more than 53 million, or
over 60 percent of the country’s population in that year. It has been projected that an
overwhelming 117 million, or about 84 percent of Filipinos will be residing in urban areas by
2050 (Figure 2.1)
0
10
20
30
40
50
60
70
80
90
100
110
120
130
140
1950 1960 1970 1980 1990 2000 2010 2020 2030 2040 2050
Year
Po
pu
lati
on
(in
millio
ns)
0
10
20
30
40
50
60
70
80
90
Perc
en
t
Urban population Rural Population % Urban
Figure 2.1: Urban and Rural Population Growth Source: UN World Urbanization Prospects: The 2007 Revision
Figure 2.2 presents data on urbanization levels of the country by region. As shown, Metro
Manila (also known as the National Capital Region or NCR) has long been 100 percent
urban. The other regions that have high levels of urban populations are those adjacent to
Metro Manila (Regions III and IV) which reflects a process of “suburbanization” and
dispersion of economic activities from the metropolis. Relatively high levels of urbanization

8
can also be seen in Region X and Region VII where growing metropolitan areas (Davao and
Cebu, respectively) are located.
48
100
30.6
37.8
25.9
60
51.1
32.3
35.8
40.5
31.2
30.1
42.8
49.1
25.1
0 10 20 30 40 50 60 70 80 90 100 110
Philippines
NCR
CAR
I
II
III
IV
V
VI
VII
VIII
IX
X
XI
XII
Reg
ion
s
Percentage
Figure 2.2: Urbanization Levels by Region, 2000 Source: National Framework for Physical Planning 2001-2030 (2002)
A related phenomenon is the continuing “primacy” of Metro Manila. In 1980, the population
of Metro Manila was recorded at 5.9 million. Growing rapidly into a primate metropolis, the
capital region’s population reached 7.9 million in 1990, about 9.9 million in 2000, and more
than 11.5 million in 2007, or easily over 13 percent of the Philippines’ total population (Table
2.1). Latest figures in 2007 show that the population density of Metro Manila is more than
18,000 people per square kilometer, three times that of the city-state of Singapore and more
than 60 times the national average.
Table 2.1. Comparative Population Growth and Density, Philippines and Metro Manila
Year Philippines Metro Manila
Total Pop Density Population % Share to Total Pop
Density
1980 48,098,460 141 5,926,000 12 9,565
1985 54,668,332 161 6,942,204 13 11,206
1990 60,703,206 178 7,948,392 13 12,830
1995 68,616,536 201 9,454,040 14 15,260
2000 76,504,077 225 9,932,560 13 16,032
2007 88,574,614 260 11,553,427 13 18,650
Source: Philippine Yearbook (NSO), various years
9
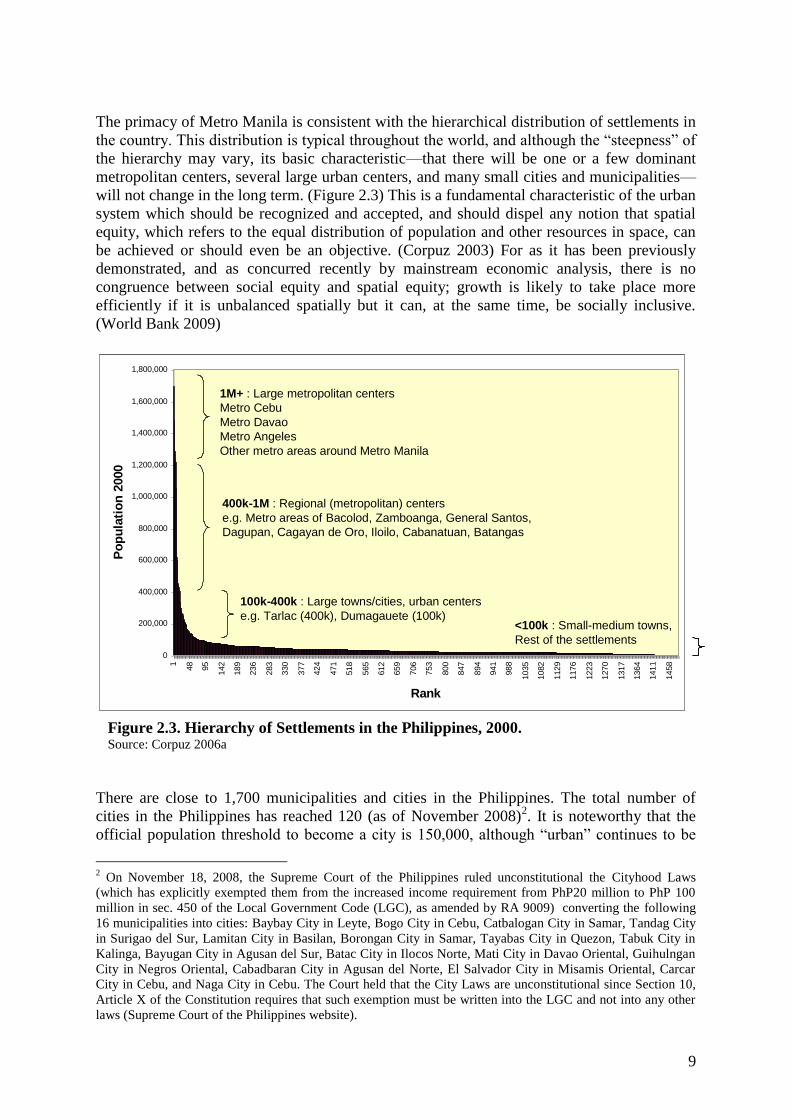
The primacy of Metro Manila is consistent with the hierarchical distribution of settlements in
the country. This distribution is typical throughout the world, and although the “steepness” of
the hierarchy may vary, its basic characteristic—that there will be one or a few dominant
metropolitan centers, several large urban centers, and many small cities and municipalities—
will not change in the long term. (Figure 2.3) This is a fundamental characteristic of the urban
system which should be recognized and accepted, and should dispel any notion that spatial
equity, which refers to the equal distribution of population and other resources in space, can
be achieved or should even be an objective. (Corpuz 2003) For as it has been previously
demonstrated, and as concurred recently by mainstream economic analysis, there is no
congruence between social equity and spatial equity; growth is likely to take place more
efficiently if it is unbalanced spatially but it can, at the same time, be socially inclusive.
(World Bank 2009)
Figure 2.3. Hierarchy of Settlements in the Philippines, 2000. Source: Corpuz 2006a
There are close to 1,700 municipalities and cities in the Philippines. The total number of
cities in the Philippines has reached 120 (as of November 2008)2. It is noteworthy that the
official population threshold to become a city is 150,000, although “urban” continues to be
2 On November 18, 2008, the Supreme Court of the Philippines ruled unconstitutional the Cityhood Laws
(which has explicitly exempted them from the increased income requirement from PhP20 million to PhP 100
million in sec. 450 of the Local Government Code (LGC), as amended by RA 9009) converting the following
16 municipalities into cities: Baybay City in Leyte, Bogo City in Cebu, Catbalogan City in Samar, Tandag City
in Surigao del Sur, Lamitan City in Basilan, Borongan City in Samar, Tayabas City in Quezon, Tabuk City in
Kalinga, Bayugan City in Agusan del Sur, Batac City in Ilocos Norte, Mati City in Davao Oriental, Guihulngan
City in Negros Oriental, Cabadbaran City in Agusan del Norte, El Salvador City in Misamis Oriental, Carcar
City in Cebu, and Naga City in Cebu. The Court held that the City Laws are unconstitutional since Section 10,
Article X of the Constitution requires that such exemption must be written into the LGC and not into any other
laws (Supreme Court of the Philippines website).
0
200,000
400,000
600,000
800,000
1,000,000
1,200,000
1,400,000
1,600,000
1,800,000
1
48
95
142
189
236
283
330
377
424
471
518
565
612
659
706
753
800
847
894
941
988
1035
1082
1129
1176
1223
1270
1317
1364
141
1
1458
Rank
Po
pu
lati
on
2000
1M+ : Large metropolitan centers
Metro Cebu
Metro Davao
Metro Angeles
Other metro areas around Metro Manila
400k-1M : Regional (metropolitan) centers
e.g. Metro areas of Bacolod, Zamboanga, General Santos,
Dagupan, Cagayan de Oro, Iloilo, Cabanatuan, Batangas
100k-400k : Large towns/cities, urban centers
e.g. Tarlac (400k), Dumagauete (100k)<100k : Small-medium towns,
Rest of the settlements

10
defined, in part, as localities having populations of only over 50,000. In this regard, studies
have shown that there could be as many as 600 urban areas by the year 2020 (ADB 1999).
As a whole, the Philippines continues to experience substantial rural-urban migration. As
noted in NEDA (2002), in-migration is expected to accelerate especially in Metro Manila and
its surrounding regions (Region III and Region IV), at least to the year 2020. Large urban
areas in these regions have reached population and density levels that reflect significant scale
and agglomeration economies. Consequently, they are expected to attract an increasing
number of rural-urban migrants in the years to come.
Clearly, rural-urban migration is a major contributor to the explosive growth of urban areas.
This is readily apparent in the fact that while natural increase has, over the years, been
generally higher for rural areas, urban populations as a whole have increased much faster
than rural populations, a trend that seems to characterize most countries in East Asia. From
1950 to 2000, urban populations in the Philippines grew at an average of about three percent
(3%) compared to a much lower one percent (1%) for rural populations.
In the context of these trends, the future well-being of Filipinos will depend largely on the
performance and efficiency of urban areas. In the words of a related study, urban areas in the
Philippines are “beacons of opportunity” (Webster, Corpuz and Pablo, 2003). For instance,
incomes in urban areas have been estimated to be 2.3 times that of rural areas. Available data
also seem to suggest that urban areas are the engines of the country’s growth, accounting for
a large proportion of the country’s economic output (about 75 percent) and household
expenditure (about 67 percent) in 2003 (Webster, Corpuz and Pablo, 2003). The contribution
of urban areas to the country’s economic growth seems even larger. In 2007, Metro Manila
alone accounted for 33 percent of GDP. The massive and continuing rural-urban migration
flows can obviously be attributed to the fact that urban areas offer opportunities for the rural
poor.
It is largely in urban areas where job opportunities are sought, socio-economic mobility is
achieved, and where most innovations are introduced. The Philippines has been transformed
into an urban economy where most economic activity now emanates from the industry and
services sectors. At the same time, agricultural employment (including the forestry and
fisheries sectors) is in absolute decline and, in recent years, employment has largely been
generated by the non-agricultural sector. Thus, the prospects for overall economic growth and
employment creation would seem to rest, in the future, on the productivity, efficiency and
performance of the urban areas.
And yet, the performance and efficiency of the Philippine urban system in the past two
decades or so have not been very encouraging especially when compared with other countries
in the region. There appear to be critical issues and problems that hamper the performance
and competitiveness of urban areas in the Philippines. These problems relate to such concerns
as inadequate infrastructure, overcrowding and congestion, strained basic urban services such
as health and sanitation, water and air pollution, slums and squatter settlements, poor urban
land management, etc. which have been compounded by weak governance and financial
capacities that obviously undermine efforts at coping with the problems associated with urban
growth. At the same time, previous initiatives to enhance private sector participation and
sustainability in financing urban infrastructure and services have generally produced less than
satisfactory results.

11
The challenge for the future is to squarely address these issues and problems in order to
develop an urban system that enhances economic production, strengthens overall global
competitiveness, promotes rural-urban and economic linkages and connectivity, engenders an
urban governance and financial capacity that can effectively address the wide range of urban
issues and concerns, and substantially contributes to improvement of the quality of life for all
urban residents. In the section that follows, a more detailed documentation of the status and
performance of the Philippine urban system will be presented. It will be organized in terms of
the following major themes: (a) economic performance; (b) efficiency in addressing social
concerns; and (c) adequacy of physical and infrastructure facilities.
B PERFORMANCE AND EFFICIENCY OF URBAN AREAS
1. Economic Indicators
As previously noted, the Philippine economy has been transformed from
predominantly agricultural to an urban economy. The share of urban-based services
and industry sectors has expanded from 28 percent in the 1980s to 77 percent in the
1990s to well over 80 percent in 2000. In fact, the contribution of the services sector
alone rose to more than 50 percent in the same year. And as early as 1987, the share
derived from the industrial sector was about 30 percent (NSO 2001).
At the national level, the data presented in Table 2.2 clearly substantiates the
dominance of the industry and service sectors. In 2007, these two sectors combined
contributed well over 85 percent of the country’s GDP. It is noteworthy, however, that
through the years, GDP growth can largely be attributed to the expansion of the
service sector. Unlike the more advanced industrial countries in the world, the share
of the service sector to GDP in the Philippines has been substantially higher than the
industry sector.
Table 2.2. Gross Domestic Product by Industrial Origin at Current Prices (in
millions pesos)
Year
Agri., Fishery, Forestry
Industry Sector Service Sector
GDP
Amount % Share to GDP
Amount % Share to GDP
Amount % Share to GDP
1997 457983 18.9 779786 32.1 1188974 49.0 2426743
1998 451645 16.9 838367 31.5 1375048 51.6 2665060
1999 510494 17.1 911074 30.6 1555337 52.2 2976905
2000 528868 15.8 1082431 32.3 1743428 52.0 3354727
2001 549113 15.1 1149120 31.6 1933241 53.2 3631474
2002 598849 15.1 1261635 31.8 2103388 53.1 3963873
2003 631970 14.6 1378870 31.9 2305562 53.4 4316402
2004 734171 15.1 1544351 31.7 2593032 53.2 4871555
2005 780072 14.3 1735148 31.9 2922685 53.7 5437905
2006 855452 14.2 1907980 31.6 3269192 54.2 6032624
2007 937342 14.1 2082735 31.3 3631243 54.6 6651320
Data Source: Economic and Social Statistics Office, National Statistical Coordination Board
Even more noteworthy is the fact that despite programs and policies aimed at
reducing the economic primacy of Metro Manila (e.g., industrial dispersal, regional

12
growth centers, ECOZONES in other parts of the country) the capital region
continues to dominate the national economy. The contribution of Metro Manila to the
GDP was 33.0 percent in 2007. Such a contribution was even higher in 2000, when
the National Capital Region accounted for 43.5 percent of GDP growth. Beyond
handling the largest volumes of international trade and transactions, available
evidence (NSCB, 2005) reveals that Metro Manila also accounts for the largest
regional shares in financial services (78 percent) transportation, communication and
storage sector (over 50.0 percent), services (45.0 percent) and the industrial sector
(38.0 percent).
It is important to note that the manufacturing and services sector in the country
continues to be dominated by the small and medium size enterprises (SME). In fact,
the SME sector is considered to be the backbone of the Philippine economy since
SMEs account for 99.6% of all registered firms nationwide, and employ about 70% of
the country’s labor force (DTI 2008). A major constraint in respect to SMEs is the
small volume of credit financing available. Moreover, although a number of credit
facilities for SMEs exist, there appear to be problems associated with the
disbursement of funds. Credit utilization is relatively low, and innovative mechanisms
must be considered by the government (including disbursement through non-
government organizations) to facilitate and encourage access to credit.
Largely through its urban areas, the country has attracted foreign direct investments.
Over a six-year period, total approved foreign direct investments (FDIs) in the
country reached its peak at Php 173.9 billion in 2004, decreased to Php 95.8 billion in
2005 (a considerable decline of 44.9 percent) but rose again to Php 165.8 billion in
2006 (Table 2.3). Clearly attributable to the recent economic meltdown, FDIs dropped
sharply from January to August in the current year.
Reflecting its economic dominance, a very high percentage (over 60 percent) of FDI
enterprises in the country are located in Metro Manila. Much smaller proportions are
located in large urban areas in Region IV, Region III and Region VII. But precisely
because of its FDI and export market orientation, many observers feel that the
Philippines is particularly vulnerable to external economic shocks. The Philippine
economy also lacks diversification, with investments coming mostly from the US and
Japan. Conversely, Philippine exports are destined mainly to these two countries.
Table 2.3. Total Approved Foreign Direct Investments by Promotion Agency,
2001-2006 (in million pesos)
Agency 2001 2002 2003 2004 2005 2006
Board of Investments
29,042.9
8,815.1
8,348.5
127,889.0
43,796.9
36,557.0
Philippine Economic Zone Authority
32,399.7
22,796.1
24,922.8
41,536.8
49,842.2
52,338.2
Subic Bay Metro Authority
287.7
746.7
365.3
2,314.8
838.7
68,901.7
Clark Development Corporation
705.8
13,690.7
373.8
2,154.6
1,329.0
8,083.1
Total
62,436.1
46,048.6
34,010.4
173,895.2
95,806.8
165,880.0
Source: Philippine Statistical Yearbook (2007)

13
Although still relatively small, perhaps one of the most promising and rapidly
growing economic areas in the country is the Information and Communications
Technology (ICT) services sector. In part because the Philippine government has
actively promoted ICT services, there are now 129 ICT parks/buildings in the country.
Earnings from selected ICT sectors grew from US 249 million dollars in 2001 to more
than US 2.1 billion dollars in 2005 with the Customer Contact Center accounting for
more than three-fourths of these earnings (Table 2.4). As of 2005, there were 223,500
persons employed in the ICT sector, with the Customer Contact Center accounting for
the overwhelming majority (Table 2.5).
Table 2.4. Earnings from Selected ICT Sectors, 2001, 2004-2005 (million dollars)
ICT Sector 2001 2004 2005
Customer Contact Center 173 864 1,600
Medical Transcription 40 483 70
Software Development 115 268 204
Animation 21 40 54
BPO 180
Total 249 1,655 2,108
Source: Philippine Strategic Roadmap for the Information & Communications Sector (2006)
Table 2.5. Number of Firms and Employees per ICT Sector
ICT Sector No. of Firms No. of Employees
Animation* 40 4,500
BPO 60 22,500
Customer Contact Center 112 179,000
Medical Transcription 50 5,500
Software Development 300 12,000
Total 562 223,500
Source: Philippine Strategic Roadmap for the ICT Sector (2006)
*Note: 1st quarter of 2006 data, all else are as of 2005
Indeed, growth in the contact (call) center industry has been almost exponential with
earnings in the sector surging from US$173 million in 2001 to US$1.6 billion in
2005, or almost a nine-fold increase within a four-year period. One reason why IT
investors are attracted to the Philippines is the relatively cheap cost of skilled labor. It
has been estimated that IT investors can save more than 60 percent on skilled software
developers in the Philippines, and up to 80 percent of college educated, English-
proficient Filipino workers in contact centers.
2. Social Indicators
a. Poverty
Poverty reduction in the Philippines has generally been modest with the
proportion of poor families declining from 44.2 percent in 1985, to 33.7
percent in 2000 (Table 2.6) In fact, over the same period, the absolute number
of poor families increased from 4.6 million in 1985 to 5.1 million in 2000.
Also noteworthy is the fact that following the 1997 Asian economic crisis,
poverty incidence in the country rose slightly to 33.7 percent in 2000.

14
The evidence presented in Table 2.7 likewise documents the clear disparities
in poverty reduction between urban and rural areas. In 2000, for instance,
poverty incidence in urban areas was only 19.9 percent as compared to a much
higher 46.9 percent in rural areas. Apparently, poverty reduction is occurring
mainly in urban areas. As noted by other scholars, poverty seems to be largely
a rural phenomenon (Balisacan, 2001)
Table 2.6. Poverty Incidence in the Philippines
Year Philippines Urban Rural
1985 44.2 33.6 50.7
1988 40.2 30.1 46.3
1991 39.9 31.1 48.6
1994 35.5 24.0 47.0
1997 31.8 17.9 44.4
2000 33.7 19.9 46.9
Source: ADB, Poverty in the Philippines: Income, Assets and Access (2005)
The data reveal that poverty incidence was lowest for the most urbanized
National Capital Region (8.7 percent) and, to some extent, in Central Luzon
(29.5 percent) and Southern Tagalog (18.6 percent) or the regions surrounding
Metro Manila. They also show that poverty levels have decelerated much
faster for Metro Manila over the 15-year period. On the other hand, poverty
incidence had been much higher in the predominantly rural regions. In the
rural Autonomous Region of Muslim Mindanao (ARMM), poverty incidence,
in fact, rose from 50.7 percent in 1991, to a high 66.0 percent in 2000.
Table 2.7. Philippine Poverty Incidence by Region
Region 1985 1988 1991 1994 1997 2000
Philippines 44.2 40.2 39.9 35.5 31.8 33.7
NCR 23.0 21.6 13.2 8.0 6.4 8.7
1 – Ilocos 37.5 44.9 48.4 47.9 37.8 37.1
2 – Cagayan Valley 37.8 40.4 43.3 35.5 32.1 29.5
3 - Central Luzon 27.7 29.3 31.1 25.2 15.4 18.6
4 – Southern Tagalog 40.3 41.1 37.9 29.7 25.7 25.3
5 – Bicol 60.5 54.5 55.0 55.1 50.1 55.4
6 - Western Visayas 59.9 49.4 45.3 43.0 39.9 43.1
7 - Central Visayas 57.4 46.8 41.7 32.7 34.4 38.8
8 - Eastern Visayas 59.0 48.9 40.1 37.9 40.8 43.6
9 - Western Mindanao 54.3 38.7 49.7 44.7 40.1 46.6
10 - Northern Mindanao 53.1 46.1 53.0 49.2 47.0 45.7
11 - Southern Mindanao 43.9 43.1 46.2 40.3 38.2 40.0
12 - Central Mindano 51.7 36.1 57.0 54.7 50.0 51.1
CAR 41.9 48.8 51.0 42.5 36.6
ARMM 50.7 60.0 57.3 66.0
Source of Basic Data: Family Income and Expenditure Surveys (1985-2000) Note: There is no
official poverty threshold in CARAGA. Thus, the provinces of CARA are grouped with
Region 10 (Agusan del Norte, Agusan del Sur and Surigao del Norte) or 11 (Surigao del Sur).
The urban-rural differential in poverty incidence is paralleled by the results of
a survey on “self-rated” poverty. As shown in Figure 2.4, a greater proportion
of respondents in rural areas consider themselves “poor” when compared with
urban respondents. Across the regions of the country, a higher percentage of
respondents in predominantly rural Mindanao consider themselves poor when
compared with their counterparts in Luzon, Visayas and the NCR (Figure 2.5).

15
Figure 2.4. Self-Rated Poverty, Urban vs. Rural Source: Social Weather Stations
Figure 2.5. Self-Rated Poverty by Location Source: Social Weather Stations
16
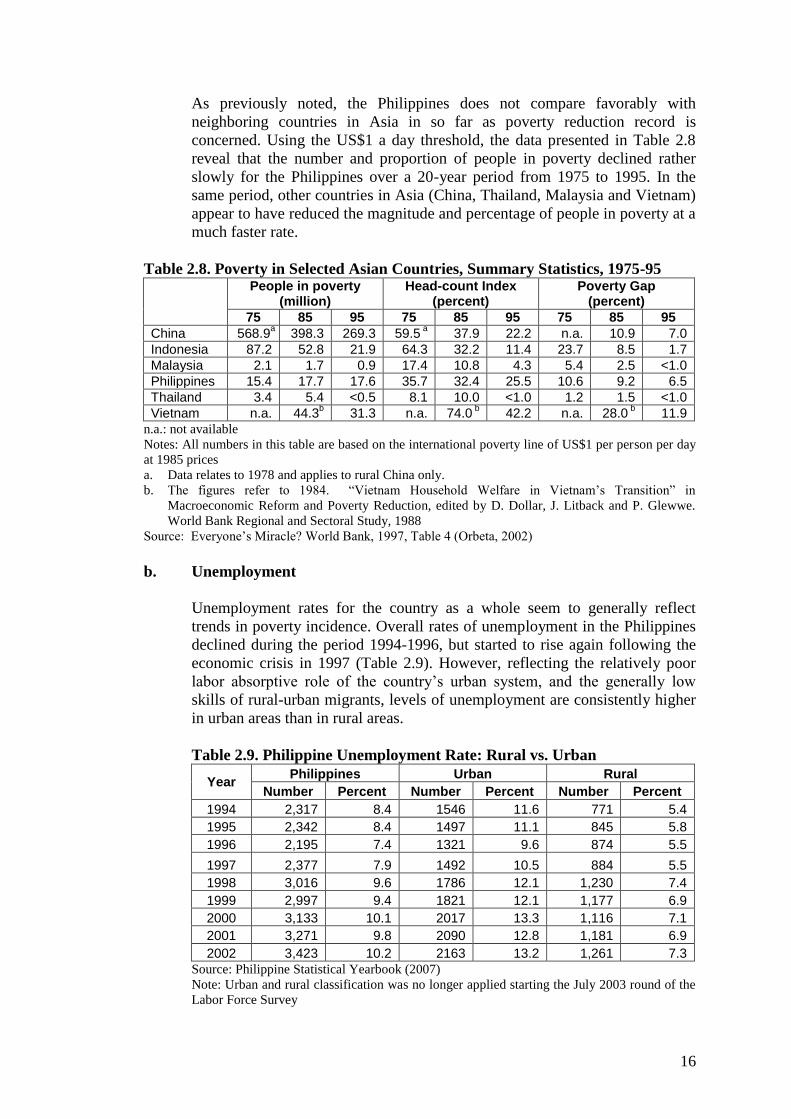
As previously noted, the Philippines does not compare favorably with
neighboring countries in Asia in so far as poverty reduction record is
concerned. Using the US$1 a day threshold, the data presented in Table 2.8
reveal that the number and proportion of people in poverty declined rather
slowly for the Philippines over a 20-year period from 1975 to 1995. In the
same period, other countries in Asia (China, Thailand, Malaysia and Vietnam)
appear to have reduced the magnitude and percentage of people in poverty at a
much faster rate.
Table 2.8. Poverty in Selected Asian Countries, Summary Statistics, 1975-95 People in poverty
(million) Head-count Index
(percent) Poverty Gap
(percent)
75 85 95 75 85 95 75 85 95
China 568.9a 398.3 269.3 59.5
a 37.9 22.2 n.a. 10.9 7.0
Indonesia 87.2 52.8 21.9 64.3 32.2 11.4 23.7 8.5 1.7
Malaysia 2.1 1.7 0.9 17.4 10.8 4.3 5.4 2.5 <1.0
Philippines 15.4 17.7 17.6 35.7 32.4 25.5 10.6 9.2 6.5
Thailand 3.4 5.4 <0.5 8.1 10.0 <1.0 1.2 1.5 <1.0
Vietnam n.a. 44.3b 31.3 n.a. 74.0
b 42.2 n.a. 28.0
b 11.9
n.a.: not available
Notes: All numbers in this table are based on the international poverty line of US$1 per person per day
at 1985 prices
a. Data relates to 1978 and applies to rural China only.
b. The figures refer to 1984. “Vietnam Household Welfare in Vietnam’s Transition” in
Macroeconomic Reform and Poverty Reduction, edited by D. Dollar, J. Litback and P. Glewwe.
World Bank Regional and Sectoral Study, 1988
Source: Everyone’s Miracle? World Bank, 1997, Table 4 (Orbeta, 2002)
b. Unemployment
Unemployment rates for the country as a whole seem to generally reflect
trends in poverty incidence. Overall rates of unemployment in the Philippines
declined during the period 1994-1996, but started to rise again following the
economic crisis in 1997 (Table 2.9). However, reflecting the relatively poor
labor absorptive role of the country’s urban system, and the generally low
skills of rural-urban migrants, levels of unemployment are consistently higher
in urban areas than in rural areas.
Table 2.9. Philippine Unemployment Rate: Rural vs. Urban
Year Philippines Urban Rural
Number Percent Number Percent Number Percent
1994 2,317 8.4 1546 11.6 771 5.4
1995 2,342 8.4 1497 11.1 845 5.8
1996 2,195 7.4 1321 9.6 874 5.5
1997 2,377 7.9 1492 10.5 884 5.5
1998 3,016 9.6 1786 12.1 1,230 7.4
1999 2,997 9.4 1821 12.1 1,177 6.9
2000 3,133 10.1 2017 13.3 1,116 7.1
2001 3,271 9.8 2090 12.8 1,181 6.9
2002 3,423 10.2 2163 13.2 1,261 7.3
Source: Philippine Statistical Yearbook (2007)
Note: Urban and rural classification was no longer applied starting the July 2003 round of the
Labor Force Survey

17
In 2002, the latest year when the urban and rural classification was still
applied for the recording of unemployment data, the unemployment rate for
urban areas was a high 13.2 percent, compared to a much lower 7.3 percent for
rural areas. In some years, especially the period following the 1997 economic
crisis, unemployment levels were even higher in Metro Manila.
Although the rural-urban differentials in levels of unemployment seem to have
persisted through the years, other studies have noted that underemployment is
higher for rural areas than for urban areas. As shown in Figure 2.6, the annual
underemployment rate for the period 1994-2006 has consistently been higher
for the Philippines as a whole than for Metro Manila. For instance, the
underemployment rate was only 13.2 percent in the NCR in 2006 compared to
a much higher 20.4 percent nationally in the same year.
0
5
10
15
20
25
Percent
Philippines 20.9 19.8 19.4 22.8 23.7 22.1 19.9 16.6 15.3 15.8 16.9 21.2 20.4
Metro Manila 7.7 6.0 5.9 13.7 19.4 15.6 10.4 10.2 7.8 9.3 12.5 13.2 13.2
1994 1995 1996 1997 1998 1999 2000 2001 2002 2003 2004 2005 2006
Figure 2.6. Underemployment Rate: Philippines and Metro Manila Source: Philippine Statistical Yearbook (2007)
c. Education
Available data on educational status are not very encouraging. Although
generally higher for Metro Manila, net participation rate in public and private
elementary and secondary schools drastically declined starting in 2002-2003
(Table 2.10). In the period 2005-2006, net participation rate in the country as a
whole was 74 for elementary and 45 for secondary. The comparative figures
for Metro Manila during the same period were 73 and 55, respectively. Even
more alarming are the reported backlogs in classrooms. In 2000, there was a
national shortage of more than 30,000 classrooms (NLUC 2000). Just as
discouraging is the evidence on teacher-pupil ratios which stood at well over
1:40 standard for all elementary schools in the country in 2001.

18
Table 2.10. Net Participation Rate in Public and Private Schools
Year Philippines Metro Manila
Elementary Secondary Elementary Secondary
1997-98 95 64 100 80
1998-99 96 65 93 82
1999-00 97 65 99 75
2000-01 97 66 100 79
2001-02 97 73 98 86
2002-03 90 58 97 74
2003-04* 82 47 77 56
2004-05* 76 43 75 52
2005-06* 74 45 73 55
Source: Philippine Statistical Yearbook (2007)
* Data for public school only
d. Health
Also worrisome is the health status of Filipinos. The data presented in Table
2.11 reveal that infant mortality rates are extremely high for the country as a
whole.
Table 2.11. Infant Mortality Rate by Region
Region 1990 1995 2003
PHILIPPINES 57 49 30
Metro Manila 46 32 24
CAR 63 55 14
1 - Ilocos Region 56 46 29
2 - Cagayan Valley 62 54 28
3 - Central Luzon 45 40 25
4a – CALABARZON 25
4b – MIMAROPA 44
5 - Bicol Region 64 58 28
6 - Western Visayas 61 55 39
7 - Central Visayas 55 47 28
8 - Eastern Visayas 76 64 36
9 - Western Mindanao 64 59 27
10 - Northern Mindanao 57 54 38
11 - Southern Mindanao 56 52 38
12 - Central Mindanao 56 54 27
13 – Caraga 35
ARMM 74 63 41
Source: Philippine Statistical Yearbook (2007)
They are, however, much lower for Metro Manila. Curiously, and especially
for the 1995-2003 period, infant mortality rates have declined faster for the
country as a whole than for Metro Manila. The backlogs in social
infrastructure for health are likewise extremely high.

19
e. Housing and Informal Settlements
In the Philippine context, the housing problem is largely an urban
phenomenon. The magnitude of the housing need (defined as backlog plus
new households) is staggering and has been estimated to reach more than 3.7
million in 2010 (Table 2.12). In Metro Manila alone, the total backlog (to
include new households) has been projected to reach close to 500,000 units.
Addressing this backlog would roughly require about 3,000 hectares of land if
designed to accommodate detached housing units, a prospect that seem to
suggest that a higher density housing strategy is needed if the housing deficit
is to be effectively addressed. Beyond the provision of housing by the public
sector, new approaches must obviously be found especially since rural-urban
migration is expected to continue in the next few decades and would
exacerbate the housing problem.
Table 2.12. Housing Need Per Region, 2005-2010
2005 2006 2007 2008 2009 2010 Total
NCR 58,412 82,182 82,434 82,689 82,946 83,206 83,469 496,928
CAR 1,309 6,494 6,589 6,685 6,783 6,882 6,984 40,416
I 5,556 25,027 25,446 25,874 26,310 26,757 27,212 156,626
II 4,078 17,725 18,032 18,346 18,667 18,995 19,330 111,094
III 12,569 71,938 73,837 75,798 77,821 79,909 82,064 461,368
IV 23,827 127,872 131,742 135,757 139,920 144,239 148,718 828,248
V 12,267 28,288 28,557 28,830 29,109 29,392 29,679 173,855
VI 16,816 36,941 37,255 37,574 37,898 38,227 38,561 226,455
VII 10,578 45,880 46,865 47,877 48,918 49,988 51,087 290,616
VIII 7,281 18,766 18,940 19,116 19,294 19,476 19,660 115,252
IX 7,642 21,824 22,133 22,449 22,772 23,101 23,438 135,717
X 5,912 18,880 19,164 19,455 19,751 20,054 20,364 117,668
XI 11,158 41,922 42,722 43,542 44,384 45,248 46,134 263,952
XII 6,661 18,033 18,270 18,511 18,758 19,009 19,266 111,847
ARMM 5,126 22,800 23,482 24,190 24,926 25,691 26,484 147,574
CARAGA 5,942 12,791 12,902 13,016 13,131 13,248 13,367 78,456
Total 195,133 597,362 608,370 619,708 631,389 643,422 655,821 3,756,072
Backlog + New HouseholdsAnnual
BacklogRegion
Source: HUDCC
It is important to note that the increasing housing deficit can, in part, be
attributed to the fact that shelter and finance agencies had, through the years,
fallen short of their accomplishment targets. Except for the HDMF which has
surpassed its accomplishment targets, the performance of other agencies had
been less than satisfactory. (Table 2.13) There appears to be significant
progress in reducing the processing time for housing loan applications by
HDMF (Figure 2.7). At the same time, however, the total amount of housing
loans extended appears to remain at relatively low levels when measured
against total housing need. In 2006, for instance, the total amount of loans
extended was over P15 billion (Table 2.14) well short of addressing the
housing backlog which was estimated to be more than 608,000 housing units
in the same year.

20
Table 2.13. Number of Shelter Security Units Constructed, Financed
and/or Administered by the Government Year NHA NHMFC HDMF HGC Total
1996 27,828 14,668 69,265 71,898 183,679
1997 45,793 14,591 88,148 84,134 232,666
1998 32,875 11,102 52,670 48,962 145,609
1999 40,201 6,286 33,273 11,000 90,760
2000 42,807 6,088 23,944 75,282 148,121
2001 27,350 9,457 25,947 33,241 95,995
2002 22,683 12,331 19,125 28,651 82,790
2003 16,132 14,026 48,636 35,012 113,806
2004 11,443 14,137 56,550 17,167 99,297
2005 43,229 12,710 53,421 5,496 114,856
Targets for 2005* 55,000 15,360 44,716 24,822 139,898
Accomplishment
Rate (%) 78.60 82.75 119.47 22.14 82.10
Source: HUDCC; Philippine Statistical Yearbook (2007); * MTPDP Chapter on Housing
Construction
30
15 15
0
5
10
15
20
25
30
35
2004 2005 2006
Year
No
.o
f d
ay
s
Figure 2.7. Processing Time for Loan Applications Source: HDMF as cited in the Philippine Statistical Yearbook (2007)

21
Table 2.14. Housing Loan Granted Under the PAG-IBIG Expanded Housing Loan
Program by Region (Amount in thousand pesos)
Region 1998 1999 2000 2001 2002 2003 2004 2005 2006
NCR 7,040,110 4,202,762 3,544,312 2,130,213 2,859,400 5,291,064 8,809,659 8,531,129 9,093,025
CAR 166,317 150,133 98,771
1 – Ilocos 159,072 116,861 53,707 92,838 190,863 264,281 112,059 187,006 236,552
2 – Cagayan Valley 92,235 121,916 51,691 78,439 102,569 182,219 416,136 512,435 382,947
3 - Central Luzon 339,148 257,779 219,428 223,130 351,956 901,642 1,823,353 1,811,869 1,573,631
4 – Southern Tagalog 246,645 206,132 161,245 114,716 198,970 316,621 596,387 727,157 63,132
5 – Bicol 248,158 146,540 82,332 147,763 199,196 257,163 336,205 295,158 261,399
6 - Western Visayas 381,181 308,326 242,101 240,767 396,433 479,440 536,059 614,865 752,203
7 - Central Visayas 344,161 296,322 151,599 173,204 340,516 481,630 606,571 843,701 1,027,238
8 - Eastern Visayas 233,957 200,753 98,495 103,047 122,528 144,784 166,530 152,797 229,472
9 - Western Mindanao 180,873 122,370 59,752 55,089 84,039 85,717 155,801 198,982 324,633
10 - Northern Mindanao 369,001 325,740 146,020 140,625 199,036 362,638 352,191 299,744 459,502
11 - Southern Mindanao 562,118 500,699 224,816 288,314 326,212 527,439 552,423 716,091 645,327
12 - Central Mindano 153,851 185,872 53,522 43,109 30,315 29,631 60,597 126,766 109,569
13 - Caraga 96,499 123,413 270,236
ARMM
Total 10,350,510 6,994,072 5,089,020 3,831,254 5,402,033 9,324,269 14,786,787 15,291,246 15,527,637 Source: Philippine Statistical Yearbook (2007)
And nowhere is the housing problem more evident than in the phenomenon of
slums and squatter settlements. Recent estimates show that more than a third
of urban populations reside in slum areas and squatter settlements. In Metro
Manila, a little less than 4 out of every 10 residents are living in slums and
squatter settlements in 2002 (Ragrario, 2004). Even a cursory examination of
these informal settlements would readily reveal that these communities are
characterized by unsanitary conditions and health hazards, extreme
overcrowding and congestion, and limited or no access to basic urban services.
Although resettlement and relocation programs have been implemented
especially in the 1990s, many of these programs have had limited success in
regard to the provision of livelihood opportunities. In the meantime, housing
construction projects had fallen drastically during the same period.
3. Physical Development
a. Urban Expansion and Density
An immediate consequence of the explosive rate of urbanization and rural-
urban migration has been the conversion of land to urban uses. There are no
recent and firm estimates of urban land expansion. However, the little
evidence that exists seems to suggest that, overall, urban land expansion in the
country is rapid. In 1982, the total urban land area in the country was
estimated to be less than 860,000 hectares. By 1986, the urban land area
increased to more than one million hectares (Cariño, B. and Cariño, L., 2007).
In more recent years, the encroachment of urban areas into thousands of
hectares of agricultural lands is quite obvious especially in the
CALABARZON area. The data presented in Table 2.15 indicate that as of

22
2006, more than 46,000 hectares of agricultural land have been approved for
conversion into non-agricultural uses.
Table 2.15. Agricultural Land Conversion into Non-Agricultural
Purposes as of December 2006 (in hectares)
Region Total
Agricultural Area
Total Approved Conversions
Percent
Philippines 4,217,868 46,648 1.11
CAR 133,176 257 0.19
I 351,355 1,344 0.38
II 478,711 500 0.10
III 553,081 10,208 1.85
IV 119,033 18,923 15.90
V 101,953 2,140 2.10
VI 289,845 3,067 1.06
VII 101,653 1,142 1.12
VIII 172,301 694 0.40
IX 83,440 313 0.38
X 194,145 1,823 0.94
XI 338,982 4,372 1.29
XII 163,882 1,387 0.85
XIII 517,446 283 0.05
ARMM 565,219 107 0.02
NCR 53,646 88 0.16
Sources: Cariño, Benjamin and Cariño, Ledivina. Urbanization, Industrialization and Land
Conversion in the Philippines: Policy Issues and Problems (2007); CARP Briefer and
Statistical Handbook (2006); and Philippine Statistical Yearbook (2007)
Population density in large urban centers is likewise extremely high. As of
2007, Metro Manila had an average population density of 18,650 persons per
square kilometer, up from its population density of around 16,032 per square
kilometer in 2000. The comparable figures for the country as a whole are
much lower: 225 per square kilometer in 2000, and 260 in 2007.
b. Urban Transportation
One of the most critical problems of large urban areas has to do with traffic
and the high cost of moving people. In Metro Manila, for instance, there were
more than 1.5 million registered vehicles in 2006, representing close to 30
percent of the total number of registered vehicles in the country as a whole
(Table 2.16). In the meantime, no new high capacity transit facilities (e.g.
LRT, MRT, BRT) have been added to the system since the 1990s and road
construction has been limited and, generally, has not kept pace with the
number of vehicles. For this reason, traffic congestion has become chronic in
the Metro Manila. As observed in another study (Webster, Corpuz and Pablo,
2003), traffic in Metro Manila moves at an average of 12 kph at peak hours,
much slower when compared to such cities as Jakarta (26 kph), Shanghai (25
kph) and Bangkok (21 kph). Overall, efforts to improve public transportation
service have been insufficient and sporadic.

23
Table 2.16. Number of Registered Vehicles
2005 2006
Philippines 5,059,753 5,331,574
New 760,580 781,741
Renewal 4,299,173 4,549,833
Metro Manila 1,580,753 1,555,174
New 217,890 209,923
Renewal 1,362,863 1,345,251
% to National Total 31 29
Culled from 2007 Philippine Statistical Yearbook
c. Air Pollution
Partly because of the high number of vehicles, air pollution has become a
problem, at least in some parts of Metro Manila. Data from the Ambient Air
Monitoring of the Environmental Management Bureau reveal that as of June
2008, the NCR, on the average, registered a total suspended particulates (TSP)
level of 170ug/Ncm (Table 2.17). It is important to note that while NCR’s
average as well as each of the city’s average seem to be within the standard of
230ug/Ncm, certain parts (monitoring stations) of Pasay, Valenzuela, Manila
and Makati show TSP levels that are above the acceptable standards.
Table 2.17. Pollution Levels in Metro Manila Cities (June 2006 - June
2008)
Cities Jun '06 Jan '07 Jun '07 Jan '08 Jun '08
Pasay 326 226 277 277 276
Valenzuela 198 243 231 179 263
Manila 102 178 127 122 198
Mandaluyong 122 142 175 119 175
NPO 166 135 130 119 122
Makati 157 143 87 207 120
Quezon City 135 111 94 139 113
Pasig 82 72 144 102 96
Average 161 156 158 158 170
Data Source: Ambient Air Monitoring, Environmental Management Bureau
Air quality has generally deteriorated, particularly from the period June 2006
to January 2008, (Figure 2.8) despite some initiatives to counter it like the
implementation of the Biofuels Act of 2007 (RA 9367), which mandated a one
percent (1%) blending of coco-biodiesel. Although the Asian Institute of
Petroleum Studies Inc. (Aipsi) noted that as DENR records show, there has
been a 17% reduction in TSP and PM10 levels during the second quarter of
2007, and a 24.2% drop during the third quarter, more recently data from the
EMB reveal that NCR’s average pollution level increased by 7 percent
between January 2008 and June 2008. This fact clearly suggests that the use of
biofuels may not be the only aspect to consider in addressing air pollution, and
the current usage level of ethanol may not be substantial to significantly
address the problem. Implementation of other strategies (e.g., strict

24
enforcement of the “smoke belching” test for registering vehicles) must be
strengthened.
0
50
100
150
200
250
300
350
Jun '06 Jan '07 Jun '07 Jan '08 Jun '08
TS
P l
evel
(ug
/Ncm
)Pasay
Valenzuela
Manila
Mandaluyong
Makati
Pasig
QC
NPO
Figure 2.8. Pollution Levels in Metro Manila (June 2006 – June 2008) Data Source: Ambient Air Monitoring, Environmental Management Bureau
A related study (Krupnick, Morgernstern, et. al, 2003) observed that the
location of the Philippines makes it impervious from emissions from the
western countries as well as emissions from the so-called yellow sands (loess)
that affects other East Asian countries like Japan and Korea (2003). Air
quality problems in the country, they deduced, are generated domestically,
either from stationary (industrial plants) or mobile (vehicles) sources.
d. Solid Waste Disposal
Solid waste management is a pervasive problem in most urban areas in the
country. While solid waste collection is generally more efficient in urban areas
than in rural areas, waste generation also tends to be higher in urban areas
(0.5-0.7 kg per capita versus 0.3 kg in rural areas). An extremely inadequate
solid waste management program contributes to a very serious environmental
problem in Metro Manila. On a daily basis in 2008, about 7,000 tons of solid
wastes are generated in the capital region (National Solid Waste Management
Commission). Of these, only about 700 tons per day are recycled or
composted. The balance of around 6,000 tons are either a) hauled to the city’s
dump sites, b) dumped into creeks, canals and rivers, c) burned thereby
contributing to air pollution, or d) otherwise left on streets, creating
considerable health hazards. The most immediate consequence is the
lamentable situation of decay and stench.
Proper disposal of medical wastes pose another challenge. ADB reported that
of the estimated 47 tons of medical wastes being generated each day by health

25
care facilities (about 3,700) in Metro Manila, more than half of it, or 26 tons
are considered potentially infectious (ADB 2004). The danger lies in the fact
that a considerable portion of these wastes (e.g., used syringes, infected
bandages) form part of the heap of garbage one sees in open dump sites, hence
posing danger to those who may come in contact.
e. Water Supply and Sewerage
The supply of potable water in urban areas is likewise lamentable. In 2004,
only about 58 percent of households in urban areas had access to drinking
water (World Health Organization, 2006). Nationally, just over 20 percent of
urban households have piped water. The situation in urban areas has, however,
improved in recent years. Piped water system coverage has increased from 44
percent in 1993 to 51 percent in 2003 (World Health Organization and
UNICEF, 2006).
The percentage of urban households with connections to wastewater facilities
is even smaller. In 2004, only about 7 percent of urban households were linked
to a central sewerage collection system (World Health Organization, 2006).
The overwhelming majority of the urban population relies on septic tanks
which are often improperly constructed, or otherwise poorly maintained. In
many cases as well, industrial establishments in urban areas have no
wastewater treatment resulting in water pollution problems in many parts of
the country.
Water pollution is very evident in Metro Manila. It has been reported as early
as the 1990s that all four water bodies in the metropolis (Pasig-Marikina,
Navotas-Malabon-Tullaban-Tenejeros, Manila Bay, and Laguna Lake) are
polluted and considered “biologically” dead except for the upstream portion of
Marikina river. All pollutants generated in Metro Manila eventually drain into
Manila Bay which has shown signs of ecological distress.
Briefly, then, whether measured in terms of economic competitiveness, social
indicators such as poverty and unemployment, physical development and
transportation efficiency, the performance of urban areas in the last two decades or so,
has not been very encouraging, especially when compared with other urban centers in
the Asian region. In the context of the expected continuing growth of urban areas at
least in the next 20 years, a critical development challenge for the future is to improve
the efficiency of urban areas as catalyst for growth and innovation, and as primary
agents for poverty reduction, job creation and upward mobility. In the sections that
follow, drivers of the urban system issues and problems in the country will be
examined.
26
Chapter III
Drivers of the Urban System
A EXTERNAL DRIVERS
There is not much that the Philippines can do to directly alter external drivers of the urban
system but the way we respond to them can significantly affect us, including how our urban-
based economy performs and ultimately how the welfare of Filipinos, not just in the cities but
throughout the country, is affected. Monitoring and anticipating the events surrounding these
drivers are, therefore, important in order to manage constraints, minimize negative impacts or
maximize opportunities arising from them.
Some of the key external factors that drive Philippine urban and economic conditions
include: the global financial crisis, continued competition for FDIs from other developing
countries, international migration and overseas Filipino workers (OFW) remittances, the rise
of sustainability and climate change in the international development agenda, and the
continuing promise of the IT and tourism sectors.
1. The global financial crisis
The global financial crisis that emerged in 2007-2008 illustrates the increasing
integration of the world’s economies and the significant influence of international
events, both positive and negative, on the Philippines. This crisis has led to: tighter
access to credit, foreign exchange volatility, and a depressed equity. It can also lead to
reduced exports, foreign direct investments, tourism receipts and remittance flows;
and worsening terms of trade. (Habito 2008) By mid-December 2008, the world‘s
financial system had already written off more than one trillion dollars (US); the
domestic stock market, meanwhile, already lost 55% of its market value since the start
of the year. (Wallace Business Forum 2008)
The tenure and the extent of impact of the crisis are not clear. It has been argued, for
example, that Asia, which accounts for only 3% of the financial writeoff as of
December 2008, is in a better position to weather the crisis. And history provides
varying expectations. Affected economies were able to recover from the 1997 Asian
financial crisis after 5-7 years, but it took about 25 years to return to the previous peak
after the Great Depression of 1929. What is certain, however, is that there will be
lower incomes and expenditures and therefore fewer resources for urban and overall
growth in the country (as well as for most of the world) as we move into the second
decade of the 21st century.
2. Competition for FDIs from and the faster growth of other countries
The Philippines continues to rank much lower than the rest of the Asian countries in
terms of FDI inflows. In 2007, it received $2,928 million in FDI inflows, the lowest
among the major economies of Southeast Asia (Indonesia, Malaysia, Singapore,
Thailand, and Vietnam); Vietnam, which had the second lowest amount of inflows,
received more than 230 percent of Philippine inflows. China’s and India’s FDI
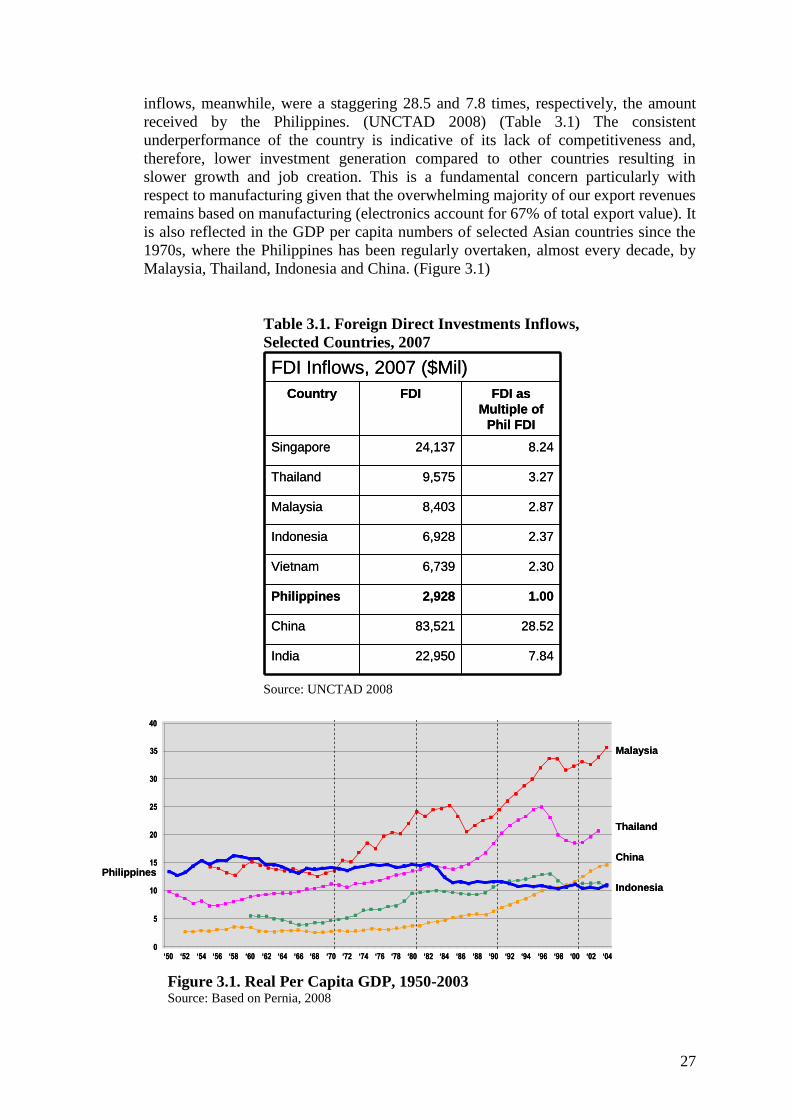
27
inflows, meanwhile, were a staggering 28.5 and 7.8 times, respectively, the amount
received by the Philippines. (UNCTAD 2008) (Table 3.1) The consistent
underperformance of the country is indicative of its lack of competitiveness and,
therefore, lower investment generation compared to other countries resulting in
slower growth and job creation. This is a fundamental concern particularly with
respect to manufacturing given that the overwhelming majority of our export revenues
remains based on manufacturing (electronics account for 67% of total export value). It
is also reflected in the GDP per capita numbers of selected Asian countries since the
1970s, where the Philippines has been regularly overtaken, almost every decade, by
Malaysia, Thailand, Indonesia and China. (Figure 3.1)
Table 3.1. Foreign Direct Investments Inflows,
Selected Countries, 2007
Source: UNCTAD 2008
Figure 3.1. Real Per Capita GDP, 1950-2003 Source: Based on Pernia, 2008
7.8422,950India
28.5283,521China
1.002,928Philippines
2.306,739Vietnam
2.376,928Indonesia
2.878,403Malaysia
3.279,575Thailand
8.2424,137Singapore
FDI as
Multiple of
Phil FDI
FDICountry
FDI Inflows, 2007 ($Mil)
7.8422,950India
28.5283,521China
1.002,928Philippines
2.306,739Vietnam
2.376,928Indonesia
2.878,403Malaysia
3.279,575Thailand
8.2424,137Singapore
FDI as
Multiple of
Phil FDI
FDICountry
FDI Inflows, 2007 ($Mil)
Philippines
40
35
30
25
20
15
10
5
0‘50 ‘52 ‘54 ‘56 ‘58 ‘60 ‘62 ‘64 ‘66 ‘68 ‘70 ‘72 ‘74 ‘76 ‘78 ‘80 ‘82 ‘84 ‘86 ‘88 ‘90 ‘92 ‘94 ‘96 ‘98 ‘00 ‘02 ‘04
Malaysia
Thailand
China
Indonesia
Philippines
40
35
30
25
20
15
10
5
0‘50 ‘52 ‘54 ‘56 ‘58 ‘60 ‘62 ‘64 ‘66 ‘68 ‘70 ‘72 ‘74 ‘76 ‘78 ‘80 ‘82 ‘84 ‘86 ‘88 ‘90 ‘92 ‘94 ‘96 ‘98 ‘00 ‘02 ‘04
Malaysia
Thailand
China
Indonesia

28
There is a lot that we can do to improve our competitiveness but these will have to be
done in an environment where other countries in the region have become more
efficient or have surpassed the Philippines in terms of infrastructure or service support
or governance and thus in attracting investments.
3. International migration and remittances
With its 8.2 million OFWs, the Philippines is the third largest source of migrant
workers in the world behind China (40 million) and India (20 million). As a
proportion of total population, however, OFWs comprise 10%--the highest--besting
China’s 2.9% and India’s 1.9%. As of 2008, remittances accounted for about 10% of
GDP, with 24.1% of Filipino households receiving some form of contribution from
abroad. On the average, 28% of these households’ income was derived from such
contributions.
International migration and OFW remittances continue to be significant drivers of the
local economy, although these may decline in the short-medium term due to the
global financial crisis that has slowed overseas demand. In the long term, however,
OFW deployment is expected to be driven by strong demand, especially from
developed economies where population is projected to decline by 23% from 741
million to 571 million by 2050; consequently, demand for OFW labor is likely to
remain high. (Torres 2008)
OFW remittances have increasingly contributed to the Philippine economy and
poverty reduction, with a 10% increase in the share of remittances in household
income associated with a 2.6% rise in the proportion lifted out of poverty. There is
evidence, however, that unlike domestic remittances, which contribute to a reduction
of inequality, international remittances contribute to increased inequality both from
income distribution and regional-geographical points of view. Overall, while OFW
remittances have helped Filipino families survive during the past three decades, the
same experience suggests that such a labor export policy should be viewed as a stop-
gap measure because it cannot be relied upon to significantly contribute to poverty
reduction, reduce income inequality and lead to long term economic growth. (Pernia
2008)
4. Competitive advantage in information technology and business process
outsourcing
Information technology and business process outsourcing continue to be a bright spot
for the Philippines given its competitive advantage in this sector, anchored on its
skilled labor force, English language proficiency, competitive costs, and other factors.
In 2007, the Philippine IT-BPO industry earned close to US$5 billion in export
revenues, representing a world market share of about 8% (a distant second to India’s
51%), and employing about 430,000. By 2010, revenues are expected to grow by 40%
to about US$13 billion, increasing market share to 10%, and employing 900,000. And
while 80% of IT-BPO activities take place in Metro Manila (with Makati absorbing
much of the available talent), Cebu and Angeles also have sizable IT-BPO workforces

29
and, together with other “next wave” cities, are well poised to absorb a larger share of
future growth. (Virata 2008)
The latest global financial crisis threatens to dampen demand for IT-BPO services but
this may be addressed by shifting from, for example, sales support to collection
services or to health care, engineering, gaming and non-voice BPO in general.
Improving marketing and continued development of human resources will be key
objectives. (Business World 2008; PDI 2008)
The IT sector is particularly significant to the Philippines because of its combination
of relatively (1) high wage structure and (2) large labor force requirements. This
contrasts with the low wage, labor intensive jobs that have characterized the job
market, primarily in the rural and low-skilled urban service sectors. The potential
contribution of the IT sector to poverty reduction is, therefore, very promising. It is
also useful to point out that IT-BPO activities are primarily urban-based activities and
therefore reinforce the key role of cities in overall economic growth and poverty
reduction.
5. Tourism industry growth
Tourism is the world’s largest industry. In 2008, the direct and indirect impacts of the
industry accounted for of 8.8% of GDP. It also provided 3.5 million jobs (10.3% of
total employment) and generated about 9.9% of total export earnings. (World Travel
and Tourism Council 2008)
International tourist arrivals grew by an average of 7 percent per year during the past
four years with international tourism receipts exceeding $900 million in 2007. (People
and Planet 2008) By end 2007, a new peak was reached with over three million tourist
arrivals. (Figure 3.2)
Inter-Asian travel is expected to remain strong despite the downturn brought about by
the global financial crisis. While tourism arrivals in the Philippines have failed to
keep pace with its neighbors, the potentials of the industry to drive the local economy
remains strong given the leisure demands of the rapidly growing middle classes of
Asia’s emerging countries and the high propensity to travel by Europe’s and North
America’s baby boomers. In 2007, 70 million Japanese, 40million Chinese and 6
million Koreans travelled across Asia. (China Daily 2008)

30
1,144
1,3721,449
1,760
2,049
2,223
1,7971,933 1,907
2,291
2,623
2,843
3,092
1,992
2,1712,149
5.6%7.6%
-1.3%
8.4%
20.1%
-9.8%-8.2%
1.0%
-3.3%
16.4%
21.5%21.3%
20.0%
8.8%
14.5%
8.5%
0
500
1,000
1,500
2,000
2,500
3,000
3,500
'92 '93 '94 '95 '96 '97 '98 '99 '00 '01 '02 '03 '04 '05 '06 '07
Th
ou
san
ds
-15%
-10%
-5%
0%
5%
10%
15%
20%
25%
% Y
on
Y G
row
th R
ate
s (
lin
e)
Figure 3.2. Tourist Arrivals in the Philippines, 1992-2007 Source: NSCB Economic Indicators
The Philippine government originally targeted to increase annual foreign tourist
arrivals from two to five million by 2010 with an annual growth of 8%-10% but has
since scaled this back to a more modest 5%-6%, targeting 3.4 to 3.6 million arrivals
for 2009. (TTG Asia 2009) Whether this can be achieved remains to be seen; by end-
2008 tourist arrivals from Japan, Korea and US balikbayans—the country’s top
tourism markets—had already declined sharply. (Philippine Star 2008) In the longer
term, however, as the global crisis recedes, tourism growth will be fueled by
increasing global affluence, especially in China, India and most of East Asia. Major
policy initiatives and investments will be required to support such growth and to
address existing constraints including limited airport and hotel/accommodation
capacities, land and sea travel infrastructure and services, destination upgrades, and
lingering security concerns.
6. The rise of sustainability and climate change in the development agenda
Sustainability and global climate change are increasingly becoming visible
components of the mainstream development agenda to the extent that many
development policies, investment portfolios and strategies of public and private sector
agencies, organizations and companies recognize and support the triple bottom line—
simultaneously targeting economic, environmental and social objectives—and give
priority to investments in sustainable initiatives. (The ADB, for example, in its latest
strategy document (Strategy 2020) has decided to refocus its operations on five core
areas, one of which is “environment, including climate change.”) (ADB 2008) Green
buildings and communities now topbill many urban and regional planning discussions
and real estate fora. And various markets, especially in the developed economies, now
place a premium on green products and technologies.
Sustainability and climate change are no less significant for the urban areas of
developing countries such as the Philippines. There is no question that sustainable

31
urban development makes sense, especially from a longer term, life-cycle perspective.
Further, sustainability is directly relevant to the poor environmental conditions of
many urban areas in the Philippines, particularly the large metropolitan areas, low-
lying cities threatened by global warming and rising sea levels and other disaster-
prone regions. The increasing deterioration of urban air quality, depletion of energy
and water resources, inadequate waste management, worsening traffic congestion in
Philippine cities, demand urgent attention and action not only for personal well being
but also in support of the country’s global competitiveness.
As shown in Table 3.2 below, the Philippines already has a deficit ecological footprint
of about 27 million global hectares (gha). The average Filipino is consuming 61%
more than its present biocapacity (measured relative to average land carrying
capacity), which is higher than the worldwide per capita consumption of 31%.
Table 3.2. Ecological Footprint, Selected Countries, 2005
B INTERNAL DRIVERS
Internal drivers directly affect the urban system but unlike external drivers, we can
substantially influence them thereby changing the system. Effecting these changes is not
necessarily easy but they are well within our direct sphere of influence.
1. Rapid population growth
The Philippines has a total population of 89 million based on the 2007 census. The
average annual growth rate declined to 2.04% in 2000-2007 from 2.34% in 1990-
418.7912.9820.0532.27Canada
153.497.6215.4220.16Australia
98.840.441.39222.78Indonesia
6.450.252.6725.35Malaysia
-17.86-4.130.034.33Singapore
-27.00-0.330.5483.05Philippines
-73.97-1.150.9864.23Thailand
-145.51-3.040.7047.82S Korea
-534.24-0.480.411,103.37India
-549.39-4.290.60128.09Japan
-1,313.32-4.405.02298.21United States
-1,654.13-1.250.861,323.35China
Source: Global footprint Network, 2008
-0.120.882,370.63Low income countries
-0.032.163,097.93Mid income countries
-2.713.67971.82High income countries
-4,082.67-0.632.066,475.63World
Ecological
deficit-reserve
(million gha)
Ecological
deficit-reserve
(gha/person)
Biocapacity
(gha/person)
Population
(million)
Country/Region
Ecological Footprint, 2005

32
2000. Given the later rate, however, total population will still double in about 33
years. Table 3.3 below shows comparable population data for other countries in the
region (2000-2005).
Table 3.3. Comparative Population Data Country/ Region
2005 Pop (Mil)
2000-05 AGR
2005 Urban
Pop (Mil)
2005% Urban
2000-05 Urban AGR
2000-05 Rural AGR
World 6,500 1.24 3,200 48.6 2.07 0.48
Dev Regs 1,200 0.36 900 74.0 0.61 -0.34
SE Asia 560 1.40 245 44.1 3.47 -0.10
Philippines 85 2.07 53 62.7 3.45 -0.04
Thailand 63 0.76 20 32.3 1.49 -0.42
China 1,300 0.67 530 40.4 3.10 -0.83
India 1,100 1.62 325 28.7 2.35 1.33
Indonesia 226 1.31 109 48.1 4.04 -0.92
Vietnam 85 1.45 22 26.4 3.13 0.88
Malaysia 26 1.95 17 67.6 3.69 -1.26
As shown, the Philippines has the highest annual total population growth rate
(2.07%), which is well above the world’s growth rate, and more than double those of
developed countries as well as several countries in Asia namely, China and Thailand.
The Philippines is also one of the most urbanized (62.7% urban). Its urban growth rate
is also very high (3.45%), exceeded only by Indonesia in the above list.
The high growth rate of the Philippines is worrisome because it means that the
number of jobs and amount of services needed to be provided annually are much
greater compared to other countries. To illustrate, if the Philippines had the growth
rate of Thailand, then the number of classrooms, hospital beds, length of roads, and
other services and infrastructure needed to address the annual increase in demand
would be less than half required by its current growth rate. In other words, an increase
from 1% to 2% in the growth rate translates to a 100% increase in demand.
The high urban growth rate of the Philippines is similar to other countries of East
Asia, which reflects both a strong natural growth pattern and rural-urban migration. It
also supports the idea that while poverty is largely a rural phenomenon, cities serve to
improve overall welfare and act as agents of poverty reduction. Unfortunately, the
country’s poor economic performance over the past decades suggests that the cities
are also strained to provide job opportunities and relief to migrants notwithstanding
the welfare improvements enjoyed by the latter.
Together with economic growth rates, population growth is a major determinant of
poverty reduction. With population growth rates in the order of 2%-3%, economic
growth will have to be in the range of 7% if substantial poverty reduction is to take
place. The latter is unlikely to happen in the short-medium term given the global
financial crisis as well as the lack of various reform components (fiscal, governance,
planning, etc.) required to sustain significant economic growth. In any case,
significant improvements in the overall quality of life in both the urban and rural areas
are unlikely to take place in the absence of a continued reduction in the rate of
population growth. (Webster, Corpuz, Pablo 2003)

33
2. Development of metropolitan and other large urban markets
Rapid population growth has contributed to the formation of an unprecedented
number of large metropolitan and urban centers. Out of 72 major urban centers and
clusters in 1990, only 4 were larger than one million (Metro Manila, Metro Cebu,
Metro Angeles and the Malolos-Meycauayan corridor). By 2007, this number had
doubled (including Davao City, the Bacoor-Dasmarinas corridor, the Calamba-San
Pedro corridor, and the greater Antipolo area).
During the same period, the number of urban centers between 500,000 and one
million had increased from six to ten, and those between 100,000 and 500,000 from
41 to 54. (Figure 3.3) This is consistent with the findings of an earlier study that
current growth trends will lead to a larger number of urban centers even as the
population share of Metro Manila and the top quintile cities will tend to decline in the
future. (Corpuz 2000)
Figure 3.3. Urban Centers in the Philippines, 2007.

34
The emergence of additional large urban centers means that there is now a larger
number of areas that can support services and markets which were previously feasible
only in the larger cities. Individually and as regional or subregional clusters, these
cities offer greater economies of scale that can attract new investments and lead to the
introduction of various transportation, medical, educational, retail and other
commercial services. The extent of these investments will also be determined by
household incomes and affordability but clearly, new market opportunities will be
there. (Likewise, however, the larger cities imply larger scale environmental impacts
that need to be managed and suggest the urgency of sustainability and disaster
mitigation measures.)
To a large extent, and despite periodic policy rhetoric about urban dispersal and
decongestion, the growth of large urban centers did not involve explicit or purposeful
planning intervention. Along with the rest of the urban system, these were products of
demographic and economic trends, physical characteristics and constraints of the
archipelago, and the decentralized institutional environment. As a whole, growth
patterns may be characterized as rapid but incremental, largely influenced by the
availability or lack of infrastructure, and by key catalytic investments of the private
sector—in transportation projects, industrial zones, regional shopping centers, and
business districts to name several.
The current spatial distribution of the urban system is unlikely to be altered, especially
in the short-medium term.
3. The primacy of an expanded Metro Manila
As mentioned earlier, Metro Manila continues to dominate the urban hierarchy and
domestic economy. It already represents the largest concentration of consumers in
Southeast Asia (although purchasing power is below other cities in the region). By
2015, it is expected to become the 15th
largest “city” in the world. (Webster, Corpuz,
Pablo 2003; UN 2002)
The real impact of Metro Manila, however, is underappreciated because the extent of
its influence goes well beyond its administrative boundaries. Already, the major urban
centers of its neighboring provinces have become part of the day-to-day functional
orbit of Metro Manila. While Metro Manila’s growth continues to be oriented towards
its periphery, the growth directions of its neighboring provinces (measured by the
historical movements of population centroids as well as transport patterns) are
increasingly biased towards the capital region. Indeed, the effective and functional
coverage of Metro Manila now includes much of Bulacan, Pampanga, Rizal, Laguna,
Cavite and Batangas, melded into what may be termed as a Mega Manila by the
limited road and highway network that extends into the provinces. (Corpuz 2006)
(Figure 3.4)

35
Figure 3.4. Mega Manila, 2000 Source: Corpuz, 2006b.
The aforementioned Mega Manila overshadows the rest of the urban hierarchy,
accounting for 30% (26 million) of the country’s population, 50% of economic
output, while occupying less than 4% of the national territory. The population of this
predominantly urban region is growing at annual rate of 2.88%, faster than the
country’s overall rate of 2.04% and Metro Manila’s 2.11%. It is also almost seven
times larger than the province of Cebu, where the second largest urban center of the
country is located, in terms of population. At its present growth rate, it will double its
population in less than 24 years, adding, on the average, more than one million people
every year to the region.
The size and growth rate of Mega Manila means that this region will continue to be
the primary market and the main attraction for investments in the country for the
coming decades and, desirable or not, what happens to Mega Manila in the short-
medium term will determine much of what happens to the rest of the urban system
and the country. The extent to which it can succeed in anchoring the country’s growth
Pampanga
Bulacan
Rizal
Laguna Cavite
Batangas
Metro Manila
2000
36
depends largely on how this region is managed and functions to serve the
requirements of its residents and investors. It is useful to note, however, that at this
point in time, there is no single institution that is mandated or even oriented towards
this purpose.
4. Private sector-led housing market
The housing problem of the country can be appreciated by considering the total
annual housing need (2005-2010 backlog plus new requirement) of approximately
625,000 units.
First, about two-thirds of the housing need comes from new requirements (natural
increase plus net immigration). This means that the high population growth rate is a
key contributing factor.
Second, there is a severe shortage in government funding to adequately address the
housing requirement. At PhP200,000 per unit (as per the MTPDP), a total of PhP125
billion per year, for six years, is needed. This is a conservative amount given that
about 50% of the housing requirement is in urban Metro Manila, Calabarzon and
Central Luzon where the cost of land and labor is much higher than in the rest of the
country. This annual amount already represents about ten percent of the total national
government appropriations for 2008. (In contrast, NHA, the government agency
tasked with housing production, was only allocated PhP3.5 billion or only 2.8% of the
PhP125 billion requirement. In fact, the combined 2008 GAA of all the housing
agencies—HUDCC, HLURB, NHA, HGC, NHMFC—amounted to only PhP4.9
billion. Notably, the budgeted debt service payment for interest alone can cover more
than twice the annual housing requirement.) The severe funding limitation of
government for housing along with the rapid population growth, explains, in part,
why the housing need gets bigger and bigger every year.
Third, the lack of government resources for housing also explains why the private
sector dominates housing production in the country. Government housing
accomplishment targets are only about 30% of the housing need; actual
accomplishment, however, is only about 69% of target or 23% of total need. (Senate
Economic Planning Office 2006) Given continued limitations in government housing
funds, increasing private sector participation in the housing sector is necessary if any
headway is going to be made in reducing the country’s housing need. And in this
case, effective demand, not supply, is critical because without substantial government
subsidies, the private sector will be responding primarily to housing market
affordability.
5. Education and quality of labor supply
The global benefits of remittances and the rapid growth of the IT-BPO industry in the
Philippines are largely affected by the skill levels and thus the quality of education of
the labor force. In the BPO sector, one of the biggest constraints to further growth is
the availability of skilled personnel and this is why “next wave” cities are typically
those with universities and colleges and thus have high potentials for supplying the
manpower requirements of the industry. And while short term measures to improve
labor skills have been initiated—English language competency training, for
37
example—longer term prospects require major intervention in the broader structure of
education in the country. This concern runs across all fields and courses of education,
given that only 45% of children of schooling age finish high school and that 55% of
those entering the labor force will have at most only one year of college education.
(Corpuz 2004)
The amount and quality of education has a major impact on the quality of the urban
labor force and on poverty reduction. Skills training programs need to be
complemented by programs to upgrade school facilities, improve physical access to
school and to keep students in school through food aid, scholarships and other forms
of direct support.
6. Continued dissipation of national and local resources
Capital resources are not only limited but are also dissipated by inefficiencies in the
planning-investment programming-budgeting-implementation process. Described as a
“Divide by N” syndrome, (Carino, Corpuz, Manasan 2004) where resources are
scattered throughout various political initiatives and geographical areas, this results in
a dearth of catalytic investments that have sufficient scale to provide strategic focus
and meaningful development impacts.
A case in point is the formation of state universities and colleges (SUCs). There were
111 SUCs all over the country as of 2002. This number represents an increase of more
than 150% since 1990 (from 138 to 348), considering main and satellite campuses.
(Webster, Corpuz, Pablo, 2003) Created by legislation, SUCs are typically justified
based on the argument that they increase accessibility to education and allow a larger
number of students to be served in a wider geographical area. SUCs can also have
positive multiplier impacts on host communities. What is not mentioned, however, is
that given budget limitations and current deficiencies in school facilities, faculty and
other personnel, it is more efficient to build up existing educational institutions—
construct more classrooms, increase library facilities, hire and train more teachers and
provide more scholarships—than to disperse resources to more locations that result in
the creation of more inadequately supported universities and colleges. In other words,
having several good quality educational institutions that can also serve a large number
of students through scholarships is better than many mediocre institutions. (Webster,
Corpuz, Pablo, 2003; Canlas and Fujisaki)
7. Shortcomings in urban and regional transportation systems
The inadequacy of urban and regional transportation in the Philippines remains a
major constraint in the movement of people and commodities between production and
consumption centers as well as between urban centers. This has led to high domestic
transport costs relative to some international routes and, as a whole, penalized the
productivity, efficiency and competitiveness of the country relative to other countries
in East Asia. Further, it has limited opportunities for urban growth and regional
development, sometimes at the expense of environmentally-constrained areas,
because of the lack of access to other areas better suited to absorb additional or new
developments. The effective urban-industrial heartland of Luzon, for example, has
remained essentially unchanged since the late 1970s, confined to the Angeles-Metro
Manila-Batangas corridor. Recent road extensions to Subic and improvements in the

38
port of Batangas have extended commercial traffic but these have been exceptions
rather than the rule during this extended period of time. Expansion of transport
capacity along the northern and southern corridors to northern Luzon and towards the
Bicol region, respectively, has been minimal or has actually declined with respect to
rail transport.
In addition to causing higher transport costs (effectively imposing a tax on producers)
and thus penalizing competitiveness, shortcomings in the regional transportation
system have also caused urban growth to sprawl from Metro Manila, incrementally
filling up land regardless of suitability and thus compromising environmental
integrity. Opportunities to disperse development efficiently to the north and the south,
similar to what has taken place along Thailand’s eastern seaboard, have not been
realized.
Similar development patterns have been taking place in many other areas of the
country’s urban system in the Visayas and Mindanao, although lesser in scale and
thus attracting less attention.
39
Chapter IV
Institutional Set-Up and Environment
There are a number of fundamental issues and problems that characterize the institutional
environment of urban development and housing that somehow hamper the implementation of
critical programs and projects. These issues may be classified into: (a) the incongruence of
sectoral and area-based orientation; (b) weak governance capacity of LGUs; (c) weak
coordinative mechanism for urban development and housing services; and (d) political
interference.
In the sections that follow, these fundamental issues and problems will be examined. In the
process, some options in resolving these issues and critical gaps in policy formulation and
implementation will be discussed.
A ISSUES AND PROBLEMS
1. Sectoral vs. Area-based Orientation
Although area-based planning at the national level had gained some prominence in the
1970’s (mainly through the Integrated Area Development approach and the Human
Settlements concept), it remains largely as a special case and an exception to the
traditional sectoral plans formulated by the national government. Indeed, the
Philippine government bureaucracy is largely structured along sectoral concerns,
clearly evident in the Medium Term Philippine Development Plan (MTPDP) which is
the official national plan document for the country. In the MTPDP, the chapters are
organized along the traditional sectors (e.g., agriculture, health, education, tourism,
natural resources, etc.) and define clearly the functional jurisdictions of various
national government agencies. In principle, the direct correspondence between the
sectors and the national agencies responsible for them allows for a smooth transition
from planning to implementation. Although a long-term National Framework for
Physical Planning (NFPP) is now likewise formulated by the NEDA, the linkage
between the NFPP and the MTPDP is not clearly established.
A critical issue, however, is the need to synchronize area-based programs and projects
at the local level, on one hand, with national sectoral priorities, on the other. Even in
the absence of budget constraints, the MTPDP does not deal squarely with
intersectoral prioritization which is the essence of local and sub-national area-based
planning. The Comprehensive Land Use Plans (CLUPs) and the Comprehensive
Development Plans (CDPs), of LGUs, and plans formulated at the metropolitan level
(e.g., the Metro Manila Development Agency or MMDA plan) are area-based and
geographic in orientation. At the same time, they have to reckon with a budgeting and
implementation system that is heavily sectoral in character. This problem has, to some
extent, been resolved by the devolution of some sectoral functions to LGUs under the
1991 Local Government Code. However, substantial service delivery functions and
programs remain with, and controlled by, the National Government Agencies
(NGAs). For this reason, it is not surprising that sectoral programs and projects
40
respond more to the imperatives of NGAs which, in many cases, are not viewed by
LGUs as being consistent with local development priorities.
There is little accountability to local governments if NGAs place a higher premium on
development activities and programs that are typically articulated by their central
offices. At the same time, investment priorities identified by LGUs often have no
concrete and reliable connections to national sectoral policy concerns and priorities.
Since national funds get allocated through the sectors, and cascaded down to regional
and local sectoral offices, large, strategic investment proposals identified by the LGUs
have little chance of being implemented.
It is probably even more difficult to set priorities and implement programs and
projects that cut across LGU boundaries (e.g., metropolitan or sub-regional). These
programs and projects have to reckon with a “fractionated” implementation structure
composed of politically independent LGUs. For this reason, these areas have no
inherent political “champions” especially in the absence of a metro-wide authority
that has substantial resource allocation and budgeting functions. Even though a
number of metropolitan areas have already been identified, and development plans
have been prepared for quite a few (e.g., Metro Manila, Metro Cebu, Metro Davao,
CALARZON, etc.) implementation has been spotty. In metropolitan areas, most
projects that are implemented are those that are initiated by the private sector, foreign-
funded, or otherwise those that coincide with an approved sectoral budget.
2. Weak LGU Governance Capacity
As previously noted, the 1991 Local Government Code is a dramatic and far-reaching
piece of legislation that has thrust the LGUs into the limelight of carrying out
programs in urban development and housing. This is an advantage that must be
utilized in dealing with sectoral biases. The LGU is not sector bound and has an area
and geographic orientation. Indeed, the institutional responsibilities for plan
formulation, financing and implementation are clearly prescribed by the LGC:
The Local Development Plan (LDP) shall be prepared by the Local
Development Council (LDC);
The LDP will be approved by the Sanggunian;
Funds for the LDP shall be allocated by the Local Finance Committee (LFC);
and
The Local Chief Executive, together with the executive departments, will
implement the development plan.
Although the legal mandates are clear and straightforward, there is, in reality, a wide
gap between mandate and actual practice. First of all, many Local Development
Councils (LDC’s), the local body that is tasked with the planning function, are
inactive and largely ineffective. As noted elsewhere, it is a huge and unwieldy body
that is moribund for long periods during the fiscal year (Cariño, Corpuz and Manasan
2004). It meets infrequently, in many cases only twice a year: once to launch the plan
preparation process, and a second time to approve the plan document (Cariño 1999).

41
It is for this reason that many LGUs have no plan documents despite the requirements
set out in the 1991 Local Government Code. Data from the Regional Field Offices
Report show that 228 cities and municipalities are without approved CLUPs and
another 368 have outdated CLUPs (Table 4.1)
Table 4.1. Status of CLUP Preparation (as of December 2007) Cities Municipa
lities Sub-total Total
LGUs with Approved CLUPs 1381
New Plan* 3 171 174
Updated CLUPs** 99 723 822
CLUPs for Updating*** 17 368 385
LGUs without approved CLUPs (but with ongoing planning activities)
1 228 229
Total number of LGUs 120 1490 1381 1610
* First Plan
** Updated CLUPs with old plan
*** CLUPs for updating with old plan
Source: HLURB-DILG Regional Field Offices Report
There are other reasons that have been cited for the failure of LGUs to comply with
the requirements of the Local Government Code (LGC) on the preparation of plan
documents. A major constraint is that the overwhelming majority of the personnel of
the City/Local Planning and Development Office lack formal planning education and
have a poor appreciation of the planning logic. Consequently, the quality of most plan
documents is poor, i.e., they are not internally consistent and lack sufficient
consideration of external demands and conditions and other critical factors that make
an impact on local development. In particular, they could be significantly improved
by targeting specific gaps in plan content and format, projecting future conditions, and
building up basic planning logic by linking analysis of existing situations, to planning
goals and targets, and finally to specific strategies, programs and projects (Cariño,
Corpuz and Manasan 2004; Cariño 2008).
Also generally ignored in local planning is the important role that the private sector
and entrepreneurship could play in the local development process. This comes as a
surprise given the universal recognition of the critical role that the private sector,
including the business sector and the “civil society” as necessary partners of the
public sector in the development process especially in the implementation of specific
programs and projects. And yet, such a partnership is obscure in many plan
documents, probably explaining the lack of prominence given to such schemes as
joint venture, other forms of public-private partnerships, and to Build-Operate-
Transfer (BOT) modalities and its variants (Cariño 2008).
Perhaps, even more critical is a recurrent theme emphasized in the local finance
literature: the mismatch between revenue means and expenditure needs of LGUs. As
noted elsewhere, the fiscal gap between the cost of devolved functions and the
additional revenues generated from new revenue sources provided for in the LGC is
huge. Although the situation across LGUs varies, some of the major reasons for this
fiscal gap include the limitations on the taxing powers of LGUs under the 1991 Local
Government Code, and the retention of many types of taxes by the national
government (Manasan, 1992 and Bird, 1999).

42
At the same time, LGUs still have a lot of room to improve their own-source
revenues. In many LGUs, the internal revenue code remains outdated and non-
traditional sources of funds (e.g., borrowing, bond flotation, BOT schemes, etc.) are
hardly tapped (ADB 2004; Manasan 1992). Consequently, many LGUs remain
heavily dependent on the Internal Revenue Allotment (IRA), or the allocations of the
national government to LGUs, and on the Local Development Fund (20 percent of the
IRA) as the main source of funding for urban development and housing programs and
projects (Table 4.2). Given that the Local Development Fund (LDF) is relatively
meager, only small, often non-strategic projects are implemented by the LGUs. At the
same time, large, strategic projects have no clear connections to national and external
sources of funds.
Table 4.2. IRA as Percentage of Total LGU Revenue
All LGUs Provinces Municipalities Cities
1991 39.8 42.3 43.4 37.5
1995 61.9 74.5 68.5 43.7
2000 64.5 80.2 77.2 44.6
2002 66.2 81.5 86.0 50.1
Average
1985-1991 36.4 38.3 40.3 35.6
1992-2002 62.5 77.7 73.7 44.7
Source: Cariño, Benjamin; Corpuz, Arturo; and Manasan, Rosario. Preparatory Work for the Proposed
Technical Assistance on Strengthening Provincial Planning and Expenditure Management. July, 2004.
The fiscal gap and the continuing dependence on the IRA have combined to produce a
lack of real fiscal economy among LGUs, weak accountability and political economy
issues in the formulation of the budget (Loehr and Manasan 1999). Unless LGUs are
able to significantly upgrade their own-source revenues, as well as tap non-traditional
sources of revenues, they will remain dependent on the small LDF for implementing
local projects. In turn, reliance on the LDF could significantly affect their ability to
finance more strategic projects that are critical to the achievement of local and urban
development goals and objectives.
3. Weak National Coordinative Mechanisms
The coordinative mechanisms for the housing and urban development services are
generally weak. At the national level, this is particularly critical for housing services
given the huge backlog in housing and the proliferation of colonies of informal
settlers in urban areas and cities. As clearly evident in large urban areas in the
country, even danger zones like areas along railroad tracks, banks of rivers, etc. are
transformed into areas of settlement for the poorer segments of Philippine society.
There are currently numerous shelter agencies that are tasked to address different
aspects of the housing sector. These include, among others, the following:
Home Guaranty Corporation
Housing and Land Use Regulatory Board
National Housing Authority
National Home Mortgage Finance Corporation
PAG-IBIG (Home Development Mutual Fund)

43
Social Housing Finance Corporation
However, the activities of these agencies are often uncoordinated and lack a clear
strategic focus. Even more critical is the fact that “housing” is seen simply as shelter
phenomenon and often unrelated to urban development. Such a simplistic concept of
housing is not appropriate in responding to the need for other services attached to
housing (e.g., infrastructure, transportation, etc.) Strong sectoral biases of various
agencies similarly aggravate the problem of coordination.
Recognition of this issue has, in the past, led to the creation of Councils/Committees,
although most of them have largely been ineffective in achieving coordination and
synchronization of various housing and urban services. There is obviously a need to
institute a stronger mechanism for the harmonization of all shelter and urban
development policies, guidelines and standards at the national level. Such a
mechanism should also provide for the extension of technical and other forms of
assistance to LGUs to ensure that land use plans and zoning ordinances conform with
prescribed national standards and policies, and other legal issuances.
4. Weak Participatory Mechanisms
The Philippines is known for its popular democracy, clearly manifest in the large
number of non-government organizations (NGOs), peoples’ organizations and other
community-based organizations that are active. However, the main channels for
participatory governance, although formally in place, do not seem to be functioning
well. As previously noted, the Local Development Council (LDC), a multi-sectoral
group intended to be the central planning body of the LGU, is moribund for long
periods. Some sectors view the large representation of NGOs in the LDC as a
welcome innovation in that it increases community awareness of the activities of the
council. However, the performance record of NGO representatives has been less than
satisfactory. In many occasions, NGO representatives seem to contribute little to the
formulation of the local development plan, and are more preoccupied with seeking
support (a share of the LDF) for specific projects of their own organizations.
As previously noted, participation of the private and business sectors is often ignored
in the local planning process. There appear to be obstacles to greater participation of
the business sector in various development activities. The Local Government Code
has lodged regulatory authority in terms of the issuance of business permits, licences
and business tax in the hands of LGUs. Although business regulations and their
enforcement vary widely across cities in the Philippines, the institutional procedures
and processes are, generally, cumbersome. The large number of procedures is a
disincentive to many businesses and probably creates opportunities for corruption (see
Doing Business in the Philippines, 2008).
As shown in Figure 4.1, the Philippines ranks very low among East Asian countries in
terms of the ease of doing business, higher only than Cambodia, Lao PDR and Timor-
Leste. Neighboring countries such as Singapore, Hong Kong, Thailand and Malaysia
rank much higher when reckoned against global best practice. The Philippines also
require a large number of entry procedures (15) to start a business, fewer only than
Brunei (Figure 4.2). As noted elsewhere, opening a business in Marikina, for instance,
would require 15 procedures. The case of Valenzuela is even worse: one would spend

44
37 days to complete 22 procedures—more steps than anywhere else in the world
(Doing Business in the Philippines, 2008). Most other countries in East and Southeast
Asia only require 13 or fewer procedures to start a business.
Figure 4.1: Ranking on the Ease of Doing Business Among Asian Countries Source: Doing Business 2008
Figure 4.2: Ranking on the Number of Procedures to Start a Business Among
Asian Countries Source: Doing Business database

45
5. Political Interference
Finally, planning and investment prioritization are difficult to achieve because
budgets are often driven by political motives. Political pressure influence project lists
and prioritization. The total cost of projects listed in the MTPDP is often beyond the
capacity of the national government to finance. Consequently, the MTPDP serves less
as a plan of action and more as a wish list of projects, subject to further refinement
(Webster, Corpuz and Pablo 2004). Indeed, political pressure often manifests itself in
terms of the incongruence between plans and budgets, and in terms of resources being
spread too thinly across many concerns to satisfy many patrons and interests.
Political interference at the national level is mimicked at the LGU levels. In an earlier
study, political interference in the formulation of the Annual Investment Program
(AIP) which serves as the basis for annual budgetary allocations for capital
expenditures is well documented (Cariño, Corpuz and Manasan 2004). It is
noteworthy that the AIPs in most LGUs are put together to comply with the
requirement of the Department of Budget and Management (DBM) that no
appropriation chargeable against the Local Development Fund (LDF) can be made if
the project is not listed in the local plan. In other words, the AIP inappropriately
serves as the local plan to comply with the legal budgetary requirement. In many
LGUs as well, there is a limited view of the AIP with the list of projects being
confined to those that can be funded out of the LDF.
In the same manner that national legislators are given countryside development fund
(CDF) allocations from the national government, the local development fund (LDF) is
a source of CDF-like allocations to key political actors at the LGU level: the chief
executive officers, the vice governors/mayors, and members of the Sanggunian.
Recipients of allocations from the LDF are the main contributors to the project
listings of the AIP. Since the allocations are relatively small, and most local leaders
are likewise politically motivated, the project listings in the AIP are often a “mixed-
bag” of small, unrelated projects that have no clear connections to the longer term
plan and development strategy for the locality. In short, the AIP is at the core of local
politics which effectively shortens the planning horizon to one year, and transforms
the local development plan into a mere compliance document.
B POLICY OPTIONS
1. Enhancing National-Local Coordination
In the context of decentralization, urban development initiatives should be driven
locally. Because large amount of government funds continues to be sourced from the
national government, however, and also because major capital investments require the
approval of national government agencies, such urban development initiatives will
have to be facilitated at the national level.
Clearly, there is much room for the improvement in national-local-relations.
National-local interfaces, which could influence the form and substance of local
development plans and investment programs must be encouraged. As revealed
elsewhere, interfaces between local government officials with representatives of

46
regional and national government agencies has been found to be infrequent and hardly
have any impact on local project priorities. It is, in part, for this reason that national
sectoral concerns hardly form part of local investments decisions and, vice versa,
local development priorities are hardly taken into account in national sectoral
planning. Also not apparent is the integration of national planning initiatives and
frameworks (e.g., gender concerns, plan for children, poverty alleviation) in local
plans and initiatives.
A possible venue for interface is the LDC, a multi-sectoral body created precisely to
ensure representation of various sectors of the local community. Representatives of
national government agencies should probably be allowed to participate in the
deliberations of the LDC to ensure synchronization of national sectoral concerns on
one hand, and local development priorities, on the other. Although patterned after the
Regional Development Council (RDC), the LDC is, in theory, a more powerful body
since, unlike the RDC, it represents an actual unit of government and its decisions are
directly actionable by the LGU concerned. In reality, however, the LDC is moribund
for long periods during the fiscal year, a fact that may suggest a reassessment of its
structure for planning and decision-making. Measures to improve the efficiency of the
LDC, and to enhance its function as a possible venue for local-national interface must
be explored.
2. Strengthening LGU Capacities
There is similarly a need to ensure that governance capabilities and logistical
requirements are available at local levels. An institution or a consortium of
institutions should be designated to undertake the capability building programs.
Beyond collaborative arrangements, there is a need to institutionalized training in
terms of consolidating gains made in previous capacity building programs, and
sustaining efforts at constantly identifying and targeting trainees, and developing
more specialized modules.
These training programs should both be general and specific to the needs of particular
LGUs. Possible areas of capability building include the planning logic and linkages of
planning, investment programming and budgeting, project evaluation and
prioritization, and the improvement of databases. The latter would require the
participation of national and regional agencies involved in deriving, managing, and
dissemination of data relevant to local planning and governance. The individual and
collective efforts of the NEDA, DILG, DOF (Department of Finance) and DBM will
no doubt be important, but what is probably required is a more permanent institution
that will devote full-time attention to managing the logistics, mobilizing and
undertaking the training activities, and providing the needed pre- and post-training
support.
Improving local revenues to provide more resources for project implementation
should form part of this objective. In the short-term, performance-based incentives for
determining the allocation of the IRA (to include national counterpart funds), along
with the tapping of non-traditional sources of revenues (e.g., borrowing, bond
flotation, BOT schemes, etc.) as well as the streamlining of maintenance and other
operating expense (MOOE) allocations should be explored. In the medium and long-
term, efforts must be exerted in increasing the tax autonomy of LGUs (by realigning

47
the existing tax assignment and giving LGUs more taxing powers commensurate with
their expenditure responsibilities) would enhance the accountability of LGU officials
to local communities. LGUs should not only have their own-source revenues, but also
the power to control the amount of revenues they receive at the margin to enable them
to finance the level of services and programs that would make an impact on local
development.
3. Enhancing Participatory Governance
The structure and composition and role of the LDC in planning decision-making and
as a forum for local-national coordination need reassessment. Despite numerous
planning, programming and resource allocation functions assigned to it by the LGC, it
plays a relatively limited role in planning and investment decisions. It is a large,
unwieldy body that rarely meets, and it is the Executive Committee that absorbs most
of its functions for the greater part of the fiscal year. This pattern is probably efficient
and politically convenient. Whether this should be allowed to persist given the
envisioned function of the LDC as a venue for participatory governance is a policy
question that needs to be revisited.
Much reform is also needed at the national and local levels to enhance the
participation of the business sector in various development activities. In particular,
there is a need to reduce the high number of procedures that are required to start a
business, deal with construction-related activities and transfer a property title across
Philippine cities. When compared with other cities in the world, Philippine cities are
not doing all that well in dealing with the business sector.
4. Enhancing National Coordinative Mechanisms
There are numerous agencies that are involved in the provision of services relative to
housing and urban development. It has been observed, in this connection, that the
provision of these services lack synchronization and harmonization. “Council” or
“Committee” type of mechanisms (e.g., the HUDCC and the NLUC) have largely
been relied upon to coordinate urban development, housing and land use activities. In
the absence of budget control and resource allocation powers, experience has shown
that these coordinative mechanisms seem to be inherently weak. Resource allocation
powers seem to be a requirement to ensure effective coordination of the activities of
various agencies.
After careful assessment and evaluation of various alternative proposals, support
should be seriously considered for the creation of a strong Department for Housing
and Urban Development (DHUD). The DHUD should be given budget control over
relevant activities in housing and urban development, and its relationship with various
agencies performing functions relevant to urban development must be clearly
delineated. Its main mandate is to rationalize the structure and functions of the
different housing and urban development agencies and harmonize all housing and
urban development plans, policies, programs and projects of various government
corporations and agencies

48
5. Reorienting Political Leaders
In the final analysis, the success of programs and projects in housing and urban
development rests with local political leaders. Ideally, local political leaders should
submerge political interests in favor of the overall welfare of their respective
communities. However, this is easier said than done in the context of the local
political culture in the country.
But one important intervention has to do with educating/reorienting local political
leaders on the importance of, and the benefits to be derived from medium term,
strategic planning. The experience of the Governance and Local Democracy (GOLD)
project of the United States Agency for International Development and the Local
Governance Support Program or LGSP of the Canadian International Development
Agency in the strengthening of the local planning and governance processes suggests
that the key to the success of these interventions are (a) the early engagement of local
officials in the local planning process so as to promote their commitment to the local
development plans that are formulated, and (b) the participation of broad-based multi-
sectoral groups in the exercise.
For this reason, advocacy among LGU officials of the importance of medium-term
strategic planning must be sustained. The lessons that can be learned from
experiences in “term-based planning” of some areas in Mindanao should also be
examined. Advocacy and reorientation may likewise enhance the linkage of the local
plan with the local budget in that local officials would be easier to persuade to refer to
the strategic local plan and investment program when they identify projects that will
be funded out of their LDF allocations.

49
Chapter V
Vision, Strategic Implications, and Elements of the Framework
A VISION
The NUDHF 1999-2004 vision for urban development in the Philippines remains valid and is
retained for this framework: an urban system that (i) facilitates economic production, (ii)
develops and strengthens local comparative advantages, and (iii) provides all urban residents
with an improving quality of life. (HUDCC 2000)
Based on this vision, and considering the current state of the urban system and the housing
sector, this framework (2008-2010) focuses on the following themes:
Strengthening the competitiveness and poverty reduction role of the urban system,
Improving the sustainability of communities and the provision of housing, and
Intensifying efforts to improve governance.
These themes form the structure of the recommendations of this framework. Consider, first,
however, strategic implications of the performance and drivers of the urban system and the
current institutional environment.
B STRATEGIC IMPLICATIONS3
1. Recognize the arena of urban competition and build on strengths
Much of the future of the country will depend on the performance of its urban system
which, in turn, depends substantially on its overall competitiveness relative to other
urban areas of the world. At least in the short-medium term, capital flows to the
Philippines will be influenced increasingly by the management and performance of
the business, social and physical environment of Mega Manila and other urban
regions of the country—i.e. not just by the cost of doing business but also by the
variety of cultural experiences, the air quality and the efficiency of the public
transportation system, to cite several benchmark examples—vis-à-vis the
metropolitan region of Bangkok, for example, or Jakarta or Ho Chi Minh or other
cities of East Asia.
It is important, therefore, to build up the competitiveness of Philippine cities and this
means building on its strengths—its language and service proficiency in the IT-BPO
sector; natural, cultural and human resources that cater to a growing tourism industry;
the emergence of several large urban markets; active private sector participation in
several sectors; and its decentralized government structure to mention some of the
most prominent—while minimizing the impacts of its weaknesses.
3 The following strategic implications are based on Webster, Corpuz and Pablo 2003.

50
It should also be noted that while national welfare depends largely on the performance
of the urban system, the latter is invariably linked to the rural sector. The success of
the urban system, therefore, cannot be separated from a commensurate improvement
in the living conditions of the rural population.
2. Identify strategic priorities
Given limited resources, capital and other investments need to have strategic focus
and priority in order to avoid their dissipation into many initiatives that will have
minimal collective impact. Identified priority actions, if they are to have meaningful
and sustainable results, should address causes rather than symptoms of development
issues even as they realistically take into account resource limitations. E.g. Onsite
relocation should be given priority over offsite relocation given that livelihood
activities and opportunities close to current places of residence are critical to the
success of relocation activities; the high cost of urban land, however, mandates the
use of medium-high density housing designs.
Ideally, top priority should be given to activities that will lead to the largest positive
impacts to as many people as possible, using the least amount of resources, in the
shortest possible time.
However, it is important to accept that tradeoffs will have to be made, particularly in
terms of investments across sectors and locations. By definition, investment priorities
should not be comprehensive, meaning they should not cover all activities and regions
of the country. It is very convenient politically, for example, to allocate infrastructure
projects to all the regions. But limited resources means that not all of these projects
will be implemented at the same time or that such resources will have to be spread out
to cover many but smaller projects. Clearly, if the objective is to spur regional-scale
growth, the latter is not going to be acceptable because many small individual and
unrelated projects will have minimal impact on their host regions compared to a few
major regional-scale initiatives.
3. Emphasize short term actions without losing sight of strategic objectives
The short-medium term horizon of this framework requires actions which demonstrate
immediate impacts. This is consistent with the political objectives of many local
leaders. However, many issues cannot be resolved in the short term. In these cases the
objective would be to avoid quick-fix cosmetic projects and instead, to implement
projects that yield visible results within the political tenure of political incumbents
but, more importantly, also initiate more sustainable solutions in the future.
Experiences in other countries show that concerted and strategic action can yield
meaningful results within a decade as far as economic growth and even environmental
rehabilitation is concerned.

51
4. Continue to work with the decentralized bureaucracy and local autonomy while
enhancing national-local and inter-local coordination
The decentralized bureaucracy and relative autonomy of local governments in the
Philippines emphasizes the need to work with local initiatives. This also means that
unlike a government with a strong centrist orientation, there will be a greater variation
in opportunities for introducing and implementing urban development projects and
programs across LGUs. Obviously, local governments will be in a better position to
attract and manage urban development by, for example, creating better planning and
investment environments. At the same time, however, national-local as well as inter-
local coordination cannot be assumed and if the system for such coordination is not
yet in place, this will have to be established to ensure consistency in planning and
implementation.
5. Build on private sector participation and partnerships
Private sector participation and partnerships have increasingly been recognized as
vital ingredients to development planning and implementation. In the case of housing
and urban development in the Philippines, the need to rely on private sector
participation is unavoidable given the dominant role of the private sector, especially
when compared to other countries, in housing and other urban development projects.
Further, government has always had limited capital investment capability; national
budget appropriations for infrastructure, for example, has been less than 3% of GDP,
which is less than the 5% target. (Diokno 2008; Bonoan 2007) Enhancing private
sector participation and partnerships, however, will require more transparent
participation and evaluation processes, consistency in enforcement and interpretation
of rules, realistic valuations, and reduced corruption.
C ELEMENTS OF A FRAMEWORK
What has been previously discussed may be grouped into three basic themes that firm the
structure of the framework: (a) the urban system, (b) housing and communities, and (c)
governance.
The first can be divided into two modules, each corresponding to the fundamental objectives
of improving urban competitiveness and poverty reduction. The second theme can similarly
be divided into housing delivery and sustainable communities—micro and macro elements of
the urban system. The third theme serves as the fifth module and cuts across the previous
modules.
The urban system 1 Urban competitiveness
2 Poverty reduction
Housing and communities 3 Housing affordability and delivery
4 Sustainable communities
Governance 5 Performance-oriented governance

52
1. Urban competitiveness
The urban system plays a major role in the economic development of the country.
Given increasing global integration, the extent to which the cities that comprise our
urban system can play this role depends on their competitiveness relative to other
cities of the region and of the world.
2. Poverty alleviation
The continued relatively high poverty incidence in the country is a direct result of the
lack of pro-poor economic growth. As concentrations of economic activity, cities
serve as agents of poverty reduction.
3. Housing affordability and delivery
A significant part of the problem plaguing the housing sector in the country is the lack
of affordability. The fundamental solution to this problem is again rooted in economic
growth, which provides employment and income to households, which can then
increase affordability levels. In the short-medium term, increasing the availability of
housing credit and financial resources as well lowering the cost of land and housing
production can make a significant difference.
4. Sustainable communities
Communities—whether a single neighborhood or an entire city—need a combination
of function and amenity, based on acceptable environmental standards. Ultimately,
they need to be sustainable by providing minimum service standards as well as from
the point of view of global, climate change.
5. Performance-oriented governance
Governance cuts across all modules. It is key to improving urban competitiveness and
poverty reduction, in providing shelter and in the development of sustainable
communities. Improving efficiency, reducing wastage and corruption, and improving
coordination across all layers of bureaucracy are needed while taking into account the
decentralized structure of government.

53
Chapter 6
Strategic Recommendations
The following recommendations are organized according to the themes and modules
described in the previous chapter. It is useful to reiterate that the recommendations are not
exhaustive; some of them are new while others are existing project proposals and/or are part
of other public plan or policy documents. These plan or policy documents tend to be
comprehensive in nature, typically with an extensive list of projects that covers a medium-
long term implementation horizon. Projects included in this framework, however, are
intended to be strategic; they were selected because they lead to the attainment of objectives
that drive the vision of the urban system, given existing resource and institutional constraints.
Those that form part of existing plan or policy documents should not be viewed as re-listed or
existing projects but, rather, as projects that are prioritized and therefore should be
implemented as soon as possible.
A URBAN COMPETITIVENESS
Context
Philippine cities provide the highest levels of service and living standards in the country and
account for the majority of national economic growth. Much of what happens to the country
in terms of production and employment, income and consumption, and access to basic
services and amenities will continue to be determined by the performance of its urban system.
This will be influenced significantly by its competitiveness with other cities in East Asia and
the rest of the world—by its efficiency and the extent to which it can attract investments, for
example, in the BPO, electronics, and medical tourism sectors, vis-à-vis the cities of India,
Vietnam, and Thailand, respectively.
Because they form the largest concentrations of economic activity, metropolitan regions are
at the forefront of the country’s global competition. But urban competitiveness is important to
the entire hierarchy of settlements within the country’s urban system.
First, investments cascade throughout the hierarchy. For example, while IT developments are
attracted primarily to the large labor forces and amenities of the metropolitan regions of
Manila, Cebu and Davao, other regional cities with similar manpower resources and services,
even if smaller in scale, are increasingly attracting the same type of investments. It is
important to point out that the investments attracted to this type of producer services in any
city of the urban system are largely influenced by the competitiveness of the largest city—
that the attraction of provincial or regional cities is affected by how Metro Manila can
compete globally.
Second, individual cities throughout the hierarchy can compete directly with other cities. This
is particularly true for products and services that are based on natural resources, culture,
educational facilities or any other attraction that is unique to a specific locality and which
therefore is not dependent primarily on the competitiveness of large metropolitan areas. In
this case, however, domestic and international access is important. Given that international

54
and even regional gateways are limited to metropolitan centers, transportation and
communication linkages with these centers are critical for other cities of the urban system.
Third, large metropolitan centers, by their very nature, interact substantially with their
adjacent areas. This can be a positive sum relationship, forming a regional cluster of urban
areas anchored by a core metropolitan center. Peripheral areas of this cluster can benefit from
the economies of agglomeration catalyzed by the metropolitan center, integrating into a
network of markets and production that would have been otherwise inaccessible.
Overall, however, as manifested by its inability to undergo consistent, breakthrough
economic growth, the Philippines is characterized by its lack of urban competitiveness.
Although its urban areas account for an overwhelming majority of national economic growth,
they have also been underperforming relative to their potentials and other cities in East Asia.
In particular, the urban system is plagued by:
High transaction costs and production inefficiencies
Lack of infrastructure and service facilities
Inability to attract significant amounts of investments
Outmigration of talent
Diminishing competitiveness of its primary international gateway and service center
(Metro Manila)
Lack of financial resources.
Addressing these problems is not easy or simple. Invariably, however, it is rooted in
improving the competitiveness of the urban system.
Primary strategy
Improve national competitiveness by increasing productivity and efficiency of
urban-industrial regions. Build on existing strengths in manufacturing and
producer services. Focus export oriented activities in core export areas (e.g.
CALABARZON, Cebu, Central Luzon) which are potentially globally
competitive.
The idea is to focus initially on a few urban clusters or corridors (e.g. Calabarzon,
Central Luzon, Cebu, Davao) that have the best chance of competing globally for
investments in services and manufacturing. These investments can: (a) create
relatively higher paying jobs (compared to the rural sector) for the steadily increasing
number of people in the labor force, and (b) anchor and eventually catalyze
developments in nearby regions and eventually in the rest of the country. Some of the
specific initiatives or activities are the following:

55
o Provide strategic infrastructure and services in support of urban-industrial
regions.
Extension of NLEX to La Union; full width of STAR tollway to Batangas
City; extension of SLEX to Quezon.
This supports the Mega Manila (Central Luzon-Metro Manila-Calabarzon)
corridor, the primary urban-industrial and service area of the country. It enhances
the links of Metro Manila with the Batangas port area, complementing the existing
link with Subic-Clark. It also serves to extend economic integration with the
northern and southern edges of the corridor.
Review and revise the BOT law to remove barriers to private sector
participation.
One possible revision is to give intellectual property protection to bidders who
submit unsolicited bids. This will encourage bidders to make more thorough
assessments of their proposals, including innovative measures to enhance
feasibility without involving government subsidy.
Assure the long term supply of clean power.
This is particularly relevant to high technology industries which require a reliable
supply of power at reasonable rates. The need for new power sources is especially
important in Visayas and Mindanao, which are already being threatened with
rolling blackouts.
Protect infrastructure rights-of-ways.
Providing rights-of-way to transportation and other infrastructure projects is a
major constraint, particularly when delays are incurred in implementation.
Identifying and then preventing the unauthorized and inappropriate use of these
rights-of-ways are important tasks to ensure future implementation.
Continue/complete the Nautical Highway including necessary linkage
(land-based) requirements.
Improve efficiency and reduce cost of nautical transport (e.g. address
regulatory vs operational conflicts, prevent imposition of cargo handling
and other unnecessary fees for RORO and CHARO operations).
Establish RORO operations with other archipelagic Asian countries.
Given the archipelagic nature of the country, the completion of the Nautical
Highway, linking Mega Manila with the urban-industrial and service centers of
Cebu and Davao, is a major step towards full economic integration. To maximize
the benefits from the Highway, management and operational reforms that reduce
the cost of nautical transport are also needed. RORO and other linkages with other
countries in Southeast Asia should also be explored to enhance specialization and
efficiency and expand the network of markets served. (Basilio 2008)
56
Improve transport/traffic improvement between airport/port and
industrial zones.
Ensure security (e.g. prevent hijacking) to and from industrial zones.
Learning from the experiences of locators, improving and ensuring the safety of
access to and from industrial zones and service centers (e.g. IT-BPO complexes)
are important factors that promote competitiveness.
o Support national competitiveness at the local government level through local
development planning, investment in catalytic infrastructure, promotion and
investment support programs.
– Integrate local economic development (e.g. City Development Strategy)
and other means by which competitiveness can be enhanced into local
planning.
Local economic development is a critical part of national development, more so
with the decentralized structure of government in the Philippines. And yet little is
understood about what it requires and how it can take place at the local level. The
City Development Strategies Program has been involved in this initiative for more
than a decade already in the Philippines and the experiences and lessons learned
by its participating cities provide realistic lessons for other cities of the urban
system.
– Encourage integration of urban peripheries into metro regions through
local planning and inter-local transportation.
Economic integration is made possible by transportation and other physical
linkages; inter-local cooperation in providing for such projects, by integrating
them in local land use and infrastructure plans, are needed to complement national
and regional initiatives. The proposed C-6 road project that connects the provinces
of Laguna, Rizal and Bulacan around Metro Manila is one example of how urban
peripheries are better integrated into a metropolitan region.
Other Strategies
Support development of strategic clusters; enhance value added of existing
clusters, support local promise, orient developmental planning, research, and
data collection to clusters.
Education, Garments, Furniture, Jewelry, Leathergoods, and Medical clusters are
some of the activities that have existing and/or promising operations. These are based
on local skills, gender considerations, resources and initiatives, and can benefit from
localization economies (similar industries clustering in one location) in urban areas
outside the metropolitan centers.
Increase Metro Manila’s attractiveness as a global service center and visitors
destination by improving basic urban functions, addressing traffic congestion,

57
mobility, pollution, etc.—essentially taking immediate steps to demonstrate that
the city works.
o Establish a scientific traffic and transport planning system; formulate and
disseminate a medium-long term transport development plan based on
international standards.
o Assure the completion of LRT1 Extensions along EDSA (to complete the
EDSA loop with MRT3) and towards Cavite (to integrate with the large
number of industrial activities and urban markets of the southwest).
o Support local initiatives (e.g. by helping provide right-of-way, integration
with traffic operations and aligning infrastructure) to build BRT and other
dedicated transit lines, with priority given to the integration and connection
of central business districts.
Metro Manila is one of the few metropolitan areas of the world that lacks a well
organized transit system. It cannot compete globally without one. Current transport
and traffic management practice is short-term oriented, rely on disruptive ground
experiments, penalize pedestrians and use up more precious urban land than necessary
(i.e. U-turns severely penalize pedestrians by not allowing them to cross or forcing
them to use grade separated walkways, and require unnecessary road widening), and
lack a technically-sound plan to build up an international standard transit system.
The plan should implement pipeline LRT extension projects and focus on the
development of new BRT lines. These extension projects are long overdue and are
needed both to increase transit capacity in Metro Manila as well as to improve
integration with peripheral areas. The development of new BRT lines, on the other
hand, can benefit from the recent experiences of other metropolitan centers in
developing countries (e.g. Bogota, Jakarta); these offer more affordable transit
solutions that can involve the private sector.
o Assure the supply of water; jumpstart Laiban Dam project.
Water supply in the extended Metro Manila region is expected to fall short of
demand by about 2015 if no additional sources are developed. This is
unacceptable. The proposed Laiban dam project, which continues to be stalled,
should be given immediate priority.
o Improve and provide amenities.
Highly visible and utilized amenities are critical elements of competitive cities.
These help improve the quality of life residents and serve as major tourist
destinations. Pedestrian-oriented public amenities which can be immediately
implemented should be identified and supported, e.g. Metro Manila tourism-
entertainment-historical clusters in Makati, Intramuros, Ermita, Quezon City.
o Support the development of Mega Manila in terms of planning, investment
programming, budgeting and implementation of key projects (keeping in
mind that the RDC role of MMDA has not been fulfilled and that MMDA is

58
not capacitated to plan and implement for Metro Manila and, much less, for
a Mega Manila jurisdiction).
Metro Manila and its neighboring regions require a new institutional entity that
provides a system (not ad hoc) where planning and implementation of key projects
can be integrated. The structure and organization of this entity needs to be studied
carefully. Ideally, it should be able to get the cooperation of the LGUs concerned
while providing inter-local or regional guidance. This suggests a politically-astute
leadership that does not pose a political threat to LGUs while maintaining strong
political support from the President. In any case, it is clear, that none of the
existing agencies are equipped or oriented towards this task.
One possible approach is to use a sector-based super-regional structure, e.g. a
water management body for the North Luzon Agri-Business Quadrangle or the
Central Philippines super region. By focusing on a single sector, the institution
becomes less politically threatening and can be more focused on its tasks. And by
adopting the super-region format, it builds on an existing structure, albeit
conceptual at this stage, and minimizes the tendency to dissipate resources by
replicating projects among all existing administrative regions. In the case, of the
Luzon Urban Beltway super region, however, it may be necessary to modify its
boundaries to include Pangasinan province to better suit economic linkages.
Support IT-enabled services to further enhance the country’s competitive
advantage in the sector.
o Further align educational system to support IT requirements, e.g. shift to
non-voice applications.
o Encourage and support application of IT in LGU management and service
systems.
o Support private sector initiatives in IT.
As mentioned earlier, the IT sector is one of the areas where the Philippines enjoys a
competitive edge over most other counties. At the moment, and as expected, IT
investments are focused on the metropolitan centers of the country, although it is also
expected that secondary and other regional cities will be attracting their own share of
IT locators. It is important to maintain, if not increase competitive edge in this sector
by ensuring a properly-trained labor force and infrastructure required by future
demand. This can be done by supporting and complementing private sector initiatives,
particularly the Business Processing Association of the Philippines.
Support tourism sector and its regional/urban-rural linkages.
o Implement an effective open skies policy.
o Integrate international-domestic airport operations, particularly for the
benefit of the customer/passenger.
o Complete ongoing regional airport developments.
59
o Support the continued development of the Mactan tourism zone.
Tourism is another sector with the potential of being a major economic driver for the
country. The major constraints to its further growth are limited international and
domestic access, the development of physical and social infrastructure support
(accommodations, travel agencies, tour operators, etc.) and an integrated network of
tourism destinations, lead by a few tourism zones that have the required critical mass
and aforementioned support structures to attract a high volume of tourists. It is
important that all of these elements are in place as prematurely promoting tourism
traffic without the required support can damage future growth potentials.
B POVERTY ALLEVIATION
Context
Poverty incidence has risen after the declining trend in the previous decades. This reflects
slowing economic growth, the high population growth rate, and the lack of safety nets for
those adversely affected.
Studies have shown that poverty reduction can be addressed through: broad-based labor-
intensive and inclusive growth, good governance and accountability, human and social
development (strategies that target basic social services for the poor), social protection, and
special poverty alleviation policies or direct anti-poverty interventions (Deolalikar 2002).
Economic growth that benefits the poor is a necessary prerequisite. And this is why urban
competitiveness is important—because it is the primary urban-based strategy towards
economic growth.
Comprehensive approaches to poverty reduction need to deal with the urban and rural
dimensions of poverty. Some activities are more rural-oriented such as agrarian reform, land
productivity investments (e.g. irrigation), and improvement of agricultural terms of trade,
while others are common to both urban and rural sectors (e.g. enhanced credit access for
SMEs, reduced corruption, increased and sustained access to education and health services).
But urban areas are especially suited to serve as agents of poverty reduction because of the
concentration of employment and economic activities in cities. Poverty incidence in cities has
been consistently lower than in rural areas and this has continuously attracted and led to the
absorption of rural migrants into the urban labor force.
Setting aside governance policies (which will be covered in a subsequent module), and
keeping in mind that pro-poor economic growth is the primary strategy against poverty,
specific poverty alleviation policies oriented towards urban areas include the following.
Primary Strategies
Support human resource and livelihood programs aimed at poverty alleviation.
o Support vocational education and training programs, including those that
complement IT-BPO and tourism objectives and initiatives.
60
o Encourage labor-intensive cluster development (refer to Urban
Competitiveness module).
Employment and livelihood strategies for poverty alleviation are most effective if
they respond to sectors or industries that have a high demand for labor-intensive work
because this is likely to lead to the employment of more people. Typically, however,
labor-intensive work is also low-wage (as demonstrated by most agricultural jobs).
Recent IT-BPO demand for labor, however, is relatively high in numbers as well as in
terms of wage level, which makes this an ideal industry as far as income growth is
concerned, at least in the short-medium terms, as the industry continues to grow.
Tourism is another industry that has been recognized to have major growth potentials
and which involves a high labor component because of its high service (in
accommodation, hospitality, travel and tours, etc.) component.
Cluster development refers to industries that revolve around a core industry or activity
and therefore benefit from proximity to each other as they fuel each other’s growth.
Many clusters are based on existing local specialization and thus provide
opportunities for local labor employment.
o Implement/expand stay-in-school programs for the poor.
o Provide loans and scholarships for post-secondary education.
Improving the low school participation rate is an important step towards poverty
reduction because education allows much greater opportunities for livelihood and
employment. These opportunities are enhanced as education progresses towards
secondary and tertiary education.
An example of a program that could be implemented is a Conditional Cash Transfer
(CCT) program where families are provided with money with the primary condition
that the children attend school. This program has been quite successful in Latin
America and recent experience in the Philippines has confirmed its positive impact
provided that beneficiaries are properly targeted and that conditionality is maintained;
complementation with other social programs (e.g. transportation and school access
and quality of teaching) also enhances the impact of the program. As in other
programs, good governance, especially operational transparency, has to be in place in
order to ensure that resources are properly utilized. (Son and Florentino 2008)
Encourage smaller size families.
o Population management; family planning
As mentioned earlier, high population growth rates can hamper poverty reduction
efforts. Large families tend to have lower incomes per family member, e.g. average
income per family member of a 4-person family can be 40%-80% higher than a 7-
member family. (FIES 2000) In particular, women may be burdened by successive
childbirths. Reducing family size, by encouraging the increased use of contraceptives
by both women and men, for example, can have a dramatic positive impact on family
income and thus on poverty reduction. (NEDA-NCFRW 2004)

61
Other Strategies
Recognize and enhance rural-urban linkages of poverty alleviation to improve
labor mobility and increase the sharing of market information among rural
producers and urban consumers.
o Increase physical, telecommunication and business linkages with rural areas.
o Expand and intensify internet connections with rural areas.
o Encourage and give incentives to programs that assist in-migrants in terms of
employment, education and service delivery opportunities.
Establishing and maintaining transportation and communication linkages between
urban and rural are important because many of the poor population reside in the rural
areas while the urban areas contain a much greater number of opportunities for
employment and other poverty-reducing activities. Providing affordable internet
access to rural areas is a key strategy because it opens the rural population to
information about new market prospects, more efficient technologies as well as
opportunities that could influence labor mobility.
Even as basic services and facilities should be made available in rural areas, voluntary
migration to the cities should not be discouraged; migrants typically have the greatest
incentive to look for work with the least expectations. These are traits that are not
easy to find in many job markets. (Unfortunately, they are welcomed to cities for the
wrong reasons—primarily viewed as voters by local politicians.)
Instead of policies and programs that seek to keep rural population in rural areas or
return migrants to rural areas, which have been common in the past, ways to make
migrants productive—through community-based livelihood training, jobs placement
and referral systems should be initiated.
Increase entrepreneurial opportunities for the poor.
o Establish a nationwide micro-credit system.
Allowing access to a micro-credit system is a critical income-generating strategy to
move families out of poverty. This involves providing necessary capital to start and
expand small businesses and generate further investments.
Previous experience with the provision of micro-credit shows that it can lead to
increased entrepreneurship among the poor, and improvement in income, savings,
children’s education, health and nutrition, and empowerment of women. Successful
micro-credit programs require substantial funding, appropriate training for
participants, and an effective system of repayment. (NEDA-NCRFW 2004)

62
C HOUSING AFFORDABILITY AND DELIVERY
Context
The country’s housing backlog (195,000 per year between 2005 and 2010) and total
requirement (backlog plus new requirement: about 655,000 by 2010) (Republic of the
Philippines, 2004) remain large and are increasing. Distinguishing the basic characteristics of
the demand for housing is helpful in identifying appropriate policy responses.
Informal sector:
The fundamental problem here is affordability and it can really be addressed only through the
creation of jobs and subsequent increases in household income. In short, the problem with
low-income housing is not of housing but of low income. As with the issue of poverty,
economic growth that lifts households out of their impoverished situation is key. Financial
schemes to aid in the provision of housing for this sector cannot succeed if full recovery is
required.
Commercial housing:
This segment is being served through the financial system, fueled by OFW remittances in
recent years. Increasing access to credit through a secondary mortgage market is one of the
most important measures that can be done to improve the performance of this housing
segment, along with other measures that can broaden and deepen the capital market. Ensuring
the delivery of properly designed and built products by developers and monitoring sales
processes to prevent fraudulent practices are also necessary.
Socialized and low cost housing:
A large component of this segment is supported by government agencies such as Pag-Ibig,
HGC, DBP and until recently the NHMFC. Increasing the availability of funding for this
segment, along with the reduction of costs of production and transactions—e.g. by increasing
land supply available for housing in order to reduce land cost or reforming the land titling and
management system—can improve housing delivery (Lazaro Bernardo Tiu 2006).
Primary Strategies
Increase funding and other resources for proven and key housing programs and
institutions.
o Build on Community Mortgage Program success and strengths.
o Create an effective secondary mortgage institution.
The Community Mortgage Program is a program that has been quite successful in the
past and has an established implementation mechanism. During the 2001-2006 period,
it accounted for 25% of the total housing accomplishment of government (excluding
secure tenure through presidential proclamation), making it the single largest non-
financing contributor to the housing program. It should be continued whenever the
opportunities arise and supported with necessary funding.

63
A secondary mortgage institution has already been proposed in the past and was an
intended result of the Securitization Act of 2004. It did not develop because the
financial returns are too low to attract private funds. Securing funds to support the
startup of a secondary mortgage institution may be difficult at this period of scarce
financing but as the credit crunch eases, soft funding might become available for this
purpose. Repealing the Securitization Act to allow tax incentives originally proposed
for the legislation should also be considered to enhance the viability of a secondary
mortgage institution. (Lazaro Bernardo Tiu 2006)
Streamline housing development transaction processes; reduce transaction costs
and protect housing consumers.
o Establish a Land Administration Authority (integrating the LMB, LRA,
NAMRIA and RODs); support passage of the LARA bill.
The Land Administration Reform Act (LARA) bill has been pending in congress
but has yet to be passed. It is, however, an important contribution towards
reducing transaction costs associated with land titling and management. A key
feature of the bill is to integrate separate land administration agencies into one
institution and to standardize valuation and appraisal activities, among others. The
passage of the bill is a strategic objective because it can reduce the cost of housing
and other land development projects, enhance transparency and good governance,
and help unlock unutilized land capital.
o Continue to streamline permitting process for mass housing projects, e.g.
simplify or do away with multiple ECC requirements for different phases of
the same project.
o Strictly enforce and impose penalties that effectively deter violations by
housing developers.
Protecting consumers is not always given enough attention with the focus on
facilitating production and housing developers. A lot of existing rules and
regulations provide protection to consumers and regulatory agencies need
continued support in enforcement. One approach is to improve collections of
penalties which can then be utilized to support regulatory and enforcement
agencies. An example is the penalty on developers for pre-selling, which is
already relatively low such that there is little incentive to follow regulations
because it is more cost-effective to pay the penalty. Increasing the amount of the
penalty not only improves but also reduces the cost of enforcement.
Other Strategies
Provide incentives to unlock land for affordable housing.
o Raise funds for socialized/low cost housing through guided private sector
redevelopment of public land (e.g. redevelopment of NHA land to raise funds
for relocation and construction of onsite housing facilities).

64
One of the major assets of government agencies is land that they own. Because of
their location, some of these properties are already of considerable value but are
underutilized. Selective disposition and redevelopment of these properties, whether
through sale or lease terms, can help raise much needed resources that can be
channelled to affordable housing.
Selective redevelopment of these properties are also opportunities for urban renewal
that can catalyze local economic and neighbourhood development. It is important,
however, that the disposition and redevelopment of these properties are consistent
with local land use plans, and are carried out with full transparency, possibly with an
advisory body with private sector representatives.
Provide and encourage access to land for affordable housing.
o Adopt measures to enhance reclassification of lands of the public domain into
A &D lands.
o Consider alternative land access modes such as long term leases and usufruct
rights.
o Anticipate and put in place basic infrastructure ahead of settlement to enable
the poor to buy cheaper land in peripheral areas.
These initiatives are intended to make more land available for affordable housing.
Comprising about thirty percent of housing costs, land availability is a major
constraint, particularly with the consistent rise of land prices (or are at least
maintained during economic downturns), the finite supply of land, and limited
transportation infrastructure investments that curtail access to newly urbanizing areas.
Efficiency and innovative initiatives to improve land access, without compromising
environmental integrity, should be considered. These may include shortening the
process in reclassifying public land into A & D (alienable and disposable) land, going
into long term leases and usufruct rights arrangements for public land that cannot be
sold outright to affordable housing developers, and putting in place basic
infrastructure (e.g. roads, utilities) in relatively inexpensive peripheral land which are
anticipated to develop into urban communities.
Link local land use/physical and community development plans with
industry/local employment generating investment programs.
o Provide a framework for the delineation of areas for housing and settlements
development, e.g. national land use code, unified planning guidelines.
Housing developments should be integrated into the rest of their host urban
communities and for lower income housing, affordable access to areas of employment
is especially critical. Failure to provide such access can prevent housing communities
from being occupied as intended, or households from participating in relocation
projects (e.g. as part of urban renewal developments).

65
Ideally, accessibility between housing and employment should be embodied in local
land use plans as well as in industry investment programs. This is usually limited,
however, to formal industrial/export zone projects which integrate onsite as well as
offsite housing into their development designs. Otherwise, typical housing projects do
not take into account access to employment.
The link between housing and employment can be strengthened by providing
incentives to developers (through fiscal incentives or by easing or reducing other
regulatory requirements e.g. an adjusted scale of socialized housing requirements
based on proximity to employment areas), by anticipating places of residence and
places of employment (which can be in mixed use communities) and incorporating
these into local land use plans, and by including housing-employment integration in
national and local planning guidelines.
Explore promising financing sources and schemes.
o Encourage innovative financing (e.g. private sector real estate investment
trusts that redevelop urban core land and which involve the development of
mid- and high-rise community housing).
o Explore concessional loans for socialized/low cost housing programs.
Innovative financing and development schemes can be explored to simultaneously
implement housing and urban redevelopment projects. An example is the use of a
private real estate investment trust as a vehicle to relocate informal settlers. This has
been utilized successfully in other countries (Sri Lanka and Kenya) wherein
properties occupied by informal settlers were redeveloped into medium rise housing
and commercial mixed use projects.
In this scheme, informal settlers agree to vacate land they occupy for shares in the
form of housing units to be developed in a part of the same property. The vacated land
is then conveyed to a private trust that causes the development of a part of the land
into commercial use and a part into medium-high rise housing which will then be
conveyed to the informal settlers. Government mediates between the informal settlers
and the trust.
A key feature of this scheme is that it does not require funding from government or
amortization payments from the informal settler. It does, require, however, that the
property concerned be of potential high commercial value in order to fund both the
housing and commercial developments. (Gunesekera 2008) Informal settlers benefit
because they acquire tenured housing in virtually the same location without
substantial amortization payments. The property owner benefits because he gets part
of the value of the property that is unlocked when it is developed. And government
benefits because it is able to implement a housing and urban renewal project without
using up substantial public resources. In any case, the application of this scheme can
be explored for occupied or idle government properties in downtown urban areas.

66
D SUSTAINABLE COMMUNITIES
Context
Land use and overall management of the built environment is generally ineffective. Basic
services are lacking and service standards are below accepted levels.
Development trends are not sustainable in terms of current overall ecological footprint
estimates for the country as well as with respect to location specific service performance
standards. Zoning regulations continue to be the primary way to establish and enforce
development controls but the extent to which they incorporate sustainability practices and
standards are minimal based on current environment indicators, especially in large urban
centers. Further, implementation and enforcement of zoning ordinances are irregular at best.
There is also a conspicuous lack of public amenities. Overall, environmental conditions are
deteriorating, characterized by:
Diminishing water resources
Increasing energy costs
Poor air quality
Poor, unsanitary solid waste management
Traffic congestion
Increasing threat of disasters (because of continuing population increases and
environmental degradation)
The role of local governments in managing the environment and enhancing the sustainability
of communities is critical because of the decentralized structure of government, but close
coordination with national and regional level initiatives is also necessary.
Decentralization has provided local governments with several ways to promote sustainability.
They can utilize their powers to regulate (zoning), to influence the direction of growth
through infrastructure and other utility projects, and to provide incentives (or disincentives)
through taxation and other fiscal measures.
Primary Strategies
Review traditional zoning and encourage sustainable and private sector
initiatives through performance and service standards.
Use market-based incentives and disincentives to provide public amenities and to
support urban land use objectives.
o Adopt incentive zoning (e.g. density bonuses, tax/RPT incentives).
Incentive zoning can effectively complement traditional exclusionary zoning by
providing positive incentives in the form of density bonuses, fiscal incentives and fast
track processing, to name a few. It is important, however, that such incentives are
thought out carefully so that they do not run counter to other development objectives,
e.g. allowing more density in areas that are already congested and are thus constrained
from absorbing further growth. Incorporating performance standards also allow
flexibility that can tap private sector innovation and creativity. In any case,
67
appropriate consultation and transparency should always be practiced in the
formulation and enforcement of zoning provisions.
Anticipate and encourage sustainable development and building practices in
local zoning and metropolitan plans and other ordinances.
o Establish and support green planning and building standards and
accreditation; integrate appropriate sustainable zoning and green building
practices (e.g. LEED, BREEAM, Greenmark) into building code, local
planning guidelines and zoning ordinances.
o Remove zoning and code obstacles to the application of green technology and
sustainable designs.
o Encourage energy efficiency, renewal energy application, water conservation
and reuse, biodiversity.
International sustainable zoning and building provisions can be used as references to
integrate appropriate standards into local zoning and building codes. Certification
and/or accreditation by established building councils or institutions such LEED or
BREEAM should also be encouraged for the private sector with the objective of
promoting market recognition of sustainability oriented buildings and businesses.
Sometimes existing codes or regulations prevent the application of new sustainable
technologies. This requires a review and revision of such codes to remove obstacles
such as height limits that prohibit wind turbines or obstruction of solar access by
future adjacent developments.
o Take immediate steps to significantly improve urban air quality and to
address the solid waste and sewerage problems.
Improving air quality and ensuring proper solid waste disposal and sewerage
treatment are important components of sustainability initiatives because they deal
directly with the physical environment and affect virtually the entire population.
They are basic environmental concerns that need to be addressed regardless of the
presence or absence of formal sustainability policies or plans. They are also critical
factors in promoting tourism, especially in metropolitan centers, and in improving
local health and sanitation. Because they often transcend local government
boundaries, they are best addressed through metropolitan or regional institutions. Key
areas of intervention include: implementation of urban mass transit projects,
enforcement of regulations against smoke belching and industrial pollution, lifting the
Clean Air Act prohibition on the use of clean incineration technology, and inter-local
(metropolitan) or regional cooperation on the location and operation of sanitary
landfills.
o Encourage pedestrianization and transit and mixed use community
development.
Strategies that promote sustainable communities are consistent with strategies that
have been associated with “smart growth,” “new urbanism,” and other movements
68
that have been formed in response to the sprawl-type of developments that have
characterized North American cities. In general, these strategies, which focus on
promoting pedestrianization, transit and mixed use communities, should be
encouraged.
Other Strategies
Continue to build capacities of LGUs in development and land use planning.
o Conduct appropriate capability-building (including database management)
programs that: introduce and encourage triple bottom line planning
approach (environmental, social, financial/economic objectives); and
recognize the confluence of market and sustainable objectives.
Ultimately, the best way (and perhaps the only way) to ensure that sustainability is
practiced is to make it profitable to be sustainable. This requires shaping the market to
appreciate and thus place a premium on sustainable products and businesses.
Local governments can support market appreciation of sustainability by recognizing
and providing incentives to the private sector for pioneering sustainability practices
and services. One of the basic initiatives towards this objective is to assist in
monitoring and publicizing current levels and trends of energy and water
consumption, solid waste generation and recycling, and other sustainability indicators.
Another is to include sustainability in education and training curricula, especially for
primary and secondary students.
o Prioritize updating of A&D vs forest land and environmentally constrained
land information (including maps) to match development priorities of LGUs.
Local land use planning can go a long way in promoting sustainability. Land use
plans are the basis for zoning ordinances which are legal regulatory instruments that
can establish and enforce sustainability standards and practices. As mentioned earlier,
increased pedestrian activity (vis-à-vis automobile use), compact and mixed use
communities and the increased use of environment friendly transit facilities are
important sustainability objectives and these can be embodied in local land use plans.
These plans, however, depend on relatively accurate maps to define protection areas
and among the most fundamental requirement are delineations of alienable and
disposable (A&D) lands vis-à-vis forest lands.
Integrate disaster risk management into community development.
o Integrate Disaster Risk Management Guidelines into local planning
guidelines.
Disasters are functions of risk and probability—the number of people or amount of
property threatened and the likelihood of an event that will cause the threat. Thus
disasters are more likely to happen as population increases. Increasingly, events that
were simply natural occurrences of nature (e.g. seismic events) are becoming disasters
because more and more people are affected by such events. Fortunately, technology
and an increased understanding of potential disasters also allow us to anticipate and

69
react to these risks in ways that were previously unknown. Guidelines on Disaster
Risk Management prepared under the supervision of the National Economic
Development Authority are already available and, at least, its key components should
be integrated into local planning guidelines.
E PERFORMANCE ORIENTED GOVERNANCE
Context
While the performance of the urban system will determine much of what happens to the
country, the performance of local governments will be a major factor in how the urban
system functions. And despite significant improvements in some areas, service deliveries in
cities have substantial room for improvement in terms of efficiency, coordination and quality.
The Philippines still ranks low globally, even within East Asia, in terms of the ease and cost
of doing business, the process of starting a business, and the strength of legal rights, to cite
several examples. (World Bank 2007) Addressing these issues requires, among others, more
efficient revenue generation, investment and expenditure, as well as performance-oriented
reforms in the processes involved.
Actual and the perception of political interference and corruption deter private sector
participation and investments. Preventing or substantially controlling them will increase the
amount of development resources available for housing, infrastructure and other urban
developments.
Planning and implementation systems are often disconnected and inefficient; vertical
(national-local, provincial-city/municipal, public-private) and horizontal linkages (inter-
sectoral and planning-investment programming-budgeting-implementation) remain weak.
The Joint Memorandum Circular of 2007 (involving DILG, NEDA, DBM and DOF) is a
landmark agreement towards improving national-local planning and implementation and can
serve as a guide to improve vertical coordination. Continued capability building,
improvement of horizontal linkages, and benchmarking are also needed.
Inter-jurisdictional coordination among housing and other support agencies also need to be
strengthened in light of their individual mandates and changing characteristics of the housing
market and the requirements of intended beneficiaries.
Finally, the incongruence between sector- and area-based institutions and organizations
hamper effective governance. This is particularly evident in inter-local (metropolitan)
management and service systems, which are increasingly important given the continued
growth of cities and the formation of de facto metropolitan areas. Very few of these systems
are in place. But they are essential requisites of a competitive urban system.
Primary Strategies
Encourage and create performance-based local governance.
Provide incentives for LGUs to be less IRA-dependent and to mobilize own
source revenues; encourage LGUs to tap innovative financing schemes.

70
o Consider linking part of IRA transfers to LGU performance in (i)
governance effectiveness (mix of activities and efficiency of delivery), (ii)
revenue generation and (iii) effective developmental / capital spending in
order to reward high performing LGUs.
Effective local governance may be enhanced if IRA transfers are also based on some
measure of performance without necessarily reducing base transfers. Performance-
based governance is also encouraged if government is directly responsible for
generating it own resources. Again, without necessarily reducing its IRA, local
governments can increase its other sources of revenues and thus become less IRA-
dependent. Alternative funding and financing schemes for LGUs are already well
known and there is substantial experience to guide such initiatives.
Strengthen LGU capacity building in strategic planning: planning, investment
programming, budgeting and implementation linkages.
o Harmonize local planning, investment programming and budgeting
guidelines.
o Improve data systems tracking the urban system (including standardizing
and simplifying common benchmarks and metrics such as the definition of
urban areas) and compare performance levels across LGUs to encourage
positive competition.
o Designate consortium of institutions for training and capability building.
Horizontal coordination of local planning, investment programming, and budgeting is
weak such that few programs, projects and activities (PPAs) identified at the planning
stage are actually implemented. Instead, other PPAs are somehow inserted at the
investment programming and budgeting phases of the cycle. Harmonizing the way the
various stages of planning, investment programming and budgeting link up can help
ensure that those that are implemented directly address local issues and problems
identified during the planning stage.
Local development efforts can benefit from benchmarks and indicators, especially on
how other local government units are performing, can help provide similar
performance targets and guide the identification of priority PPAs. Sometimes this can
be as basic as having a simple and common definition of urban areas that allow the
derivation of urban performance indicators which are comparable not only with other
local government units but historically as well. Existing indicators on poverty,
education and health service access, and the environment can also be disaggregated to
allow better targeting within a city or municipality.
Improve vertical coordination.
o Operationalize key provisions of JMC 2007.
o Vertically integrate planning guidelines and schedules, e.g. HLURB,
Provincial Development and Physical Framework Plan (PDPFP), National
Framework for Physical Planning (NFPP).

71
o Explore ways to institutionalize the discussion of urban development issues at
the Cabinet level (as opposed to simply being a component of individual
sectoral cluster discussions).
Improving vertical coordination among local, regional, and national agencies is a
major effort and covers a broad area—it can involve both functional (e.g. planning,
investment programming, and budgeting) as well as sectoral linkages (e.g. education,
health, industry, environment, etc.). The Joint Memorandum Circular of 2007
(“Guidelines on the Harmonization of Local Planning, Investment programming,
Budgeting and Expenditure Management, and Revenue Administration”) involving
DILG, NEDA, DBM and DOF is a major initiative towards this objective because of
its comprehensive scope. (It includes planning and budgeting activities across the
different vertical levels and even takes into account local elections.) For this same
reason, it is also more difficult to implement and thus working out its incremental
operationalization is an important strategy.
A major step towards vertical coordination is the harmonization of the planning
guidelines and schedules that are embodied in the HLURB planning guidelines, the
PDPFP planning and investment programming guidelines, and the NFPP. Of
particular importance is the alignment of the HLURB and PDPFP guidelines because
both deal with local government units and because of the fundamental interaction
between the two plans at both levels, i.e. city and municipal plans are basic
components of provincial plans. And a key task that should be prioritized is the
integration of the local development plan with the physical framework plan. Such
integration provides a more direct linkage between physical and sectoral plans,
reduces or removes redundant planning tasks, and allows local planners to be more
efficient given their heavy planning and administrative workloads.
The full import and depth of urban development issues can be underemphasized if
they are viewed piecemeal—when they are presented and discussed by sector. For
example, road infrastructure provides access to livelihood which is a success factor in
the resettlement of informal settlers which, in turn, is a prerequisite for most urban
renewal projects aimed at local economic development and poverty reduction—but all
of these linkages may not be appreciated if the road is viewed separately from
livelihood and livelihood is viewed separately from resettlement and so on.
Evaluating a single sector project in this mosaic of development initiatives fails to
capture the full set of impacts. A mechanism that institutionalizes the discussion of
multi-sectoral, urban development initiatives at the Cabinet and other national levels
of government administration could be instrumental in promoting the success of such
initiatives.
o Enhance national-local interface, e.g. allowing NGA representatives to
participate in LDC deliberations.
o Harmonize government regulatory systems with the private sector deed
restrictions, covenants, etc.
At the local level, one specific measure that can be explored to enhance vertical
coordination is to allow NGA representatives to participate, at least as resource

72
persons, in local development council deliberations that affect planning, investment
programming and budgeting. This will: allow up-to-date sharing of information about
sectoral PPAs among local, regional and national levels; identify points of conflict
and complementation and economies of scale in project development and
implementation (e.g. in terms procurement, implementation schedules, and
monitoring), and establish the division of responsibilities and expectations more
clearly.
Another specific measure is to harmonize government regulations, especially zoning
ordinances, with private sector deed restrictions and covenants where the latter are
still applied. These restrictions can be helpful in establishing more specific
development guidelines that help preserve property values which are often the basis of
local government property-based revenues. In the past, conflicts in the interpretation
of jurisdiction and applicability of private, contractual development restrictions have
been exploited to circumvent contractual obligations to the detriment of local
environmental quality and thus local revenues. They can also lead to corruption
during attempts to resolve such conflicts. Harmonizing local zoning ordinances and
private deed restrictions to remove these conflicts have been effective in promoting
responsible urban development as experienced in Makati and Cebu City.
Other Strategies
Improve coordination among agencies involved in the provision of shelter
services.
o Support creation of Department of Housing and Urban Development
(DHUD) to enhance coordination among shelter agencies.
As mentioned earlier, the creation of a stronger DHUD should be seriously considered
with the objectives of rationalizing the structure and functions of the different housing
and urban development agencies and harmonizing all housing and urban development
plans, policies, programs and projects of various government corporations and
agencies. The DHUD should be given budget control over relevant activities in
housing and urban development, and its relationship with various agencies performing
functions relevant to urban development clearly delineated.
Increase accountability of LGUs and private sector; increase process
transparency to minimize opportunities for corruption; support private-public
partnerships in project implementation.
o Upgrade LGU–client interface systems and automate and apply IT into LGU
systems.
o Standardize and widely publicize administrative processes.
The simple practice of standardizing and widely publicizing administrative processes
has been proven to be very effective in increasing accountability, improving
efficiency and reducing opportunities for corruption. Likewise, the application of IT
in processes dealing with the public, e.g. application and issuance of permits and

73
licenses, payments of taxes and fees, and general information dissemination, can
significantly improve government performance.
Support metro (inter local) jurisdictional cooperation; provide real incentives to
inter-local cooperation; harmonize legal and service management mechanisms
among metropolitan LGUs.
o Create and support urban jurisdictions (initially sector-based) that match
existing functional service areas, starting with the largest metro areas.
Metropolitan or inter-local linkages are increasing with the overall increase of urban
populations and unprecedented mobility allowed by new technologies and fostered by
changing lifestyles. Increasingly, more activities are becoming metropolitan in
coverage. For example, in Metro Manila, inter-LGU (compared to intra-LGU) private
vehicle and transit trips account for the overwhelming majority of trips in the AM
peak (78% and 73%, respectively).
Effective metropolitan management, however, is difficult to create because of the
strong decentralized powers of local governments which have discouraged extended
coordination and cooperation in key urban services and functions such as traffic
management, solid waste management, air quality, security, etc. In general, strong
incentives are needed to induce metro-level planning and coordination. One interim
approach is to focus on specific sectors which are already functioning or have the
potential to function at a metropolitan level. This is less threatening to individual
LGUs and allows a more focused sectoral approach.
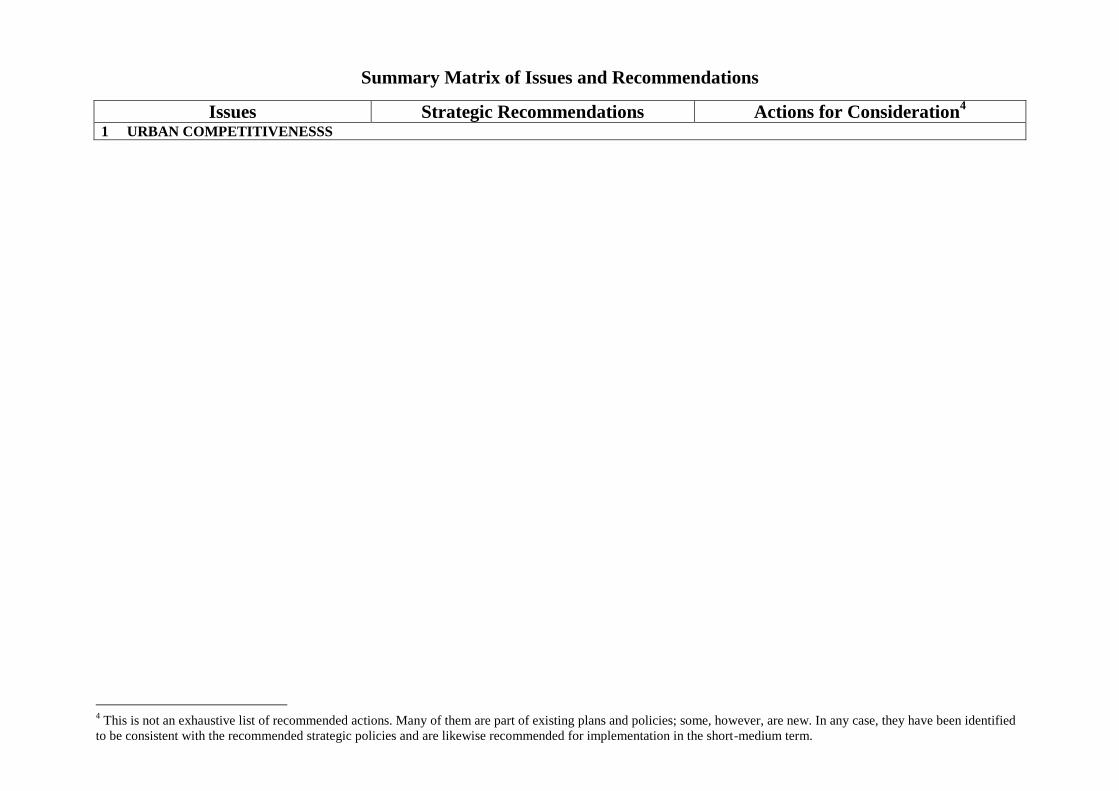
Summary Matrix of Issues and Recommendations
Issues Strategic Recommendations Actions for Consideration4
1 URBAN COMPETITIVENESSS
4 This is not an exhaustive list of recommended actions. Many of them are part of existing plans and policies; some, however, are new. In any case, they have been identified
to be consistent with the recommended strategic policies and are likewise recommended for implementation in the short-medium term.

75
Philippine cities provide the highest levels
of service and living standards in the
country and account for the majority of
national economic growth. Much of what
happens to the country in terms of
production and employment, income and
consumption, and access to basic services
and amenities will continue to be
determined by the performance of its
urban system. This will be influenced
significantly by its competitiveness with
other cities in East Asia and the rest of
the world.
Overall, however, as manifested by its
inability to undergo consistent,
breakthrough economic growth, the
Philippines is characterized by its lack of
urban competitiveness. Although its
urban areas account for an overwhelming
majority of national economic growth,
they have also been underperforming
relative to their potentials and other cities
in East Asia.
In particular, the urban system is plagued
by:
High transaction costs and production
inefficiencies.
Lack of infrastructure and service
facilities.
Inability to attract significant amounts
of investments.
Outmigration of talent.
– Improve national competitiveness by
increasing productivity and efficiency of
urban-industrial regions. Build on existing
strengths in manufacturing and producer
services. Focus export oriented activities in
core export areas (e.g., CALABARZON, Cebu,
Central Luzon) which are potentially globally
competitive.
– Provide strategic infrastructure in support
of urban-industrial regions.
– Support national competitiveness at local
government level through local development
planning, investment in catalytic
infrastructure, promotion and investment
support programs.
– Initiate the extension of NLEX and SLEX to La
Union and Quezon, respectively.
– Remove barriers to private sector
participation/BOT Law review (e.g. giving
protection intellectual property protection to
bidders)
– Assure the long term supply of clean power (as
required by high-tech industries).
– Protect infrastructure rights-of-ways.
– Continue/complete the Nautical highway including
necessary linkage (land-based) requirements.
– Improve efficiency and reduce cost of nautical
transport (e.g. address regulatory vs operational
conflicts, prevent imposition of cargo handling and
other unnecessary fees for RORO and CHARO
operations).
– Establish RORO operations with other archipelagic
Asian countries.
– Improve transport/traffic improvement between
airport/port and manufacturing zones.
– Ensure security (e.g. prevent hijacking) to and from
industrial zones.
– Integrate local economic development (e.g. City
Development Strategy) and other means by which
local competitiveness can be enhanced into local
planning.
– Encourage integration of urban peripheries into
metro regions through local planning and inter-local
transportation (e.g. C-6)
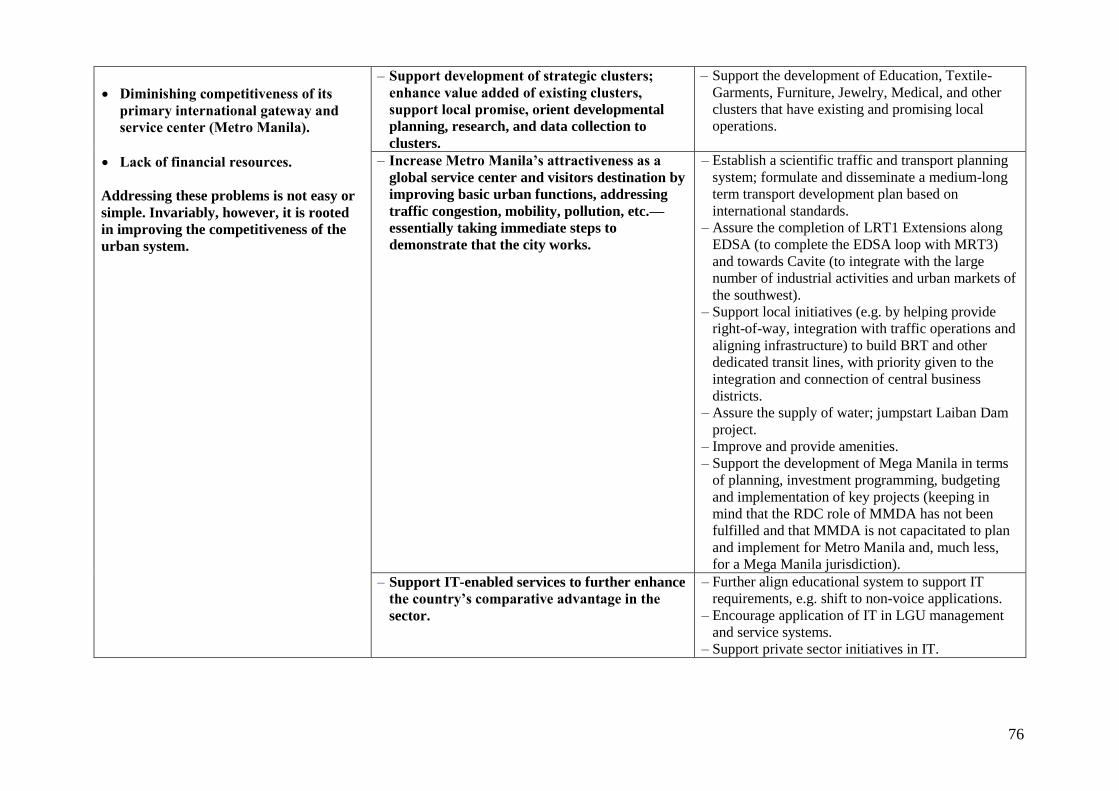
76
Diminishing competitiveness of its
primary international gateway and
service center (Metro Manila).
Lack of financial resources.
Addressing these problems is not easy or
simple. Invariably, however, it is rooted
in improving the competitiveness of the
urban system.
– Support development of strategic clusters;
enhance value added of existing clusters,
support local promise, orient developmental
planning, research, and data collection to
clusters.
– Support the development of Education, Textile-
Garments, Furniture, Jewelry, Medical, and other
clusters that have existing and promising local
operations.
– Increase Metro Manila’s attractiveness as a
global service center and visitors destination by
improving basic urban functions, addressing
traffic congestion, mobility, pollution, etc.—
essentially taking immediate steps to
demonstrate that the city works.
– Establish a scientific traffic and transport planning
system; formulate and disseminate a medium-long
term transport development plan based on
international standards.
– Assure the completion of LRT1 Extensions along
EDSA (to complete the EDSA loop with MRT3)
and towards Cavite (to integrate with the large
number of industrial activities and urban markets of
the southwest).
– Support local initiatives (e.g. by helping provide
right-of-way, integration with traffic operations and
aligning infrastructure) to build BRT and other
dedicated transit lines, with priority given to the
integration and connection of central business
districts.
– Assure the supply of water; jumpstart Laiban Dam
project.
– Improve and provide amenities.
– Support the development of Mega Manila in terms
of planning, investment programming, budgeting
and implementation of key projects (keeping in
mind that the RDC role of MMDA has not been
fulfilled and that MMDA is not capacitated to plan
and implement for Metro Manila and, much less,
for a Mega Manila jurisdiction).
– Support IT-enabled services to further enhance
the country’s comparative advantage in the
sector.
– Further align educational system to support IT
requirements, e.g. shift to non-voice applications.
– Encourage application of IT in LGU management
and service systems.
– Support private sector initiatives in IT.

77
– Support tourism sector and its regional/urban-
rural linkages.
– Implement an effective open skies policy.
– Integrate international-domestic airport operations,
particularly for the benefit of the
customer/passenger.
– Complete ongoing regional airport developments.
– Support the continued development of the Mactan
tourism zone.

78
Issues Strategic Recommendations Actions for Consideration 2 POVERTY ALLEVIATION
Poverty incidence has risen after the
declining trend in the previous decades.
This reflects slowing economic growth,
the high population growth rate, and the
lack of safety nets for those adversely
affected.
Studies have shown that poverty
reduction can be addressed through:
broad-based labor-intensive and inclusive
growth, good governance and
accountability, human and social
development (strategies that target basic
social services for the poor), social
protection, and special poverty
alleviation policies or direct anti-poverty
interventions. Economic growth that
benefits the poor is a necessary
prerequisite. And this is why urban
competitiveness is important—because it
is the primary urban-based strategy
towards economic growth.
High population growth rates can
hamper poverty reduction efforts. Large
families tend to have lower incomes per
– Support human resource and livelihood
programs aimed at poverty alleviation.
– Support vocational education and training
programs, particularly those that can support IT-
BPO and tourism objectives and initiatives.
– Encourage labor-intensive cluster development
(refer to Urban Competitiveness module).
– Implement/expand stay-in-school programs for the
poor.
– Provide loans and scholarships for post-secondary
education.
– Encourage smaller sized families. – Implement a population management/family
planning program.
– Recognize and enhance rural-urban linkages of
poverty alleviation to improve labor mobility
and increase the sharing of market information
among rural producers and urban consumers
– Increase physical, telecommunication and business
linkages with rural areas.
– Expand and intensify internet connections with
rural areas.
– Encourage and give incentives to programs that
assist in-migrants in terms of employment,
education and service delivery opportunities.

79
family member. Reducing family size can
have a dramatic positive impact on
family income and thus on poverty
reduction.
Comprehensive approaches to poverty
reduction need to deal with the urban
and rural dimensions of poverty. But
urban areas are especially suited to serve
as agents of poverty reduction because of
the concentration of employment and
economic activities in cities. Poverty
incidence in cities has been consistently
lower than in rural areas and this has
continuously attracted and led to the
absorption of rural migrants into the
urban labor force.
– Increase entrepreneurial opportunities for the
poor.
– Establish a nationwide micro-credit system.

80
Issues Strategic Recommendations Actions for Consideration 3 HOUSING AFFORDABILITY AND DELIVERY
The country’s housing need (backlog plus
new requirement: about 655,000 by 2010)
remain large and are increasing.
Distinguishing the basic characteristics of
the demand for housing is helpful in
identifying appropriate policy responses.
Informal sector: The fundamental
problem here is affordability and it can
really be addressed only through the
creation of jobs and subsequent increases
in household income. In short, the
problem with low-income housing is not
of housing but of low income. As with the
issue of poverty, economic growth that
lifts households out of their impoverished
situation is key. Financial schemes to aid
in the provision of housing for this sector
cannot succeed if full recovery is
required.
Commercial housing: This segment is
being served through the financial
system, fueled by OFW remittances in
recent years. Increasing access to credit
through a secondary mortgage market is
one of the most important measures that
can be done to improve the performance
of this housing segment, along with other
measures that can broaden and deepen
the capital market. Ensuring the delivery
of properly designed and built products
by developers and monitoring sales
– Increase funding and other resources for
proven and key housing programs and
institutions.
– Build on Community Mortgage Program success
and strengths.
– Create an effective secondary mortgage institution.
– Streamline housing development transaction
processes; reduce transaction costs and protect
housing consumers.
– Establish a Land Administration Authority
(integrating the LMB, LRA, NAMRIA and RODs);
support passage of the LARA bill.
– Continue to streamline permitting process for mass
housing projects, e.g. simplify or do away with
multiple ECC requirements for different phases of
the same project.
– Strictly enforce and impose penalties that
effectively deter violations by housing developers.
– Provide incentives to unlock land for
affordable housing.
– Raise funds for socialized/low cost housing through
guided private sector redevelopment of public land
(e.g. redevelopment of NHA land to raise funds for
relocation and construction of onsite housing
facilities).
– Provide and encourage access to land for
affordable housing.
– Adopt measures to enhance reclassification of lands
of the public domain into A &D lands.
– Consider alternative land access modes such as long
term leases and usufruct rights.
– Anticipate and put in place basic infrastructure
ahead of settlement to enable the poor to buy
cheaper land in peripheral areas.

81
processes to prevent fraudulent practices
are also necessary.
Socialized and low cost housing: A large
component of this segment is supported
by government agencies such as Pag-Ibig,
HGC, DBP and until recently the
NHMFC. Increasing the availability of
funding for this segment, along with the
reduction of costs of production and
transactions—e.g. by increasing land
supply available for housing in order to
reduce land cost or reforming the land
titling and management system—can
improve housing delivery.
– Link local land use/physical and community
development plans with industry/local
employment generating investment programs.
– Provide a framework for the delineation of areas for
housing and settlements development, e.g. national
land use code, unified planning guidelines.
– Explore promising financing sources and
schemes.
– Encourage innovative financing (e.g. private sector
real estate investment trusts that redevelop urban
core land and which involve the development of
mid-highrise community housing).
– Explore concessional loans for socialized/low cost
housing programs.
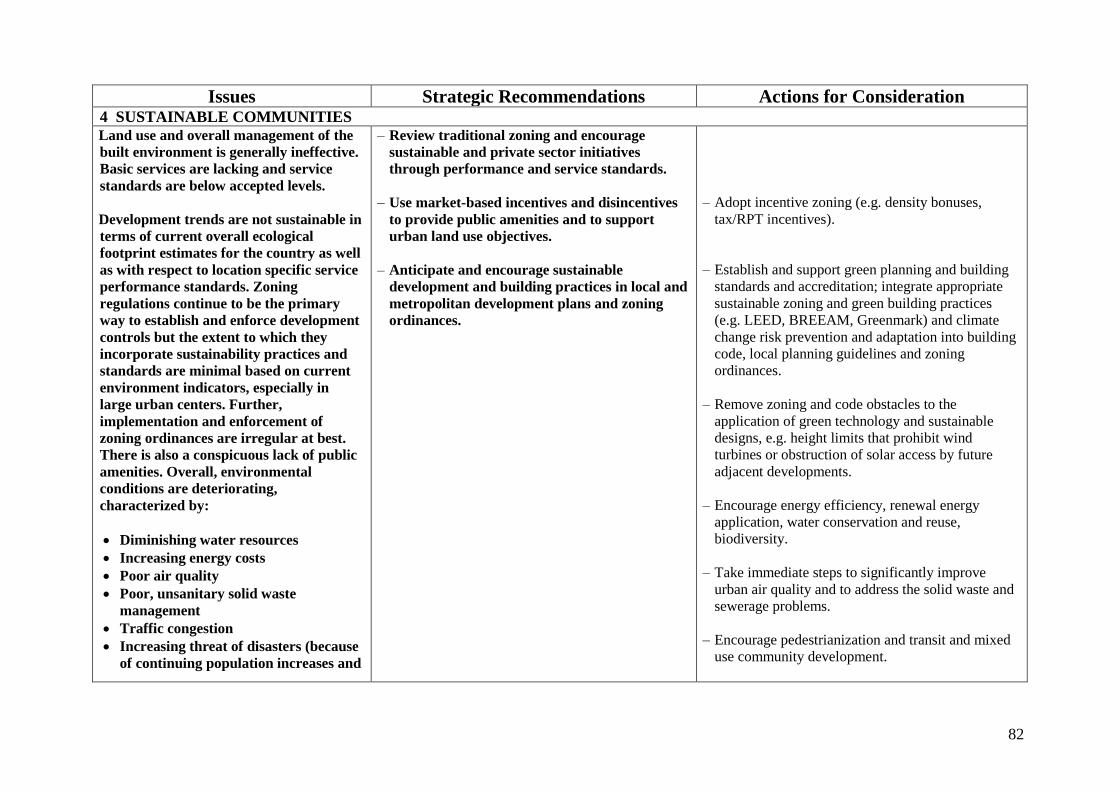
82
Issues Strategic Recommendations Actions for Consideration 4 SUSTAINABLE COMMUNITIES
Land use and overall management of the
built environment is generally ineffective.
Basic services are lacking and service
standards are below accepted levels.
Development trends are not sustainable in
terms of current overall ecological
footprint estimates for the country as well
as with respect to location specific service
performance standards. Zoning
regulations continue to be the primary
way to establish and enforce development
controls but the extent to which they
incorporate sustainability practices and
standards are minimal based on current
environment indicators, especially in
large urban centers. Further,
implementation and enforcement of
zoning ordinances are irregular at best.
There is also a conspicuous lack of public
amenities. Overall, environmental
conditions are deteriorating,
characterized by:
Diminishing water resources
Increasing energy costs
Poor air quality
Poor, unsanitary solid waste
management
Traffic congestion
Increasing threat of disasters (because
of continuing population increases and
– Review traditional zoning and encourage
sustainable and private sector initiatives
through performance and service standards.
– Use market-based incentives and disincentives
to provide public amenities and to support
urban land use objectives.
– Anticipate and encourage sustainable
development and building practices in local and
metropolitan development plans and zoning
ordinances.
– Adopt incentive zoning (e.g. density bonuses,
tax/RPT incentives).
– Establish and support green planning and building
standards and accreditation; integrate appropriate
sustainable zoning and green building practices
(e.g. LEED, BREEAM, Greenmark) and climate
change risk prevention and adaptation into building
code, local planning guidelines and zoning
ordinances.
– Remove zoning and code obstacles to the
application of green technology and sustainable
designs, e.g. height limits that prohibit wind
turbines or obstruction of solar access by future
adjacent developments.
– Encourage energy efficiency, renewal energy
application, water conservation and reuse,
biodiversity.
– Take immediate steps to significantly improve
urban air quality and to address the solid waste and
sewerage problems.
– Encourage pedestrianization and transit and mixed
use community development.

83
environmental degradation)
The role of local governments in
managing the environment and enhancing
the sustainability of communities is
critical because of the decentralized
structure of government, but close
coordination with national and regional
level initiatives is also necessary.
Decentralization has provided local
governments with several ways to
promote sustainability. They can utilize
their powers to regulate (zoning), to
influence the direction of growth through
infrastructure and other utility projects,
and to provide incentives (or
disincentives) through taxation and other
fiscal measures.
– Continue to build capacities of LGUs in
development and land use planning.
– Conduct appropriate capability-building (including
database management) programs that: introduce
and encourage triple bottom line planning approach
(environmental, social, financial/economic
objectives); and recognize the confluence of market
and sustainable objectives.
– Prioritize updating of A&D vs forest land and
environmentally constrained land information
(including maps) to match development priorities of
LGUs.
– Integrate disaster risk management into
community development
– Integrate Disaster Risk Management Guidelines
into local planning guidelines.

84
Issues Strategic Recommendations Actions for Consideration 5 PERFORMANCE ORIENTED GOVERNANCE
While the performance of the urban
system will determine much of what
happens to the country, the performance
of local governments will be a major
factor in how the urban system functions.
And despite significant improvements in
some areas, service deliveries in cities have
substantial room for improvement in
terms of efficiency, coordination and
quality. Addressing these issues requires,
among others, more efficient revenue
generation, investment and expenditure,
as well as performance-oriented reforms
in the processes involved.
Actual and the perception of political
interference and corruption deter private
sector participation and investments.
Preventing or substantially controlling
them will increase the amount of
development resources available for
Encourage and create performance-based local
governance.
Provide incentives for LGUs to be less IRA-
dependent and to mobilize own source
revenues; Encourage LGUs to tap innovative
financing schemes
– Strengthen LGU capacity building in strategic
planning: planning, investment programming,
budgeting and implementation linkages.
– Consider linking part of IRA transfers to LGU
performance in (i) governance effectiveness (mix of
activities and efficiency of delivery), (ii) revenue
generation and (iii) effective developmental / capital
spending in order to reward high performing LGUs.
– Harmonize local planning, investment programming
and budgeting guidelines.
– Improve data systems tracking the urban system
(including standardizing and simplifying common
benchmarks and metrics such as the definition of
urban areas) and compare performance levels across
LGUs to encourage positive competition.
– Designate consortium of institutions for training and
capability building.

85
housing, infrastructure and other urban
developments.
Planning and implementation systems are
often disconnected and inefficient; vertical
(national-local, provincial-city/municipal,
and public-private) and horizontal
linkages (inter-sectoral) remain weak. The
Joint Memorandum Circular of 2007
(involving DILG, NEDA, DBM and DOF)
is a landmark agreement towards
improving national-local planning and
implementation and can serve as a guide
to improve vertical coordination.
Continued capability building,
improvement of horizontal linkages, and
benchmarking are also needed.
Inter-jurisdictional coordination among
housing and other support agencies also
need to be strengthened in light of their
individual mandates and changing
characteristics of the housing market and
the requirements of intended
beneficiaries.
Finally, the incongruence between sector-
and area-based institutions and
organizations hamper effective
governance. This is particularly evident in
inter-local (metropolitan) management
and service systems, which are
increasingly important given the
continued growth of cities and the
formation of de facto metropolitan areas.
Very few of these systems are in place. But
they are essential requisites of a
competitive urban system.
Improve vertical coordination. Operationalize key provisions of JMC 2007.
Vertically integrate planning guidelines and
schedules, e.g. HLURB, PDPFP, NFPP.
Explore ways to institutionalize the discussion of
urban development issues at the Cabinet level (as
opposed to simply being a component of sectoral
cluster discussions).
Enhance national-local interface, e.g. allowing NGA
representatives to participate in LDC deliberations.
Harmonize government regulatory systems with the
private sector deed restrictions, covenants, etc.
Improve coordination among agencies involved
in the provision of shelter services.
– Support creation of DHUD to enhance coordination
among shelter agencies.
Increase accountability of LGUs and private
sector; increase process transparency to
minimize opportunities for corruption; support
private-public partnerships in project
implementation.
Upgrade LGU–client interface systems and
automate and apply IT into LGU systems.
Standardize and widely publicize administrative
processes.
– Support inter -local (metro and subregional)
jurisdictional cooperation; provide real
incentives to inter-local cooperation;
harmonize legal and service management
mechanisms among metropolitan LGUs
Create and support urban jurisdictions (initially
sector-based) that match existing functional service
areas, starting with the largest metro areas.

86

References
Asian Development Bank
1999 Urban Sector Strategy, Manila: ADB
2004 The Garbage Book: Solid Waste Management in Metro Manila
2005 Poverty in the Philippines: Income, Assets and Access
2008 Strategy 2020: The Long Term Strategic Framework of the Asian
Development Bank, 2008-2020.
Associates in Rural Development, Inc.
1993 “A Study on Regional and Local Planning Systems: Book 1 Main Report.”
LDAP Project No. 92-0436. USAID, Philippines.
Balisacan, Arsenio M.
2001 Growth, Inequality, Politics and Poverty Reduction. School of Economics,
University of the Philippines.
Basilio, Enrico
2008 Interview, December 2008.
Bird, Richard
1999 “Rethinking Situational Taxes: a New Look at Tax Assignment,” IMF
Working Paper No. 99/165, Washington, D.C.: International Monetary Fund.
Bonoan, Manuel M.
2007 “DPWH Medium Term Infrastructure Development Program, 2005-2010,”
March 15, 2007
Business World
2008 “Outsourcing firms tag skills, market awareness as key concerns,” December
4, 2008.
Canlas, Dante
“Human Resource Development in the Philippines: Goals, Policies and
Governance,” The Philippine Economy: Alternatives for the 21st Century, D.
Canlas and S. Fujisaki, eds., University of the Philippines Press, Quezon City.
Cariño, Benjamin
1999 “Regional Development and Decentralization Policy.” SPRING Newsletter,
Dortmund, SPRING Center.
Cariño, Benjamin and Cariño, Ledivina
2007 “Urbanization, Industrialization and Land Conversion in the Philippines:
Policy Issues and Problems.”
Cariño, Benjamin V. Arturo G. Corpuz and Rosario G. Manasan

88
2004 “Preparatory Work for the Proposed Technical Assistance on Strengthening
Provincial Planning and Expenditure Management.” Report submitted to the
NEDA and ADB.
China Daily
2008 “Tourism industry growing despite global economic slowdown,” October 22,
2008.
Commission on Information and Communication Technology
2006 “Philippine Strategic Roadmap for the Information and Communication
Technology Sector.”
Corpuz, Arturo
2000 “Technical Study: Towards the Formulation of a National Urban Policy
Agenda,” National Urban Policy Agenda, NEDA.
2003 “Myths and Misconceptions of Urban and Regional Development,” Lecture
delivered during “Housing and Urbanism: Designing Sustainability,”
November 5, 2003, Makati City, Philippines.
2004 “Poverty Alleviation and Economic Growth,” Paper prepared for GTZET-
NEDA.
2006a “Population and Settlements 2,” Provincial Development and Physical
Framework Guidebook, powerpoint presentation, June 2006.
2006b “Centrographic Measures of the Growth of Metro Manila with Comparisons to
the Metropolitan Areas of Bangkok and Jakarta,” 31st Conference, Federation
of Asian Economic Associations, Singapore.
2007 “Integration and Institutionalization of CDS into the National Planning
System,” Cities Alliance Grant, City Development Strategies in the
Philippines: An Enabling Platform for Good Governance and Improving
Service Delivery.
Deolalikar, A. et al.,
2002 “Poverty Reduction and the role of institutions in developing Asia,” Asian
Development Bank, May 2002.
Department of Agrarian Reform
2006 CARP Briefer and Statistical Handbook
Diokno, Benjamin E.
2008 Business World, December 18, 2008.
Gunesekera, Darin
2008 “Lets take the modern homes market home to the people,” lecture delivered in
UP School of Urban and Regional Planning, Diliman, Quezon City.
Habito, Cielito
2008 Philippine Daily Inquirer, Nov. 30, 2008.
Krupnick, Alan, Richard Morgernstern, Carolyn Fischer, et. al

89
2003 “Air Pollution Control Policy Options for Metro Manila,” Resources for the
Future Discussion Paper, Washington, D.C.
Lazaro, Bernardo, Tiu
2006 “Bilateral ODA for Housing: A Concept Note,” paper prepared for Fernando
Zobel de Ayala.
Loehr, William and Rosario G. Manasan
1999 “Fiscal Decentralization and Economic Efficiency: Measurement and
Evaluation,” Report submitted to USAID, Manila.
Manasan, Rosario G.
1992 Fiscal Implications of the Local Government Code of 1991,” Journal of
Philippine Development, Volume XIX, No. 1, Makati, Philippines.
National Economic Development Authority-National Commission on the Role of Filipino
Women (NEDA-NCRFW)
2004 Harmonized Gender and Development Guidelines for Project Development,
Implementation, Monitoring and Evaluation
National Land Use Committee (NLUC)
2000 National Framework for Physical Planning:2001-2030, Manila: NEDA
National Statistical Coordination Board
2007 Philippine Statistical Yearbook
National Statistics Office
2001 Philippine Yearbook
People and Planet
2008 www.peopleandplanet.net/doc.php?id=1110, June 9, 2008.
Pernia, Ernie M.
2008 “Is Labor Export Good Development Policy,” Third Ayala Corporation-UP
School of Economics Economic Forum, October 2008.
Philippine Daily Inquirer
2008 “BPO firms gird for growth, call for increased support, December 3, 2008.
The Philippine Star
2008 “RP tourism reels from global crisis,” November 27, 2008.
Ragrario, Junio M.
2003 “Urban Slums Report: The Case of Metro Manila,” Understanding Slums:
Case Studies for the Global Report on Human Settlements, A Report Prepared
with the Funding of UN-Habitat and produced by the Development Planning
Unit of the University College London
Republic of the Philippines
1991 The Local Government Code of 1991, Annotated by Jose N. Nolledo, National
Book Store, Inc., Metro Manila.

90
2000 National Urban Development and Housing Framework, 1999-2004, prepared
by the Housing and Urban Development Coordinating Council
2002 National Framework for Physical Planning, 2001-2030
2004 Medium Term Philippine Development Plan, 2004-2010
Senate Economic Planning Office
2006 “Housing Sector at a Glance.”
Son, Hyun H. and Florentino, Jhiedon
2008 “Ex-ante Impact Evaluation of Conditional Cash Transfer Program on School
Attendance and Poverty: The Case of the Philippines,” ADB Economics
Working Paper Series, No. 142, December 2008, Asian Development Bank
TTG Asia
2009 ATF Daily, January 9, 2009, p.24.
Torres, Estrella
2008 “Labor Migration to Stay Strong,” Business Mirror, Dec. 3, 2008.
United Nations Population Division
2002 World Urbanization Prospects: The 2001 Revision, New York,
www.un.org/esa/population/publications/wup2001/wup2001dh.pdf
2007 World Urbanization Prospects: The 2007 Revision Database,
http://esa.un.org/unup/
United Nations Conference on Trade and Development (UNCTAD)
2008 World Investment Report 2008: Transnational Corporations and the
Infrastructure Challenge, New York.
Virata, Gigi
2008 “Driving Breakthrough Growth in the Philippine IT-BPO Industry: Next Wave
Cities,” BPAP, September 2008.
The Wallace Business Forum
2008 Vol.9, No.224, December 2, 2008, p.3.
Webster, Douglas, Arturo Corpuz and Christopher Pablo
2003 “Towards a National Urban Development Framework for the Philippines:
Strategic Consideration,” prepared for World Bank-NEDA.
World Bank
1997 Everyone’s Miracle?
2007 Doing Business 2008: East Asia, Washington D.C.
2009 World Development Report 2009: Reshaping Economic Geography,
Washington D.C.
World Travel and Tourism Council
2008 “The 2008 Travel and Tourism Economic Research: Philippines.”

91
Websites:
Department of Trade and Industry
www.dti.gov.ph
Environmental Management Bureau
www.emb.gov.ph
Housing and Urban Development Coordinating Council
www.hudcc.gov.ph
National Economic and Development Authority
www.neda.gov.ph
National Solid Waste Management Commission
www.nswmc.gov.ph
Social Weather Stations
www.sws.org.ph
Supreme Court of the Philippines
www.supremecourt.gov.ph
World Health Organization
www.who.int