national survey results - mclaughlinonline.com
TRANSCRIPT

• Field Dates: October 14th to 18th, 2021
• www.mclaughlinonline.com
National Survey Results
General Election Likely Voters
Political Environment, Trends & Analysis

Direction: United StatesTime Series
38
59
0
10
20
30
40
50
60
70
80
11
/14
1/1
5
2/1
5
3/1
5
4/1
5
5/1
5
6/1
5
7/1
5
8/1
5
9/1
5
10
/15
11
/15
1/1
6
2/1
6
3/1
6
5/1
6
12
/16
1/1
7
2/1
7
3/1
7
4/1
7
5/1
7
8/1
7
10
/17
11
/17
12
/17
1/1
8
2/1
8
3/1
8
4/1
8
5/1
8
6/1
8
7/1
8
8/1
8
9/1
8
10
/18
11
/18
12
/18
2/1
9
3/1
9
5/1
9
6/1
9
7/1
9
9/1
9
10
/19
12
/19
2/2
0
3/2
0
4/2
0
5/2
0
6/2
0
8/2
0
9/2
0
11
/3/2
0
11
/24
/20
12
/20
3/2
1
4/2
1
5/2
1
6/2
1
8/2
1
9/2
1
10
/21
Right Direction Wrong Track
2National - M&A
October 2021

38
59
3
0
10
20
30
40
50
60
70
Right Direction Wrong Track DK/Ref.
R W
East 44 53
Midwest 36 61
South 36 62
West 40 57
Vote Trump 2020 10 88
Vote Biden 2020 64 31
Vote Cong. – GOP 13 85
Vote Cong. – DEM 65 32
Vote Cong.– UND 30 60
Approve Biden 77 19
Disapprove Biden 6 93
Republican 13 86
Democrat 69 27
Independent 29 66
Liberal 60 36
Moderate 46 50
Conservative 14 85
White 32 66
African- American 65 31
Hispanic 38 56
Under 55 41 55
Over 55 34 64
Married 34 64
Single 43 54
Men 42 57
Women 35 61
Live in Urban Area 50 47
Live in Suburban Area 34 64
Live in Rural Area 32 65
Direction: United States
3National - M&A
October 2021

App. Disapp.
East 45 54
Midwest 41 59
South 43 55
West 54 45
Vote Trump 2020 8 91
Vote Biden 2020 80 18
Vote Cong. – GOP 10 89
Vote Cong. – DEM 82 17
Vote Cong.– UND 36 54
Approve Biden 100 0
Disapprove Biden 0 100
Republican 10 88
Democrat 83 16
Independent 39 59
Liberal 71 27
Moderate 56 42
Conservative 15 85
White 37 62
African- American 81 18
Hispanic 50 48
Under 55 49 48
Over 55 39 61
Married 39 60
Single 50 48
Men 45 55
Women 46 53
Live in Urban Area 56 42
Live in Suburban Area 42 57
Live in Rural Area 35 62
Job Rating: Joe Biden
National - M&A
October 20214
45
2421
54
15
39
20
10
20
30
40
50
60
70
Approve Strongly Smwt Disapprove Smwt Strongly DK/Ref.
3/21 4/21 5/21 6/21 8/21 9/21 10/21
Approve 55 58 56 55 54 47 45
Disapprove 40 41 43 44 45 52 54

55
37
8
0
10
20
30
40
50
60
Yes No DK/Refused
Yes No
East 51 39
Midwest 59 37
South 59 33
West 46 44
Vote Trump 2020 90 6
Vote Biden 2020 22 66
Vote Cong. – GOP 89 8
Vote Cong. – DEM 21 68
Vote Cong.– UND 46 27
Approve Biden 17 75
Disapprove Biden 87 6
Republican 88 8
Democrat 23 66
Independent 54 36
Liberal 28 61
Moderate 43 46
Conservative 86 11
White 59 35
African- American 26 60
Hispanic 65 28
Under 55 53 38
Over 55 57 37
Married 63 32
Single 48 41
Men 54 40
Women 56 34
Live in Urban Area 46 45
Live in Suburban Area 57 36
Live in Rural Area 62 29
From what you have seen so far, are you worried about the future of America with Joe Biden as President?
5National - M&A
October 2021

Opinion: Joe BidenTime Series
47
51
10
20
30
40
50
60
70
3/20 4/20 5/20 6/20 8/20 9/20 11/3/20 12/20 3/21 4/21 5/21 6/21 8/21 9/21 10/21
Favorable Unfavorable
National - M&A
October 20216

47
2521
51
12
40
20
10
20
30
40
50
60
70
FAV. Very Smwt UNFAV. Smwt Very NO OPIN.
Fav. Unfav.
East 48 52
Midwest 44 55
South 43 53
West 55 44
Vote Trump 2020 8 91
Vote Biden 2020 83 15
Vote Cong. – GOP 11 87
Vote Cong. – DEM 84 14
Vote Cong.– UND 42 54
Approve Biden 95 4
Disapprove Biden 7 92
Republican 11 87
Democrat 87 11
Independent 40 59
Liberal 73 23
Moderate 57 42
Conservative 17 82
White 39 59
African- American 79 21
Hispanic 50 47
Under 55 51 46
Over 55 41 59
Married 40 59
Single 53 45
Men 45 53
Women 48 50
Live in Urban Area 59 40
Live in Suburban Area 43 55
Live in Rural Area 39 59
Opinion: Joe Biden
National - M&A
October 20217

44
23 21
51
10
42
4 10
10
20
30
40
50
60
70
FAV. Very Smwt UNFAV. Smwt Very NO OPIN. NHO
Fav. Unfav.
East 43 54
Midwest 42 54
South 44 51
West 48 47
Vote Trump 2020 9 89
Vote Biden 2020 78 17
Vote Cong. – GOP 11 87
Vote Cong. – DEM 81 15
Vote Cong.– UND 25 57
Approve Biden 85 12
Disapprove Biden 11 86
Republican 11 86
Democrat 83 12
Independent 36 60
Liberal 74 22
Moderate 50 43
Conservative 15 82
White 38 58
African- American 75 21
Hispanic 45 50
Under 55 49 46
Over 55 38 59
Married 38 59
Single 48 46
Men 40 55
Women 48 48
Live in Urban Area 56 39
Live in Suburban Area 40 57
Live in Rural Area 37 58
Opinion: Kamala Harris
National - M&A
October 20218
5/21 6/21 8/21 9/21 10/21
Favorable 47 47 47 46 44
Unfavorable 48 48 48 50 51

Opinion: Nancy PelosiTime Series
37
57
10
20
30
40
50
60
70Favorable Unfavorable
National - M&A
October 20219
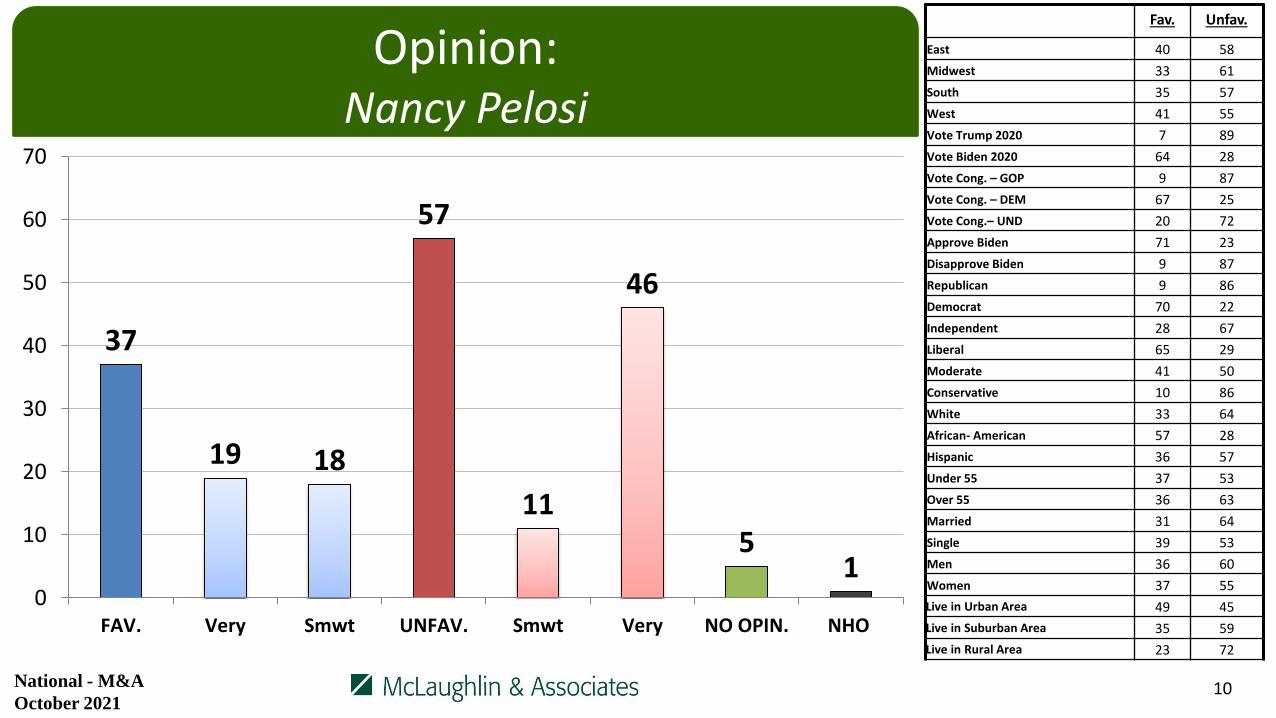
37
19 18
57
11
46
51
0
10
20
30
40
50
60
70
FAV. Very Smwt UNFAV. Smwt Very NO OPIN. NHO
Fav. Unfav.
East 40 58
Midwest 33 61
South 35 57
West 41 55
Vote Trump 2020 7 89
Vote Biden 2020 64 28
Vote Cong. – GOP 9 87
Vote Cong. – DEM 67 25
Vote Cong.– UND 20 72
Approve Biden 71 23
Disapprove Biden 9 87
Republican 9 86
Democrat 70 22
Independent 28 67
Liberal 65 29
Moderate 41 50
Conservative 10 86
White 33 64
African- American 57 28
Hispanic 36 57
Under 55 37 53
Over 55 36 63
Married 31 64
Single 39 53
Men 36 60
Women 37 55
Live in Urban Area 49 45
Live in Suburban Area 35 59
Live in Rural Area 23 72
Opinion: Nancy Pelosi
National - M&A
October 202110

33
1420
47
13
34
137
0
10
20
30
40
50
60
70
FAV. Very Smwt UNFAV. Smwt Very NO OPIN. NHO
Fav. Unfav.
East 44 44
Midwest 32 47
South 28 48
West 34 47
Vote Trump 2020 12 73
Vote Biden 2020 54 23
Vote Cong. – GOP 14 70
Vote Cong. – DEM 55 21
Vote Cong.– UND 17 56
Approve Biden 59 20
Disapprove Biden 12 70
Republican 13 71
Democrat 56 21
Independent 30 50
Liberal 53 24
Moderate 39 35
Conservative 12 75
White 32 52
African- American 40 22
Hispanic 29 50
Under 55 32 40
Over 55 35 57
Married 33 53
Single 33 43
Men 37 53
Women 30 41
Live in Urban Area 42 38
Live in Suburban Area 32 49
Live in Rural Area 24 54
Opinion: Chuck Schumer
National - M&A
October 202111
4/21 5/21 6/21 8/21 9/21 10/21
Favorable 34 32 33 31 32 33
Unfavorable 47 48 43 46 49 47

Generic Ballot: U.S. CongressTime Series
47
48
6
0
10
20
30
40
50
60
2/1
4 3
/14
4/1
4 5
/14
6/1
4 8
/14
9/1
4 1
0/1
4 1
1/1
4 1
/15
2/1
5 3
/15
4/1
5 5
/15
6/1
5 7
/15
8/1
5 9
/15
10
/15
11
/15
1/1
6 2
/16
3/1
6 5
/16
12
/16
1/1
7 2
/20
/17
3/1
7 4
/17
5/1
7 8
/17
10
/17
11
/17
12
/17
1/1
8 2
/18
3/1
8 4
/18
5/1
8 6
/18
7/1
8 8
/18
9/1
8 1
0/1
81
1/1
81
2/1
82
/19
3/1
95
/19
6/1
97
/19
9/1
91
0/1
91
2/1
92
/20
3/2
04
/20
5/2
06
/20
8/2
09
/20
11
/3/2
01
1/2
4/2
01
2/2
0 3
/21
4/2
1 5
/21
6/2
18
/21
9/2
11
0/2
1
Democrat Republican Undecided
National - M&A
October 202112

GOP DEM. UND.
East 43 47 10
Midwest 51 46 3
South 51 45 5
West 43 50 8
Vote Trump 2020 91 3 6
Vote Biden 2020 8 87 6
Vote Cong. – GOP 100 0 0
Vote Cong. – DEM 0 100 0
Vote Cong.– UND 0 0 100
Approve Biden 11 85 5
Disapprove Biden 79 15 6
Republican 96 3 2
Democrat 5 95 1
Independent 43 39 18
Liberal 15 83 2
Moderate 35 53 12
Conservative 85 12 4
White 56 40 5
African- American 11 87 3
Hispanic 47 41 12
Under 55 43 51 7
Over 55 55 41 5
Married 60 36 5
Single 36 56 8
Men 50 43 7
Women 46 50 5
Live in Urban Area 36 59 5
Live in Suburban Area 51 44 5
Live in Rural Area 56 35 9
48
33
96
47
33
6 7 6
0
10
20
30
40
50
60
70
GOP Def. Prob. Lean DEM Def. Prob. Lean UND.
Generic Ballot: U.S. Congress
National - M&A
October 202113

61
18 21
0
10
20
30
40
50
60
70
Capitalism Socialism DK/Ref.
C S
East 67 12
Midwest 61 17
South 56 22
West 63 18
Vote Trump 2020 80 5
Vote Biden 2020 44 30
Vote Cong. – GOP 80 7
Vote Cong. – DEM 43 31
Vote Cong.– UND 49 12
Approve Biden 47 27
Disapprove Biden 74 11
Republican 81 7
Democrat 43 29
Independent 59 19
Liberal 44 37
Moderate 52 17
Conservative 82 5
White 66 14
African- American 40 33
Hispanic 59 21
Under 55 51 26
Over 55 74 8
Married 67 14
Single 54 27
Men 68 18
Women 54 19
Live in Urban Area 56 28
Live in Suburban Area 64 15
Live in Rural Area 60 12
All things being equal, do you prefer: 1. Free Market Capitalism
or.2. Big Government Socialism
7/19 9/19 10/19 12/19 2/20 3/20 4/20 5/20 6/20 8/20 9/20 11/20 12/20 3/21 4/21 5/21 6/21 8/21 10/21
Capitalism 60 61 63 60 61 62 59 61 62 59 60 76 58 60 63 64 63 59 61
Socialism 14 15 14 16 12 13 17 16 15 17 18 24 16 18 19 15 17 16 18
National - M&A
August 202114

76
24
0
10
20
30
40
50
60
70
80
Capitalism Socialism
C S
East 78 22
Midwest 80 20
South 73 27
West 76 24
Vote Trump 2020 92 8
Vote Biden 2020 62 38
Vote Cong. – GOP 90 10
Vote Cong. – DEM 61 39
Vote Cong.– UND 78 21
Approve Biden 65 35
Disapprove Biden 86 14
Republican 90 10
Democrat 62 38
Independent 76 24
Liberal 53 47
Moderate 78 22
Conservative 92 8
White 80 20
African- American 59 41
Hispanic 76 25
Under 55 68 32
Over 55 86 13
Married 81 19
Single 67 33
Men 80 20
Women 72 27
Live in Urban Area 66 34
Live in Suburban Area 78 22
Live in Rural Area 84 16
All things being equal, do you prefer: 1. American Capitalism
or.2. Big Government Socialism
National - M&A
October 202115

78
22
0
10
20
30
40
50
60
70
80
90
American Opportunity Society Big Government Socialism
Amer. Oppor.
Gov’t Socialism
East 78 22
Midwest 77 23
South 78 22
West 77 23
Vote Trump 2020 92 8
Vote Biden 2020 65 35
Vote Cong. – GOP 90 10
Vote Cong. – DEM 64 36
Vote Cong.– UND 83 16
Approve Biden 66 33
Disapprove Biden 88 13
Republican 90 10
Democrat 65 35
Independent 78 22
Liberal 55 45
Moderate 79 20
Conservative 94 6
White 79 21
African- American 70 29
Hispanic 81 20
Under 55 72 28
Over 55 85 15
Married 82 18
Single 69 31
Men 77 23
Women 78 22
Live in Urban Area 65 35
Live in Suburban Area 83 17
Live in Rural Area 83 17
All things being equal, do you prefer…?1. American Opportunity Society
OR,2. Big Government Socialism
16National –Gingrich 360
October 2021
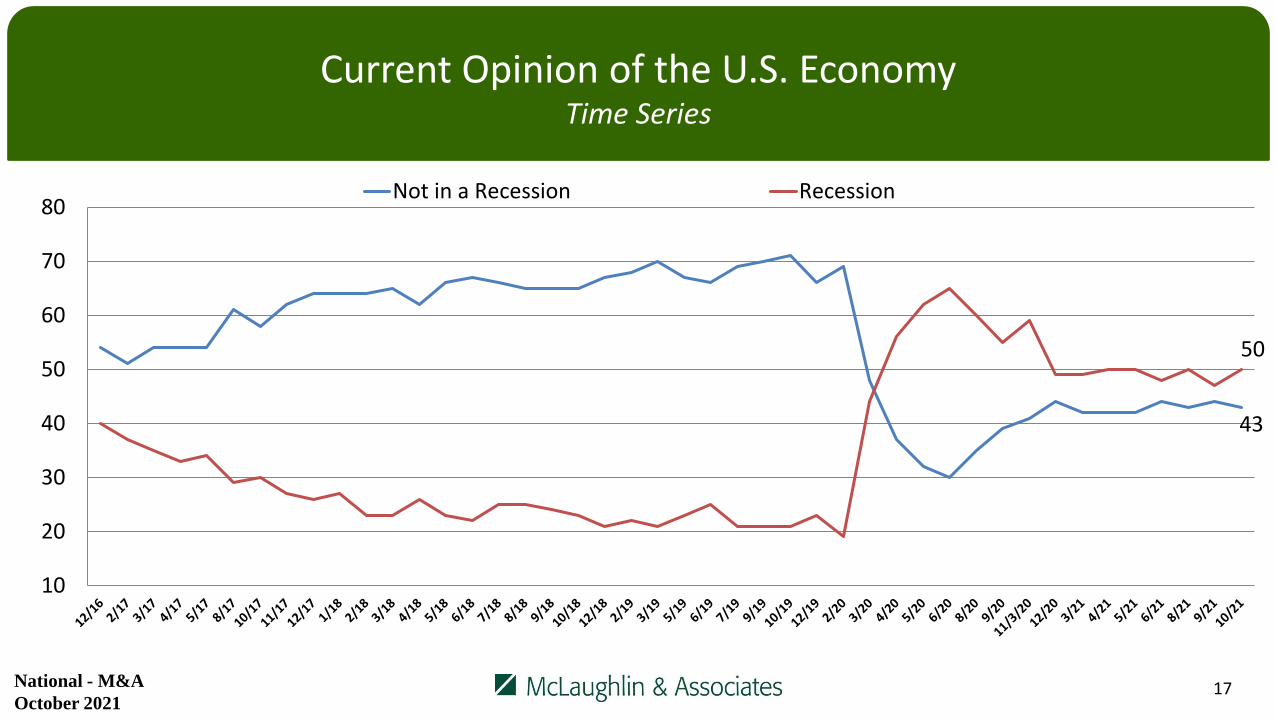
Current Opinion of the U.S. EconomyTime Series
43
50
10
20
30
40
50
60
70
80Not in a Recession Recession
National - M&A
October 202117

Current Opinion of the U.S. EconomyTime Series
36
58
10
20
30
40
50
60
70
80
Getting Better Getting Worse
National - M&A
October 202118

9/19 10/19 12/19 2/20 3/20 4/20 5/20 6/20 8/20 9/20 11/20 12/20 3/21 4/21 5/21 6/21 8/21 9/21 10/21 Rep Dem Ind Lib Mod ConUnder
55
Over
55Men Women
NOT RECESSION 70 71 66 69 48 37 32 30 35 39 41 44 42 42 42 44 43 44 43 37 50 43 52 48 32 44 43 50 37Getting Better 33 36 38 43 17 14 12 16 18 21 20 23 17 21 21 22 21 19 18 9 30 14 30 20 8 19 17 24 13Getting Worse 37 35 28 27 30 24 20 15 17 18 21 21 24 21 21 21 22 25 25 28 20 29 22 29 25 25 25 26 25
RECESSION 21 21 23 19 44 56 62 65 60 55 59 49 49 50 50 48 50 47 50 60 42 49 42 45 61 50 51 46 54
Getting Better 8 9 12 9 11 15 25 29 26 25 28 18 26 31 28 28 23 18 18 8 28 17 24 21 9 20 15 16 19
Getting Worse 14 11 11 11 34 41 37 37 34 31 31 31 23 18 22 20 27 28 33 51 15 32 18 24 52 30 36 30 35
D.K./REFUSED 9 9 12 12 9 7 6 4 5 6 0 8 9 8 8 8 8 9 7 4 8 8 6 7 6 6 7 4 8
GETTING BETTER
41 45 49 52 28 29 38 44 44 45 48 41 44 52 49 50 44 38 36 17 58 31 54 41 17 39 32 40 32
GETTING WORSE
50 46 39 39 64 65 57 52 52 49 52 52 47 39 43 41 49 53 58 79 34 61 40 53 77 55 62 55 60
D.K./REFUSED 9 9 12 12 9 7 6 4 5 6 0 8 9 8 8 8 8 9 7 4 8 8 6 7 6 6 7 4 8
Net Diff. -10 -1 10 13 -36 -37 -19 -8 -8 -4 -3 -11 -3 13 6 9 -5 -16 -22 -63 24 -30 15 -12 -59 -16 -30 -15 -28
Current Opinion of the U.S. EconomyTime Series
National - M&A
October 202119

28
13 16
72
18
54
00
10
20
30
40
50
60
70
Approve StronglyApprove
SomewhatApprove
Disapprove SomewhatDisapprove
StronglyDisapprove
DK/Refuse
Approve Disapp.
East 27 73
Midwest 26 74
South 32 68
West 26 75
Vote Trump 2020 10 90
Vote Biden 2020 45 55
Vote Cong. – GOP 12 88
Vote Cong. – DEM 45 55
Vote Cong.– UND 28 72
Approve Biden 52 48
Disapprove Biden 8 92
Republican 11 89
Democrat 50 51
Independent 22 78
Liberal 48 52
Moderate 31 69
Conservative 10 90
White 22 78
African- American 49 51
Hispanic 37 63
Under 55 37 63
Over 55 16 84
Married 23 77
Single 37 63
Men 29 71
Women 27 73
Live in Urban Area 39 61
Live in Suburban Area 27 73
Live in Rural Area 17 83
Do you approve or disapprove of President Biden’s proposed new federal mileage tax which would tax a driver 8 cents for every mile they drive and cost the average driver
over $1200 a year?
20National - M&A
October 2021

Would you say you most favor a smaller government with fewer services or a larger government with many services?
Time Series
50
36
10
20
30
40
50
60
70
3/1
5 4
/15
5/1
5 6
/15
7/1
5 8
/15
9/1
5 1
0/1
5 1
1/1
5 1
/16
2/1
6 3
/16
5/1
6 1
1/1
6 1
2/1
6 1
/17
2/1
7 3
/17
4/1
7 5
/17
8/1
7 1
0/1
7 1
1/1
7 1
2/1
7 1
/18
2/1
8 3
/18
4/1
8 5
/18
6/1
8 7
/18
8/1
89
/18
10
/18
11
/18
12
/18
2/1
93
/19
5/1
96
/19
7/1
99
/19
10
/19
12
/19
2/2
03
/20
4/2
05
/20
6/2
08
/20
9/2
01
2/2
0 3
/21
4/2
15
/21
6/2
18
/21
9/2
11
0/2
1
Smaller Larger
National - M&A
October 202121

50
36
14
0
10
20
30
40
50
60
70
Smaller Gov't Larger Gov't DK/Ref.
Smaller Larger
East 48 40
Midwest 46 37
South 52 36
West 51 34
Vote Trump 2020 73 17
Vote Biden 2020 29 54
Vote Cong. – GOP 72 19
Vote Cong. – DEM 28 56
Vote Cong.– UND 44 20
Approve Biden 31 54
Disapprove Biden 67 21
Republican 71 19
Democrat 30 56
Independent 50 33
Liberal 26 57
Moderate 42 41
Conservative 75 16
White 52 35
African- American 32 46
Hispanic 56 33
Under 55 44 40
Over 55 58 31
Married 56 33
Single 45 39
Men 53 38
Women 47 35
Live in Urban Area 45 43
Live in Suburban Area 51 35
Live in Rural Area 55 31
Job Rating: Donald Trump
Would you say you most favor a smaller government with fewer services or a larger government with many services?
National - M&A
October 202122
3/21 4/21 5/21 6/21 8/21 9/21 10/21
Smaller Gov’t 51 48 48 48 49 50 50
Larger Gov’t 35 36 37 37 37 34 36

57
2631
35
2213
9
0
10
20
30
40
50
60
70
Likely Very Likely SomewhatLikely
Not Likely Not VeryLikely
Not at AllLikely
DK/Refuse
Likely Not
East 56 34
Midwest 59 34
South 59 33
West 51 38
Vote Trump 2020 64 30
Vote Biden 2020 50 39
Vote Cong. – GOP 65 29
Vote Cong. – DEM 49 40
Vote Cong.– UND 44 39
Approve Biden 51 41
Disapprove Biden 63 29
Republican 66 28
Democrat 54 36
Independent 48 41
Liberal 50 40
Moderate 53 39
Conservative 65 27
White 55 36
African- American 61 29
Hispanic 67 28
Under 55 62 31
Over 55 49 39
Married 60 34
Single 60 31
Men 57 35
Women 56 35
Live in Urban Area 61 30
Live in Suburban Area 54 37
Live in Rural Area 55 36
Joe Biden was 78-years old when he was sworn in and will be 82 at the end of his term. How likely is it that Vice-President Kamala Harris will be president before the end of Joe
Bidens 4-Year term?
23National - M&A
October 2021
5/21 6/21 8/21 9/21 10/21
Likely 64 63 62 58 57
Not Likely 31 30 32 32 35

38 38
24
0
10
20
30
40
50
60
70
Republican Democratic Do Not Vote in Primaries
Job Rating: Donald Trump
INDEPENDENTS ONLY: Thinking ahead to the 2024 primary election for President, in which party’s primary are you more likely to vote –
the Republican primary or the Democratic primary
24
GOP DEM
East 25 35
Midwest 45 39
South 47 32
West 28 50
Vote Trump 2020 72 8
Vote Biden 2020 8 65
Vote Cong. – GOP 73 10
Vote Cong. – DEM 7 70
Vote Cong.– UND 23 36
Approve Biden 8 67
Disapprove Biden 59 18
Republican - -
Democrat - -
Independent 38 38
Liberal 12 66
Moderate 37 39
Conservative 66 9
White 39 31
African- American 20 66
Hispanic 40 51
Under 55 38 49
Over 55 38 24
Married 42 35
Single 37 46
Men 38 37
Women 39 40
Live in Urban Area 39 45
Live in Suburban Area 40 32
Live in Rural Area 32 45National - M&A
October 2021
5/21 6/21 8/21 9/21 10/21
Republican 31 31 40 36 38
Democrat 33 35 36 39 38
Don’t Vote 25 23 25 24 24

25
(11/20: N=445) (12/20: N=443) (3/21: N=443) (4/21: N=458) (5/21: N=459) (6/21: N=463) (8/21: N=467) (9/21: N=476) (10/21: N=473)
11/20 12/20 3/21 4/21 5/21 6/21 8/21 9/21 10/21
Kamala Harris 29 25 28 34 35 31 28 29 29
Michelle Obama 23 29 23 20 16 19 16 17 18
Stacey Abrams * * * * 4 5 4 5 5
Alexandria Ocasio-Cortez 6 7 8 3 7 5 7 7 7
Pete Buttigieg 6 5 7 5 6 4 8 7 9
Amy Klobuchar 2 2 3 4 3 3 2 3 3
Beto O’Rourke * * 2 2 2 3 2 3 3
Cory Booker 2 3 4 4 4 3 5 4 3
John Hickenlooper 1 3 2 2 1 2 2 0 1
Kirsten Gillibrand 1 1 1 2 1 2 1 1 1
Andrew Cuomo 5 5 1 2 1 2 4 2 2
Deval Patrick 1 1 1 1 2 1 3 1 1
Gavin Newsom * * 0 2 2 1 2 2 2
Tim Kaine 1 2 1 1 2 1 1 0 1
Ilhan Omar 1 1 1 1 1 1 * * *
Tom Steyer * * * * * * * 1 1
Joe Manchin * * * * * * * * 2
Undecided 23 18 14 12 13 16 13 18 13
Thinking ahead to the 2024 Democratic primary election for President, if that election were held today among the following candidates, for whom would you vote?
(Democrat Primary Voters)
National - M&A
October 2021

70
21
9
0
10
20
30
40
50
60
70
80
Yes No DK
Yes No
East 64 23
Midwest 65 21
South 74 19
West 73 26
Vote Trump 2020 76 15
Vote Biden 2020 5 91
Vote Cong. – GOP 72 19
Vote Cong. – DEM 12 77
Vote Cong.– UND 68 29
Approve Biden 42 49
Disapprove Biden 73 18
Republican 71 22
Democrat - -
Independent 66 20
Liberal 70 24
Moderate 68 25
Conservative 71 20
White 68 23
African- American 77 23
Hispanic 70 20
Under 55 77 15
Over 55 62 28
Married 69 21
Single 65 26
Men 67 24
Women 73 19
Live in Urban Area 69 23
Live in Suburban Area 68 23
Live in Rural Area 75 16
Job Rating: Donald Trump
Do you want to see Donald Trump run for President again in 2024?(Republican Primary Voters)
National - M&A
October 202126
3/21 4/21 5/21 6/21 8/21 9/21 10/21
Yes 72 69 73 72 66 71 70
No 20 22 17 19 22 21 21

81
63
18 156 10
40
102030405060708090
100
Support StronglySupport
SomewhatSupport
Oppose SomewhatOppose
StronglyOppose
DK/Refuse
Support Oppose
East 68 23
Midwest 85 13
South 85 12
West 79 18
Vote Trump 2020 88 8
Vote Biden 2020 11 88
Vote Cong. – GOP 84 13
Vote Cong. – DEM 30 55
Vote Cong.– UND 59 32
Approve Biden 55 40
Disapprove Biden 84 13
Republican 82 15
Democrat - -
Independent 79 17
Liberal 85 8
Moderate 73 23
Conservative 84 13
White 79 17
African- American 88 12
Hispanic 85 10
Under 55 87 11
Over 55 75 21
Married 80 15
Single 78 20
Men 77 19
Women 85 12
Live in Urban Area 82 18
Live in Suburban Area 81 15
Live in Rural Area 82 13
If Donald Trump ran for President again in 2024, would you support or oppose him for the Republican nomination?
(Republican Primary Voters)
National - M&A
October 202127
3/21 4/21 5/21 6/21 8/21 9/21 10/21
Support 81 82 82 80 82 84 81
Oppose 15 15 13 16 15 14 15

(11/20: N=442) (12/20: N=438) (3/21: N=448) (4/21: N=441) (5/21: N=444) (6/21: N=444) (8/21: N=467) (9/21: N=456) (10/21: N=463)
11/20 12/20 3/21 4/21 5/21 6/21 8/21 9/21 10/21
Donald Trump 53 56 55 55 57 55 54 59 53
Ron DeSantis 2 1 4 7 8 9 11 8 10
Mike Pence 9 11 8 10 10 8 8 10 9
Candace Owens * * 3 2 3 4 2 1 3
Ted Cruz 4 5 5 3 3 4 3 3 3
Nikki Haley 4 3 3 2 5 3 4 2 4
Mitt Romney 4 4 3 3 2 3 3 3 4
Marco Rubio 2 1 1 1 0 1 3 2 2
Tim Scott 1 1 1 1 1 1 0 1 1
John Kasich 3 2 2 3 1 1 2 2 1
Liz Cheney * * * * 1 1 1 2 1
Mike Pompeo 1 1 1 1 1 1 1 1 1
Tom Cotton 1 1 2 1 0 1 0 1 1
Rick Scott 1 0 0 1 1 1 0 1 1
Kristi Noem 1 2 1 0 1 0 2 0 1
Greg Abbott * * * * * * * * 1
Undecided 15 10 10 9 7 7 7 6 6
Thinking ahead to the 2024 Republican primary election for President, if that election were held today among the following candidates, for whom would you vote?
(Republican Primary Voters)
28National - M&A
October 2021

(11/20: N=442) (12/20: N=438) (3/21: N=448) (4/21: N=441) (5/21: N=444) (6/21: N=444) (8/21: N=467) (9/21: N=456) (10/21: N=463)
11/20 12/20 3/21 4/21 5/21 6/21 8/21 9/21 10/21
Ron DeSantis 2 2 9 14 18 24 23 22 24
Mike Pence 30 20 15 19 19 19 11 15 14
Donald Trump, JR 20 20 21 15 13 15 12 19 18
Ted Cruz 5 7 9 10 12 6 9 7 5
Mitt Romney 5 5 6 3 3 5 4 4 5
Nikki Haley 8 6 5 3 5 4 4 4 5
Candace Owens * * 4 4 5 3 6 5 5
Liz Cheney * * * * 1 2 1 2 2
Marco Rubio 2 3 2 3 1 2 4 2 2
Kristi Noem 1 2 2 1 1 1 2 1 2
Mike Pompeo * 1 2 2 2 1 2 2 1
Tim Scott 1 2 2 1 2 1 1 2 2
Tom Cotton 1 2 2 2 1 1 1 1 1
John Kasich 2 3 2 2 2 1 1 2 2
Rick Scott 1 0.4 1 1 0 1 0 1 2
Greg Abbott * * * * * * * * 2
Undecided 21 22 17 14 12 11 14 12 10
Thinking ahead to the 2024 Republican primary election for President, if that election were held today among the following candidates, for whom would you vote?
(Republican Primary Voters)
29National - M&A
October 2021

49
41
6 3
46
37
6 4 4
0
10
20
30
40
50
60
70
Trump Definitely Probably Lean Harris Defnitely Probably Lean Und
Trump Harris Und.
East 48 45 7
Midwest 52 44 5
South 51 46 3
West 45 51 4
Vote Trump 2020 97 2 1
Vote Biden 2020 6 88 7
Vote Cong. – GOP 93 4 3
Vote Cong. – DEM 5 90 5
Vote Cong.– UND 44 39 16
Approve Biden 10 86 4
Disapprove Biden 83 13 4
Republican 92 5 3
Democrat 8 88 4
Independent 49 44 7
Liberal 19 78 3
Moderate 39 56 6
Conservative 83 13 4
White 56 40 4
African- American 12 83 5
Hispanic 56 38 6
Under 55 46 50 4
Over 55 55 41 5
Married 61 35 4
Single 39 55 6
Men 51 44 5
Women 48 49 4
Live in Urban Area 37 59 5
Live in Suburban Area 53 42 5
Live in Rural Area 59 38 3
Now, if the 2024 Presidential election were held today, which one of the following best describes how you would vote in the general election for President between Donald Trump, the Republican candidate and Kamala Harris, the Democrat
candidate, for whom would you vote?
30National - M&A
October 2021
5/21 6/21 8/21 9/21 10/21
Donald Trump 49 49 49 49 49
Kamala Harris 45 45 46 47 46

51
42
10
42
11
30
7
0
10
20
30
40
50
60
70
RepublicanCandidate
Much MoreLikely
Smwht MoreLikely
DemocratCandidate
Much MoreLikely
Smwht MoreLikely
No Impact
Rep Dem
East 51 39
Midwest 54 38
South 52 42
West 47 46
Vote Trump 2020 91 4
Vote Biden 2020 15 76
Vote Cong. – GOP 93 3
Vote Cong. – DEM 10 84
Vote Cong.– UND 37 25
Approve Biden 16 77
Disapprove Biden 81 12
Republican 92 3
Democrat 13 81
Independent 50 39
Liberal 19 75
Moderate 44 46
Conservative 83 12
White 58 35
African- American 17 80
Hispanic 52 40
Under 55 48 45
Over 55 56 36
Married 63 31
Single 40 51
Men 54 38
Women 48 45
Live in Urban Area 43 49
Live in Suburban Area 52 41
Live in Rural Area 62 32
Which of the following candidates are you more likely to vote for congress?A REPUBLICAN CANDIDATE who supports allowing school choice for every American child.
OR,A DEMOCRAT CANDIDATE who supports more funding for government run schools and raising salaries for
government employed teachers.
31National –Gingrich 360
October 2021

5347
00
10
20
30
40
50
60
Parents have protested againstpublic school curriculums thatteach Critical Race Theory and
focus on diversity in sexualorientation.
Parents say that these areimportant topics that deserve to be
taught in schools.
DK/Refused
Protest Teach
East 55 46
Midwest 54 46
South 53 47
West 53 47
Vote Trump 2020 80 20
Vote Biden 2020 29 71
Vote Cong. – GOP 78 22
Vote Cong. – DEM 28 72
Vote Cong.– UND 52 48
Approve Biden 33 67
Disapprove Biden 71 29
Republican 76 24
Democrat 30 70
Independent 55 45
Liberal 24 76
Moderate 43 57
Conservative 86 14
White 59 41
African- American 33 67
Hispanic 56 44
Under 55 48 52
Over 55 61 39
Married 64 36
Single 45 55
Men 59 41
Women 48 52
Live in Urban Area 49 51
Live in Suburban Area 54 47
Live in Rural Area 60 40
Which of the following opinions comes closer to your own?
1.(Some/Other) parents have protested against public school curriculums that teach Critical Race Theory and focus on diversity in sexual orientation.
OR,2.(Other/Some) parents say that these are important topics that deserve to be taught in schools.
32National - DM
October 2021

35
19 16
52
13
39
14
0
10
20
30
40
50
60
70
Agree StronglyAgree
SomewhatAgree
Disagree SomewhatDisagree
StronglyDisagree
DK/Refuse
Agree Disagr.
East 34 48
Midwest 34 53
South 37 51
West 32 54
Vote Trump 2020 16 76
Vote Biden 2020 52 29
Vote Cong. – GOP 20 74
Vote Cong. – DEM 51 29
Vote Cong.– UND 25 45
Approve Biden 58 25
Disapprove Biden 16 75
Republican 19 74
Democrat 57 25
Independent 26 57
Liberal 60 26
Moderate 38 41
Conservative 12 81
White 29 59
African- American 57 24
Hispanic 42 48
Under 55 44 42
Over 55 22 64
Married 31 57
Single 42 43
Men 35 55
Women 35 48
Live in Urban Area 49 38
Live in Suburban Area 30 57
Live in Rural Area 27 59
President Biden has urged the FBI to investigate some of the parents who have protested vigorously about Critical Race Theory curriculum at school board meetings. He has said that they may be domestic terrorists. Do you agree or disagree that these
parents should be investigated?
33National - DM
October 2021

53
24 23
0
10
20
30
40
50
60
People say that President Biden’s weakness in Afghanistan is emboldening China and making them think they can
act militarily against Taiwan without fear of retaliation by the United States.
People say China knows that PresidentBiden will stand firm for Taiwan.
DK/Refused
Weak Strong
East 46 23
Midwest 52 25
South 58 23
West 52 24
Vote Trump 2020 79 8
Vote Biden 2020 29 38
Vote Cong. – GOP 78 10
Vote Cong. – DEM 29 39
Vote Cong.– UND 44 17
Approve Biden 27 44
Disapprove Biden 76 8
Republican 76 12
Democrat 30 38
Independent 54 20
Liberal 32 39
Moderate 46 26
Conservative 76 10
White 57 22
African- American 27 34
Hispanic 61 23
Under 55 50 21
Over 55 57 27
Married 60 23
Single 48 23
Men 56 28
Women 50 20
Live in Urban Area 46 29
Live in Suburban Area 54 22
Live in Rural Area 59 22
Which of the following opinions comes closer to your own?
1.(Some/Other) people say that President Biden’s weakness in Afghanistan is emboldening China and making them think they can act militarily against Taiwan without fear of retaliation by the United States.
OR,2.(Other/Some) people say China knows that President Biden will stand firm for Taiwan.
34National - DM
October 2021

61
43
18
33
16 17
7
0
10
20
30
40
50
60
70
Agree StronglyAgree
SomewhatAgree
Disagree SomewhatDisagree
StronglyDisagree
DK/Refuse
Agree Disagr.
East 56 35
Midwest 62 32
South 62 30
West 61 36
Vote Trump 2020 86 9
Vote Biden 2020 37 55
Vote Cong. – GOP 87 9
Vote Cong. – DEM 35 57
Vote Cong.– UND 50 30
Approve Biden 38 55
Disapprove Biden 81 13
Republican 87 9
Democrat 38 55
Independent 57 34
Liberal 40 55
Moderate 50 38
Conservative 87 10
White 64 30
African- American 44 47
Hispanic 63 28
Under 55 58 32
Over 55 64 33
Married 70 25
Single 54 37
Men 63 33
Women 58 33
Live in Urban Area 56 37
Live in Suburban Area 63 31
Live in Rural Area 61 30
Do you agree or disagree that President Biden is trying to get Congress to spend too much money?
35National - DM
October 2021

60
40
21
30
15 169
0
10
20
30
40
50
60
70
Agree StronglyAgree
SomewhatAgree
Disagree SomewhatDisagree
StronglyDisagree
DK/Refuse
Agree Disagr.
East 57 31
Midwest 60 33
South 64 28
West 58 32
Vote Trump 2020 85 11
Vote Biden 2020 38 48
Vote Cong. – GOP 85 11
Vote Cong. – DEM 36 50
Vote Cong.– UND 55 26
Approve Biden 39 50
Disapprove Biden 80 14
Republican 84 12
Democrat 38 49
Independent 59 29
Liberal 41 47
Moderate 52 35
Conservative 83 13
White 62 29
African- American 41 45
Hispanic 76 20
Under 55 60 30
Over 55 62 30
Married 68 26
Single 57 32
Men 62 32
Women 59 29
Live in Urban Area 60 33
Live in Suburban Area 61 30
Live in Rural Area 61 27
Do you agree or disagree that President Biden is stimulating inflation by spending so much money?
36National - DM
October 2021

52
2923
32
17 15 16
0
10
20
30
40
50
60
70
Agree StronglyAgree
SomewhatAgree
Disagree SomewhatDisagree
StronglyDisagree
DK/Refuse
Agree Disagr.
East 52 33
Midwest 54 27
South 53 32
West 47 34
Vote Trump 2020 65 16
Vote Biden 2020 40 47
Vote Cong. – GOP 67 15
Vote Cong. – DEM 38 49
Vote Cong.– UND 41 32
Approve Biden 41 49
Disapprove Biden 62 18
Republican 68 14
Democrat 41 46
Independent 46 35
Liberal 45 43
Moderate 44 41
Conservative 64 15
White 52 32
African- American 44 35
Hispanic 67 23
Under 55 57 27
Over 55 45 38
Married 58 28
Single 52 32
Men 54 34
Women 50 29
Live in Urban Area 55 32
Live in Suburban Area 50 33
Live in Rural Area 53 28
Some people have criticized President for his inability to get his programs passed by Congress even though he has a majority in both houses. Do you agree or disagree with
this criticism?
37National - DM
October 2021

Now, from the following list, which issue is personally most important to you?4/20 5/20 6/20 8/20 9/20 12/20 3/21 4/21 5/21 6/21 8/21 9/21 10/21 Rep Dem Ind Lib Mod Cons Under 55 Over 55 Men Women
SOCIAL 18 20 30 23 27 22 22 27 24 28 24 23 30 19 36 37 48 31 16 34 25 28 32
Affordable Health care 7 7 7 6 7 7 7 7 7 9 7 7 9 7 10 12 13 10 6 12 6 9 10
Reduce Climate Change 4 6 5 4 5 3 5 6 5 5 7 8 7 3 11 6 14 7 2 7 7 8 6
Protect Medicare 4 4 5 5 6 4 4 5 4 5 4 4 6 4 7 8 6 8 4 4 9 7 6
Improving Education 3 4 5 4 3 3 2 4 3 4 4 2 4 3 4 5 5 4 2 6 1 3 5
Improve Race Relations * * 8 7 6 5 4 6 4 4 3 2 4 1 5 7 9 2 1 6 1 3 5
ECONOMIC 26 31 22 23 22 26 25 21 27 25 24 23 23 26 20 24 13 29 26 26 20 24 23
Reopening the Economy 11 16 11 13 10 12 13 9 15 7 5 6 6 8 4 5 3 7 7 7 4 6 6
Reduce Gov’t Waste 4 3 4 3 3 4 5 6 5 6 5 4 4 6 3 3 1 4 7 3 6 4 4
Create Jobs 5 7 8 7 9 9 7 7 8 6 7 7 6 4 7 8 5 9 4 9 2 6 6
Reduce Inflation * * * * * * * * * 5 7 6 8 8 7 8 5 9 8 8 8 8 7
SECURITY 6 5 11 13 12 11 14 20 20 20 17 20 18 35 6 12 4 10 36 14 24 19 17
Fix Immigration 3 2 3 2 2 3 4 5 12 11 11 11 12 24 3 8 2 4 26 8 18 13 11National
Security/Terrorism 3 3 3 4 4 3 5 3 5 5 4 8 4 9 2 2 1 4 7 4 5 4 5
Fight Crime/Law & Order * * 5 5 6 5 6 12 3 4 2 2 2 2 2 2 1 2 3 2 2 2 2
CORONAVIRUS 41 31 24 30 25 30 27 21 16 14 20 21 17 8 27 14 23 20 9 17 17 17 16
Stop Spread 22 15 13 17 17 21 17 15 11 10 16 17 13 6 21 10 16 16 7 13 12 13 13
Distribute Vaccine * * * * * * 10 7 5 4 4 4 4 2 6 3 7 3 3 4 4 5 3
HONESTY/INTEGRITY/D.C. 8 11 10 10 11 10 9 9 11 8 9 8 8 8 8 7 8 7 7 4 12 8 7
RE-EXAMINING 2020 ELEC. * * * * * * * * * 4 5 4 4 5 2 5 2 3 5 4 3 3 4
DK/Refused 2 1 2 2 3 2 2 2 3 2 1 2 1 1 1 1 1 0 1 1 1 1 1
National - M&A
October 202138

Total Rep Dem Ind Lib Mod Cons Under 55 Over 55 Men Women
Facebook 75 73 77 74 76 76 72 76 73 71 78
YouTube 66 64 66 67 71 64 63 77 50 67 65
Instagram 42 39 48 39 52 42 35 56 23 35 49
Twitter 33 29 39 32 43 32 28 41 22 37 30
Pinterest 27 24 33 23 28 26 27 31 21 14 39
TikTok 25 23 29 20 30 26 18 37 7 18 30
Linked-In 23 23 23 25 23 24 23 24 22 29 18
SnapChat 21 19 24 21 29 22 15 33 5 17 26
WhatsApp 17 15 21 14 21 16 14 22 9 19 15
Reddit 14 13 13 18 18 14 12 20 6 18 11
Telegram 7 5 10 5 10 5 5 9 3 8 6
Tumblr 6 3 8 5 10 6 2 8 2 6 5
Rumble 4 6 4 2 4 2 6 5 2 3 5
Parler 4 6 2 4 3 3 5 5 3 4 4
GAB.com 2 3 2 2 2 1 4 3 1 2 2
CloutHub 1 1 2 0 2 1 2 2 0 1 2
GETTR 2 2 2 2 2 2 2 2 1 2 2
Other 0 2 0 0 1 0 2 1 1 1 1
None 7 7 7 8 5 7 10 4 13 9 6
From the following list, which social media networks do you use?
National - M&A
October 202139

16
4 4 62
80
4
-5
5
15
25
35
45
55
65
75
85
Yes UniformedServices
Other PublicServices
Private Sector More Than 1 None DK/Refused
Do you or does any member of your family who lives in this household belong to a uniformed-services labor union, such as a police or firefighters’ union; another public-
services union, such as a teachers’ union, or a private-sector labor union?
40
Yes None
East 18 77
Midwest 16 80
South 16 81
West 15 82
Vote Trump 2020 15 82
Vote Biden 2020 16 79
Vote Cong. – GOP 16 80
Vote Cong. – DEM 16 81
Vote Cong.– UND 18 74
Approve Biden 20 76
Disapprove Biden 13 84
Republican 16 80
Democrat 20 76
Independent 10 86
Liberal 24 71
Moderate 17 80
Conservative 8 87
White 13 84
African- American 16 74
Hispanic 28 69
Under 55 23 72
Over 55 6 92
Married 19 79
Single 16 77
Men 18 78
Women 14 82
Live in Urban Area 20 76
Live in Suburban Area 17 79
Live in Rural Area 8 89
National - M&A
October 2021

36
96
17
2 2
63
20
10
20
30
40
50
60
70
Yes Immigrated Parents Grandparents ImmediateHousehold
More Than 1 ofAbove
None DK/Refused
Are you, your parents or grandparents or someone in your immediate household an immigrant to the United States?
41
Yes None
East 49 50
Midwest 28 71
South 31 67
West 41 58
Vote Trump 2020 37 62
Vote Biden 2020 35 63
Vote Cong. – GOP 38 61
Vote Cong. – DEM 32 66
Vote Cong.– UND 51 48
Approve Biden 38 61
Disapprove Biden 35 64
Republican 38 61
Democrat 33 65
Independent 37 62
Liberal 39 60
Moderate 37 62
Conservative 33 65
White 32 66
African- American 17 83
Hispanic 65 34
Under 55 33 65
Over 55 40 59
Married 41 58
Single 31 68
Men 41 58
Women 31 67
Live in Urban Area 37 61
Live in Suburban Area 40 58
Live in Rural Area 23 77
National - M&A
October 2021

Total Total Total
Party: Age: Area:
Republican 36 18-29 17 Urban 30
Democrat 37 30-40 16 Suburban 49
Ind./Other/D.K./Ref. 27 41-55 25 Rural 21
Ideology: 56-65 20 Region:
Liberal 30 Over 65 22 New England 5
Moderate 33 Mean 49.2 Middle Atlantic 13
Conservative 37 Race: East North Central 15
Gender: White 68 West North Central 7
Male 48 African American/Black 13 South Atlantic 22
Female 52 Hispanic 13 East South Central 6
Asian 4 West South Central 11
Vote Behavior: Mountain 8
Democrat 45 Pacific 14
Ticket Splitter 12
Republican 43
Voter Profile: n= 1,000
42

New York Office566 South Route 303Blauvelt, NY 10913
845-365-2000
D.C./Virginia Office919 Prince Street
Alexandria, VA 22314703-518-4445
www.mclaughlinonline.com
National - M&A
October 202143