national student survey analysis
TRANSCRIPT
National Student Survey Analysis 2020–2021 ADMINISTRATION
Page 1
2020–2021 Administration
NATIONALSTUDENT SURVEYANALYSIS


National Student Survey Analysis 2020–2021 ADMINISTRATION
Page 3
Executive Summary
This report provides an overview of the results for a national high school student survey conducted
during the 2020–2021 school year. The survey was created by Resonant Education staff members in
collaboration with the Aspen Institute to ask students about their participation in sports as well as
other perceptions about sports in high school.
Overall, nearly 6,000 students responded to the survey from schools representing all regions of the
country as well as school types (Public, Private, and Charter) and urbanicity (Urban, Suburban, and
Rural). The results provide critical information about the experience of high school students in
sports both before and during the COVID-19 pandemic. There are several notable results that could
inform key decisions that are listed below and explained in further detail within the report.
Previously Played High School SportsAcross Genders
Basketball 24%
Soccer 21%
Track & Field 19%
Volleyball 17%
Football 16%
Most Requested Sports Not Offeredat Their School
Archery 13%
Gymnastics 7%
Lacrosse 7%
Bowling 7%
Students in charter schools were more likely to report that they wanted more options for sports offered at their school. Most frequent requests were for sports often common in traditional schools (swimming and football).
The most requested sport for Black students was gymnastics (13% compared to the overall average of 7%). This sport was especially requested by females.
Why Students Engaged in Sports
Having fun 81%#1
#2
#3
#4
#5
#6
Exercise 79%
Learning and improving skills 66%
Playing with and making new friends 64%
Competing (testing myself against others) 59%
Winning games 53%
Black students were much more likely than other races and ethnicities to report playing sports for college scholarships (50% versus overall average of 39%) while White students were more likely to report belonging to a group than other races and ethnicities.
Motivation for Playing Sportsfor Males And Females
Male Female
Competing 64% 54%
60% 48%
41% 56%
29% 38%
37% 46%
Winning games
Mental health & well-being
Belonging to a group
College applications

National Student Survey Analysis 2020–2021 ADMINISTRATION
Page 4
Top Reasons Why Students Are Not Participating in High School Sports
Concern for Catching or TransmittingCOVID-19 by Playing Sports — bySchool Type and Gender
Schoolwork 42%#1
#2
#3
#4
Not enjoying sports 32%
Not having sports that are of interest 26%
I don’t think I’m good enough 25%
White students had higher interest levels in outdoor activities and climbing and Black students were most likely to be interested in dance as an activity (28% vs 19% overall).
As students got older, they were less likely to agree with statements such as “Coaches at my school value every member of the team” and “Coaches at my school have positive relationships with all of their players.” Items were scored on a a five-point frequency scale, from Never (1) to Almost Always (5).
Interest in Participating in PhysicalActivities for Males and Females
Male Female
Not concerned
Strength training
7% 33%
4% 32%
17% 24%
20% 9%
44% 29%
26% 23%Biking
Rural 43%
34%Overall
Male 43%
29%Female
Coaches at myschool value everymember of the team
Very concerned
Urban 31%
22%Overall
Black 37%
37%Asian
15%White
Parkour
Skateboarding
Yoga
Dance
Student Perceptions of AthleticPersonnel by Grade
4.28
4.234.11
3.97
Coaches at my schoolhave positiverelationships with allof the players
Grade 9 10 11 12
4.26
4.274.17
4.09
The report includes each question broken down
by school type (Public, Private, and Charter),
urbanicity (Urban, Rural, and Suburban), gender,
and race/ethnicity.
National Student Survey Analysis 2020–2021 ADMINISTRATION
Page 5
IntroductionThe Aspen Institute has partnered with Resonant
Education to design and implement a national
student survey to collect information about a
variety of topics primarily related to high school
student perceptions of sports. This report provides
an overview of the findings of a quantitative
analysis of survey results.
Project BackgroundThe Aspen Institute’s Project Play launched a
major new phase of its work called Reimagining
School Sports in America, in partnership with
Adidas/BOKS, The DICK’S Sporting Goods
Foundation and the Hospital for Special Surgery.
This multiyear initiative aims to identify strategies
and models that engage and create more healthy
opportunities for students.
As part of this initiative, the Aspen Institute
partnered with Resonant Education to administer
an anonymous, online student survey to capture
the thoughts of high school students on a range
of topics related to sports, in order to better
understand their needs, interests, and attitudes.
Since 2014, Resonant Education’s mission has
been to improve educational experiences for
students, educators, and parents around the
country by enhancing the data used to drive
decisions. Resonant partners with organizations to
design and deliver the highest quality educational
surveys, assessments, and evaluations available.
Resonant Education has conducted surveys and
assessments in several of the largest districts and
educational organizations across the country.
Survey MethodologyThe survey was created by Resonant Education
staff members in collaboration with the Aspen
Institute and launched in September 2020, during
the COVID-19 pandemic. The survey includes items
that asked students about the types of sports
they have played previously, what sports they
planned to play in the future assuming they would
be allowed to play again, and what sports they
wish their school offered. It also included similar
questions for non-sport activities. The survey also
looked at sport motivation, both why students
choose to play a sport and why they choose not to
play a sport, as well as the student’s experience in
school with both PE classes and athletic personnel.
Finally, given that the survey was administered
during the height of the COVID-19 pandemic,
questions were included that related to sports and
COVID-19.
The survey was conducted online and schools
that participated were given a unique web link
to share with all of their students. Since each
school received one link, student responses were
completely anonymous. School personnel were
encouraged to distribute their web link to students
using whatever channels worked best for their
school. Common distribution channels included
posting the link on the school’s online learning
platform, sending the link to students over email,
and having the link provided directly to students
by a teacher at the end of PE class time. Schools
were recruited for participation in the survey over
email and their participation in the survey was
completely voluntary.
National Student Survey Analysis 2020–2021 ADMINISTRATION
Page 6
Upon completion of the survey, school personnel
received access to the results of their school’s
survey in Resonant Education’s online reporting
platform. They were able to review all item
responses, noting that results were suppressed
when sample sizes were not large enough to
protect the identity of student respondents.
Schools were able to use this data for future
planning needs or as part of Title IX reporting. The
survey was open between September 14, 2020, and
March 1, 2021.
SampleOverall, there were 5,932 total survey responses.
Survey responses were checked for minimum
time spent on the survey, that all questions were
answered, and answer variation (e.g., no straight-
line answers) to ensure valid responses. No
responses were identified as needing deletion.
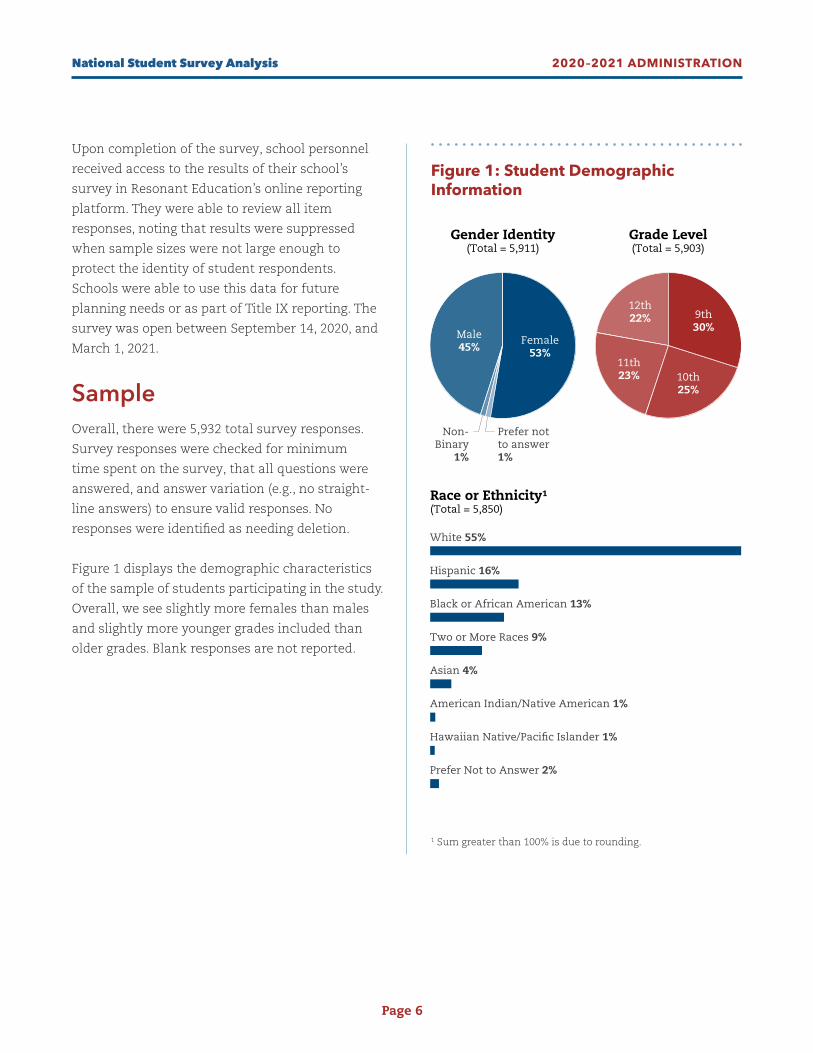
Figure 1 displays the demographic characteristics
of the sample of students participating in the study.
Overall, we see slightly more females than males
and slightly more younger grades included than
older grades. Blank responses are not reported.
Gender Identity(Total = 5,911)
Race or Ethnicity¹(Total = 5,850)
Grade Level(Total = 5,903)
9th30%
Female53%
Male45%
Non-Binary
1%
Prefer notto answer1%
White 55%
Hispanic 16%
Black or African American 13%
Two or More Races 9%
Asian 4%
American Indian/Native American 1%
Hawaiian Native/Pacific Islander 1%
Prefer Not to Answer 2%
10th25%
11th23%
12th22%
Figure 1: Student Demographic Information
1 Sum greater than 100% is due to rounding.
National Student Survey Analysis 2020–2021 ADMINISTRATION
Page 7
RESULTS

National Student Survey Analysis 2020–2021 ADMINISTRATION
Page 8
The survey results are broken down into five
primary sections below. The first section provides
information about the types of sports that
students have played previously, what they plan
to play, and what they wish their school offered.
The second section looks at sport motivation,
both why students choose to play a sport and why
they choose not to play a sport. Section 3 looks at
non-sport activities that students participate in at
school and outside of school, plus what they would
like to participate in. Section 4 looks at items that
ask about the student’s experience in school with
both PE classes and athletic personnel. The final
section (Section 5) looks at questions related to
sports and COVID-19.
Section 1: Sport Engagement and Preferences for Various SportsThis section looks at the type of sports that
students reported playing in the past, what they
are planning to play (both at school and outside
of school), as well as the sports they wish were
offered at their school. For all figures in this
section, percentages will sum to greater than 100%,
as students were able to select multiple response
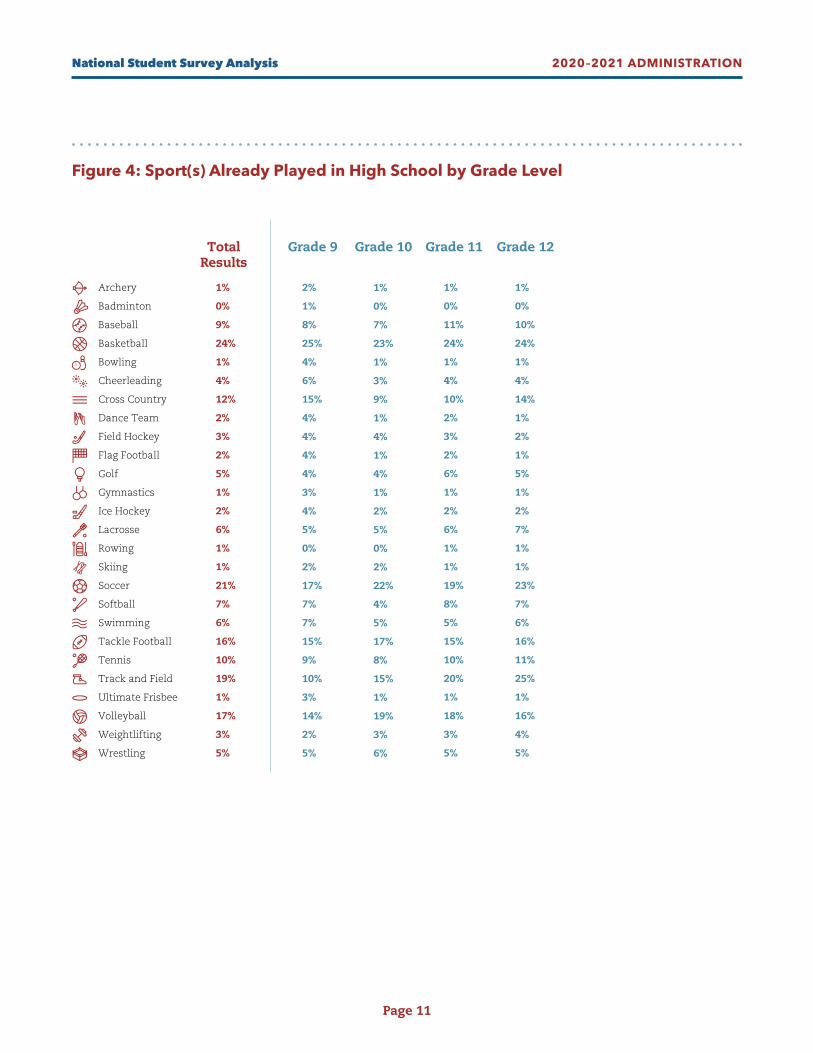
options for all questions. Figures 2–4 look at what
students reported having previously played in
prior years. Figure 2 looks at the breakdown by
school type (Public, Private and Charter) as well as
urbanicity (Urban, Suburban, and Rural). Figure
3 presents the breakdown by gender and race/
ethnicity, and Figure 4 shows the breakdown
by grade level.
Overall, the most popular sports played previously
in high school by students were basketball
(24% of students), soccer (21%), track and field
(19%), volleyball (17%) and football (16%). For
school type, charter schools reported the highest
percentages of students playing traditional sports
like soccer, basketball, and volleyball. Private
schools had significantly higher percentages of
students reporting that they played lacrosse,
tennis, and field hockey. In looking at urbanicity,
rural schools tended to report the highest levels
of playing basketball, softball, and track and field
while urban schools reported the highest levels of
playing soccer.
Differences in sport by gender reflected expected
differences for sports traditionally made available
to single genders such as football, cheerleading,
wrestling, and volleyball. Most other sports that
were offered equally to both genders saw similar
percentages in participation. By race/ethnicity,
the most popular sports for Black students were
basketball, football, and track and field. For
Hispanic students, the most popular sports were
soccer and basketball, and Asian students had the
highest percentages for cross country, tennis, and
volleyball. By grade level, participation in sports
tended to increase overall as students moved up
into the higher grades. An example of this can be
seen in track and field, which saw participation
rise steadily by grade from 10% in 9th grade all the
way to 25% by 12th grade.

National Student Survey Analysis 2020–2021 ADMINISTRATION
Page 9
TotalResults
PublicSchools Urban Suburban Rural
Public, Non-Charter SchoolsPrivateSchools
1%
0%
9%
24%
1%
4%
12%
2%
3%
2%
5%
1%
2%
6%
1%
1%
21%
7%
6%
16%
10%
19%
1%
17%
3%
5%
1%
0%
11%
23%
2%
5%
10%
2%
0%
2%
5%
2%
0%
2%
0%
1%
16%
8%
6%
20%
7%
22%
0%
17%
3%
6%
0%
0%
6%
20%
1%
1%
16%
1%
12%
0%
6%
0%
8%
19%
1%
3%
28%
2%
7%
7%
18%
13%
3%
17%
3%
2%
CharterSchools
0%
1%
8%
48%
1%
8%
7%
2%
1%
4%
0%
1%
2%
1%
0%
1%
35%
6%
3%
13%
1%
12%
1%
23%
1%
3%
1%
0%
9%
19%
1%
4%
10%
3%
2%
1%
5%
2%
0%
2%
2%
0%
20%
7%
4%
15%
6%
18%
0%
16%
1%
6%
0%
0%
13%
19%
3%
4%
12%
2%
0%
2%
7%
2%
1%
1%
0%
1%
14%
6%
7%
21%
7%
20%
1%
16%
2%
7%
2%
0%
10%
28%
0%
6%
9%
1%
0%
2%
4%
1%
0%
2%
0%
0%
17%
11%
5%
20%
8%
25%
0%
18%
4%
6%
Archery
Badminton
Baseball
Basketball
Bowling
Cheerleading
Cross Country
Dance Team
Field Hockey
Flag Football
Golf
Gymnastics
Ice Hockey
Lacrosse
Rowing
Skiing
Soccer
Softball
Swimming
Tackle Football
Tennis
Track and Field
Ultimate Frisbee
Volleyball
Weightlifting
Wrestling
Figure 2: Sport(s) Already Played in High School by School Type and Urbanicity

National Student Survey Analysis 2020–2021 ADMINISTRATION
Page 10
All Male Black White Hispanic AsianFemale
1%
0%
9%
24%
1%
4%
12%
2%
3%
2%
5%
1%
2%
6%
1%
1%
21%
7%
6%
16%
10%
19%
1%
17%
3%
5%
1%
0%
20%
27%
2%
0%
12%
0%
0%
2%
6%
0%
3%
6%
0%
1%
21%
0%
3%
33%
9%
19%
2%
3%
5%
10%
1%
0%
1%
22%
1%
8%
11%
3%
6%
1%
4%
2%
1%
5%
1%
1%
20%
12%
8%
1%
10%
19%
0%
30%
1%
1%
0%
0%
10%
47%
1%
8%
4%
1%
0%
3%
1%
1%
0%
5%
0%
0%
10%
6%
1%
28%
3%
29%
1%
15%
3%
5%
1%
0%
10%
20%
1%
4%
14%
2%
5%
1%
6%
1%
3%
7%
1%
2%
20%
7%
7%
14%
11%
18%
1%
18%
3%
4%
0%
0%
9%
23%
1%
3%
5%
1%
1%
3%
2%
1%
0%
2%
0%
0%
39%
6%
4%
14%
7%
14%
1%
13%
0%
5%
0%
0%
4%
20%
1%
2%
20%
2%
2%
3%
6%
2%
4%
3%
0%
0%
15%
9%
5%
8%
19%
16%
1%
20%
5%
5%
Archery
Badminton
Baseball
Basketball
Bowling
Cheerleading
Cross Country
Dance Team
Field Hockey
Flag Football
Golf
Gymnastics
Ice Hockey
Lacrosse
Rowing
Skiing
Soccer
Softball
Swimming
Tackle Football
Tennis
Track and Field
Ultimate Frisbee
Volleyball
Weightlifting
Wrestling
Figure 3: Sport(s) Already Played in High School by Gender and Race/Ethnicity
National Student Survey Analysis 2020–2021 ADMINISTRATION
Page 11
Figure 4: Sport(s) Already Played in High School by Grade Level
TotalResults
Grade 9 Grade 10
1%
0%
9%
24%
1%
4%
12%
2%
3%
2%
5%
1%
2%
6%
1%
1%
21%
7%
6%
16%
10%
19%
1%
17%
3%
5%
2%
1%
8%
25%
4%
6%
15%
4%
4%
4%
4%
3%
4%
5%
0%
2%
17%
7%
7%
15%
9%
10%
3%
14%
2%
5%
1%
0%
7%
23%
1%
3%
9%
1%
4%
1%
4%
1%
2%
5%
0%
2%
22%
4%
5%
17%
8%
15%
1%
19%
3%
6%
Grade 11
1%
0%
11%
24%
1%
4%
10%
2%
3%
2%
6%
1%
2%
6%
1%
1%
19%
8%
5%
15%
10%
20%
1%
18%
3%
5%
Grade 12
1%
0%
10%
24%
1%
4%
14%
1%
2%
1%
5%
1%
2%
7%
1%
1%
23%
7%
6%
16%
11%
25%
1%
16%
4%
5%
Archery
Badminton
Baseball
Basketball
Bowling
Cheerleading
Cross Country
Dance Team
Field Hockey
Flag Football
Golf
Gymnastics
Ice Hockey
Lacrosse
Rowing
Skiing
Soccer
Softball
Swimming
Tackle Football
Tennis
Track and Field
Ultimate Frisbee
Volleyball
Weightlifting
Wrestling

National Student Survey Analysis 2020–2021 ADMINISTRATION
Page 12
Figures 5–7 look at what students were planning to play during the upcoming
year (provided they were available). Similar to the previous figures, Figure 5
presents the breakdown by school type (Public, Private and Charter) as well as
urbanicity (Urban, Suburban, and Rural). Figure 6 presents the breakdown by
gender and race/ethnicity, and Figure 7 shows the breakdown by grade level.
Similar trends emerged in sports played previously (Figures 2–4) and sports
expected to play during this upcoming year.
TotalResults
PublicSchools Urban Suburban Rural
Public, Non-Charter SchoolsPrivateSchools
2%
1%
11%
23%
2%
5%
8%
3%
3%
2%
5%
1%
2%
5%
0%
1%
20%
8%
6%
14%
10%
20%
1%
16%
4%
6%
3%
1%
12%
22%
2%
6%
7%
3%
1%
2%
5%
2%
1%
2%
0%
1%
17%
10%
5%
16%
9%
23%
1%
16%
5%
7%
0%
0%
7%
21%
1%
1%
11%
2%
10%
0%
5%
1%
7%
19%
1%
2%
23%
3%
7%
7%
17%
14%
3%
13%
1%
1%
CharterSchools
3%
2%
8%
34%
3%
10%
5%
3%
1%
5%
2%
3%
1%
0%
0%
1%
32%
6%
4%
11%
4%
12%
2%
28%
3%
3%
3%
1%
12%
20%
3%
6%
6%
5%
2%
2%
7%
2%
1%
2%
2%
1%
21%
6%
4%
14%
10%
17%
1%
15%
2%
6%
2%
1%
13%
20%
3%
5%
8%
4%
0%
2%
6%
2%
1%
1%
0%
2%
13%
6%
6%
17%
7%
25%
1%
16%
4%
7%
3%
1%
11%
25%
1%
6%
7%
1%
0%
1%
4%
1%
0%
2%
0%
1%
19%
13%
5%
16%
9%
24%
0%
17%
6%
8%
Archery
Badminton
Baseball
Basketball
Bowling
Cheerleading
Cross Country
Dance Team
Field Hockey
Flag Football
Golf
Gymnastics
Ice Hockey
Lacrosse
Rowing
Skiing
Soccer
Softball
Swimming
Tackle Football
Tennis
Track and Field
Ultimate Frisbee
Volleyball
Weightlifting
Wrestling
Figure 5: Sport(s) Planning to Play This Year in High School by School Type and Urbanicity

National Student Survey Analysis 2020–2021 ADMINISTRATION
Page 13
Figure 6: Sport(s) Planning to Play This Year in High School by Gender and Race/Ethnicity
All Male Black White Hispanic AsianFemale
2%
1%
11%
23%
2%
5%
8%
3%
3%
2%
5%
1%
2%
5%
0%
1%
20%
8%
6%
14%
10%
20%
1%
16%
4%
6%
2%
1%
21%
29%
2%
0%
8%
0%
0%
3%
6%
0%
3%
6%
0%
1%
20%
0%
3%
29%
7%
20%
2%
4%
6%
11%
2%
1%
1%
18%
1%
10%
8%
5%
5%
1%
4%
2%
1%
5%
1%
1%
20%
14%
8%
0%
13%
20%
0%
28%
2%
1%
2%
1%
9%
39%
3%
10%
5%
3%
0%
4%
1%
3%
1%
3%
0%
1%
10%
6%
2%
24%
5%
35%
1%
15%
3%
5%
2%
0%
12%
19%
2%
4%
9%
2%
4%
1%
6%
1%
3%
8%
0%
2%
19%
9%
7%
12%
11%
19%
1%
16%
4%
6%
2%
1%
10%
21%
2%
7%
4%
4%
1%
3%
3%
2%
1%
2%
0%
1%
40%
8%
5%
11%
7%
15%
0%
17%
3%
6%
1%
1%
3%
16%
1%
1%
13%
3%
1%
3%
6%
1%
1%
2%
1%
1%
15%
8%
6%
7%
22%
14%
2%
24%
1%
4%
Archery
Badminton
Baseball
Basketball
Bowling
Cheerleading
Cross Country
Dance Team
Field Hockey
Flag Football
Golf
Gymnastics
Ice Hockey
Lacrosse
Rowing
Skiing
Soccer
Softball
Swimming
Tackle Football
Tennis
Track and Field
Ultimate Frisbee
Volleyball
Weightlifting
Wrestling

National Student Survey Analysis 2020–2021 ADMINISTRATION
Page 14
Figure 7: Sport(s) Planning to Play This Year in High School by Grade Level
TotalResults
Grade 9 Grade 10
2%
1%
11%
23%
2%
5%
8%
3%
3%
2%
5%
1%
2%
5%
0%
1%
20%
8%
6%
14%
10%
20%
1%
16%
4%
6%
4%
1%
11%
31%
3%
6%
8%
4%
3%
3%
4%
3%
2%
5%
0%
2%
20%
10%
7%
15%
8%
22%
2%
20%
6%
7%
2%
1%
11%
21%
2%
4%
7%
2%
3%
2%
5%
1%
2%
5%
0%
2%
22%
7%
6%
14%
12%
17%
1%
17%
4%
6%
Grade 11
1%
1%
10%
20%
1%
5%
7%
2%
2%
1%
7%
1%
2%
6%
0%
1%
18%
7%
5%
13%
11%
20%
1%
16%
2%
5%
Grade 12
1%
0%
10%
17%
1%
6%
9%
2%
2%
1%
5%
1%
2%
6%
1%
0%
19%
6%
4%
12%
10%
21%
2%
12%
2%
4%
Archery
Badminton
Baseball
Basketball
Bowling
Cheerleading
Cross Country
Dance Team
Field Hockey
Flag Football
Golf
Gymnastics
Ice Hockey
Lacrosse
Rowing
Skiing
Soccer
Softball
Swimming
Tackle Football
Tennis
Track and Field
Ultimate Frisbee
Volleyball
Weightlifting
Wrestling
Figures 8–10 look at what students were planning to play during the upcoming
year outside of school. Figure 8 looks at the breakdown by school type (Public,
Private and Charter) as well as urbanicity (Urban, Suburban, and Rural). Figure
9 presents the breakdown by gender and race/ethnicity, and Figure 10 shows
the breakdown by grade level.

National Student Survey Analysis 2020–2021 ADMINISTRATION
Page 15
Figure 8: Sport(s) Planning to Play This Year Outside of High School by School Type and Urbanicity
TotalResults
PublicSchools Urban Suburban Rural
Public, Non-Charter SchoolsPrivateSchools
3%
1%
10%
19%
3%
2%
2%
4%
2%
3%
4%
2%
2%
6%
0%
3%
19%
9%
5%
6%
5%
6%
1%
13%
4%
3%
4%
1%
12%
20%
3%
3%
3%
4%
0%
3%
4%
3%
2%
2%
0%
2%
18%
12%
4%
8%
4%
7%
1%
14%
5%
4%
0%
0%
6%
12%
0%
1%
1%
2%
6%
0%
6%
1%
5%
19%
1%
7%
17%
1%
5%
0%
12%
2%
0%
7%
2%
0%
CharterSchools
5%
2%
7%
24%
4%
3%
2%
5%
0%
5%
1%
3%
1%
2%
0%
2%
30%
4%
7%
9%
3%
8%
2%
17%
1%
2%
4%
1%
13%
18%
4%
5%
2%
5%
0%
3%
4%
3%
2%
2%
0%
1%
21%
8%
6%
11%
5%
11%
1%
13%
5%
3%
2%
1%
13%
18%
4%
2%
3%
5%
1%
3%
3%
2%
2%
1%
0%
3%
15%
10%
4%
7%
3%
6%
1%
13%
4%
5%
5%
1%
10%
21%
2%
3%
3%
3%
0%
3%
4%
2%
1%
3%
0%
1%
19%
14%
4%
7%
4%
6%
0%
15%
6%
4%
Archery
Badminton
Baseball
Basketball
Bowling
Cheerleading
Cross Country
Dance Team
Field Hockey
Flag Football
Golf
Gymnastics
Ice Hockey
Lacrosse
Rowing
Skiing
Soccer
Softball
Swimming
Tackle Football
Tennis
Track and Field
Ultimate Frisbee
Volleyball
Weightlifting
Wrestling
Similar patterns were present for sports chosen inside and outside the school,
with basketball, soccer, and volleyball being the top choices. Private school
students tended to seek out lacrosse and tennis outside of school more than
other school types.

National Student Survey Analysis 2020–2021 ADMINISTRATION
Page 16
Figure 9: Sport(s) Planning to Play This Year Outside of High School by Gender and Race/Ethnicity
TotalResults
3%
1%
10%
19%
3%
2%
2%
4%
2%
3%
4%
2%
2%
6%
0%
3%
19%
9%
5%
6%
5%
6%
1%
13%
4%
3%
Male Black White Hispanic AsianFemale
4%
0%
20%
26%
4%
0%
2%
1%
0%
4%
6%
1%
3%
6%
0%
4%
20%
1%
3%
13%
4%
6%
1%
2%
7%
6%
2%
1%
1%
12%
1%
4%
2%
7%
3%
1%
2%
4%
1%
5%
0%
2%
18%
16%
7%
1%
7%
6%
0%
23%
1%
1%
3%
0%
9%
42%
3%
6%
4%
4%
0%
6%
2%
3%
1%
4%
0%
1%
10%
7%
2%
17%
3%
17%
1%
12%
5%
3%
3%
0%
11%
13%
3%
2%
1%
3%
2%
1%
5%
2%
3%
7%
0%
4%
16%
10%
5%
4%
5%
3%
1%
13%
4%
3%
2%
1%
9%
17%
2%
3%
1%
4%
1%
4%
1%
2%
1%
3%
0%
0%
42%
9%
6%
6%
5%
4%
1%
13%
2%
3%
0%
1%
1%
17%
0%
0%
5%
0%
1%
5%
4%
3%
4%
3%
1%
4%
16%
6%
8%
5%
16%
8%
1%
14%
3%
0%
Archery
Badminton
Baseball
Basketball
Bowling
Cheerleading
Cross Country
Dance Team
Field Hockey
Flag Football
Golf
Gymnastics
Ice Hockey
Lacrosse
Rowing
Skiing
Soccer
Softball
Swimming
Tackle Football
Tennis
Track and Field
Ultimate Frisbee
Volleyball
Weightlifting
Wrestling

National Student Survey Analysis 2020–2021 ADMINISTRATION
Page 17
Figure 10: Sport(s) Planning to Play This Year Outside of High School by Grade Level
Grade 9 Grade 10
4%
1%
10%
21%
3%
2%
2%
5%
2%
3%
3%
3%
3%
6%
0%
3%
19%
10%
6%
8%
4%
7%
1%
14%
5%
4%
3%
1%
9%
16%
2%
2%
2%
4%
1%
2%
4%
2%
2%
6%
0%
4%
22%
7%
5%
7%
6%
5%
0%
12%
3%
3%
Grade 11
2%
1%
11%
20%
1%
2%
2%
2%
1%
2%
5%
2%
2%
4%
0%
2%
14%
9%
4%
5%
6%
5%
1%
15%
4%
3%
Grade 12
2%
1%
9%
15%
5%
3%
2%
3%
1%
3%
4%
1%
3%
6%
0%
3%
20%
7%
4%
4%
5%
5%
1%
11%
4%
3%
TotalResults
3%
1%
10%
19%
3%
2%
2%
4%
2%
3%
4%
2%
2%
6%
0%
3%
19%
9%
5%
6%
5%
6%
1%
13%
4%
3%
Archery
Badminton
Baseball
Basketball
Bowling
Cheerleading
Cross Country
Dance Team
Field Hockey
Flag Football
Golf
Gymnastics
Ice Hockey
Lacrosse
Rowing
Skiing
Soccer
Softball
Swimming
Tackle Football
Tennis
Track and Field
Ultimate Frisbee
Volleyball
Weightlifting
Wrestling
Figures 11–13 look at the sports that students wished were offered at their school.
Figure 11 presents the breakdown by school type (Public, Private and Charter) as well as
urbanicity (Urban, Suburban, and Rural). Figure 12 presents the breakdown by gender and
race/ethnicity, and Figure 13 shows the breakdown by grade level.
National Student Survey Analysis 2020–2021 ADMINISTRATION
Page 18
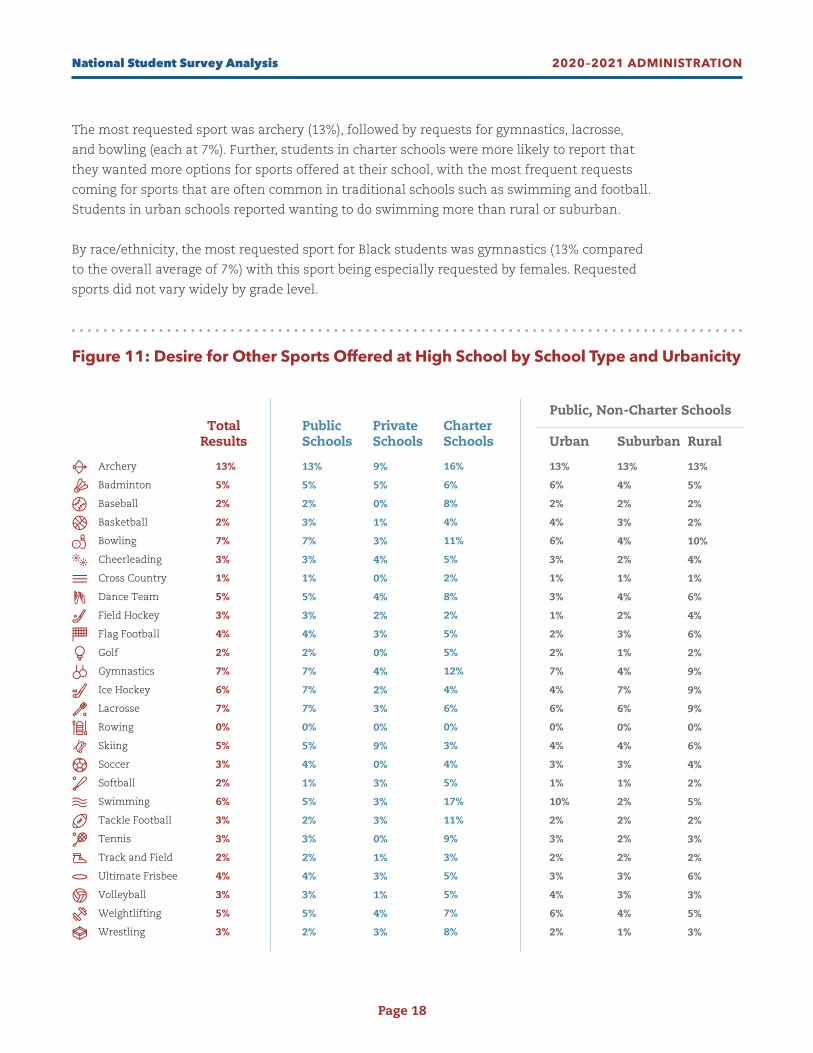
Figure 11: Desire for Other Sports Offered at High School by School Type and Urbanicity
The most requested sport was archery (13%), followed by requests for gymnastics, lacrosse,
and bowling (each at 7%). Further, students in charter schools were more likely to report that
they wanted more options for sports offered at their school, with the most frequent requests
coming for sports that are often common in traditional schools such as swimming and football.
Students in urban schools reported wanting to do swimming more than rural or suburban.
By race/ethnicity, the most requested sport for Black students was gymnastics (13% compared
to the overall average of 7%) with this sport being especially requested by females. Requested
sports did not vary widely by grade level.
TotalResults
PublicSchools Urban Suburban Rural
Public, Non-Charter SchoolsPrivateSchools
13%
5%
2%
2%
7%
3%
1%
5%
3%
4%
2%
7%
6%
7%
0%
5%
3%
2%
6%
3%
3%
2%
4%
3%
5%
3%
13%
5%
2%
3%
7%
3%
1%
5%
3%
4%
2%
7%
7%
7%
0%
5%
4%
1%
5%
2%
3%
2%
4%
3%
5%
2%
9%
5%
0%
1%
3%
4%
0%
4%
2%
3%
0%
4%
2%
3%
0%
9%
0%
3%
3%
3%
0%
1%
3%
1%
4%
3%
CharterSchools
16%
6%
8%
4%
11%
5%
2%
8%
2%
5%
5%
12%
4%
6%
0%
3%
4%
5%
17%
11%
9%
3%
5%
5%
7%
8%
13%
6%
2%
4%
6%
3%
1%
3%
1%
2%
2%
7%
4%
6%
0%
4%
3%
1%
10%
2%
3%
2%
3%
4%
6%
2%
13%
4%
2%
3%
4%
2%
1%
4%
2%
3%
1%
4%
7%
6%
0%
4%
3%
1%
2%
2%
2%
2%
3%
3%
4%
1%
13%
5%
2%
2%
10%
4%
1%
6%
4%
6%
2%
9%
9%
9%
0%
6%
4%
2%
5%
2%
3%
2%
6%
3%
5%
3%
Archery
Badminton
Baseball
Basketball
Bowling
Cheerleading
Cross Country
Dance Team
Field Hockey
Flag Football
Golf
Gymnastics
Ice Hockey
Lacrosse
Rowing
Skiing
Soccer
Softball
Swimming
Tackle Football
Tennis
Track and Field
Ultimate Frisbee
Volleyball
Weightlifting
Wrestling

National Student Survey Analysis 2020–2021 ADMINISTRATION
Page 19
Figure 12: Desire for Other Sports Offered at High School by Gender and Race/Ethnicity
Male Black White Hispanic AsianFemale
12%
4%
4%
4%
8%
1%
1%
1%
3%
5%
3%
2%
7%
6%
0%
5%
3%
1%
4%
5%
3%
2%
6%
3%
7%
4%
12%
5%
1%
2%
7%
5%
1%
8%
3%
4%
1%
12%
5%
7%
0%
5%
3%
3%
7%
2%
3%
2%
3%
3%
3%
2%
10%
4%
2%
6%
7%
5%
1%
9%
1%
5%
3%
13%
2%
3%
0%
3%
3%
2%
9%
5%
5%
3%
3%
3%
5%
5%
13%
5%
2%
2%
8%
3%
1%
4%
3%
4%
1%
6%
8%
8%
0%
6%
2%
2%
5%
3%
2%
2%
5%
3%
5%
2%
10%
4%
4%
3%
7%
3%
1%
6%
2%
4%
3%
7%
4%
6%
0%
4%
4%
2%
8%
5%
5%
2%
3%
5%
4%
3%
15%
14%
2%
2%
7%
2%
2%
6%
2%
4%
3%
4%
5%
5%
0%
9%
7%
1%
10%
2%
3%
2%
3%
5%
4%
2%
TotalResults
13%
5%
2%
2%
7%
3%
1%
5%
3%
4%
2%
7%
6%
7%
0%
5%
3%
2%
6%
3%
3%
2%
4%
3%
5%
3%
Archery
Badminton
Baseball
Basketball
Bowling
Cheerleading
Cross Country
Dance Team
Field Hockey
Flag Football
Golf
Gymnastics
Ice Hockey
Lacrosse
Rowing
Skiing
Soccer
Softball
Swimming
Tackle Football
Tennis
Track and Field
Ultimate Frisbee
Volleyball
Weightlifting
Wrestling

National Student Survey Analysis 2020–2021 ADMINISTRATION
Page 20
Figure 13: Desire for Other Sports at High School by Grade Level
Grade 9 Grade 10
12%
3%
2%
3%
6%
3%
1%
5%
2%
4%
3%
6%
5%
4%
0%
4%
4%
2%
6%
4%
3%
2%
3%
3%
4%
2%
13%
5%
2%
2%
7%
3%
1%
5%
3%
4%
2%
7%
8%
7%
0%
5%
3%
2%
6%
3%
3%
2%
4%
3%
5%
3%
Grade 11
12%
6%
3%
2%
7%
4%
1%
5%
2%
3%
2%
8%
6%
8%
0%
5%
2%
2%
6%
3%
3%
2%
4%
3%
5%
3%
Grade 12
14%
5%
2%
2%
9%
4%
1%
6%
4%
5%
2%
8%
6%
8%
0%
6%
3%
2%
7%
3%
4%
2%
6%
4%
6%
4%
TotalResults
13%
5%
2%
2%
7%
3%
1%
5%
3%
4%
2%
7%
6%
7%
0%
5%
3%
2%
6%
3%
3%
2%
4%
3%
5%
3%
Archery
Badminton
Baseball
Basketball
Bowling
Cheerleading
Cross Country
Dance Team
Field Hockey
Flag Football
Golf
Gymnastics
Ice Hockey
Lacrosse
Rowing
Skiing
Soccer
Softball
Swimming
Tackle Football
Tennis
Track and Field
Ultimate Frisbee
Volleyball
Weightlifting
Wrestling

National Student Survey Analysis 2020–2021 ADMINISTRATION
Page 21
Section 2: Motivations for Engaging in Sport and Reasons for Not Engaging in Sport
This section looks at both why students reported
wanting to play sports as well as the reasons they
listed for not playing sports. For all figures in this
section, percentages will sum to greater than 100%,
as students were able to select multiple response
options for all questions. Figure 14 looks at the
reasons that students listed for playing sports by
school type (Public, Private and Charter) as well as
urbanicity (Urban, Suburban, and Rural), gender
and race/ethnicity, and grade level.
Overall, the top responses for why students engaged
in sports were having fun (81%), exercise (79%),
learning and improving skills (66%), playing with
and making new friends (64%), and competing
(testing myself against others) (59%). There was a
stronger connection in private schools (46%) for
belonging to a group within a school than the overall
average (34%), which also relates to private schools
having the highest percentage about playing and
making new friends (73%). Further, making family
proud tended to be slightly more common in rural
schools (40%) versus private schools (25%).
For gender, there were differences in a few key
motivating factors. With males, winning games
(60% for males, 48% for female) and competing
(64% for males, 54% for females) showed higher
rates while females were more likely to report
mental health and well-being (56% for females,
41% for males), belonging to a group (38% for
females, 29% for males) and college applications
(46% for females, 37% for males). By race/ethnicity,
Black students were much more likely to report
playing sports for college scholarships as a
motivation (50% versus overall average of 39%)
while White students were more likely to report
belonging to a group. Hispanics also reported
college scholarships more frequently than the
average (44% compared to 39%), and Asian
students reported the lowest levels for this reason
at 23%. Asians were higher than the average for
exercise and improving skills.
Figure 15 included students that indicated
they wouldn’t be participating in a sport in the
upcoming year and looks at the various reasons
that students listed for not participating by
school type (Public, Private and Charter) as well as
urbanicity (Urban, Suburban, and Rural), gender
and race/ethnicity presented, and grade level.
The most common reasons for not participating
included schoolwork (42%), not enjoying sports
(32%), not having sports that are of interest (26%),
and not trying out because students didn’t think
they were good enough to make the team (25%).
Charter school students tended to report greater
barriers (fewer sports offered, transportation, and
too much schoolwork).
There were some notable differences by gender,
with females more likely to report schoolwork,
social factors (not welcome, friends don’t play,
etc.), and not believing they will make the team
(28% vs. 20% for males). For race/ethnicity, White
students were more likely to report that they did
not feel welcome and having barriers due to work
schedules, while Asian students reported having
too much schoolwork as more of a barrier than
students of other races/ethnicities.

National Student Survey Analysis 2020–2021 ADMINISTRATION
Page 22
Overall %
80 83 80 8078 83 78 82 81 8380 83 80 80 79 81
81%Having fun
74 82 80 8477 82 72 82 75 8577 89 75 78 77 77
79%Exercise
66 68 65 6364 68 65 65 66 7365 66 69 66 63 67
66%Learn andimprove skills
61 66 63 6560 67 55 67 62 6962 73 52 60 63 63
64%Playing with andmaking new friends
54 61 60 6164 54 51 62 57 5258 64 51 54 56 61
59%Competing (testingmyself against others)
54 55 52 5360 48 56 54 51 4554 54 48 54 56 61
53%Winning gamesand championships
School type Gender
M F
Race/ethnicityPublic
non-charter
Pub. Priv. Ch. Ur. Sub. Rur. Bl. Wh. Hisp. As.
Grade level
9 10 11 12
Figure 14: Motivation for Playing Sports

National Student Survey Analysis 2020–2021 ADMINISTRATION
Page 23
Overall %
40 43 38 3242 37 50 36 44 2342 27 47 43 41 41
39%College scholarships
31 40 36 4035 38 32 37 37 3238 31 35 35 39 39
36%Getting awayfrom problems
34 37 35 3635 35 40 35 36 2239 25 31 37 37 41
35%Making myfamily proud
30 35 34 3729 38 22 39 24 3631 46 25 29 30 33
34%Belonging to a groupwithin the school
24 31 32 3426 33 28 32 27 2630 30 24 32 38 31
29%Having a coachwho cares about me
18 25 21 2325 18 19 22 18 2122 23 18 20 20 23
22%Access to qualityathletic facilities
40 44 45 3937 46 40 42 43 4542 43 42 41 41 42
42%Improve collegeapplications
41 51 52 5641 56 34 53 48 4748 55 46 45 52 47
49%Emotional well-beingand mental health
School type Gender
M F
Race/ethnicityPublic
non-charter
Pub. Priv. Ch. Ur. Sub. Rur. Bl. Wh. Hisp. As.
Grade level
9 10 11 12

National Student Survey Analysis 2020–2021 ADMINISTRATION
Page 24
Figure 15: Why Students are Not Participating in High School Sports
Overall %
38 44 44 4336 47 41 41 44 5442 35 49 43 41 42
42%Too much schoolwork
34 29 32 3228 34 26 34 32 3731 31 33 30 33 30
32%I don’t enjoy sports
29 29 23 2329 24 22 28 24 2725 25 33 26 29 23
26%There aren’t any sportopportunities offeredthat interest me
26 29 21 2420 28 23 25 26 2425 19 24 24 22 28
25%I didn’t try out because I don’t thinkI’m good enough
13 18 27 3322 23 21 25 20 1923 13 23 17 23 25
22%Work schedule
18 22 21 2116 24 14 21 21 2321 13 22 21 18 23
21%Family responsibilities
11 16 11 1410 14 8 14 9 913 13 9 12 11 16
13%I don’t feel welcome
School type Gender
M F
Race/ethnicityPublic
non-charter
Pub. Priv. Ch. Ur. Sub. Rur. Bl. Wh. Hisp. As.
Grade level
9 10 11 12

National Student Survey Analysis 2020–2021 ADMINISTRATION
Page 25
Overall %
11 12 13 149 146
14 12 713 3 12 8 15 13
12%Too expensive
10 10 10 139 11 7 12 9 1111 9 13 8 9 13
11%Transportationchallenges
11 12 9 1110 11 13 11 8 911 7 11 11 10 12
11%Fear of injury or illness
3 57 11
67 3 9
4 67
5 4 3 8 8
7%I don’t like the coaches
57 9 9
59
68
4 48 10
47 7 8
7%Previous injuries
3 3 2 32 3 3 3 36
26 4 2 2 3
3%I didn’t make the team
2 4 2 54 3 3 4 3 04 2 4 2 5 3
3%I am ineligible
3 2 2 22 2 2 2 1 02 2 3 2 1 2
2%Not able to accommodatemy disability
4 4 4 33 2 15
1 148 2 2 3 5
4%I don’t feel safe becauseof my gender identificationor sexual preference
12 16 13 1110 156
15 10 1713 10 11 11 14 14
13%My friends don’t play
School type Gender
M F
Race/ethnicityPublic
non-charter
Pub. Priv. Ch. Ur. Sub. Rur. Bl. Wh. Hisp. As.
Grade level
9 10 11 12
National Student Survey Analysis 2020–2021 ADMINISTRATION
Page 26
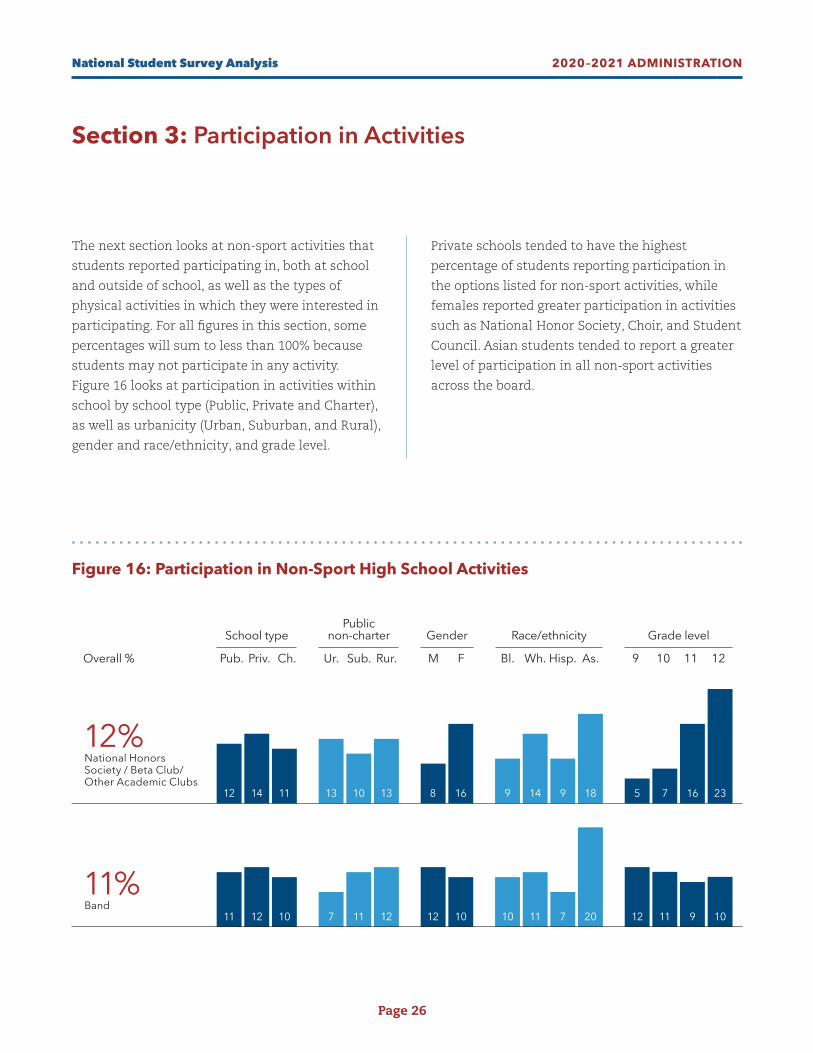
Section 3: Participation in Activities
The next section looks at non-sport activities that
students reported participating in, both at school
and outside of school, as well as the types of
physical activities in which they were interested in
participating. For all figures in this section, some
percentages will sum to less than 100% because
students may not participate in any activity.
Figure 16 looks at participation in activities within
school by school type (Public, Private and Charter),
as well as urbanicity (Urban, Suburban, and Rural),
gender and race/ethnicity, and grade level.
Private schools tended to have the highest
percentage of students reporting participation in
the options listed for non-sport activities, while
females reported greater participation in activities
such as National Honor Society, Choir, and Student
Council. Asian students tended to report a greater
level of participation in all non-sport activities
across the board.
Overall %
School type Gender
M F
Race/ethnicityPublic
non-charter
Pub. Priv. Ch. Ur. Sub. Rur. Bl. Wh. Hisp. As.
Grade level
9 10 11 12
5 7 16 238 16 9 14 9 1812 14 11 13 10 13
12%National HonorsSociety / Beta Club/Other Academic Clubs
12 11 9 1012 10 10 11 7 2011 12 10 7 11 12
11%Band
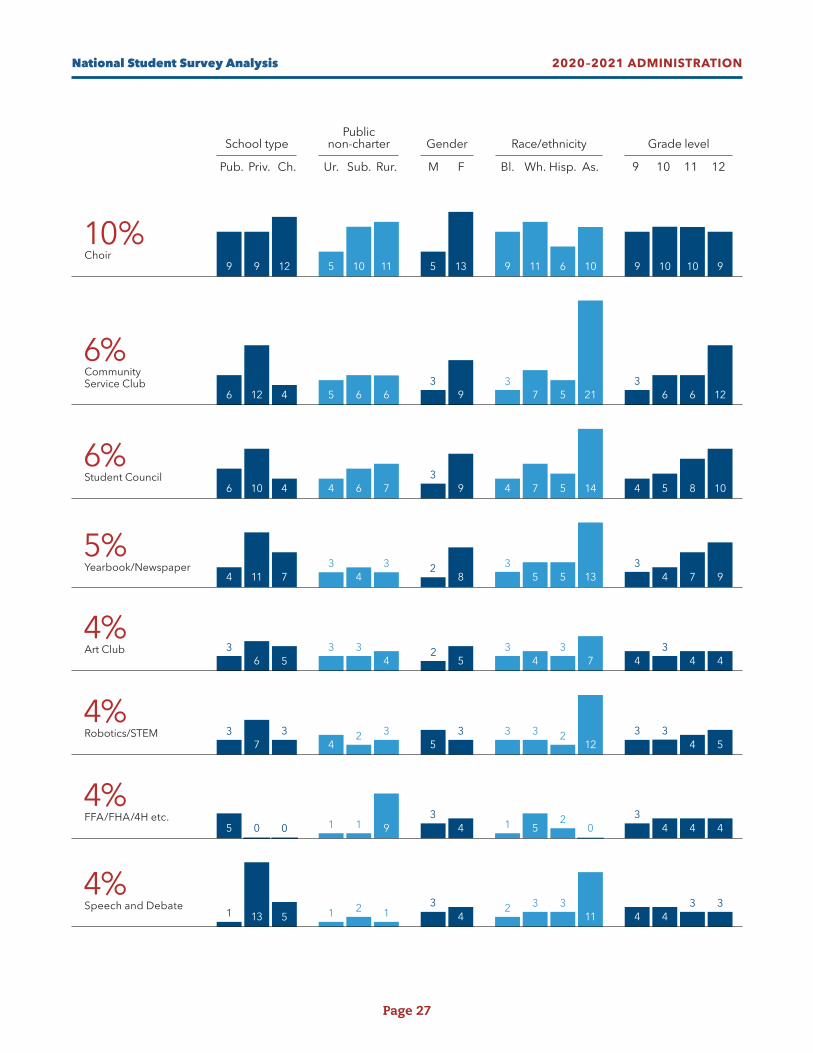
Figure 16: Participation in Non-Sport High School Activities
National Student Survey Analysis 2020–2021 ADMINISTRATION
Page 27
9 10 10 95 13 9 11 6 109 9 12 5 10 11
10%Choir
36 6 12
39
37 5 216 12 4 5 6 6
6%Community Service Club
34 4 4
34 1 5
205 0 0 1 1 9
4%FFA/FHA/4H etc.
4 43 33
42 3 3
111 13 5 1 2 1
4%Speech and Debate
3 34 55
3 3 212
337
34
2 34%Robotics/STEM
43
4 452 3
4 733
6 53 3
4
4%Art Club
34 7 9
28
35 5 134 11 7
34
35%Yearbook/Newspaper
4 5 8 103
9 4 7 5 146 10 4 4 6 7
6%Student Council
School type Gender
M F
Race/ethnicityPublic
non-charter
Pub. Priv. Ch. Ur. Sub. Rur. Bl. Wh. Hisp. As.
Grade level
9 10 11 12

National Student Survey Analysis 2020–2021 ADMINISTRATION
Page 28
Figure 17: Participation in Non-Sport High School Activities
Overall %
45 48 45 4736 54 29 53 37 4746 53 39 43 45 47
46%Walking/Hiking
30 34 39 4244 30 34 38 34 3233 50 37 30 38 30
36%Workout at a Gym
School type Gender
M F
Race/ethnicityPublic
non-charter
Pub. Priv. Ch. Ur. Sub. Rur. Bl. Wh. Hisp. As.
Grade level
9 10 11 12
Figure 17 looks at participation in physical
activities outside of school by school type (Public,
Private and Charter), as well as urbanicity (Urban,
Suburban, and Rural), gender and race/ethnicity,
and grade level. The activities reported most
frequently include walking/hiking (46%), working
out at a gym (36%), pickup games (32%), riding
bikes (32%), and jogging (30%). Across the board,
students in private schools tended to report
participating in these activities more frequently.
There were two notable differences by gender,
with females more likely to report walking/hiking
and males more likely to play in pickup games.
For race/ethnicity, White students reported higher
levels of activity for most choices, but were much
higher for activities such as walking/hiking, riding
bikes, swimming, jogging, and skiing.

National Student Survey Analysis 2020–2021 ADMINISTRATION
Page 29
32 34 30 3143 23 32 32 29 2831 37 30 27 29 33
32%Pickup Games/Free Play
39 35 29 2332 32 22 37 25 2730 46 27 24 31 32
32%Riding Bikes
Overall %
8 10 9 810 8 2 12 2 39 10 3 7 7 12
9%Boating
9 10 8 810 8 0 13 2 115
33 2 2 9 3
9%Skiing
8 9 10 113 15 8 115
118 166
8 10 8
9%Yoga
21 22 20 1919 23 11 26 13 1822 22 15 17 20 25
21%Swimming
30 31 30 2930 30 22 33 25 3828 44 20 27 26 31
30%Jogging
School type Gender
M F
Race/ethnicityPublic
non-charter
Pub. Priv. Ch. Ur. Sub. Rur. Bl. Wh. Hisp. As.
Grade level
9 10 11 12

National Student Survey Analysis 2020–2021 ADMINISTRATION
Page 30
Figure 18: Interest in Physical Activities
Overall %
School type Gender
M F
Race/ethnicityPublic
non-charter
Pub. Priv. Ch. Ur. Sub. Rur. Bl. Wh. Hisp. As.
Grade level
9 10 11 12
34 35 36 3844 29 32 38 32 2934 45 31 34 34 34
35%Strength Training
25 26 23 2426 23 20 26 23 3124 29 24 22 23 25
24%Biking
Figure 18 looks at the types of physical activities
in which students were interested in participating
by school type (Public, Private and Charter), as well
as urbanicity (Urban, Suburban, and Rural), gender
and race, and grade level. The most commonly
reported activity of interest was strength training
(35%), followed by biking (24%), skateboarding
(21%), yoga (21%), and climbing (20%).
The most common activities of interest for females
were yoga and dance, scoring much higher on both
of these than males, but females were also more
likely to request skateboarding than males (24%
compared to 17%). Males showed a higher interest
in activities such as parkour and strength training.
There were fewer differences in interests by race/
ethnicity, but two patterns that stood out were
that White students had higher interest levels in
outdoor activities and climbing and Black students
were most likely to be interested in dance as an
activity (28% vs 19% overall).

National Student Survey Analysis 2020–2021 ADMINISTRATION
Page 31
14 19 24 287 33 22 22 16 2319 29 19 21 21 18
21%Yoga
21 22 21 2017 24 16 20 24 2221 21 24 20 20 21
21%Skateboarding
16 15 13 1320 9 12 14 13 1514 14 16 12 13 15
14%Parkour
11 11 12 1314 9 10 12 10 1111 10 12 11 10 13
11%Adventure Racing
11 15 16 1915 15 17 9 181015 18 11 15 12 16
15%Outdoor Recreation
18 20 19 222217 20 19 192018 25 19 18 18 19
19%General Fitness Classes
18 20 19 214
32 28 16 23 2019 16 26 20 20 18
19%Dance
20 20 20 2021 19 13 23 15 1820 23 17 20 17 22
20%Climbing
School type Gender
M F
Race/ethnicityPublic
non-charter
Pub. Priv. Ch. Ur. Sub. Rur. Bl. Wh. Hisp. As.
Grade level
9 10 11 12

National Student Survey Analysis 2020–2021 ADMINISTRATION
Page 32
Section 4: Information about the School
The following section looks at student responses to
items asking about the student’s school. The first
item looks at participation and satisfaction for PE
classes offered by the school and the second set
of items looks at responses for athletic personnel
at the school.
Figure 19 looks at students’ responses about
their PE class by school type (Public, Private and
Charter), as well as urbanicity (Urban, Suburban,
and Rural), gender and race, and grade level.
Students in private schools were much less likely
to have taken a PE class. Further, there was a
slightly higher percentage of students in charters
reporting that playing a sport in PE class made
them want to play that sport at the school. In
addition, students in urban schools were more
likely to report that they did not enjoy their high
school PE class, while students in rural schools
were more likely to report enjoying their PE class.
For demographics, males tended to report enjoying
PE classes more than females, and Asian students
were more likely to report they did not enjoy PE
classes than students of other races/ethnicities.
Figure 20 looks at student responses about athletic
personnel at their school on topics ranging
from nutrition and injury prevention to their
relationship with coaches by school type (Public,
Private and Charter), as well as urbanicity (Urban,
Suburban, and Rural), gender and race, and grade
level. The response scale used for this group of
items was a five-point frequency scale, from Never
to Almost Always. To create an overall average by
School Type, Urbanicity, Gender, or Grade Level,
the scores for each item were averaged together
to form a single score from one to five, with lower
scores representing less frequency of the behavior
described and higher scores representing a higher
frequency. Scores across sectors were fairly similar,
but charter school students reported a greater level
of education on nutrition, especially in comparison
to private schools.
For gender, males tended to rate questions
higher than females for most items in the scales.
The average for males tended to be higher to a
greater degree for questions related to nutrition,
encouraging athletes to play multiple sports, and
forming relationships with coaches. Responses
across race/ethnicity were similar, but Black and
Hispanic students reported that athletic personnel
provided information about nutrition more
frequently than students of other races/ethnicities.
One trend that stood out for students at different
grade levels was that, as students got older, they
were less likely to agree with statements such as
“Coaches at my school value every member of the
team” and “Coaches at my school have positive
relationships with all of their players,” which may
reflect differentiated treatment in upper grades
as students reach higher levels of competition
(e.g., varsity instead of junior varsity) for stronger
athletes of members of the team.

National Student Survey Analysis 2020–2021 ADMINISTRATION
Page 33
45 70 67 7067 58 65 62 64 5369 32 59 63 68 71
62%I enjoyed myhigh school PE class
43 12 14 1122 21 22 21 20 3014 58 20 17 14 13
22%I have not taken a PEclass in high school
4 6 5 65 5 5 47
65 510
5 5 4
5%Playing a certain sport inmy high school PE classmade me want to playthat sport at my school
8 13 14 136 15 8 13 9 1113 6 12 16 13 12
12%I did not enjoy myhigh school PE class
School type Gender
M F
Race/ethnicityPublic
non-charter
Pub. Priv. Ch. Ur. Sub. Rur. Bl. Wh. Hisp. As.
Grade level
9 10 11 12
Figure 19: Ratings for PE Classes

National Student Survey Analysis 2020–2021 ADMINISTRATION
Page 34
5
4
3
2
1
4.4I enjoy playingsports at myschool
1 – Never; 2 – Rarely; 3 – Sometimes; 4 – Often; 5 – Almost Always
School type Gender
M F
Race/ethnicityPublic
non-charter
Pub. Priv. Ch. Ur. Sub. Rur. Bl. Wh. Hisp. As.
Grade level
9 10 11 12
5
4
3
2
1
5
4
3
2
1
5
4
3
2
1
4.29Athletic personnelat my school takesteps to protectme from physicalinjury as much aspossible
4.18Coaches at myschool have positiverelationships withall of their players
4.13Athletic personnelat my schoolconsistently takesteps for heat andhydration thatkeep me safe
Figure 20: Perceptions of Athletic Personnel at High School

National Student Survey Analysis 2020–2021 ADMINISTRATION
Page 35
School type Gender
M F
Race/ethnicityPublic
non-charter
Pub. Priv. Ch. Ur. Sub. Rur. Bl. Wh. Hisp. As.
Grade level
9 10 11 12
4.13Coaches at myschool help mefeel good aboutmyself as a person
4.12Coaches at myschool value everymember of theteam
3.79Athletic personnelat my school takesteps to make sureour team is safefrom bullying
3.57Athletic personnelat my schoolencourage me toplay multiple sportsinstead of justfocusing on one sport
3.48Athletic personnelat my schooleducate me ongood nutrition
5
4
3
2
1
5
4
3
2
1
5
4
3
2
1
5
4
3
2
1
5
4
3
2
1
National Student Survey Analysis 2020–2021 ADMINISTRATION
Page 36
Section 5: Questions Related to COVID-19
The next section reports on how students felt
about their experience during COVID-19 between
September 2020 and March 2021. It begins with
questions about concerns and how schools can
reduce these concerns. The section then includes
information about how students’ interest in sport
has changed since COVID-19 as well as what they
are missing the most about sports.
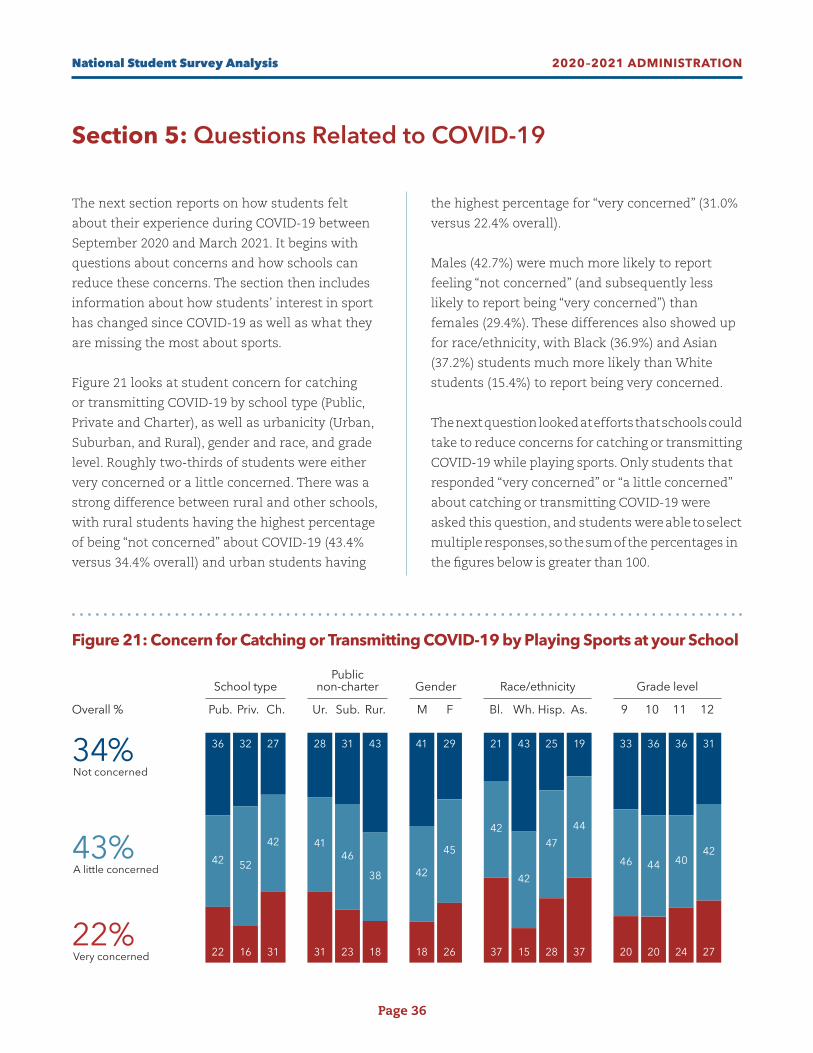
Figure 21 looks at student concern for catching
or transmitting COVID-19 by school type (Public,
Private and Charter), as well as urbanicity (Urban,
Suburban, and Rural), gender and race, and grade
level. Roughly two-thirds of students were either
very concerned or a little concerned. There was a
strong difference between rural and other schools,
with rural students having the highest percentage
of being “not concerned” about COVID-19 (43.4%
versus 34.4% overall) and urban students having
the highest percentage for “very concerned” (31.0%
versus 22.4% overall).
Males (42.7%) were much more likely to report
feeling “not concerned” (and subsequently less
likely to report being “very concerned”) than
females (29.4%). These differences also showed up
for race/ethnicity, with Black (36.9%) and Asian
(37.2%) students much more likely than White
students (15.4%) to report being very concerned.
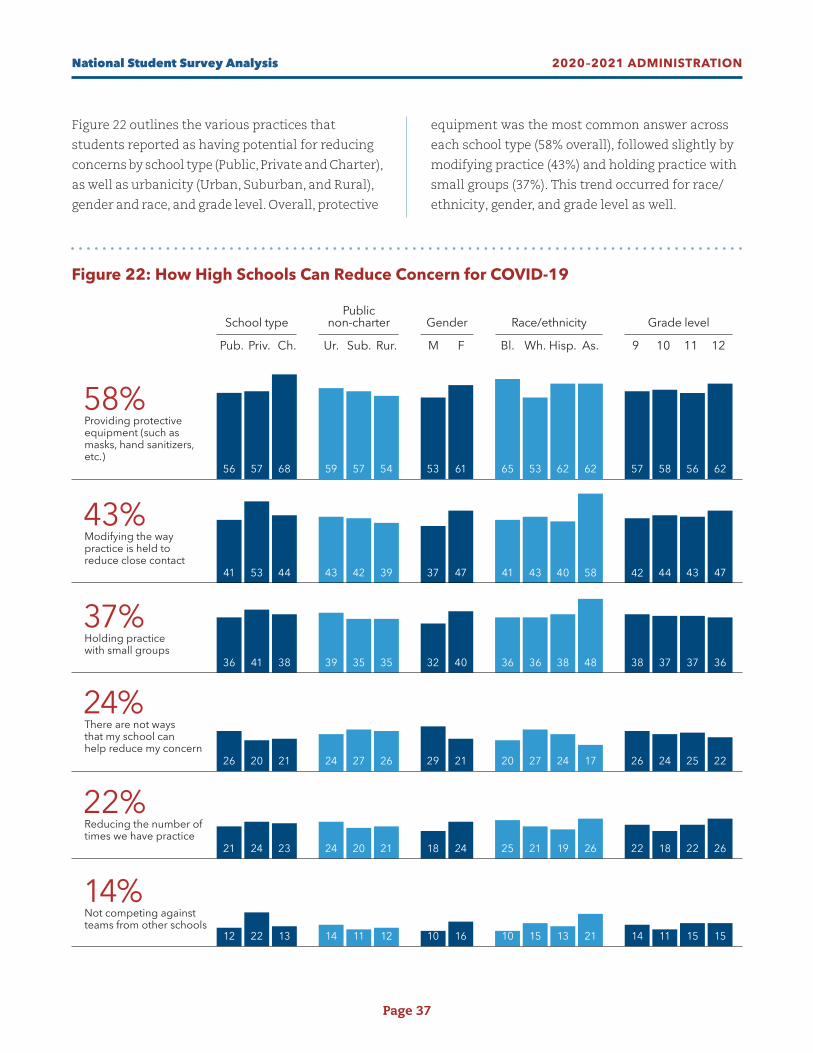
The next question looked at efforts that schools could
take to reduce concerns for catching or transmitting
COVID-19 while playing sports. Only students that
responded “very concerned” or “a little concerned”
about catching or transmitting COVID-19 were
asked this question, and students were able to select
multiple responses, so the sum of the percentages in
the figures below is greater than 100.
Overall %
School type Gender
M F
Race/ethnicityPublic
non-charter
Pub. Priv. Ch. Ur. Sub. Rur. Bl. Wh. Hisp. As.
Grade level
9 10 11 12
34%Not concerned
43%A little concerned
22%Very concerned
33 36 36 3141 29 21 43 25 1936 32 27 28 31 43
46 44 4042
42
45
42
42
4744
42 52
42 4146
38
20 20 24 2718 26 37 15 28 3722 16 31 31 23 18
Figure 21: Concern for Catching or Transmitting COVID-19 by Playing Sports at your School
National Student Survey Analysis 2020–2021 ADMINISTRATION
Page 37
Figure 22 outlines the various practices that
students reported as having potential for reducing
concerns by school type (Public, Private and Charter),
as well as urbanicity (Urban, Suburban, and Rural),
gender and race, and grade level. Overall, protective
equipment was the most common answer across
each school type (58% overall), followed slightly by
modifying practice (43%) and holding practice with
small groups (37%). This trend occurred for race/
ethnicity, gender, and grade level as well.
Figure 22: How High Schools Can Reduce Concern for COVID-19
57 58 56 6253 61 65 53 62 6256 57 68 59 57 54
58%Providing protectiveequipment (such asmasks, hand sanitizers,etc.)
42 44 43 4737 47 41 43 40 5841 53 44 43 42 39
43%Modifying the waypractice is held toreduce close contact
26 24 25 2229 21 20 27 24 1726 20 21 24 27 26
24%There are not waysthat my school canhelp reduce my concern
22 18 22 2618 24 25 21 19 2621 24 23 24 20 21
22%Reducing the number oftimes we have practice
14 11 15 1510 16 10 15 13 2112 22 13 14 11 12
14%Not competing againstteams from other schools
38 37 37 3632 40 36 36 38 4836 41 38 39 35 35
37%Holding practicewith small groups
School type Gender
M F
Race/ethnicityPublic
non-charter
Pub. Priv. Ch. Ur. Sub. Rur. Bl. Wh. Hisp. As.
Grade level
9 10 11 12

National Student Survey Analysis 2020–2021 ADMINISTRATION
Page 38
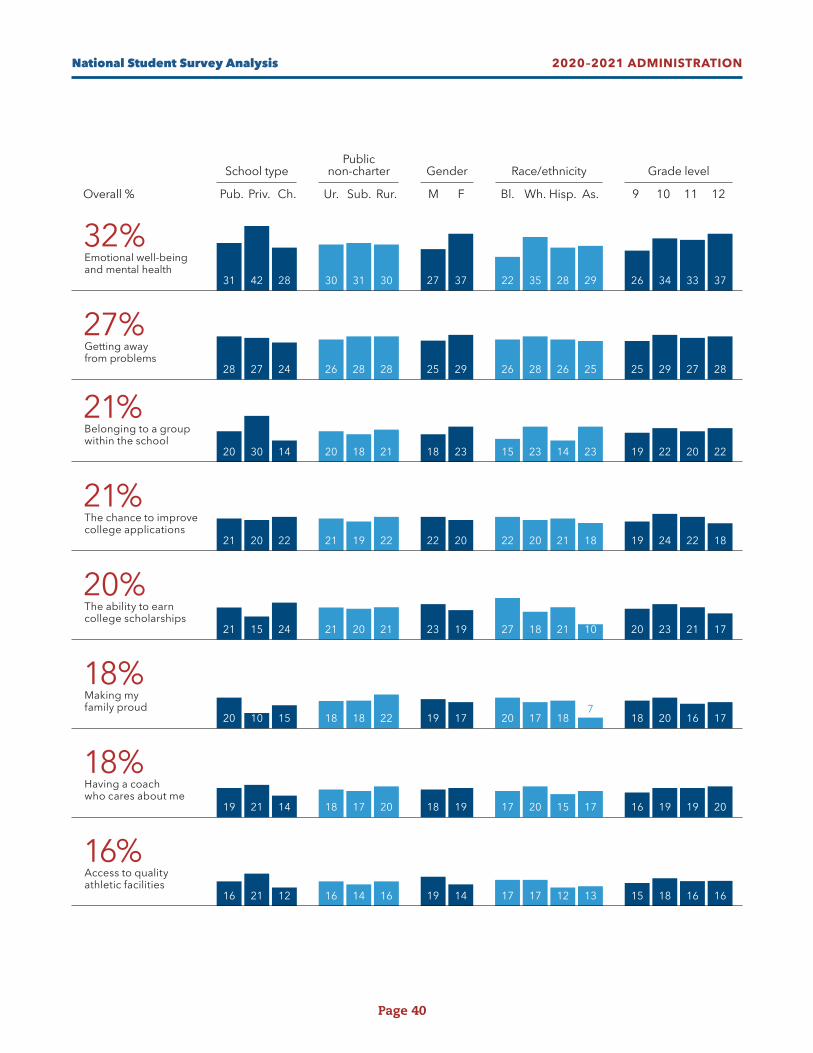
Figure 24 looks at what students are missing about
sports since the cancellation of many sports due
to COVID-19. For these figures, percentages will
sum to greater than 100%, as students were able to
select multiple response options for all questions.
Figure 24 looks at the breakdown by school type
(Public, Private and Charter), as well as urbanicity
(Urban, Suburban, and Rural), gender and race,
and grade level. Similar to the original motivations
reported for playing sports, the most common
element students reported missing about sports
was having fun (59%), followed by playing with and
making new friends (53%) and exercise (51%).
Private school students tended to report higher
percentages for social reasons of missing sports.
The earlier reported differences about motivations
for sport across gender showed up in this item
as well, with males more likely to be missing the
competition and winning games, while females
were more likely to report missing benefits to
emotional/mental health. Similar trends for race/
ethnicity reported earlier in motivation for playing
sports (e.g., Black students missing the chance
to earn scholarships, White students missing for
mental health reasons) emerged in what students
were missing about sports as well.
Overall %
School type Gender
M F
Race/ethnicityPublic
non-charter
Pub. Priv. Ch. Ur. Sub. Rur. Bl. Wh. Hisp. As.
Grade level
9 10 11 12
30%Grown
54%Stayed the same
16%Diminished
32 33 29 2634 28 35 31 27 2529 37 26 28 29 30
56 5252 55
5255
49 54 57 5554
51
56 53 54 55
12 15 19 1914 17 16 15 17 2016 13 18 20 16 15
Figure 23 looks at how students’ interest in sports
has changed since COVID-19 by school type
(Public, Private and Charter), as well as urbanicity
(Urban, Suburban, and Rural), gender and race,
and grade level. Overall, the most common answer
across the board was that interest had stayed the
same. Private school students reported the greatest
increases, while charter school students noted the
greatest decreases.
There were not large differences in these responses
by gender, but Black and White students were
more likely to report their interest had grown than
Hispanic or Asian students.
Figure 23: How Interest in Sports Has Changed Since COVID-19

National Student Survey Analysis 2020–2021 ADMINISTRATION
Page 39
Figure 24: What Students are Missing About Sports Since COVID-19
Overall %
60 61 55 5760 59 62 57 61 6257 64 60 59 55 58
59%Having fun
55 56 49 5352 55 47 55 53 6151 72 47 50 50 51
53%Playing with andmaking new friends
48 54 50 5353 50 48 52 52 5449 65 51 49 49 48
51%Exercise
44 44 38 4043 41 44 40 44 4141 45 42 39 39 43
42%Learn andimprove skills
40 43 39 4246 38 38 44 35 4040 56 32 37 38 42
41%Competing (testingmyself against others)
39 40 36 3843 36 40 40 32 3037 49 31 34 35 40
38%Winning gamesand championships
School type Gender
M F
Race/ethnicityPublic
non-charter
Pub. Priv. Ch. Ur. Sub. Rur. Bl. Wh. Hisp. As.
Grade level
9 10 11 12
National Student Survey Analysis 2020–2021 ADMINISTRATION
Page 40
Overall %
19 22 20 2218 23 15 23 14 2320 30 14 20 18 21
21%Belonging to a groupwithin the school
19 24 22 1822 20 22 20 21 1821 20 22 21 19 22
21%The chance to improvecollege applications
20 23 21 1723 19 27 18 21 1021 15 24 21 20 21
20%The ability to earncollege scholarships
18 20 16 1719 17 20 17 187
20 10 15 18 18 22
18%Making myfamily proud
16 19 19 2018 19 17 20 15 1719 21 14 18 17 20
18%Having a coachwho cares about me
15 18 16 1619 14 17 17 12 1316 21 12 16 14 16
16%Access to qualityathletic facilities
25 29 27 2825 29 26 28 26 2528 27 24 26 28 28
27%Getting awayfrom problems
26 34 33 3727 37 22 35 28 2931 42 28 30 31 30
32%Emotional well-beingand mental health
School type Gender
M F
Race/ethnicityPublic
non-charter
Pub. Priv. Ch. Ur. Sub. Rur. Bl. Wh. Hisp. As.
Grade level
9 10 11 12

National Student Survey Analysis 2020–2021 ADMINISTRATION
Page 41
Discussion
Overall, the most popular sports students reported
having previously played were basketball (24%
of students), soccer (21%), track and field (19%),
volleyball (17%) and football (16%). The most
requested sport was archery (13%), followed by
requests for gymnastics, lacrosse, and bowling
(each at 7%). By race/ethnicity, the most requested
sport for Black students was gymnastics (13%
compared to the overall average of 7%) with this
sport being especially requested by females. The
most requested sport for other races/ethnicities
was archery for White (13%), Hispanic (10%), and
Asian students (15%).
The top responses for why students engaged in
sports were having fun (81%), exercise (79%),
learning and improving skills (66%), playing with and
making new friends (64%), and competing (testing
myself against others) (59%) and winning games
(53%). Responses for motivation to play sports varied
by gender and race/ethnicity, with males showing
higher rates for winning games (60% for males, 48%
for female) and competing (64% for males, 54% for
females), while females were more likely to report
mental health and well-being (56% for females, 41%
for males), belonging to a group (38% for females,
29% for males) and college applications (46% for
females, 37% for males). Black students were much
more likely than other races/ethnicities to report
playing sports for college scholarships (50% versus
overall average of 39%) while White students were
more likely to report belonging to a group. The most
common reasons for not participating in sports
included schoolwork (42%), not enjoying sports
(32%), not having sports that are of interest (26%),
and not trying out because students didn’t think
they were good enough to make the team (25%).
The most commonly reported physical activity in
which students have an interest in participating
was strength training (35%), followed by biking
(24%), skateboarding (21%), yoga (21%), and
climbing (20%). The most commonly reported
physical activity in which female students have
an interest in participating were yoga and dance,
scoring much higher on both of these than
males, but they also were more likely to report
skateboarding (24% for females compared to 17%
for males). Males showed a higher interest in
activities such as parkour and strength training.
There were fewer differences in interest by race/
ethnicity, but two patterns that stood out were
that White students had higher interest levels in
outdoor activities and climbing and Black students
were most likely to be interested in dance as an
activity (28% vs 19% overall).
From the scales related to athletic personnel at
the school, as student got older, they were less
likely to agree with statements such as “Coaches
at my school value every member of the team” and
“Coaches at my school have positive relationships
with all of their players.”
Concerns about COVID-19 differed strongly by
urbanicity, race/ethnicity, and gender. There was a
strong difference between rural and other schools,
with rural students having the highest percentage
of being “not concerned” about COVID-19 (43.4%
versus 34.4% overall) and urban students having
the highest percentage for “very concerned”
(31.0% versus 22.4% overall). Males (42.7%) were
much more likely to report feeling “not concerned”
(and subsequently less likely to report being “very
concerned”) than females (29.4%).

National Student Survey Analysis 2020–2021 ADMINISTRATION
Page 42
These differences also showed up for race/
ethnicity, with Black (36.9%) and Asian (37.2%)
students much more likely than White students
(15.4%) to report being very concerned.
Sports have obviously been severely impacted
by the COVID-19 pandemic, but not surprisingly,
students tended to report similar elements
they were missing about sports to the original
motivations reported for playing sports, such as
having fun (59%), playing with and making new
friends (53%), and exercise (51%).
Areas for Future ResearchThere are several questions that warrant further
investigation. Given the number of demographic
variables and possible differences that exist within
each sport (e.g., do these overall findings still apply
for just those participating in soccer?), there are
countless research questions that can be answered
using these results, each of which could lead to a
full report by itself. However, this initial report has
identified two key areas that can inform potential
programmatic and policy-related decision. Each of
these is detailed below:
Reasons for Participation by Sport The overall reasons that students listed for
participation in sports were having fun (81%),
exercise (79%), learning and improving skills (66%),
playing with and making new friends (64%), and
competing (testing myself against others) (59%).
These findings have implications for decisions
about training for coaches and the content of
practices. However, while this report provided
overall results for the motivations students listed,
there is potential to differentiate trainings for
coaches by sport. To inform how trainings should
be differentiated, it would be useful to investigate
how these motivations vary across various sports.
A further breakdown for reasons of participation
by sport could also factor in race/ethnicity and
gender. The current analysis showed that reasons
for participation in sports varied by both gender
and race/ethnicity. One example is that Black
students were more likely to report that earning
a potential college scholarship was a motivating
factor in participation. However, these motivations
may show further variation by sport (e.g., does this
trend stay consistent for both football and other
sports that may not have as many scholarships?)
and further analysis could inform both recruiting
efforts and training programs.
Coaching Practices to Develop Social and Emotional Skills by SportAs students moved into higher grades, they were
less likely to agree with statements such as
“Coaches at my school value every member of the
team” and “Coaches at my school have positive
relationships with all of their players”. While this
drop may reflect more competitive levels of sports
at upper levels (e.g., varsity instead of junior
varsity), it also may indicate that different ways
of communicating that coaches value players or
different methods of relationship building are
necessary in upper grades. An analysis of these
questions by sport as well as qualitative interviews
asking students specially about these practices
would provide insight into whether this was a
trend by type of sport (e.g., ones that get more
competitive or are based on playing time) or if it
was a trend that was consistent across all sports.
In either situation, training for coaches on SEL
practices could be differentiated by either grade
level or by sport to better meet the needs of their
particular athletes.