national soccer league
TRANSCRIPT

ANNUAL REPORT 2012 41
National Soccer League(Trading as the Premier Soccer League)
ANNUAL FINANCIAL STATEMENTS31 July 2012
ANNUAL REPORT 2012 43ANNUAL REPORT 201242
The annual financial statements have been prepared under the supervision of Siphamandla Makhaya (CA) SA.
Composition of the Executive Committee 44
Financial Managers Report 45 -46
Statement of the Executive Committee’s responsibility 47
Independent auditor’s report 48 - 49
Report of the Executive Committee 50 - 51
Statement of comprehensive income 52
Statement of financial position 53
Statement of changes in equity 54
Statement of cash flows 55
Notes to the annual financial statements 56 - 73
Supplementary information
Detailed statement of comprehensive income 74 - 79
CONTENTS
National Soccer League(Trading as the Premier Soccer League)
ANNUAL FINANCIAL STATEMENTSfor the year ended 31 July 2012

ANNUAL REPORT 2012 45ANNUAL REPORT 201244
NATIONAL SOCCER LEAGUE
FINANCIAL MANAGERS REPORT For the year ended 31 July 2012
NATIONAL SOCCER LEAGUE
COMPOSITION OF THE EXECUTIVE COMMITTEE for the year ended 31 July 2012
Chairman
Dr I Khoza
Chief Executive Officer
Mr Z Majavu (appointed 1 August 2011- resigned 18 October 2011)
Mr S Matthews (appointed 1 February 2012 - resigned 30 June 2012)
Mr C Mokanyane (appointed Acting Chief Executive Officer 18 October 2011 to 31 January 2012 and
30 June 2012 to date)
Members
Mr K Motaung
Ms M Madlala
Mr S Matthews (resigned 31 January 2012)
Mr G Allie
Mr J Comitis
Mr M Mokoena
Dr P Sokhela
Mr E Sono (appointed 1 February 2012)
In terms of paragraph 9.1 of the League’s constitution, all of the above members will hold office until the next general
meeting to be held on the 8th of November 2012.
Figure 1: Annual total revenue over a period of 5 years
Total revenue
Years
It is my pleasure to present to you the audited annual financial statements of the National Soccer League (NSL) for the
financial year ended 31 July 2012.
The National Soccer League has reported a net loss of R15.7 million during the current year compared to a net profit of
R3.7 million in the last year. The loss is mainly due to last years employees’ tax and value added tax which were discovered
after an audit as instituted by the Executive Committee. This was in line with the Executive Committee’s commitment to
good corporate governance.
The Total Revenue, including other income, decreased by R23.1 million in the current year compared to last year. The
reduction is mainly due to the cancellation fee by Telkom of R15 million as well as the Telkom Charity Cup rights fee of
R15.8 million which were paid last year and distributed as additional ex gratia to the clubs. This was not repeated in the
current year. However, the Total Revenue effectively increased by R7.7 million, if we take away the effect of the revenue
loss from Telkom Charity Cup. This increment was due to Consumer Price Index.
Administration costs increased by R12.8 million in the current year compared to last year. Included in the administration
costs are the employees’ tax amounts and value added tax amounts which relate to prior years as mentioned above.
These are once-off losses which are not expected to recur in the future.
Competition expenditure increased from R163.8 million in 2011 to R171.6 in 2012. The increase is mainly due to higher
costs of travelling as well as the 25% increase in referees and match commissioners’ fees which were not paid over the
past few years.
The monthly grants paid to the teams remained constant compared to prior year. However, the total grants as presented
on the statement of comprehensive income have decreased by R28.8 million which is the additional ex gratia grant that
was paid to clubs in the last year.

ANNUAL REPORT 2012 47ANNUAL REPORT 201246
Staff costs increased as a result of the appointment of senior management during the current year.
Interest expense increased due to the interest and penalties charged by SARS as a result of the audit.
The League implements and monitors the business risks, accounting and internal control systems approved by the
League’s Executive. The principal features of the system of internal controls included:
• Budgetarycontroloverincomeandexpenditure
• Regularreviewsoffinancialmanagementinformation
• Identificationandmanagementofkeybusinessandinherentrisks.
Cambridge Mokanyane
Chief Financial Officer
NATIONAL SOCCER LEAGUE
FINANCIAL MANAGERS REPORT (continued) For the year ended 31 July 2012
NATIONAL SOCCER LEAGUE
STATEMENT OF THE EXECUTIVE COMMITTEE’S RESPONSIBILITY for the year ended 31 July 2012
The members of the Executive Committee are responsible for the preparation, integrity and fair presentation of the annual
financial statements of the National Soccer League.
The members of the Executive Committee are required by the League’s constitution to maintain adequate accounting
records and to prepare annual financial statements for each financial year, which fairly present the state of affairs of
the League at the end of the financial year, the results of its operations and cash flows for the year. In preparing the
accompanying annual financial statements, International Financial Reporting Standards have been followed.
The members of the Executive Committee are also responsible for the League’s systems of internal financial control. These
are designed to provide reasonable, but not absolute, assurance as to the reliability of the financial statements and to
adequately safeguard, verify and maintain accountability for the league assets, and to prevent and detect misstatement
and loss. Nothing has come to the attention of the members of the Executive Committee’s to indicate that any material
breakdown in the functioning of these controls, procedures and systems has occurred during the year under review.
The annual financial statements incorporate full and responsible disclosure. The Executive Committee has reviewed
the League’s budget and cash flow forecast for the year ending 31 July 2013. On the basis of this review and in light
of the current financial position and sponsorship facilities, the Executive Committee is satisfied that the National Soccer
League is a going concern and has therefore continued to adopt the going concern basis in preparing the annual financial
statements.
The League’s external auditors, Deloitte & Touche, have audited the annual financial statements and their report appears
on pages 48 and 49. The annual financial statements and detailed statement of comprehensive income for the year
ended 31 July 2012 as set out on pages 50 to 79 have been approved by the members of the Executive Committee on
11 October 2012 and are signed on its behalf by:
ACTING CHIEF EXECUTIVE OFFICER
CHAIRMAN OF FINANCE COMMITTEE
Figure 2: Distribution to clubs over a period of 5 years
Years
Distributions to clubs350.00
300.00
250.00
200.00
R m
150.00
100.00
50
2008 2009 2010 2011 2012
Grants
Prize money
Participation fee

ANNUAL REPORT 2012 49ANNUAL REPORT 201248
We have audited the annual financial statements of National Soccer League, set out on pages 50 to 73 which comprises
the statement of financial position as at 31 July 2012, and the statement of comprehensive income, statement of changes
in equity and the statement of cash flows for the year then ended, and the notes, comprising a summary of significant
accounting policies and other explanatory information.
Executive Committee Responsibility for the Financial Statements
The Executive Committee are responsible for the preparation and fair presentation of these financial statements in
accordance with International Financial Reporting Standards and for such internal control as the members determine is
necessary to enable the preparation of financial statements that are free from material misstatement, whether due to fraud
or error.
Auditor’s Responsibility
Our responsibility is to express an opinion on these financial statements based on our audit. We conducted our audit in
accordance with International Standards on Auditing. Those standards require that we comply with ethical requirements
and plan and perform the audit to obtain reasonable assurance whether the financial statements are free from material
misstatement.
An audit involves performing procedures to obtain audit evidence about the amounts and disclosures in the financial
statements. The procedures selected depend on the auditor’s judgment, including the assessment of the risks of material
misstatement of the financial statements, whether due to fraud or error. In making those risk assessments, the auditor
considers internal control relevant to the entity’s preparation and fair presentation of the financial statements in order
to design audit procedures that are appropriate in the circumstances, but not for the purpose of expressing an opinion
on the effectiveness of the entity’s internal control. An audit also includes evaluating the appropriateness of accounting
principles used and the reasonableness of accounting estimates made by management, as well as evaluating the overall
presentation of the financial statements.
We believe that the audit evidence we have obtained is sufficient and appropriate to provide a basis for our audit opinion.
Independent auditor’s report to the members of the National Soccer League Independent auditor’s report to the members of the National Soccer League (continued)
Opinion
In our opinion the financial statements present fairly, in all material respects, the financial position of National Soccer
League as at 31 July 2012, and of its financial performance and its cash flows for the year then ended in accordance with
International Financial Reporting Standards.
Supplementary information
The detailed statement of comprehensive income set out on pages 74 to 79 does not form part of the financial state-
ments and is presented as additional information. We have not audited this schedule and accordingly we do not
express an opinion there on.
Other reports
As part of our audit of the financial statements for the year ended 31 July 2012, we have read the Executive Commit-
tee’s report for the purpose of identifying whether there are material inconsistencies between this report and the audited
financial statements.
Thisreportistheresponsibilityofthepreparer.Basedonreadingthisreportwehavenotidentifiedmaterialinconsisten-
cies between this report and the audited financial statements. However, we have not audited this report and accordingly
do not express an opinion on it.
Deloitte & Touche
Registered Auditor
Per: Haroon Loonat
Partner
11 October 2012

ANNUAL REPORT 2012 51ANNUAL REPORT 201250
NATIONAL SOCCER LEAGUE
REPORT OF THE EXECUTIVE COMMITTEE for the year ended 31 July 2012
Nature of business
The primary objective of the National Soccer League is to promote, organise, control and administer professional and
semi-professional soccer in South Africa. The National Soccer League aims to utilise its funds for investments and for such
other purposes as shall be in the interest of the League and the affiliated clubs, and the objectives for which the National
Soccer League has been established.
Financial review
The League has recorded a net loss of R15.7 million (2011: profit of R3.7 million) during the current year. This loss is due
mainly to interest and penalties to the South African Revenue Services (“SARS”) in respect of employees tax relating to
prior years. In addition, certain input tax VAT has been denied which added to the loss.
The reduction in revenue from R560 million to R540 million is due to the phase-out of the Telkom Charity Cup. The revenue
amounts from other sponsors have remained intact and increases are governed by long-term contracts with the sponsor
partners.
The founding guidelines and principles, upon which the League was established, have always been for the development
and support of professional soccer in South Africa. Consequently, an amount of R273 million has been disbursed to clubs
during the year. The Clubs have a reciprocal responsibility to continue to enhance the brand of the League and to be
mindful of their obligations to the soccer fraternity.
As a further indication of the support and responsibility of the League to the broader soccer community, the Executive
Committee have approved an amount of R7 million (2011: R7 million) to the South African Football Association (SAFA) for
development expenditure.
Chief executive officer
The Executive Committee continues with its plan to find a suitable candidate for the position of Chief Executive Officer.
Despite the changes in this role during the year, the League continues to be ably led by the Chief Operating Officer who
is leading the National Soccer League in an acting capacity.
Going concern
We believe there will be sufficient funds generated from sponsorships to enable the League to continue as a going
concern in the foreseeable future.
The Executive Committee has been successful in renegotiating the renewal of many of its sponsorship contracts. The
broadcast negotiations with SuperSport have been successfully concluded for an additional five years by the Executive
Committee.
The Executive Committee has reviewed the budget for the year ahead together with the cash forecast and is confident
that the League will have sufficient cash resources to meet its obligations as they fall due.
NATIONAL SOCCER LEAGUE
REPORT OF THE EXECUTIVE COMMITTEE (continued) for the year ended 31 July 2012
Finance Committee
The Committee members are appointed by the Executive Committee.
The Committee met ten times during the year to discuss accounting, auditing, internal control and other financially related
matters. It provides an independent forum through which the independent auditors report to the Executive Committee.
The independent auditors were invited to two meetings during the year.
Internal controls
The members of the Executive Committee are responsible for maintaining adequate accounting records and for taking
reasonable steps to safeguard the assets of the League to prevent and detect fraud and other irregularities. To enable the
members to meet these responsibilities, management sets standards and implements systems of internal control aimed
at reducing the risk of error or loss in a cost-effective manner. The members are not aware of any material breakdown in
internal controls during the year under review.
Subsequent events
No events of a material nature have occurred between the accounting date and the date of this report, which would result
in an adjustment to or disclosure in the financial statements.
Auditors
The League’s auditors are Deloitte & Touche.

ANNUAL REPORT 2012 53ANNUAL REPORT 201252
NATIONAL SOCCER LEAGUE
STATEMENT OF COMPREHENSIVE INCOME for the year ended 31 July 2012
Notes 31/07/2012 31/07/2011
R R
Revenue 3 539 706 835 560 258 669
Other income 4 18 574 979 20 871 317
Total revenue 558 281 814 581 129 986
Administration costs (77 230 155) (64 475 698)
Competition expenditure (171 290 665) (163 783 105)
Grants (272 960 000) (301 760 000)
Development expenditure (9 074 822) (8 149 372)
Staff costs (24 564 846) (22 140 726)
Marketing and media (20 324 005) (21 055 160)
Loss from operations 6 (17 162 679) (234 075)
Interest 7 (4 743 611) (474 884)
Interest received 8 5 967 351 6 619 747
(Loss) profit before taxation (15 938 939) 5 910 788
Taxation income (expense) 9 258 703 (2 257 104)
Total (loss) profit and comprehensive (loss) income
for the year(15 680 236) 3 653 684
NATIONAL SOCCER LEAGUE
STATEMENT OF FINANCIAL POSITION at 31 July 2012
Notes 31/07/2012 31/07/2011
R R
Assets
Non-current assets
Property, plant and equipment 10 34 125 585 32 490 705
Deferred taxation 11 6 532 633 6 297 736
Total non-current assets 40 658 218 38 788 441
Current assets
Trade and other receivables 12 20 515 423 24 095 703
Balancesduebyteams 3 464 709 5 394 173
Cash and cash equivalents 216 970 14 951 125
Taxation asset - 1 475 983
Total current assets 24 197 102 45 916 984
Total assets 64 855 320 84 705 425
Equity and liabilities
Reserves
Team guarantees 257 393 257 393
Insurance reserve fund - 7 985 000
Retained (loss) income (712 257) 6 982 979
Total reserves (454 864) 15 225 372
Non-current liabilities
Long-term liabilities 13 3 796 811 4 072 600
Total non-current liabilities 3 796 811 4 072 600
Current liabilities
Trade and other payables 14 40 835 690 28 613 405
Balancesduetoteams 16 183 664 32 947 515
Provisions 15 2 109 037 2 666 073
Current portion of long-term liabilities 13 639 099 1 180 460
Bankoverdraft 1 745 883 -
Total current liabilities 61 513 373 65 407 453
Total equity and liabilities 64 855 320 84 705 425
ANNUAL REPORT 2012 55ANNUAL REPORT 201254
NATIONAL SOCCER LEAGUE
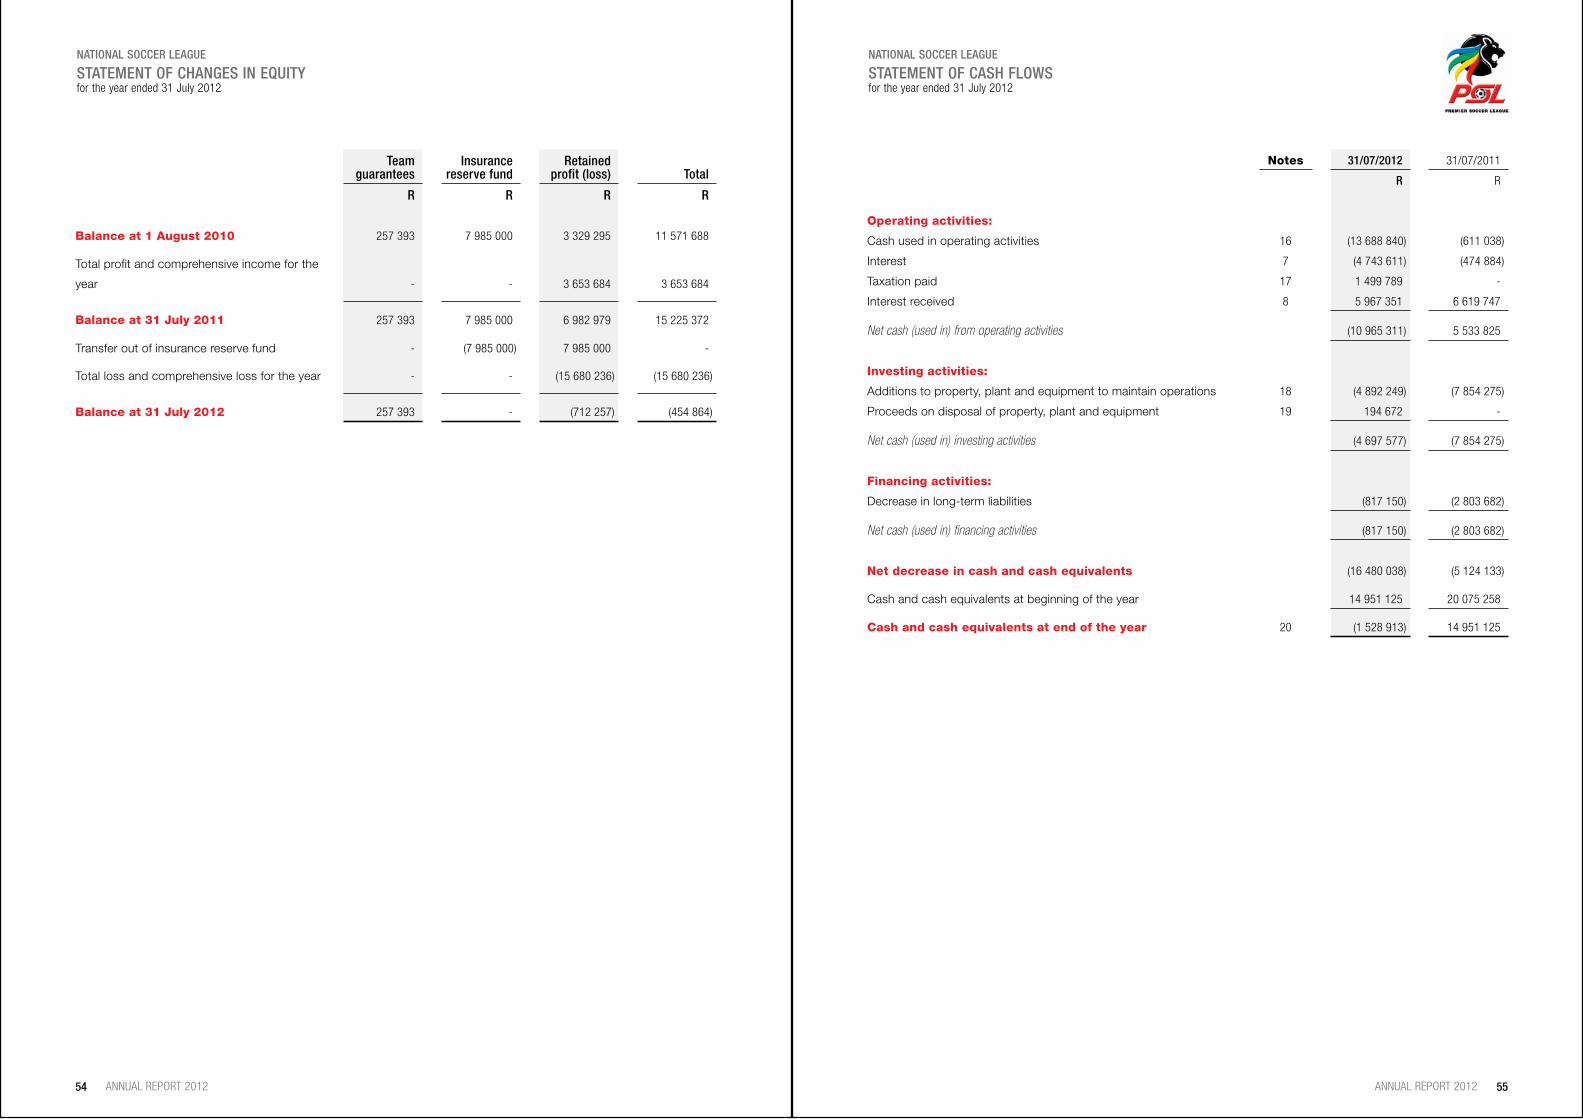
STATEMENT OF CHANGES IN EQUITY for the year ended 31 July 2012
Team guarantees
Insurance reserve fund
Retained profit (loss)
Total
R R R R
Balance at 1 August 2010 257 393 7 985 000 3 329 295 11 571 688
Total profit and comprehensive income for the
year - - 3 653 684 3 653 684
Balance at 31 July 2011 257 393 7 985 000 6 982 979 15 225 372
Transfer out of insurance reserve fund - (7 985 000) 7 985 000 -
Total loss and comprehensive loss for the year - - (15 680 236) (15 680 236)
Balance at 31 July 2012 257 393 - (712 257) (454 864)
NATIONAL SOCCER LEAGUE
STATEMENT OF CASH FLOWS for the year ended 31 July 2012
Notes 31/07/2012 31/07/2011
R R
Operating activities:
Cash used in operating activities 16 (13 688 840) (611 038)
Interest 7 (4 743 611) (474 884)
Taxation paid 17 1 499 789 -
Interest received 8 5 967 351 6 619 747
Net cash (used in) from operating activities (10 965 311) 5 533 825
Investing activities:
Additions to property, plant and equipment to maintain operations 18 (4 892 249) (7 854 275)
Proceeds on disposal of property, plant and equipment 19 194 672 -
Net cash (used in) investing activities (4 697 577) (7 854 275)
Financing activities:
Decrease in long-term liabilities (817 150) (2 803 682)
Net cash (used in) financing activities (817 150) (2 803 682)
Net decrease in cash and cash equivalents (16 480 038) (5 124 133)
Cash and cash equivalents at beginning of the year 14 951 125 20 075 258
Cash and cash equivalents at end of the year 20 (1 528 913) 14 951 125
ANNUAL REPORT 2012 57ANNUAL REPORT 201256
1. Presentation of annual financial statements
These financial statements are presented in South African Rand since that is the currency in which the majority of
the League’s transactions are denominated.
1.1 Standards and interpretations in issue not yet adopted
The League has adopted all the new and revised standards issued by the International Accounting Standards
Board(IASB)thatarerelevantandeffectiveforaccountingperiodsbeginningonorbefore1January2011.
At the date of authorisation of these financial statements, other than the standards and interpretations adopted, the
following new and revised standards and interpretations applicable to the League were in issue but not yet effective:
• IFRS1 First-timeAdoptionofInternationalFinancialReportingStandards
• IFRS7 FinancialInstruments:Disclosures
• IFRS9 FinancialInstruments-ClassificationandMeasurement
• IFRS12 Disclosureofinterestinotherentities
• IFRS13 FairValueMeasurement
• IAS1 PresentationofFinancialStatements
• IAS39 FinancialInstruments:RecognitionandMeasurement
• IAS12 Incometaxes
• IAS32 Financialinstruments:Presentation
The Executive Committee anticipates that all the above Standards and Interpretations will be adopted in the
League’s financial statements for the future financial periods as they become effective. The adoption of these
Standards and Interpretations will have no material impact on the financial statements of the League in the period
of initial application.
2. Summary of significant accounting policies
Basis of preparation
The financial statements have been prepared under the historical cost basis except for the valuation of certain
financial instruments at fair value.
Statement of compliance
The financial statements have been prepared in accordance with International Financial Reporting Standards and
in the manner required by the League’s constitution.
Property, plant and equipment
Land is stated at historical cost and is not depreciated. Other property, plant and equipment are stated at histori-
cal cost less accumulated depreciation and any accumulated impairment losses. Depreciation is calculated on
historical cost using the straight line basis to reduce carrying amount to the estimated residual value of the asset,
over its useful life.
NATIONAL SOCCER LEAGUE
NOTES TO THE ANNUAL FINANCIAL STATEMENTS for the year ended 31 July 2012
Property, plant and equipment (continued)
The following annual depreciation rates apply:
Buildings 5%
Motor vehicles 20%
Office equipment 15%
Office furniture 10%
Computer equipment and software 20% - 33,3%
Property, plant and equipment is derecognised upon disposal or where no future economic benefits are expected
to arise from continued use of the asset.
The gain or loss arising on the disposal or retirement of an asset is determined as the difference between the sales
proceeds and the carrying amount of the asset and is recognised in income.
The League has reviewed the residual values used for the purpose of depreciation calculations in the light of the
definition of residual value in IAS 16 Property, Plant and Equipment. The review did not highlight any requirements
for an adjustment to the residual values used in the current or prior period. The gain or loss arising on the disposal
or retirement of an asset is determined as the difference between the sales proceeds and the carrying amount of
the asset and is recognised in income. An item of property, plant and equipment is derecognised upon disposal or
when no future economic benefits are expected to arise from the continued use of the asset. Assets held under fi-
nance leases are depreciated over their expected useful lives on the same basis as owned assets or, where shorter,
the term of the relevant lease.
Impairment
At each reporting date, the League reviews the carrying amounts of its tangible and intangible assets to determine
whether there is any indication that those assets have suffered an impairment loss. If any such indication exists, the
recoverable amount of the asset is estimated in order to determine the extent of the impairment loss (if any). Where
it is not possible to estimate the recoverable amount of an individual asset, the League estimates the recoverable
amount of the cash-generating unit to which the asset belongs. Where a reasonable and consistent basis of
allocation can be identified, corporate assets are also allocated to individual cash-generating units, or otherwise
they are allocated to the smallest group of cash-generating units for which a reasonable and consistent allocation
basis can be identified. Intangible assets with indefinite useful lives and intangible assets not yet available for use
are tested for impairment annually, and whenever there is an indication that the asset may be impaired.
Recoverable amount is the higher of fair value less costs to sell and value in use. In assessing value in use, the
estimated future cash flows are discounted to their present value using a pre-tax discount rate that reflects current
market assessments of the time value of money and the risks specific to the asset for which the estimates of future
cash flows have not been adjusted.
If the recoverable amount of an asset (or cash-generating unit) is estimated to be less than its carrying amount, the
carrying amount of the asset (or cash-generating unit) is reduced to its recoverable amount. An impairment loss is
recognised immediately in profit or loss, unless the relevant asset is carried at a revalued amount, in which case the
impairment loss is treated as a revaluation decrease.
NATIONAL SOCCER LEAGUE
NOTES TO THE ANNUAL FINANCIAL STATEMENTS (continued) for the year ended 31 July 2012

ANNUAL REPORT 2012 59ANNUAL REPORT 201258
NATIONAL SOCCER LEAGUE
NOTES TO THE ANNUAL FINANCIAL STATEMENTS (continued) for the year ended 31 July 2011
NATIONAL SOCCER LEAGUE
NOTES TO THE ANNUAL FINANCIAL STATEMENTS (continued) for the year ended 31 July 2012
2. Summary of significant accounting policies (continued)
Impairment (continued)
Where an impairment loss subsequently reverses, the carrying amount of the asset (or cash-generating unit) is
increased to the revised estimate of its recoverable amount, but so that the increased carrying amount does not
exceed the carrying amount that would have been determined had no impairment loss been recognised for the
asset (or cash-generating unit) in prior years. A reversal of an impairment loss is recognised immediately in profit
or loss, unless the relevant asset is carried at a revalued amount, in which case the reversal of the impairment loss
is treated as a revaluation increase.
Provisions
Provisions are recognised when the League has a present legal or constructive obligation as a result of a past event
and it is probable that the company will be required to settle that obligation and a reliable estimate can be made of
the amount of the obligation. Provisions are measured at the directors’ best estimate of the expenditure required
to settle the obligation at the end of the reporting period, and are discounted to present value where the effect is
material.
Revenue recognition
Revenue comprises sponsorship revenue from various sponsors and the sale of broadcasting rights. Revenue
which is received in terms of contracts is recognised on an accrual basis. Contracts that are tournament-specific or
relate directly to the League season are recognised over the duration of the specific tournament or League season
as appropriate. Revenue is measured at the fair value of consideration received or receivable.
All other income is accounted for on an accrual basis. This includes gate revenue, income from members, advertising
board income and other miscellaneous income.
Interest income from a financial asset is recognised when it is probable that the economic benefits will flow to
the League and the amount of income can be measured reliably. Interest income is accrued on a time basis, by
reference to the principle outstanding and at the effective estimated future cash receipts through the expected life
of the financial asset to that asset’s net carrying amount on initial recognition.
Retirement benefit costs
The retirement benefit plan is governed by the Pension Fund Act, 1956. Contributions paid to fund obligations for
the payment of retirement benefits are charged against income in the year of payment.
Critical accounting judgements and key sources of estimation uncertainty
In the application of the League’s accounting policies, which are described above, the Executive Committee
members are required to make judgements, estimates and assumptions about the carrying amounts of assets and
liabilities that are not readily apparent from other sources. The estimates and associated assumptions are based
on historical experience and other factors that are considered to be relevant. Actual results may differ from these
estimates.
The estimates and underlying assumptions are reviewed on an ongoing basis. Revisions to accounting estimates
are recognised in the period in which the estimate is revised if the revision affects only that period or in the period
of the revision and future period if the revision affects both current and future periods.
Key sources of estimation uncertainty
The following are the key assumptions concerning the future, and other key sources of estimation uncertainty at
the statement of financial position date, that have a significant risk of causing a material adjustment to the carrying
amounts of assets and liabilities within the next financial year.
Useful lives of property, plant and equipment
As described above, the League reviews the estimated useful lives of property, plant and equipment at the end of
each annual reporting period.
Taxation
Income tax expense represents the sum of the tax currently payable and deferred tax.
Current tax
The tax currently payable is based on taxable profit for the year. Taxable profit differs from profit as reported in the
statement of comprehensive income because of items of income or expense that are taxable or deductible in other
years and items that are never taxable or deductible. The company’s liability for current tax is calculated using tax
rates that have been enacted or substantively enacted by the end of the reporting period.
Deferred tax
Deferred tax is recognised on temporary differences between the carrying amounts of assets and liabilities in
the financial statements and the corresponding tax bases used in the computation of taxable profit. Deferred
tax liabilities are generally recognised for all taxable temporary differences. Deferred tax assets are generally
recognised for all deductible temporary differences to the extent that it is probable that taxable profits will be
available against which those deductible temporary differences can be utilised. Such deferred tax assets and
liabilities are not recognised if the temporary difference arises from goodwill or from the initial recognition (other
than in a business combination) of other assets and liabilities in a transaction that affects neither the taxable profit
nor the accounting profit.
The carrying amount of deferred tax assets is reviewed at each reporting period and reduced to the extent that it
is no longer probable that sufficient taxable profits will be available to allow all or part of the asset to be recovered.
Deferred tax assets and liabilities are measured at the tax rates that are expected to apply in the period in which the
liability is settled or the asset realised, based on tax rates (and tax laws) that have been enacted or substantively
enacted by the end of the reporting period. The measurement of deferred tax liabilities and assets reflects the tax
consequences that would follow from the manner in which the company expects, at the reporting date, to recover
or settle the carrying amount of its assets and liabilities
Deferred tax assets and liabilities are offset when there is a legally enforceable right to set off current tax assets
against current tax liabilities and when they relate to income taxes levied by the same taxation authority and the

ANNUAL REPORT 2012 61ANNUAL REPORT 201260
NATIONAL SOCCER LEAGUE
NOTES TO THE ANNUAL FINANCIAL STATEMENTS (continued) for the year ended 31 July 2012
2. Summary of significant accounting policies (continued)
Taxation (continued)
company intends to settle its current tax assets and liabilities on a net basis.
Current and deferred tax for the period
Current and deferred tax are recognised in profit or loss, except when they relate to items credited or debited
directly to equity, in which case the current and deferred tax is also recognised directly in equity, or where they arise
from the initial accounting for a business combination. The tax effect is included in the accounting for the business
combination.
Financial instruments
Financial assets and financial liabilities are recognised on the League’s statement of financial position when the
League has become party to contractual provisions of the instrument.
Measurement
Financial instruments are initially measured at cost, which includes transaction costs. Subsequent to initial recogni-
tion, these instruments are measured as set out below.
Trade and other receivables (including balances due by the teams)
Trade and other receivables are measured at initial recognition at fair value, and are subsequently measured
at amortised cost using the effective interest rate method. Appropriate allowances for estimated irrecoverable
amounts are recognised in profit or loss when there is objective evidence that the asset is impaired. The allowance
recognised is measured as the difference between the asset’s carrying amount and the present value of estimated
future cash flows discounted at the effective interest rates computed at initial recognition.
Bank borrowings
Long-term liabilities in the form of mortgage bonds and instalment sale liabilities are initially measured at fair value,
and are subsequently measured at amortised cost, using the effective interest rate method. Any difference between
the proceeds (net of transaction costs) and the settlement or redemption of borrowings is recognised over the term
of the borrowings in accordance with the League’s accounting policy on borrowing costs.
Trade and other payables (including balances due to the teams)
Trade and other payables are initially measured at fair value, and are subsequently measured at amortised cost,
using the effective interest rate method.
Cash and cash equivalents
For the purpose of the statement of cash flow, cash and cash equivalents comprise cash on hand and deposits held
on call with banks net of bank overdraft, all of which are available for use by the League unless otherwise stated.
31/07/2012 31/07/2011
R R
NATIONAL SOCCER LEAGUE
NOTES TO THE ANNUAL FINANCIAL STATEMENTS (continued) for the year ended 31 July 2012
3. Revenue
Sponsorship income 217 013 906 239 152 943
Broadcastingrights 285 000 000 285 000 000
Supplier contributions 37 692 929 36 105 726
539 706 835 560 258 669
4. Other income
Commissions – Super Six 1 062 308 1 930 010
Share of revenue from tournament gate takings 15 677 129 17 746 482
Other 1 835 542 1 194 825
18 574 979 20 871 317
5. Non-cash sponsorship
Avis
- Income 1 131 120 924 480
- Expense (1 131 120) (924 480)
- -
Adidas
- Income 1 379 442 1 379 442
- Expense (1 379 442) (1 379 442)
- -
Southern Sun
- Income 247 406 195 052
- Expense (247 406) (195 052)
- -
Coca-Cola
- Income 36 309 31 567
- Expense (36 309) (31 567)
- -
Net non-cash sponsorship - -

ANNUAL REPORT 2012 63ANNUAL REPORT 201262
31/07/2012 31/07/2011
R R
NATIONAL SOCCER LEAGUE
NOTES TO THE ANNUAL FINANCIAL STATEMENTS (continued) for the year ended 31 July 2012
6. Loss from operations
This is arrived at after taking the following items into account:
Auditor’s remuneration:
- Audit fees 1 375 384 1 264 000
- Other fees 114 000 58 000
1 489 384 1 322 000
Baddebtswrittenoffandprovidedfor 4 506 832 555 842
Commissions 21 786 602 22 342 588
Depreciation:
-Buildings 27 628 19 929
- Motor vehicles 65 770 180 811
- Office equipment 319 025 210 700
- Office furniture 178 636 166 367
- Computer equipment and software 2 610 684 1 033 806
3 201 743 1 611 613
Executive Committee and all other sub-committees:
- Executive Committee and all other sub-committees remuneration 1 189 433 1 021 060
- Honoraria – current year 3 000 000 2 673 831
4 189 433 3 694 891
Professional fees
Legal fees:
- Deductible fees 1 282 386 1 593 642
- Non-deductible fees - 558 798
- Corporatisation fees 2 083 290 2 074 436
Consulting 3 970 856 -
7 336 532 4 226 876
Profit on disposal of property, plant and equipment 136 347 -
Operating lease charges
- Equipment rental 1 266 954 1 234 537
31/07/2012 31/07/2011
R R
NATIONAL SOCCER LEAGUE
NOTES TO THE ANNUAL FINANCIAL STATEMENTS (continued) for the year ended 31 July 2012
7. Interest
Instalment sale - 1 844
Bondfinance 372 402 422 332
South African Revenue Services 4 371 209 -
Other - 50 708
4 743 611 474 884
8. Interest received
Staff loans 4 200 2 772
Bank 5 662 147 6 396 598
Teams 301 004 220 377
5 967 351 6 619 747
9. Taxation income (expense)
South African Normal Taxation 23 806 35 037
Current taxation - current year - -
- prior year under provision 23 806 35 037
Deferred taxation - current year (1 200) (2 666 163)
- prior year over provision 236 097 374 022
Taxation income (expense) 258 703 (2 257 104)
The taxation charge for the year is reconciled to the profit before taxation
per the statement of comprehensive income.
(Loss) profit before taxation (15 938 939) 5 910 788
Taxation at the domestic income tax rate of 28% (4 462 903) 1 655 021
Taxation effect of exempt differences 4 459 062 775 046
Taxation effect utilisation of assessed loss - 236 096
Taxation effect due to prior year (over) under provision of deferred taxation (236 096) (374 022)
Taxation effect due to prior year (over) under provision (23 806) (35 037)
Taxation effect of amounts taxed at capital gains tax rate 5 040 -
(258 703) 2 257 104
The tax loss available for set-off against future taxable income amounts to
R21.2 million.

ANNUAL REPORT 2012 65ANNUAL REPORT 201264
NATIONAL SOCCER LEAGUE
NOTES TO THE ANNUAL FINANCIAL STATEMENTS (continued) for the year ended 31 July 2012
10. Property, plant and equipment
Land and buildings
Motor
vehicles
Office
equipment
Office
furniture
Computer equipment &
software
Total
R R R R R R
2012
Cost
At 1 August 2011 21 269 753 1 452 149 3 331 764 1 955 120 11 595 821 39 604 607
Additions 291 233 - 313 758 150 295 4 139 662 4 894 948
Disposals - (1 007 413) - - - (1 007 413)
At 31 July 2012 21 560 986 444 736 3 645 522 2 105 415 15 735 483 43 492 142
Accumulated
depreciation
At 1 August 2011 49 102 1 328 053 1 648 473 1 150 014 2 938 260 7 113 902
Depreciation 27 628 65 770 319 025 178 636 2 610 684 3 201 743
Disposals (949 088) - - - (949 088)
At 31 July 2012 76 730 444 735 1 967 498 1 328 650 5 548 944 9 366 557
Carrying value
At 1 August 2011 21 220 651 124 096 1 683 291 805 106 8 657 561 32 490 705
At 31 July 2012 21 484 256 1 1 678 024 776 765 10 186 539 34 125 585
Land and buildings consists of:
Property location Purchase date R’ million
Erf 502 of Portion 7, Morningside October 2005 1, 755
Erf 215 and Erf 216, Parktown February 2006 10, 370
Erf 1 of Portion 1 Vandia Grove June 2007 4, 210
Erf 309 Parktown February 2010 4,900
In the opinion of the Executive Committee, the market values of these properties are in excess of their book value.
Included in land and buildings is an amount of R21 484 256 (2011: R21 220 651) relating to property which is not
depreciated. As detailed in note 13 to the financial statements, the carrying value of land and buildings includes
amounts of R21 484 256 (2011: R21 220 651) in respect of assets held under mortgage bonds.
NATIONAL SOCCER LEAGUE
NOTES TO THE ANNUAL FINANCIAL STATEMENTS (continued) for the year ended 31 July 2012
10. Property, plant and equipment (continued)
Land and buildings
Motor
vehicles
Office
equipment
Office
furniture
Computer equipment &
software
Total
R R R R R R
2011
Cost
At 1 August 2010 21 265 079 1 452 149 2 644 012 1 934 370 4 454 722 31 750 332
Additions 4 674 - 687 752 20 750 7 141 099 7 854 275
At 31 July 2011 21 269 753 1 452 149 3 331 764 1 955 120 11 595 821 39 604 607
Accumulated
depreciation
At 1 August 2010 29 173 1 147 242 1 437 773 983 647 1 904 454 5 502 289
Depreciation 19 929 180 811 210 700 166 367 1 033 806 1 611 613
At 31 July 20110 49 102 1 328 053 1 648 473 1 150 014 2 938 260 7 113 902
Carrying value
At 1 August 2010 21 235 906 304 907 1 206 239 950 723 2 550 268 26 248 043
At 31 July 2011 21 220 651 124 096 1 683 291 805 106 8 657 561 32 490 705
Land and buildings consists of:
Property location Purchase date R’ million
Erf 502 of Portion 7, Morningside October 2005 1, 755
Erf 215 and Erf 216, Parktown February 2006 10, 370
Erf 1 of Portion 1 Vandia Grove June 2007 4, 210
Erf 309 Parktown February 2010 4,900
In the opinion of the Executive Committee, the market values of these properties are in excess of their book value.
Included in land and buildings is an amount of R21 220 651 (2010: R21 265 079) relating to property which is not
depreciated. As detailed in note 13 to the financial statements, the carrying value of land and buildings includes
amounts of R21 220 651 (2010: R21 265 079) in respect of assets held under mortgage bonds.

ANNUAL REPORT 2012 67ANNUAL REPORT 201266
NATIONAL SOCCER LEAGUE
NOTES TO THE ANNUAL FINANCIAL STATEMENTS (continued) for the year ended 31 July 2012
31/07/2012 31/07/2011
R R
11. Deferred taxation
Opening balance 6 297 736 8 589 877
Prior year adjustment to deferred taxation from assessed loss 236 097 374 022
Tax charge to the statement of comprehensive for the year (1 200) (2 666 163)
Closing balance 6 532 633 6 297 736
Deferred taxation asset is due to:
- Estimated tax loss from income received in advance in prior year 21 220 894 19 825 840
- Provisions 2 109 937 2 666 073
23 330 831 22 491 913
Deferred taxation at 28% 6 532 633 6 297 736
12. Trade and other receivables
Trade receivables
Phumelela Gaming and Leisure - 2 200 211
South African Post Office 300 000 300 000
300 000 2 500 211
Other receivables
Deposits 54 000 54 000
Staff loans 158 369 47 909
South African Revenue Service (“SARS”) 1 596 071 1 596 071
Value Added Taxation 17 854 534 19 253 386
FIFA World Cup tickets 350 936 585 550
Other 201 513 58 576
20 215 423 21 595 492
20 515 423 24 095 703
NATIONAL SOCCER LEAGUE
NOTES TO THE ANNUAL FINANCIAL STATEMENTS (continued) for the year ended 31 July 2012
12. Trade and other receivables (continued)
The average credit period on trade receivables at year end is 20 days. No interest is charged on outstanding trade
receivables. Management considers all trade receivables to be recoverable hence no provision for bad debts is
considered necessary for the trade receivable.
Beforeacceptinganynewsponsorship,theLeagueperformsvaluationsonthepotentialsponsorstoassessthe
potential sponsor’s credit quality and defines credit limits by customer.
Included in the League’s trade and other receivable balance are debtors with a carrying amount of
R300 000 (2011: R2 500 211) which are past due at the reporting date for which the entity has not provided for as
there has not been a significant change in credit quality and the amounts are still considered recoverable. The entity
does not hold any collateral over these balances.
Ageing of past due but not impaired
Up to six months
Six months to one year
More than one year Total
R R R R
2012
Trade receivables - - 300 000 300 000
2011
Trade receivables 2 200 211 - 300 000 2 500 211
Trade receivables that are past due are individually assessed. Sponsors with no history of default and from whom the
full amounts are expected to be recovered are not provided for. The individually impaired receivables relate to sponsors
that are experiencing unexpected economic difficulties.
Management considers that the carrying amount of trade and other receivables approximates their fair value.

ANNUAL REPORT 2012 69ANNUAL REPORT 201268
NATIONAL SOCCER LEAGUE
NOTES TO THE ANNUAL FINANCIAL STATEMENTS (continued) for the year ended 31 July 2012
31/07/2012 31/07/2011
R R
13. Long-term liabilities
Mortgage bonds 4 435 910 5 253 060
Less: current portion of long-term liabilities (639 099) (1 180 460)
3 796 811 4 072 600
3 796 811 4 072 600
The mortgage bonds are secured by land and buildings, as detailed in note
10, with a net book value of R21 484 256 (2011: R21 220 651).
The mortgage bonds are repayable in monthly instalments ranging between
R12 380 and R57 113 per month with the last repayment date of 31 August
2020. Interest is charged at the bank prime overdraft rate plus 0, 5 % per
annum.
Management considers that the carrying amount of long-term liabilities
approximates their fair value.
Reconciliation of future payments:
Instalment sale agreements
Within one year
Two tofive years
Over five years Total
R R R R
Mortgage bonds
Parktown (639 099) (3 796 811) - (4 435 910)
NATIONAL SOCCER LEAGUE
NOTES TO THE ANNUAL FINANCIAL STATEMENTS (continued) for the year ended 31 July 2012
31/07/2012 31/07/2011
R R
14. Trade and other payables
Accruals 11 662 540 4 568 139
CAF participation fees - 2 000 000
Commissions - 2 827 936
Diners Club 262 192 512 043
Finder’s fee 5 104 349 7 578 255
Pay-as-you-earn (PAYE) 951 035 1 082 683
SARS liability (PAYE and VAT) 12 441 063 -
Legal fees - 39 542
South African Football Association (SAFA) 7 980 000 7 980 000
Sundry creditors 2 434 511 675 407
Trade creditors - 1 349 400
40 835 690 28 613 405
Management considers that the carrying amount of trade and other payables approximates their fair value.
15. Provisions
Provisions 2 109 937 2 666 073
Provisions
Provision for bonuses Provision for
leave pay Total
R R R
At 1 August 2011 994 975 1 671 098 2 666 073
Current year charge to the statement of
comprehensive income (373 109) (183 027) (556 136)
At 31 July 2012 621 866 1 488 071 2 109 937
Provision for bonuses:The provision for bonuses represents the bonus payments that have accrued to employees.
Leave pay:The provision relates to employees’ leave entitlement at year end and is calculated using total cost to company.
Provisions are measured at the Executive Committee’s best estimate of the expenditure required to settle the obligation at the reporting date, and are discounted to present value where the effect is material.

ANNUAL REPORT 2012 71ANNUAL REPORT 201270
NATIONAL SOCCER LEAGUE
NOTES TO THE ANNUAL FINANCIAL STATEMENTS (continued) for the year ended 31 July 2012
31/07/2012 31/07/2011
R R
16. Cash used in operating activities
Loss from operations (17 162 679) (234 075)
Adjustments for:
Depreciation 3 201 743 1 611 613
(Decrease) increase in provisions (556 136) (421 601)
Profit on disposal of property, plant and equipment (139 044) -
Operating profit before working capital changes (14 656 116) 955 937
Adjustments for working capital changes:
Decrease in trade and other receivables 3 580 280 759 410
Decrease (increase) in balances due by teams 1 929 481 (4 502 825)
Increase (decrease) in trade and other payables 12 222 285 (28 923 243)
(Increase) decrease in balances due to teams (16 764 770) 31 099 683
967 276 (1 566 975)
Cash used in operating activities (13 688 840) (611 038)
17. Taxation paid
Amounts unpaid (overpaid) at beginning of the year 1 475 983 (1 440 946)
Amounts credited to the income statement (excluding deferred taxation) 23 806 (35 037)
Amounts overpaid at end of the year - 1 475 983
1 499 789 -
18. Additions to property, plant and equipment to
maintain operations
Total additions to property, plant and equipment (note 10) 4 892 249 7 854 275
19. Proceeds on disposal of property, plant and equipment
Bookvalueofproperty,plantandequipment 58 325 -
Profit on disposal of property, plant and equipment 136 347 -
Proceeds on disposal property, plant and equipment 194 672 -
NATIONAL SOCCER LEAGUE
NOTES TO THE ANNUAL FINANCIAL STATEMENTS (continued) for the year ended 31 July 2012
21. Post retirement benefits
The provident fund has been registered in terms of the Pension Funds Act No. 24 of 1956. The fund is a defined
contribution plan. The National Soccer League makes monthly contributions to the scheme at a rate of 6% of
members’ monthly salaries as defined in the rules of the scheme. The amount due to the provident fund as at 31
July 2012 is R94 731 (2011: 110 807). The contributions for the year amounted to R758 931 (2011: R910 660).
22. Related party transaction
The following related party transaction occurred during the year:
- Remuneration 1 189 433 1 021 060
- Honoraria 3 000 000 2 673 831
RelatedpartytransactionsaredefinedastransactionswithBoardof
Governors, members of the Executive Committee and all other
sub-committees, and entities over which they have significant influence or
control.
23. Employee information
Number of employees 44 3420. Cash and cash equivalents
Bankbalancesandcash 216 970 14 951 125
Bankoverdraft (1 745 883) -
(1 528 913) 14 951 125
31/07/2012 31/07/2011
R R
BankbalancesandcashcompromisecashheldbytheLeagueandshorttermdepositswithanoriginal
maturity of three months or less. The carrying amounts of these assets approximate their fair value.
Securities are held over the following items:Loan account number: 8151111678401 R3 500 000
MortgageBond–ERF309ParktownofNedbond R2 000 000
MortgageBond–ERF215,REMPTN1ofERF216Parktown R2 000 000
Extent of facilities:Overdraft – current account R2 000 000
20. Cash and cash equivalents (continued)
ANNUAL REPORT 2012 73ANNUAL REPORT 201272
NATIONAL SOCCER LEAGUE
NOTES TO THE ANNUAL FINANCIAL STATEMENTS (continued) for the year ended 31 July 2012
31/07/2012 31/07/2011
R R
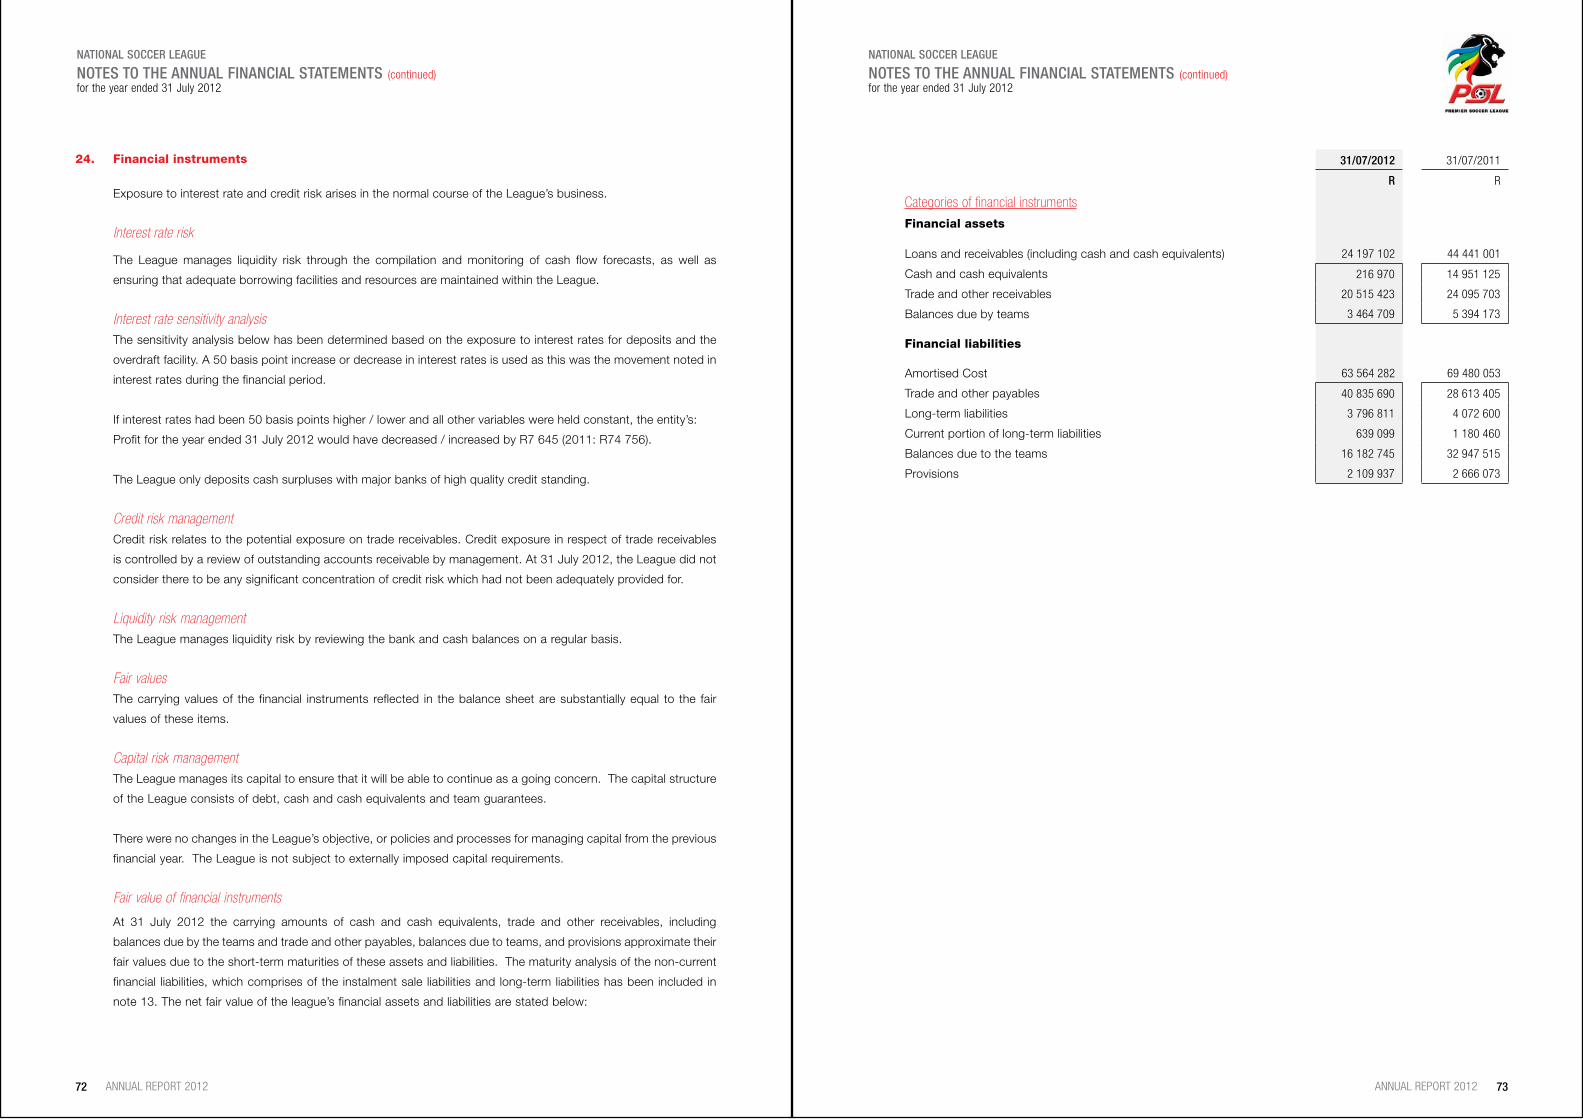
Categories of financial instruments
Financial assets
Loans and receivables (including cash and cash equivalents) 24 197 102 44 441 001
Cash and cash equivalents 216 970 14 951 125
Trade and other receivables 20 515 423 24 095 703
Balancesduebyteams 3 464 709 5 394 173
Financial liabilities
Amortised Cost 63 564 282 69 480 053
Trade and other payables 40 835 690 28 613 405
Long-term liabilities 3 796 811 4 072 600
Current portion of long-term liabilities 639 099 1 180 460
Balancesduetotheteams 16 182 745 32 947 515
Provisions 2 109 937 2 666 073
24. Financial instruments
Exposure to interest rate and credit risk arises in the normal course of the League’s business.
Interest rate risk
The League manages liquidity risk through the compilation and monitoring of cash flow forecasts, as well as
ensuring that adequate borrowing facilities and resources are maintained within the League.
Interest rate sensitivity analysisThe sensitivity analysis below has been determined based on the exposure to interest rates for deposits and the
overdraft facility. A 50 basis point increase or decrease in interest rates is used as this was the movement noted in
interest rates during the financial period.
If interest rates had been 50 basis points higher / lower and all other variables were held constant, the entity’s:
Profit for the year ended 31 July 2012 would have decreased / increased by R7 645 (2011: R74 756).
The League only deposits cash surpluses with major banks of high quality credit standing.
Credit risk management Credit risk relates to the potential exposure on trade receivables. Credit exposure in respect of trade receivables
is controlled by a review of outstanding accounts receivable by management. At 31 July 2012, the League did not
consider there to be any significant concentration of credit risk which had not been adequately provided for.
Liquidity risk managementThe League manages liquidity risk by reviewing the bank and cash balances on a regular basis.
Fair valuesThe carrying values of the financial instruments reflected in the balance sheet are substantially equal to the fair
values of these items.
Capital risk managementThe League manages its capital to ensure that it will be able to continue as a going concern. The capital structure
of the League consists of debt, cash and cash equivalents and team guarantees.
There were no changes in the League’s objective, or policies and processes for managing capital from the previous
financial year. The League is not subject to externally imposed capital requirements.
Fair value of financial instruments
NATIONAL SOCCER LEAGUE
NOTES TO THE ANNUAL FINANCIAL STATEMENTS (continued) for the year ended 31 July 2012
At 31 July 2012 the carrying amounts of cash and cash equivalents, trade and other receivables, including
balances due by the teams and trade and other payables, balances due to teams, and provisions approximate their
fair values due to the short-term maturities of these assets and liabilities. The maturity analysis of the non-current
financial liabilities, which comprises of the instalment sale liabilities and long-term liabilities has been included in
note 13. The net fair value of the league’s financial assets and liabilities are stated below:

ANNUAL REPORT 2012 75ANNUAL REPORT 201274
NATIONAL SOCCER LEAGUE
DETAILED STATEMENT OF COMPREHENSIVE INCOME (continued) for the year ended 31 July 2012
Other income
Share of revenue from competition gate takings
MTN8 7 182 932 5 896 797
Telkom Knockout 4 926 832 7 996 252
Nedbank Cup 3 567 365 3 853 433
15 677 129 17 746 482
Income from members
Appeal fee (6 700) 39 781
Arbitration fee - DRC 79 562 75 434
DC Costs Recovered 306 120 180 139
Fines 328 074 540 158
707 056 835 512
Other income
Commissions - Super Six 1 062 308 1 930 010
Other income 1 128 486 359 313
2 190 794 2 289 323
Total other income 18 574 979 20 871 317
31/07/2012 31/07/2011
R R
NATIONAL SOCCER LEAGUE
DETAILED STATEMENT OF COMPREHENSIVE INCOME for the year ended 31 July 2012
31/07/2012 31/07/2011
R R
Revenue
Broadcasting rights
SuperSport International 285 000 000 285 000 000
ABSA 91 893 175 88 358 817
Sponsorships - Cup Competitions
Telkom Charity - 30 750 000
MTN8 29 322 280 28 194 500
Telkom Knockout 38 356 831 36 881 568
Nebank Cup 57 441 620 54 968 058
125 120 731 150 794 126
Total sponsorship revenue 217 013 906 239 152 943
Supplier cash contributions
Coca-Cola 8 591 516 8 261 073
SABreweries 13 431 842 12 792 231
Vodacom 15 669 571 15 052 422
37 692 929 36 105 726
Total revenue 539 706 835 560 258 669
ANNUAL REPORT 2012 77ANNUAL REPORT 201276
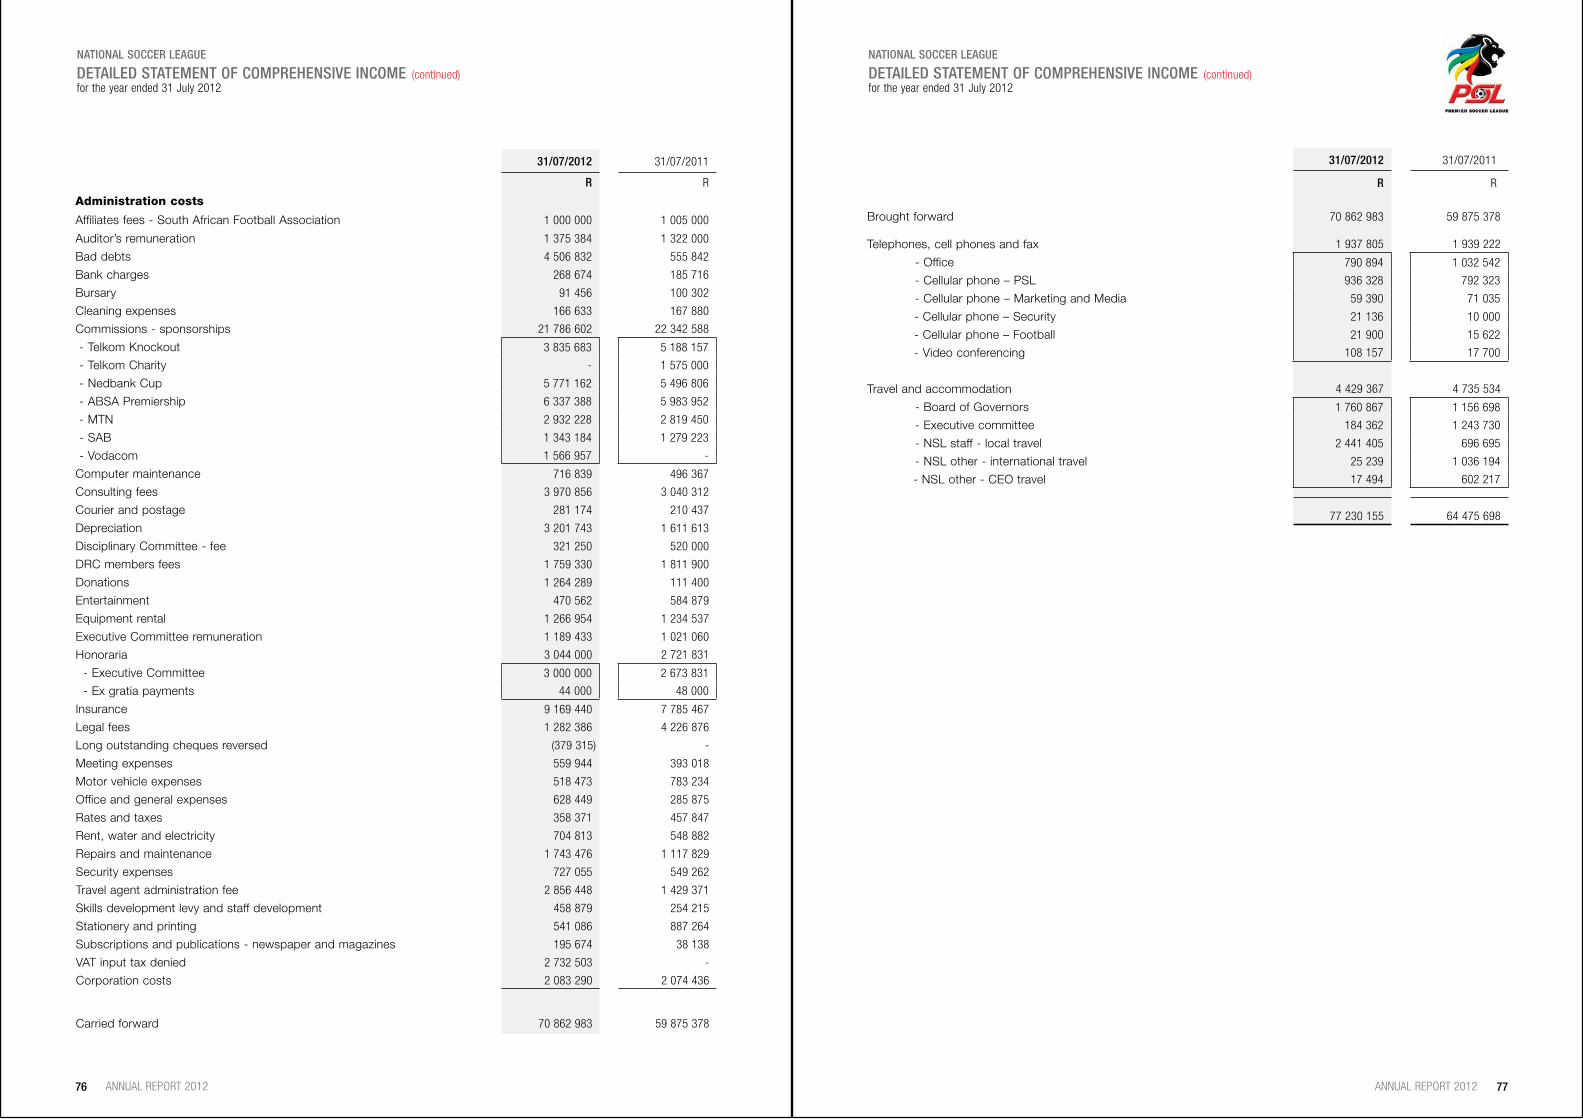
NATIONAL SOCCER LEAGUE
DETAILED STATEMENT OF COMPREHENSIVE INCOME (continued)for the year ended 31 July 2012
31/07/2012 31/07/2011
R R
Broughtforward 70 862 983 59 875 378
Telephones, cell phones and fax 1 937 805 1 939 222
- Office 790 894 1 032 542
- Cellular phone – PSL 936 328 792 323
- Cellular phone – Marketing and Media 59 390 71 035
- Cellular phone – Security 21 136 10 000
- Cellular phone – Football 21 900 15 622
- Video conferencing 108 157 17 700
Travel and accommodation 4 429 367 4 735 534
-BoardofGovernors 1 760 867 1 156 698
- Executive committee 184 362 1 243 730
- NSL staff - local travel 2 441 405 696 695
- NSL other - international travel 25 239 1 036 194
- NSL other - CEO travel 17 494 602 217
77 230 155 64 475 698
NATIONAL SOCCER LEAGUE
DETAILED STATEMENT OF COMPREHENSIVE INCOME (continued)for the year ended 31 July 2012
31/07/2012 31/07/2011
R R
Administration costs
Affiliates fees - South African Football Association 1 000 000 1 005 000
Auditor’s remuneration 1 375 384 1 322 000
Baddebts 4 506 832 555 842
Bankcharges 268 674 185 716
Bursary 91 456 100 302
Cleaning expenses 166 633 167 880
Commissions - sponsorships 21 786 602 22 342 588
- Telkom Knockout 3 835 683 5 188 157
- Telkom Charity - 1 575 000
- Nedbank Cup 5 771 162 5 496 806
-ABSAPremiership 6 337 388 5 983 952
- MTN 2 932 228 2 819 450
-SAB 1 343 184 1 279 223
- Vodacom 1 566 957 -
Computer maintenance 716 839 496 367
Consulting fees 3 970 856 3 040 312
Courier and postage 281 174 210 437
Depreciation 3 201 743 1 611 613
Disciplinary Committee - fee 321 250 520 000
DRC members fees 1 759 330 1 811 900
Donations 1 264 289 111 400
Entertainment 470 562 584 879
Equipment rental 1 266 954 1 234 537
Executive Committee remuneration 1 189 433 1 021 060
Honoraria 3 044 000 2 721 831
- Executive Committee 3 000 000 2 673 831
- Ex gratia payments 44 000 48 000
Insurance 9 169 440 7 785 467
Legal fees 1 282 386 4 226 876
Long outstanding cheques reversed (379 315) -
Meeting expenses 559 944 393 018
Motor vehicle expenses 518 473 783 234
Office and general expenses 628 449 285 875
Rates and taxes 358 371 457 847
Rent, water and electricity 704 813 548 882
Repairs and maintenance 1 743 476 1 117 829
Security expenses 727 055 549 262
Travel agent administration fee 2 856 448 1 429 371
Skills development levy and staff development 458 879 254 215
Stationery and printing 541 086 887 264
Subscriptions and publications - newspaper and magazines 195 674 38 138
VAT input tax denied 2 732 503 -
Corporation costs 2 083 290 2 074 436
Carried forward 70 862 983 59 875 378

ANNUAL REPORT 2012 79ANNUAL REPORT 201278
NATIONAL SOCCER LEAGUE
DETAILED STATEMENT OF COMPREHENSIVE INCOME (continued)for the year ended 31 July 2012
Development expenditure
SAFA - Development 7 000 000 7 000 000
Security development - Workshop - 61 950
Referees’ development - Workshop 121 820 87 422
Grants - SAFPU 1 000 000 1 000 000
Club Summit 953 002 -
9 074 822 8 149 372
Staff costs
Salary and related costs 24 564 846 22 140 726
Marketing and media
Advertising and promotion - 632 949
Corporate clothing and promotional handouts 322 039 574 650
Communications and media 880 232 928 199
Marketing management 16 999 916 15 040 080
Photographer - 264 800
PSL Dinner - 1 182 766
PSL Dinner – Graphics and Awards - 500 000
Soccer X 121 452 3 188
Statistics 120 000 316 500
Stats and media track 702 941 616 945
Travel and accommodation 1 065 825 995 083
Website 111 600 -
20 324 005 21 055 160
31/07/2012 31/07/2011
R R
Broughtforward 132 768 131 135 867 131
Travel and accommodation 38 522 534 27 915 974
- Commissioners’ expenses 1 883 108 2 386 074
- Referees 7 498 277 6 884 778
- Security 2 055 754 2 588 092
- Match co-ordinators - 1 089 803
- PSL officials 675 236 381 357
- Teams 26 410 159 14 585 870
171 290 665 163 783 105
Grants
Grants to premier league teams - Monthly 197 760 000 197 760 000
-Bonus 32 000 000 56 000 000
Grants to 1st division teams - Monthly 38 400 000 38 400 000
-Bonus 4 800 000 9 600 000
272 960 000 301 760 000
NATIONAL SOCCER LEAGUE
DETAILED STATEMENT OF COMPREHENSIVE INCOME (continued)for the year ended 31 July 2012
31/07/2012 31/07/2011
R R
Competition expenditure
Commissioners’ fees 2 015 813 1 412 900
Referees - basic fees 2 338 656 1 993 850
Referees - match fees 6 733 153 4 505 320
Security expenses - allowances 151 250 476 600
Security fees - referees 557 487 489 500
Kit expenses 914 041 1 058 894
Other competition costs (2 169 157) 2 700 003
Tournament activation costs 1 977 227 2 413 613
- MTN8 Cup 301 223 712 150
- Telkom Knockout Cup 1 306 397 652 216
-ABSAPremiership 159 200 86 673
- National First Division 1 448 66 302
- Telkom Charity - 534 935
- Nedbank Cup 208 959 361 337
Participation SAFA teams - Nedbank Cup 1 000 000 1 000 000
CAF Participation 2 000 000 2 000 000
Opening and closing billboards 4 400 000 5 500 000
Boardplacements 8 126 999 7 232 129
Reimbursement - Sponsor tickets 6 315 789 3 640 000
Referee and player awards 2 139 129 533 368
Gate takings expenses 18 667 744 21 760 954
-ABSAPremiership 202 528 678 423
- Telkom Charity - 1 630 421
- MTN8 5 283 887 5 740 847
- Nedbank Cup 5 490 887 5 983 257
- NFD - Playoffs 28 587 12 079
- Telkom Knockout Cup 7 661 855 7 715 927
Prize Money 77 600 000 79 150 000
-ABSAPremiership 29 500 000 29 500 000
- National First Division 1 000 000 1 000 000
- Telkom Charity - 1 550 000
- MTN8 8 000 000 8 000 000
- Nedbank Cup 15 300 000 15 300 000
- Telkom Knockout 10 200 000 10 200 000
- Team participation fee - MTN8 5 600 000 5 600 000
- Team participation fee - Telkom Knockout Cup 4 000 000 4 000 000
- Team participation fee - Nedbank Cup 4 000 000 4 000 000
Carried forward 132 768 131 135 867 131

ANNUAL REPORT 201280
NOTES