national park service bus electrification study: 2020 report
TRANSCRIPT
NREL is a national laboratory of the U.S. Department of Energy Office of Energy Efficiency & Renewable Energy Operated by the Alliance for Sustainable Energy, LLC This report is available at no cost from the National Renewable Energy Laboratory (NREL) at www.nrel.gov/publications.
Contract No. DE-AC36-08GO28308
Technical Report NREL/TP-5400-78012 February 2021
National Park Service Bus Electrification Study: 2020 Report
Madeline Gilleran, Andrew Kotz, Leslie Eudy, and Kay Kelly
National Renewable Energy Laboratory

NREL is a national laboratory of the U.S. Department of Energy Office of Energy Efficiency & Renewable Energy Operated by the Alliance for Sustainable Energy, LLC This report is available at no cost from the National Renewable Energy Laboratory (NREL) at www.nrel.gov/publications.
Contract No. DE-AC36-08GO28308
National Renewable Energy Laboratory 15013 Denver West Parkway Golden, CO 80401 303-275-3000 • www.nrel.gov
Technical Report NREL/TP-5400-78012 February 2021
National Park Service Bus Electrification Study: 2020 Report
Madeline Gilleran, Andrew Kotz, Leslie Eudy, and Kay Kelly
National Renewable Energy Laboratory
Suggested Citation Gilleran, Madeline, Andrew Kotz, Leslie Eudy, and Kay Kelly. 2021. National Park Service Bus Electrification Study: 2020 Report. Golden, CO: National Renewable Energy Laboratory. NREL/TP-5400-78012. https://www.nrel.gov/docs/fy21osti/78012.pdf.

NOTICE
This work was authored by the National Renewable Energy Laboratory, operated by Alliance for Sustainable Energy, LLC, for the U.S. Department of Energy (DOE) under Contract No. DE-AC36-08GO28308. Funding provided by the U.S Department of the Interior, National Park Service. The views expressed herein do not necessarily represent the views of the DOE or the U.S. Government.
This report is available at no cost from the National Renewable Energy Laboratory (NREL) at www.nrel.gov/publications.
U.S. Department of Energy (DOE) reports produced after 1991 and a growing number of pre-1991 documents are available free via www.OSTI.gov.
Cover Photos by Dennis Schroeder: (clockwise, left to right) NREL 51934, NREL 45897, NREL 42160, NREL 45891, NREL 48097, NREL 46526.
NREL prints on paper that contains recycled content.
iii This report is available at no cost from the National Renewable Energy Laboratory at www.nrel.gov/publications.
List of Acronyms BEB battery electric bus CDB conventional diesel bus CEV commercial electric vehicle DOE U.S. Department of Energy HEB hybrid electric bus HVAC heating, ventilation, and air conditioning MPGe miles per gallon equivalent (gallon of propane) MY model year NPS National Park Service NREL National Renewable Energy Laboratory OEM original equipment manufacturer PSI Power Solutions International RMP Rocky Mountain Power USDOT U.S. Department of Transportation WAVE Wireless Advanced Vehicle Electrification

iv This report is available at no cost from the National Renewable Energy Laboratory at www.nrel.gov/publications.
Executive Summary The mission of the U.S. Department of the Interior’s National Park Service (NPS) is to preserve unimpaired the natural and cultural resources and values of the national park system for the enjoyment, education, and inspiration of this and future generations. To fulfill this mission, many national parks that use buses for visitor transportation services have expressed interest in using alternative fuels and adopting advanced technology vehicles, especially as there are now zero-tailpipe-emission battery electric bus (BEB) purchase options on the federal supply schedule. Zion National Park (Zion), Bryce Canyon National Park (Bryce), and Yosemite National Park (Yosemite) have elected to be early adopters of BEBs. The National Renewable Energy Laboratory (NREL) was tasked with collecting in-use data on demonstration BEBs at all three parks and conducting real-world performance evaluations of BEBs compared to conventional internal combustion engine buses and hybrid electric buses (HEBs) operating in the National Park Service fleet.
This report summarizes important considerations for implementing BEBs in the three national park fleets, detailing information about current buses at each fleet, electric bus demonstration vehicles, and performance evaluations of BEBs in Zion, Bryce, and Yosemite. Results include in-use data collection metrics such as average bus speed, energy usage per trip, and daily distance traveled. Also covered are effects of high heating, ventilation, and air-conditioning (HVAC) system use to both heat and cool the buses, emissions estimations before and after use of electric buses, operating costs, electric vehicle infrastructure, maintenance, and bus driver user experience survey information. Analysis results from this project will help the National Park Service (NPS) understand how BEBs and future expansion of BEBs could assist in meeting their bottom line and operational goals and assist NPS in choosing appropriate locations for future BEB deployments. Note that each analysis was tailored to the needs of each national park, and the methodology for data collection and analysis has evolved over time.
Zion Executive Summary Results presented in this report are a follow-on to the interim report for Zion; this most recent report includes information on data collection efforts for New Flyer BEBs. The testing period for the New Flyer Xcelsior Charge 60-ft bus, which is closer in size and passenger capacity to the existing propane buses operating in the canyon, occurred from September 1–7, 2018, on the Canyon route. NREL outfitted propane buses and the demonstration bus with data acquisition systems. The testing period for the 35-ft New Flyer Xcelsior Charge took place from August 8–20, 2019, on the in-town shuttle, which provides service from stops within the town of Springdale connecting to the park entrance. Data acquisition devices were placed on six of the 30-ft propane buses and the one 35-ft New Flyer electric bus.
On average, the 60-ft BEB on the Canyon route used 2.28 ± 0.15 kWh/mi of energy, whereas the 35-ft BEB on the Town route used only 1.66 ± 0.09 kWh/mi. This is expected because the 35-ft shuttle is smaller and lighter than the 60-ft shuttle. As of the publication of this report, New Flyer offers the 60-ft BEB with a 466-kWh usable battery and the 35-ft BEB with a 311-kWh and 388-kWh usable battery with the plug-in option. Based on this analysis, all current battery sizes can accommodate 29 trips of the Town route. However, the canyon shuttle, which can do up to 12 trips per day, may require a larger battery, especially when considering battery degradation over time.

v This report is available at no cost from the National Renewable Energy Laboratory at www.nrel.gov/publications.
NREL developed a charging strategy analysis for Zion’s fleet assuming it was fully electrified and that each bus had its own 60-kW charger. Two scenarios were analyzed: one in which no charge management was used and the buses charged as soon as they pulled in, and one in which charge management was implemented and the buses could charge any time before they had to pull out to begin their shift the next day, provided they return to 100% state of charge before departure. The no-charge management scenario results in a peak demand on the grid of 1.1 MW at roughly 9 p.m., and the charge management scenario results in a demand on the grid of 540 kW at various points throughout the night.
Bryce Executive Summary NREL performed two in-use data collection activities for Bryce Canyon: one in September 2018 that monitored a Proterra Catalyst E2, and one in September 2019 to test existing conventional diesel buses. A total of 15,923 miles of data were captured and over 4 million seconds of data were analyzed during these tests. In analyzing results from the data collection activities, it was found that there would be a 25% reduction in trip energy usage for the Bryce Point route and a 21% reduction in trip energy usage for the Rainbow Point route if electric vehicles were used rather the conventional diesel vehicles. A BEB with a 360-kWh battery size may reduce Bryce Point trips by one trip per day, but all operation should be possible with a 660-kWh battery.
Yosemite Executive Summary NREL installed data loggers on 15 buses at Yosemite that operated from July 1, 2019, to August 5, 2019. The loggers captured 35,477 total miles of in-use data from 362 vehicle days and 3,793 total hours of operation. The average daily engine-on time was 10.6 hours per day and maximum daily run time was 16.4 hours. Idle time, in which the engine is on but speed is zero, was about 30% of the total daily run time, which will benefit electrification, as electric vehicles require much less energy when idling and produce zero emissions.
Average daily brake energy is 265 kWh and daily energy usage when the vehicle is idle is 24 kWh. Maximum daily energy usage is around 470 kWh. Because of this, lower battery sizes were excluded from this study because they would not be feasible for this route without intermediate charging. Because daily energy usage was relatively high for Yosemite, additional analysis was completed looking at bus dwell times to determine if overnight charging was feasible or if a combination of overnight and on-route charging was necessary; it was determined that on-route charging was currently not needed. A hot-spot dwell time analysis was also completed to determine where chargers should be placed if on-route fast charging was ever necessary. Several locations on the Yosemite Valley route could accommodate fast chargers, including Yosemite Valley Lodge and Curry Village. For the Mariposa route, the Mariposa Grove nature area could possibly accommodate an on-route fast charger.
NREL also completed an analysis to determine the total number of chargers needed for full fleet electrification, assuming a fleet size of 4 at Mariposa and 22 at Yosemite Valley, not including the two Proterra buses already acquired and two GILLIG buses soon to be retired. NREL completed two case studies to determine the number of chargers needed and location of those charging stations. The first, a conservative case, assumed one 60-kW charger per electric bus. A second, more optimized, case determined the minimum number of 60-kW chargers necessary: 4 at Mariposa and 14 at Yosemite Valley. Finally, because Yosemite is in Pacific Gas & Electric’s

vi This report is available at no cost from the National Renewable Energy Laboratory at www.nrel.gov/publications.
service territory, information regarding their special electric vehicle rates for commercial customers—which do not include demand charges—was also included in this report.

vii This report is available at no cost from the National Renewable Energy Laboratory at www.nrel.gov/publications.
Table of Contents Executive Summary ................................................................................................................................... iv 1 Introduction and Background ............................................................................................................. 1
1.1 Project Objectives ......................................................................................................................... 1 1.2 Shuttle Services Looking to Electrify ........................................................................................... 2
1.2.1 Zion .................................................................................................................................. 2 1.2.2 Bryce ................................................................................................................................ 2 1.2.3 Yosemite .......................................................................................................................... 3
1.3 Literature Review: Previous Reports about Park Electrification................................................... 5 1.3.1 2016 Zion National Park, Utah Fuel Analysis, and Vehicle Fleet Replacement Study ... 5 1.3.2 2016 Rocky Mountain Power Study ................................................................................ 5 1.3.3 2016 Zion Canyon Shuttle Bus Fleet Evaluation (Initial NREL Study) .......................... 6 1.3.4 2017 Zion Canyon Shuttle Bus Fleet Interim Report ....................................................... 6 1.3.5 2020 National Parks Service Shuttle Electrification Final Report ................................... 6
2 Current Bus Specifications ................................................................................................................. 7 2.1 Zion Bus Specifications ................................................................................................................ 7 2.2 Bryce Bus Specifications .............................................................................................................. 8 2.3 Yosemite Bus Specifications ......................................................................................................... 9
3 Electric Bus Demo Specifications .................................................................................................... 10 3.1 Proterra Catalyst E2 – Demo Bus ................................................................................................ 10 3.2 New Flyer Xcelsior Charge 60’ – Demo Bus .............................................................................. 11 3.3 New Flyer Xcelsior Charge 35’ – Demo Bus .............................................................................. 12
4 Data Collection Efforts ....................................................................................................................... 13 4.1 Methodology ............................................................................................................................... 13 4.2 Zion Data Collection Details ....................................................................................................... 13 4.3 Bryce Data Collection Details ..................................................................................................... 14 4.4 Yosemite Data Collection Details ............................................................................................... 14
5 Results and Discussion ..................................................................................................................... 15 5.1 In-Use Data Collection ................................................................................................................ 15
5.1.1 Zion Data Collection Results ......................................................................................... 15 5.1.2 Bryce Data Collection Results ....................................................................................... 24 5.1.3 Yosemite Data Collection Results .................................................................................. 27
5.2 Accessory Use: Climate Effects .................................................................................................. 38 5.2.1 Accessory Use Summary ............................................................................................... 38 5.2.2 Site Details ..................................................................................................................... 39
5.3 Emissions Estimates .................................................................................................................... 41 5.3.1 Methodology .................................................................................................................. 41 5.3.2 Site Details ..................................................................................................................... 42
5.4 Operating Cost............................................................................................................................. 46 5.5 Electric Bus Considerations ........................................................................................................ 47
5.5.1 Infrastructure for EV Charging ...................................................................................... 47 5.5.2 Current Battery Electric Bus OEMs ............................................................................... 48
5.6 Maintenance ................................................................................................................................ 50 5.7 User Experience Survey .............................................................................................................. 56
6 Conclusions and Next Steps ............................................................................................................. 56 References ................................................................................................................................................. 58 Appendix A. National Park Route Maps ........................................................................................... 60 Appendix B. Data Parameters Logged ............................................................................................. 63 Appendix C. Zion Fleet Charging Analysis ...................................................................................... 64

viii This report is available at no cost from the National Renewable Energy Laboratory at www.nrel.gov/publications.
List of Figures Figure 1. Zion shuttle service map ................................................................................................................ 2 Figure 2. Bryce shuttle service map .............................................................................................................. 3 Figure 3. Bryce detailed routes map ............................................................................................................. 3 Figure 4. Yosemite Valley shuttle service map ............................................................................................ 4 Figure 5. Mariposa Grove shuttle service map ............................................................................................. 5 Figure 6. ElDorado Transmark RE-29 with trailer attachment ..................................................................... 8 Figure 7. Thomas HDX bus .......................................................................................................................... 9 Figure 8. 2005 GILLIG hybrid bus ............................................................................................................. 10 Figure 9. 2017 Proterra Catalyst E2 – demo bus ........................................................................................ 11 Figure 10. 2018 New Flyer Xcelsior Charge 60’ – demo bus .................................................................... 12 Figure 11. 2018 New Flyer Xcelsior Charge 40’ – demo bus .................................................................... 12 Figure 12. DRU900 data logger .................................................................................................................. 13 Figure 13. Bryce data collection period (darker = more energy use) .......................................................... 14 Figure 14. Yosemite data collection period (darker = more energy use) .................................................... 15 Figure 15. Zion drive cycle comparison to Fleet DNA data ....................................................................... 17 Figure 16. Daily results for New Flyer 60’ (Canyon) and 35’ (Town) ....................................................... 19 Figure 17. Trip results for New Flyer 60’ (Canyon) and 35’ (Town) ......................................................... 20 Figure 18. Daily number of trips possible with 100% battery capacity and 80% battery capacity ............ 21 Figure 19. Daily number of trips possible with 1-hour and 1.5-hour midday charging, including battery
degradation ............................................................................................................................. 21 Figure 20. Computing nightly time needed to charge for each block ......................................................... 23 Figure 21. Charging schedule with no charge management has peak demand of 1.1 MW ........................ 23 Figure 22. Charging schedule with charge management has peak demand of 540 kW .............................. 24 Figure 23. Daily average speed and distance for diesel and electric buses ................................................. 25 Figure 24. Daily average speeds and distances traveled ............................................................................. 26 Figure 25. Fuel economy and fuel consumption rate .................................................................................. 26 Figure 26. Trip results comparing Bryce Point route and Rainbow Point route ......................................... 27 Figure 27. Daily engine-on time and percentage of engine-on time when vehicle is idle .......................... 28 Figure 28. Daily brake energy usage and energy usage when idle ............................................................. 28 Figure 29. Daily average fuel economy and daily distance traveled .......................................................... 29 Figure 30. Trip results comparing different routes ..................................................................................... 29 Figure 31. Dwell length analysis to assess most common dwell times....................................................... 30 Figure 32. Simplified electric vehicle model diagram ................................................................................ 30 Figure 33. Detecting when state of charge violations would have occurred............................................... 31 Figure 34. Necessary battery size of vehicle assuming charged whenever stopped for ≥50 minutes ......... 31 Figure 35. Necessary battery size of vehicle assuming charged whenever stopped for ≥10 minutes ......... 32 Figure 36. Hot-spot analysis for all of Yosemite National Park (≥60-minute dwells) ............................... 32 Figure 37. Hot-spot analysis for Yosemite Valley (≥60-minute dwells) .................................................... 33 Figure 38. Hot-spot analysis for Wawona (≥60-minute dwells) ................................................................. 33 Figure 39. Hot-spot analysis for Yosemite Valley (≥5-minute dwells) ...................................................... 34 Figure 40. Hot-spot analysis for Wawona (≥5-minute dwells) ................................................................... 34 Figure 41. Average and maximum daily energy usage by day ................................................................... 35 Figure 42. Average and maximum daily energy, grouped by bus .............................................................. 35 Figure 43. Energy usage of HVAC system is significant ........................................................................... 39 Figure 44. Temperature dependence of vehicle energy consumption – Proterra study at Zion .................. 39 Figure 45. Energy consumption per device – New Flyer study .................................................................. 40 Figure 46. Energy consumption per device ................................................................................................ 41 Figure 47. Estimated vehicle emissions for tailpipe and fuel/electricity production .................................. 43 Figure 48. Comparison of trip average total emissions for 60-ft propane and electric buses ..................... 44

ix This report is available at no cost from the National Renewable Energy Laboratory at www.nrel.gov/publications.
Figure 49. Comparison of emissions between operation in Utah and California ....................................... 45 Figure 50. Tailpipe and production emissions for Bryce ............................................................................ 45 Figure 51. Average per-trip operating cost for both propane bus and BEB................................................ 46 Figure 52. Comparison of operating costs between the 60-ft propane and electric buses .......................... 47 Figure 53. Scheduled and unscheduled maintenance cost for BEBs .......................................................... 52 Figure 54. Labor and Parts costs for BEBs ................................................................................................. 53 Figure 55. Maintenance cost by system ...................................................................................................... 54 Figure 56. Propulsion system maintenance costs for BEBs ........................................................................ 55 Figure 57. Propulsion system costs by subsystem ...................................................................................... 55 Figure 58. Zion shuttle service map ............................................................................................................ 60 Figure 59. Bryce shuttle service map .......................................................................................................... 61 Figure 60. Yosemite Valley shuttle service map ........................................................................................ 62 Figure 61. Zion fleet charging – no charge management ............................................................................ 64 Figure 62. Zion fleet charging – charge management................................................................................. 65
List of Tables Table 1. ElDorado Transmark RE-29 Specifications, Including Trailer Attachment ................................... 7 Table 2. Thomas HDX Bus Specifications ................................................................................................... 8 Table 3. Yosemite Bus Specifications .......................................................................................................... 9 Table 4. Proterra Catalyst E2 – Demo Bus Specifications.......................................................................... 10 Table 5. 2018 New Flyer Xcelsior Charge 60’ – Demo Bus Specifications ............................................... 11 Table 6. New Flyer Xcelsior Charge 35’ – Demo Bus Specifications ........................................................ 12 Table 7. Proterra 40’ Test Summary ........................................................................................................... 15 Table 8. Proterra 40’ Daily Average Vehicle Statistics .............................................................................. 16 Table 9. Proterra 40’ Trip Average Statistics.............................................................................................. 18 Table 10. Daily Energy Usage for Battery Electric Bus ............................................................................. 22 Table 11. Mariposa Necessary Charger Count: Conservative Daily Average Scenario ............................. 36 Table 12. Mariposa Necessary Charger Count: Worst-Case Scenario........................................................ 36 Table 13. Yosemite Valley Charger Count: 22-Bus Scenario .................................................................... 36 Table 14. Yosemite Valley Charger Count: 15-Bus Scenario .................................................................... 37 Table 15. Yosemite Valley Charger Count: Worst-Case Scenario ............................................................. 37 Table 16. Pacific Gas & Electric: Electric Vehicle Rates for Commercial Customers............................... 38 Table 17. Trip Average Electric Bus and Accessory Information – Proterra Study ................................... 40 Table 18. Grid Energy Production Mixture for Utah and California .......................................................... 44 Table 19. Selection of BEBs and Related Specifications ........................................................................... 49 Table 20. Summary of BEB key performance metrics ............................................................................... 51 Table 21. Data Parameters Logged During In-Use Data Collection Activity ............................................. 63

1 This report is available at no cost from the National Renewable Energy Laboratory at www.nrel.gov/publications.
1 Introduction and Background The U.S. Department of the Interior’s National Park Service (NPS) is a leader among federal agencies in aggressively pursuing alternative fuels and advanced technology vehicles for alternative transportation system fleets in parks. The mission of NPS is to “preserve unimpaired the natural and cultural resources and values of the national park system for the enjoyment, education, and inspiration of this and future generations.” To fulfill this mission, many national parks that use buses for visitor transportation services have expressed interest in using alternative fuels and adopting advanced technology vehicles, especially as there are now zero-tailpipe-emission battery electric bus (BEB) purchase options on the federal supply schedule. Zion National Park (Zion), Bryce Canyon National Park (Bryce), and Yosemite National Park (Yosemite) have elected to be early adopters of BEBs. Bryce recently purchased and put in service a used Proterra E2 demonstration bus, Zion has demonstrated multiple BEBs and purchased two Proterra E2s, and Yosemite has two Proterra E2s in service. These cases have been closely studied and monitored to ensure a successful incorporation into the existing fleets and to identify requirements should other parks decide to replicate these actions in the future.
The U.S. Department of Energy’s (DOE’s) National Renewable Energy Laboratory (NREL) supports both the federal and the private sectors in deploying alternative fuel and advanced technology vehicles to lower energy use. NREL has developed a suite of tools and resources that assist fleets in quantifying the efficiency benefits of new vehicle fuels and technologies, along with assessing their required refueling infrastructure and analyzing alternative fuel markets [1]. NREL is now a sought-after resource for its transportation technology expertise and has successfully worked with federal agencies, including NPS, to implement transportation projects.
NREL was invited to provide objective, data-driven information to NPS during their in-use evaluation of BEBs. NREL’s experience in evaluating, measuring, and verifying fleet deployments of advanced medium- and heavy-duty vehicle technologies has illustrated the relationship between vocational duty cycle, fuel economy, and emissions, as well as the potential impacts on life-cycle costs, barriers to implementation, and commercial viability. Estimates for cost, reliability, functionality, and overall performance of a given technology vary significantly based on actual vehicle usage. Knowledge of real-world vocational drive cycles and vehicle operation will be critical as these national parks select the right technology for a shuttle bus fleet to maximize potential energy efficiency, emissions, and economic and performance benefits. This is the second report for this project that details the research and analysis efforts from 2017 through 2020 [2].
1.1 Project Objectives The objective of this effort is to provide NPS with technical assistance to evaluate BEB performance within three of its national parks. Using a suite of data acquisition, analysis, and visualization tools, NREL has conducted real-world performance evaluations of BEBs compared to conventional internal combustion engine buses and hybrid electric buses (HEBs) operating at three different parks in the national park fleet. This report summarizes the performance evaluation of BEBs in Zion, Bryce Canyon, and Yosemite National Parks. Analysis results from this project will help NPS understand how BEBs and future expansion of BEBs could assist in
2 This report is available at no cost from the National Renewable Energy Laboratory at www.nrel.gov/publications.
meeting their bottom line and operational goals, as well as help NPS choose appropriate locations for future BEB deployments.
1.2 Shuttle Services Looking to Electrify
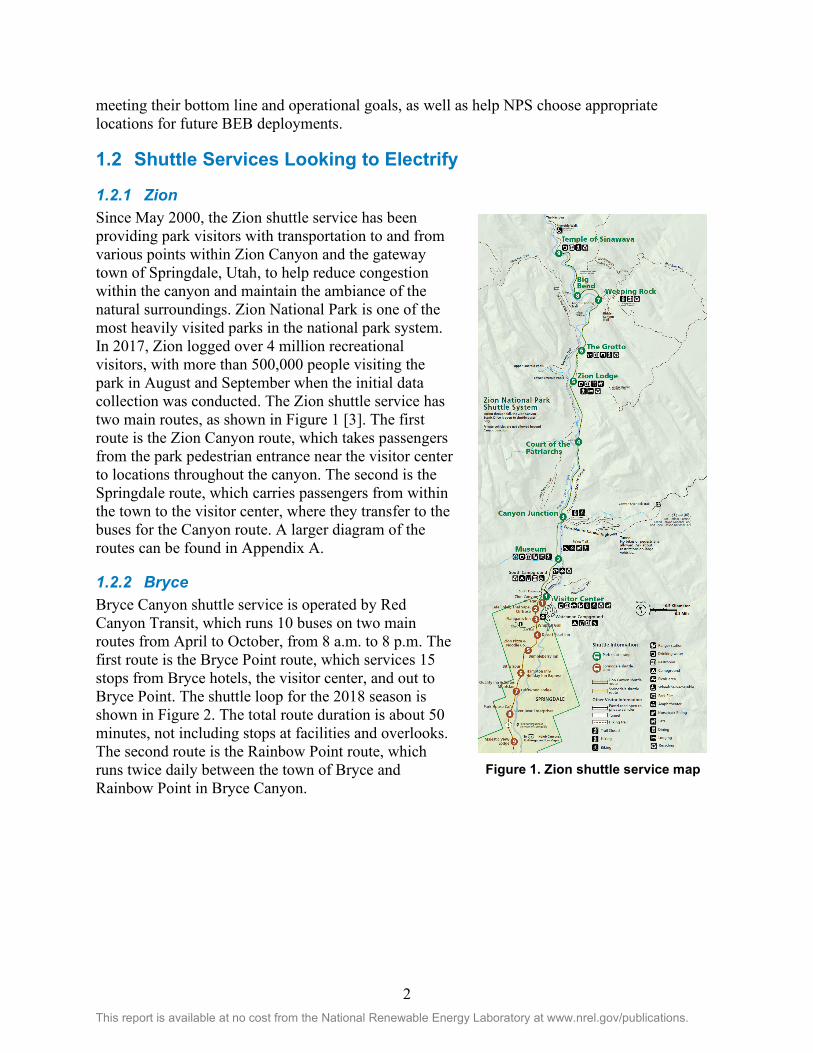
1.2.1 Zion Since May 2000, the Zion shuttle service has been providing park visitors with transportation to and from various points within Zion Canyon and the gateway town of Springdale, Utah, to help reduce congestion within the canyon and maintain the ambiance of the natural surroundings. Zion National Park is one of the most heavily visited parks in the national park system. In 2017, Zion logged over 4 million recreational visitors, with more than 500,000 people visiting the park in August and September when the initial data collection was conducted. The Zion shuttle service has two main routes, as shown in Figure 1 [3]. The first route is the Zion Canyon route, which takes passengers from the park pedestrian entrance near the visitor center to locations throughout the canyon. The second is the Springdale route, which carries passengers from within the town to the visitor center, where they transfer to the buses for the Canyon route. A larger diagram of the routes can be found in Appendix A.
1.2.2 Bryce Bryce Canyon shuttle service is operated by Red Canyon Transit, which runs 10 buses on two main routes from April to October, from 8 a.m. to 8 p.m. The first route is the Bryce Point route, which services 15 stops from Bryce hotels, the visitor center, and out to Bryce Point. The shuttle loop for the 2018 season is shown in Figure 2. The total route duration is about 50 minutes, not including stops at facilities and overlooks. The second route is the Rainbow Point route, which runs twice daily between the town of Bryce and Rainbow Point in Bryce Canyon.
Figure 1. Zion shuttle service map

3 This report is available at no cost from the National Renewable Energy Laboratory at www.nrel.gov/publications.
Figure 2. Bryce shuttle service map
Figure 3 displays detailed versions of the Bryce routes. The Bryce Point route makes up to thirteen trips per day and the Rainbow Point route makes two trips per day. Other routes made by the buses to help pick up passengers during surges or at the end of the day are shown in the middle map, for which trip count varies.
Figure 3. Bryce detailed routes map
1.2.3 Yosemite Unlike the other two parks in this study, Yosemite National Park offers its Valley shuttle service year-round and has six other seasonal and tour shuttle services. This report focuses on the shuttles servicing Yosemite Valley and Mariposa Grove, which consists of four unique routes using 40-ft HEBs. The routes that leave from the Yosemite Valley Visitor Center include the Yosemite Valley shuttle and El Capitan shuttle. The Yosemite Valley shuttle operates year-round from 7 a.m. to 10 p.m. and travels approximately nine miles roundtrip. The El Capitan shuttle
Rainbow Point
Other Bryce Point

4 This report is available at no cost from the National Renewable Energy Laboratory at www.nrel.gov/publications.
operates from mid-June to early October from 9 a.m. to 5 p.m. and travels approximately seven miles roundtrip. Routes are shown in Figure 4.
Figure 4. Yosemite Valley shuttle service map
Routes leaving from the Mariposa Grove Welcome Plaza include the Mariposa Grove shuttle, which travels from the South Entrance of the Mariposa Grove Welcome Plaza to the Mariposa Grove, and the limited shuttle service from the Welcome Plaza to the Wawona Hotel. The Mariposa Grove shuttle operates from March 15 through November 30 and travels approximately four miles roundtrip. Typical hours of operation for the Mariposa Grove shuttle are:
• March 15 through May 14: 8 a.m. to 5 p.m. • May 15 through October 14: 8 a.m. to 8 p.m. • October 15 through November 30: 8 a.m. to 5 p.m.
The shuttle from Mariposa Grove to Wawona Hotel operates from June 15 to November 7 from 9 a.m. to 5 p.m. and travels approximately ten miles roundtrip, with pickups and drop-offs occurring about every two hours. Mariposa Grove routes can be seen in Figure 5.

5 This report is available at no cost from the National Renewable Energy Laboratory at www.nrel.gov/publications.
Figure 5. Mariposa Grove shuttle service map
1.3 Literature Review: Previous Reports about Park Electrification All three parks are advancing toward all-electric fleets, but the original fleet of 39 iconic propane power units and 23 trailers at Zion National Park have been the prime focus of electrification studies, as they are scheduled for phased replacement after 20 years of service due to high mileage, declining engine condition, and increasing maintenance requirements. Several studies have been performed in recent years to identify the appropriate replacements, including evaluation of different propulsion technologies, the feasibility of retrofitting the existing buses as BEBs, and identifying infrastructure requirements for electric charging.
1.3.1 2016 Zion National Park, Utah Fuel Analysis, and Vehicle Fleet Replacement Study
This study, funded by the Alternative Transportation Program, was performed by NPS in collaboration with the U.S. Department of Transportation’s (USDOT’s) Volpe Center to analyze fleet replacement options, including a variety of fuel technologies, and identify the most efficient and effective replacement or rehabilitation schedule for the buses. Given that the propane fleet was still in a suitable condition and a comparable propane replacement bus was not available at the time of the study, the authors recommended repowering a portion of the propane buses to extend service life and retrofitting the remaining buses for battery electric propulsion. In 2017, an addendum to the technical study was added recommending replacing the fleet with battery electric buses since retrofitting the propane buses was found infeasible after a review of proposals.
1.3.2 2016 Rocky Mountain Power Study This study was performed at the request of Zion National Park by Rocky Mountain Power (RMP) to identify the infrastructure requirements to provide distribution-level electrical service for a 490-kW fast-charging system [4]. The three charging installation options examined in this study included: two fast-charging stations at the Zion Canyon Visitor Center; two fast-charging stations at different locations—one at the Zion Human History Museum and one at the Zion Canyon Visitor Center; and 14 slow-charging stations at the Zion bus maintenance facility. The scope of the RMP study encompassed an evaluation of RMP’s electrical system and identification of required additions/modifications, along with an assessment of the reliability

6 This report is available at no cost from the National Renewable Energy Laboratory at www.nrel.gov/publications.
impact on the grid to ensure grid compliance. The resulting report provides a cost analysis, assessment of feasibility of support, description of required facilities, and information on alternatives to serve the required loads. The RMP report includes electricity cost information for both off-peak and on-peak charging that are used in the current NREL evaluation assuming an off-peak rate of $0.076/kWh and an on-peak rate of $0.169/kWh from 2016.
1.3.3 2016 Zion Canyon Shuttle Bus Fleet Evaluation (Initial NREL Study) In partnership with the DOE Clean Cities program, NREL’s Fleet Test and Evaluation Team evaluated the in-use performance of the Zion National Park propane power shuttle buses [5]. NREL researchers deployed onboard data loggers to nine vehicles operating on the 16-mile Zion Canyon loop. Data collected from the buses were used to characterize the operational duty cycle and drive cycle statistics to determine the optimal power and energy storage requirements that would allow for a successful conversion to battery electric propulsion. These technical specifications were subsequently provided to prospective retrofitters, as NPS solicited bids for the conversion of the propane buses.
NPS released a solicitation in fiscal year 2016 to retrofit up to 14 of Zion’s buses from propane to battery electric. NREL staff provided technical expertise to NPS during the proposal review process; however, a successful bidder was not identified, and the solicitation was cancelled in the best interest of the government. At this point, NPS began researching new battery electric buses sold directly by an original equipment manufacturer (OEM).
1.3.4 2017 Zion Canyon Shuttle Bus Fleet Interim Report For the 2017 Zion Canyon Shuttle Bus Fleet Interim Report [2], written by NREL, Zion National Park had the opportunity to demonstrate a Proterra BEB for several weeks beginning in August 2017 and concluding in October 2017. NREL collected in-use data on the demonstration bus during this time. The interim report summarized the initial performance evaluation of the demonstration BEB in Zion National Park, with the notable benefits during this 5-week study being the improved efficiency, reduced emissions, and lower operating cost of the BEB, while the existing propane buses demonstrated superior maneuverability, driving range, and passenger capacity.
1.3.5 2020 National Parks Service Bus Electrification Report Results presented in this report are a follow-on that incorporates both old and new work done at Zion National Park. Since the interim report was published, data collection was completed on New Flyer BEBs in Zion and data analyzed from Bryce and Yosemite. In addition, other studies were completed to further understand how temperature affects efficiency throughout the year, infrastructure requirements, lifetime costs, emissions, and yearly energy consumption. Finally, modeling of modern conventional and HEBs was performed to understand how other new technologies compare to the new BEB. This most recent report includes additional data collection, analysis, and an expanded survey of the operator, maintenance staff, and management feedback.

7 This report is available at no cost from the National Renewable Energy Laboratory at www.nrel.gov/publications.
2 Current Bus Specifications 2.1 Zion Bus Specifications The current Zion shuttle fleet contains 39 model year (MY) 2000 & 2009 ElDorado Transmark RE-29 30-ft propane-powered tractors and 23 non-powered 30-ft trailers purchased in 1999. The current Zion propane buses use a Cummins B 5.9-L propane-powered engine certified to 2.3 grams of nitrogen oxides per brake horsepower-hour (gNOx/bhp-hr) [6]. The MY 2000 ElDorado Transmark RE-29 bus operating on propane has 195 hp at 2,600 rpm and 420 lb-ft at 1,600 rpm. In its current configuration, this engine is turbocharged and has an ignition system that consists of individual coils or a coil pack with standard automotive spark plug wires. A mixer type fuel system utilizes a mass air flow unit to help with fuel control and O2 feedback. While this was effective for MY 2000, technology has changed considerably, and the industry does not have any turbocharged models currently available.
Current technology for propane engines uses spark ignition, non-turbocharged with advanced exhaust gas recirculation to control NOx emissions. Modern propane engines for this application will all be stoichiometric combustion, with spark controlled by advanced computers utilizing current coil over spark plug technology. The Cummins 5.9-L engine was discontinued in 2007 to give way to the new ISB 6.7 L. The current propane engines in this marketplace that would fit this torque and horsepower range are the Roush 6.8-L propane engine and the Power Solutions International (PSI) 8.8-L engine. The Roush engine is rated at 362 hp at 3,900 rpm and 457 lb-ft at 3,100 rpm in school bus applications. The propane is injected in these engines through a liquid fuel injection system with a NOx certification of 0.05 gNOx/bhp-hr [7]. PSI is another producer of propane engines for this application that meet the current 0.2 gNOx/bhp-hr. This is a liquid fuel injection 8.8-L engine that is rated at 270 hp at 2,600 rpm and 565 lb-ft at 1,500 rpm. This engine is designed for high torque at low rpm with the ability to be a drop-in for a conventional school bus application. The Springdale route solely uses the propane-powered tractors, while the Zion Canyon route uses tractors pulling unpowered trailers. A list of summary specifications can be found in Table 1 and a picture of the Transmark RE-29 shown in Figure 6.
Table 1. ElDorado Transmark RE-29 Specifications, Including Trailer Attachment
Specification Description
Vehicle make and model ElDorado Transmark RE-29
Vehicle model year 2000
Gross combined weight rating 53,000 lbs
Gross combined curb weight 37,220 lbs
Gross combined passenger capacity 105
Engine make and model Cummins ISB LPG 5.9 L
Engine rating 195 hp, 460 lb-ft at 1,600 rpm

8 This report is available at no cost from the National Renewable Energy Laboratory at www.nrel.gov/publications.
Figure 6. ElDorado Transmark RE-29 with trailer attachment
2.2 Bryce Bus Specifications Bryce Canyon National Park operates a smaller 10-bus fleet with newer buses compared to Zion. The current fleet at Bryce consists of mostly MY 2016 Thomas HDX diesel buses with a 300-hp Cummins ISL engine. A list of summary specifications can be found in Table 2 and a picture of the buses is shown in Figure 7.
Table 2. Thomas HDX Bus Specifications
Specification Description
Vehicle make and model Thomas HDX Activity Bus
Vehicle model year 2016
Gross combined weight rating 36,200 lbs
Gross combined passenger capacity 54
Bus size 40 ft
Engine make and model Cummins ISL
Engine rating 300 hp

9 This report is available at no cost from the National Renewable Energy Laboratory at www.nrel.gov/publications.
Figure 7. Thomas HDX bus
2.3 Yosemite Bus Specifications Yosemite currently has a fleet of low-floor, 40-foot, 40-passenger transit vehicles, mostly comprising GILLIG HEBs. Sixteen GILLIG buses were purchased in 2005 and four in 2011, and total mileage per bus ranges from 54,000 to over 250,000 miles.
Table 3. Yosemite Bus Specifications
Specification Description
Vehicle make and model GILLIG Hybrid New Flyer Xcelsior XDE40
Vehicle model year 2005, 2011 2017
Gross vehicle weight rating 40,600 lbs 44,533 lbs
Curb weight 29,220 lbs 29,317 lbs
Combined passenger capacity 74 74
Bus size 40 ft 40 ft
Engine make and model Cummins ISB Cummins ISB
Engine rating 260 hp 280 hp

10 This report is available at no cost from the National Renewable Energy Laboratory at www.nrel.gov/publications.
Figure 8. 2005 GILLIG hybrid bus
3 Electric Bus Demo Specifications 3.1 Proterra Catalyst E2 – Demo Bus The first demonstration studies used two MY 2017 Proterra Catalyst E2 40-foot low-floor electric buses leased from Proterra for a one-month trial period in the summer of 2017. During this study, the Proterra BEBs were used at Zion and Bryce Canyon. However, 60-ft propane buses are used at Zion, so this report will provide a comparison of both the 60-ft propane buses and 40-ft electric buses on the Zion Canyon route. Summary specifications for the Proterra BEB can be found in Table 4, with a picture of the Proterra Catalyst E2 bus shown in Figure 9. It should be noted that the Proterra buses tested had 330 kWh usable batteries, but Proterra has since increased the battery size to 360 kWh usable (440 kWh nominal) energy capacity.
Table 4. Proterra Catalyst E2 – Demo Bus Specifications
Specification Description
Vehicle make and model Proterra Catalyst E2
Vehicle model year 2017
Gross combined weight rating 39,050 lbs
Gross combined curb weight 29,849 lbs
Gross combined passenger capacity 70
Battery size 330 kWh a
Motor rating 295 hp peak
a 360-kWh battery will replace this battery size in future models

11 This report is available at no cost from the National Renewable Energy Laboratory at www.nrel.gov/publications.
Figure 9. 2017 Proterra Catalyst E2 – demo bus
3.2 New Flyer Xcelsior Charge 60’ – Demo Bus A 2018 New Flyer Xcelsior Charge 60-ft low-floor demonstration BEB was used for the second Zion bus study during a weeklong test starting on the 2018 Labor Day weekend. During this study, the New Flyer BEB was used on the Zion Canyon route, providing a comparison of both the existing 60-ft propane bus and a 60-ft electric bus. Summary specifications for the 60-ft New Flyer BEB can be found in Table 5, with a picture of the New Flyer Xcelsior Charge 60’ bus shown in Figure 10.
Table 5. 2018 New Flyer Xcelsior Charge 60’ – Demo Bus Specifications
Specification Description
Vehicle make and model New Flyer Xcelsior Charge 60’
Vehicle model year 2018
Gross combined curb weight 45,662 lbs
Combined passenger capacity 125
Battery size 466 kWh a
Motor rating 281 hp peak
a Usable battery capacity
12 This report is available at no cost from the National Renewable Energy Laboratory at www.nrel.gov/publications.
Figure 10. 2018 New Flyer Xcelsior Charge 60’ – demo bus
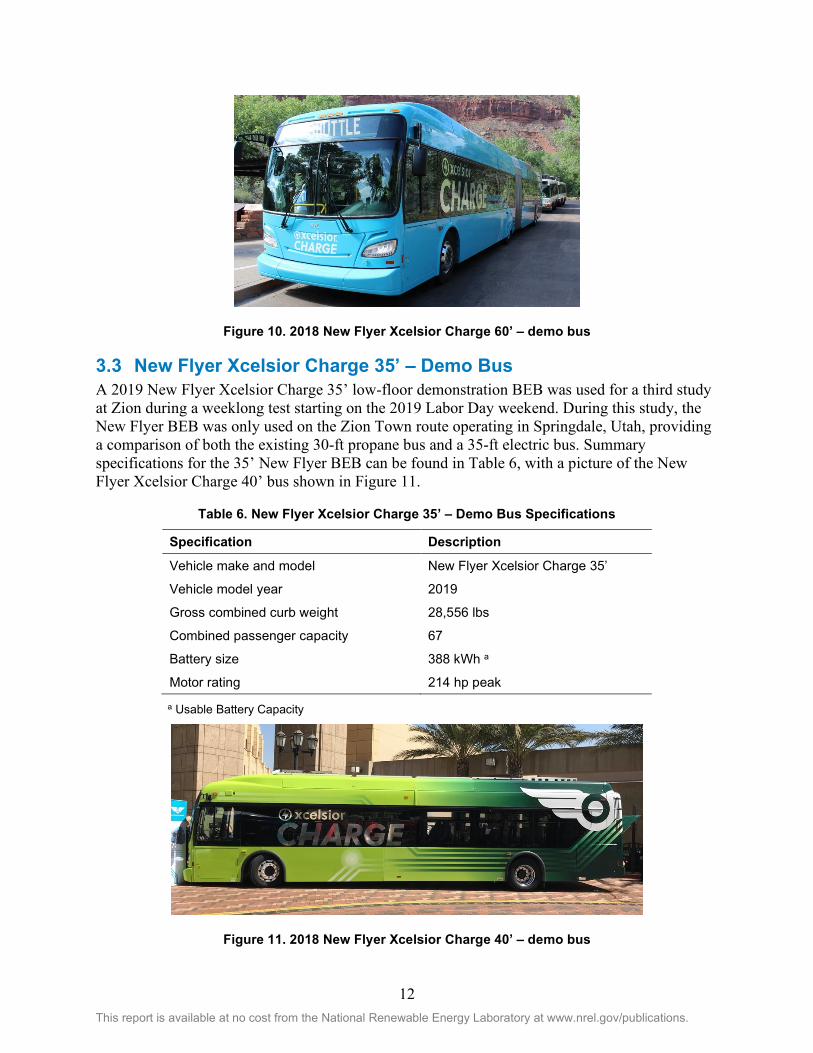
3.3 New Flyer Xcelsior Charge 35’ – Demo Bus A 2019 New Flyer Xcelsior Charge 35’ low-floor demonstration BEB was used for a third study at Zion during a weeklong test starting on the 2019 Labor Day weekend. During this study, the New Flyer BEB was only used on the Zion Town route operating in Springdale, Utah, providing a comparison of both the existing 30-ft propane bus and a 35-ft electric bus. Summary specifications for the 35’ New Flyer BEB can be found in Table 6, with a picture of the New Flyer Xcelsior Charge 40’ bus shown in Figure 11.
Table 6. New Flyer Xcelsior Charge 35’ – Demo Bus Specifications
Specification Description
Vehicle make and model New Flyer Xcelsior Charge 35’
Vehicle model year 2019
Gross combined curb weight 28,556 lbs
Combined passenger capacity 67
Battery size 388 kWh a
Motor rating 214 hp peak
a Usable Battery Capacity
Figure 11. 2018 New Flyer Xcelsior Charge 40’ – demo bus

13 This report is available at no cost from the National Renewable Energy Laboratory at www.nrel.gov/publications.
4 Data Collection Efforts 4.1 Methodology In-use data collection activities were performed by temporarily installing data acquisition systems on both conventional and electric buses for the duration of each study. The data acquisition systems used in these studies were Isaac Instruments DRU900/908 J1939, seen in Figure 12. With the data loggers, vehicle duty cycle activities such as speed, location, power consumption, and accessory use were recorded. An assessment of electrification potential was made based on the analysis of these data.
Figure 12. DRU900 data logger
Each park analysis was tailored according to each park’s needs. Daily results were analyzed to see maximum energy usage in a day. This figure is important in determining if overnight charging alone is sufficient, or if on-route charging was necessary for electrification without changing current operations. If overnight charging alone was not sufficient, trip results were also analyzed. This way, one could see how changes in bus operations, such as reducing the daily number of trips by a certain increment, could allow for bus electrification with only overnight charging. Because each vehicle performs a different number of trips each day, analysis was completed to compute average number of daily trips and assess how daily number of trips varies among each bus of the fleet and by day of week. To analyze trips, the data are filtered to only include trips longer than one mile to avoid erroneous trips that may have occurred during maintenance or for other reasons.
Idling times, in which the bus is powered on but not moving, were also analyzed. When a conventional vehicle idles, it is burning fuel, emitting tailpipe exhaust, and creating noise. Electric vehicles do not need to idle while the vehicle is stopped, but may be consuming energy to operate the heating, ventilation, and air-conditioning (HVAC) system and other auxiliary loads such as battery cooling.
4.2 Zion Data Collection Details Three in-use data collection activities were performed from August 2017 to September 2019 to test each demonstration bus:

14 This report is available at no cost from the National Renewable Energy Laboratory at www.nrel.gov/publications.
Proterra 40’ – The first test period occurred from August 15–September 22, 2017, on the Canyon route within the park. This test involved instrumenting three of the existing propane buses that have a 30-ft tractor pulling a 30-ft trailer and the one Proterra 40-ft BEB demo bus with data acquisition systems.
New Flyer Xcelsior Charge 60’ – The second test period occurred from September 1–7, 2018, on the Canyon route; however, this New Flyer BEB was a 60-ft bus, which is closer in size and passenger capacity to the existing propane buses operating in the canyon. One of the propane units, as well as the one demo bus, were instrumented with data acquisition systems.
New Flyer Xcelsior Charge 35’ – The last test period took place from August 8–20, 2019, on the in-town shuttle, which provides service from stops within the town to the park entrance. Data acquisition devices were placed on six of the 30-ft propane buses and the one 35’ New Flyer electric bus.
4.3 Bryce Data Collection Details Two in-use data collection activities were performed for Bryce Canyon. One was in September 2017, which monitored a Proterra Catalyst E2, and the second was in September 2018 to test existing conventional diesel buses. These collection periods are shown in Figure 13. Over 15,923 miles of data were captured and over 4 million seconds of data were analyzed during this test.
Figure 13. Bryce data collection period (darker = more energy use)
4.4 Yosemite Data Collection Details To capture the diverse route set at Yosemite, data loggers were installed on fifteen buses from July 1–August 5, 2019, as shown in Figure 14. During these collection activities, over 35,477 miles of in-use data were captured from 362 vehicle days and 3,793 total hours of operation. Of the 15 buses that had data loggers, 12 operated on Yosemite Valley routes, 3 operated on Mariposa routes, and 2 did not operate due to mechanical issues.

15 This report is available at no cost from the National Renewable Energy Laboratory at www.nrel.gov/publications.
Figure 14. Yosemite data collection period (darker = more energy use)
5 Results and Discussion 5.1 In-Use Data Collection
5.1.1 Zion Data Collection Results
Zion 2017 Study – Proterra 40’ A summary of testing information for the Proterra 40’ test can be seen in Table 7. Proterra subsequently provided detailed powertrain data from the BEB (see Appendix B for a list of BEB data channels). Over 15,500 miles of in-use data were captured from 128 vehicle days, with nearly 1,000 uniquely identified trips. It should be noted that the electric bus is missing data from September 9–22 due to an error with the Proterra data logging system during this time. However, the additional data used in the analysis of the propane buses had no statistical impact on the propane bus fuel economy or this analysis, because these buses did not have cabin air conditioning. Additional information was collected from Zion Park Fleet Management, including fueling records and operator feedback.
Table 7. Proterra 40’ Test Summary
Bus Powertrain Total Dist. (mi)
Total Fuel (gal/gal-e) a Ambient Temp. (°F)
Active Days Total Trips
Bus 44 Propane 3,175 1,125 85.8 ± 7.33 28 194
Bus 41 Propane 4,368 1,478 85.5 ± 6.75 37 276
Bus 42 Propane 5,152 1,661 84.6 ± 7.76 37 310
Proterra Electric 2,847 183 91.4 ± 5.57 26 172
a For comparison purposes, electricity consumption is converted to an equivalent gallon of propane on an energy-equivalent basis, in which one gallon of propane contains 28 kWh of energy.
Daily Results (2017 – Proterra 40’) This study compared three MY 2000 60-ft propane buses to one MY 2017 40-ft BEB, with a compilation of the daily average statistics shown in Table 8. It is likely that newer-technology propane engines would have slight efficiency improvements (5%–15%). However, there are currently no known modern propane transit buses available on the market. Where appropriate, it has been noted if a modern engine would show a distinct advantage. The BEB had higher daily average speeds as compared to the propane vehicles throughout this study, which is attributed to the smaller passenger capacity and multiple doorways of the low-floor bus design of the BEB. The smaller passenger capacity of the 40-ft BEB and the two doors of its low-floor design

16 This report is available at no cost from the National Renewable Energy Laboratory at www.nrel.gov/publications.
allowed the bus to be loaded faster and therefore had shorter idle times than the 60-ft propane buses.
Typically, BEBs have better acceleration due to the low-speed torque properties of electric motors, which allows them to achieve their target driving speed quicker, resulting in higher average speeds. However, in this study, the propane buses had slightly higher moving average speeds. The slightly slower moving speed of the electric bus could be a result of the drivers being less familiar with the handling of the BEBs while driving through the canyons, with the larger wheelbase of the 40-ft bus causing them to reduce their driving speed.
Table 8. Proterra 40’ Daily Average Vehicle Statistics
Bus Bus 44 Bus 41 Bus 42 Proterra
Average speed (mph) 10.3 ± 2.1 10.6 ± 1.8 10.7 ± 1.7 14.3 ± 0.6
Moving avg. speed (mph) 17.4 ± 1.2 17.9 ± 1.4 17.4 ± 0.7 16.9 ± 0.6
Distance (mi) 113 ± 57.9 118 ± 48.6 139 ± 45.2 110 ± 20.1
Time moving (h) 6.5 ± 3.4 6.7 ± 2.9 8.0 ± 2.6 6.5 ± 1.1
Kinetic intensity (1/mi) 1.3 ± 0.29 1.2 ± 0.14 1.2 ± 0.11 1.3 ± 0.10
Miles per gallon (MPG) or miles per gallon equivalent (MPGe) 2.7 ± 0.39 2.9 ± 0.30 3.1 ± 0.36 15.7 ± 1.4
Propulsion requirements (kWh/mi) 2.3 ± 0.56 2.1 ± 0.41 2.2 ± 0.42 1.8 ± 0.17
Daily propulsion energy (kWh) 249 ± 127.7 247 ± 103.0 295 ± 97.1 197 ± 40.2
The propane buses had slightly higher daily average driving distances than the BEB due to the range limitation of approximately 180 miles for the BEB used in this test. The longest daily distance recorded by the propane buses was 186 miles, whereas the BEB was only 116 miles. Using the average electricity consumption rate of 1.8 kWh per mile, the BEBs with a usable battery capacity of 330 kWh should have a maximum driving range of 183 miles (or 200 miles for the 360-kWh pack). Over a 12-year period, degradation within the 330-kWh battery may limit its capacity to 80%, meaning that range would drop to approximately 145 miles. Larger battery options are available today, which could achieve 300-mile range or 240 miles at year 12 assuming 80% capacity degradation [8], [9]. Actual driving was limited by “range anxiety” and other factors such as aggressive driving, with the higher vehicle torque and increased cooling loads from the air conditioning. For example, a driver would not want to start a route with the BEB being uncertain if there is enough capacity to complete the route, but the propane buses have substantial extra capacity, thus giving the drivers peace of mind.
Kinetic intensity, shown in Equation 1, is a metric used to quantify the driving intensity of a route, and has a direct impact on fuel efficiency. This metric is defined as the characteristic acceleration (Equation 2) divided by the square of the aerodynamic velocity (Equation 3), where 𝑣𝑣 is velocity, 𝑔𝑔 is gravitational acceleration, and ℎ is elevation. Kinetic intensity provides a route-specific ratio of the energy required for acceleration to the energy lost to aerodynamic drag, offering insight into the relative advantage a hybrid or electric vehicle may have between specific routes [10]. A route with frequent highway driving and limited stops such as long-haul trucking would have a relatively low kinetic intensity and provide limited advantages to

17 This report is available at no cost from the National Renewable Energy Laboratory at www.nrel.gov/publications.
hybrid/electric vehicles, whereas a route with slow speeds and frequent stops such as a transit bus would have a high kinetic intensity and many energy recovery opportunities for hybrid/electric vehicles.
𝑘𝑘𝑘𝑘𝑘𝑘𝑘𝑘𝑘𝑘𝑘𝑘𝑘𝑘 𝑘𝑘𝑘𝑘𝑘𝑘𝑘𝑘𝑘𝑘𝑖𝑖𝑘𝑘𝑘𝑘𝑖𝑖 = characteristic acceleration aerodynamic speed2
= 𝑎𝑎�𝑣𝑣𝑎𝑎𝑎𝑎𝑎𝑎𝑎𝑎2 (1)
𝑎𝑎� = ∑ 𝑝𝑝𝑝𝑝𝑖𝑖𝑘𝑘𝑘𝑘𝑘𝑘𝑣𝑣𝑘𝑘 (12 ∗ �𝑣𝑣𝑗𝑗+1
2 −𝑣𝑣𝑗𝑗2�+𝑔𝑔∗ �ℎ𝑗𝑗+1 −ℎ𝑗𝑗)�𝑁𝑁−1𝑗𝑗=1 (2)
𝑣𝑣𝑎𝑎𝑘𝑘𝑎𝑎𝑝𝑝2 = � 𝑣𝑣𝑗𝑗,𝑗𝑗+13��������� ∗ ∆𝑘𝑘𝑗𝑗,𝑗𝑗+1
𝑁𝑁−1
𝑗𝑗=1 (3)
The average kinetic intensity observed for the Zion Canyon route was 1.26 mi−1, which is less intense than typical transit bus driving. Figure 15 provides vehicle average comparison of transit buses from various agencies throughout North America. While the Zion National Park shuttle system has the lowest average kinetic intensity, there are still ample opportunities for energy recovery with higher average characteristic acceleration than aerodynamic velocity.
Figure 15. Zion drive cycle comparison to Fleet DNA data [11]
MPGe is the equivalent energy content in gallons of propane that the electric bus used. For example, there are nearly 28 kWh of energy per gallon of propane, so if a 10-mile trip takes 28 kWh of electricity to propel the bus, then the bus has a MPGe of 10. Despite the relatively low kinetic intensity of the Zion Canyon route, the electric bus was able to achieve a daily average MPGe of 15.7, as compared to the 3.0 MPG the propane buses achieved. This improvement can be attributed to both the increase in powertrain efficiency and the smaller size/passenger capacity of the electric bus.
The average propulsion power of the electric bus was 1.8 kWh/mi, as compared to 2.2 kWh/mi for the propane bus. Therefore, if this study were comparing two 60-ft buses with the same passenger capacity, the fuel economy improvement of the electric bus would be closer to a

18 This report is available at no cost from the National Renewable Energy Laboratory at www.nrel.gov/publications.
fourfold improvement, assuming both vehicles took 2.2 kWh to propel the vehicle one mile. Further, a 2017 propane bus would likely have efficiency improvements such as electric engine fans and accessories that could improve the efficiency of the propane bus by 10% and lessen the difference in efficiency between the two propulsion technologies [12], [13].
Trip Results (2017 – Proterra 40’) Table 9 provides trip average statistics, in which one trip is defined as traveling from the visitor center into the canyon ending at the Temple of Sinawava and back to the visitor center (approximately 16 miles). Again, the BEB had a slightly higher average speed, which can be attributed to smaller passenger capacity and multiple doorways allowing passengers to board and alight the bus simultaneously, resulting in shorter dwell periods at stops. This is confirmed by both the lower average idle time and shorter time stopped in the pickup zone next to the visitor center.
Interestingly, the total trip time for the BEB was, on average, longer than the propane buses, which is a result of the propane buses being sent out on shorter trips to help increase capacity during peak hours of the day. The BEB only completed trips for the full route. It should also be noted that the time moving plus the time spent idling will not add up to the total trip time, because the buses were turned off during portions of the trip.
Table 9. Proterra 40’ Trip Average Statistics
Bus Bus 44 Bus 41 Bus 42 Proterra
Average speed (mph) 12.8 ± 1.5 13.2 ± 1.9 12.6 ± 1.2 14.6 ± 0.7
Moving avg. speed (mph) 17.8 ± 1.1 18.1 ± 1.3 17.7 ± 1.0 17.2 ± 0.7
Distance (mi) 16.2 ± 2.1 15.7 ± 2.5 16.5 ± 1.6 16.4 ± 0.1
Total trip time (min) 77.5 ± 13.3 74.0 ± 17.3 79.1 ± 10.6 83.4 ± 3.0
Time moving (min) 55.1 ± 8.4 52.7 ± 10.4 56.1 ± 6.7 57.1 ± 2.4
Time spent idling (min) 17.6 ± 5.8 17.1 ± 6.4 18.5 ± 5.7 10.4 ± 3.0
Time stopped in pickup zone (min) 4.9 ± 2.7 4.7 ± 2.6 4.2 ± 2.6 2.8 ± 1.4
Kinetic intensity (1/mi) 1.2 ± 0.15 1.2 ± 0.16 1.2 ± 0.13 1.3 ± 0.10
MPG or MPGe 2.9 ± 0.28 3.1 ± 0.29 3.2 ± 0.29 16.0 ± 1.72
Propulsion requirements (kWh/mi) 2.1 ± 0.23 2.0 ± 0.19 2.1 ± 0.18 1.8 ± 0.21
Avg. trip propulsion energy (kWh) 34.6 ± 5.6 31.6 ± 6.3 34.0 ± 4.7 29.1 ± 3.5
On a trip average, the BEB had a similar MPGe to the day average—around 16 MPGe—which is more energy efficient than the propane buses, which had a trip average fuel economy of 3.1 MPG. However, if the BEB had been a comparable 60-ft bus, which requires more propulsion power, the efficiency improvement would have been closer to 4 times. Again, a 2017 propane bus would likely have efficiency improvements such as electric engine fans that could lower the difference in efficiency between the two propulsion technologies. The average trip energy for the BEB was around 29.1 kWh, whereas the propane buses were around 33 kWh. This information can be used to help identify the proper battery size for future BEB purchases, or for powertrain sizing of modern propane vehicles.

19 This report is available at no cost from the National Renewable Energy Laboratory at www.nrel.gov/publications.
Zion Study – New Flyer 60’ (Canyon) and 35’ (Town) After testing the Proterra 40’ BEB on the Zion Canyon route, NPS elected to perform an additional test of a New Flyer 60’ BEB, as well as a New Flyer 35’ BEB on the Springdale route that carries passengers from within the town to the park entrance.
Daily Results (2018 & 2019 New Flyer 60’ and 35’) Like the Proterra BEB demonstration analysis, this section shows the daily results for both New Flyer demonstration BEBs. Figure 16 shows the daily distances of the conventional and the demonstration bus for both the Canyon route and the Town route.
Figure 16. Daily results for New Flyer 60’ (Canyon) and 35’ (Town)
Overall, the BEBs operated fewer daily miles than the longest day recorded by the existing propane buses during the test period. However, further analysis into the battery state of charge level of the BEB’s is warranted to ensure a BEB was not hitting its battery limit and is a suitable replacement that can meet or exceed existing operational needs since the Park’s visitation has been increasing each year.
Trip Results (2019 New Flyer 60’ and 35’) Energy used per mile in units of kWh/mi is a key efficiency metric used by heavy-duty vehicles to establish their energy efficiency, just like miles per gallon for light-duty gasoline cars. A more efficient electric vehicle will use fewer kWh/mi. Figure 17 shows the average energy usage for the Canyon and Town routes for the BEBs and the average engine output power of the propane buses. It should be noted that the energy estimates from the buses are daily averages. A GPS error during testing prevented the processing from being able to break up the data by trip. On average, the 60-ft BEB on the Canyon route used 2.28 ± 0.15 kWh/mi of energy, whereas the 35-ft BEB on the Town route used only 1.66 ± 0.09 kWh/mi. This is expected because the 35-ft shuttle is smaller and lighter than the 60-ft shuttle. Interestingly, the existing propane buses produced slightly less brake energy per mile than the electric vehicles, which had energy recapture through regenerative braking. However, the this is likely due to the HVAC use of the 60’ BEB which is not present in the propane bus since there is no air conditioning.
Using the daily average energy consumption multiplied by the route distance, the right plot in Figure 17 shows the incremental energy increase versus trip number, with horizontal lines

20 This report is available at no cost from the National Renewable Energy Laboratory at www.nrel.gov/publications.
indicating the available New Flyer battery sizes and the lighter shaded parts being the upper and lower standard deviations. As of this publication, New Flyer offers the 60-ft BEB with a 466-kWh usable battery and the 35-ft BEB with a 311-kWh and 388-kWh usable battery. Based on this analysis, all current battery sizes can accommodate 29 daily trips of the Town route. However, the Canyon buses, which can do up to 12 trips per day, may require a larger battery, especially when considering battery degradation over time.
Figure 17. Trip results for New Flyer 60’ (Canyon) and 35’ (Town)
To further examine the battery degradation requirements, Figure 18 looks at both the present-day battery requirements per trip and the battery requirement assuming the buses have 80% battery capacity remaining. Based on the right-hand plot in Figure 18, the 35-ft BEB would be able to complete the 29 daily trips, assuming the 388-kWh battery was originally purchased. However, the 60-ft BEB would only be able complete about 9 trips per day with 80% remaining battery capacity, meaning more vehicles or midday charging would be required.
Midday charging is a strategy that can be used to increase the daily range by pulling a bus out of service during periods of decreased demand. Figure 19 shows a simulation of daily battery requirements when incorporating midday charging versus number of daily trips for both a 1-hour (left) and 1.5-hour (right) charge with only 80% usable battery capacity remaining due to battery degradation. While each BEB is different, it is typically most efficient and fastest to charge an electric vehicle between 20% and 80% state of charge, so this simulation looks at charging at 60 kW when the bus state of charge goes below 50%. For the 60-ft BEB, the 1-hour charge at 60 kW allows the BEB to complete 10 trips throughout the day, and the 1.5-hour charge at 60 kW increases that to 11 daily trips. However, the eleventh trip is within the standard deviation, so a longer or higher powered (such as 125 kW) midday charging may be needed for days with high energy consumption such as hot or cold days, which have increased accessory loads from HVAC.

21 This report is available at no cost from the National Renewable Energy Laboratory at www.nrel.gov/publications.
Figure 18. Daily number of trips possible with 100% battery capacity and 80% battery capacity
Figure 19. Daily number of trips possible with 1-hour and 1.5-hour midday charging, including battery degradation
Zion 2020 Fleet Charging Schedule Analysis Analysis of charging at Zion until this point has been focused on a single vehicle, but actual charging and energy use will be more complex with buses being put into service at different times throughout the day due to varying ridership demand. Charging these vehicles without consideration for total site energy use can have a large impact on demand charges. To address this, NREL performed a charging strategy analysis for Zion’s fleet assuming full fleet electrification. Assuming each bus has its own 60-kW charger, this analysis examines two scenarios:
1. No charge control option, in which the buses are charged as soon as they pull in (unmanaged)
2. Charge management that specifies buses can charge any time before they had to pull out to begin their shift the next day, provided they return to 100% state of charge.

22 This report is available at no cost from the National Renewable Energy Laboratory at www.nrel.gov/publications.
Using the energy consumption results from the in-use data collection efforts, which are shown in Table 10, the necessary time to charge was computed by multiplying the total hours the bus was operating by average kilowatts for each route to calculate daily energy usage (kWh). Next, daily energy usage in kWh was divided by the charging power (60 kW) to obtain hours needed to fully charge to 100% state of charge. Note that this is an upper estimate of the charging power, as the buses will not actually charge at a constant 60 kW. The constant current / constant voltage charging protocol make it such that the average charging power is lower than the maximum achieved. This was only calculated for buses pulling in during the evening, which excludes the Sweep, Interpretive, and Block 104 bus that arrive at 2 p.m., as these have a very large window in which they can charge.
Table 10. Daily Energy Usage for Battery Electric Bus
BEB analysis results Average kWh/mile Max. kWh/mile Average kW Max. kW
60-ft Canyon shuttle 2.32 2.57 24.07 25.89
35-ft Town shuttle 1.66 1.87 17.04 20.94
Results of this charging analysis can be seen in Figure 20, with daily energy usage per block varying from 35 kWh to 367 kWh and an average daily energy usage across all blocks of 246 kWh. Tied directly to average daily energy usage, the necessary time to charge each bus varies from 0.6 hours to 6.6 hours with an average nightly charging duration of 4.1 hours. Combining these charge times, both charging scenarios were examined, with the no-charge control scenario shown in Figure 21 and the managed charging scenario in Figure 22.

23 This report is available at no cost from the National Renewable Energy Laboratory at www.nrel.gov/publications.
Figure 20. Computing nightly time needed to charge for each block
Figure 21. Charging schedule with no charge management has peak demand of 1.1 MW

24 This report is available at no cost from the National Renewable Energy Laboratory at www.nrel.gov/publications.
Figure 22. Charging schedule with charge management has peak demand of 540 kW
The first scenario, with no charge management, shows a peak demand on the grid of 1.1 MW at 9 p.m. when 19 out of 25 buses are charging at once, and no charging between 4 a.m. and 9 a.m. even though some of the buses are still at the maintenance facility. While this scenario charges the buses as fast as possible, there are 5 hours when no buses are charging, and of the 25 buses, 14 require 5 hours or less to charge. This means there is potential to stagger the bus charging such that the peak site energy demand is reduced.
Charge management is implemented in the second scenario by delaying the charging start time such that when one BEB finishes charging, another starts, given that each bus is fully charged by the time it is scheduled to leave. As a result, the peak demand on the grid is reduced to 540 kW, occurring at various points throughout the night. While it is difficult to predict how increases in vehicle demand that increase the total number of buses or lengthen service times will affect the outcome, this strategy provides an idea of how charge management can be used to reduce demand charges. In addition, an Excel spreadsheet is provided with this report so that future operational changes can be incorporated. Finally, larger charging schedule figures can be found in Appendix C.
5.1.2 Bryce Data Collection Results Like Zion National Park, Bryce Canyon also tested 40’ Proterra BEBs in September 2017, totaling over 3,000 miles of in-service operation at the park. To compare the electric bus operation to that of the existing buses, NREL logged data on four of the nine existing diesel shuttles in September 2018, resulting in an additional 12,841 miles of data. In total, data acquisition devices on Bryce buses captured 15,923 miles of data from over 4 million seconds of data.
Bryce Daily Results Daily distance and daily average speed are important indicators of vehicle electrification potential. Figure 23 shows the daily average speed (left) and daily distance distribution (right) of both the conventional and electric buses. While both the diesel and electric buses had similar daily distances, the average speed was slightly lower for the electric bus, which may indicate

25 This report is available at no cost from the National Renewable Energy Laboratory at www.nrel.gov/publications.
slightly different driving characteristics such as longer dwell times at stops. These initial results based on daily distance indicate that the BEB can perform the same duty as the existing conventional diesel buses (CDBs), with both buses having a max daily distance around 175 miles. While this is within the advertised range of the vehicle, the longest daily distance may be tricky to cover with lower battery sizes and no intermediate charging.
Figure 23. Daily average speed and distance for diesel and electric buses
Distributions of daily brake energy (left) and energy used at idle (right) are shown in Figure 24. The electric bus option has 28% lower daily average energy than the conventional bus due to regenerative braking and reduced idle energy. On average, there was a 58% lower daily idle energy consumption for the BEB, which used an average of 16.6 kWh of energy at idle per day, whereas the CDB used 39.7 kWh of brake energy at idle.

26 This report is available at no cost from the National Renewable Energy Laboratory at www.nrel.gov/publications.
Figure 24. Daily average speeds and distances traveled
Highlighting this efficiency improvement of the electric bus, Figure 25 shows the daily fuel economy of both the CDB and BEB (left) and daily fuel consumption of the CDB (right). While the BEB does not use conventional fuel, the battery energy it uses was converted to an equivalent diesel gallon assuming 37.4 kWh of energy is equivalent to the energy content of 1 U.S. gallon of diesel. The mean CDB fuel economy was 6.0 MPG with an average daily fuel consumption of 20.7 gallons, whereas the BEB had an average equivalent fuel economy of 20.9 MPGe.
Figure 25. Fuel economy and fuel consumption rate

27 This report is available at no cost from the National Renewable Energy Laboratory at www.nrel.gov/publications.
Bryce Trip Results While daily results indicate BEB and CDB were able to perform the same distances, it is important to analyze energy use at a trip level to see what the requirements are for an individual route, as well as to inform future planning. The left plot in Figure 26 shows the trip energy usage by bus for each of the routes described in Figure 3. As expected, the BEB used less energy than the CDB for all routes, with a 25% reduction in trip energy usage for the Bryce Point route and a 21% reduction in trip energy usage for the Rainbow Point route. It should be noted that the “Other Trips” category had routes of different lengths, so it is not comparing the same work.
Average trip energy use can then be used for estimating battery requirements by multiplying the stepwise trip number by the energy use, as shown in the right plot of Figure 26. With the Bryce Point route completing up to 13 trips per day, a 440-kWh usable battery size would be required to complete those trips; however, for the Rainbow Point route, a smaller battery could be used with that bus only completing two trips per day.
Figure 26. Trip results comparing Bryce Point route and Rainbow Point route
5.1.3 Yosemite Data Collection Results Yosemite National Park was the third and final park to be analyzed. With the original test schedule of summer 2018 being delayed by wildfires, testing was rescheduled and took place in summer 2019. Due to rescheduling the testing, NREL was only able to collect data on the existing fleet and not on the two purchased 40’ Proterra BEBs, as they were not operational at the time of testing. Despite this, NREL was able to perform actionable analysis and provide electrification estimates.
Yosemite Daily Results Daily duty cycle analysis provides a first look at the electrification potential of Yosemite’s bus operation, allowing one to quickly identify which buses would be first candidates for electrification. Figure 27 shows a distribution of daily engine-on time in hours (left) with the average on-time being 10.6 hours per day and maximum daily run time of 16.4 hours. The right plot provides the percentage of engine-on time, in which the vehicle is stopped and idling. On average, these vehicles idle about 30% of the total daily run time, which will benefit

28 This report is available at no cost from the National Renewable Energy Laboratory at www.nrel.gov/publications.
electrification, as BEBs require much less energy when idling and produce zero tailpipe emissions.
Figure 27. Daily engine-on time and percentage of engine-on time when vehicle is idle
A daily energy production distribution is shown below in Figure 28 on the left and the energy produced while the HEB is idling is shown on the right. From these distributions, the average daily brake energy produced by the HEB engine is 265 kWh, with an average 24 kWh of that daily energy produced at idle. Maximum daily energy produced is around 470 kWh. As a result, battery sizes lower than 470 kWh were excluded from this study because they would not be feasible without intermediate charging.
Figure 28. Daily brake energy usage and energy usage when idle
Daily average fuel economy varied from 3–8 MPG, shown in Figure 29. Buses operating on the Yosemite Valley loop had a higher average MPG than those on the Mariposa loop, which could, in part, be a result of newer buses being used in the Yosemite Valley. Daily distance is shown in the right plot of Figure 29, with the maximum distance around 160 miles. With transit buses using around 2 kWh/mi of energy on average, a 160-mile day would require 320 kWh of energy, which is well within the available battery capacities. However, some buses produced up to 470 kWh of engine brake energy, meaning certain routes may use up to 2.9 kWh/mi.

29 This report is available at no cost from the National Renewable Energy Laboratory at www.nrel.gov/publications.
Figure 29. Daily average fuel economy and daily distance traveled
Yosemite Trip Results Translating this electrification potential into trip capabilities by route, Figure 30 shows trip energy usage results. Average trip energy usage per route is shown in the left figure, and battery size versus daily trip number is shown in the right. While these are estimates based on HEB energy production, the Mariposa daily number of trips based on bus mileage is 37, which can be achieved by the Proterra usable battery size of 530 kWh.
Figure 30. Trip results comparing different routes

30 This report is available at no cost from the National Renewable Energy Laboratory at www.nrel.gov/publications.
Yosemite Charging Analysis
Overnight Charging vs. On-Route Charging Aside from battery size, charging is another important aspect to electrification. Unlike fueling conventional internal combustion engine vehicles, charging takes substantially longer. To determine if overnight charging is feasible or if a combination of overnight and on-route charging is necessary, dwell times were analyzed to understand the charging opportunity.
Figure 31 shows results of a dwell time analysis in which there were large daily dwells between 7–30 hours, which provides substantial opportunity for charging. As indicated in the legend, dwell times 1 hour or greater can use slower charging rates such as in overnight charging, whereas charging during dwell times of 5 minutes to 1 hour is possible but requires high charging levels. Dwell times less than 5 minutes provide limited, if any, charging opportunity with current charging technology.
Figure 31. Dwell length analysis to assess most common dwell times
To assess if a battery electric vehicle could substitute a conventional vehicle, a simplified electric vehicle model was developed in which the bus engine was replaced with a motor. A depiction of this model can be seen in Figure 32.
Figure 32. Simplified electric vehicle model diagram
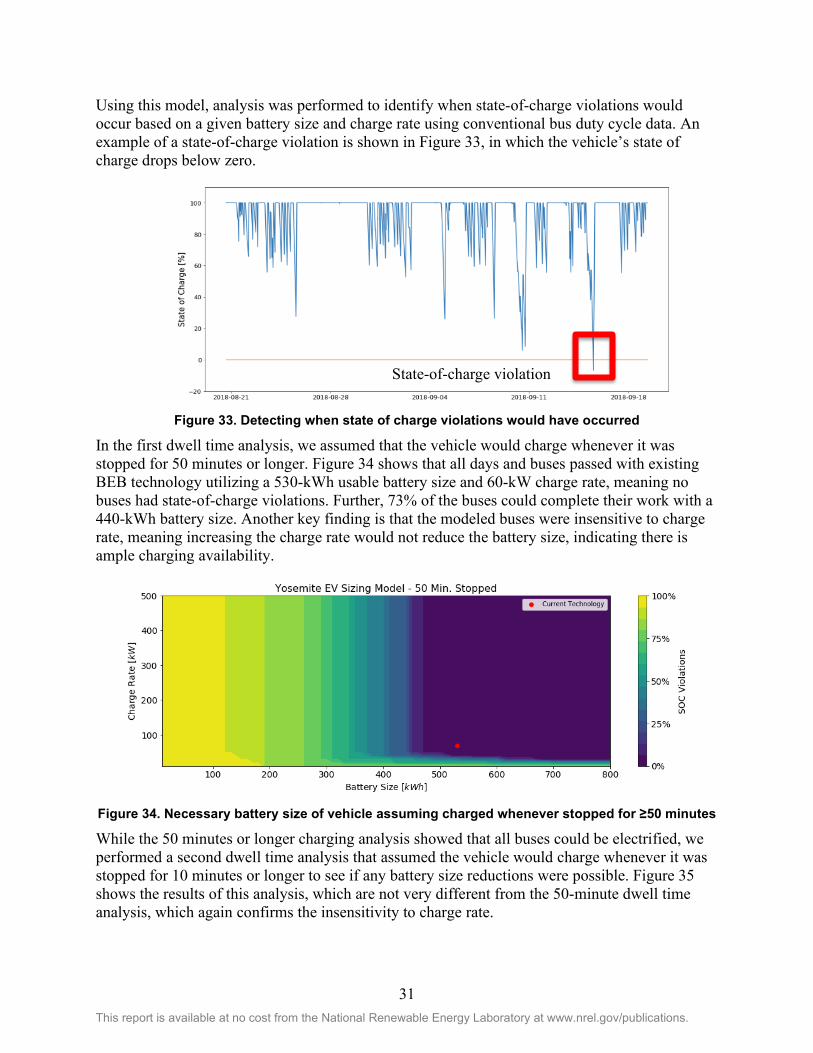
31 This report is available at no cost from the National Renewable Energy Laboratory at www.nrel.gov/publications.
Using this model, analysis was performed to identify when state-of-charge violations would occur based on a given battery size and charge rate using conventional bus duty cycle data. An example of a state-of-charge violation is shown in Figure 33, in which the vehicle’s state of charge drops below zero.
Figure 33. Detecting when state of charge violations would have occurred
In the first dwell time analysis, we assumed that the vehicle would charge whenever it was stopped for 50 minutes or longer. Figure 34 shows that all days and buses passed with existing BEB technology utilizing a 530-kWh usable battery size and 60-kW charge rate, meaning no buses had state-of-charge violations. Further, 73% of the buses could complete their work with a 440-kWh battery size. Another key finding is that the modeled buses were insensitive to charge rate, meaning increasing the charge rate would not reduce the battery size, indicating there is ample charging availability.
Figure 34. Necessary battery size of vehicle assuming charged whenever stopped for ≥50 minutes
While the 50 minutes or longer charging analysis showed that all buses could be electrified, we performed a second dwell time analysis that assumed the vehicle would charge whenever it was stopped for 10 minutes or longer to see if any battery size reductions were possible. Figure 35 shows the results of this analysis, which are not very different from the 50-minute dwell time analysis, which again confirms the insensitivity to charge rate.
State-of-charge violation

32 This report is available at no cost from the National Renewable Energy Laboratory at www.nrel.gov/publications.
Figure 35. Necessary battery size of vehicle assuming charged whenever stopped for ≥10 minutes
Therefore, the largest commercially available 40-ft BEB battery size of 660 kWh (530 kWh usable) can accommodate all the recorded days without need for on-route charging.
Charger Placement Analysis Charger placement is another critical aspect to bus electrification. Using hot-spot analysis on vehicle dwell periods, we identified frequent dwell locations that may be conducive to placing a charger. Figure 36 details the results of a hot-spot dwell time analysis, with the bright red spots indicating frequent stop locations that are 60 minutes or longer.
Figure 36. Hot-spot analysis for all of Yosemite National Park (≥60-minute dwells)
A zoomed-in version of Yosemite Valley is shown in Figure 37, with the largest of these located at the bus garage and overnight parking location, meaning this is likely the best place to co-locate chargers. It should be noted that some hot spots are located off the road, which is likely a result of GPS scatter from the canyon walls.
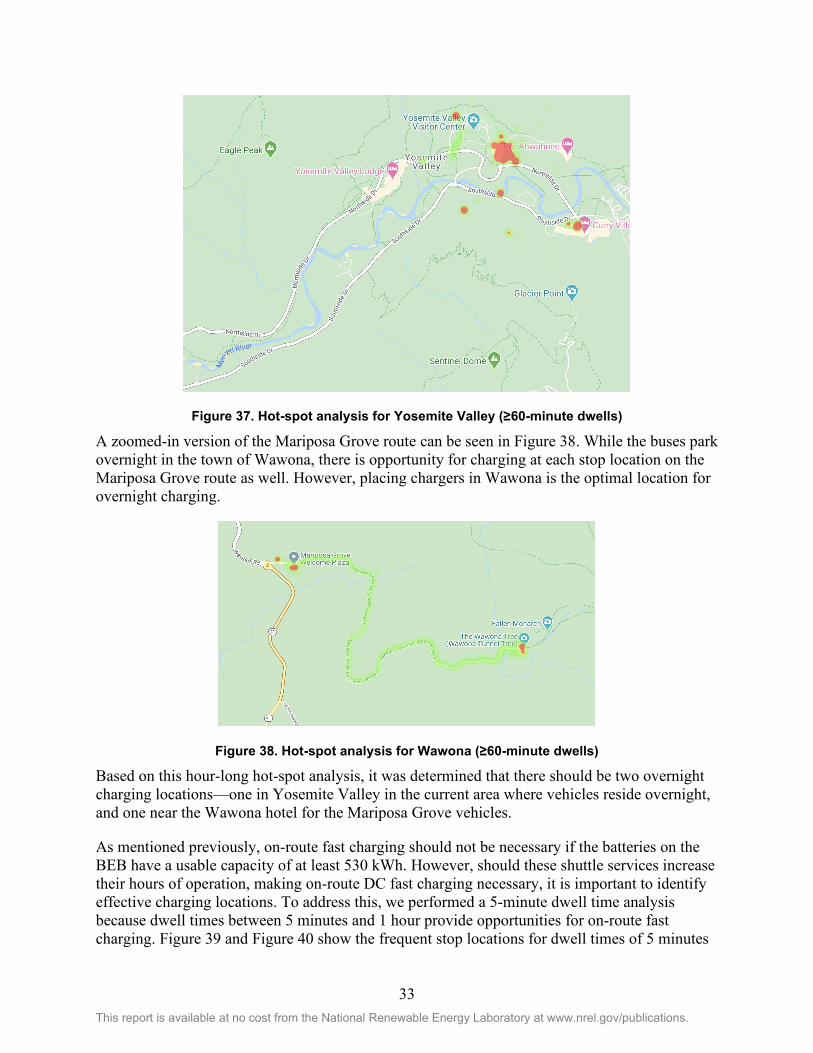
33 This report is available at no cost from the National Renewable Energy Laboratory at www.nrel.gov/publications.
Figure 37. Hot-spot analysis for Yosemite Valley (≥60-minute dwells)
A zoomed-in version of the Mariposa Grove route can be seen in Figure 38. While the buses park overnight in the town of Wawona, there is opportunity for charging at each stop location on the Mariposa Grove route as well. However, placing chargers in Wawona is the optimal location for overnight charging.
Figure 38. Hot-spot analysis for Wawona (≥60-minute dwells)
Based on this hour-long hot-spot analysis, it was determined that there should be two overnight charging locations—one in Yosemite Valley in the current area where vehicles reside overnight, and one near the Wawona hotel for the Mariposa Grove vehicles.
As mentioned previously, on-route fast charging should not be necessary if the batteries on the BEB have a usable capacity of at least 530 kWh. However, should these shuttle services increase their hours of operation, making on-route DC fast charging necessary, it is important to identify effective charging locations. To address this, we performed a 5-minute dwell time analysis because dwell times between 5 minutes and 1 hour provide opportunities for on-route fast charging. Figure 39 and Figure 40 show the frequent stop locations for dwell times of 5 minutes

34 This report is available at no cost from the National Renewable Energy Laboratory at www.nrel.gov/publications.
or greater. The number of red areas representing frequent stop locations is greater than that for the hour dwell time analysis, with the majority of those new areas located at bus stop locations throughout the Yosemite Valley. For the Mariposa Grove route, the hot-spot locations for 5-minute dwells are the same as those for the 1-hour dwells. However, the spots near the Mariposa Grove Welcome Center and near the end of the route are larger, indicating frequent short stops at those locations and opportunity for on-route fast charging.
Figure 39. Hot-spot analysis for Yosemite Valley (≥5-minute dwells)
Figure 40. Hot-spot analysis for Wawona (≥5-minute dwells)
Yosemite Charger Count Analysis Providing a charger for each bus can be expensive, both in infrastructure cost and in demand charges incurred from all buses charging at once. To help reduce these costs, NREL performed an analysis to determine total number of chargers needed for fleet electrification. This assumed full electrification of a fleet size of 4 at Mariposa and 22 at Yosemite Valley, not including the 2 Proterra buses already acquired and 2 GILLIG buses soon to be retired. Two case studies were completed to determine the number of chargers needed, location of those charging stations, and peak charging demand. The first, a conservative case, assumed one 60-kW charger per electric bus, and a second, more optimized analysis determined the minimum number of 60-kW chargers necessary.

35 This report is available at no cost from the National Renewable Energy Laboratory at www.nrel.gov/publications.
Based on the first analysis case with 22 60-kW chargers at the Valley Visitor Center and 4 60-kW chargers are the Mariposa Grove – Wawona Hotel location, this case would result in a peak demand of 1.32 MW at the Valley Visitor Center and 240 kW at the Mariposa Grove – Wawona Hotel. Case two optimized the number of chargers such that the fewest number of chargers are installed. This is complicated to analyze due to duty cycle variance because energy usage and idle times vary by bus, day, and weather, with vehicle range for electric vehicles decreasing in extreme temperatures; data loggers were only on the buses from July 1–August 5, 2019. To highlight these variances, Figure 41 shows that when energy usage was averaged by all buses for each day recorded, the average daily energy usage was 237 kWh, varying from 72 kWh to 293 kWh. The maximum daily energy usage was 403 kWh, varying from 246 kWh to 476 kWh.
Figure 41. Average and maximum daily energy usage by day
Seen in Figure 42, when energy usage was averaged by all days for each bus recorded, the average daily energy usage was 207 kWh, varying from 35 kWh to 347 kWh. The maximum daily energy usage was 350 kWh, varying from 174 kWh to 476 kWh. Because averaging by all days for each bus resulted in a more conservative estimate, with the average daily energy usage at 237 kWh, this was used to complete the minimum necessary charger count analysis.
Figure 42. Average and maximum daily energy, grouped by bus

36 This report is available at no cost from the National Renewable Energy Laboratory at www.nrel.gov/publications.
For the Mariposa Grove route, these buses had an average daily energy usage of 315 kWh. Assuming average daily energy was 315 kWh and charging rate is 60 kW with 95% efficiency, average charging period to return to full state of charge would be 4 hours and 31 minutes. Mariposa has a wider window to charge overnight than Yosemite Valley due to a shorter operation schedule, with Mariposa buses having at least 12 hours each night to charge. Assuming someone can switch chargers in the middle of the overnight charging period, the minimum necessary charger count is two 60-kW chargers for Mariposa Grove, shown in Table 11.
Table 11. Mariposa Necessary Charger Count: Conservative Daily Average Scenario
Maximum daily energy
Time needed to charge overnight, per bus
Time needed to charge overnight for all buses
Charging window
Number of chargers necessary
315 kWh 4 hours, 31 minutes 18 hours, 4 minutes 12 hours 2
While two chargers were deemed necessary for Mariposa Grove based on average daily energy usage, a worst-case scenario analysis was also performed, knowing that the maximum daily energy seen at Mariposa was 402 kWh of energy usage. Assuming four buses are in operation and each used 402 kWh of energy daily, 7 hours and 3 minutes of charging would be required per bus, making 28 hours and 13 minutes necessary for all four buses. Assuming a 12-hour charging window, one would divide the hours needed to charge all four buses by the charging window to see necessary number of chargers. Rounding up to an even number of chargers (because chargers typically come in pairs), four would be necessary at Mariposa. A summary of these results can be seen in Table 12 below.
Table 12. Mariposa Necessary Charger Count: Worst-Case Scenario
Maximum daily energy
Time needed to charge overnight, per bus
Hours needed to charge overnight for all buses
Charging window
Number of chargers necessary
402 kWh 7 hours, 3 minutes 28 hours, 13 minutes 12 hours 4
Looking at Yosemite Valley, the buses had an average daily energy usage of 198 kWh when grouped by bus and 218 kWh when grouped by day. Assuming each bus used 218 kWh with a charging rate of 60 kW and efficiency of 95%, this would mean the average charging period for the bus is 3 hours and 49 minutes. Assuming 22 buses are operational each day, a total of 85 hours would be necessary to complete charging of all buses. While the El Capitan shuttle operates for a shorter time window, the Yosemite Valley shuttle operates from 7 a.m. to 10 p.m. Therefore, this smaller 9-hour charging window was assumed for all buses for a conservative estimate. Dividing the 85 hours of charging by the 9-hour charging window and rounding up to an even number, 10 chargers are needed at Yosemite Valley to resume normal operation, assuming someone can switch chargers between BEBs overnight.
Table 13. Yosemite Valley Charger Count: 22-Bus Scenario
Maximum daily energy
Time needed to charge overnight, per bus
Time needed to charge overnight for all buses
Charging window
Number of chargers necessary
218 kWh 3 hours, 49 minutes 85 hours 9 hours 10

37 This report is available at no cost from the National Renewable Energy Laboratory at www.nrel.gov/publications.
Assuming there are 15 buses in daily operation because not all buses are used all the time, with the same average daily energy usage, charging power, and efficiency assumptions, 59 hours of total charging time is necessary each night. Dividing this by the 9-hour charger window and rounding up to an even number means that eight chargers are necessary, assuming someone can switch the chargers overnight.
Table 14. Yosemite Valley Charger Count: 15-Bus Scenario
Maximum daily energy
Time needed to charge overnight, per bus
Time needed to charge overnight for all buses
Charging window
Number of chargers necessary
218 kWh 3 hours, 49 minutes 59 hours 9 hours 8
While ten chargers were deemed necessary for Yosemite Valley based on 22 operational buses, a worst-case scenario analysis was also performed, knowing that the maximum day logged has 293 kWh per bus of average energy usage. This would mean fully charging each bus overnight would take 5 hours and 8 minutes, or 113 total hours if 22 buses were charging. Assuming again a 9-hour charging window and rounding up to an even number of chargers, fourteen would be necessary. A summary of results can be seen in Table 15.
Table 15. Yosemite Valley Charger Count: Worst-Case Scenario
Maximum daily energy
Hours needed to charge overnight, per bus
Hours needed to charge overnight for all buses
Charging window
Number of chargers necessary
293 kWh 8 hours, 11 minutes 113 hours 9 hours 14
Yosemite Monthly Energy Usage Analysis An analysis was also completed to predict the additional monthly energy usage with full fleet electrification. Assuming 26 buses per day are operational (22 in Yosemite Valley and 4 in Mariposa) with 237 kWh daily energy used per bus, total daily energy usage for the fleet is 6.2 MWh, meaning roughly 185 MWh of energy usage per month is expected with full fleet electrification. If the maximum average were used in this calculation (293 kWh), then one could expect 229 MWh of electricity use with full fleet electrification (in addition to the existing electrical loads on buildings). Assuming 19 buses per day are operational (15 in Yosemite Valley and 4 in Mariposa) with 237 kWh daily energy, total daily energy usage is 4.5 MWh, meaning roughly 135 MWh of additional energy usage per month is expected with full fleet electrification. If the maximum average energy usage (293 kWh) were used in this calculation, then it is expected that 167 MWh of additional energy usage will occur with fleet electrification.
Yosemite Electric Rate Tariff Analysis Yosemite Valley is in Pacific Gas & Electric’s territory, which, as of October 2019, has special electric vehicle rates for commercial customers [14]. These commercial electric vehicle (CEV) rates are currently in place and will stay in effect until 2025 to promote stability. Seen in Table 16, there is a subscription charge based on peak demand.

38 This report is available at no cost from the National Renewable Energy Laboratory at www.nrel.gov/publications.
Table 16. Pacific Gas & Electric: Electric Vehicle Rates for Commercial Customers [15]
Rate Element CEV-S a CEV-L-S b CEV-L-P c
Subscription charge per kW of peak demand d
$21.17/10-kW block
$167.75/50-kW block
$153.41/50-kW block
Peak energy charge $0.322/kWh $0.334/kWh $0.326/kWh
Off-peak energy charge $0.130/kWh $0.121/kWh $0.117/kWh
Super off-peak energy charge $0.103/kWh $0.098/kWh $0.095/kWh
a For those customers with peak demands of 100 kW or less b For those customers with peak demands of more than 100 kW taking service on secondary voltage c For those customers with peak demands of more than 100 kW taking service on primary voltage d PG&E proposes a “subscription charge” for its CEV customers similar to data usage plans sold by wireless telecommunication providers.
The proposed CEV peak period is from 4–9 p.m. all days of the year, and the proposed CEV super off-peak period is from 9 a.m. to 2 p.m. all days of the year. All other hours would fall in the proposed CEV off-peak period. There are no demand charges or fixed charges proposed for the CEV rates. As seen in Table 16, the costs normally collected by such charges would instead be collected through the subscription charge and energy charges.
5.2 Accessory Use: Climate Effects
5.2.1 Accessory Use Summary One of the key differences between the BEB and propane buses is that the BEB has HVAC to help cool passengers, which requires energy to operate, whereas the propane buses use passive roof hatches and open windows to cool the cabin.
This addition of the HVAC may improve rider experience but requires additional consideration when identifying the proper battery size, because HVAC energy use can be significant. While the overall energy use of the BEB and electric bus HVAC is lower, the BEB bus has a higher fraction of energy going to HVAC than the conventional bus because the BEB powertrain is more efficient. Figure 43 shows that the energy consumption by the HVAC for Zion for the BEB was 24.1% of the total energy consumption throughout the study. Such a load can drastically reduce the vehicle’s driving range.

39 This report is available at no cost from the National Renewable Energy Laboratory at www.nrel.gov/publications.
Figure 43. Energy usage of HVAC system is significant
HVAC energy usage is also highly dependent on ambient temperature, as opposed to the passive system of the propane buses. Figure 44 shows the trip average energy consumption of the vehicle’s air compressor, power steering, and HVAC versus ambient temperature along with a second plot with the total energy use and estimated vehicle driving range. These graphs were made from the Proterra study at Zion but can be applied to BEBs at other parks, with a caveat that the different number of door openings and closings along with increases in outdoor humidity could affect results.
Figure 44. Temperature dependence of vehicle energy consumption – Proterra study at Zion
5.2.2 Site Details Zion Accessory Use The figures in Section 5.2.1 were taken from Zion during the Proterra study. As previously mentioned, such high loads from energy consumption of HVAC can drastically reduce a vehicle’s driving range. For example, with a 330-kWh battery pack, a 1.5-kWh/mi energy consumption would allow the vehicle to travel 220 miles, whereas an energy consumption of 2.0

40 This report is available at no cost from the National Renewable Energy Laboratory at www.nrel.gov/publications.
kWh/mi would only allow 165 miles. Table 17 shows the trip average energy consumption for the vehicle and accessories along with the average ambient temperature, showing that for an average ambient temperature of 92°F the average HVAC energy consumption is 24% compared to the 2.4% from the air compressor and the 1.2% from the power steering. The energy consumption of the accessories directly impacts the vehicle’s range, meaning if the vehicle did not use the HVAC, the range would have been about 32% greater during this study.
Table 17. Trip Average Electric Bus and Accessory Information – Proterra Study
Total energy consumption (kWh/mi) 1.78 ± 0.21
Air compressor (Wh/mi) 43.3 ± 5.8
HVAC (Wh/mi) 428.2 ± 130.8
Steering (Wh/mi) 21.5 ± 1.5
Trip ambient temperature (°F) 91.7 ± 7.4
During the later New Flyer study, similar data were captured, shown in Figure 45, with energy consumption results close to those seen in the Proterra study. The Town shuttle bus uses slightly less energy for propulsion than the Canyon shuttle bus because it is smaller, but for each shuttle, 10%–25% of total energy consumption went to HVAC.
Figure 45. Energy consumption per device – New Flyer study
Bryce Accessory Use Bryce Canyon BEB energy consumption versus ambient temperature by accessory is shown in Figure 46. Bryce Canyon has a cooler climate than Zion Canyon due to higher elevation, and because of the lower temperatures, heating the bus became a larger factor. Heating the buses in colder weather may play a bigger role in range reduction than using air conditioning in high heat conditions, depending on the type of heating. These buses used resistive heating which is energy-intensive. However, for moderate climates, heat pumps may be a more efficient option. In this example, range of a 360-kWh battery would be reduced from 230 miles to 160 miles due to HVAC considerations in both the cold and hot scenarios.

41 This report is available at no cost from the National Renewable Energy Laboratory at www.nrel.gov/publications.
Figure 46. Energy consumption per device
Yosemite Accessory Use Yosemite temperature varies from 56°F to 90°F in summer months and can be as cold as 28°F in winter months. Therefore, heating may be a larger factor in influencing bus range than using air conditioning in warmer weather. However, winter months show reduced bus service, so the additional buses that would otherwise be unused in winter months can help if range issues do occur. Diesel heating systems are a possibility should range be an issue, but further analysis should be done to verify this. Note that if diesel heating systems were incorporated, technically this would no longer be zero emission technology; however, this option is common in low-temperature options, as electric heating can utilize a substation portion of bus energy.
5.3 Emissions Estimates
5.3.1 Methodology
Estimating Bus Tailpipe Emissions
Electric There are zero tailpipe emissions for electric vehicles, which is a major benefit of adopting electric buses, especially when replacing older buses due to increasing emissions standards. However, much like the production of fuels, emissions from electricity are dependent on the grid, but these emissions are being improved over time as more renewable electricity generation is added to the grid.
Diesel Diesel buses are currently used at Bryce and Yosemite, with Bryce using traditional diesel buses and Yosemite using HEBs. Conventional buses can have extremely high solid particulate matter and gaseous emissions, which pose direct and ancillary risks to both humans and the environment [13], [16], [17]. Modern diesel and alternative-fueled vehicles have managed to significantly reduce these emissions down to the detection limit of current measurement devices [18], but they cannot compete in terms of tailpipe emissions with an electric vehicle.

42 This report is available at no cost from the National Renewable Energy Laboratory at www.nrel.gov/publications.
Propane Propane buses are currently used at Zion. The tailpipe emissions of the propane buses at Zion are estimated from the consumption of fuel, where combustion of one gallon of propane produces 5.6 kg of CO2. It can be assumed that in a properly functioning propane engine, all the carbon is fully converted to CO2. SOx is a function of the fuel consumed with the assumption that all sulfur is converted to SO2 and the average sulfur content of liquified petroleum gas is 37 mg/kg based on national propane surveys. The propane buses were certified to 2.3 gNOx/bhp-hr back in 2000 [6]. However, if these buses were to be replaced with modern-day buses, the NOx emissions would be far less as a result of modern-day emissions standards. To ensure a fair comparison between the propane and electric buses, this analysis assumes the NOx emissions of the propane buses are at the levels of modern technology (0.03 gNOx/bhp-hr of the PSI 6.8-L engine [7]).
Estimating Emissions from Fuel/Electricity Production When examining vehicle emissions, one must consider not only the tailpipe emissions but also consider emissions from fuel/electricity production. Emissions from the electric buses were estimated using yearly average emissions rates provided by the U.S. Energy Information Agency. It should be noted that during these studies, the demonstration electric buses were charged with a stationary generator, but for the purposes of estimating emissions when permanent charging infrastructure is installed, we assume that the vehicle was charged using grid energy. Fuel production emissions for the conventional buses were estimated using Argonne National Laboratory’s Greenhouse gases, Regulated Emissions, and Energy use in Transportation (GREET) model, which provides national- and state-level emissions estimates from fuel and energy production [19].
5.3.2 Site Details
Zion Emissions Analysis – Proterra Study An estimation of both the tailpipe emissions and the indirect emissions from fuel/electricity production for the BEB and propane buses from the Proterra analysis can be seen in Figure 47. Note that CO2 emissions are an order of magnitude higher than SOx and NOx. To show the relative comparisons, CO2 is shown in units of kg/mi, while SOx and NOx are shown in units of g/mi.

43 This report is available at no cost from the National Renewable Energy Laboratory at www.nrel.gov/publications.
Figure 47. Estimated vehicle emissions for tailpipe and fuel/electricity production
Zion Bus Tailpipe Emissions Using the assumptions detailed in Section 5.3.1, the propane buses had a trip average tailpipe emission rate around 1.83 kgCO2/mi, 0.08 gSOx/mi, and 0.05 gNOx/mi compared to zero tailpipe emissions from the electric bus.
A more accurate measure of tailpipe emissions from the existing propane buses could be obtained using NREL’s heavy-duty chassis dynamometer, but this was outside the scope of the project. Additionally, a modern technology propane bus would likely have efficiency improvements that reduce the fuel burned and thus the CO2 produced.
Zion Bus Emissions from Fuel Production The fuel production emissions for the propane bus were 0.31 kgCO2/mi, and the electricity production emissions for the energy consumed by the BEB were 1.53 kgCO2/mi. Additionally, SOx and NOx are byproducts of both propane and electricity production. The propane buses had trip average fuel production emissions of 0.60 gSOx/mi and 0.77 gNOx/mi, whereas the BEB had electricity production emissions of 0.69 gSOx/mi and 2.16 gNOx/mi. Furthermore, the BEBs in the Proterra study for which emissions analysis was completed were 40-ft buses, so if these buses had been 60-ft buses, comparable to the existing propane buses, the emission rates would have been even higher due to the increased per-mile energy consumption.
Zion Combined Emissions Summary The combined tailpipe and energy production emissions from a comparable 60-ft BEB would have been 1.77 kgCO2/mi, 0.80 gSOx/mi, and 2.51 gNOx/mi, whereas the propane buses produced 2.14 kgCO2/mi, 0.64 gSOx/mi, and 0.85 gNOx/mi.
This results in 17% lower CO2 emissions for the comparable BEB. However, both the SOx and NOx are higher than that of the propane buses, with the BEB NOx emissions being over three times greater, as seen in Figure 48.

44 This report is available at no cost from the National Renewable Energy Laboratory at www.nrel.gov/publications.
Figure 48. Comparison of trip average total emissions for 60-ft propane and electric buses
The BEB emissions are attributed to the energy production mixture of the local Utah power grid, which is a majority coal power [20]. As the grid mixture switches away from coal and into more renewables like in California [21], as seen in Table 18, the BEB emissions from electricity production will decrease. It is also important to emphasize that the BEB emissions from energy production are concentrated to power generation facilities, rather than point source (or tailpipe) emissions as is the case for the propane vehicles. This reduction in local air pollution is an added benefit of BEBs.
Table 18. Grid Energy Production Mixture for Utah and California
Energy Source Utah California
Coal 70.4% 0.1%
Petroleum-fired 0.1% -
Natural gas 19.0% 46.0%
Nuclear - 7.9%
Renewables 10.1% 44.7%
Other 0.4% 1.3%
If the 60-ft BEB were charged using the energy mixture of the California electric grid, the emissions from electricity would be substantially reduced and the SOx emissions virtually eliminated. Figure 49 shows a comparison of total BEB emissions between a 60-ft bus charged using the Utah power grid and one using the California power grid.

45 This report is available at no cost from the National Renewable Energy Laboratory at www.nrel.gov/publications.
Figure 49. Comparison of emissions between operation in Utah and California
Bryce Emissions Analysis While there are zero tailpipe emissions from electric vehicles, it should be noted that during the Bryce study the demonstration electric bus was charged with a stationary generator, but for the purposes of estimating emissions when permanent charging infrastructure is installed, it is assumed that the vehicle was charged using grid energy.
Looking upstream to where that electricity is produced by assessing the current grid mix in Utah, one would expect an introduction of BEBs to lead to a 35% reduction in total CO2, 93% increase in total NOx, and 40% increase in total SOx. However, like the Zion study, a net decrease would occur as the electric grid reduces emissions over time. Emissions results for Bryce are shown in Figure 50, with source-specific emission on the left and combined emissions on the right.
Figure 50. Tailpipe and production emissions for Bryce
Yosemite Emissions Analysis As discussed previously, if the 60-ft BEB studied for Zion were charged using the energy mixture of the California electric grid, the emissions from electricity would be substantially

46 This report is available at no cost from the National Renewable Energy Laboratory at www.nrel.gov/publications.
reduced and the SOx emissions virtually eliminated. Figure 49 shows a comparison of total BEB emissions between a 60-ft bus charged using the Utah power grid and one using the California power grid. If the current Yosemite fleet were electrified, an 81% reduction in total CO2, 75% reduction in total NOx, and complete elimination of SOx is expected, and these emissions will continue to decrease as the California electric grid reduces its emissions.
5.4 Operating Cost Operating costs are another key consideration when evaluating electric vehicle adoption. An example comparing the operating costs of conventional and electric vehicles can be seen in the Zion analysis in the following section. The electricity rates used in this analysis were based on a site study by RMP, which evaluated both an off-peak slow-charging option where the electricity cost was $0.076/kWh and an on-peak fast-charging option where the cost was $0.169/kWh. The propane costs of this analysis were provided by Zion at $0.94/gal of propane.
Figure 51 provides a comparison of the propane bus average per-trip fuel cost and the average per-trip electricity cost of the BEB for both on- and off-peak charging. The propane bus had an average per-trip fuel cost of $4.97 ($0.311 per mile), whereas the BEB, which was charged at night during off-peak hours, had an average per-trip electricity cost of $2.21 ($0.138 per mile). If the BEB had been charged during on-peak hours from 1–8 p.m., the cost would have been $4.91 per trip ($0.307 per mile).
Figure 51. Average per-trip operating cost for both propane bus and BEB
For a 60-ft BEB, Figure 52 shows the off-peak charge rate would have been $2.57 per trip ($0.161 per mile), and the on-peak charge rate would have been $5.71 per trip ($0.357 per mile), which is 15% higher than the current per-trip cost of the propane bus. This shows that vehicle operating costs are greatly dependent on fuel/electricity costs, as well as charging schedule.
$0.94/g
$0.076/kW
$0.169/kW

47 This report is available at no cost from the National Renewable Energy Laboratory at www.nrel.gov/publications.
Figure 52. Comparison of operating costs between the 60-ft propane and electric buses
5.5 Electric Bus Considerations
5.5.1 Infrastructure for EV Charging Current BEB charging strategies include on-route fast-charge, in-depot plug-in (i.e, plug in at a maintenance facility), or plug-in with supplemental on-route inductive charging. All three strategies have advantages and disadvantages.
On-Route Fast-Charging
With on-route fast-charging, a bus should be able to operate all day. An operator needs to ensure the route circles through a charger within the estimated range of the bus and plan enough dwell time for the bus to fully charge. With existing BEB models, this time is approximately 6-10 minutes.
Advantages:
• Buses could operate all day with a smaller on-board battery pack (reduced cost) • Maintenance facility logistics and parking like conventional buses • One fast-charge station could serve buses on multiple, intersecting routes.
Disadvantages:
• Cost of fast charger, installation, and required electrical upgrades • Routes limited by location of fast-charge station • Training for operators to dock the bus to charger • Potential for demand/time-of-use charges by utility • Current fast chargers are not standard (different OEMs provide different types of
chargers).

48 This report is available at no cost from the National Renewable Energy Laboratory at www.nrel.gov/publications.
Maintenance Facility Plug-in Charging
Bus OEMs are building BEBs with larger battery packs for longer range. These buses are typically charged overnight when electricity costs are lower. The time for charging varies depending on the OEM and size of the battery pack, generally 2–6 hours.
Advantages:
• Off-peak charging with potentially lower electricity rates • All charging equipment located at the maintenance facility • Standardized chargers • Charging handled by maintenance staff—drivers can operate the bus like a conventional
bus. Disadvantages:
• Typically requires larger on-board battery packs to accommodate full-day range • Need for multiple chargers at maintenance facility • Plan for logistics for operating buses in the parking/charging area (traffic flow, bollards,
reduced parking space) • Longer charging time, may need to have some buses charge midday to meet range.
Plug-in with On-Route Inductive Charging
Adding an on-route inductive charger can increase the range of a plug-in bus. Agencies that currently use this strategy do not plan time at the stop for a full charge. Therefore, the bus energy still depletes over time. Inductive chargers require a receiver on the bus, a charging pad installed in the roadbed, and the charging supply equipment near the stop. The primary technical challenge for the inductive charger is alignment of the bus over the pad. Agencies have painted lines on the pavement to aid drivers in proper alignment. A bus can also have an indicator in the driver’s area to show when the bus and pad are adequately aligned. Inductive charging is an emerging technology with limited suppliers. As of this report, there are two OEMs providing this type of charging system: Wireless Advanced Vehicle Electrification (WAVE) [22] and Momentum Dynamics [23]. WAVE offers systems at 50 kW and 250 kW and has built commercial charging stations at transit agencies as well as other vehicle applications. Momentum Dynamics provides inductive charging systems from 50 kW to 450 kW. Momentum Dynamics systems have been deployed at several transit agencies in the United States.
5.5.2 Current Battery Electric Bus OEMs Several bus OEMs currently produce BEBs. The following section summarizes the models available from each OEM building buses in the United States. Table 19 lists a selection of BEBs that are available from OEMs.

49 This report is available at no cost from the National Renewable Energy Laboratory at www.nrel.gov/publications.
Table 19. Selection of BEBs and Related Specifications
40' 60'
New Flyer Proterra BYD New Flyer BYD
Max. battery size 590 kWh 660 kWh 324 kWh 885 kWh* 547 kWh
Wheel base (ft) 24 25 20 19 and 24.5 20 and 22.5
Curb weight (lb) 30,500 33,061 30,865 45,500 47,620
Turning radius (ft) 44 41.9 42.7 44 31
Total passengers 83 70 60 120 120
Seated passengers 40 40 25 60 60
Advertised range (mi) 284 350 155 284 170
*Note that the New Flyer 885 kWh battery for its 60’ BEB may not be available at this time
BYD BYD is a Chinese OEM with a U.S. headquarters and production facility in Lancaster, California. The U.S. facility only produces BEBs. BYD builds buses that meet “Buy America” requirements, as required by the Federal Transit Authority. BYD offers 30-ft, 40-ft, 60-ft articulated and motor coach buses. The primary charging strategy is plug-in; however, there is an option for using an inductive charger on-route to increase the range. BYD has worked with WAVE and Momentum Dynamics to supply the inductive charging equipment. The OEM has produced buses for many agencies, including Antelope Valley Transit Authority, Long Beach Transit, and Stanford University. NREL worked with Long Beach Transit to evaluate a fleet of 10 40-ft BYD buses in service.
GILLIG GILLIG is a U.S. company based in California. It offers buses in a variety of propulsion systems including diesel, compressed natural gas, and diesel hybrid. GILLIG has demonstrated a fleet of four 29-ft trolley replica BEBs at County Connection in Walnut Creek, California. NREL worked with the agency to evaluate these buses. The OEM has also recently announced a 40-ft BEB that will be operated by several agencies.
GreenPower Motor Company GreenPower is a new bus company based in Vancouver, Canada, with a manufacturing facility in Porterville, California. GreenPower offers BEBs for transit and school application and includes bus sizes from 30–45 feet, including a double-deck option. This OEM also produces smaller shuttle buses (EV Star) that can hold up to 24 passengers depending on seating configuration. The EV Star shuttle completed testing at Altoona, Pennsylvania, in April 2020, receiving an Altoona score of 92.2. GreenPower’s 40-foot bus model has been in service in the City of Porterville, California since 2017.
50 This report is available at no cost from the National Renewable Energy Laboratory at www.nrel.gov/publications.
New Flyer New Flyer is a Canadian-based company with several production facilities in the United States to conform to the “Buy America” standard. The OEM is the leading manufacturer of transit buses in the United States and offers all propulsion technologies including diesel, diesel hybrid, compressed natural gas, BEB, fuel cell electric bus, and electric trolley on its standard Xcelsior platform. Many conventional technology parts are shared between all propulsion systems and electric drive parts are shared between the BEB and fuel cell electric bus models. This is expected to help lower cost and increase parts availability. New Flyer supports both plug-in and fast-charge strategies. Chicago Transit Authority received the first two BEBs, which have been in service for two years. Other agencies have announced purchases of New Flyer BEBs and fuel cell electric buses.
Novabus Novabus is a Canadian-based company that also supplies buses for the U.S. market. The OEM supplies buses with multiple propulsion systems and has recently added a BEB to its lineup. The BEB design uses an on-route, fast-charge strategy. Currently, no U.S.-based transit agency has purchased a Novabus BEB.
Proterra Proterra is a U.S.-based bus OEM that produces BEBs at production facilities in Greenville, South Carolina, and the City of Industry, California. This OEM only produces BEBs, although past projects included an electric bus with fuel cell range extender. The OEM offers two drivetrains on 35-ft or 40-ft chassis that have various battery configurations for increased range. The charging strategies include on-route fast charging or in-depot plug-in. To date, Proterra has supplied the most BEBs in the United States. Agencies are operating Proterra buses in many different climates around the country.
Complete Coachworks Another option for BEBs is having the existing buses remanufactured. Complete Coachworks specializes in remanufacturing buses, offering a zero-emission propulsion system. The process begins by dismantling the bus down to the chassis. Complete Coachworks installs the electric propulsion system and replaces the other components. The propulsion system includes electric accessories (air compressor, power steering, and HVAC) and LED lighting.
5.6 Maintenance While maintenance data were not applicable for the short duration of the Zion BEB demonstration, NREL has worked with five transit fleets to evaluate maintenance requirements for BEBs. NREL has collected data on Proterra buses at two agencies: Foothill Transit (West Covina, California) and King County Metro (Seattle, Washington). New evaluations of Proterra buses include a fleet of six 40-ft Catalyst E2 buses at Duluth Transit. Data from these evaluations will provide performance results on the technology in colder climates. NREL has also worked with Long Beach Transit to evaluate a fleet of 10 40-ft BYD BEBs, and with County Connection in Concord, California, to evaluate four 29-ft GILLIG Trolley Replica BEBs.
The evaluations at Foothill Transit, KC Metro, County Connection (CC), and Long Beach Transit have provided sufficient data to report performance results. NREL has published two

51 This report is available at no cost from the National Renewable Energy Laboratory at www.nrel.gov/publications.
technical reports on the Foothill Transit evaluation covering data from April 2014 through December 2016 [24], [25]. NREL has also published biannual progress reports on the Foothill Transit BEBs. [26]–[29]. NREL has published two data reports on the BEBs at KC Metro [30]. Table 20 provides a summary of maintenance and key performance metrics for the four fleets.
Table 20. Summary of BEB key performance metrics
Data Item Foothill Transit KC Metro
Long Beach Transit
County Connection
Bus manufacturer Proterra Proterra BYD GILLIG
Bus length (ft) 35 40 40 29
Number of buses 12 3 10 4
Data period 1/15–12/19 4/16–3/17 1/18–6/19 6/17–5/18
Number of months 60 12 18 12
Total mileage in data period 1,504,027 83,127 214,662 51,550
Availability (85% is target) 83% 81% 72% 77%
Fuel economy (kWh/mile) 2.16 2.36 1.85 2.84
Fuel economy (mpdge a) 17.41 15.9 20.3 13.3
Average speed, including stops (mph) 10.6 14.8 8.0 6.0
Miles between roadcalls (MBRC) – bus 5,766 2,771 4,035 4,686
MBRC – propulsion system only 14,058 6,927 10,089 6,444
MBRC – ESS b only 212,634 N/A 48,425 17,183
Scheduled maintenance ($/mile) c 0.07 0.04 0.15 0.08
Unscheduled maintenance ($/mile) 0.37 0.22 0.35 0.31
Total maintenance ($/mile) 0.45 0.26 0.44 0.39
Maintenance – propulsion system only ($/mile) 0.16 0.05 0.04 0.10
a Mile per diesel gallon equivalent b Energy storage system c Work order maintenance cost
NREL collects maintenance work orders from the transit agencies to calculate operating costs. Because accident-related repairs are extremely variable from bus to bus, NREL eliminates those costs from the analysis. NREL also eliminates warranty cost data from the operating cost calculation because those costs are covered in the purchase price of the buses. For consistency, NREL uses a labor cost of $50/hour for all maintenance calculations. Cost per mile is calculated as follows:
Cost per mile = [(labor hours × $50/hr) + parts cost] / mileage (4)
NREL calculates total cost per mile as well as scheduled and unscheduled cost per mile. Figure 53 shows the scheduled and unscheduled maintenance costs for each agency, along with an

52 This report is available at no cost from the National Renewable Energy Laboratory at www.nrel.gov/publications.
overall average. In the early stage of implementation, all four fleets had some level of on-site OEM technicians that handled the warranty work. Agency maintenance staff handled inspections and bus-related repair. Transit agency staff occasionally aid the OEM technician during repairs, and those labor hours are counted as costs for the agency. NREL has tracked the performance and cost for Foothill Transit for more than 5 years. The costs for the agency have increased as the warranty period for the buses ended and parts costs are no longer covered by the OEM. Long Beach maintenance cost split between scheduled and unscheduled work differs from the other fleets. The agency reports that maintenance technicians often complete unscheduled repairs during the scheduled maintenance and do not initiate a separate work order. As a result, the scheduled maintenance is higher than expected, but the combined maintenance cost is unaffected.
Figure 53. Scheduled and unscheduled maintenance cost for BEBs
Figure 53 shows the maintenance cost per mile separated by labor and parts. For Foothill Transit, parts costs make up a larger portion of the total costs because the buses have surpassed the warranty period. The other three fleets are under warranty and therefore have fewer parts costs.
$0.04 $0.07 $0.08$0.15
$0.09
$0.22
$0.37$0.31
$0.29
$0.30
$0.00$0.05$0.10$0.15$0.20$0.25$0.30$0.35$0.40$0.45$0.50
KCM Foothill CC LongBeach
Average
Mai
nten
ance
Cos
t, $/
mi
Scheduled Unscheduled

53 This report is available at no cost from the National Renewable Energy Laboratory at www.nrel.gov/publications.
Figure 54. Labor and Parts costs for BEBs
Figure 55 separates the maintenance costs by vehicle system and illustrates the differences between issues encountered by each fleet. For KC Metro, much of the cost was attributed to cab, body, and accessories. For Foothill Transit, propulsion system costs were highest, followed by tire costs. County Connection issues for cab, body, and accessories were highest, followed by propulsion system costs. Long Beach had high costs for cab, body, and accessories, followed by preventive maintenance inspections. As mentioned earlier, the high labor hours for Long Beach includes some hours that should have been attributed to other systems.
System Breakdown:
• Cab, body, and accessories: Includes body, glass, cab and sheet metal, seats and doors, and accessory repairs such as hubodometers and radios
• Propulsion-related systems: Repairs for exhaust, fuel, engine, electric motors, battery modules, propulsion control, non-lighting electrical (charging, cranking, and ignition), air intake, cooling, and transmission
• Preventive maintenance inspections (PMI): Labor for inspections during preventive maintenance
• Brakes: Includes brake pads, disks, calipers, anti-lock braking system, and brake chambers
• Frame, steering, and suspension • HVAC • Lighting • Air system (general) • Axles, wheels, and drive shaft • Tires
0.24 0.220.33
0.390.29
0.02
0.23 0.06
0.05
0.09
0.000.050.100.150.200.250.300.350.400.450.50
KCM Foothill CC LongBeach
Average
Mai
nten
ance
Cos
t, $/
mi
Labor Parts

54 This report is available at no cost from the National Renewable Energy Laboratory at www.nrel.gov/publications.
Figure 55. Maintenance cost by system
To understand the differences between conventional and zero-emission technology, NREL separates the cost per mile by vehicle system. The propulsion-related systems were chosen to include only those systems of the vehicles that could be affected directly by the selection of a fuel or advanced technology. Figure 56 outlines the propulsion system cost per mile for each agency, along with an overall average. Propulsion system maintenance costs averaged $0.09 per mile. Costs for Foothill Transit reflect increases after the end of the warranty period. This is due to the addition of parts costs and the increased labor as the transit maintenance staff have taken over all troubleshooting and repairs of the new technology. One factor for the increased propulsion costs for Foothill Transit is failure of the low-voltage (starter) batteries. One known issue is that the accessories (farebox, cameras, etc.) continually draw power from these batteries. If the BEB master switch is not turned off at the end of operation, the accessories continue to draw power from the low-voltage batteries, reducing the life. The buses have two low-voltage batteries that cost around $400 for the pair. The cost for multiple replacements drives up the propulsion costs. Also, the agency has had to replace several advanced technology parts that are high-dollar parts, such as traction motors and DC-DC converters.
$0.00
$0.05
$0.10
$0.15
$0.20
$0.25
$0.30
$0.35
$0.40
$0.45
$0.50
KCM Foothill CC LongBeach
Cos
t per
mile
Tires
General air systemrepairsAxles, wheels, anddrive shaftLighting
HVAC
Frame, steering, andsuspensionBrakes
PMI
Propulsion-related
Cab, body, andaccessories

55 This report is available at no cost from the National Renewable Energy Laboratory at www.nrel.gov/publications.
Figure 56. Propulsion system maintenance costs for BEBs
Figure 57 separates the propulsion costs for each fleet by subsystem. Costs for the electric drive system were high for each fleet. The cranking/charging category costs were primarily low-voltage battery replacements. County Connection had issues with the energy storage system (ESS) in the early stage of deployment.
Figure 57. Propulsion system costs by subsystem
$0.05
$0.16
$0.10
$0.04
$0.09
$0.00
$0.02
$0.04
$0.06
$0.08
$0.10
$0.12
$0.14
$0.16
$0.18
KCM Foothill CC LongBeach
Average
Mai
nten
ance
Cos
t, $/
mi
Propulsion system costs
$0.00
$0.02
$0.04
$0.06
$0.08
$0.10
$0.12
$0.14
$0.16
$0.18
KCM Foothill CC LongBeach
Cos
t per
mile
Transmission
Electric Drive
Fuel System
Cooling
Air Intake
Cranking/charging
Electrical
ESS

56 This report is available at no cost from the National Renewable Energy Laboratory at www.nrel.gov/publications.
5.7 User Experience Survey Five drivers provided feedback on the Proterra demonstration BEB in Zion. Overall, the drivers liked the bus, but most felt it was not a good fit for Zion’s operation. Drivers liked the power and smooth acceleration of the bus and also commented on the quietness of the bus, although it made the air conditioner seem loud. One driver suggested addition of a bell or some other sound to alert bike riders to the approaching bus. Drivers liked the air conditioning but preferred the ability to open the windows to get fresh air and give the passengers a better view of the scenery. One expressed concern that having air conditioning would result in passengers riding on the bus, rather than getting out into the park.
Most drivers had issues with the size of the bus. Four drivers mentioned the bus size made it difficult to maneuver the tight turns when there was oncoming traffic. They also worried about turns when bike riders were close by. The lack of a trailer results in a lower passenger capacity. Three out of five drivers commented on the limited capacity, although one driver stated the interior width and height meant more room for standing passengers. Drivers also expressed concern about their ability to view the back door. Occasionally, they would close a door on passengers as they were trying to exit.
The most common complaints were with the driver area. All five drivers felt the controls were poorly laid out. The destination sign controls were hard to reach and the microphone didn’t work as well. Most drivers felt the seat was comfortable, but two drivers wanted an arm rest. Drivers did like the visibility through the windshield and door.
Pros:
• Good power and acceleration • Quiet • Low floor makes it easy for passengers to enter and exit • Air conditioning works well.
Cons:
• Location of driver controls not optimal • Bus size makes it difficult to maneuver tight turns • Low passenger capacity • Inability to open windows.
6 Conclusions and Next Steps Zion, Bryce, and Yosemite have elected to be early adopters of BEBs. NREL was tasked with collecting in-use data on demonstration BEBs at all three parks and has conducted real-world performance evaluations of BEBs compared to CDBs and HEBs operating in the national park fleet.
This report summarized important considerations for implementing BEBs in the three national park fleets, detailing information about current buses at each fleet, electric bus demonstration vehicles, as well as performance evaluations of BEBs in Zion, Bryce, and Yosemite. Results

57 This report is available at no cost from the National Renewable Energy Laboratory at www.nrel.gov/publications.
included in-use data collection reporting metrics such as average bus speed, energy usage per trip, and daily distance traveled, as well as effects of high HVAC system use to both heat and cool the buses, emissions estimations before and after use of electric buses, operating costs, electric vehicle infrastructure, maintenance, and bus driver user experience survey information.
Analysis results from this project will help NPS understand how BEBs and future expansion of BEBs could assist in meeting their bottom line and operational goals and assist NPS in choosing appropriate locations for future BEB deployments. Note that each analysis was tailored to the needs of each national park, and the methodology for data collection and analysis has evolved and changed over time.
Future work that could improve understanding of BEB effects at each park should consist of performing in-use data collection for new BEBs and validating actual performance on each park’s newly purchased BEBs, including Proterra buses recently purchased at all three parks. Regarding Yosemite specifically, a future study could be performed to analyze how battery range and bus operation may be affected by cold ambient temperatures. Regarding Zion specifically, a minimal charger count optimization can be performed, with various optimal charging strategies depending on that charger count, similar to the charging analysis performed for Yosemite. In addition, better understanding of charge management control costs and solutions currently available, as well as computing the respective monthly utility bill for each strategy could be performed.

58 This report is available at no cost from the National Renewable Energy Laboratory at www.nrel.gov/publications.
References [1] National Renewable Energy Laboratory, “Data and Tools | Transportation Research |
NREL,” 2018. [Online]. Available: https://www.nrel.gov/transportation/data-tools.html. [Accessed: 07-Mar-2018].
[2] National Parks Service, “Shuttle System - Zion National Park (U.S. National Park Service),” 2018. [Online]. Available: https://www.nps.gov/zion/planyourvisit/shuttle-system.htm. [Accessed: 07-Mar-2018].
[3] National Renewable Energy Laboratory, “Zion National Park Propane-to-Electric Shuttle Bus Testing | Transportation Research | NREL,” 2016. [Online]. Available: https://www.nrel.gov/transportation/fleettest-electric-zion.html. [Accessed: 07-Mar-2018].
[4] California Air Resources Board, Executive Order A-21-285. 2000.
[5] California Air Resources Board, New On-Road Heavy-Duty Engines. 2017.
[6] Proterra, “Proterra | Catalyst 40-Foot Bus Performance Specifications,” 2018. [Online]. Available: https://www.proterra.com/wp-content/uploads/2019/06/Proterra-Catalyst-40-ft-Spec-Sheet.pdf. [Accessed: 07-Mar-2018].
[7] New Flyer of America, “Xcelsior CHARGETM - New Flyer | North America’s Bus Leader | New Flyer | North America’s Bus Leader,” 2018. [Online]. Available: https://www.newflyer.com/buses/xcelsior-charge/. [Accessed: 07-Mar-2018].
[8] M. P. O’Keefe, A. Simpson, K. J. Kelly, and D. S. Pedersen, “Duty Cycle Characterization and Evaluation Towards Heavy Hybrid Vehicle Applications,” SAE Tech. Pap. 2007-01-0302, 2007.
[9] J. Campbell, W. Watts, and D. Kittelson, “Reduction of Accessory Overdrive and Parasitic Loading on a Parallel Electric Hybrid City Bus,” SAE World Congr., no. 1, pp. 1–7, 2012.
[10] A. J. Kotz, “DATA DRIVEN APPROACH TO VEHICLE EMISSIONS REDUCTION,” University of Minnesota, 2016, p. 101.
[11] “Electric vehicle charge network rates.” [Online]. Available: https://www.pge.com/en_US/large-business/solar-and-vehicles/clean-vehicles/ev-charge-network/program-participants/rates-and-billing.page. [Accessed: 14-Jul-2020].
[12] V. Grewe, K. Dahlmann, S. Matthes, and W. Steinbrecht, “Attributing ozone to NOx emissions: Implications for climate mitigation measures,” Atmos. Environ., vol. 59, no. x, pp. 102–107, Nov. 2012.
[13] US EPA, OAR, and OAQPS, “Health | Nitrogen Dioxide | US EPA,” Air and Radiation, 2014. [Online]. Available: http://www.epa.gov/airquality/nitrogenoxides/health.html. [Accessed: 01-Dec-2014].
59 This report is available at no cost from the National Renewable Energy Laboratory at www.nrel.gov/publications.
[14] J. D. Herner et al., “Effect of advanced aftertreatment for PM and NOx control on heavy-duty diesel truck emissions,” Environ. Sci. Technol., vol. 43, no. 15, pp. 5928–5933, 2009.
[15] Argonne National Laboratory, “The Greenhouse Gases, Regulated Emissions, and Energy Use in Transportation (GREET),” 2009. [Online]. Available: http://www.transportation.anl.gov/modeling_simulation/GREET/index.html.
[16] U.S. Energy Information Administration, “Utah Energy Profile Data,” 2018. [Online]. Available: https://www.eia.gov/state/data.php?sid=UT#SupplyDistribution. [Accessed: 07-Mar-2018].
[17] U.S. Energy Information Administration, “California Energy Profile Data,” 2018. [Online]. Available: https://www.eia.gov/state/data.php?sid=CA. [Accessed: 07-Mar-2018].
[18] “Wave | Wireless Advanced Vehicle Electrification | Inductive Charging.” [Online]. Available: https://waveipt.com/. [Accessed: 14-Jul-2020].
[19] “Home - Momentum Dynamics.” [Online]. Available: https://momentumdynamics.com/. [Accessed: 14-Jul-2020].
[20] L. Eudy, R. Prohaska, K. Kelly, and M. Post, “Foothill Transit Battery Electric Bus Demonstration Results,” 2014.
[21] L. Eudy and M. Jeffers, “Foothill Transit Battery Electric Bus Demonstration Results: Second Report,” 2017.
[22] L. Eudy and M. Jeffers, “Foothill Transit Battery Electric Bus Progress Report, Data Period Focus: Jul 2019 through Dec. 2019,” 2020.
[23] L. Eudy and M. Jeffers, “Foothill Transit Agency Battery Electric Bus Progress Report Data Period Focus: Jan. 2019 through Jun. 2019,” 2019.
[24] L. Eudy and Matthew Jeffers, “Foothill Transit Agency Battery Electric Bus Progress Report Data Period Focus: Jan. 2018 through Jun. 2018,” 2018.
[25] L. Eudy and M. Jeffers, “Foothill Transit Agency Battery Electric Bus Progress Report Data Period Focus: Jul. 2018 through Dec. 2018,” 2019.
[26] National Renewable Energy Laboratory, “King County Metro Battery Electric Bus Demonstration: Preliminary Project Results,” 2017.

60 This report is available at no cost from the National Renewable Energy Laboratory at www.nrel.gov/publications.
Appendix A. National Park Route Maps
Canyon Route
Springdale Route
Figure 58. Zion shuttle service map
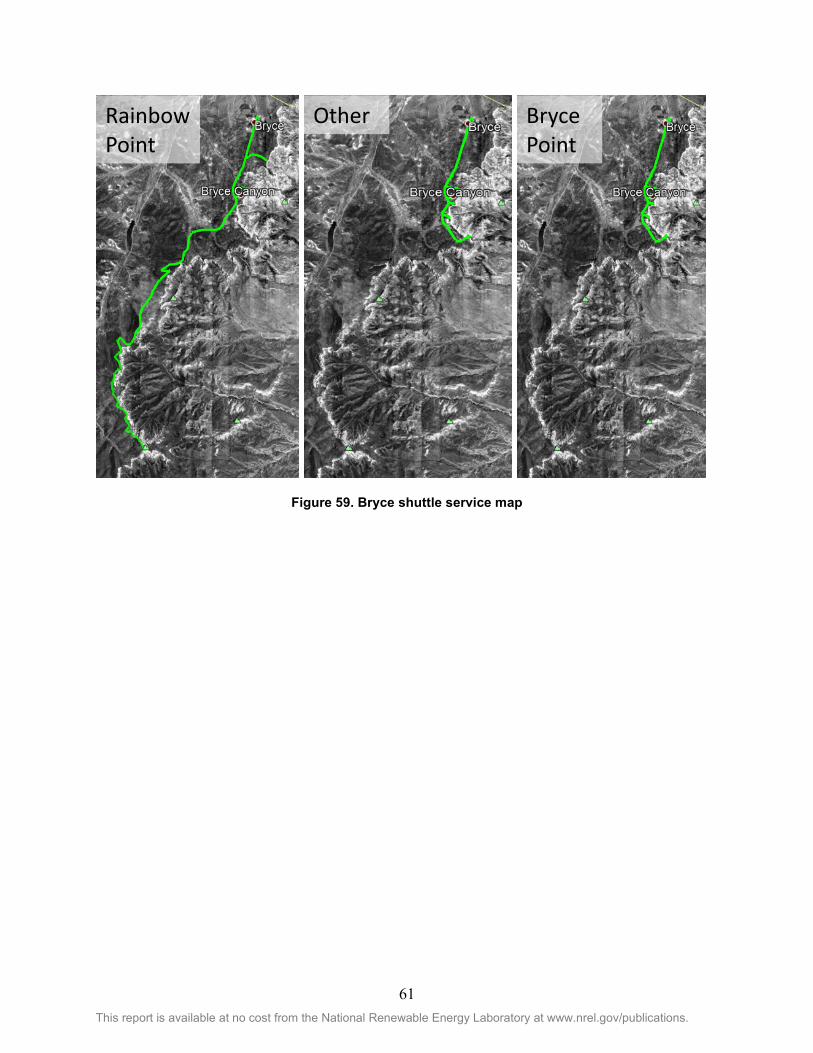
61 This report is available at no cost from the National Renewable Energy Laboratory at www.nrel.gov/publications.
Figure 59. Bryce shuttle service map
Rainbow Point
Other Bryce Point

62 This report is available at no cost from the National Renewable Energy Laboratory at www.nrel.gov/publications.
Figure 60. Yosemite Valley shuttle service map

63 This report is available at no cost from the National Renewable Energy Laboratory at www.nrel.gov/publications.
Appendix B. Data Parameters Logged Table 21. Data Parameters Logged During In-Use Data Collection Activity
Parameter Unit Parameter Unit Local date and time s Engine speed at idle, Point 1 rpm GPS time s Engine percent torque at idle, Point 1 % GPS latitude deg Engine speed at Point 2 rpm GPS longitude deg Engine percent torque at Point 2 % GPS number of Sats
Engine speed at Point 3 rpm
GPS elevation m Engine percent torque at Point 3 % GPS speed kph Engine speed at Point 4 rpm Brake switch
Engine percent torque at Point 4 %
Transmissions shift in progress
Engine speed at Point 5 rpm Transmission output shaft speed rpm Engine percent torque at Point 5 % Transmission input shaft speed rpm Engine speed at high idle, Point 6 rpm Accelerator pedal Position 1 % Engine gain (Kp) of the endspeed governor %prpm Engine percent load at current speed % Engine reference torque Nm Actual maximum available torque % Engine trip fuel L Engine torque mode
Engine coolant temperature °C
Driver's demand engine torque % Engine fuel temperature 1 °C Actual engine - percent torque % Engine oil temperature 1 °C Engine speed rpm Engine intercooler temperature °C Engine starter mode
Engine fuel delivery pressure kpa
Transmission selected gear
Engine oil pressure kpa Transmission actual gear ratio
Parking brake switch
Transmission current gear
Wheel-based vehicle speed kph Transmission requested range
Brake switch
Transmission current range
Cruise control accelerate switch
Engine exhaust gas recirc. mass flow kgph Engine fuel rate Lph Engine intake air mass flow rate kgph Barometric pressure kpa Engine protect lamp data
Ambient air temperature °C
Engine amber warning lamp data
Engine air intake temperature °C Engine red stop lamp data
Engine intake manifold #1 pressure kpa
Engine exhaust gas recirculation temp. °C Engine intake manifold #1 temperature °C Air compressor status
Engine air intake pressure kpa
Estimated percent fan speed % Transmission oil temperature °C Fan drive state
Engine gas supply pressure kpa
Front axle speed kph High-resolution total vehicle distance km Amber warning lamp status
Engine total idle fuel used L
Nominal friction - percent torque % Engine total idle hours h Aftertreatment exhaust gas mass flow kgph Engine total hours of operation h

64 This report is available at no cost from the National Renewable Energy Laboratory at www.nrel.gov/publications.
Appendix C. Zion Fleet Charging Analysis
Figure 61. Zion fleet charging – no charge management

65 This report is available at no cost from the National Renewable Energy Laboratory at www.nrel.gov/publications.
Figure 62. Zion fleet charging – charge management