national park service beach nourishment guidance
TRANSCRIPT

National Park Service Beach Nourishment Guidance
Natural Resource Technical Report NPS/NRSS/GRD/NRTR—2012/581
National Park Service U.S. Department of the Interior Natural Resource Stewardship and Science

ON THE COVER Top: Canaveral National Seashore, Florida (NPS photograph)
Bottom Left: Golden Gate National Recreation Area, California (NPS photograph)
Bottom Right: Kemp’s ridley sea turtle (Lepidochelys kempii), Gulf Islands National Seashore, Florida (NPS photograph)

National Park Service Beach Nourishment Guidance
Natural Resource Technical Report NPS/NRSS/GRD/NRTR—2012/581
Kate Dallas
GSA Guest Scientist
Jodi Eshleman
National Park Service
Geologic Resources Division
200 Chestnut St.
U.S. Custom House, 3rd
Floor
Philadelphia, PA 19147
Rebecca Beavers
National Park Service
Geologic Resources Division
12795 West Alameda Parkway
Lakewood, Colorado 80228
September 2012
U.S. Department of the Interior
National Park Service
Natural Resource Stewardship and Science
Fort Collins, Colorado

ii
The National Park Service, Natural Resource Stewardship and Science office in Fort Collins,
Colorado publishes a range of reports that address natural resource topics of interest and
applicability to a broad audience in the National Park Service and others in natural resource
management, including scientists, conservation and environmental constituencies, and the public.
The Natural Resource Report Series is used to disseminate high-priority, current natural resource
management information with managerial application. The series targets a general, diverse
audience, and may contain NPS policy considerations or address sensitive issues of management
applicability.
All manuscripts in the series receive the appropriate level of peer review to ensure that the
information is scientifically credible, technically accurate, appropriately written for the intended
audience, and designed and published in a professional manner.
This report was reviewed as informative scientific information by subject-matter experts who
were not directly involved in the collection, analysis, or reporting of the data.
Views, statements, findings, conclusions, recommendations, and data in this report do not
necessarily reflect views and policies of the National Park Service, U.S. Department of the
Interior. Mention of trade names or commercial products does not constitute endorsement or
recommendation for use by the U.S. Government.
This report is available from the Geologic Resources Division
(http://www.nature.nps.gov/geology) and the Natural Resource Publications Management
website (http://www.nature.nps.gov/publications/nrpm).
Please cite this publication as:
Dallas, K. L., J. Eshleman, and R. Beavers. 2012. National Park Service beach nourishment
guidance. Natural Resource Technical Report NPS/NRSS/GRD/NRTR—2012/581. National
Park Service, Fort Collins, Colorado.
NPS 909/114346, September 2012

iii
Contents
Page
Figures..................................................................................................................................................... ..vii
Tables ......................................................................................................................................................... ix
Acknowledgments..................................................................................................................................... xii
Introduction ..................................................................................................................................................1
Purpose ................................................................................................................................................ 1
Topics Covered .................................................................................................................................... 1
Disclaimer ............................................................................................................................................ 2
NPS Policy Considerations ..........................................................................................................................3
Preservation of Natural Systems .......................................................................................................... 3
Restoration of Human-Disturbed Systems .......................................................................................... 4
Wetland Policy ..................................................................................................................................... 4
Wetland Excepted Actions............................................................................................................... 5
Floodplain Policy ................................................................................................................................. 6
Revegetation and Landscaping ............................................................................................................ 6
Borrow Pits and Dredge Spoil Areas ................................................................................................... 6
Biological Resource Management ....................................................................................................... 7
Legal Authority and Jurisdiction ......................................................................................................... 7
Sediment Properties for Beach Nourishment ...............................................................................................9
Grain Size Compatibility ..................................................................................................................... 9
Overfill Factor Compatibility ............................................................................................................ 12
Sediment Color Compatibility ........................................................................................................... 13
Composite Mineralogy ...................................................................................................................... 13
Organic Content ................................................................................................................................. 14
Sediment Contamination ................................................................................................................... 14
Foreign Matter ................................................................................................................................... 14

iv
Contents (continued)
Page
Selecting Native Material for Compatibility Analysis ...................................................................... 14
Nearshore Sediment Placement .................................................................................................................17
Offshore Borrow Areas ..............................................................................................................................19
Project Design Considerations to Reduce Environmental Impacts ...........................................................21
Turbidity ............................................................................................................................................ 21
Placement Design .............................................................................................................................. 21
Placement Geometry ..................................................................................................................... 21
Volume .......................................................................................................................................... 22
Coverage ....................................................................................................................................... 23
Compaction ................................................................................................................................... 23
Construction .................................................................................................................................. 24
Project Timing ................................................................................................................................... 24
Minimizing Impact to Benthic Invertebrate Populations ................................................................... 24
Monitoring Program...................................................................................................................................27
Seasonality ......................................................................................................................................... 27
Frequency .......................................................................................................................................... 27
Duration ............................................................................................................................................. 28
Monitoring Components .................................................................................................................... 28
Topographic Surveys .................................................................................................................... 28
Visual Beach Inspections .............................................................................................................. 29
Sediment Samples.......................................................................................................................... 29
Turbidity Monitoring .................................................................................................................... 29
Aerial Photography ....................................................................................................................... 30
Bathymetric Surveys...................................................................................................................... 30
Wave, Current, and Water Level Measurements .......................................................................... 30
Sea Turtle Monitoring ................................................................................................................... 31

v
Contents (continued)
Page
Macro-Invertebrate Sampling ....................................................................................................... 31
Other Biological Resources .......................................................................................................... 32
Permits and Regulations ............................................................................................................................33
References ..................................................................................................................................................35
Appendix A: State Beach Nourishment Policies .......................................................................................41
Appendix B: Case Study – North End Restoration Project, Assateague Island National Seashore,
MD .............................................................................................................................................................51
Project Description ............................................................................................................................ 51
Measures of Project Success .............................................................................................................. 51
Monitoring Program .......................................................................................................................... 52
Lessons Learned: Potential Pitfalls .................................................................................................... 53
Placement Location ...................................................................................................................... 53
Sediment Size Distribution ............................................................................................................ 53
Model Parameters ......................................................................................................................... 54
Lessons Learned: Success Stories ..................................................................................................... 55
Placement Timing ......................................................................................................................... 55
Mechanical Bypassing Method ..................................................................................................... 55
Importance of Long-Term Monitoring .......................................................................................... 55
Appendix C: Case Study – Perdido Key, FL in Gulf Islands National Seashore ......................................57
Project Description ............................................................................................................................ 57
Monitoring Program .......................................................................................................................... 57
Lesson Learned from Monitoring: Beach Width .......................................................................... 58
Monitoring for Future Nourishment Projects .................................................................................... 58
Design Considerations for Future Projects at Perdido Key ............................................................... 59
Littoral Zone Placement ............................................................................................................... 59
Mid-island Placement ................................................................................................................... 59

vi
Contents (continued)
Page
Seasonal Timing ............................................................................................................................ 59
Beach Configuration ..................................................................................................................... 59

vii
Figures
Page
Figure 1. Erosion currently threatens historic Fort Massachusetts in Gulf Islands National
Seashore, Mississippi. A restoration plan calls for sediment placement to supplement the eroded
shoreline and help stabilize the foundation of the fort (Photograph by B. Webster)...................................3
Figure 2. Beach nourishment was implemented at Assateague Island National Seashore,
Maryland to mitigate for some of the sediment lost from the beach since construction of the
Ocean City Inlet jetties (Photograph by the U.S. Army Corps of Engineers). ............................................4
Figure 3. Prisoner’s Harbor on Santa Cruz Island, Channel Islands National Park, California
(Photograph by K. Noon). ............................................................................................................................4
Figure 4. Close-up image of beach sand, Golden Gate National Recreation Area, California
(Photograph by P. Barnard). ........................................................................................................................9
Figure 5. Grain size distribution curves from a restoration project in Gulf Islands National
Seashore, Mississippi (Figure adapted from USACE 2010a). ...................................................................10
Figure 6. Natural sediment variability offshore Golden Gate National Recreation Area,
California (Photograph by P. Barnard). .....................................................................................................13
Figure 7. Map of existing and proposed nearshore placement areas at Beaufort Inlet, North
Carolina. Shackleford Banks, a barrier island to the east of the inlet, is part of Cape Lookout
National Seashore (Figure adapted from USACE 2010b). ........................................................................17
Figure 8. Excavator placing sediment along the Lake Michigan shoreline, Indiana Dunes
National Lakeshore, Indiana (NPS photograph). .......................................................................................21
Figure 9. Proposed sand slurry pipeline at Gateway National Recreation Area, New Jersey.
Sand would be removed from accreting Gunnison Beach and deposited in the eroding critical
zone. Burial of biological resources is unlikely because only ~1530 m3 (~2000 yd
3) of sand will
be removed/filled per day (Figure from USFWS 2005). ...........................................................................22
Figure 10. Ghost crab at Padre Island National Seashore, Texas (NPS photograph). ..............................25
Figure 11. A federally-listed threatened and endangered species, a Piping plover (Charadrius
melodus) chick, in Cape Cod National Seashore, Massachusetts. Beaches in the seashore serve as
critical breeding habitat (NPS photograph). ..............................................................................................28
Figure 12. Beach profiles at Ocean Beach collected using an ATV-mounted GPS, Golden Gate
National Recreation Area, California (Figure by J. Hansen). ....................................................................28

viii
Figures (continued)
Page
Figure 13. Bathymetric change from 1974–2009 at Beaufort Inlet, North Carolina, adjacent to
Cape Lookout National Seashore (Figure adapted from USACE 2010a). ................................................30
Figure 14. Kemp’s ridley sea turtle (Lepidochelys kempii), a federally-listed endangered species,
Padre Island National Seashore, Texas (NPS photograph). .......................................................................31
Figure 15. Aerial image looking south showing Ocean City Inlet and eroded Assateague Island
at the top of the image (Photograph by Jane Thomas, IAN Image Library;
www.ian.umces.edu/imagelibrary) ............................................................................................................51
Figure 16. Location map of the North End Restoration Project, Assateague Island National
Seashore, MD (Figure from Schupp et al. 2007). ......................................................................................52
Figure 17. Monitoring data illustrated that the shoreline section directly onshore of the sediment
placement site became highly and unnaturally accretional, signaling the need for a change in
placement site at ASIS (Figure from Schupp et al. 2007). ........................................................................54
Figure 18. Unexpected conditions led to a loss of overwash processes and a sheltered island
interior at ASIS, fostering vegetation succession and dune growth (NPS photograph). ...........................54
Figure 19. A hopper dredge placing sediment on and just seaward of the nearshore bar at ASIS.
Waves and currents move the sediment onto the shoreline (NPS photograph). ........................................55
Figure 20. Perdido Key Beach in Gulf Islands National Seashore, Florida (NPS photograph). ..............57
Figure 21. Location map of Perdido Key, Gulf Islands National Seashore, Florida. ...............................57
Figure 22. Average profiles (based on 7 profiles) within the nourishment area, Gulf Islands
National Seashore, Florida (Figure from Work and Dean 1992). ..............................................................58

ix
Tables
Page
Table 1. U.S. standard sieve sizes. Information from King and Galvin (2002). .......................................10
Table 2. U.S. Army Corps of Engineers’ Coastal Engineering Manual recommended grain size
compatibility limits (Gravens et al., 2008). ...............................................................................................11
Table 3. Florida and North Carolina state requirements for beach nourishment sediment.
Requirements are from the Florida Administration Code (2001) and North Carolina
Administration Code (2007). .....................................................................................................................12
Table 4. Information sources for state beach nourishment policies. Table adapted from
USDOC/NOAA (2000). .............................................................................................................................41

xi
Acknowledgments
We thank Riley Hoggard (National Park Service; NPS), Bridget Lussier (Applied Technology &
Management), Julia Brunner (NPS), Courtney Schupp (NPS), Tracy Rice (Terraqueous Management &
Research Group), Mark Messersmith (U.S. Army Corps of Engineers, Charleston), Andrew Coburn
(Western Carolina University), S. Jeffress Williams (U.S. Geological Survey, Emeritus) and many state
agencies for your insightful discussions, recommendations and willingness to share previous studies and
lessons learned. We thank Courtney Schupp (NPS) for providing the case study presented in Appendix
B. The lead author of the report was supported through the Geological Society of America’s (GSA)
GeoCorps America Program with funding from the NPS Geologic Resources Division. Mike Cook
(also a GSA scientist) did extensive research on state requirements. We gratefully acknowledge the
many detailed reviews by NPS staff, subject matter experts, and external peers.


1
Introduction
The National Park System (NPS) incorporates 85 coastal park units, including national parks, seashores,
lakeshores, recreation areas, monuments, preserves, historic sites, and memorials. These areas contain
over 19,000 km (12,000 mi) of shoreline, iconic American features, and a wide variety of geological,
biological, and cultural resources. To protect and preserve National Park coastal resources, a clear
approach to coastal sediment management based on sound coastal science and engineering is needed.
Purpose This manual is intended to be used as guidance by NPS staff to better plan and manage beach
nourishment projects when beach nourishment has been determined to be consistent with NPS
Management Policies. This manual provides tools for resource managers to interface with partners that
are completing technical designs and outlines best management practices that can be utilized to avoid or
minimize potential adverse impacts. These tools and practices provide a consistent approach to
proposed beach nourishment projects, but also contain the flexibility for different outcomes as
appropriate based on specific park conditions and mandates. An informed, unified approach is
necessary to protect coastal resources and adaptively manage these locations for future generations,
especially in the face of weather variability and directional climate change. This guidance focuses on
managing shoreline and nearshore sediment nourishment projects, but does not provide detailed
information on technical design for projects. Project design should be tailored to individual project
goals and site conditions, and requires the expertise of a professional specializing in this type of work.
Coastal structures (seawalls, groins, breakwaters, jetties, etc.) and dredging also are not addressed in this
manual. However, many of the best management practices presented can be applied to these activities.
Coastal structures and dredging can have potentially significant consequences for coastal ecosystems
and require professional consultation.
The information in this manual was compiled from federal and state regulations, peer-reviewed and
other publications, best management practices, other agency requirements, NPS regions for which
extensive information was available, and experience with past projects. Because of the diversity of park
units, the topics addressed in the manual will not always apply for a site-specific project. These topics
present a starting point for discussion related to beach nourishment within the NPS and discussion with
other agencies and partners. The suggested actions provide useful information to parks considering,
analyzing, and/or developing planning documents that include beach nourishment.
Topics Covered Topics addressed in this report include:
Federal and state regulations;
Existing NPS regulations and policy;
General project design considerations;
Sediment properties for beach nourishment;
Nearshore sediment placement;
Offshore borrow sources;
Physical and biological monitoring; and
Beach nourishment case studies.

2
Disclaimer The information contained within this document is intended only to improve the internal management of
the NPS. It does not replace or supplant applicable laws, regulations, or other authorities. This
document does not create new NPS policy; instead it provides guidance for implementing existing NPS
policy. It is not intended to, and does not, create any right or benefit, substantive or procedural,
enforceable at law or equity by a party against the United States, its departments, agencies,
instrumentalities or entities, its officers or employees, or any other person.

3
NPS Policy Considerations
The 2006 NPS Management Policies (NPS 2006) provide important considerations for evaluating when
beach nourishment should, or should not, take place in a park unit. In some park areas, the resources
and processes function naturally. In other areas, human-caused impacts may require some degree of
restoration or mitigation. These situations, and how the relevant policies apply to proposed beach
nourishment projects, are explained below.
Preservation of Natural Systems In parks with “natural shoreline processes (such as erosion, deposition, dune formation, overwash, inlet
formation, and shoreline migration),” these processes “will be allowed to continue without interference”
(NPS Management Policies § 4.8.1.1, 2006).
The policies do allow intervention in natural geologic processes in certain situations, specifically when:
“Directed by Congress;
Necessary in emergencies that threaten human life and property;
There is no other feasible way to protect natural resources, park facilities, or historic properties;
or
Intervention is necessary to restore impacted conditions and processes, such as restoring habitat
for threatened or endangered species”
(NPS Management Policies § 4.8.1,
2006).
Beach nourishment is a type of intervention.
Therefore, any beach nourishment proposed in
park areas with natural shoreline processes
must meet one or more of the above
requirements to be deemed compatible with §
4.8.1 and § 4.8.1.1. This determination must
utilize the results of any applicable scientific
research, as required by NPS Management
Policies § 2.1.2 (NPS 2006) (also see 16
U.S.C. § 5936). Additionally, any sediment
placement shall be carried out in a way that
ensures that park resources and values remain
unimpaired, in order to comply with the NPS
Organic Act, 16 U.S.C. § 1, and with NPS
Management Policies § 1.4.2 (NPS 2006).
Other policies potentially relevant to beach nourishment proposals require that park landscapes
“disturbed by natural phenomena, such as landslides, earthquakes, floods, hurricanes, tornadoes, and
fires, will be allowed to recover naturally” unless manipulation (which includes beach nourishment) is
necessary to:
Mitigate for excessive disturbance caused by past human effects;
Figure 1. Erosion currently threatens historic Fort Massachusetts in Gulf Islands National Seashore, Mississippi. A restoration plan calls for sediment placement to supplement the eroded shoreline and help stabilize the foundation of the fort (Photograph by Bob Webster).

4
Preserve cultural and historic resources as appropriate based on park planning documents; or
Protect park developments or the safety of people.
(See NPS Management Policies § 4.1.5; also see NPS Management Policies § 4.4.2.4).
Restoration of Human-Disturbed Systems Where human activities or structures have
altered coastal dynamics, ecosystems, tidal
regimes and sediment transport rates (e.g.
Figure 1), the applicable NPS policy is
different than the policy explained in the
previous section. Activities and structures that
alter shoreline processes include structures
constructed both parallel (seawalls,
breakwaters, revetments, bulkheads) and
perpendicular (jetties, groins) to the shoreline,
dredged harbors and navigation channels, and
dredging or disposal of sediments within and
beyond the littoral system. In these situations,
the NPS policy is to investigate, in
consultation with appropriate state and federal
agencies, alternatives for “mitigating the effects
of such activities or structures and for restoring
natural conditions” (NPS Management Policies
§ 4.8.1.1, 2006). NPS restoration actions in human-disturbed areas seek to return the area to the “natural
conditions and processes characteristic of the ecological zone in which the damaged resources are
situated,” (NPS Management Policies § 4.1.5; also see § 4.4.2.4, 2006). Beach nourishment to restore
shoreline processes, areas disturbed by sediment extraction, and habitat, is an example of this policy
(e.g. Figure 2). Throughout the restoration process the NPS will comply with all local, state, and federal
laws and regulations.
Wetland Policy NPS wetland protection policies are found in
NPS Management Policies § 4.6.5 (NPS
2006). NPS Procedural Manual (P.M.) #77-1:
Wetland Protection (NPS 2012c) establishes
procedures for implementing these policies.
Projects that involve sediment restoration in
the intertidal zone are subject to NPS wetland
protection policies and procedures because
estuarine or marine intertidal zones (including
beach areas between the extreme high and
extreme low spring tidal elevations) are
defined as wetlands under P.M. #77-1.
Figure 3. Prisoner’s Harbor on Santa Cruz Island, Channel Islands National Park, California (Photograph by K. Noon).
Figure 2. Beach nourishment was implemented at Assateague Island National Seashore, Maryland to mitigate for some of the sediment lost from the beach since construction of the Ocean City Inlet jetties (Photograph by the U.S. Army Corps of Engineers).

5
The NPS has a “no net loss of wetlands” policy and strives to achieve a net gain of wetlands through
restoration (NPS Management Policies § 4.6.5, 2006). Where wetlands have been degraded due to
previous or ongoing human actions (e.g. Figure 3), the NPS will, to the extent practicable, restore them
to pre-disturbance conditions. For new activities, that are either located in or otherwise could have
adverse impacts on wetlands, the NPS will employ the following sequence:
Avoid adverse wetland impacts to the extent practicable;
Minimize impacts that cannot be avoided; and
Compensate for remaining unavoidable adverse wetland impacts by restoring wetlands that have
been previously destroyed or degraded.
Compensation for wetland impacts or losses requires that at least one acre of wetlands be restored for
each acre destroyed or degraded (NPS Management Policies § 4.6.5, 2006). Greater than 1:1
compensation may be required when the wetlands being impacted are of high quality or exceptional value,
when it will take a number of years for the restored site to become fully functional, or when the likelihood
of full restoration success is unclear (P.M. #77-1§ 5.2.3). All actions proposed by the NPS that have the
potential to cause adverse impacts on wetlands require NEPA compliance. If the action will result in
adverse impacts on wetlands, a Wetland Statement of Findings must be prepared, circulated for public
review and comment, and approved in accordance with NPS wetland protection procedures (P.M. #77-
1§ 5.3.4 and 5.3.5).
Wetland Excepted Actions
Section 4.2 of P.M. #77-1 addresses actions that may qualify as “excepted” from the Wetland Statement
of Findings and wetland compensation requirements (P.M. #77-1 § 5.2.3, 5.3.4 and 5.3.5). Section 4.2.1
(h) states that actions designed specifically for the purpose of restoring degraded (or completely lost)
natural wetland, stream, riparian, or other aquatic habitats or ecological processes may be excepted. For
purposes of this exception, "restoration" refers to reestablishing environments in which natural
ecological processes can, to the extent practicable, function at the site as they did prior to disturbance.
Proposed restoration actions that will result in a net loss of wetland habitat cannot be excepted under
Section 4.2.1 (h).
For an action to be excepted from the Wetland Statement of Findings and compensation requirements,
the conditions and best management practices (BMPs) referred to in P.M. #77-1 Section 4.2.2 must be
satisfied. If one or more of these conditions or BMPs are not met, then the action reverts to full
compliance with P.M. #77-1. Exceptions do not imply exemption from the Clean Water Act, Section
7(a) of the Wild and Scenic Rivers Act, Section 10 of the Rivers and Harbors Act, the Endangered
Species Act, the National Environmental Policy Act (NEPA), or other laws, regulations, or procedures
governing NPS activities.
If a project is determined to qualify as an “excepted action,” then wetland analyses are addressed in the
NEPA compliance document. Examples of analyses include wetland delineations, impacts and benefits
of the proposed actions to wetland physical and biological functions, maps and acreages of existing
versus restored wetlands (by wetland type), sediment composition, soil type, grain size and color
analyses, contaminants analyses, and effects on wetland and wetland-dependent flora and fauna. For
projects that deal with intertidal wetland habitat, the extreme high and extreme low spring tidal
elevations should be used to define the boundaries and acreages of wetlands. The NEPA compliance

6
documentis also the place to address compliance with other requirements of P.M. #77-1, including
explanations of avoidance and minimization of wetland impacts to the extent practicable and
explanation of why the project was determined to qualify as an “excepted action.”
Floodplain Policy The NPS will manage for the preservation of floodplain values and minimize potentially hazardous
conditions associated with flooding. Specifically, NPS Management Policies § 4.6.4 (2006) states the
NPS will:
Protect, preserve, and restore the natural resources and functions of floodplains;
Avoid the long- and short-term environmental effects associated with the occupancy and
modification of floodplains; and
Avoid direct and indirect support of floodplain development and actions that could adversely
affect the natural resources and functions of floodplains or increase flood risks.
When it is not practicable to locate or relocate development or inappropriate human activities to a site
outside and not affecting the floodplain, the NPS will:
Prepare and approve a Floodplain Statement of Findings, in accordance with procedures
described in D.O. #77-2: Floodplain Management;
Use nonstructural measures as much as practicable to reduce hazards to human life and property
while minimizing the impact to the natural resources of floodplains; and
Ensure that structures and facilities are designed to be consistent with the intent of the standards
and criteria of the National Flood Insurance Program.
Revegetation and Landscaping Any surplus soils or sediments from construction activities within the park may be used for the
restoration of other degraded areas in the park, if it is determined that the use of the in-park source will
not significantly affect cultural or natural resources or ecological processes (NPS Management Policy §
9.1.3.2, 2006). Soils or sediments imported from inside or outside park boundaries must be:
Compatible with existing soils or sediments;
Free of undesired seeds and organisms; and
Fulfill the horticultural requirements of plants used for restoration.
Borrow Pits and Dredge Spoil Areas Parks should use existing borrow sites or create new sites in the park only after developing and
implementing a park-wide borrow management plan that addresses the cumulative effects of borrow site
extraction, restoration, and importation. NPS Management Policy § 9.1.3.3 (2006) requires that
materials from borrow pits, quarries, and other clay, stone, gravel, or sand sources on NPS lands,
including submerged lands, will be extracted and used only:
By the Park Service or its agents or contractors;
For in-park administrative uses;
After compliance with other applicable federal, state, and local requirements; and

7
After compliance with the NEPA and National Historic Preservation Act (NHPA), including
written findings that:
o Extraction and use of in-park borrow materials does not or will not impair park resources
or values;
o It is the park’s most reasonable alternative based on economic, environmental, and
ecological considerations; and
o No outside sources are reasonably available.
Dredged material may be used for beach nourishment or another resource management activity only if
the superintendent first finds that the proposed nourishment or activity will not impair park resources
and values and that the proposed activity is consistent with park planning documents (NPS Management
Policies § 9.1.3.3, 2006). The development of new dredge spoil areas or borrow pits, or the expansion
of existing ones, will be analyzed through the NEPA and NHPA processes. In addition, dredging and/or
placement activities must meet the requirements of appropriate laws, regulations, executive orders, and
related guidance, including, but not limited to, the Endangered Species Act, P.M. #77-1, D.O. #77-2,
and sections 401 and 404 of the Clean Water Act.
Biological Resource Management The National Park Service will maintain all plants and animals native to park ecosystems by (NPS
Management Policies § 4.4.1, 2006):
Preserving and restoring the natural abundances, diversities, dynamics, distributions, habitats,
and behaviors of native plant and animal populations and the communities and ecosystems in
which they occur;
Restoring native plant and animal populations in parks when they have been extirpated by past
human-caused actions; and
Minimizing human impacts on native plants, animals, populations, communities, and
ecosystems, and the processes that sustain them.
Native species are defined as all species that have occurred, now occur, or may occur as a result of
natural processes on national park lands (NPS Management Policies § 4.4.1.3, 2006).
Legal Authority and Jurisdiction A new reference manual has been developed to help NPS coastal park managers understand their legal
and regulatory authorities. For jurisdictional guidance on a broad array of ocean and coastal topics see
the Ocean and Coastal Park Jurisdiction Reference Manual #39-1 (NPS 2011).


9
Figure 4. Close-up image of beach sand, Golden Gate National Recreation Area, California (Photograph by P. Barnard).
Sediment Properties for Beach Nourishment
Sediment used for beach nourishment (Figure 4) should
ideally be indistinguishable from native site sediment in terms
of color, shape, size, mineralogy, compaction, organic
content, and sorting. However, typically fill material does not
exactly match the native sediment and a compatibility
analysis is necessary to consider the similarity. This section
presents factors that are used to assess sediment
compatibility, including grain size, overfill factor, color,
mineralogy, organic content, sediment contamination, and
foreign matter.
Grain Size Compatibility Sediment grain size is the single most important borrow
material characteristic (Gravens et al. 2008). The grain size
will affect the shape of the nourished beach, the rate at which
fill material is eroded from the project, and the biological habitat. Coarse sediments will provide greater
resistance to erosion, but may reduce recreational value to users of the beach or impact biological
habitat, such as sea turtle nesting ability. The goal for nourishment is to choose sediment that best
matches the native material of the beach to help reduce any unintended consequences that could result
from modification.
To analyze for grain size, the native beach should be sampled throughout the length and width of the
project area and include samples collected along cross-shore transects from the berm crest (or mean high
water line) to a water depth corresponding to the position of the typical storm bar (Gravens et al. 2008).
The purpose of sampling across the beach and into the nearshore is to capture the zone of active
sediment processes. If cross-shore composites exhibit a wide range of median grain size and standard
deviation values, an alongshore composite should be calculated for the entire project domain to reduce
the variability (Gravens et al. 2008). All sediment samples should be taken from the surface to some
predetermined depth and then mixed thoroughly before analysis to ensure representative sediment
sampling. Subaqueous borrow areas should be sampled for grain size through physical sampling, such
as coring, in a similar manner to that described for the native beach.
Grain size compatibility between borrow and native sediment is determined by comparing the grain size
distributions (sand grain frequency, mean and median grain size, and standard deviation). Grain size
characteristics are quantified based on sieve analyses of samples, from which particle size distribution
curves can be graphed (Figure 5). Table 1 presents information on U.S. standard sieve sizes.
10
Table 1. U.S. standard sieve sizes. Information from King and Galvin (2002).
U.S. Standard Sieve Opening (mm) Unified Soil
Classification System
Greater than 12 in. Greater than 300 Boulder
3 in. to 12 in. 75 to 300 Cobble
¾ in. to 3 in. 19 to 75 Coarse Gravel
#4 to ¾ in. 4.75 to 19 Fine Gravel
#10 to #4 2 to 4.75 Coarse Sand
#40 to # 10 0.425 to 2 Medium Sand
#200 to # 40 0.075 to 0.425 Fine Sand
#230 to # 200 0.0625 to 0.075 Fine-Grained Soil
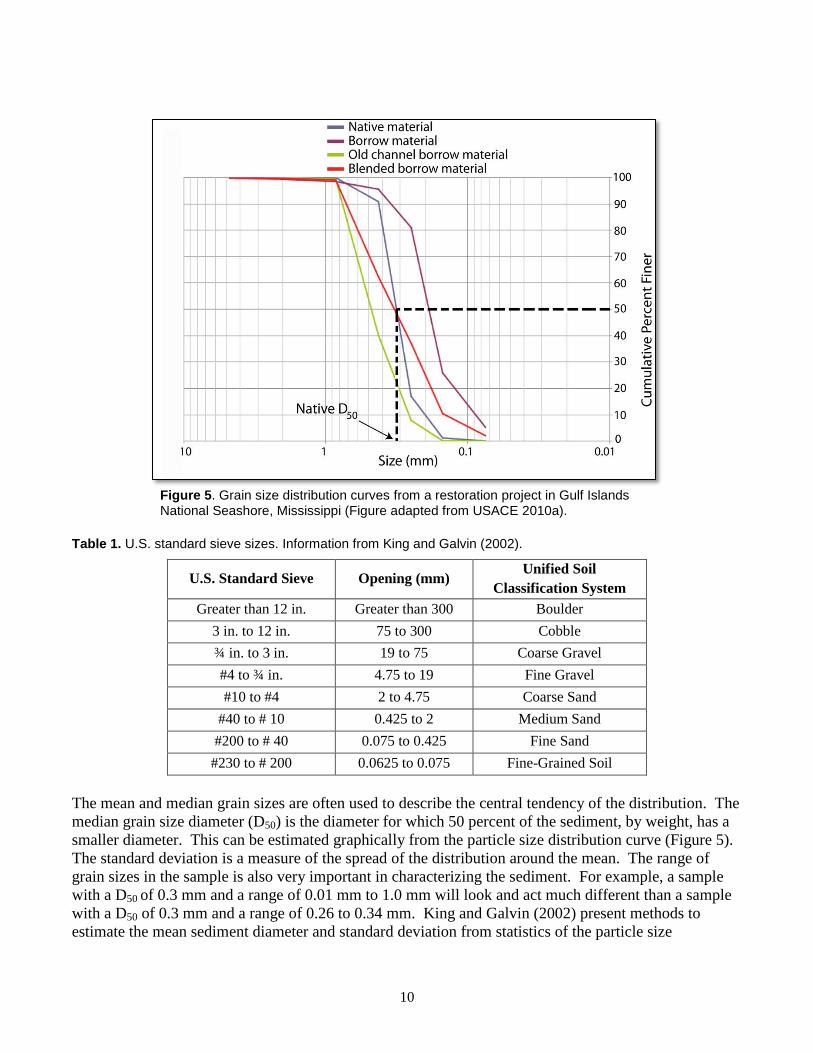
The mean and median grain sizes are often used to describe the central tendency of the distribution. The
median grain size diameter (D50) is the diameter for which 50 percent of the sediment, by weight, has a
smaller diameter. This can be estimated graphically from the particle size distribution curve (Figure 5).
The standard deviation is a measure of the spread of the distribution around the mean. The range of
grain sizes in the sample is also very important in characterizing the sediment. For example, a sample
with a D50 of 0.3 mm and a range of 0.01 mm to 1.0 mm will look and act much different than a sample
with a D50 of 0.3 mm and a range of 0.26 to 0.34 mm. King and Galvin (2002) present methods to
estimate the mean sediment diameter and standard deviation from statistics of the particle size
Figure 5. Grain size distribution curves from a restoration project in Gulf Islands National Seashore, Mississippi (Figure adapted from USACE 2010a).

11
distribution.
Beach nourishment projects should use fill material with a composite grain size distribution similar to
that of the native beach material. Ideally, the median size of the borrow sediment should not be less
than the median of the native material and the spread of sizes in the borrow distribution should not
exceed that of the native sediment (King and Galvin 2002). However, this is not always possible due to
limitations in available borrow sites or incorporation of beneficial reuse sediment. On severely eroded
beaches it is possible that the native distribution could be skewed toward the coarse sediments if the
fines (silts and clays) have been eroded away (King and Galvin 2002). As a general recommendation,
suitable material will have grain sizes that range from fine to very coarse sand with limited amounts
(less than 10%) of very fine sand, silt, and clay. Sediment with less than 10% fines may help reduce
turbidity and biological impacts to beach fauna (see Turbidity section) (Greene 2002). Excessive coarse
material and shell hash should also be avoided because it can alter habitat characteristics and impair
shorebird feeding (Peterson et al. 2006). The U.S. Army Corps of Engineers’ Coastal Engineering
Manual (CEM) (Gravens et al. 2008) recommends limits on grain size variation between native and
borrow sediments (Table 2).
Table 2. U.S. Army Corps of Engineers’ Coastal Engineering Manual recommended grain size compatibility limits (Gravens et al. 2008).
Native Median
Grain Diameter
Compatible Borrow Median
Grain Diameter
> 0.2 mm within ± 0.02 mm
0.15–0.2 mm within ± 0.01 mm
< 0.15 mm at least as coarse as native
Some states, such as Florida and North Carolina, have detailed, quantitative requirements regarding
sediment compatibility (Table 3). North Carolina also has state regulations regarding sediment
compatibility sampling techniques. These requirements can be used as general guidelines for beach
nourishment projects in other states. However, it is important to consider the native sediment size
carefully when reviewing other state regulations, since these were developed for the native sediment in
that specific state. Parks in other states should check with the lead coastal management agency in their
state (see Appendix A) for any relevant requirements and adhere to the recommendations outlined in this
report for consistency and best management practices. Appendix A provides information related to state
beach nourishment requirements and policies.

12
Table 3. Florida and North Carolina state requirements for beach nourishment sediment. Requirements are from
the Florida Administration Code (2001) and North Carolina Administration Code (2007).
*Note – As of May 2012, North Carolina has included these requirements into state law, but has not integrated them into the
state’s federally approved coastal management program.
Overfill Factor Compatibility Typically, the design of beach fill projects aims to compensate for the grain size differences between
borrow sand and native sand by overfilling with borrow sand and assuming that a portion of the fine
material will wash out by wave action (King and Galvin 2002). The overfill factor is used to roughly
estimate the volume of fill material needed to produce a unit volume of material on the native beach
after grain sorting losses (Gravens et al. 2008). For example, an overfill factor of 1.2 indicates that 120
m3 (or yd
3) of fill sediment must be placed to yield 100 m
3 (or yd
3) of residual fill on the beach.
Expressed in another way, this means that 1/1.2 = 83% of the borrow material is expected to remain as
residual beach fill. The overfill calculation provides only an approximate volume estimation and should
not be used in the final design process for volume calculations because it does not take into account any
coastal processes (Gravens et al. 2008).
The overfill factor can also be used to assess the general suitability of fill material or to compare the
relative merits of different borrow sites. The overfill factor is usually calculated using the Krumbein-
James technique (Gravens et al. 2008). Dean (1974) offers another method for computing the overfill
factor, which typically yields lower estimates of the overfill factor. The CEM presents a graphical
method of calculating the overfill factor from mean and standard deviation values of the native and
borrow sediments (Gravens et al. 2008). The CEM (Gravens et al. 2008) recommends an overfill factor within the range of 1.00 to 1.05, but
acknowledges that this is very difficult to achieve. (A value of 1.00 indicates direct compatibility, while
values higher than 1.00 indicate greater non-compatibility.) A broader range of 1.0 to 1.5 was identified
as satisfactorily compatible in the EA of the West Ship Island North Shore Restoration project in
Mississippi (USACE 2010a). However, post-nourishment monitoring efforts at another project in
Morehead City, North Carolina found that sediment with an overfill factor of 1.4 was non-compatible
for local beaches (Bodge et al. 2006). In this instance the non-compatible material contained clay and
State
Particle
Size
Range
(mm)
Allowable %
Silt, Clay,
Colloids
(Passing
#230 Sieve)
Allowable %
Fine Gravel
(Retained on
#4 Sieve)
Allowable
Coarse
Material
Dredge
Material
Allowable %
Fines (Passing
#230 Sieve)
Carbonate
Content
North
Carolina*
n/a
% by weight
of native
beach plus
additional 5%
% by weight
of native
beach plus
additional 5%
% by weight
of native
beach plus
additional 5%
up to 10% by
weight
% by weight
of native
beach plus
additional
15%
Florida
0.062–
4.76
5% by weight
or less
5% by weight
or less
% material
retained on
3/4 inch sieve
cannot exceed
% on native
beach
up to 10% by
weight
(10%–20% for
nearshore
placement)
must not
result in
cementation

13
high fractions of silt and large shells. A similar overfill factor, however, may be acceptable for another
project if the grain size distributions (sand grain frequency, mean and median grain size, and standard
deviation) of the native and borrow materials are similar. The overfill factor is only one factor used to
assess sediment compatibility, and it is important to consider all factors before making a final
compatibility decision.
Sediment Color Compatibility Borrow material should be as close as possible
in color to the native sediment to limit visual
and biological impacts after placement. A
change in sediment color can alter the
sediment’s temperature and affect organisms
living in or utilizing the sediment. For
example, sand temperature influences the
reproductive success of many species,
including horseshoe crabs (Avissar 2006) and
sea turtles (Crain et al. 1995). (In addition to
color, sand temperature is also dependent on
the mineralogy of the sediment.) A change in
beach color can also impact visitor enjoyment.
Sediment color is often described using the
Munsell color chart (Munsell Color 2010). In the Munsell system sediment color is determined visually
by comparing the sediment to the Munsell chart and identifying a matching color chip. Colors are
measured along three different dimensions: hue, value (lightness or darkness), and chroma (departure
from grey) and are recorded in the order of hue followed by value/chroma, such as 10YR 4/6 (Munsell
Color 2010). Since moisture affects color, it can be useful to record color twice, once dry, and once
moist. In some cases interstitial water contained in the borrow sample can make the material appear
darker than the dry sediments, so it is recommended to wash a few samples before making the moist
color determination (FDEP 2010).
Florida regulates color compatibility and requires that fill “be similar in color” to native beach sediment
(FAC 2001). In Florida, fill material can be expected to lighten one Munsell value once placed on the
beach and dried by the sun (FDEP 2010). However, darker or tanner colored sands in other states may
undergo more drastic lightening when dried (e.g. Figure 6). Shell content can also influence the overall
color of the sediment and will also likely lighten one Munsell value once dried. Some sediment may not
lighten in the sun (i.e. iron stained sediment), so the source of the color of the sediment should be taken
into account when determining color compatibility (FDEP 2010).
Composite Mineralogy The mineralogy should be very similar between the fill and native material. Mineralogy affects
sediment temperature, compaction, and moisture content, all of which can impact biological resources
and physical processes. In most places sand-sized sediment is predominantly composed of quartz
particles with lesser amounts of other minerals such as feldspar (Gravens et al. 2008). Some locations
may also have a dominant amount of calcium carbonate that is usually of organic origin. To avoid
cementation of the beach, calcium carbonate content of fill material should be limited. In North
Figure 6. Natural sediment variability offshore Golden Gate National Recreation Area, California (Photograph by P. Barnard).

14
Carolina, the composite mineralogy of the borrow material must be “similar to the mineralogy” of the
native beach and the carbonate content in borrow material may not exceed the carbonate content of the
native beach by more than 15% (NCAC 2007). In Florida, the carbonate content in the borrow sediment
must not result in cementation of the beach (FAC 2001). Projects in other states should consult with the
lead coastal state agency on any mineralogy requirements (see Appendix A for a list of state agencies).
Organic Content Fill material should have similar organic content as the native beach. The organic content in sediment
can greatly affect plant and animal populations. For example, the success of incubating turtle eggs can
be reduced when the organic content of the fill material is different from the natural beach (Greene
2002). Maintaining the same organic content is also important because organic material supplies
nutrients to benthic organisms. In high-energy environments, such as beaches, organic matter consists
mainly of decayed macroalgae, feces, and animal remains (Thayer et al. 2003). Measurement of organic
content requires destruction of the organic matter via chemicals or heat. The carbon is then converted to
carbon dioxide and measured directly or indirectly. See Schumacher (2002) for more information on
determination of organic content in sediment.
Sediment Contamination Fill material must be substantially free of harmful chemical contaminants. Sediment is usually
characterized as substantially free of contaminants if it is composed entirely of sand, gravel, or other
inert material, and is found in areas of high current or wave energy (Moffatt & Nichol 2006). Chemical
contaminants are usually associated with silt and clay-sized particles as well as organic substances. The
likelihood for contamination may also be based on previous chemical testing of sediments from the
same vicinity and/or proximity of the fill material to contaminant sources or preindustrial age deposits
(Science Applications International Corporation 2007).
The United States Environmental Protection Agency (USEPA) has physical and chemical standards for
sediments that will be placed in marine environments. Some states have adopted standards that are more
rigorous than the USEPA standards. In addition, in order to preserve and protect park resources, parks
may need to develop or adopt more stringent standards. For example, Gateway National Recreation
Area has developed draft sediment standards for use in protection, restoration and maintenance projects.
The draft standards exceed USEPA and New York Department of Environmental Quality standards. A
higher standard has been deemed necessary by the park to protect and preserve park resources
unimpaired. Further information on sediment chemical contamination can be found in the Evaluation of
Dredged Material Proposed for Discharge in Waters of the U.S. – Testing Manual (USEPA and
USACE 1998).
Foreign Matter Fill material must be free of trash, debris, and large pieces of organic material because of health and
safety hazards and possible odor and visual impacts. For example, Florida (FAC 2001) and North
Carolina (NCAC 2007) regulations require that fill material not contain construction debris, toxic
material or other foreign matter.
Selecting Native Material for Compatibility Analysis If the project site has been impacted and it is difficult to determine what the native sediment consists of,
a nearby, undisturbed site can be used when determining native sediment characteristics. The nearby

15
site should have similar coastal processes and similar sediment type and range to be representative of
what would originally have been at the impacted project site.

17
Nearshore Sediment Placement
Nearshore placement is an alternative to direct beach placement that can be implemented when cost or
environmental impacts discourage placement directly on the beach, or when the sediment does not meet
beach nourishment standards for the percentage of silt/clay sediment content. Nearshore placement of
sediment dredged from coastal navigation channels (USACE 2010b) and from ebb- and flood-tidal
deltas (Schupp et al. 2007) that is substantially free of contaminants is of growing interest for coastal
managers, scientists, and residents. The common practice of placing dredged sediment far offshore
removes sediment from the system and may contribute to long-term shoreline erosion on land adjacent
to the channel (Morton 2008, Gailani and Smith 2006). Nearshore placement instead provides beneficial
use of the dredged material and when applied properly, retains sediment within the littoral system.
Generally the success of nearshore placement in transporting sand to the beach decreases with increasing
distance from shore (Smith et al. 2007). Regional and local sediment transport patterns must therefore
be considered in the selection of placement sites in order for placed sand to benefit the littoral and beach
sediment budget. Placement sites should also be chosen to minimize sand movement back into the
navigation channel and to limit unwanted impacts to natural wave characteristics (Gailani and Smith
2006). Placement design should consider potential effects on nearshore biological populations and may
require sampling and monitoring of biological resources in the nearshore as well as the intertidal areas.
See the Project Design Considerations to Reduce Environmental Impacts and Monitoring Program
sections for more information.
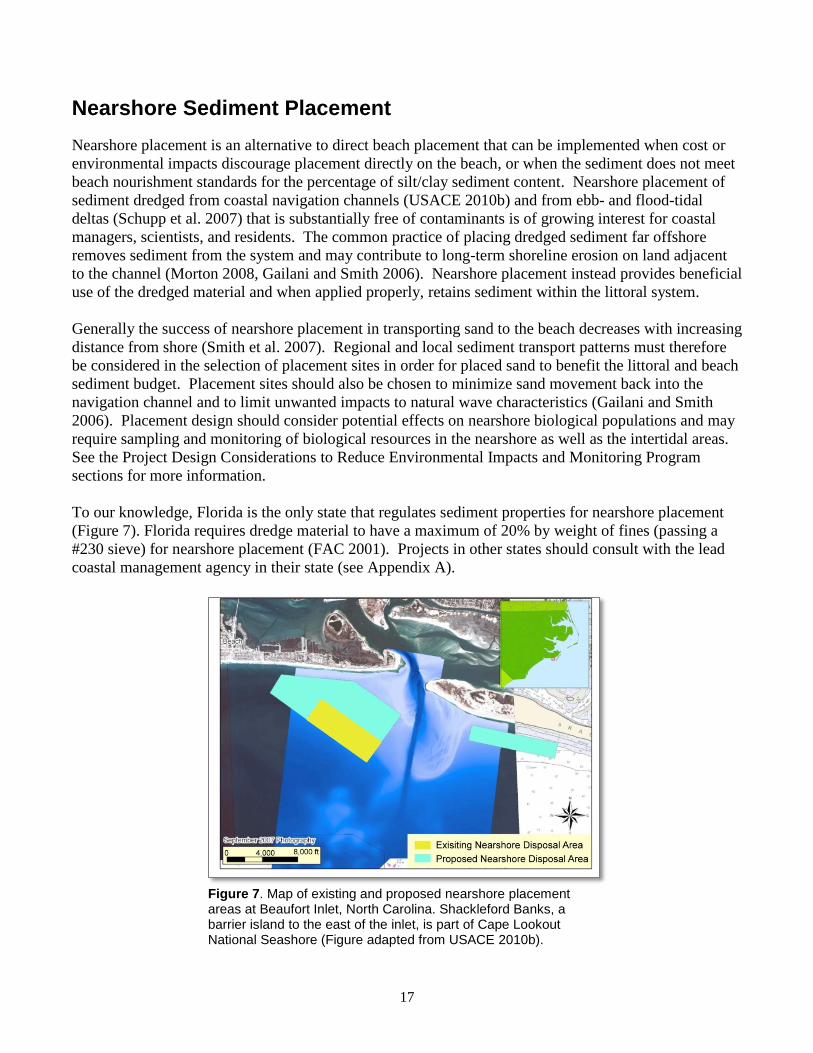
To our knowledge, Florida is the only state that regulates sediment properties for nearshore placement
(Figure 7). Florida requires dredge material to have a maximum of 20% by weight of fines (passing a
#230 sieve) for nearshore placement (FAC 2001). Projects in other states should consult with the lead
coastal management agency in their state (see Appendix A).
Figure 7. Map of existing and proposed nearshore placement areas at Beaufort Inlet, North Carolina. Shackleford Banks, a barrier island to the east of the inlet, is part of Cape Lookout National Seashore (Figure adapted from USACE 2010b).


19
Offshore Borrow Areas
Offshore areas are regularly used as the sediment borrow source for beach nourishment projects.
Borrow material may be mined from ebb tidal shoals near inlets or shoals on the continental shelf, or
reused from the creation or maintenance dredging of harbors, navigation channels, or waterways.
Offshore borrow sources are generally evaluated through the collection of surface sediment samples,
sub-bottom profiling and/or coring (Dean 2002). Sediment compatibility tests between the borrow and
beach sediment, and analysis of the available borrow volume are required prior to dredging to ensure the
sediment is of suitable quality and volume. The most important factor when considering suitability is
grain size (see the Sediment Properties for Beach Nourishment section). Suitable borrow sediments are
dredged from the seafloor and transported to the beach via dredges, barges, and/or pipelines.
In addition to sediment compatibility, evaluation of borrow sources should also consider the effects of
dredging on wave transformation and sediment transport in the area. Pre- and post-dredging bathymetry
should be simulated and used to investigate the possible effects of dredging a borrow area on littoral
processes in the area (Gravens et al. 2008). The analysis should include a numerical wave model and
comparison of breaking wave conditions, longshore transport rates, and transport rate gradients between
pre- and post-dredging scenarios. If necessary, the depth or shape of the borrow area may require
modification to avoid concentrations of wave energy or altered sediment transport (Gravens et al. 2008).
Borrow areas should be in water depths greater than the zone of active sediment transport to avoid any
reduction in cross-shore or alongshore sediment transport.
Borrow sites should be located away from important biological habitat such as significant spawning
areas, Marine Protected Areas, or other habitats valuable to local fishery or benthic resources (Rice
2009). Excavation of the borrow site should avoid leaving large depressions or holes if possible, and
instead employ a series of shallow, staggered cuts. This method allows the areas in between cuts to act
as refugia for repopulation of benthic resources and limits alterations to the seafloor bathymetry (Rice
2009).
Dredging should also leave a sufficient layer of seafloor sediment that matches, as much as possible, the
original surface layer to limit changes in habitat. For example, sediments within a borrow area off Folly
Beach, South Carolina became increasingly fine (more silt/clay) after dredging and showed little
evidence of recovery one year later (Bergquist et al. 2005). It was later determined that the borrow area
filled with fine sediments because the area was dredged too deep (3 m below the seafloor) and was in
close proximity to a harbor full of fine sediment (Bergquist et al. 2005). The biological community also
changed after dredging, likely in response to the change in sediment.
Similar to the nourishment site, pre- and post-project monitoring of the borrow site is essential to
identify any physical or biological change. Monitoring may include:
Sediment sampling and analysis;
Wave monitoring and modeling;
Bathymetric and substrate surveys;
Shoreline monitoring and modeling;
Benthic community sampling and their trophic relationships to fishes; or
Marine mammal and wildlife monitoring (during operations).

20
See Dean (2002), Greene (2002), Nairn et al. (2004), Gravens et al. (2008), and Rice (2009) for more
information on borrow site evaluation, potential impacts of borrow dredging, and borrow site
monitoring.

21
Project Design Considerations to Reduce Environmental Impacts
Every effort should be taken to avoid and/or mitigate impacts to NPS resources during beach
nourishment projects. Projects should have clearly articulated objectives, preferably with quantitative
goals that can be measured and monitored. These objectives should be related to, and informed by, the
purpose and significance of the park unit. Careful attention must always be given to any threatened or
endangered species. For example, an objective may be to “slow erosion on the seaward side of the fort
while protecting native biota” or “restore and maintain 200 feet of beach habitat perpendicular to the
shore for a length of 1 mile, for recreation and habitat protection.” This section includes specific design
elements that may help to reduce negative impacts. It is important to note that beach nourishment can
also have beneficial impacts on biota in the project area, many of which are well-adapted to naturally
highly dynamic conditions that are typical of a beach and nearshore environment (Dean 2002).
Turbidity The amount of turbidity in the nearshore environment due to sediment placement should be limited by
following these best management practices:
Use sediment that closely resembles native sediment;
Select sediment with a low percentage of silt and clay;
Limit the rate and total volume of placement;
Use turbidity curtains to contain suspended solids; and
Conduct fill placement when tidal elevation and wave energy is low.
High turbidity can impair filter feeding invertebrates, reduce light needed for photosynthesis, block the
view of visual feeders, coat submerged aquatic vegetation, and be a deterrent to recreational use by the
public (Greene 2002, Moffatt & Nichol 2006). Elevated sedimentation levels are also known to
negatively influence coral reef communities and have been observed during beach nourishment activities
(Jordan et al. 2010). Turbidity will usually disappear within several hours after operations finish, but
some studies have shown turbidity to be a long-term problem (Greene 2002). Project managers should
check with the lead coastal management agency in their state for any specific requirements (see
Appendix A).
Placement Design Placement Geometry
Placement geometry can have a significant
influence on a project’s success and ecological
impact. It is generally accepted that the elevation
of the design berm should correspond to the
natural berm crest elevation (Dean 2002, Gravens
et al. 2008). Construction of a higher berm may
produce a steeper beach face slope than natural and
prevent turtles from crawling up the beach to nest
(Steinitz et al. 1998) or degrade recreational use
(Figure 8). Florida regulations, for example,
require beach nourishment projects be designed to
provide habitat that is suitable for successful marine
Figure 8. Excavator placing sediment along the Lake Michigan shoreline, Indiana Dunes National Lakeshore, Indiana (NPS photo).

22
turtle nesting activity (FAC 2001). If the design berm is lower than the natural berm, it may be
overtopped and produce flooding and ponding on the berm (Gravens et al. 2008). An alternative design
approach is to construct a berm that is slightly lower than the natural elevation and allow storms and
overwash processes to build the elevation to the natural level (Dean 2002).
Design berm (beach) width depends on the purpose of the project, project economics, and environmental
resources. For federal beach nourishment projects, berm width is calculated through a process of
optimization based on storm damage reduction (Gravens et al. 2008). Beach width is optimized by
computing the costs and benefits of different design options and choosing the option that maximizes net
benefits (Gravens et al. 2008).
A key aspect of defining the design profile is to recognize if the pre-project beach has a healthy, normal
profile shape or an unnatural shape. If the natural beach is sediment starved, profiles from nearby,
healthy beaches that experience similar wave and tide conditions, and have similar grain sizes, can be
used to determine the design profile. For federal projects the final design profile is determined through
optimization. Storm-induced beach erosion modeling is performed during the optimization process to
assess profile response from varied storm conditions. Different profiles are run through the model to
find the option that provides maximum net economic benefits (Gravens et al. 2008).
During construction, the berm is built to the desired elevation,
but it is often made much wider than the final design profile.
The over-building method is used because of the working
limitations of the equipment and the desire to place the material
in the most economical way. Waves and current action will
then redistribute the sediment to deeper parts of the profile over
time (Gravens et al. 2008).
Volume
The total volume of material placed is site-specific and based on
the project goals, physical environment, infrastructure, potential
downdrift effects, and sensitive biological resources. The
volume required is calculated as the difference in cross-
sectional area between the pre-project profile and the modified
design profile shape (Gravens et al. 2008). The modified design
profile shape is different than the design profile because it takes
into account the amount of sediment needed to maintain the
design profile prior to the first renourishment (see Gravens et al.
2008 for more information and examples). Differences in
desired level of protection or potential for increased erosion may
lead to alongshore differences in fill volume (Figure 9).
Placement of 4.1 million m3 (5.4 million yd
3) of sediment on
Perdido Key in Gulf Island National Seashore, for example,
advanced the shoreline an average of 125 m (410 ft) seaward and
caused unanticipated biological impacts (FDEP and Dean 2000).
Monitoring showed the nourished beach was too wide for swash
zone nutrients to reach vegetation in the back beach and ultimately caused a failure of sea oat seed
Figure 9. Proposed sand slurry pipeline at Gateway National Recreation Area, New Jersey. Sand would be removed from accreting Gunnison Beach and deposited in the eroding critical zone. Burial of biological resources is unlikely because only ~1530 m
3 (~2000 yd
3) of
sand will be removed/filled per day (Figure from USFWS 2005).

23
production (per. communication R. Hoggard 2010). See the Perdido Key Case Study in Appendix C for
more information.
Coverage
For beach nourishment projects, sediment is generally placed with a rectangular or trapezoidal planform
along a continuous section of beach and the planform spreads out over time. Rice (2009) recommends
that sediment should not be placed in one large area, but instead be divided up into smaller sections to
leave undisturbed areas of existing biological resources. For this approach, future renourishment efforts
should alternate which sections receive fill. Rice (2009) recommends individual sections not exceed
610 m (2000 ft) in length unless scientific monitoring proves otherwise. If possible, the beach fill
should be spread in multiple layers and staggered over time in order to minimize invertebrate mortality
and facilitate benthic invertebrate repopulation. Quite often, however, many nourishment projects
deposit thick layers, resulting in high mortality of benthic macrofauna (Speybroeck et al. 2006).
Peterson et al. (2000) found a decrease of 86–99% in macro-invertebrate populations 5–10 weeks after
nourishment. While the original organisms will die off, the newly restored beach should become
naturally re-colonized. Recovery can sometimes be fairly quick (e.g. a few months to <1 year), because
of rapid sediment dispersal and/or high natural species tolerance (Gorzelany and Nelson 1987, Nelson
1993, Smith and Rule 2001, Cruz-Motta and Collins 2004). However, when inappropriately selected
sediments alter the native habitat characteristics, or have high organic or pollutant loads, the effects can
be long lasting. Peterson et al. (2006) documented limited recovery of Donax spp. (coquina clam) 7–12
months after nourishment in North Carolina and a 70–90% decline in feeding shorebirds largely in
response to prey depression of Donax spp. See the Minimizing Impact to Benthic Invertebrate
Populations section for more information.
Nourishment activities should avoid sensitive habitats and areas with high ecological value. Projects
should be scheduled to avoid productive biological seasons (see Project Timing section). If sensitive
habitats exist within the project area buffers can be created. Rice (2009) recommends creating buffers
of 100 m (328 ft) around wading bird colonies, 200 m (656 ft) around mixed tern/skimmer colonies, and
100– 200 m (328– 656 ft) around solitary bird nests. Sensitive plants should be given a buffer of at least
10 m (33 ft). If construction activities will occur 24 hours a day, 7 days a week, buffers may need to be
greater. Sediment management projects in the nearshore and offshore environments should establish
buffers around all reefs, hard bottoms, submerged aquatic vegetation, and other high value habitats.
Rice (2009) suggests buffers be at least 500 m (1640 ft) around these habitats.
Compaction
Coastal nourishment projects should not increase sand compaction. Compaction can be limited by:
Using compatible fill material with similar grain size, shape, calcium carbonate content, and
silt/clay content as is found on the native beach;
Staging and storing construction equipment off the beach; and
Tilling the fill surface after placement.
Compaction affects water retention, permeability, exchange of gases and nutrients, and may decrease
turtle nesting success by impeding nest excavation and preventing hatchling emergence (Milton et al.
1997, Steinitz et al. 1998, Defeo et al. 2009). In Florida, beach nourishment permits from the Florida
Department of Environmental Planning require sand compaction to be 500 psi (pounds per square inch)

24
or lower after nourishment (FAC 2001). However, some researchers argue that this threshold is
unwarranted and needs to be revaluated (Davis et al. 1999). Projects in other states should check with
the appropriate state agency for any compaction requirements (see Appendix A for a list of agencies).
Construction
Construction related traffic should be limited and controlled in order to minimize adverse impacts to air
quality, habitat structure, traffic, public safety, noise, and biological processes including nesting and
foraging. All associated vehicles and equipment should be muffled to limit disturbances to the fauna,
such as shorebirds abandoning their nests. Project areas should also be clearly marked for safety
concerns.
Project Timing The acquisition of fill material and the construction phase of any project should be timed to avoid the
most productive biological seasons, regular storm seasons, and high beach visitor-use times. Birds, sea
turtles, fish, crabs, clams, amphipods, shrimp, worms, tiger beetles, and mysids are some of the animals
that use the sandy intertidal area. The preferred timing for nourishment depends on the species
inhabiting or exploiting the area and the nature and location of the project.
In areas that have nesting seabird and turtle populations, projects should not overlap with nesting
seasons. For example, Florida discourages beach nourishment activities during the main portion of sea
turtle nesting season (May 15 to October 31). The state of North Carolina also limits work from May 1
to November 15 to minimize adverse impacts to nesting sea turtles. In addition to nesting birds, timing
of construction should also consider resting and foraging birds (Speybroeck et al. 2006).
Winter is the best season to minimize impact on epibenthic organisms and larger benthic infauna
(Speybroeck et al. 2006). Nourishment during the warm season (beginning in April for the Atlantic
coast) can affect macrobenthos reproduction, recruitment, and size (Peterson el al. 2000). For the
Atlantic and Gulf coasts of the United States, winter (mid-November to February) is the best season for
undertaking beach nourishment, partially because it avoids the spawning and recruitment periods for
benthic invertebrates (Rice 2009).
The National Marine Fisheries Service (NMFS) and state regulations should be consulted regarding
project timing if the project may impact essential fish habitat. If any threatened or endangered species
habitat may be impacted, consultation with the United States Fish and Wildlife Service (USFWS) and
NMFS is necessary to determine when (or if) sediment can be extracted and/or placed.
If possible, nourishment projects should avoid storm seasons, such as hurricane season (June 1 to
November 30) in the Gulf States and nor’easter season (usually October thru April) in the Northeastern
states. A major storm occurring during the construction phase could potentially transport a majority of
the placed sediment from the project area.
Minimizing Impact to Benthic Invertebrate Populations Native benthic invertebrates are protected under NPS Management Policies (NPS 2006) and the Organic
Act (16 USC § 1). This section highlights ways to minimize impacts to benthic invertebrates because
they are often present in beach and nearshore project sites. Other species that may be present, such as
birds, fish, sea turtles, and clams, are equally as important and must be considered and addressed during
pre-project planning.

25
To limit negative impacts to benthic invertebrates, projects should determine which populations are
present and where they occur, and use compatible sediment (see the Sediment Properties for Beach
Nourishment section). While sediment compatibility is widely considered key, impacts to invertebrate
survival and recovery may also be reduced by:
Conducting beach nourishment projects when invertebrate populations are at their seasonal low
on the beach;
Extending the time between renourishment episodes to permit recovery;
Placing fill in several short sections (as opposed to a continuous section) to leave undisturbed
regions for enhanced recovery;
Limiting the volume and rate of sediment placement to allow motile invertebrates to migrate
upwards; and
Maintaining the natural beach profile to preserve habitat area.
(Peterson et al. 2000, Smith and Rule 2001, Greene 2002, Bishop et al. 2006, Peterson et al. 2006,
Speybroeck et al. 2006, Defeo et al. 2009, Rice 2009, Vivian et al. 2009.) The rate of longshore
transport may also play a role in benthic recovery because high rates of longshore transport have the
capacity to dilute and disperse incompatible sediment and can enhance invertebrate immigration (Van
Dolah et al. 1984, Peterson et al. 2006).
Benthic macro-invertebrates, typically crabs
(Figure 10), bivalve mollusks, amphipods, and
polychaetes in warm oceans, are the prey base
for surf fish, shorebirds, and epibenthic
invertebrates (Greene 2002). Thus, they are
critical to the health of higher trophic levels
and can also serve as indicators of habitat for
predator species. The effects of sediment
placement (beach nourishment or nearshore
sediment placement) on benthic invertebrates
are diverse, ranging from few or no detectable
effects (e.g. no measureable change in number
of individuals or species richness in SE
Australia; Smith and Rule 2001) to
widespread, long-lasting impacts (e.g.
decreased species richness and total density, and shifts in macrobenthic assemblage structure in Florida,
Rakocinski et al. 1996). Most studies have found a significant decline in benthic invertebrate population
at the placement location immediately following sediment placement due to burial and suffocation (e.g.
Peterson et al. 2000, Cruz-Motta and Collins 2004, Bishop et al. 2006). However, the duration of the
population impact varied by project. Studies show the most important determinant of impact and rate of
recovery of benthic invertebrate populations is the degree to which fill sediment matches the native
sediment (Nelson 1993, Peterson et al. 2000).
Previous research demonstrates that where fill sediment matches the native sediment (grain size
distribution, mineralogy, organic content, and pollution loads) there are limited impacts on benthic
invertebrate population abundances and recovery occurs fairly rapidly (between a few months to <1
year) (Gorzelany and Nelson 1987, Nelson 1993, Smith and Rule 2001, Cruz-Motta and Collins 2004).
Figure 10. Ghost crab at Padre Island National Seashore, Texas (NPS photo).

26
Gorzelany and Nelson (1987) concluded that compatible fill material likely contributed to the lack of
negative invertebrate effects at a beach nourishment project in eastern Florida. Similarly, the lack of
detectable effects on the invertebrate community structure after nearshore sediment placement in
Australia was attributed to compatible sediment and effective placement design (Smith and Rule 2001).
In contrast, other studies have found large depressions of benthic invertebrate populations where
incompatible sediment was used (McLachlan 1996, Rakocinski et al. 1996, Peterson et al. 2000, Harvey
et al. 1998, Peterson et al. 2006, Colosio et al. 2007). Peterson et al. (2006) reported that unnaturally
coarse fill sediment during the winter 2001/02 Bogue Banks, North Carolina beach nourishment project
was associated with limited benthic invertebrate recovery after one year and a 70–90% decline in
feeding shorebirds, which they attributed to invertebrate prey depression. Rakocinski et al. (1996) also
found delayed recovery of invertebrates in concert with increased silt/clay loading after a large beach
and nearshore restoration project (7.1 million m3 along 7 km of shoreline (9.3 million yd
3 along 4.3
miles)) in Gulf Islands National Seashore (see the case study in Appendix C).
Beach invertebrate populations are patchily distributed with densities of hundreds to thousands per
square meter often occurring (McLachlan 1996). Intertidal invertebrate populations can also relocate
during flood and ebb tides and with the normal deposition-erosion of shore sediments (Barnes and
Wenner 1968). Although there is generally limited knowledge of invertebrate ecology, if possible,
project managers should determine which populations are present and where they occur to protect
invertebrate animals during beach nourishment projects. It may be possible to screen mobile
invertebrate populations away from sediment discharge areas using block nets. Temporary removal and
reseeding is also possible with many beach invertebrate populations.
In summary, a review of the scientific literature shows variable effects of sediment placement on benthic
population survival and recovery based on the compatibility of the placed sediment, various design
factors, and the natural physical processes occurring in the area. Utilizing fill sediment that closely
matches the native sediment (e.g. grain size distribution, mineralogy, and organic content) appears to
have the greatest influence. Effective project timing, design, and placement rate may also help to
prevent negative impacts.
In 2007 the NPS Inventory and Monitoring Program (I&M) initiated a benthic habitat mapping program
in ocean and coastal national parks. The report, A Servicewide Benthic Mapping Program for National
Parks (USGS 2010) outlines the program’s protocols and is a resource to learn more about benthic
habitat mapping. NOAA’s report, Guidance for Benthic Habitat Mapping: An Aerial Photographic
Approach (NOAA 2001), may also be helpful if a project is using aerial photography for habitat
mapping.
27
Monitoring Program
Beach nourishment projects should include scientifically rigorous pre-project, during construction, and
post-project physical and biological monitoring. Monitoring is necessary to assess project performance,
identify any impacts, and ensure project functionality and environmental standards. Monitoring
provides critical information for adaptive management efforts (Rice 2009).
Monitoring plans will vary by project due to the project size, budget, species present, and overall
monitoring goals. All monitoring plans must relate to the project objective, be scientifically based, and
incorporate collaboration with various experts, including engineers, managers, and biologists. Larger
projects should incorporate control areas and be statistically valid (Peterson and Bishop 2005). If
possible, intersperse areas of nourishment and control sites to avoid spatial interdependence. Otherwise,
bracket the nourished site with control sites on both sides (Peterson and Bishop 2005). For smaller
projects, control areas may not be necessary if the goal is to just show whether or not project objectives
have been achieved within the project area.
After a review of 46 beach monitoring studies, Peterson and Bishop (2005) concluded that many
monitoring programs have serious flaws because they are conducted by contractors usually associated
with the proponents of the project rather than by independent researchers, and have no independent peer-
review. Instead, they suggest that monitoring programs should be carried out by a third/neutral party
and include anonymous scientific peer-review. Data should also be shared with project managers and
engineers in a timely manner to facilitate adaptive management (Rice 2009). Many of the monitoring
aspects and components presented below are also applicable to monitoring of the borrow site. The NPS
I&M Program has developed various monitoring protocols that can provide guidance for parks
developing a monitoring program. All of the protocols are available on the I&M Monitoring Protocol
Database (NPS 2012a).
Seasonality Each characteristic or variable of a monitoring plan should have its own seasonal requirement, and
therefore timing constraints, that should be identified and addressed in the monitoring plan. For
example, because resource aspects (such as migratory bird use, hydrologic patterns, turtle nesting
density, fish abundance, invertebrate abundance, and wave energy) change over various time scales,
each should be assessed individually (Thayer et al. 2003). Both the project and control areas should be
sampled each time sampling is conducted, and in the same month at a minimum. Annual monitoring
should be done at the same time of year to reduce the effects of seasonality on detection of long-term
trends.
Frequency Monitoring should occur before, during, and after nourishment activities. Pre-project monitoring is
required to obtain baseline data on significant flora and fauna in the area and to document the natural
spatial and seasonal variability of the biological and physical systems (Gravens et al. 2008). These data
can then be compared with data collected after restoration to assess any project related impacts. All
relevant biological and physical variables should be sampled at the same time (or as close as possible)
and sampling techniques must be consistent throughout the project to allow for hypothesis testing
(Nelson 1993).

28
Duration The duration of monitoring should vary by project depending on the project size, the variables being
monitored, and overall monitoring goals. Pre-project monitoring should include enough time to gather
baseline information on the preexisting systems. A pre-project sampling period of at least a year is
highly recommended to observe storm events and seasonal patterns (Thayer et al. 2003). Monitoring
during construction is critical to ensure that proper design specifications are met and should include
periodic sampling of the fill material to catch any incompatible material (Thayer et al. 2003, Rice 2009).
Post-construction monitoring should span a time period that permits statistical analysis.
Monitoring Components Monitoring plans should contain one or more of the
following components measured before the project is
started (in order to establish a baseline), during
construction, and for an appropriate length of time
after the project is complete.
Topographic surveys;
Visual beach inspections;
Beach sediment sampling;
Turbidity monitoring;
Aerial shoreline configuration (photography);
Bathymetric surveys;
Continuous wave and water-level
measurements; and
Biological monitoring of sea turtles, macro-invertebrates, birds, fish, seagrasses, corals, or other
biological resources.
The physical characteristics, flora, and fauna
monitored will vary by project. The project area
may have highly sensitive areas such as sea
turtle nesting sites or might include federally
threatened and/or endangered species (Figure
11). Similarly, the physical conditions will
differ widely between project sites, requiring
different monitoring components. It is not
expected that every project will incorporate
all of the monitoring activities listed below.
The components are presented merely to
show the activities that may be included in a
monitoring plan. Topographic Surveys
Topographic surveys are used to calculate and monitor beach volumes, monitor shoreline position, and
to document changes in the beach cross section (Figure 12). Topographic data can be collected through
profile surveys, all-terrain vehicle (ATV) mounted GPS surveys, or from airborne light-detection and
ranging (LIDAR) surveys.
Figure 11. A federally-listed threatened and endangered species, a Piping plover (Charadrius melodus) chick, in Cape Cod National Seashore, Massachusetts. Beaches in the seashore serve as critical breeding habitat (NPS photo).
Figure 12. Beach profiles at Ocean Beach collected using an ATV-mounted GPS, Golden Gate National Recreation Area, California (Figure from Hansen).

29
Profile surveys are accomplished by repeating profiles at regular intervals along the shoreline using
traditional surveying techniques. Profile surveys should re-occupy the same transects every time and be
referenced to a common baseline that is set at the beginning of the study (Gravens et al. 2008). Surveys
should occur at low tide and cover the entire beach profile from the upper beach out to beyond the depth
of closure (seaward limit of profile change). Annual surveys should be conducted during the time of
year when wave energy is lowest. Since the distance between the profiles is usually large, the
topographic data derived from profiling is spatially limited and the ability to make inferences about the
beach as a whole is also limited.
Topographic surveys of the entire beach can be done using an ATV-mounted GPS receiver. The
receiver collects position and elevation data at regular intervals (e.g. 1 sec) and then after the survey the
georeferenced elevations are gridded to produce a three-dimensional surface of the beach. ATV surveys
provide seamless, high-resolution topographic data for the entire beach. A typical survey of Ocean
Beach (a 7 km (4.3 mi) long beach in Golden Gate National Recreation Area) consists of roughly 20,000
individual elevations (Hansen and Barnard 2010). The NPS Northeast Coastal and Barrier Network has
developed an ATV ocean shoreline position monitoring protocol, which is available at
http://science.nature.nps.gov/im/units/ncbn/vs/shoreline.aspx. ATV surveys may not be appropriate for
all areas, particularly those with sensitive habitat or threatened species.
High-resolution elevation data can also be collected by airborne or stationary LIDAR (Gares et al.
2006). LIDAR measures distances by sending pulses of light that strike and reflect from the surface.
The LIDAR system also measures the time of the pulse return and the GPS position, allowing it to
record accurately georeferenced data. LIDAR generates very large point datasets that can be analyzed to
provide highly accurate and detailed three-dimensional elevation models. More information about
LIDAR is available online through NOAA’s publication: Lidar 101: An Introduction to Lidar
Technology, Data, and Applications (NOAA 2008).
Visual Beach Inspections
Visual inspections should occur concurrently with all baseline and post project monitoring events. If
possible, conduct inspections at low tide to gather observations of the entire beach area. Inspections
should note all observations about the condition of the beach (e.g. dune vegetation, storm scarping or
overwash, post-storm recovery berms, sand bars, points and cusps, channels, longshore variability in
beach features, sediment color, presence of shell hash, compaction, and slope). An observation checklist
can be helpful to ensure consistent methods over time.
Sediment Samples
Sediment sampling is needed to determine any change in the grain size distribution over time, which
could affect the beach shape and biological habitat. Sediment grab samples should be collected
regularly along the profile survey lines and occur concurrently with annual profile surveys. Samples
should re-occupy the same locations along the profile (e.g. berm, foreshore, cusp, foredune, etc.),
include more than the surface layer of sediment, and be mixed well before analysis to ensure
representative sampling of the beach. Turbidity Monitoring
Turbidity monitoring should be conducted regularly during construction. Turbidity levels are often
measured using a secchi disk that is mounted on a pole or line and lowered down in the water. The areal

30
extent of increased turbidity can also be determined with digital photography (Moffatt & Nichol 2006).
If monitoring indicates excessive, prolonged turbidity, construction should be halted or modified.
Best management practices for limiting turbidity should be employed including the use of compatible
sediment with a low percentage of silt and clay, silt fencing to confine the suspended solids, and timing
of the fill placement when tidal elevation and wave energy are low (see the Project Design
Considerations to Reduce Environmental Impacts section for more information). Aerial Photography
Vertical aerial photography is used to monitor long-term fill performance, shoreline position, and
subaerial beach width (Gravens et al. 2008). Aerial photographs provide a total-project perspective that
cannot be obtained with profile surveys alone and are an important resource for communicating with
others. Vertical aerial photographs should be acquired at least annually and near midday around low
tide to minimize shadows and capture the greatest area of beach (Gravens et al. 2008). Photographs
should be taken just before the winter storm season and as close as possible to the date of the beach
profile surveys. It is best to use the largest scale photography available, with 1:20,000 considered the
smallest scale useable for shoreline mapping (Moore 2000). To perform any analysis of an image it
must first be georeferenced (aligned to a map coordinate system).
Bathymetric Surveys Bathymetric surveys are used to measure the
bathymetry, or elevation, of the seafloor.
Bathymetry can be measured using a single or
multibeam echosounder system. An
echosounder measures depth through use of
sound signals emitted from an instrument
mounted on a boat.
Shoreface profiles, offshore borrow sites,
nearshore placement sites, and dredging sites
can all be assessed and monitored through
bathymetric surveying. Bathymetric data
(Figure 13) can be used to find the depth of
borrow sites (and whether the dredger can reach
them), the surface area of sediment that is
available to be dredged, the recharge rate of the
dredged area, the shape of the shoals (which is
important for fish habitat and wave attenuation), and bathymetric change over time. Data can also be
used to model incoming waves and help to predict how wave energy may change if the bathymetry is
modified. Bathymetric surveys are also important for capturing nearshore data to extend beach profiles
offshore. Bathymetric profiles should align with the dry beach profiles and extend offshore some
distance beyond the expected depth of closure.
Waves, Currents, and Water Level Measurements
Waves, currents, and water levels are measured because they are the primary hydrodynamic forces
controlling beach evolution (Gravens et al. 2008). Wave, currents, and water level measurements should
be taken before, during, and after the project. These data can be compared to measured beach response
Figure 13. Bathymetric change from 1974–2009 at Beaufort Inlet, North Carolina, adjacent to Cape Lookout National Seashore (Figure adapted from USACE 2010a).

31
to help understand project behavior. Wave and water level measurements are often collected using a
pressure gauge, buoy, or other sensor placed offshore of the project area.
Sea Turtle Monitoring
Sea turtle monitoring variables should be selected that
will best reflect any change to their habitat that may
occur as a result of the particular project (Figure 14).
Most parks with sea turtle habitat have a turtle
management program that can provide data necessary
to evaluate pre- and post-project adverse or positive
effects of a beach nourishment or modification
project. The loggerhead sea turtle (Caretta caretta)
and green sea turtle (Chelonia mydas) are federally-
listed threatened and endangered species, respectively,
and are regularly monitored during beach nourishment
activities. Many different variables related to sea
turtles have been monitored, including nest density,
grain size distribution, sand moisture content,
incubation period, hatching success, emerging success,
hatchling fitness, clutch size, sand compaction, and sand temperature (Milton et al. 1997, Steinitz et al.
1998, Davis et al. 1999, Rumbold et al. 2001, Brock et al. 2009). Nesting density is often measured as
part of monitoring programs and is determined by observing crawl tracks. Crawl tracks can also
indicate the species and type of crawl (Rumbold et al. 2001).
Macro-Invertebrate Sampling
Macro-invertebrate species are sampled to characterize the ecological response of the beach after
nourishment. These species are used because they capture the spatial distribution of perturbations due to
their relatively sedentary nature and short life-cycles, and because they are an important component of
the nearshore food web (Peterson et al. 2000). Macro-invertebrates can be sampled concurrently with
sediment and beach profile sampling; however, the timing and frequency of invertebrate sampling
should be designed to maximize the opportunity to capture representative population samples. A
stratified sampling plan perpendicular to the shoreline, day and night sampling, and sampling during
different tidal elevations may be appropriate because invertebrates (and other animals) respond to these
environmental cues differently (Rudloe 1980, Peterson et al. 2006). Monitoring studies in North
Carolina have studied mole crabs, coquina clams, and ghost crabs and have documented the effects of
prey population changes on shorebird populations (Peterson et al. 2000, Peterson et al. 2006).
Coring is preferred over grab sampling because coring extends to the full depth of occupation of the
sediment column, captures sedimentary strata, and includes the same amount of sediment per sample
(Peterson and Bishop 2005). Ghost crabs can be monitored by counting active ghost crab burrow holes
along the upper (mid-intertidal to dune crest) portion of beach profiles (Peterson et al. 2006). Lucrezi et
al. (2009) found that several environmental factors significantly influence ghost crab burrow numbers
and recommend that counts be limited to within a few hours after sunrise on days with low wind. See
the Minimizing Impact to Benthic Invertebrate Populations section for more information on the effects
of sediment placement on benthic invertebrates and actions to help reduce impacts.
Figure 14. Kemp’s ridley sea turtle (Lepidochelys kempii), a federally-listed endangered species, Padre Island National Seashore, Texas (NPS photo).

32
Other Biological Resources
Other biological resources may require monitoring depending on the project and species present. Birds,
fish, seagrasses, invertebrates, dune plants, and corals are just some of the resources that may be
monitored. For example, projects in the Great Lakes may monitor the federally-listed threatened and
endangered Piping plover (Charadrius melodus), while projects in the Northeastern U.S. may monitor
the federally-listed threatened Northeastern Beach Tiger Beetle (Cicindela dorsalis dorsalis). Nearshore
nourishment projects may monitor subtidal populations of invertebrates or fish that burrow and lay eggs
in subtidal sands (e.g., sand lance and grunion).

33
Permits and Regulations
In addition to the NPS Organic Act, the key federal laws related to beach nourishment in units of the
NPS are Section 404 of the Clean Water Act of 1972, the Rivers and Harbors Appropriation Act of
1899, and NEPA of 1970. NEPA requires the Federal Government to consider all reasonable
alternatives before beginning any federal action. The analysis of alternatives is investigated through an
Environmental Assessment or Environmental Impact Statement. Wetland and/or floodplain Statements
of Finding may need to be attached to NEPA documents as required by NPS wetland protection and
floodplain management procedures and as required by federal acts and Executive Orders (a
representative list follows) and any state and county laws and permitting requirements that might apply.
The NPS decision-maker must issue a written finding that the planned action will not lead to an
impairment of park resources and values before proceeding. More information regarding the NEPA
process can be found in the NPS Director’s Order #12 and Handbook for Environmental Analysis,
available online through the NPS Office of Policy (NPS 2012b). For information related to NPS
jurisdiction see the Ocean and Coastal Park Jurisdiction Reference Manual #39-1 (NPS 2011).
Other federal laws and executive orders affecting coastal nourishment projects include, but are not
limited to, the Endangered Species Act, Coastal Zone Management Act, National Historic Preservation
Act, Clean Air Act, Fish and Wildlife Coordination Act, Land and Water Conservation Fund Act, Water
Resources Development Act, Shore Protection Act, Coastal Barrier Improvement Act, Outer Continental
Shelf Lands Act, Magnuson-Stevens Act, Marine Mammal Protection Act, Migratory Bird Treaty Act,
Executive Order 13089: Coral Reef Protection, Executive Order 13158: Marine Protected Areas,
Executive Order 11990: Protection of Wetlands, Executive Order 11988: Floodplain Management, and
DOI Secretarial Order 3289: Climate Change.
The NPS Director’s Order #12 Handbook lists 7 steps in a typical NEPA analysis process:
Step 1: Identify your park’s need for action;
Step 2: Identify your park’s goals and objectives in taking action;
Step 3: Identify your proposal;
Step 4: Identify issues or problems that need to be addressed to reach park goals and objectives;
Step 5: Resolve these issues by creating reasonable alternatives;
Step 6: Identify information gaps and needs and gather needed data; and
Step 7: Identify the impacts of each alternative.
Communication with all affected agencies and stakeholders early and throughout the project is key for a
smooth permitting process. For example, if a project will be interacting with the USFWS, it is
recommended to contact the USFWS person who will ultimately be writing the response letter and
discuss concerns they foresee related to the project. Early coordination with the Bureau of Ocean
Energy Management is also important if outer continental shelf (OCS) sand or gravel will be mined
(guidelines for obtaining resources from the OCS are available at
http://www.boemre.gov/sandandgravel/PDF/MMSGuidelines/Final_MMS_Guidelines_120208.pdf).
Public involvement is also a critical component of the process and is used as the basis for developing
alternatives (NOAA 2010).

34
The NEPA process includes many details and key steps that cannot be missed. The NPS Office of
Policy (NPS 2012b) webpage provides helpful documents under Director’s Order #12, including the
“Handbook for Environmental Impact Analysis” and “NEPA’s 40 Most Asked Questions.” Additional
help with the NEPA process is available by contacting the planning and compliance staff in your region.
State and local regulations may also play an important role in coastal nourishment projects. Many states
have specific beach nourishment requirements that must be taken into account when planning a beach
nourishment project. Appendix A lists the lead coastal management agency for states containing a
national park unit with ocean, coastal, or Great Lakes shoreline, as identified in Curdts (2011).
Appendix A also includes a brief summary of some of the major regulations related to beach
nourishment for each state.
The Coastal Zone Management Act (CZMA) of 1972 requires coastal states to develop and implement
coastal zone management plans (CMPs). CMPs provide for the management of land and water uses that
have a direct and significant impact on coastal resources. CMPs must be submitted to the Department of
Commerce’s NOAA for approval by the state. The CZMA requires federal agencies to conduct
activities in a manner consistent with the state’s federally approved coastal management program. If the
project’s state does have a federally approved program, a statement of consistency must be presented to
the lead state agency by the federal project proponent to determine the project’s consistency with the
state’s coastal management program prior to the beginning of the project. State coastal management
program managers and federal consistency contacts for each state can be found online at
http://coastalmanagement.noaa.gov/consistency/welcome.html.
A synopsis of state policies, laws, and regulations pertaining to beach nourishment, nearshore sand
mining, dredge and fill operations, sand scraping/dune reshaping, dune creation/restoration, and public
access is located in Appendix B of the State, Territory, and Commonwealth Beach Nourishment
Program, A National Overview (NOAA 2000).

35
References
Avissar, N. G. 2006. Modeling Potential Impacts of Beach Replenishment on Horseshoe Crab Nesting
Habitat Suitability. Coastal Management 34(4):427–441.
Barnes, N. B. and A. M. Wenner. 1968. Seasonal variation in the sand crab Emerita analoga (Decapoda,
Hippidae) in the Santa Barbara area of California. Limnology and Oceanography 13(3):465–475.
Bergquist, D. C., S. Crowe, M. Levisen and R. F. Van Dolah. 2005. Change and Recovery of Physical
and Biological Characteristics at Beach and Borrow Areas Impacted by the 2005 Folly Beach
Renourishment Project. U.S. Army Corps of Engineers, Charleston District, Charleston, SC.
Bodge, K., S. C. Howard, and E. J. Olsen. 2006. Regional Sand Transport Study: Morehead City Harbor
Federal Navigation Project. Olsen Associates, Inc., Carteret County, NC.
Brock, K. A., J. S. Reece, and L.M. Ehrhart. 2009. Effects of Beach Nourishment on Marine Turtles.
Restoration Ecology 17(2):297–307.
Bishop, M. J., C. H. Peterson, H. C. Summerson, H. S. Lenihan, and J. H. Grabowski. 2006. Deposition
and Long-Shore Transport of Dredge Spoils to Nourish Beaches: Impacts to Benthic Infauna of an
Ebb-Tidal Delta. Journal of Coastal Research 223:530–546.
Browder, A. E. and R.G. Dean. 2000. Monitoring and Comparison to predictive models of the Perdido
Key beach nourishment project, Florida, USA. Coastal Engineering 39:173–191.
Colosio, F., M. Abbiati, and L. Airoldi. 2007. Effects of Beach Nourishment on Sediments and Benthic
Assemblages. Marine Pollution Bulletin 54:1197–1206.
Crain, D. A., A. B. Bolten, and K. A. Bjorndal. 1995. Effects of Beach Nourishment on Sea Turtles:
Review and Research Initiatives. Restoration Ecology 3(2):95–104.
Cruz-Motta, J. J. and J. Collins. 2004. Effects of dredged material disposal on a tropical soft-bottom
benthic assemblage. Marine Pollution Bulletin 48:270–280.
Curdts, T. 2011. Shoreline Length and Water Area in the Ocean, Coastal and Great Lakes Parks:
Updated Statistics for Shoreline Miles and Water Acres. Natural Resource Data Series
NPS/WASO/NRDS—2011/282. National Park Service, Fort Collins, Colorado.
Davis, R. A., M. V. FitzGerald, and J. Terry. 1999. Turtle Nesting on Adjacent Nourished Beaches with
Different Construction Styles: Pinellas County Florida. Journal of Coastal Research 15:111–120.
Dean, R. G. 1974. Compatibility of Borrow Material for Beach Fill. Proceedings 14th International
Conference on Coastal Engineering. Copenhagen, Denmark.
Dean, R. G. 1988. Recommendations for Placement of Dredged Sand on Perdido Key, Gulf Islands

36
National Seashore. Coastal and Oceanographic Engineering Department, University of Florida,
Gainesville, FL.
Dean, R. G. 2002. Beach Nourishment: Theory and Practice. Advanced Series on Ocean Engineering,
Vol. 18. World Scientific Publishing, Singapore, 399 pp.
Dean, R. G., E. Otay, and P. A. Work. 1995. Perdido Key beach nourishment project: A synthesis of
findings and recommendations for future nourishments. UFL/COEL-95/011. Coastal and
Oceanographic Engineering Department, University of Florida, Gainesville, Florida.
Defeo, O., A. McLachlan, D. S. Schoeman, T. A. Schlacher, J. Dugan, A. Jones, M. Astra, and F.
Scapini. 2009. Threats to Sandy Beach Ecosystems: A Review. Estuarine, Coastal and Shelf Science
81:1–12.
Florida Administration Code (FAC). 2001. Rules and Procedures for Application for Coastal
Construction Permits, Chapter 62B-41.
Florida Department of Environmental Protection (FDEP). 2010. Offshore Sand Search Guidelines.
Gailani, J. Z. and S. J. Smith. 2006. Numerical Modeling Studies Supporting Nearshore Placement of
Dredged Material from the Savannah River Entrance Channel. U.S. Army Engineer Research and
Development Center, Coastal and Hydraulics Laboratory, Vicksburg, Mississippi.
Gares, P. A., Y. Wang, and S. A. White. 2006. Using LIDAR to Monitor a Beach Nourishment Project
at Wrightsville Beach, North Carolina, USA. Journal of Coastal Research 22(5):1206–1219.
Gorzelany, J. F. and W. G. Nelson. 1987. The effects of beach replenishment on the benthos of a
subtropical Florida beach. Marine Environmental Research 21:75–94.
Gravens, M., B. Ebersole, T. Walton, and R. Wise. 2008. Beach Fill Design. In: Coastal Engineering
Manual, Part V, Coastal Project Planning and Design, Chapter IV-4, Engineer Manual 1110-2-1100,
U.S. Army Corps of Engineers, Washington, D.C.
Greene, K. 2002. Beach Nourishment: A Review of the Biological and Physical Impacts. Atlantic States
Marine Fisheries Commission, Washington, D.C. ASMFC Habitat Management Series no. 7.
Hansen, J. E. and P. L. Barnard. 2010. Sub-weekly to interannual variability of a high-energy shoreline.
Coastal Engineering 57:959–972.
Harvey, M., D. Gauthier, and J. Munro. 1998. Temporal changes in the composition and abundance of
the macro-benthic invertebrate communities at dredged material disposal sites in the Anse a Beaufils
Bais des Chaleurs, Eastern Canada. Marine Pollution Bulletin 36:41–55.
Jordan, L. K. B., K. W. Banks, L. E. Fisher, B. K. Walker, and D. S. Gilliam. 2010. Elevated
sedimentation on coral reefs adjacent to a beach nourishment project. Marine Pollution Bulletin
60:261–271.

37
King, D. and C. Galvin. 2002. Coastal Sediment Properties. In: Coastal Engineering Manual, Part III,
Coastal Sediment Processes, Chapter I-1, Engineer Manual 1110-2-1100, U.S. Army Corps of
Engineers, Washington, D.C.
Lucrezi, S., T. A. Schlacher, and S. Walker. 2009. Monitoring human impacts on sandy shore
ecosystems: a test of ghost crabs (Ocypode spp.) as biological indicators on an urban beach.
Environmental Monitoring Assessment 152:413–424.
McLachlan, A. 1996. Physical factors in benthic ecology: effects of changing sand particle size on beach
fauna. Marine Ecology Progress Series 131:205–217.
Milton, S. L., A. A. Schulman, and P. Lutz. 1997. The Effect of Beach Nourishment with Aragonite
versus Silicate Sand on Beach Temperature and Loggerhead Sea Turtle Nesting Success. Journal of
Coastal Research 13(3):904–915.
Moffat & Nichol. 2006. Final Sand Compatibility and Opportunistic Use Program Plan. Moffat &
Nichol, Long Beach, California.
Moore, L. J. 2000. Shoreline Mapping Techniques. Journal of Coastal Research 16(1):111–124.
Morton, R.A. 2008. Historical Changes in the Mississippi Barrier Island Chain and the Roles of Extreme
Storms, Sea Level, and Human Activities. Journal of Coastal Research 24(6):1587–1600.
Munsell Color. 2010. Munsell Color System; Color Matching from Munsell Color Company. Available
from http://www.xrite.com/top_munsell.aspx (accessed 12 October 2010).
Nairn, R., J. A. Johnson, D. Hardin and J. Michel. 2004. A Biological and Physical Monitoring Program
to Evaluate Long-term Impacts from Sand Dredging Operations in the United States Outer
Continental Shelf. Journal of Coastal Research 20: 126–137.
National Oceanic and Atmospheric Administration (NOAA). 2000. State, Territory, and Commonwealth
Beach Nourishment Program: A National Overview. Available from
http://coastalmanagement.noaa.gov/resources/docs/finalbeach.pdf
National Oceanic and Atmospheric Administration (NOAA). 2001. Guidance for Benthic Habitat
Mapping: An Aerial Photographic Approach. Available from
http://www.csc.noaa.gov/digitalcoast/_/pdf/bhmguide.pdf
National Oceanic and Atmospheric Administration (NOAA). 2008. LIDAR 101: An Introduction to
LIDAR Technology, Data, and Applications. Available from
http://www.csc.noaa.gov/digitalcoast/_/pdf/What_is_Lidar.pdf
National Oceanic and Atmospheric Administration (NOAA). 2010. Beach Nourishment: A Guide for
Local Government Officials. Available from http://www.csc.noaa.gov/beachnourishment/html/human/law/index.htm (accessed 20 October 2010).
38
National Park Service (NPS). 2006. Management Policies. U.S. Department of Interior, National Park
Service, Washington, D.C.
National Park Service (NPS). 2011. Ocean and Coastal Park Jurisdiction Reference Manual #39-1.
National Park Service, Lakewood, Colorado.
National Park Service (NPS). 2012a. Inventory and Monitoring Protocol Database. Available from
http://science.nature.nps.gov/im/monitor/VitalSigns/BrowseProtocol.aspx
National Park Service (NPS). 2012b. National Park Service Office of Policy. Available from
http://www.nps.gov/applications/npspolicy/index.cfm
National Park Service (NPS). 2012c. National Park Service Procedural Manual #77-1: Wetland
Protection. National Park Service, Fort Collins, Colorado.
Nelson, W. G. 1993. Beach Restoration in the Southeastern US: Environmental Effects And Biological
Monitoring. Ocean and Coastal Management 19:157–182.
North Carolina Administration Code (NCAC). 2007. Technical Standards for Beach Fill Projects, 15A
NCAC 07H .0312.
Peterson, C. H., D. H. M. Hickerson, and G. G. Johnson. 2000. Short-term consequences of nourishment
and bulldozing on the dominant large invertebrates of a sandy beach. Journal of Coastal Research
16:368–378.
Peterson, C. H. and M. J. Bishop. 2005. Assessing the Environmental Impacts of Beach Nourishment.
Bioscience 5(10):887–896.
Peterson, C. H., M. J. Bishop, G. A. Johnson, L. M. D'Anna, and L. M. Manning. 2006. Exploiting
Beach Filling as an Unaffordable Experiment: Benthic Intertidal Impacts Propagating Upwards to
Shorebirds. Journal of Experimental Marine Biology and Ecology 338:205–221.
Rakocinski, C. F., R. W. Heard, S. E. LeCroy, J. A. McLelland, and T. Simons. 1996. Responses by
macrobenthic assemblages to extensive beach restoration at Perdido Key, Florida, U.S.A. Journal of
Coastal Research 12: 326–353.
Rice, T. M. 2009. Best Management Practices for Shoreline Stabilization to Avoid and Minimize
Adverse Environmental Impacts. Prepared for the USFWS, Panama City Ecological Services Field
Office.
Rudloe. A. 1980. The Breeding Behavior and Patterns of Movement of Horseshoe Crabs, Limulus
polyphemus, in the Vicinity of Breeding Beaches in Apalachee Bay, Florida. Estuaries 3(3):177–183.
Rumbold, D. G., P. W. Davis, and C. Perretta. 2001. Estimating the effect of beach nourishment on
Caretta caretta (loggerhead sea turtle) nesting. Restoration Ecology 9:304–310.

39
Schupp, C. A., G. P. Bass, and W. G. Grosskopf. 2007. Sand Bypassing Restores Natural Processes to
Assateague Island, Maryland. Coastal Sediments Conference Proceedings, New Orleans, Louisiana.
Science Applications International Corporation. 2007. Draft Review of Biological Impacts Associated
with Sediment Management and Protection of California Coastal Biota. Prepared for the California
Coastal Sediment Management Workgroup, under contract with the Beacon Erosion Authority for
Clean Oceans and Nourishment (BEACON).
Schumacher, B.A. 2002. Methods for the Determination of Total Organic Carbon (TOC) in soils and
sediment. United States Environmental Protection Agency Environmental Sciences Division National
Exposure Research Laboratory, Las Vegas, Nevada.
Smith, S. D. A. and M. J. Rule. 2001. The effects of dredge-spoil dumping on a shallow water soft-
sediment community in the Solitary Islands Marine Park, NSW, Australia. Marine Pollution Bulletin
42:1040–1048.
Smith, S. J., J. Marsh, and T. Puckette. 2007. Analysis of Fluorescent Sediment Tracer for Evaluating
Nearshore Placement of Dredged Material. U.S. Army Engineer Research and Development Center,
Coastal and Hydraulics Laboratory, Vicksburg, Mississippi.
Speybroeck, J., D. Bonte, W. Courtens, T. Gheskiere, P. Grootaert, J. Maelfait, M. Mathys, S. Proovst,
K. Sabbe, E. W. M. Stienen, V. V. Lancker, M. Vincx, and S. Degraer. 2006. Beach nourishment: an
ecologically sound coastal defense alternative? A review. Aquatic Conservation: Marine and
Freshwater Ecosystems 16:419–435.
Steinitz, M. J., M. Salmon, and J. Wyneken. 1998. Beach Renourishment and Loggerhead Turtle
Reproduction: A Seven-Year Study at Jupiter Island, Florida. Journal of Coastal Research 14(3):
1000–1013.
Thayer, G. W., T. A. McTigue, R. J. Bellmer, F. M. Burrows, D. H. Merkey, A. D. Nickens, S. J.
Lozano, P. F. Gayaldo, P. J. Polmateer, and P.T. Pinit. 2003. Science-Based Restoration Monitoring
of Coastal Habitats, Volume One: A Framework for Monitoring Plans Under the Estuaries and Clean
Waters Act of 2000 (Public Law 160–457). NOAA Coastal Ocean Program Decision Analysis Series
No. 23, Volume 1. NOAA National Centers for Coastal Ocean Science, Silver Spring, Maryland.
U.S. Army Corps of Engineers (USACE). 2010a. Environmental Assessment Mississippi Coastal
Improvement Program – Barrier Island Restoration Plan, West Ship Island North Shore Restoration.
U.S. Army Corps of Engineers, Mississippi Sound, Mississippi.
U.S. Army Corps of Engineers (USACE). 2010b. Morehead City Dredged Material Management Plan.
U.S. Army Corps of Engineers, Wilmington, North Carolina.
U.S. Department of Commerce (USDOC), National Ocean and Atmospheric Administration. 2000.
State, Territory, and Commonwealth Beach Nourishment Programs: A National Overview. National
Ocean Service, Office of Ocean & Coastal Resource Management. Technical Document No. 00-01.

40
U.S. Environmental Protection Agency and United States Army Corps and Engineers (USEPA and
USACE). 1998. Evaluation of Dredged Material Proposed for Discharge in Waters of the U.S. -
Testing Manual, Inland Testing Manual. EPA reference 823-B-98-004, USACE Office of Water,
Washington, D.C.
U.S. Fish and Wildlife Service (USFWS). 2005. Biological Opinion on the Effects of Construction and
Operation of a Sand Slurry Pipeline System at the National Park Service, Sandy Hook Unit, Gateway
National Recreation Area, Monmouth County, New Jersey on Piping Plover (Charadrius melodus),
Seabeach Amaranth (Amaranthus pumilus), and Northeastern Beach Tiger Beetle (Cicindea dorsalis
dorsalis). U.S. Fish and Wildlife Service, Pleasantville, New Jersey.
U.S. Geological Society (USGS). 2010. A Servicewide Benthic Mapping Program for National Parks.
Available from http://pubs.usgs.gov/of/2010/1264/pdf/ofr2010-1264.pdf
Van Dolah, R. F., D. R. Calder, and D. M. Knott. 1984. Effects of Dredging and Open-Water Disposal
on Benthic Macroinvertebrates in a South Carolina Estuary. Estuaries 7(1): 26–37.
Vivian, J. M., M. D. Domenico, and T. Cesear Marques de Almeida. 2009. Effects of dredged material
disposal on benthic macrofauna near Itajai Harbor (Santa Catarina, South Brazil). Ecological
Engineering 35: 1435–1443.
Work, P. A. and R. G. Dean. 1992. Perdido Key Beach Nourishment Project: Gulf Islands National
Seashore 1991 annual Report.

41
Appendix A: State Beach Nourishment Policies
States listed in the table and in the following paragraphs are those that have a national park unit with
ocean, coastal, or Great Lakes shoreline, as identified in Curdts (2011).
Table 4. Information sources for state beach nourishment policies. Table adapted from USDOC/NOAA (2000).
State Lead Coastal Management Agency
Alaska Dept. of Natural Resources, Alaska Coastal Management Program
American Samoa Dept. of Commerce
California Coastal Commission, San Francisco Bay Conservation and Development Commission,
State Coastal Conservancy
Florida Dept. of Environmental Protection
Georgia Dept. of Natural Resources, Coastal Resources Division
Guam Bureau of Statistics and Plans
Hawaii Office of Planning and Office of Conservation and Coastal Lands
Indiana Dept. of Natural Resources
Louisiana Office of Coastal Protection and Restoration
Maine State Planning Office
Maryland Dept. of Natural Resources
Massachusetts Executive Office of Environmental Affairs, Office of Coastal Zone Management
Michigan Dept. of Natural Resources and Environment, Office of the Great Lakes
Minnesota Dept. of Natural Resources
Mississippi Dept. of Marine Resources
New Jersey Dept. of Environmental Protection, Bureau of Coastal Engineering
New York Dept. of Environmental Conservation
North Carolina Dept. of Environment and Natural Resources, Division of Coastal Management
Ohio Dept. of Natural Resources, Office of Coastal Management
Oregon Dept. of Land Conservation and Development, Oregon Parks and Recreation Dept.
Puerto Rico Dept. of Natural and Environmental Resources
South Carolina Dept. of Health and Environmental Control, Ocean & Coastal Resource Management
Texas General Land Office
Virgin Islands Dept. of Planning and Natural Resources, Division of Coastal Zone Management
Virginia Dept. of Environmental Quality
Washington Dept. of Ecology
Wisconsin Dept. of Administration, Bureau of Intergovernmental Relations
The following state policies are subject to change and may not be complete. More information was

42
found for some states than others. States with limited information do not necessarily have fewer policies
or requirements. States not listed may also have relevant policies. Please confirm all requirements with
the appropriate state agency. Additional federal and/or local permits may also be required.
Alaska
The Alaska Department of Natural Resources oversees the Alaska Coastal Management Program. The
Alaska Administration Code 112.200 states that placement of structures and the discharge of dredged or
fill material into coastal waters must, at a minimum, comply with the standards contained in 33 CFR
Parts 320–323 (the federal Navigation and Navigable Waters law). In addition to the statewide policies,
some coastal districts also have enforceable policies related to beach nourishment and disposal of
dredged material.
Alaska Coastal Management Program, Department of Natural Resources: http://alaskacoast.state.ak.us/
American Samoa
The Department of Commerce serves as the lead agency for the American Samoa Coastal Program.
Land use permits are required for placing fill, dredging, or removing sediment from any coastal
wetlands. Please contact the Department of Commerce for more information.
American Samoa Department of Commerce: http://www.doc.as/
California
The California Coastal Commission (CCC) is the lead agency responsible for carrying out California’s
Coastal Management Program by planning for and regulating development in the coastal zone consistent
with the policies of the California Coastal Act. The CCC requires permits for any development within
the coastal zone, broadly defined as the placement or erection of any solid material or structure,
discharge or disposal of any dredged material; grading, removing, dredging, mining or extraction of any
materials; or change of density of intensity of use of land. The San Francisco Bay Conservation and
Development Commission is responsible for the San Francisco Bay-Delta portion of the coastal zone. In
areas where there is a certified Local Coastal Program one must apply to that city or country directly.
California Coastal Commission: http://www.coastal.ca.gov/index.html
Florida
The Florida Department of Environmental Protection serves as the lead agency for the Florida Coastal
Program. A Joint Coastal Permit is required to conduct any coastal construction activities. Florida has
extensive eligibility criteria for coastal construction permits, including requirements related to marine
turtle protection, design, siting, and sediment compatibility (see Table 1). Florida law requires that all
sandy sediment excavated from the coastal system be deposited on the adjacent beach or in the
nearshore. Monitoring programs are also required for any construction that is determined to have an
adverse impact.
Florida Joint Coastal Permit Program: http://www.dep.state.fl.us/beaches/programs/envpermt.htm#JCP
Florida Rules and Procedures for Application for Coastal Construction Permits (PDF):
https://www.flrules.org/gateway/ChapterHome.asp?Chapter=62B-41

43
Georgia
The Georgia Department of Natural Resources, Coastal Resources Division Coastal Management
Program serves as the lead agency for the Georgia Coastal Program. A permit is required for all
shoreline engineering activities and for all land alteration on beaches, sand dunes, and submerged lands.
A permit will be issued only if the activity will not impair the values and functions of the natural system
of sediment transport including the coastal sand dunes, beaches, sandbars, and shoals and if the activity
is not contrary to the public interest. The Georgia Shore Protection Act outlines the permitting process
and requirements for beach nourishment activities.
Georgia Department of Natural Resources, Coastal Resources Division: http://crd.dnr.state.ga.us/
Georgia Shore Protection Act: http://crd.dnr.state.ga.us/content/displaycontent.asp?txtDocument=84
Guam
The Bureau of Statistics and Plans oversees the Guam Coastal Management Program and the use,
protection, and development within Guam’s coastal zone. The Guam Territorial Seashore Protection
Act requires a permit for any development (discharge of any dredged material or dredging, mining, or
removal of any material) within a seashore reserve.
Guam Bureau of Statistics and Plans: http://www.bsp.guam.gov/
Hawaii
The Office of Conservation and Coastal Lands, within the Department of Land Natural Resources, is
responsible for overseeing beach and marine lands out to the seaward extent of the state’s jurisdiction.
Permits are required for all beach nourishment activities and are broken into two categories. Category I
includes projects less than 380 m3 (500 yd
3) and Category II represents projects from 380–7,600 m
3
(500–10,000 yd3). Projects greater than 7,600 m
3 (10,000 yd
3) require individual consultation with other
agencies. All projects require sediment compatibility between the native and proposed fill material.
Applications and beach nourishment guidelines are available on the Office of Conservation and Coastal
Lands website.
Hawaii Office of Conservation and Coastal Lands: http://portal.ehawaii.gov/
Indiana
The Department of Natural Resources regulates beach nourishment in Indiana. Beach nourishment
activities are encouraged through state statute to protect and increase sand in Indiana along Lake
Michigan. A permit is required to place fill, erect a permanent structure, or remove material from a
navigable waterway. Some projects may be eligible for a general permit. A royalty fee for the removal
of materials dredged from Lake Michigan may be waived if any suitable material is placed along the
Lake Michigan shoreline as beach nourishment for the beneficial use of the general public.
Indiana Department of Natural Resources: http://www.in.gov/dnr/

44
Louisiana
The Louisiana Department of Natural Resources, Office of Coastal Management (OCM) works to
protect, develop, and restore or enhance the resources of the state’s coastal zone. A Coastal Use Permit
is required for projects that may impact coastal waters, including dredging or filling. The OCM requires
beneficial use of dredged material wherever possible and has four options for permit applicants involved
in coastal projects that include dredging:
1. Implementing a project that makes beneficial use of the dredged material;
2. Providing for the use of the dredged material on an approved coastal restoration project;
3. Using dredged material at another location that creates the same amount of beneficial use; or
4. Making a voluntary contribution to the Coastal Resources Trust fund, based on the amount of
material dredged.
Louisiana Office of Coastal Management, Coastal Use Permit:
http://dnr.louisiana.gov/index.cfm?md=pagebuilder&tmp=home&pid=90&pnid=0&nid=189
Maine
The State Planning Office leads the Maine Coastal Program. Any dredging, bulldozing, or removing or
displacing of material within the coastal sand dune system or coastal wetlands requires a Natural
Resources Protection Act (NRPA) permit. The NRPA requires beach nourishment projects to use
material that has texture and color characteristics consistent with the natural beach material. The profile
of the new nourished beach must also be compatible with the natural beach profile and the timing of the
project should minimize impacts on existing wildlife.
Maine Coastal Program, State Planning Office: http://www.maine.gov/spo/coastal/index.htm
Maine’s Natural Resources Protection Act: http://www.maine.gov/dep/blwq/docstand/nrpapage.htm
Maryland
The Department of Natural Resources is the lead agency for Maryland’s Chesapeake & Coastal
Program. Maryland’s coastal policies include the following beach nourishment requirements:
The fill material grain size shall be equal to or greater in grain size and character to the existing
beach material, or determined otherwise to be compatible with existing site conditions and
acceptable to the Department;
The fill material shall be relatively free of organic material, floating debris, or other objects;
Silt and clay fills that change the sandy nature of the existing beach materials are not acceptable;
Gravel fill may be acceptable, if particle sizes are equal to or greater than the existing beach
materials; and
Fill material shall be placed above the mean high water line before final grading to achieve the
desired beach profile, unless site conditions prohibit the placement of fill material above the
mean high water line and specific measures are designed to prevent material from washing away
from the site.
Maryland Coastal Program, Department of Natural Resources: http://www.dnr.state.md.us/ccp/index.asp
Massachusetts
The Massachusetts Office of Coastal Zone Management (OCZM) serves as the lead agency for policy
and technical assistance related to the Massachusetts Coastal Management Program. Proponents of

45
beach nourishment projects are required to obtain a permit that includes characterizing beach conditions
and stability and documenting the physical and chemical properties of the fill and native material. The
Massachusetts Department of Environmental Protection and OCZM published a report detailing best
management practices for beach nourishment projects in Massachusetts. By following the guidance
proponents can expedite the permitting process. The report can be found online at:
http://www.mass.gov/dep/water/resources/bchbod.pdf
Massachusetts Office of Coastal Zone Management: http://www.mass.gov/czm/czm.htm
Michigan
The Office of the Great Lakes, within the Department of Natural Resources and Environment,
administrates Michigan’s Coastal Management Program. The Shorelands Protection and Management
section of the Natural Resources and Environmental Protection Act is the key state statute regarding
coastal erosion and the environmental protection of coastal areas. Permits are required for dredging,
filling, grading, or placement of permanent structures in designated environmental areas.
Michigan Coastal Management Program: http://www.michigan.gov/deq/0,1607,7-135-
3313_3677_3696---,00.html
Michigan Shorelands Protection and Management Permit:
http://michigan.gov/statelicensesearch/0,1607,7-180-24786_24825-244641--,00.html
Minnesota
The Department of Natural Resources (DNR) manages Minnesota’s Lake Superior Coastal Program.
One goal of the DNR it to limit the use of beach sand and other types of fill in order to prevent damage
to fish spawning areas, aquatic habitat, and water quality of Minnesota’s lakes. For most projects
constructed below the ordinary high-water level of public waters, an individual Public Waters Work
Permit is required.
Minnesota’s Lake Superior Coastal Program: http://www.dnr.state.mn.us/waters/lakesuperior/index.html
Mississippi
The Mississippi Department of Marine Resources serves as the lead authoritative agency for activities in
the coastal zone. Permits are required for any dredging or filling activities and fill material must be non-
toxic and either stabilized or of sufficient size as to not be displaced during typical storm tides.
Mississippi Department of Marine Resources: http://www.dmr.state.ms.us/
New Jersey
The Bureau of Coastal Engineering, operating under the Office of Engineering and Construction and the
Department of Environmental Protection, is responsible for administering beach nourishment, shore
protection and coastal dredging projects throughout New Jersey. New Jersey regulates nourishment as a
non-structural shoreline protection measure. Uncontaminated dredged sediments with 75% sand or
greater are generally encouraged for beach nourishment (NJ Admin. Code 7:7E-4.8).
N.J. Admin Code 7:7E-7.11. Beach nourishment projects, such as non-structural shore protection
measures are encouraged, provided that:
1. The particle size and type of fill material is compatible with the existing beach material to

46
ensure that the new material will not be removed to a greater extent than the existing material
would be by normal tidal fluctuations;
2. The elevation, width, slope and form of proposed beach nourishment projects are compatible
with the characteristics of the existing beach;
3. The sediment deposition will not cause unacceptable shoaling in downdrift inlets and
navigation channels; and
4. Public access to the nourished beach is provided in cases where public funds are used to
complete the project.
New Jersey Bureau of Coastal Engineering: http://www.nj.gov/dep/shoreprotection/
New Jersey Administration Code (PDF): http://www.state.nj.us/dep/landuse/7-7e.pdf
New York
The Department of Environmental Conservation administers a Coastal Erosion Control Permit Program
that regulates beach restoration activities. In addition, the Department of State is in charge of the
Coastal Zone Management Policy and determining federal consistency. The following standards must
be met for permit issuance:
Is reasonable and necessary, considering reasonable alternatives to the proposed activity, and the
extent which the proposed activity requires a shoreline location;
Will not be likely to cause a measurable increase in erosion at the proposed site or other
locations; and
Prevents, if possible, or minimizes adverse effects on:
o Natural protective features and their functions and protective values;
o Existing erosion protection structures; and
o Natural resources including, but not limited to, significant fish and wildlife habitats and
shellfish beds.
New York Department of Environmental Conservation, Coastal Erosion Control Permit Program:
http://www.dec.ny.gov/permits/6064.html
New York State Coastal Policies: http://www.nyswaterfronts.com/consistency_coastalpolicies.asp
North Carolina
The North Carolina Department of Environment and Natural Resources, Division of Coastal
Management implements and supervises coastal zone management programs. North Carolina has
extensive regulations regarding beach nourishment and requires a Coastal Area Management Act permit.
Beach restoration, sand nourishment and disposal projects may be allowed when (15A North Carolina
Administration Code 07M.0202):
1. Erosion threatens to degrade public beaches and to damage public and private properties;
2. Beach restoration, nourishment or sand disposal projects are determined to be socially and
economically feasible and cause no significant adverse environmental impacts;
3. The project is determined to be consistent with state policies for shoreline erosion response and
state use standards for Ocean Hazards, Public Trust Waters, Areas of Environmental Concern
and the relevant rules and guidelines of state and federal review agencies.
The code also states that clean, beach quality material dredged from navigation channels within the
active near shore, beach or inlet shoal systems must not be removed permanently from the active near
shore, beach or inlet shoal system unless no practical alternative exists. Preferably, this dredged

47
material will be disposed of on the ocean beach or shallow active nearshore area where environmentally
acceptable and compatible with other uses of the beach (15A NCAC 07M.1101). North Carolina has
detailed, quantitative requirements regarding sediment compatibility (see Table 1) and sampling
techniques.
North Carolina Department of Environment and Natural Resources, Division of Coastal Management
Permits: http://dcm2.enr.state.nc.us/Permits/aecs.htm
North Carolina Administration Code: http://ncrules.state.nc.us/ncac.asp
Ohio
The Ohio Department of Natural Resources, Office of Coastal Management implements the Ohio
Coastal Management Program. A Shore Structure Permit is required before undertaking construction of
an erosion, wave, or flood control structure along the Lake Erie shoreline in Ohio. Shore structures
include beach nourishment, seawalls, groins, breakwaters, and more.
Ohio Department of Natural Resources, Office of Coastal Management Shore Structure Permits:
http://www.ohiodnr.com/Ohio_Coast/RegulatoryHome/ShoreStructureGuide2/tabid/9287/Default.aspx
Oregon
The Oregon Department of Land Conservation and Development serves as the lead agency for the
Oregon Coastal Program. Oregon’s ocean shore is managed by the Oregon Parks and Recreation
Department, which has an extensive permitting program for shoreline protection under The Ocean Shore
Law. A permit is required for any improvement made within the ocean shore. An improvement is
defined as filling, removing material, or constructing on the ocean shore. The ocean shore is defined as
the land lying between the extreme low tide of the Pacific Ocean and the statutory vegetation line or the
line of established upland shore vegetation, whichever is farther inland.
Oregon Coastal Management Program: http://www.oregon.gov/lcd/ocmp/
Oregon Ocean Shores Permitting, Oregon Parks and Recreation Department:
http://www.oregon.gov/OPRD/RULES/index.shtml
Puerto Rico
The Department of Natural and Environmental Resources (DNER) manages the maritime zone, coastal
waters, and submerged lands and serves as the lead agency for Puerto Rico’s Coastal Program. Please
check with the DNER for any required permits.
Puerto Rico Coastal Management Program, Department of Natural and Environmental Resources:
http://www.drna.gobierno.pr/oficinas/arn/recursosvivientes/costasreservasrefugios/pmzc/coastal-zone-
management-program
South Carolina
The Department of Health and Environmental Control, Ocean & Coastal Resource Management protects
and enhances South Carolina’s coastal resources. A permit is required for any land disturbing activity in
coastal waters, tidelands, beaches, or the beach/dune system. The Beachfront Management Act policies
severely restrict the use of hard erosion control devices and encourage the replacement of hard erosion

48
control devices with soft technologies that will provide for the protection of the shoreline without long-
term adverse effects.
South Carolina Department of Health and Environmental Control, Ocean & Coastal Resource
Management: http://www.scdhec.gov/environment/ocrm/
Texas
The Texas General Land Office is the designated lead coastal management agency. A permit is required
for any construction within 305 m (1,000 ft) landward from mean high tide and is issued by local
governments in conjunction with the Land Office.
Texas General Land Office, Caring for the Coast: http://www.glo.texas.gov/what-we-do/caring-for-the-
coast/index.html
Virgin Islands
The U.S. Virgin Islands Coastal Zone Management is managed and administered by the Division of
Coastal Zone Management, located within the Department of Planning & Natural Resources. A Coastal
Zone Management permit is required for any development activity along the coast, excluding all federal
land, offshore islands, and cays. The permit system is divided into major and minor permits, with the
distinction being how much effect the project will have on the coastal environment and community.
Virgin Islands Division of Coastal Zone Management: http://coastal-zone-management.dpnr.gov.vi/
Virginia
The Virginia Coastal Zone Management Program is comprised of a network of state agencies and local
governments with authority in the coastal zone. The Department of Environmental Quality serves as the
lead agency. Any shoreline stabilization project, including riprap, bulkheads, breakwaters, beach
nourishment, groins, or jetties require a Joint Permit. The Joint Permit Application is used to apply for
permits from the Local Wetlands Boards, Virginia Marine Resources Commission, Department of
Environmental Quality, and the U.S. Army Corps of Engineers.
Virginia Coastal Zone Management Program:
http://www.deq.state.va.us/Programs/CoastalZoneManagement.aspx
Washington
The Washington State Department of Ecology is the lead coastal management agency. Washington’s
Shoreline Management Act establishes a local/state partnership in administering permits. All shoreline
permits are processed by the local government and then sent to Ecology for approval. Permits are
required for any development within the shorelines of the state. Development consists of construction of
structures, dredging, filling, dumping, and removal of any sand, gravel, or minerals. Substantial
development permits are required for any development where the total cost exceeds five thousand
dollars or the development interferes with the normal public use of the water or shorelines of the state.
Washington Coastal Zone Management, Washington State Department of Ecology:
http://www.ecy.wa.gov/programs/sea/czm/index.html

49
Washington Shoreline Permit System:
http://www.ecy.wa.gov/programs/sea/sma/st_guide/administration/intro.html
Wisconsin
The Wisconsin Coastal Management Program is administered by the Department of Administration,
Bureau of Intergovernmental Relations. Chapter 30 of the Wisconsin Statues includes dredge and fill
regulations. Please contact the Coastal Management Program to learn about permits and requirements.
Wisconsin Coastal Management, Bureau of Intergovernmental Relations:
http://www.doa.state.wi.us/category.asp?linkcatid=648&linkid=65&locid=9


51
Appendix B: Case Study – North End Restoration Project, Assateague Island National Seashore, MD
Project Description Since its construction in 1935, a jetty system at
Ocean City Inlet has caused unnatural sediment
deprivation on northern Assateague Island,
Maryland, thereby lowering island elevation,
accelerating the natural shoreline erosion rate
(Figure 15), and causing associated habitat
degradation. To mitigate impacts of the loss of
natural sand transport processes, local and
national government agencies created a
comprehensive two-phase restoration plan.
The first short-term phase of the comprehensive
restoration plan occurred in 2002; this one-time
beach nourishment widened the beach by 30 m
(98 ft) over a distance of 10.5 km (6.5 mi) by replacing about 15% (1.4 million m3 or 1.8 million yd
3) of
the sand captured by the inlet since 1934 (Figure 16). Additionally, a low foredune was constructed
along the 2.4 kilometer-long (1.5 mi) area most vulnerable to overwash as a temporary measure to
prevent imminent island breaching and the consequences that a breach would have on the island, the
populated mainland, and inlet hydrodynamics.
The second phase, which began in January 2004, addressed the source of the problem, sediment
starvation, by restoring sediment transport to the nearshore area of the North End through biannual
mechanical bypassing of a sediment volume approximately equal to the natural pre-inlet longshore
transport rate (144,000 m3/yr or 188,000 yd
3/yr). This phase is planned to continue for 25 years. A
hopper dredge places the majority of sediment about 80–250 m (262–820 ft) from the high water
shoreline in depths of -1.5 to -5 m (-5 to -16 ft) (NAVD88), on the crest and just seaward of the
nearshore bar.
Measures of Project Success Quantitative metrics were identified and used to evaluate the overall performance of the project and to
identify if and when established threshold conditions for project modification were met:
Volume of sand mechanically bypassed (to show that the volume was equal to a natural pre-inlet
rate of sediment transport);
Shoreline change rate (to determine whether the management intervention achieved the desired
goal of shoreline erosion slowing to a natural pre-inlet rate of change);
Figure 15. Aerial image looking south showing Ocean City Inlet and eroded Assateague Island at the top of the image (Photograph by Jane Thomas, IAN Image Library; www.ian.umces.edu/imagelibrary)

52
Success and population size of piping plover, a federally-listed threatened and endangered bird
species (one indicator of a healthy early-succession beach habitat);
Percent area of sparse vegetation (a second indicator of healthy early-succession beach habitat)
Changes in the elevation of the constructed foredune (significant growth or decline would
indicate the need for further intervention); and
Frequency and extent of overwash events across the foredune (less than three events per year
would indicate that the foredune was acting as an unnatural barrier), with consideration given to
wave and wind conditions and the behavior of the surrounding areas of the North End.
Additionally, although it was not established as a project metric, the nearshore volumetric change is
regularly calculated in order to determine how much of the bypassed sand is reaching the shoreline.
Monitoring Program Many of the datasets needed to evaluate the project were already being collected by existing park
monitoring programs. Pre-construction and post-construction monitoring surveys of the project area
measured these characteristics:
Topographic and volumetric change: lidar (as available) and cross-island topographic profiles
spaced at 0.5 km (0.3 mi) intervals (twice yearly);
Shoreline response: high water shoreline position (quarterly);
Occurrence of plant communities (associations): observation of stratified random sampling
points, in particular to calculate area of sparse vegetation (annually);
Figure 16. Location map of the North End Restoration Project, Assateague Island National Seashore, MD (Figure from Schupp et al. 2007).
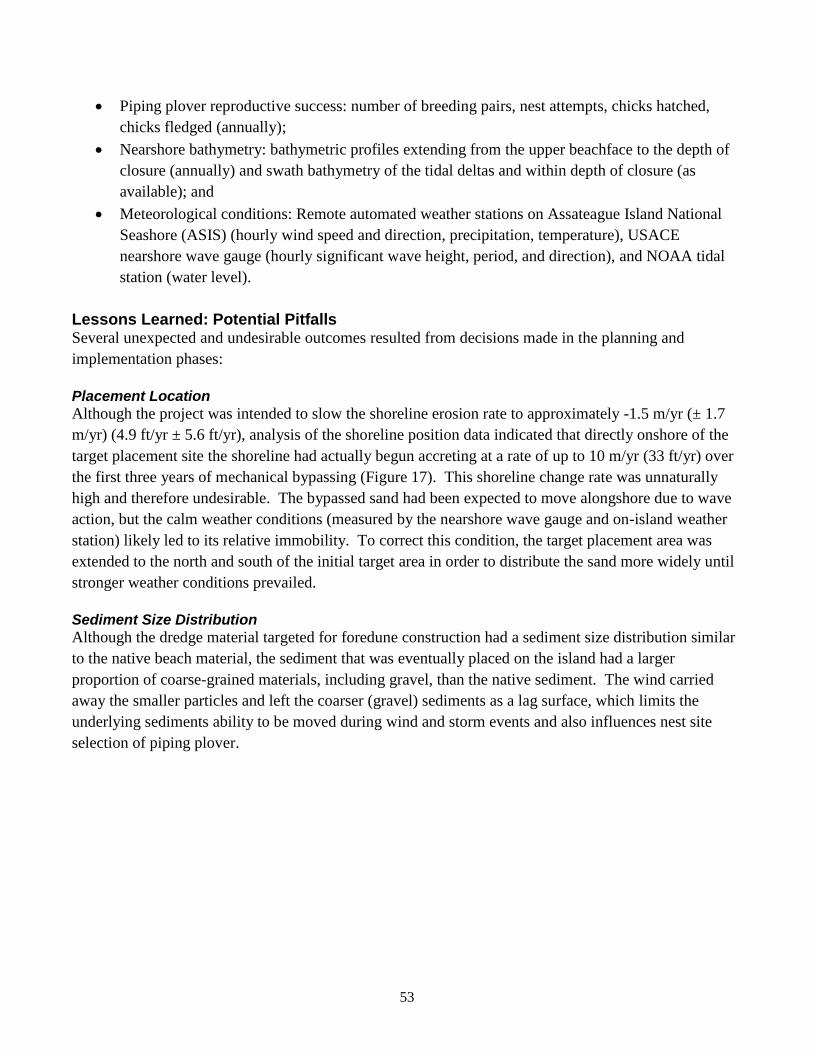
53
Piping plover reproductive success: number of breeding pairs, nest attempts, chicks hatched,
chicks fledged (annually);
Nearshore bathymetry: bathymetric profiles extending from the upper beachface to the depth of
closure (annually) and swath bathymetry of the tidal deltas and within depth of closure (as
available); and
Meteorological conditions: Remote automated weather stations on Assateague Island National
Seashore (ASIS) (hourly wind speed and direction, precipitation, temperature), USACE
nearshore wave gauge (hourly significant wave height, period, and direction), and NOAA tidal
station (water level).
Lessons Learned: Potential Pitfalls Several unexpected and undesirable outcomes resulted from decisions made in the planning and
implementation phases:
Placement Location
Although the project was intended to slow the shoreline erosion rate to approximately -1.5 m/yr (± 1.7
m/yr) (4.9 ft/yr ± 5.6 ft/yr), analysis of the shoreline position data indicated that directly onshore of the
target placement site the shoreline had actually begun accreting at a rate of up to 10 m/yr (33 ft/yr) over
the first three years of mechanical bypassing (Figure 17). This shoreline change rate was unnaturally
high and therefore undesirable. The bypassed sand had been expected to move alongshore due to wave
action, but the calm weather conditions (measured by the nearshore wave gauge and on-island weather
station) likely led to its relative immobility. To correct this condition, the target placement area was
extended to the north and south of the initial target area in order to distribute the sand more widely until
stronger weather conditions prevailed.
Sediment Size Distribution
Although the dredge material targeted for foredune construction had a sediment size distribution similar
to the native beach material, the sediment that was eventually placed on the island had a larger
proportion of coarse-grained materials, including gravel, than the native sediment. The wind carried
away the smaller particles and left the coarser (gravel) sediments as a lag surface, which limits the
underlying sediments ability to be moved during wind and storm events and also influences nest site
selection of piping plover.

54
Model Parameters
The dimensions of the nourished beach and the temporary foredune, which was built to prevent
breaching in the short period before the long-term mechanical bypassing phase could begin, were
modeled with the assumption that the recent erosion rates and storm frequency were representative of
the years to come. Instead, weather conditions were much calmer after the foredune was built, and ASIS
did not experience major storm impacts for 10 years following construction. As a result, the beach in
front of the foredune did not erode as quickly as expected, and the design height and setback of the
constructed foredune prevented overwash along the project’s entire length (2.4 km/1.5 mi), while the
surrounding portions of the North End experienced
overwash. The foredune also grew in volume, maintained its
height, and sheltered the island interior from wind and
waves. This fostered succession from sparsely vegetated
habitat to an increasing area of herbaceous vegetation, shrub
communities, and the associated growth of embryo dunes
due to the sand-trapping effects of the increased vegetation
(Figure 18).
The monitoring program enabled ASIS to identify and
quantify these undesirable changes in ecosystem function,
and to clearly and convincingly communicate to cautious
partners that there was a pressing need for action. NPS and
project partners are now mitigating these conditions by
Figure 18. Unexpected conditions led to a loss of overwash processes and a sheltered island interior at ASIS, fostering vegetation succession and dune growth (NPS photo).
Figure 17. Monitoring data illustrated that the shoreline section directly onshore of the sediment placement site became highly and unnaturally accretional, signaling the need for a change in placement site at ASIS (Figure from Schupp et al. 2007).

55
notching the foredune to allow overwash, by discussing appropriate placement sites before every
mechanical bypassing cycle, and by continuing to analyze monitoring data to identify any other
undesirable conditions that may arise.
Lessons Learned: Success Stories Many methods selected for this project appear to have been the correct choice for minimizing
undesirable impacts to visitors and the ecosystem.
Placement Timing
Mechanical bypassing is scheduled for early spring (February to March) and late fall (October) to
minimize potential conflicts with high recreational use (June to August), piping plover breeding season
(April to August), and northeaster storms (November to February).
Mechanical Bypassing Method
In order to minimize impacts to the beach ecosystem, it was
preferable to place sand in the shallow nearshore area instead of
directly onto the beach. The dredge vessel (Figure 19) carries
about 350 m3 (460 yd
3), and varies the specific dump location, so
the total volume bypassed is dispersed in time and distance;
therefore, any one load is unlikely to impact benthic communities
through heavy burial. This method is significantly different than
traditional beach nourishment projects that place large volumes of
sand directly onto the beach and then often redistribute the sand
with heavy equipment; those methods create significant change in
short periods of time, and can bury and crush invertebrate
communities.
Importance of Long-Term Monitoring
By evaluating the monitoring data on a regular basis, undesirable
conditions and trends have been detected. Management actions to
rectify these undesirable results have included notching the
foredune to allow overwash, changing the sediment placement site,
changing the amount of sediment dredged, rescheduling surveys in order to capture appropriate data, and
identifying new needs for data and modeling.
Figure 19. A hopper dredge placing sediment on and just seaward of the nearshore bar at ASIS. Waves and currents move the sediment onto the shoreline (NPS photo).


57
Appendix C: Case Study – Perdido Key, FL in Gulf Islands National Seashore
Project Description The eastern end of Perdido Key (Figure 20), a barrier island in
Gulf Islands National Seashore, Florida (Figure 21), has
experienced long-term erosion (Dean 1988), primarily due to
the interruption of littoral drift caused by maintenance
dredging of Pensacola Pass. To dispose of dredged material
from a deepening project at Pensacola Pass and counteract
shoreline erosion, the U.S. Army Corps of Engineers initiated
a large, two-phase beach and profile nourishment project at
Perdido Key from 1989 to 1991. The amount of acceptable
quality material available for beach placement was determined
from vibracores. Grain size, visual evidence, and color
information were compiled for each core to assess sediment
quality.
The first phase of restoration included onshore placement of
roughly 4.1 million m3 (5.4 million yd
3) of material along 7.5 km of shoreline (5.4 million yd
3 along 4.7
mi) from November 1989 to September 1990. The second phase included offshore placement of an
additional 3 million m3 (3.9 million yd
3) of material in water depths of roughly 6 m (20 ft) from
November 1990 to September 1991 (Rakocinski et al. 1996).
Monitoring Program The monitoring program began in 1989 with a pre-construction survey of the project area and adjacent
shorelines. After the nourishment project, surveys were conducted on an annual or biennial basis.
Physical monitoring included beach profile surveys (Figure 22), bathymetric surveys of the offshore
portion of the profiles and of the offshore placement area, wave, tide, and current measurements, and
meteorological data collection (Browder and Dean 2000). As part of the project the Navy agreed to a 5-
year monitoring plan that included:
Geophysical studies to determine behavior of the placed material and develop a predictive
model;
Vegetation monitoring to determine patterns of revegetation;
Effects of the new sand on undisturbed habitats;
Figure 20. Perdido Key Beach in Gulf Islands National Seashore, Florida (NPS photo).
Figure 21. Location map of Perdido Key, Gulf Islands National Seashore, Florida.

58
Similarity of the new beach to the old in terms of vegetation composition;
Perdido Key beach mouse (Peromyscus polionotus trissyllepsis) ecology monitoring to examine
mouse population biology and response to habitat alteration;
Benthic community studies to determine composition of benthic communities short-term effects
of placed material, and rates of recovery; and
Ecosystem synthesis to integrate and interpret the above studies into a whole-system framework
for management.
Lesson Learned from Monitoring: Beach Width
The nourishment project advanced the shoreline an average of 125 m (410 ft) seaward (Browder and
Dean 2000). Post-construction monitoring determined that this was too wide to allow sufficient
nutrients from the swash zone to reach the vegetation resulting in a production failure of sea oat seeds
(per. communication R. Hoggard 2010). These seeds are vital to the survival of the endangered beach
mouse on Perdido Key. A reduction in the beach mouse population was documented in the nourishment
area; however, a study conducted by Sankaran 1993 concluded that this was a result of the initial
population size being below the critical level required and not necessarily related to the beach
nourishment (Dean 2002).
Monitoring for Future Nourishment Projects Recommendations for future monitoring efforts at Perdido Key include the following studies:
Sea turtle nesting/hatching surveys and nest relocation;
Visual escarpment surveys (before turtle season and routinely during the season) and follow-up
inspections;
Piping plover surveys of bayside and Gulf beaches (bi-monthly from July 15 through May 15
every year for 10 years);
Perdido Key beach mouse tracking surveys;
Sediment dynamics and island morphology (fate of sediments);
Effects on sea oat production and other island vegetation;
Benthic recruitment following placement; and
Success of littoral zone placement.
Figure 22. Average profiles (based on 7 profiles) within the nourishment area, Gulf Islands National Seashore, Florida (Figure from Work and Dean 1992).
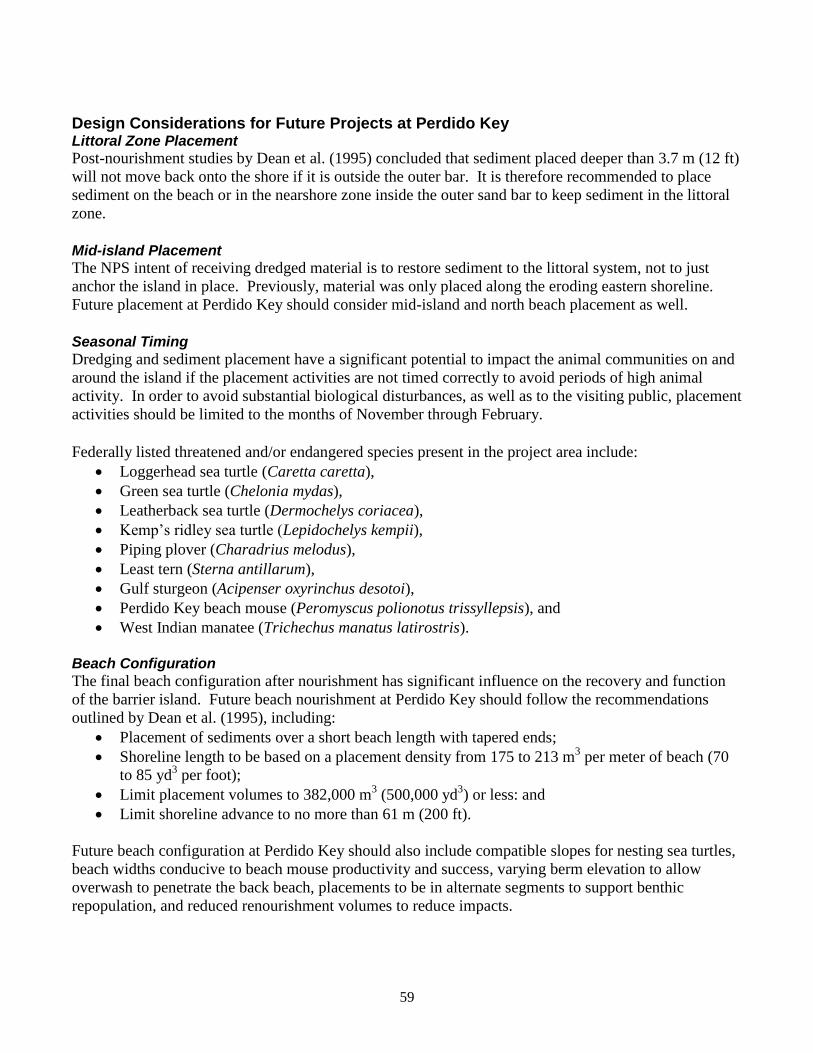
59
Design Considerations for Future Projects at Perdido Key Littoral Zone Placement
Post-nourishment studies by Dean et al. (1995) concluded that sediment placed deeper than 3.7 m (12 ft)
will not move back onto the shore if it is outside the outer bar. It is therefore recommended to place
sediment on the beach or in the nearshore zone inside the outer sand bar to keep sediment in the littoral
zone.
Mid-island Placement
The NPS intent of receiving dredged material is to restore sediment to the littoral system, not to just
anchor the island in place. Previously, material was only placed along the eroding eastern shoreline.
Future placement at Perdido Key should consider mid-island and north beach placement as well.
Seasonal Timing
Dredging and sediment placement have a significant potential to impact the animal communities on and
around the island if the placement activities are not timed correctly to avoid periods of high animal
activity. In order to avoid substantial biological disturbances, as well as to the visiting public, placement
activities should be limited to the months of November through February.
Federally listed threatened and/or endangered species present in the project area include:
Loggerhead sea turtle (Caretta caretta),
Green sea turtle (Chelonia mydas),
Leatherback sea turtle (Dermochelys coriacea),
Kemp’s ridley sea turtle (Lepidochelys kempii),
Piping plover (Charadrius melodus),
Least tern (Sterna antillarum),
Gulf sturgeon (Acipenser oxyrinchus desotoi),
Perdido Key beach mouse (Peromyscus polionotus trissyllepsis), and
West Indian manatee (Trichechus manatus latirostris).
Beach Configuration
The final beach configuration after nourishment has significant influence on the recovery and function
of the barrier island. Future beach nourishment at Perdido Key should follow the recommendations
outlined by Dean et al. (1995), including:
Placement of sediments over a short beach length with tapered ends;
Shoreline length to be based on a placement density from 175 to 213 m3 per meter of beach (70
to 85 yd3 per foot);
Limit placement volumes to 382,000 m3 (500,000 yd
3) or less: and
Limit shoreline advance to no more than 61 m (200 ft).
Future beach configuration at Perdido Key should also include compatible slopes for nesting sea turtles,
beach widths conducive to beach mouse productivity and success, varying berm elevation to allow
overwash to penetrate the back beach, placements to be in alternate segments to support benthic
repopulation, and reduced renourishment volumes to reduce impacts.


The Department of the Interior protects and manages the nation’s natural resources and cultural heritage; provides scientific and
other information about those resources; and honors its special responsibilities to American Indians, Alaska Natives, and affiliated
Island Communities.
NPS 909/114346, September 2012

National Park Service U.S. Department of the Interior
Natural Resource Stewardship and Science
1201 Oakridge Drive, Suite 150 Fort Collins, CO 80525 www.nature.nps.gov
EXPERIENCE YOUR AMERICA TM