national nutrition survey 2010
TRANSCRIPT

www.hpb.gov.sg1800 223 1313
Research & Strategic Planning DivisionHealth Promotion Board
NationalNutrition Survey2010Singapore

COPYRIGHT NOTICE
REPORT OF THE NATIONAL NUTRITION SURVEY 2010ISBN 978-981-07-5238-5
All rights reserved. Further reproduction of this material is prohibited without the written permission of the copyright holder. All material contained in this report may be used without special permission. Citation to source, however, is appreciated.
Suggested CitationReport of the National Nutrition Survey 2010Health Promotion Board, Singapore
Application for the copyright owner’s written permission to reproduceany part of this publication should be addressed to:
CEOHealth Promotion BoardResearch and Strategic Planning Division3 Second Hospital AvenueSingapore 168937Republic of SingaporeTel : (65) 6435-3500Fax : (65) 6438-3848
Commercial usage or sale of this work is prohibited.

forewordThe National Nutrition Survey is part of the Health Promotion Board’s ongoing surveillance of the diet of Singaporeans – it informs how our eating habits have evolved, and whether we are eating too little (or too much) of required nutrients. Since the first National Nutrition Survey (NNS) in 1993, the information collected has been a rich information source that has helped to shape our health promotion policies. In addition for this 2010 snapshot, salt intake has been estimated for the first time using ‘gold-standard’ urinary collection methods.
We have noted from the findings that Singaporeans are now choosing to eat more unrefined carbohydrates from wholegrain foods such as wholemeal bread, oats and brown rice. Vitamin and mineral intakes are also on the increase. However, there are also notable trends which are a cause for concern and which have implications of our long-term obesity rates, as they will fuel a rise in chronic diseases like high blood cholesterol, if not addressed. The study findings indicate that more people are consuming excessive calories and fat. One reason for this is growing affluence as the NNS 2010 reveals that some 60% of Singaporeans now eat out regularly at places like hawker centres, food courts and coffee shops, because eating out is now within easy reach.
Moving forward, a sustained effort to address not just the quality of foods consumed but also the quantity is imperative. Rather than fight social trends, HPB’s strategy is also to leverage cultural preferences and nudge them along through efforts such as the Healthier Hawker Centre programme. So even as Singaporeans eat out more, we want to make sure that affordable versions of their favourite dishes are readily available. This means working across the entire value chain, from the development of healthier ingredients, to the distribution and supply of these ingredients, to the front-end food preparation by our food vendors to serve healthy and tasty dishes. That the consumption of wholegrains and the use of healthier oils have increased in the past few years, supports this strategy and encourages us to continue nudging consumers towards healthier eating habits.
I would like to take this opportunity to acknowledge all who have contributed to the successful completion of NNS 2010. Special thanks to the Epidemiology and Disease Control Division, Ministry of Health, for their kind assistance and collaboration during the Survey. Lastly, I wish to thank all participants of the Survey who have given their time to take part, without whom this Survey would not have been possible.
Ang Hak SengCEOHealth Promotion Board


contents
ANNEXES
37
I. Recommended Dietary Allowances | 37II. Figures and Tables | 41
III. Dietary Practices Questionnaire | 135IV. Food Frequency Questionnaire | 141
PROJECT TEAM
36
REFERENCES
35
RESULTS
18
Intake of Energy and Major Nutrients | 18Intake and Consumption of Healthy Diet Pyramid (HDP) Food Groups
and Major Food Types | 22Sodium Levels from Urinary Excretion Measurements | 25
Dietary Practices | 26
SUBJECTS
17
METHODOLOGY
14
EXECUTIVE SUMMARY
9

list of tables and figures inannex IIIntake of Energy and Major Nutrients
Figure 3.1.1: Energy contribution (%) of macronutrients to total energy intake among adult
Singapore residents, by gender 41
Figure 3.1.2: Energy contribution (%) of macronutrients to total energy intake among adult
Singapore residents, by gender and ethnic groups 41
Figure 3.1.3: Energy contribution (%) of macronutrients to total energy intake among adult
Singapore residents by year, NNS 1998, NNS 2004 and NNS 2010 42
Energy
Table 3.1.1: Mean (SE) and percentile distribution of daily energy intake (kcal) among adult
Singapore residents, by gender, ethnic and age (years) groups 43
Table 3.1.2: Distribution (%) of percentage of RDA met for energy intake among adult Singapore
residents, by gender, ethnic and age (years) groups 44
Table 3.1.3: Comparison of mean (CI) energy intake (kcal) among adult Singapore residents,
by gender and ethnic groups 45
Table 3.1.4: Comparison of proportion (%) of adult Singapore residents consuming ≥ 100% of
RDA for energy, by gender 45
Protein
Table 3.2.1: Mean (SE) and percentile distribution of daily protein intake (weight in grams)
among adult Singapore residents, by gender, ethnic and age (years) groups 46
Table 3.2.2: Distribution (%) of percentage of RDA met for protein among adult Singapore
residents, by gender, ethnic and age (years) groups 47
Table 3.2.3: Comparison of mean (CI) protein intake (weight in grams) among adult Singapore
residents, by gender and ethnic groups 48
Table 3.2.4: Comparison of proportion (%) of adult Singapore residents consuming ≥ 100% of
RDA for protein, by gender 48
Fat
Table 3.3.1: Mean (SE) and percentile distribution of daily fat intake (weight in grams) among
adult Singapore residents, by gender, ethnic and age (years) groups 49
Table 3.3.2: Distribution (%) of percentage of RDA met for total fat among adult Singapore
residents, by gender, ethnic and age (years) groups 50
Table 3.3.3: Comparison of mean (CI) fat intake (g) among adult Singapore residents, by gender
and ethnic groups 51
Table 3.3.4: Comparison of proportion (%) of adult Singapore residents consuming excessive fat
(fat contributing ≥ 30% of recommended energy requirements), by gender 51

Table 3.3.5: Major sources of total fat in the diet of adult Singapore residents by year,
1998, 2004 and 2010 52
Table 3.4.1: Mean (SE) and percentile distribution of daily saturated fat intake (weight in grams)
among adult Singapore residents, by gender, ethnic and age (years) groups 53
Table 3.4.2: Distribution (%) of percentage of RDA met for saturated fat among adult Singapore
residents, by gender, ethnic and age (years) groups 54
Table 3.4.3: Comparison of mean (CI) saturated fat intake (g) among adult Singapore residents,
by gender and ethnic groups 55
Table 3.4.4: Comparison of proportion (%) of adult Singapore residents consuming excessive
saturated fat (saturated fat contributing ≥ 10% of recommended energy
requirements), by gender 55
Table 3.4.5: Major sources of saturated fat in the diet of adult Singapore residents by year,
1998, 2004 and 2010 56
Table 3.4.1.1: Comparison of mean (CI) monounsaturated fat intake (g) among adult Singapore
residents, by gender and ethnic groups 57
Table 3.4.1.2: Comparison of mean (CI) polyunsaturated fat intake (g) among adult Singapore
residents, by gender and ethnic groups 58
Table 3.4.1.3: Ratio of fatty acids relative to saturated fatty acid intake among adult Singapore
residents, by gender, ethnic and age (years) groups 59
Table 3.4.1.4: Mean (SE) fatty acid intake and mean (SE) percent contribution to total energy intake
among adult Singapore residents, by gender, ethnic and age (years) groups 60
Carbohydrates
Table 3.5.1: Mean (SE) and percentile distribution of daily carbohydrate intake (weight in grams)
among adult Singapore residents, by gender, ethnic and age (years) groups 61
Table 3.5.2: Distribution (%) of percentage of RDA met for carbohydrates among adult Singapore
residents, by gender, ethnic and age (years) groups 62
Table 3.5.3: Comparison of mean (CI) carbohydrate intake (g) among adult Singapore residents,
by gender and ethnic groups 63
Table 3.5.4: Comparison of proportion (%) of adult Singapore residents consuming excessive
carbohydrates (carbohydrates contributing ≥ 60% of recommended energy
requirement), by gender 63
Cholesterol
Table 3.6.1: Mean (SE) and percentile distribution of daily cholesterol intake (weight in milligrams)
among adult Singapore residents, by gender, ethnic and age (years) groups 64
Table 3.6.2: Distribution (%) of percentage of RDA met for cholesterol among adult Singapore
residents, by gender, ethnic and age (years) groups 65
Table 3.6.3: Comparison of mean (CI) cholesterol intake (mg) among adult Singapore residents,
by gender and ethnic groups 66
Table 3.6.4: Comparison of proportion (%) of adult Singapore residents consuming excessive
cholesterol (≥ 300mg), by gender 66

Dietary Fibre
Table 3.7.1: Mean (SE) and percentile distribution of daily dietary fibre intake (weight in grams)
among adult Singapore residents, by gender, ethnic and age (years) groups 67
Table 3.7.2: Distribution (%) of percentage of RDA met for dietary fibre among adult Singapore
residents, by gender, ethnic and age (years) groups 68
Table 3.7.3: Comparison of mean (CI) dietary fibre intake (g) among adult Singapore residents,
by gender and ethnic groups 69
Table 3.7.4: Comparison of proportion (%) of adult Singapore residents consuming insufficient
dietary fibre (< 70% RDA), by gender 69
Iron
Table 3.8.1: Mean (SE) and percentile distribution of daily iron intake (weight in milligrams)
among adult Singapore residents, by gender, ethnic and age (years) groups 70
Table 3.8.2: Distribution (%) of percentage of RDA met for iron among adult Singapore
residents, by gender, ethnic and age (years) groups 71
Table 3.8.3: Comparison of mean (CI) iron intake (mg) among adult Singapore residents,
by gender and ethnic groups 72
Table 3.8.4: Comparison of proportion (%) of adult Singapore residents consuming insufficient iron
(< 70% RDA), by gender 72
Calcium
Table 3.9.1: Mean (SE) and percentile distribution of daily calcium intake (weight in milligrams)
among adult Singapore residents, by gender, ethnic and age (years) groups 73
Table 3.9.2: Distribution (%) of percentage of RDA met for calcium among adult Singapore
residents, by gender, ethnic and age (years) groups 74
Table 3.9.3: Comparison of mean (CI) calcium intake (mg) among adult Singapore residents,
by gender and ethnic groups 75
Table 3.9.4: Comparison of proportion (%) of adult Singapore residents consuming insufficient
calcium (< 70% RDA), by gender 75
Vitamin A
Table 3.10.1: Mean (SE) and percentile distribution of daily vitamin A intake (weight in micrograms)
among adult Singapore residents, by gender, ethnic and age (years) groups 76
Table 3.10.2: Distribution (%) of percentage of RDA met for vitamin A among adult Singapore
residents, by gender, ethnic and age (years) groups 77
Table 3.10.3: Comparison of mean (CI) vitamin A intake (mcg) among adult Singapore residents,
by gender and ethnic groups 78
Table 3.10.4: Comparison of proportion (%) of adult Singapore residents consuming insufficient
vitamin A (< 70% RDA), by gender 78
Vitamin C
Table 3.11.1: Mean (SE) and percentile distribution of daily vitamin C (weight in milligrams) intake
among adult Singapore residents, by gender, ethnic and age (years) groups 79
Table 3.11.2: Distribution (%) of percentage of RDA met for vitamin C among adult Singapore
residents, by gender, ethnic and age (years) groups 80

Table 3.11.3: Comparison of mean (CI) vitamin C intake (mg) among adult Singapore residents,
by gender and ethnic groups 81
Table 3.11.4: Comparison of proportion (%) of adult Singapore residents consuming insufficient
vitamin C (< 70% RDA), by gender 81
Intake and Consumption of Healthy Diet Pyramid (HDP) Food Groups andMajor Food Types
Intake of HDP Food Groups
Figure 4.1.1: Mean daily intake of Healthy Diet Pyramid Food Groups (servings) among adult
Singapore residents, by gender 82
Table 4.1.1(a): Mean (SE) daily intake of Healthy Diet Pyramid Food Groups (servings) among adult
Singapore residents, by gender and ethnic groups 83
Table 4.1.1(b): Mean (SE) daily intake of Healthy Diet Pyramid Food Groups (servings) among adult
Singapore residents, by gender and age (years) groups 83
Figure 4.1.2: Mean daily intake of Healthy Diet Pyramid Food Groups (weight in grams) among
adult Singapore residents, by gender 84
Table 4.1.2(a): Mean (SE) daily intake of Healthy Diet Pyramid Food Groups (weight in grams) among
adult Singapore residents, by gender and ethnic groups 85
Table 4.1.2(b): Mean (SE) daily intake of Healthy Diet Pyramid Food Groups (weight in grams) among
adult Singapore residents, by gender and age (years) groups 85
Figure 4.1.3: Proportion of adult Singapore residents (%) meeting the Dietary Guidelines,
by gender 86
Table 4.1.3(a): Proportion of adult Singapore residents (%) meeting the Dietary Guidelines,
by gender and ethnic groups 87
Table 4.1.3(b): Proportion of adult Singapore residents (%) meeting the Dietary Guidelines,
by gender and age (years) groups 87
Comparison of the Intake of HDP Food Groups, NNS 2004 and NNS 2010
Figure 4.2.1: Comparison of mean daily intake of Healthy Diet Pyramid Food Groups (servings)
among adult Singapore residents, NNS 2004 and NNS 2010 88
Figure 4.2.2: Comparison of mean daily intake of Healthy Diet Pyramid Food Groups
(weight in grams) among adult Singapore residents, NNS 2004 and NNS 2010 89
Figure 4.2.3: Comparison of proportion of adult Singapore residents (%) meeting the Dietary
Guidelines, NNS 2004 and NNS 2010 89
Intake of Major Food Types
Table 4.3.1-4: Mean (SE) daily intake of the various food types (weight in grams) among adult
Singapore residents, by gender and ethnic groups 90
Table 4.3.5-8: Mean (SE) daily intake of the various food types (weight in grams) among adult
Singapore residents, by age (years) groups 94

Sodium
Table 5.1.1: Mean (SE) and percentile distribution of urinary sodium (mmol/24hr) among adult
Singapore residents, by gender, ethnic and age (years) groups 98
Table 5.1.2: Mean (SE) and percentile distribution of estimated salt intake (g/day) among adult
Singapore residents, by gender, ethnic and age (years) groups 98
Table 5.1.3: Distribution (%) of percentage of RDA met for salt among adult Singapore residents,
by gender, ethnic and age (years) groups 99
Dietary Practices
Eating Venues
Figure 6.1.1(a): Distribution of breakfast venues frequented by adult Singapore residents (%) 100
Table 6.1.1(a): Distribution of breakfast venues frequented by adult Singapore residents by gender,
ethnic and age (years) groups (%) 100
Figure 6.1.1(b): Distribution of lunch venues frequented by adult Singapore residents (%) 101
Table 6.1.1(b): Distribution of lunch venues frequented by adult Singapore residents, by gender,
ethnic and age (years) groups (%) 101
Figure 6.1.1(c): Distribution of dinner venues frequented by adult Singapore residents (%) 102
Table 6.1.1(c): Distribution of dinner venues frequented by adult Singapore residents, by gender,
ethnic and age (years) groups (%) 102
Table 6.1.1.1: Comparison of usual meal venues among adult Singapore residents, 2004 and
2010 (%) 103
Table 6.1.1.2: Comparison of proportions of adult Singapore residents eating out for lunch and/or
dinner, 2004 and 2010 (%) 104
Figure 6.1.2(a): Distribution of frequency of adult Singapore residents dining at hawker centres/
coffee shop stalls/food courts (%) 105
Table 6.1.2 (a): Distribution of frequency of adult Singapore residents dining at hawker centres/
coffee shop stalls/food courts, by gender, ethnic and age (years) groups (%) 105
Figure 6.1.2(b): Distribution of frequency of adult Singapore residents dining at western fast food
restaurants (%) 106
Table 6.1.2(b): Distribution of frequency of adult Singapore residents dining at western fast food
restaurants, by gender, ethnic and age (years) groups (%) 106
Table 6.1.2.1: Comparison of frequency of dining at hawker centres/coffee shop stalls/food courts
among adult Singapore residents, 2004 and 2010 (%) 107
Table 6.1.2.2: Comparison of frequency of dining at Western fast food restaurants among adult
Singapore residents, 2004 and 2010 (%) 107
Choice of Food Products
Figure 6.2.1(a): Distribution of types of bread consumed among adult Singapore residents (%) 108
Table 6.2.1(a): Distribution of types of bread consumed among adult Singapore residents,
by gender, ethnic and age (years) groups (%) 108
Figure 6.2.1(b): Distribution of types of rice consumed among adult Singapore residents (%) 109
Table 6.2.1(b): Distribution of types of rice consumed among adult Singapore residents,
by gender, ethnic and age (years) groups (%) 109

Table 6.2.1.1: Comparison of types of bread consumed among adult Singapore residents,
2004 and 2010 (%) 110
Figure 6.2.2: Distribution of types of oil used for cooking at home among adult Singapore
residents (%) 111
Table 6.2.2: Distribution of types of oil used for cooking at home among adult Singapore
residents, by gender, ethnic and age (years) groups (%) 111
Table 6.2.2.1: Comparison of types of oil used for cooking at home among adult Singapore
residents, 2004 and 2010 (%) 112
Figure 6.2.3: Distribution of types of fat spread used among adult Singapore residents (%) 113
Table 6.2.3: Distribution of types of fat spread used among adult Singapore residents,
by gender, ethnic and age (years) groups (%) 113
Table 6.2.3.1: Comparison of types of fat spread used among adult Singapore residents,
2004 and 2010 (%) 114
Figure 6.2.4(a): Distribution of types of milk consumed among adult Singapore residents (%) 115
Table 6.2.4(a): Distribution of types of milk consumed among adult Singapore residents,
by gender, ethnic and age (years) groups (%) 115
Figure 6.2.4(b): Distribution of types of milk/milk substitutes consumed among adult Singapore
residents (%) 116
Table 6.2.4(b): Distribution of types of milk/milk substitutes consumed among adult Singapore
residents, by gender, ethnic and age (years) groups (%) 116
Table 6.2.4.1: Comparison of types of milk consumed and types of milk added to beverages
among adult Singapore residents, 2004 and 2010 (%) 117
Figure 6.2.5: Distribution of types of sweetening agent added to beverages among adult
Singapore residents (%) 118
Table 6.2.5: Distribution of types of sweetening agent added to beverages among adult
Singapore residents, by gender, ethnic and age (years) groups (%) 118
Table 6.2.5.1: Comparison of types of sweetening agent added to beverages among adult
Singapore residents, 2004 and 2010 (%) 119
Consumption of Water and Selected Foods
Figure 6.3.1: Distribution of water intake per day among adult Singapore residents (%) 120
Table 6.3.1: Distribution of water intake per day among adult Singapore residents,
by gender, ethnic and age (years) groups (%) 120
Table 6.3.1.1: Comparison of water intake per day among adult Singapore residents,
2004 and 2010 (%) 121
Figure 6.3.2: Distribution of weekly frequency of deep fried food consumption among adult
Singapore residents (%) 122
Table 6.3.2: Distribution of weekly frequency of deep fried food consumption among adult
Singapore residents, by gender, ethnic and age (years) groups (%) 122
Table 6.3.2.1: Comparison of weekly frequency of deep fried food consumption among adult
Singapore residents, 2004 and 2010 (%) 123
Figure 6.3.3: Distribution of weekly frequency of sweetened drinks consumption among adult
Singapore residents (%) 124

EXECUTIVE SUMMARY
NATIONALNUTRITIONSURVEY2010
Table 6.3.3: Distribution of weekly frequency of sweetened drinks consumption among adult
Singapore residents, by gender, ethnic and age (years) groups (%) 124
Table 6.3.3.1: Comparison of weekly frequency of sweetened drinks consumption among adult
Singapore residents, 2004 and 2010 (%) 125
Figure 6.3.4: Distribution of weekly frequency of sweet desserts and snacks consumption among
adult Singapore residents (%) 126
Table 6.3.4: Distribution of weekly frequency of sweet desserts and snacks consumption among
adult Singapore residents, by gender, ethnic and age (years) groups (%) 126
Table 6.3.4.1: Comparison of weekly frequency of sweet desserts and snacks consumption among
adult Singapore residents, 2004 and 2010 (%) 127
Health Conscious Behaviours
Figure 6.4.1: Distribution of salt and sauces added at the table among adult Singapore
residents (%) 128
Table 6.4.1: Distribution of salt and sauces added at the table among adult Singapore
residents, by gender, ethnic and age (years) groups (%) 128
Table 6.4.1.1: Comparison of salt and sauces added at the table among adult Singapore
residents, 2004 and 2010 (%) 129
Figure 6.4.2(a): Distribution of amount of visible fat trimmed from meat among adult Singapore
residents (%) 130
Table 6.4.2(a): Distribution of amount of visible fat trimmed from meat among adult Singapore
residents, by gender, ethnic and age (years) groups (%) 130
Figure 6.4.2(b): Distribution of amount of skin trimmed from poultry among adult Singapore
residents (%) 131
Table 6.4.2(b): Distribution of amount of skin trimmed from poultry among adult Singapore
residents, by gender, ethnic and age (years) groups (%) 131
Table 6.4.2.1: Comparison of amount of visible fat trimmed from meat and skin trimmed from
poultry among adult Singapore residents, 2004 and 2010 (%) 132
Figure 6.4.3: Distribution of history of dieting for weight loss among adult Singapore
residents (%) 133
Table 6.4.3: Distribution of history of dieting for weight loss among adult Singapore residents,
by gender, ethnic and age (years) groups (%) 133
Table 6.4.3.1: Comparison of history of dieting for weight loss among adult Singapore residents,
2004 and 2010 (%) 134

EXECUTIVE SUMMARY
9
NATIONALNUTRITIONSURVEY2010
EXECUTIVE SUMMARY
NATIONALNUTRITIONSURVEY2010
executive summary1.1 ABOUT THE SURVEY
A healthy diet is associated with reduced risks of chronic diseases such as cancer, cardiovascular disease and diabetes mellitus. Since consuming excessive calories, excessive salt and foods high in fat can potentially lead to obesity, high blood pressure and high blood cholesterol, it is essential that the intake and dietary practices of a population are determined and tracked over time. Such monitoring highlights areas of public health concern which require action, and drives the development of health-promoting nutrition policy and programmes.
The National Nutrition Survey (NNS) was first conducted in 1993, then subsequently in 1998 and 2004, in conjunction with the National Health Survey (NHS). The main components of the NNS 2010 were the dietary practices questionnaire (DPQ), the food frequency questionnaire (FFQ) and the salt intake study (SIS). SIS was a new aspect in the NNS compared to previous surveys. It captured information on dietary sodium intake at the population level using 24-hour urinary collection. In addition, FFQ was also expanded in NNS 2010 to collect information on wholegrain consumption.
In Singapore, the nutritional quality of a diet is evaluated against two dietary standards – the Recommended Dietary Allowances (RDAs) and the Dietary Guidelines – developed by the Health Promotion Board. The RDAs are levels of energy and nutrient intake required for the needs of the majority1 of people in the Singapore population to be met. The food-based Dietary Guidelines for adult Singaporeans recommend a diet that contains a variety of food using the Healthy Diet Pyramid (HDP) as a guide.
1.2 CONTENTS OF THIS REPORT
The results in this report cover adult Singapore residents aged 18-69 years old in the following areas:
a) Intake of energy and major nutrientsb) Intake and consumption of Healthy Diet Pyramid (HDP) food groups and major food typesc) Sodium levels from urinary excretion measurementd) Dietary practices
1 RDAs are deemed to meet the needs of 97.5% of the target population.

EXECUTIVE SUMMARY
10
NATIONALNUTRITIONSURVEY2010
1.3 KEY FINDINGS
The key findings of the NNS 2010 are as follows:
1.3.1 Intake of energy and major nutrients
• ThemeandailyintakeofenergyamongadultSingaporeresidentsincreasedsignificantlyacrosstimefrom 2004 to 2010 (2378 kcal vs 2624 kcal). In 2010, about six in ten (59.4%) exceeded the daily recommendation for energy.
• Totalenergyderivedfromtotalfat(31.4%)hasgraduallyincreasedovertimeandisnowslightlyabovethe recommended range of less than 30%. In 2010, the mean daily intake of total fat was 93.0g, compared to 77.0g in 2004. Again, six in ten (61.4%) exceeded the recommended intake for total fat in 2010. Saturated fat (38%) was proportionally higher in the Singaporean diet compared with other fats, and contributed to 11.8% of total energy intake.
Figure A: Dietary Excesses2 of Energy and Selected Nutrients, 2004 and 2010
10 20 30 40 50 60 70 80 90 1000
Cholesterol
Energy
Saturated Fat
Carbohydrate
Total Fat
47.9
59.4
42.1
61.4
56.7
70.2
40.6
42.3
36.9
54.9
Percentage (%)
Nut
rient
s
2004
2010
• Incomparisonwith2004,slightlymorepeople (21.1%)didnotconsumesufficient fibre.However,improvements were noted in the consumption of iron, calcium and some vitamins, where more people consumed the recommended level.
2 Dietary Excesses: intake above or beyond the recommendation level (more than 100% of the respective RDA)

EXECUTIVE SUMMARY
11
NATIONALNUTRITIONSURVEY2010
EXECUTIVE SUMMARY
NATIONALNUTRITIONSURVEY2010
3 Dietary Insufficiencies: intake below the recommendation level (less than 70% of the respective RDA)
Figure B: Dietary Insufficiencies3 of Selected Nutrients, 2004 and 2010
10 20 30 40 50 60 70 80 90 1000
Vitamin C
Dietary Fibre
Calcium
Vitamin A
Iron
15.4
21.1
18.2
13.2
53.9
35.2
14.7
9.3
13.1
12.0
Percentage (%)
Nut
rient
s
2004
2010
1.3.2 Intake and consumption of HDP food groups and major food types
• OneinfouradultSingaporeresidents(25.4%)mettheDietaryGuidelinesofeatingatleasttwoservingsof fruit daily. Three in ten (31.2%) met the two-servings-a-day recommendation for vegetables. Malays had the lowest daily consumption of vegetables and were least likely to meet the Dietary Guidelines for vegetables (25.0%). Those aged 18-29 years consumed the least servings of fruit where only 18.3% fulfilled the two-servings-a-day recommendation.
• Only11.2%ofadultSingaporeresidentsconsumedatleasttwoservingsofbothfruitandvegetablesin a day, compared to 14.3% in 2004.
• Daily intakeofwholegrainproducts increasedover thepastsixyears. In2010,almost three in ten(27.0%) adult Singapore residents consumed at least one serving of wholegrain products per day. For example, 49.0% usually chose wholemeal bread or a mixture of white and wholemeal bread, compared to 28.9% in 2004.

EXECUTIVE SUMMARY
12
NATIONALNUTRITIONSURVEY2010
Rice and alternatives≥ 6 servings
70
40
20
6053
.8
Food groups
Per
cent
age
(%)
2004
2010
50
10
0
30
Wholegrain products≥ 1 serving
Fruit≥ 2 servings
Vegetables≥ 2 servings
Meat and alternatives≥ 2.5 servings
8.4
61.8
27.0 29
.0
25.4
42.2
56.3
31.2
61.2
1.3.3 Sodium levels
• Eightinten(80.2%)adultSingaporeresidentsexceededthesaltintakerecommendationoflessthan5g per day, with an average intake of 8.3g per day. Males (9.6g) consumed more salt per day than their female counterparts (7.2g). Those aged 30-49 years were found to consume the most salt among the various age groups.
1.3.4 Dietary practices
• TherewasanincreaseintheproportionofadultSingaporeresidentsconsumingsweetdessertsandsnacks more than twice per week (27.1%) compared with in 2004 (18.9%).
• Theproportionofpeopleskippingbreakfasthasdoubledfrom2004(6.9%)to2010(14.1%).
• More Singapore residents reported eating out at hawker centres, coffee shop stalls, food courts,restaurants and/or coffee houses for lunch and/or dinner. The proportion usually eating out at least four times a week has increased from 47.8% in 2004 to 60.1% in 2010.
Figure C: Proportion of adult Singapore residents meeting the Dietary Guidelines, 2004 and 2010

EXECUTIVE SUMMARY
13
NATIONALNUTRITIONSURVEY2010
EXECUTIVE SUMMARY
NATIONALNUTRITIONSURVEY2010
1.4 IMPLICATIONS AND RECOMMENDATIONS
The findings of this survey were mixed; there have been improvements in some areas of diet quality such as wholegrain consumption and vitamin and mineral intakes, however there has been a parallel worsening in other areas, with more people consuming excessive calories and an increasing role of fat in the diet. Continual effort is required to address quantity as well as quality. The new area of salt intake assessment through urinary collection confirms that most people exceed recommended intake levels and provides baseline data with which to monitor programmes and interventions.
Eating patterns and locations
Skipping breakfast and having meals away from home are associated with higher intake of total energy and are potential risk factors of higher Body Mass Index (BMI). Efforts addressing the evolving eating patterns and strategies engaging popular eating places to provide healthier options are important in public health to combat obesity.
Promoting consumption of healthy foods
The survey findings suggest that the recent national public health efforts in promoting wholegrain intake may have had positive effects. Wholegrain products such as wholemeal bread, brown rice and wholegrain noodles are gradually gaining acceptability among the population. Nonetheless, efforts in promotion are still required as only three in ten ate at least one serving of wholegrains per day.
The actual consumption of fruit and vegetables decreased over time, both by approximately one tenth of a serving. More than one quarter of the population met the daily recommendation for each. Continuing efforts to re-emphasise the ‘2 plus 2’ message to the population are warranted.
Limiting intake of unhealthy foods
Excessive intake of salt is a key risk factor for high blood pressure (i.e. hypertension). Even small dietary salt reductions can lower blood pressure and the incidence of stroke and heart disease. Current strategies that engage community and food manufacturers have to continue to promote food with lower sodium content as well as other healthy foods.
The survey reported that the total energy contributed by total fat has gradually increased across time. Although changes are small in magnitude, they indicate that population-level trends have occurred which may need to be addressed further in the development of programmes aiming at obesity prevention.

METHODOLOGY
14
NATIONALNUTRITIONSURVEY2010
methodology2.1 SAMPLE
The National Nutrition Survey 2010 (NNS 2010) was carried out in conjunction with the National Health Survey 2010 (NHS 2010). The sampling methodology for the NHS 2010 is described in the NHS 2010 report.
For NNS 2010, sampling was based on a selection matrix stratified by gender, race and age. The Malay and Indian participants were over-sampled to provide adequate numbers for statistical comparisons between the ethnic groups.
2.2 STUDY DESIGN
The main components of the NNS 2010 consist of:
a) Dietary Practices Questionnaire (DPQ) and Food Frequency Questionnaire (FFQ) Study:
A face-to-face interview using DPQ and FFQ was administered concomitantly at the designated survey venues of the NHS by interviewers from the Health Promotion Board. The DPQ collected information on dietary practices whereas the FFQ assessed consumption of various food items to estimate amounts of intake of energy, major nutrients and selected food groups.
The DPQ used in NNS 2010 consisted of 26 multiple-choice questions. The topics covered in the questionnaire included usual eating places of meals, choices on food products, consumption of selected foods and some health conscious behaviours.
The validated FFQ had been used in NNS 1998 and NNS 2004. For NNS 2010, minor modifications to the FFQ were made mainly to better differentiate consumption of wholegrain and non-wholegrain foods, and include capture of fish intake. A total of 397 food items were included.
The adequacy of intake of individual nutrients and various food groups was assessed by comparing the levels of intake with dietary standards including the Recommended Dietary Allowances (RDAs) [Annex I].
A copy of the DPQ and FFQ can be found at Annex III and Annex IV, respectively.

METHODOLOGY
15
NATIONALNUTRITIONSURVEY2010
METHODOLOGY
NATIONALNUTRITIONSURVEY2010
b) Salt Intake Study (SIS):
The ‘gold standard’ 24-hour urinary collection method was used. Participants were instructed to collect all the urine they passed during a 24-hour collection period starting from their second morning urine pass of a pre-arranged collection day, and ending with their first urine pass on the following morning. Concurrently, they kept a record diary to capture start time, end time, urine missed or spilled, and medications taken. Participants were reminded to maintain their normal routine during the urine collection period.
The completed urine samples were collected by fieldwork staff at the participants’ homes or other venues convenient to them, and despatched to a designated, qualified laboratory within 24 hours after the end of the collection period. The urine samples were then analysed and sodium levels were assessed based on an indirect potentiometric procedure using an ion selective electrode.
2.3 TRAINING OF INTERVIEWERS
All the interviewers of NNS 2010 were trained on the survey methodology and underwent rigorous training in the survey procedures assigned to them. During the fieldwork, regular audit of the interviewers was conducted to ensure strict adherence to the procedures and standards of the survey.
2.4 FIELDWORK
For the DPQ and FFQ Study, fieldwork was conducted from March to June 2010 at five government polyclinics and one community club. Subjects were recruited for SIS at the same time as for the DPQ and FFQ Study. However, fieldwork for SIS was conducted from March to July 2010 at the household of the participants.
2.5 INFORMED CONSENT
For the DPQ and FFQ Study, the consent form was part of the overall consent form for NHS 2010. All NHS 2010 participants provided informed consent to participate on the actual day of the study. A separate informed consent was obtained from the invited participants for SIS.
2.6 DATA ANALYSIS
Data coding
DPQ and FFQ data were entered into the Food Information and Nutrient Database (FIND) system of the Health Promotion Board.

SUBJECTS
NATIONALNUTRITIONSURVEY2010
METHODOLOGY
16
NATIONALNUTRITIONSURVEY2010
Statistical Analysis
Sample weights were applied to the analyses to represent the population. For analyses of DPQ and FFQ data, the overall sample weight was the product of three weightage components:
a) for the household enumeration exercise, sample weights to account for unequal probability of selection and non-response (refer to details in the NHS 2010 Report);
b) for the survey fieldwork, sample weights to account for unequal probability selection that were computed based on four attributes-gender, ethnicity and age group by survey site; and
c) post-stratification weight based on gender, ethnic and age distribution of 2010 Census Singapore resident population figures to account for over-sampling of Malay and Indian participants and to extrapolate the findings to the general population.
For SIS, a fourth weight was included to account for non-response among consenting participants.
Where comparison is made with NNS 2004 and NNS1998, the data from the past surveys were standardised to the 2010 Census Singapore resident population. For energy and selected nutrients, the RDAs have been revised over time. Figures from NNS 2004 and NNS 1998 were first corrected for the new RDAs and then standardised for comparison. 95% confidence intervals (95% CI) were computed to assess whether there were statistically significant differences between data.
Data were analysed using multiple statistical software including STATA version 11.0, SPSS version 17.0 and R version 2.13.0.
2.7 ETHICS APPROVAL
The NNS 2010 methodology, protocol and procedures were approved by the Health Promotion Board Medical and Dental Board Ethics Committee.
All invitation letters, consent forms, questionnaires and instructions to the participants were translated into Chinese, Malay and Tamil.

SUBJECTS
17
NATIONALNUTRITIONSURVEY2010
SUBJECTS
NATIONALNUTRITIONSURVEY2010
METHODOLOGY
NATIONALNUTRITIONSURVEY2010
subjectsA total of 1,661 respondents aged 18 to 69 years took part in the DPQ and FFQ Study of NNS 2010. Fourteen persons from the original sample were ineligible (age and ethnicity) and were excluded from NNS. The eventual sample size was 1647 eligible respondents. In the FFQ analyses, a further 20 persons with extreme daily energy intake were excluded4.
A total of 1,182 subjects aged 18 to 69 years were invited to the SIS of NNS 2010. Exclusion procedures5 yielded a final sample size of 739 eligible participants and an overall response rate of 63% out of all invited subjects.
DemographicCharacteristics
DPQ Sample Size(unweighted)
FFQ Sample Size(unweighted)
SIS Sample Size(unweighted)
Total 1647 1627 739
Gender
Males 817 808 377
Females 830 819 362
Ethnic Group
Chinese 673 666 250
Malay 501 491 247
Indian 473 470 242
Age Group (years)
18-29 391 383 153
30-39 398 390 175
40-49 404 403 173
50-59 284 283 122
60-69 170 168 116
4 Extreme daily energy intake: male >7000kcal/d or <500kcal/d; female >5000kcal/d or <500kcal/d.5 Exclusion criteria for SIS: ineligible (e.g. belonged to an ethnic group other than Chinese, Malay or Indian); the urine collection period not within 24±4 hours; the urine sample not despatched to the designated laboratory within 24 hours after the end of the urine collection period.

18
NATIONALNUTRITIONSURVEY2010
FOOD AND NUTRIENT INTAKE
resultsINTAKE OF ENERGY AND MAJOR NUTRIENTS
3.1 ENERGY
The average Recommended Dietary Allowances (RDAs) for energy are 2595 kcal for males and 2038 kcal for females respectively. In 2010, the mean daily energy intake of adult Singapore residents was 2624 kcal.Overall,aboutsixinten(59.4%)adultSingaporeresidentshadatotalenergyintakehigherthantherecommended level.
Males (2927kcal) had a higher mean daily intake of energy than their female counterparts (2322kcal). Daily energy intake was higher among young adults. Those aged 18-29 years consumed 17% more energy from food in a typical day than those aged 60-69 years.
The proportion exceeding the recommendation was fairly similar between genders. Additionally, the youngest age group (18-29 years) was more likely to have excessive energy intake compared with other age groups. Please refer to Annex I for the RDA for energy.
In comparison with 2004, the mean daily intake of energy in 2010 was higher in all subgroups and more people had energy intakes beyond their requirements.
Table 3.1.1, Table 3.1.2, Table 3.1.3 and Table 3.1.4
3.2 PROTEIN
The recommended protein intake for an adult Singapore resident is 1.07g/kg body weight per day. According to the Dietary Reference Intakes (DRIs) published by the USDA, the recommended contribution of protein to total energy should be between 10% and 15%. In 2010, protein provided 15.3% of energy for adult Singapore residents, compared to 14.0% and 13.4% in 2004 and 1998 respectively.
Mean daily protein intake was higher than the daily recommended level in both genders. About four in five exceeded their respective requirements and four in ten consumed 1.5 times more than the recommendation. Among the ethnic groups, the Chinese (83.8%) were more likely to consume excessive proteins compared with non-Chinese (range: 66.5%-72.0%).
Similar increases in protein intake over the years were observed regardless of gender and ethnic group. In general, people were eating approximately 21% more proteins in 2010 compared with in 2004.
Figure 3.1.1, Figure 3.1.2, Figure 3.1.3,Table 3.2.1, Table 3.2.2, Table 3.2.3 and Table 3.2.4

19
NATIONALNUTRITIONSURVEY2010NATIONALNUTRITIONSURVEY2010
FOOD AND NUTRIENT INTAKEFOOD AND NUTRIENT INTAKE
3.3 TOTAL FAT
The DRIs recommend that total fat contributes 25% to 30% of total energy intake and hence the recommended intake was 86.5g and 67.9g for males and females respectively. The mean total fat intake of adult Singapore residents was 93.0g per day in 2010. Approximately six in ten (61.4%) met or exceeded theirrecommendedintakefortotalfat.Onaverage,totalfatcontributed31.4%tothetotaldietaryenergyintake. This percent contribution to energy from total fat has consistently increased over the years from 1998.
Males had a 24% higher mean intake of total fat compared to females (103.0g vs 83.0g). Malays (95.4g) had a higher total fat intake than Indians (93.3g) and Chinese (92.5g). Similar to energy and protein, the daily intake of total fat was significantly higher in all subgroups in 2010 compared with in the past surveys.
The major food sources of total fat in 2010 were similar to those in 2004 and 1998. Most of the total fat eaten by adult Singapore residents came from stir-fried vegetables (12.3%); biscuits, pastries, cakes, nuts, titbits, snacks and local snacks (12.4%); rice, noodle, meat dishes, and desserts containing coconut milk (10.6%); fried noodles (5.6%); and flavoured rice (5.1%).
Figure 3.1.1, Figure 3.1.2, Figure 3.1.3, Table 3.3.1, Table 3.3.2, Table 3.3.3, Table 3.3.4 and Table 3.3.5
3.4 SATURATED FAT
It is recommended that saturated fat should contribute no more than 10% of total energy intake. Hence the average recommended intake levels for males and females were 28.8g and 22.6g respectively. NNS 2010 found that the mean saturated fat intake for adult Singapore residents was 35.2g per day. Almost seven in ten adult Singapore residents (70.2%) met or exceeded their recommended intake for saturated fat.
Males had a significantly higher intake (39.4g) than females (31.0g). Malays (38.3g) consumed more saturated fat than the other two ethnic groups. Both Malays (78.1%) and Indians (76.0%) were more likely to consume excessive saturated fat compared with Chinese (67.9%). Comparing the figures from 2010 with those from 1998, daily saturated fat intake was significantly higher in all subgroups.
In NNS 2010, the top contributor of saturated fat was from plant-based sources such as coconut oil and coconut milk. Malay and Indian dishes prepared with coconut milk (16.3%) made the highest contribution to the total saturated fat intake. The other major contributors were biscuits, pastries, cakes, nuts, titbits, snacks and local snacks (14.4%) and stir-fried vegetables (9.0%).
Table 3.4.1, Table 3.4.2, Table 3.4.3, Table 3.4.4 and Table 3.4.5

20
NATIONALNUTRITIONSURVEY2010
FOOD AND NUTRIENT INTAKE
3.4.1 Ratio of Fatty Acids Relative to Saturated Fat
Polyunsaturated fat (PUFA) and monounsaturated fat (MUFA) are two types of unsaturated fats, generally known as the ‘good fats’ because they are more heart-healthy. The recommended PUFA, MUFA and saturated fat (SFA) ratio for all adults is 1.00: 1.00: 1.00 (P: M: S ratio).
The P: M: S ratio for adult Singapore residents was 0.50: 1.00: 1.00, indicating that MUFA and SFA were the two major types of fatty acid consumed by adult Singapore residents and the respective energy contribution were 5.8%, 11.6% and 11.8%. MUFA was the predominant type of fatty acid in the Chinese diet while Malays consumed more SFA (38.3g) and less PUFA (16.5g) compared with non-Malays.
Table 3.4.1.1, Table 3.4.1.2, Table 3.4.1.3 and Table 3.4.1.4
3.5 CARBOHYDRATES
DRIs recommend that carbohydrates should contribute 55-65% of dietary energy and hence the average recommended intake for males and females was 389.3g and 305.7g respectively. In 2010, the overall mean daily carbohydrate intake for adult Singapore residents was 337.4g which was similar to that in 2004.
However, the percentage of energy derived from carbohydrates has steadily decreased from 1998 onwards. In 2010, carbohydrates contributed 52.1% to total energy, in comparison with 56.7% in 2004 and 60.1% in 1998.
Males consumed 26% more carbohydrates from foods than females (376.6g vs 298.2g). In terms of ethnic groups, Malays (353.8g) and Indians (355.6g) consumed more carbohydrates than Chinese (331.7g).
Figure 3.1.1, Figure 3.1.2, Figure 3.1.3,Table 3.5.1, Table 3.5.2, Table 3.5.3 and Table 3.5.4
3.6 CHOLESTEROL
Intake of cholesterol should not exceed 300mg daily. According to the NNS 2010, the mean cholesterol intake for adult Singapore residents was 341mg per day. More than half of adult Singapore residents (54.9%) met or exceeded their recommended intake for cholesterol.
Males had a significantly higher cholesterol intake than females (382mg vs 300mg). Chinese (60.0%) were more likely to meet or exceed the recommended levels than non-Chinese. This group also had the largest increase in daily cholesterol level over six years from 2004.
Table 3.6.1, Table 3.6.2, Table 3.6.3 and Table 3.6.4

21
NATIONALNUTRITIONSURVEY2010NATIONALNUTRITIONSURVEY2010
FOOD AND NUTRIENT INTAKEFOOD AND NUTRIENT INTAKE
3.7 DIETARY FIBRE
The RDA for dietary fibre for adult Singaporeans is a daily intake of 26.0g for males and 20.4g for females. The mean daily intake of dietary fibre for adult Singapore residents in 2010 was 23.7g; slightly lower than in 2004 (24.8g per day). Insufficient intake of dietary fibre is defined as intake of less than 70% of the respective RDA. More adult Singapore residents had insufficient dietary fibre intake in 2010 (21.1%) compared with in 2004 (15.4%).
Malays (22.9g) had the lowest daily intake of dietary fibre compared with other ethnic groups. They also had lower consumption of fruit and vegetables. Consequently, more Malays (26.5%) did not consume sufficient amounts of dietary fibre. Males (26.2%) were more likely to have insufficient fibre intake than females (16.0%).
Table 3.7.1, Table 3.7.2, Table 3.7.3 and Table 3.7.4
3.8 IRON
The average RDA for iron is 6.0mg per day for males and 17.7mg per day for females. Males and females had similar mean daily intakes of iron (18.9mg vs 16.8mg). Fewer females (26.3%) had insufficient iron intake (meeting less than 70% of the respective RDA) in 2010 compared with in 2004 (35.9%).
Table 3.8.1, Table 3.8.2, Table 3.8.3 and Table 3.8.4
3.9 CALCIUM
Calcium is a mineral that is essential for good bone health. The RDA for calcium for adults aged 18 years and those above 51 years is 1000mg. The RDA for those who are aged 19-50 years is 800mg.
In 2010, the mean daily intake of calcium among adult Singapore residents was 794mg per day. In comparison with 2004, there was a reduction in the proportion of adult Singapore residents having insufficient daily intakes of calcium (35.2% in 2010 vs 53.9% in 2004). The improvement was more notable among females.
Table 3.9.1, Table 3.9.2, Table 3.9.3 and Table 3.9.4
3.10 VITAMIN A
The mean daily intake of vitamin A for both males and females was above the RDA of 750mcg per day, with no significant difference between males and females.
Fewer adult Singapore residents had insufficient vitamin A intake (intake less than 70% of the RDA) in 2010 compared with in 2004; an improvement largely attributable to fewer males having insufficient intake. More Malays (16.9%) had insufficient vitamin A intake compared with non-Malays, as did older adults aged 60-69 years (15.6%) compared with other age groups.
Table 3.10.1, Table 3.10.2, Table 3.10.3 and Table 3.10.4

22
NATIONALNUTRITIONSURVEY2010
FOOD AND NUTRIENT INTAKE
3.11 VITAMIN C
The RDA for vitamin C for adult males aged 18 years and above and females aged 19 years and above is 105mg and 85mg per day, respectively. For females aged 18 years, the RDA is 80mg.
ThemeandailyintakeofvitaminCofadultSingaporeresidentswas131mg.Only12%ofadultSingaporeresidents in 2010 had insufficient vitamin C intake (intake below 70% of the RDA), and this was not significantly different from the proportion in 2004.
There was no significant difference in mean daily intake between males and females. Malays (116mg) had a lower mean daily intake of vitamin C, and a higher proportion of people with insufficient intake (23.4%) than the other ethnic groups.
Table 3.11.1, Table 3.11.2, Table 3.11.3 and Table 3.11.4
INTAKE AND CONSUMPTION OF HEALTHY DIET PYRAMID (HDP) FOOD GROUPS AND MAJOR FOOD TYPES
4.1 INTAKE OF HDP FOOD GROUPS
The food-based Dietary Guidelines for adult Singapore residents recommend an intake of 5-7 servings of rice and alternatives (of which at least one serving should be a wholegrain product), 2 servings of fruit, 2 servings of vegetables, and 2-3 servings of meat and alternatives per day. These types of food form the Healthy Diet Pyramid which can be used as a guide to achieve a well-balanced diet.
For the purpose of evaluation of this section, 6 servings and 2.5 servings were used as cut-offs for rice and alternatives and meat and alternatives, respectively.
In 2010, the mean daily intake of the HDP food groups among adult Singapore residents were 6.90 servings of rice and alternatives (including 0.76 servings of wholegrain products), 1.27 servings of fruit, 1.78 servings of vegetables and 3.16 servings of meat and alternatives. Males consumed significantly more servings of rice and alternatives (7.78 vs 6.01 servings) and meat and alternatives (3.45 vs 2.87 servings) than females.
About six in ten adult Singaporeans consumed adequate servings of rice and alternatives (61.8%) and meat and alternatives (61.2%). More than one quarter (27.0%) of the population consumed at least one serving of wholegrain products per day. For fruit and vegetables, proportions meeting the Guidelines were close to 30% (25.4% and 31.2% respectively).
Malays ate fewer wholegrain products, fruit, and vegetables compared with non-Malays. Hence fewer Malays met the Guidelines for these types of food. Those aged 18-29 years consumed the least fruit compared with other age groups with only 18.3% of them meeting the Guideline. The oldest age group (60-69 years) had the lowest consumption of vegetables and meat and alternatives among all age groups. Only23.7%mettheGuidelineforvegetables.Lessthanhalfofthem(49.0%)mettheGuidelineformeatand alternatives.
Figure 4.1.1, Figure 4.1.2, Figure 4.1.3,Table 4.1.1(a), Table 4.1.1(b), Table 4.1.2(a), Table 4.1.2(b), Table 4.1.3(a) and Table 4.1.3(b)

23
NATIONALNUTRITIONSURVEY2010NATIONALNUTRITIONSURVEY2010
FOOD AND NUTRIENT INTAKEFOOD AND NUTRIENT INTAKE
4.2 COMPARISON OF THE INTAKE OF HDP FOOD GROUPS, NNS 2004 AND NNS 2010
There was a significant increase in the mean daily intake of wholegrain products among adult Singapore residents, from 0.19 servings in 2004 to 0.76 servings in 2010. Approximately three in ten adult Singapore residents consumed at least one serving of wholegrain products daily in 2010 (27.0%) compared to 8.4% in 2004.
However the consumption of fruit and vegetables dropped from 1.37 and 1.90 servings to 1.27 and 1.78 servings per day over the past six years, respectively. Fewer Singapore residents met the Guidelines for fruit (25.4% vs 29.0%) and vegetables (31.2% vs 42.2%) in 2010 compared with in 2004. In addition, fewer Singapore residents consumed at least two servings of both fruit and vegetables in 2010 compared with in 2004 (11.2% vs 14.3%).
Figure 4.2.1, Figure 4.2.2 and Figure 4.2.3
4.3 INTAKE OF MAJOR FOOD TYPES
Gender Differences
In general, males consumed more of all the main food types, with the exception of fruit and vegetables, compared to females. Males also had a higher consumption of alcohol than females. Looking at sub-food types, further differences were observed in the intake patterns between males and females. Females tended to have a healthier eating pattern, i.e. they ate more wholemeal bread and wholegrain cereals, brown rice or porridge, wholegrain noodles, dark green leafy vegetables, dishes with poultry without skin, reduced fat milk, yogurt and cheese, and dishes with tofu or beancurd compared to males.
Ethnic Differences
Among the ethnic groups, Chinese ate more rice or porridge dishes, noodle dishes, poultry dishes, meat dishes and eggs compared with other ethnic groups. They had a higher consumption of alcohol than the other two ethnic groups. They also consumed the least amount of milk and dairy products as well as bread and breakfast cereals. Although Chinese consumed overall less vegetables compared with Indians, they tended to eat more dishes with pale green and dark green leafy vegetables.
Malays consumed more fish and seafood dishes, soy products, fast food and soft drinks than the other ethnic groups. They also had the lowest consumption of fruit and vegetables.
Indians consumed the most bread and breakfast cereals, vegetable dishes, fruit, milk and dairy products compared with others. They also ate fewer eggs, poultry and meat dishes.

24
NATIONALNUTRITIONSURVEY2010
FOOD AND NUTRIENT INTAKE
Age Differences
The youngest adults (18-29 years) consumed the most rice or porridge dishes, noodle dishes, poultry and meat dishes, eggs, fast food and soft drinks compared with other age groups. This group also consumed the least fruit, wholemeal bread and wholegrain cereals.
Olderadults (60-69years)consumedthemostwholemealbreadandwholegraincereals,andmilkanddairy products. They also consumed the least amount of poultry and meat dishes, eggs and soy products.
Tables 4.3.1, Table 4.3.2, Table 4.3.3, Table 4.3.4,Table 4.3.5, Table 4.3.6, Table 4.3.7 and Table 4.3.8

25
NATIONALNUTRITIONSURVEY2010NATIONALNUTRITIONSURVEY2010
SODIUMFOOD AND NUTRIENT INTAKE
SODIUM
5.1 SODIUM LEVELS FROM URINARY EXCRETION MEASUREMENT
Among adult Singapore residents, mean urinary sodium excretion was 142.2mmol/24hr. The estimated salt intake was 8.3g (or 3265mg sodium) per day.
The estimated salt intake was significantly higher among males (9.6g or 3777mg sodium) than females (7.2g or 2832mg sodium). There were no significant differences in salt intake among the ethnic groups. However, an inverted U-shaped pattern was observed among the various age groups, with the highest salt intake level in the 30-39 and 40-49 year olds.
The Dietary Guidelines for adults recommend that salt intake should be reduced to less than 5g (2000mg of sodium) per day. About eight in ten Singapore residents (80.2%) exceeded the recommended dietary limit for salt. Moreover, 27.7% of the population consumed double the recommended limit.
Tables 5.1.1, Table 5.1.2 and Table 5.1.3

26
NATIONALNUTRITIONSURVEY2010
DIETARY PRACTICES
DIETARY PRACTICES
6.1 EATING VENUES
6.1.1 Venues of Breakfast, Lunch and Dinner
The majority of adult Singapore residents reported usually having home-prepared breakfast (55.6%). Among those who had their breakfast away from home, the most frequented venues were hawker centres/coffee shop stalls/food courts (20.5%), followed by workplace/school canteens (8.4%). However, 14.1% of Singapore residents reported usually skipping breakfast. Malays (26.9%) and those aged 18-29 years (26.1%) were most likely to skip breakfast.
Figure 6.1.1(a) and Table 6.1.1(a)
About seven in ten adult Singapore residents reported usually having lunch away from home (70.7%). Among ethnic groups, Chinese (78.4%) were most likely to have lunch away from home. The most frequented lunch venue was hawker centres/coffee shop stalls/food courts (58.5%).
Figure 6.1.1(b) and Table 6.1.1(b)
The majority of Singapore residents usually had home-prepared dinner (65.5%) while another 28.3% had dinner at hawker centres. Compared to Malays and Indians, Chinese were most likely to usually have dinner at hawker centres (34.8%).
Figure 6.1.1(c) and Table 6.1.1(c)
6.1.1.1 Comparison of Venues of Breakfast, Lunch and Dinner, NNS 2004 and NNS 2010
In both 2004 and 2010 the majority of adult Singapore residents reported usually consuming breakfast at home. However, the proportion of Singapore residents who had breakfast at workplace/school canteens was significantly lower in 2010 (8.4% vs 12.8% in 2004), whereas the proportion who skipped breakfast was significantly higher (14.1%. vs 6.9% in 2004).
The proportion of Singapore residents who usually had lunch at hawker centres/coffee shop stalls/food courts was significantly higher in 2010 (49.9% vs 41.0% in 2004), while the proportion having lunch at workplace/school canteens was significantly lower (25.9% in 2004 vs 17.5% in 2010).
For dinner, the proportion of Singapore residents who reported usually eating at hawker centres/coffee shop stalls/food courts for dinner was also significantly higher in 2010 (28.3% vs 21.3% in 2004). In contrast, the proportion of Singapore residents who reported eating at home for dinner dropped significantly by 8.1% points compared with in 2004.
For lunch and/or dinner, the proportion of Singapore residents who reported usually eating at hawker centres/coffee shop stalls/food courts increased significantly from 46.7% in 2004 to 56.9% in 2010. Including restaurants/coffee houses with these venues, the proportion increased significantly from 47.8% to 60.1%.
Table 6.1.1.1 and Table 6.1.1.2

27
NATIONALNUTRITIONSURVEY2010NATIONALNUTRITIONSURVEY2010
DIETARY PRACTICESDIETARY PRACTICES
6.1.2 Frequency of Eating at Hawker Centres/Food Courts/Coffee Shops and Western Fast Food Restaurants
The participants were asked how often they ate at hawker centres/food courts/coffee shops and at Western fast food restaurants for any meals of the day. The majority of adult Singapore residents (80.7%) reported eating at hawker centres/food courts/coffee shops at least twice a week. In addition, nearly half (45.1%) had their meals at hawker centres/food courts/coffee shops six times a week or more.
Figure 6.1.2(a) and Table 6.1.2(a)
About one in ten Singapore residents dined at Western fast food restaurants at least twice a week. This proportion was considerably higher among Malays (20.7%) and those aged 18-29 years (28.5%).
Figure 6.1.2(b) and Table 6.1.2(b)
6.1.2.1 Comparison of Frequency of Eating at Hawker Centres/Food Courts/Coffee Shops and Western Fast Food Restaurants, NNS 2004 and NNS 2010
In both 2004 and 2010, about one in two adult Singapore residents dined at hawker centres/coffee shop stalls/food courts (for any meals of the day) six times a week or more (48.6% in 2004 vs 45.1% in 2010). The proportion dining at Western fast food restaurants once a week or less (for any meals of the day) remained at about nine in ten (90.0% in 2004 vs 89.5% in 2010).
Table 6.1.2.1 and Table 6.1.2.2
6.2 CHOICE OF FOOD PRODUCTS
6.2.1 Types of Bread and Rice Consumed
The Dietary Guidelines for adult Singaporeans recommend a diet rich in wholegrains. Examples of wholegrain food include wholemeal bread and brown/red rice. The participants were asked the types of bread and rice that they usually consumed.
Almost half (45.4%) of the adult Singapore residents usually consumed white bread (ordinary/enriched) only. 15.9% usually consumed wholemeal bread only, while 33.1% consumed a mixture of white and wholemeal bread. Altogether, 49.0% of the Singapore residents consumed wholemeal bread in their diet. Males were less likely to consume any wholemeal bread (either alone or together with white bread) (46.3%) compared to females (51.7%).
Figure 6.2.1(a) and Table 6.2.1(a)
Most (80.7%) adult Singapore residents consumed white rice only. A small proportion (4.5%) consumed brown/red rice only; 14.2% reported consuming a mixture of white and brown/red rice. In total, 18.7% of the Singapore residents consumed brown/red rice in their diet. Males (15.7%) were less likely to consume any brown/red rice (either alone or together with white rice) compared to females (21.7%).
Figure 6.2.1(b) and Table 6.2.1(b)

28
NATIONALNUTRITIONSURVEY2010
DIETARY PRACTICES
6.2.1.1 Comparison of Types of Bread Consumed, NNS 2004 and NNS 2010
A significantly higher proportion of Singapore residents reported consuming any wholemeal bread compared with in 2004 (28.9% vs 49.0% in 2010).
Table 6.2.1.1
6.2.2 Types of Fat and Oil Used for Cooking at Home
The most commonly used oil for cooking at home was blended vegetable oil (32.9%), followed by monounsaturated oils (e.g. olive oil and canola oil) (32.4%) and polyunsaturated oils (e.g. corn oil and sunflower oil) (26.6%). Very few Singapore residents used animal fat such as butter, ghee and lard for cooking at home (0.4%).
Among the three ethnic groups, blended vegetable oil was most commonly used by Malays (57.8%). Monounsaturated oils and polyunsaturated oils were the most common choices for Chinese (35.4%) and Indians (43.1%), respectively.
Figure 6.2.2 and Table 6.2.2
6.2.2.1 Comparison of Types of Fat and Oil Used for Cooking at Home, NNS 2004 and NNS 2010
Use of monounsaturated oils was 13.2% points higher in 2010 compared with in 2004, while use of blended vegetable oil was lower by 9.8% points.
Table 6.2.2.1
6.2.3 Types of Fat Spread Used
The majority of adult Singapore residents (71.4%) used some form of fat spread on bread or crackers. The most common fat spreads used were soft margarine (28.5%) and butter (28.0%). Among males butter was most commonly used, whereas among females soft margarine was most common. Almost one-third (30.1%) of Chinese did not use any fat spread at all, whereas 37.2% of Malays and 32.8% of Indians reported butter as their usual fat spread.
Figure 6.2.3 and Table 6.2.3
6.2.3.1 Comparison of Types of Fat Spread Used, NNS 2004 and NNS 2010
Significantly more adult Singapore residents used butter as fat spread on bread or crackers in 2010 compared with in 2004 (14.2% points increase) whereas fewer Singapore residents used soft margarine as fat spread (17.9% points decrease).
Table 6.2.3.1

29
NATIONALNUTRITIONSURVEY2010NATIONALNUTRITIONSURVEY2010
DIETARY PRACTICESDIETARY PRACTICES
6.2.4 Types of Milk Consumed and Milk Added to Beverages
Among adult Singapore residents, the most common type of milk consumed was low fat milk (38.1%) followed by full cream milk (14.4%) and non-fat milk (1.7%). Almost a half (45.5%) and a quarter (26.6%) did not consume any milk or did not add any milk to the beverages, respectively. Compared with Malays (33.5%) and Indians (37.8%), a higher proportion of Chinese did not drink milk at all (49.0%).
Figure 6.2.4(a) and Table 6.2.4(a)
The most common type of milk/milk substitute added to beverages was sweetened condensed milk (31.4%), which is higher in energy and sugar content than other milks. More males (36.5%) than females (26.2%) used sweetened condensed milk with their beverages. 16.8% of the population used full cream milk whereas 9.0% used low fat or non-fat milk. About a quarter of the Singapore residents (26.0%) did not add any milk/milk substitutes to their beverages. Malays (44.5%) were more likely to add sweetened condensed milk to their beverages compared with Chinese (29.7%) and Indians (25.4%).
Figure 6.2.4(b) and Table 6.2.4(b)
6.2.4.1 Comparison of Types of Milk Consumed and Milk Added to Beverages, NNS 2004 and NNS 2010
About one in two reported not consuming any milk or milk-based drinks at all (45.5% in both 2010 and 2004). Fewer adult Singapore residents consumed non-fat milk in 2010 (1.7%) compared with in 2004 (5.4%).
Condensed milk remained the key type of milk added to beverages for one in three adult Singapore residents (31.4% in 2010 vs 35.0% in 2004). More Singapore residents reported choosing full cream milk in 2010 (16.8% vs 9.0% in 2004).
Table 6.2.4.1
6.2.5 Types of Sweetening Agent Added to Beverages
The majority of adult Singapore residents (59.8%) added sugar to tea, coffee and other beverages. Nonetheless, a considerable proportion (38.6%) did not use any sweetening agent at all. Males (64.4%) and Indians (66.6%) were more likely to add sugar to beverages compared to females and the other ethnic groups, respectively.
Figure 6.2.5 and Table 6.2.5
6.2.5.1 Comparison of Types of Sweetening Agent Added to Beverages, NNS 2004 and NNS 2010
More Singapore residents reported adding sugar to their beverages in 2010 (59.8% vs 51.9% in 2004).
Table 6.2.5.1

30
NATIONALNUTRITIONSURVEY2010
DIETARY PRACTICES
6.3 CONSUMPTION OF WATER AND SELECTED FOODS
6.3.1 Consumption of Plain Water
More than half of adult Singapore residents (55.0%) met the recommended intake of at least 1.5 litre (equivalent to 6 glasses) of plain water per day. Adults aged 60-69 years (42.7%) were least likely to meet this recommendation compared to the other age groups.
Figure 6.3.1 and Table 6.3.1
6.3.1.1 Comparison of Consumption of Plain Water, NNS 2004 and NNS 2010
In 2010, significantly more adult Singapore residents consumed the recommended amount of plain water per day (55.0% vs 47.8% in 2004).
Figure 6.3.1.1
6.3.2 Consumption of Deep Fried Food
The Dietary Guidelines for adult Singapore residents recommend limiting consumption of deep fried food to no more than twice per week. The majority of adult Singapore residents (56.2%) met this guideline, and 9.6% did not eat any deep fried foods at all. However, one-third (34.2%) exceeded the recommended limit. About half of Malays (51.0%) exceeded the dietary limit for deep fried food, and young adults aged 18-39 years reported consuming deep-fried food more often than older age groups.
Figure 6.3.2 and Table 6.3.2
6.3.2.1 Comparison of Consumption of Deep Fried Food, NNS 2004 and NNS 2010
The proportion of adult Singapore residents who exceeded the dietary limit for deep fried food consumption was similar over time (37.0% in 2004 vs 34.2% in 2010). However, significantly fewer Singapore residents reported not consuming any deep fried food (from 14.6% in 2004 to 9.6% in 2010) while more Singapore residents reported consuming such food twice a week or less (from 48.4% in 2004 to 56.2% in 2010).
Table 6.3.2.1
6.3.3 Consumption of Sweetened Drinks
Nearly half (45.4%) of adult Singapore residents consumed sweetened drinks, such as soft drinks, cordials and fruit drinks more than once per week. In addition, 15.6% consumed sweetened drinks at least seven times a week. Compared to females (39.9%), more males (50.9%) consumed sweetened drinks twice or more per week. More Malays (61.0%) consumed sweetened drinks twice or more per week compared to Chinese (41.9%) and Indians (48.8%). Young adults aged 18-39 years reported consuming sweetened drinks more often than older age groups.
Figure 6.3.3 and Table 6.3.3
31
NATIONALNUTRITIONSURVEY2010NATIONALNUTRITIONSURVEY2010
DIETARY PRACTICESDIETARY PRACTICES
6.3.3.1 Comparison of Consumption of Sweetened Drinks, NNS 2004 and NNS 2010
Between 2004 and 2010, the proportion of adult Singapore residents who consumed sweetened drinks more than once per week remained at about 45%. As with consumption of deep fried food, significantly fewer Singapore residents reported not consuming sweetened drinks at all (from 39.4% in 2004 to 26.5% in 2010) while more Singapore residents consumed sweetened drinks once a week or less (from 15.9% in 2004 to 28.2% in 2010).
Table 6.3.3.1
6.3.4 Consumption of Sweet Desserts and Snacks
The majority of adult Singapore residents (58.0%) consumed sweet desserts and snacks no more than twice per week and 14.9% of them did not eat these foods at all. However, about a quarter of the Singapore residents (27.1%) ate these foods three times or more per week. Among all age groups, the 18-29 years olds were most likely to eat sweet desserts and snacks. In this age group, four out of ten (39.4%) consumed sweet desserts and snacks three times or more per week, and only 6.5% did not eat these foods at all.
Figure 6.3.4 and Table 6.3.4
6.3.4.1 Comparison of Consumption of Sweet Desserts and Snacks, NNS 2004 and NNS 2010
Overall, significantly more adult Singapore residents consumed sweet desserts and snacks more thantwice per week (27.1%) compared with in 2004 (18.9%). The proportion eating these foods once or twice a week was also higher in 2010 (58.0% vs 42.9% in 2004). Correspondingly, there was a marked decline in the proportion of Singapore residents who reported not consuming any sweet desserts and snacks at all.
Table 6.3.4.1
6.4 HEALTH CONSCIOUS BEHAVIOURS
6.4.1 Adding Salt and Sauces at the Table
Most adult Singapore residents did not add salt or sauces to their food at the table (72.4%), while 19.0% reported adding salt or sauces when food is not tasty enough. A small proportion (8.6%) added salt and sauces at the table before tasting the food. Chinese (9.3%) were more likely to add any salt or sauces before tasting the food compared to Malays (6.8%) and Indians (6.1%).
Figure 6.4.1 and Table 6.4.1
6.4.1.1 Comparison of Adding Salt and Sauces at the Table, NNS 2004 and NNS 2010
The proportion of Singapore residents who did not add salt or sauces to their food at the table increased from 63.8% in 2004 to 72.4% in 2010.
Table 6.4.1.1

32
NATIONALNUTRITIONSURVEY2010
DIETARY PRACTICES
6.4.2 Trimming Fat from Meat and Trimming Skin from Poultry
The majority of adult Singapore residents (69.6%) trimmed off all or some of the visible fat from the meat they consumed. Females (53.4%) were more likely to trim off all visible fat than males (40.5%). Half of Indians (49.6%) trimmed off all the visible fat from meat eaten whereas one-third of them (30.0%) did not eat anymeat.Onefifth(20.3%)ofadultSingaporeresidentsdidnottrimoffanyvisiblefat.Ahigherproportionof Chinese (22.3%) and Malays (18.7%) did not trim off any visible fat from meat compared with Indians (8.4%).
Figure 6.4.2(a) and Table 6.4.2(a)
Approximately seven in ten adult Singapore residents (67.7%) trimmed off all or some of the skin from the poultry they consumed. However, a quarter (27.0%) did not trim off any skin. Similar to findings on trimming fat from meat, females (54.8%) were more likely than males (42.0%) to trim off all the skin from poultry eaten. Compared to Indians (11.3%), more Malays (34.1%) and Chinese (27.8%) did not trim off any of the skin.
Figure 6.4.2(b) and Table 6.4.2(b)
6.4.2.1 Comparison of Trimming Fat from Meat and Trimming Skin from Poultry, NNS 2004 and NNS 2010
There were no significant changes in Singapore residents’ habits of trimming fat from meat and trimming skin from poultry between 2004 and 2010.
Table 6.4.2.1
6.4.3 Dieting for Weight Loss
The majority (73.8%) of adult Singapore residents had never dieted to lose weight. 18.8% reported that they had dieted occasionally or frequently in the past, while 7.4% reported continually dieting. More females (33.4%) than males (18.9%) had dieted before or were continually dieting. The younger age groups, 18-29 years and 30-39 years, were more likely to have dieted or be dieting (34.8%-35.9%) compared to other age groups.
Figure 6.4.3 and Table 6.4.3
6.4.3.1 Comparison of Dieting for Weight Loss, NNS 2004 and NNS 2010
Between 2004 and 2010 there were no significant changes in the proportion of Singapore residents who had dieted in the past or were continually dieting for weight loss.
Table 6.4.3.1

33
NATIONALNUTRITIONSURVEY2010NATIONALNUTRITIONSURVEY2010
DIETARY PRACTICESDIETARY PRACTICES
6.5 GENDER, ETHNIC AND AGE DIFFERENCES IN DIETARY PRACTICES
Gender Differences
Males Females
•Morelikelytoeatathawkercentres/coffeeshop
stalls/food courts
•Morefrequentlyconsumedeepfriedfood
•Morefrequentlyconsumesweeteneddrinks
•Morelikelytoaddsweetenedcondensedmilkto
beverages
•Morelikelytoaddsugartobeverages
•Morelikelytobedieting/havedietedbefore
•Morelikelytoconsumewholegrains(e.g.
wholemeal bread and brown/red rice)
•Morelikelytotrimoffanyvisiblefat/skinfrom
meat/poultry
Ethnic Differences
Chinese Malays Indians
•Morelikelytoeatathawker
centres/coffee shop stalls/food
courts
•Lesslikelytoconsume
wholemeal bread
•Lesslikelytoconsumeany
milk/milk-based beverages
•Morelikelytoaddsalt/sauces
at the table before tasting the
food
•Lesslikelytotrimoffanyvisible
fat/skin from meat/poultry
•Morelikelytoskipbreakfast
•MorefrequentlyeatatWestern
fast food restaurants
•Lesslikelytoconsume
wholegrains (e.g. wholemeal
bread and brown/red rice)
•Lesslikelytodrink≥ 1.5L plain
water
•Morefrequentlyconsumedeep
fried food
•Morefrequentlyconsume
sweetened drinks
•Morelikelytouseblendedoil
for cooking
•Morelikelytoaddsweetened
condensed milk to beverages
•Lesslikelytotrimoffanyvisible
fat/skin from meat/poultry
•Lesslikelytoconsumebrown/
red rice
•Morelikelytoaddsugarto
beverages

REFERENCES
NATIONALNUTRITIONSURVEY2010
34
NATIONALNUTRITIONSURVEY2010
DIETARY PRACTICES
Age Differences
18-29 years 30-59 years 60-69 years
•Morelikelytoskipbreakfast
•MorefrequentlyeatatWestern
fast food restaurants
•Lesslikelytoconsume
wholegrains (e.g. wholemeal
bread and brown/red rice)
•Morefrequentlyconsumedeep
fried food
•Morefrequentlyconsume
sweetened drinks
•Morefrequentlyconsume
sweet desserts and snacks
•Morelikelytoaddsweetened
condensed milk to beverages
•Morelikelytobedieting/have
dieted before
•Morelikelytoeatathawker
centres/coffee shop stalls/food
courts
•Lesslikelytoconsumeany
milk/milk-based beverages
•Morelikelytobedieting/have
dieted before (among 30 to 39
year olds)
•Lesslikelytoconsumebrown/
red rice
•Lesslikelytodrink≥1.5L plain
water
•Lesslikelytoconsumeany
milk/milk-based beverages

REFERENCES
35
NATIONALNUTRITIONSURVEY2010
REFERENCES
NATIONALNUTRITIONSURVEY2010NATIONALNUTRITIONSURVEY2010
DIETARY PRACTICES
references1. Deurenberg-Yap M, Li T, Tan WL, van Staveren WA, Deurenberg P. Validation of a semi-quantitative
food frequency questionnaire for estimation of Intake of energy, fats and cholesterol among Singapore. Asia Pacific Journal of Clinical Nutrition, 2000; 9(4): 282-288.
2. Ministry of Health. Epidemiology and Disease Control Division. National Health Survey 2010. Singapore, Ministry of Health, 2011.
http://www.moh.gov.sg/content/moh_web/home/Publications/Reports/2011/national_health_survey2010.html
3. Health Promotion Board. Dietary Guidelines 2003 For Adult Singaporeans (18-65 years). Singapore, Health Promotion Board, 2003.
4. Health Promotion Board. Healthy Diet Pyramid. http://www.hpb.gov.sg/HOPPortal/article?id=2638
5. Henry CJK. Basal metabolic rate studies in humans: measurement and development of new equations. Public Health Nutrition 2005; 8(7A): 1133-1152.
6. WorldHealthOrganization.Reducing salt intake in populations - Report of a WHO forum and technical meeting 5-7 October 2006, Paris, France.Geneva,WorldHealthOrganization,2006.
7. Brown IJ, Tzoulaki I, Candeias V, Elliott P. Salt Intake around the world: implications for public health. International Journal of Epidemiology 2009; 1-23.

NATIONALNUTRITIONSURVEY2010
ANNEXES
36
NATIONALNUTRITIONSURVEY2010
project teamHEALTH PROMOTION BOARD
Research Team
Dr. Ling CHEWDr. Mei Fen CHANAnita LAIYi MAQianhui CHENGDr. Annie LINGDr.GraceSOONDr. Amber Carla BASTIANMeng Thiam LIMBenjamin LEE
Survey Planning
Dr. Ling CHEWDr. Mei Fen CHANAnita LAIJingShingWONG
ACKNOWLEDGEMENT
We also wish to thank the Epidemiology and Disease Control Division (Ministry of Health), National Healthcare Group and SGH Pathology Laboratory for their contributions to the survey planning and the platform for engaging participants for the National Nutrition Survey 2010.
Survey Fieldwork
Sew King YAPLaurenHOMeiMeiLUOQianhui CHENGJay LI
Survey Report
Writers:
Yi MAAnita LAI
Editorial:
Dr. Ling CHEWDr. Mei Fen CHANDr.GraceSOONDr. Amber Carla BASTIANClareWHITTON

37
NATIONALNUTRITIONSURVEY2010NATIONALNUTRITIONSURVEY2010
ANNEXES
NATIONALNUTRITIONSURVEY2010
ANNEX I
annexesAnnex I: Recommended Dietary Allowances (RDAs)
Energy
Formulae to calculate the daily energy requirements
Age Group Energy (kcal)
Males
18-29 (16.0*W+545)*1.61
30-59 (14.2*W+593)*1.61
60-69 (13.5*W+514)*1.61
Females
18-29 (13.1*W+558)*1.61
30-59 (9.74*W+694)*1.61
60-69 (10.1*W+569)*1.61
* W - Weight in kilograms
ThepreviousWHOformulaeusedinNNS2004containedadisproportionatenumberofItaliansubjects.Energy requirements for Asian populations may have been overestimated. In the NNS 2010, equations developed by Henry (2005) were used, in which Italian subjects were excluded and a large number of people from the tropics were included. According to NHS 2010, the mean weight of Singaporeans was 71.3 kilograms for males and 58.5 kilograms for females, respectively.
RDA for energy (kcal), by gender and age (years) groups
Age Group 18-29 30-39 40-49 50-59 60-69
Males 2721 2606 2606 2606 2249
Females 2081 2048 2048 2048 1876
The average RDAs for energy are 2595 kcal for males and 2038 kcal for females respectively.
Protein
Therecommendedproteinintakeforanadultis0.75g/kgbodyweightperday(WHO,1985).Asthenetprotein utilisation (NPU) of a mixed diet in Singapore is estimated to be 70%, the recommended protein intake for an adult Singapore resident is 1.07g/kg body weight per day (Health Promotion Board, 2003).
The average RDAs for protein are 76.3g and 62.6g for males and females, respectively.

38
NATIONALNUTRITIONSURVEY2010
ANNEX I
Total Fat
The recommended limit used for total fat in this section is 30% of the RDA for energy of each gender and age group divided by the factor 9. This conversion factor used for fat is based on the estimation that one gram of fat provides around 9 kcal of energy.
RDA for total fat (g), by gender and age (years) groups
Age Group 18-29 30-39 40-49 50-59 60-69
Males 90.7 86.9 86.9 86.9 75.0
Females 69.4 68.3 68.3 68.3 62.5
The average RDAs for total fat are 86.5g and 67.9g for males and females respectively.
Saturated Fat
The recommended limit for saturated fat is 10% of the RDA for energy of each gender and age group divided by the factor 9.
RDA for saturated fat (g), by gender and age (years) groups
Age Group 18-29 30-39 40-49 50-59 60-69
Males 30.2 29.0 29.0 29.0 25.0
Females 23.1 22.8 22.8 22.8 20.8
The average RDAs for saturated fat are 28.8g and 22.6g for males and females respectively.
Carbohydrates
The recommended carbohydrate intake used in this section is 60% (mid-point of the recommended range) of the mean RDA for energy for each gender and age group divided by the factor 4. This conversion factor is based on the estimation that one gram of carbohydrate provides about 4 kcal of energy.
RDA for carbohydrate (g), by gender and age (years) groups
Age Group 18-29 30-39 40-49 50-59 60-69
Males 408.2 390.9 390.9 390.9 337.3
Females 312.1 307.1 307.1 307.1 281.5
The average RDAs for carbohydrates are 389.3g and 305.7g for males and females, respectively.
Cholesterol
The Dietary Guidelines recommend that cholesterol intake should not exceed 300mg per day across gender and age groups.

39
NATIONALNUTRITIONSURVEY2010NATIONALNUTRITIONSURVEY2010
ANNEX IANNEX I
Dietary Fibre
The Dietary Guidelines recommend a daily intake of 10g of dietary fibre per 1000 kcal of energy requirement for adults.
RDA for dietary fibre (g), by gender and age (years) groups
Age Group 18-29 30-39 40-49 50-59 60-69
Males 27.2 26.1 26.1 26.1 22.5
Females 20.8 20.5 20.5 20.5 18.8
The average RDA for dietary fibre is 26.0g for males and 20.4g for females.
Iron
TherequirementsofironwereobtainedfromtheReportoftheJointFAO/WHOExpertGroup,FAO,Rome,1970.
RDA for iron (mg), by gender and age (years) groups
Age Group 18-29 30-39 40-49 50-59 60-69
Males 6.0 6.0 6.0 6.0 6.0
Females 19.0 19.0 19.0 19.0 6.0
The average RDA for iron is 6.0mg for males and 17.7mg for females.
Calcium
TheReportoftheJointFAO/WHOExpertGroup,FAO,Rome,1961,recommendsthattheRDAforcalciumfor adult Singapore residents aged 18 years and those aged above 51 years is 1000mg. The RDA for those who are aged 19-50 years is 800mg.
RDA for calcium (mg), by gender and age (years) groups
Age Group 18 19-29 30-39 40-49 50 51-59 60-69
Males 1000 800 800 800 800 1000 1000
Females 1000 800 800 800 800 1000 1000
Vitamin A
The requirements for vitaminA intakehavebeen taken from theReportof theJointFAO/WHOExpertGroup,FAO,Rome,1965.TheRDAforvitaminAis750mcgforadultsaged18-69years.

40
NATIONALNUTRITIONSURVEY2010
ANNEX I
Vitamin C
TherequirementsofvitaminCwereobtainedfromtheReportoftheJointFAO/WHOExpertGroup,FAO,Rome, 1970. The RDA for vitamin C for adult males aged 18 years and above and females aged 19 years and above is 105mg and 85mg respectively. For females aged 18 years, the RDA for vitamin C is 80mg.
RDA for vitamin C (mg), by gender and age (years) groups
Age Group 18 19-29 30-39 40-49 50-59 60-69
Males 105 105 105 105 105 105
Females 80 85 85 85 85 85

41
NATIONALNUTRITIONSURVEY2010NATIONALNUTRITIONSURVEY2010
ANNEX IIANNEX I
31.7
16.2
51.3
30.9
15.4
51.7
31.4
15.3
52.1
31.0
14.9
52.3
31.7
15.6
51.9
25-30
10-15
55-65
Annex II: Figures and Tables
Figure 3.1.1: Energy contribution (%) of macronutrients to total^ energy intake among adult Singapore residents, by gender
Total
40
20
60
Carbohydrate Protein Fat
50
10
0
30
Males Females Recommended
100
90
80
70
Figure 3.1.2: Energy contribution (%) of macronutrients to total^ energy intake among adult Singapore residents, by gender and ethnic groups
40
20
60
Carbohydrate Protein Fat
50
10
0
30
Males Females
90
80
70
100
31.7
14.6
53.2
31.7
14.0
53.8
31.5
13.3
54.6
30.9
13.2
54.5
Males Females Males Females
Chinese Malay Indian
%
%

42
NATIONALNUTRITIONSURVEY2010
ANNEX II
31.4
15.3
52.1
Figure 3.1.3: Energy contribution (%) of macronutrients to total^ energy intake among adult Singapore residents by year, NNS 1998, NNS 2004 and NNS 2010
40
20
60
Carbohydrate Protein Total Fat
50
10
0
30
2010
90
80
70
100
28.6
14.0
56.7
26.5
13.4
60.1
2004 1998
^ Percentages do not add up to 100% because there are other components that contribute to the total daily energy intake (e.g. alcohol).
%

43
NATIONALNUTRITIONSURVEY2010NATIONALNUTRITIONSURVEY2010
ANNEX IIANNEX II
Table 3.1.1: Mean (SE) and percentile distribution of daily energy intake (kcal) among adult Singapore residents, by gender, ethnic and age (years) groups
5th 10th 25th 50th 75th 90th 95th
Males
Chinese 2906 59.6 1650 1826 2245 2703 3305 4212 4696
Malay 2990 114.5 1524 1678 2134 2743 3668 4672 5311
Indian 2983 91.7 1265 1768 2248 2949 3467 4254 4681
Females
Chinese 2322 44.0 1263 1503 1776 2290 2747 3241 3628
Malay 2379 66.5 1070 1354 1859 2228 2864 3701 4041
Indian 2229 55.1 1145 1431 1695 2122 2676 3262 3491
All Ethnic Groups
Chinese 2613 40.3 1428 1642 1975 2522 3096 3790 4379
Malay 2671 69.0 1213 1532 1911 2428 3151 4081 4721
Indian 2643 60.2 1192 1469 1927 2514 3258 3836 4423
Males
18-29 3302 100.1 1931 2077 2494 3120 3899 4746 5384
30-39 2980 121.6 1295 1691 2233 2841 3466 4599 4905
40-49 2915 77.4 1669 1858 2256 2712 3458 3992 4266
50-59 2750 97.2 1692 1813 2119 2683 3185 3785 4441
60-69 2610 144.6 1444 1587 1962 2569 2886 3548 4289
Females
18-29 2436 70.2 1157 1577 1876 2320 2879 3394 3902
30-39 2472 68.9 1402 1639 1969 2413 2863 3411 3833
40-49 2221 67.0 1239 1420 1728 2046 2550 3121 3698
50-59 2221 85.5 1133 1336 1640 2204 2704 3084 3620
60-69 2227 91.6 1285 1434 1736 2408 2592 3107 3202
All Age Groups
18-29 2853 67.0 1496 1712 2160 2702 3371 4141 4771
30-39 2722 73.0 1362 1640 2010 2596 3294 4104 4648
40-49 2546 57.7 1332 1665 1877 2401 3093 3837 4079
50-59 2500 76.0 1329 1570 1943 2428 2955 3496 4370
60-69 2438 94.2 1344 1446 1820 2456 2717 3213 3774
Total
Males 2927 48.4 1593 1811 2244 2726 3408 4263 4798
Females 2322 35.0 1234 1446 1781 2286 2751 3344 3698
ALL 2624 32.4 1383 1638 1960 2515 3123 3871 4409
SE - standard error of mean
Mean(kcal)
SE Percentile

44
NATIONALNUTRITIONSURVEY2010
ANNEX II
Table 3.1.2: Distribution (%) of percentage of RDA met for energy intake among adult Singapore residents, by gender, ethnic and age (years) groups
< 50% < 70% < 100% ≥ 100% ≥ 120% ≥ 150% ≥ 200%
Males
Chinese 0.7 8.2 38.9 61.1 35.4 14.2 2.0
Malay 2.6 11.9 43.9 56.1 33.8 17.5 5.0
Indian 4.7 11.8 38.7 61.3 41.8 14.1 3.2
Females
Chinese 1.9 7.7 41.1 58.9 41.9 14.3 2.4
Malay 3.6 12.2 39.9 60.1 35.8 20.7 3.6
Indian 1.7 12.1 47.9 52.1 35.8 13.7 1.5
All Ethnic Groups
Chinese 1.3 7.9 40.0 60.0 38.7 14.3 2.2
Malay 3.1 12.1 41.8 58.2 34.9 19.2 4.2
Indian 3.3 11.9 42.9 57.1 39.1 13.9 2.4
Males
18-29 0.0 3.7 34.9 65.1 39.7 19.9 5.0
30-39 5.0 13.4 39.7 60.3 41.8 17.9 2.2
40-49 1.1 8.8 41.7 58.3 39.1 13.3 1.7
50-59 0.6 10.7 46.2 53.8 29.0 9.7 0.3
60-69 0.0 8.7 31.0 69.0 28.4 12.8 4.6
Females
18-29 1.9 8.8 34.2 65.8 40.4 17.3 2.5
30-39 0.9 4.8 36.7 63.3 47.0 20.5 4.1
40-49 3.0 11.1 50.4 49.6 31.5 12.6 3.2
50-59 3.5 11.9 44.5 55.5 37.2 10.8 1.4
60-69 0.4 5.1 40.3 59.7 54.0 15.2 0.0
All Age Groups
18-29 1.0 6.3 34.6 65.4 40.1 18.6 3.7
30-39 2.9 9.0 38.2 61.8 44.5 19.2 3.1
40-49 2.1 10.0 46.3 53.7 35.1 12.9 2.5
50-59 2.0 11.3 45.4 54.6 32.9 10.2 0.8
60-69 0.2 7.1 35.1 64.9 39.9 13.9 2.5
Total
Males 1.4 9.1 39.6 60.4 35.9 14.6 2.5
Females 2.1 8.8 41.6 58.4 40.4 15.2 2.5
ALL 1.8 9.0 40.6 59.4 38.2 14.9 2.5

45
NATIONALNUTRITIONSURVEY2010NATIONALNUTRITIONSURVEY2010
ANNEX IIANNEX II
Table 3.1.3: Comparison of mean (CI) energy intake (kcal) among adult Singapore residents, by gender and ethnic groups
1998 2004 2010
Crude Age-Std(95% CI)
Crude Age-Std(95% CI)
Age-Std(95% CI)
Gender
Males 2335 2304(2253, 2355)
2688 2668(2588, 2748)
2927(2832, 3022)
623
Females 1838 1818(1780, 1855)
2112 2093(2032, 2154)
2322(2253, 2391)
504
Ethnic Group
Chinese 2060 2035(1996, 2075)
2367 2356(2294, 2419)
2613(2534, 2692)
578
Malay 2173 2138(2057, 2220)
2523 2467(2334, 2600)
2671(2536, 2806)
533
Indian 2237 2214(2133, 2294)
2499 2451(2335, 2566)
2643(2525, 2761)
429
Overall 2087 2062(2028, 2095)
2398 2378(2325, 2431)
2624(2561, 2688)
562
Age-Std: Age standardised
CI: Confidence Interval
Table 3.1.4: Comparison of proportion (%) of adult Singapore residents consuming ≥ 100% of RDA for energy, by gender
1998 2004 2010
Std (95% CI) Std (95% CI) Std (95% CI)
Gender
Males 33.2(30.0, 36.3)
47.2(43.0, 51.3)
60.4(55.1, 65.8)
27.2
Females 34.2(31.2, 37.2)
48.6(44.3, 52.8)
58.4(53.4, 63.5)
24.2
Overall 33.7(31.5, 35.8)
47.9(44.9, 50.8)
59.4(55.7, 63.1)
25.7
Std: Age standardised and calculated based on updated RDA formulae
CI: Confidence Interval
MeanDifference(kcal)[‘10- ‘98]
Difference(Age-Stdproportion)[‘10- ‘98]

46
NATIONALNUTRITIONSURVEY2010
ANNEX II
Table 3.2.1: Mean (SE) and percentile distribution of daily protein intake (weight in grams) among adult Singapore residents, by gender, ethnic and age (years) groups
5th 10th 25th 50th 75th 90th 95th
Males
Chinese 112.0 2.9 56.3 65.6 80.7 105.8 134.4 166.0 184.0
Malay 105.1 4.1 45.5 56.8 72.8 93.2 129.7 171.8 193.0
Indian 99.2 3.5 39.0 51.8 71.6 93.0 122.9 149.9 169.9
Females
Chinese 94.2 2.1 47.7 55.2 71.4 91.3 112.9 133.8 153.3
Malay 86.7 2.5 37.4 46.4 60.9 81.6 108.5 132.8 147.6
Indian 74.6 2.1 38.1 44.3 54.6 69.8 91.5 111.5 124.1
All Ethnic Groups
Chinese 103.0 1.9 53.9 59.8 77.1 97.0 122.9 150.6 169.0
Malay 95.5 2.5 39.3 51.9 68.1 88.4 118.9 147.8 173.0
Indian 88.1 2.2 38.7 46.4 61.2 83.4 105.8 133.4 156.2
Males
18-29 125.9 4.1 64.8 77.5 91.5 115.8 150.2 188.1 224.7
30-39 110.8 5.8 52.1 61.8 77.2 104.3 129.9 178.3 197.0
40-49 108.7 3.7 55.5 61.7 81.1 98.2 129.8 163.6 180.5
50-59 102.0 5.0 54.8 60.1 77.4 97.0 126.8 148.4 153.4
60-69 97.3 6.0 50.6 55.5 72.1 90.8 105.8 136.0 171.1
Females
18-29 93.6 2.9 41.6 56.0 73.1 88.7 112.5 135.5 146.6
30-39 98.9 3.6 49.6 59.0 75.1 94.2 116.5 148.0 168.9
40-49 86.1 2.9 44.5 51.9 63.2 83.0 100.6 132.5 147.5
50-59 88.7 4.4 38.6 47.5 59.3 85.5 112.6 128.5 147.8
60-69 87.2 4.5 46.0 56.2 60.6 85.4 109.8 121.4 125.8
All Age Groups
18-29 109.2 2.7 53.5 64.3 80.1 104.4 130.5 159.3 188.7
30-39 104.7 3.4 52.2 60.5 76.0 97.7 123.6 161.7 183.6
40-49 96.7 2.5 48.1 57.2 70.3 89.5 114.6 149.9 166.5
50-59 95.7 3.6 47.3 54.6 72.0 94.4 118.9 138.3 150.7
60-69 92.8 3.9 48.3 55.7 69.1 91.3 109.4 126.2 149.3
Total
Males 109.5 2.3 55.6 63.0 79.6 101.5 130.7 165.7 184.4
Females 91.1 1.6 45.0 53.0 66.7 87.1 111.4 132.4 150.4
ALL 100.3 1.5 48.8 56.5 73.3 94.2 121.2 149.9 168.7
SE - standard error of mean
Mean(g)
SE Percentile

47
NATIONALNUTRITIONSURVEY2010NATIONALNUTRITIONSURVEY2010
ANNEX IIANNEX II
Table 3.2.2: Distribution (%) of percentage of RDA met for protein among adult Singapore residents, by gender, ethnic and age (years) groups
< 50% < 70% < 100% ≥ 100% ≥ 120% ≥ 150% ≥ 200%
Males
Chinese 0.0 1.6 16.0 84.0 65.2 39.6 13.6
Malay 1.6 8.1 28.8 71.2 52.5 32.8 14.5
Indian 4.2 9.9 28.7 71.3 51.6 31.6 9.2
Females
Chinese 1.6 3.6 16.5 83.5 70.9 46.6 15.1
Malay 1.6 8.0 27.2 72.8 56.9 38.3 15.6
Indian 2.8 8.8 39.4 60.6 42.9 22.4 4.8
All Ethnic Groups
Chinese 0.8 2.6 16.2 83.8 68.1 43.1 14.4
Malay 1.6 8.1 28.0 72.0 54.8 35.7 15.1
Indian 3.6 9.4 33.5 66.5 47.7 27.4 7.2
Males
18-29 0.0 0.6 8.6 91.4 74.6 53.5 20.8
30-39 2.4 4.4 24.1 75.9 59.6 39.6 16.3
40-49 0.7 4.0 20.6 79.4 60.5 37.3 14.8
50-59 0.0 3.5 18.1 81.9 55.1 32.0 5.4
60-69 0.5 5.9 28.0 72.0 60.0 21.5 8.3
Females
18-29 1.9 4.9 13.7 86.3 73.5 42.8 16.8
30-39 0.0 2.4 12.8 87.2 74.9 50.1 17.2
40-49 2.6 4.6 20.6 79.4 58.6 32.7 11.1
50-59 2.7 7.1 30.9 69.1 59.9 44.9 15.7
60-69 0.3 4.4 26.7 73.3 63.2 49.0 6.9
All Age Groups
18-29 1.0 2.8 11.2 88.8 74.0 48.0 18.8
30-39 1.2 3.4 18.4 81.6 67.4 45.0 16.8
40-49 1.7 4.3 20.6 79.4 59.5 34.9 12.9
50-59 1.3 5.2 24.1 75.9 57.4 38.1 10.3
60-69 0.4 5.3 27.4 72.6 61.5 33.9 7.7
Total
Males 0.7 3.5 19.2 80.8 61.9 37.7 13.2
Females 1.7 4.7 20.3 79.7 66.1 43.0 14.2
ALL 1.2 4.1 19.8 80.2 64.0 40.4 13.7

48
NATIONALNUTRITIONSURVEY2010
ANNEX II
Table 3.2.3: Comparison of mean (CI) protein intake (weight in grams) among adult Singapore residents, by gender and ethnic groups
1998 2004 2010
Crude Age-Std(95% CI)
Crude Age-Std(95% CI)
Age-Std(95% CI)
Gender
Males 76.5 75.5(73.6, 77.3)
91.5 90.9(88.0, 93.7)
109.5(105.1, 113.9)
34.0
Females 63.1 62.3(60.9, 63.7)
75.3 74.6(72.3, 76.9)
91.1(87.9, 94.4)
28.8
Ethnic Group
Chinese 70.3 69.5(68.1, 70.9)
83.8 83.5(81.3, 85.7)
103.0(99.4, 106.6)
33.5
Malay 67.5 66.4(63.8, 69.0)
82.4 80.8(76.3, 85.2)
95.5(90.7, 100.4)
29.1
Indian 67.8 67.2(64.6, 69.8)
79.6 77.8(73.8, 81.7)
88.1(83.7, 92.4)
20.9
Overall 69.8 68.9(67.7, 70.1)
83.3 82.7(80.8, 84.6)
100.3(97.5, 103.2)
31.4
Age-Std: Age standardised
CI: Confidence Interval
Table 3.2.4: Comparison of proportion (%) of adult Singapore residents consuming ≥ 100% of RDA for protein, by gender
1998 2004 2010
Std (95% CI) Std (95% CI) Std (95% CI)
Gender
Males 45.2(41.9, 48.6)
64.4(60.4, 68.4)
80.8(77.1, 84.5)
35.6
Females 48.1(44.9, 51.2)
65.1(61.0, 69.2)
79.7(75.3, 84.1)
31.6
Overall 46.6(44.3, 49.0)
64.8 (61.9, 67.6)
80.2(77.3, 83.1)
33.6
Std: Age standardised and calculated based on updated RDA formulae
CI: Confidence Interval
MeanDifference(g)[‘10- ‘98]
Difference(Age-Stdproportion)[‘10- ‘98]

49
NATIONALNUTRITIONSURVEY2010NATIONALNUTRITIONSURVEY2010
ANNEX IIANNEX II
Table 3.3.1: Mean (SE) and percentile distribution of daily fat intake (weight in grams) among adult Singapore residents, by gender, ethnic and age (years) groups
5th 10th 25th 50th 75th 90th 95th
Males
Chinese 101.9 3.0 47.3 55.2 71.5 93.3 124.6 161.2 186.1
Malay 107.2 4.4 43.6 52.9 70.9 95.0 141.2 182.7 208.5
Indian 104.9 4.2 37.4 51.4 74.8 100.2 132.7 162.9 181.8
Females
Chinese 83.1 2.0 37.6 48.3 59.4 78.6 102.8 121.9 135.4
Malay 84.5 2.6 36.8 44.6 62.4 79.4 103.4 137.0 147.1
Indian 79.3 2.5 36.3 40.4 57.4 75.0 98.0 121.8 134.9
All Ethnic Groups
Chinese 92.5 1.9 43.1 49.7 65.6 85.9 113.0 138.8 167.1
Malay 95.4 2.7 39.2 48.5 63.4 83.5 117.8 156.1 182.8
Indian 93.3 2.6 36.3 45.0 64.5 86.5 117.9 149.8 168.3
Males
18-29 122.4 4.3 62.2 66.4 86.2 109.7 148.5 188.0 214.7
30-39 108.1 5.7 47.4 53.3 75.4 101.4 128.3 177.2 211.4
40-49 102.3 3.6 48.3 56.1 72.9 95.1 123.0 156.5 176.0
50-59 91.3 5.1 47.1 51.6 66.8 80.2 110.9 138.2 161.9
60-69 87.4 7.2 36.6 42.1 56.2 80.0 94.6 133.7 178.2
Females
18-29 90.1 3.0 40.7 52.1 65.9 84.5 109.0 133.5 145.5
30-39 90.4 3.1 48.4 52.8 66.7 84.8 109.3 134.3 146.3
40-49 79.3 2.7 35.9 47.4 62.4 72.9 90.9 119.0 136.6
50-59 76.9 3.9 32.5 38.2 52.1 71.5 99.3 115.4 124.0
60-69 74.6 4.6 32.5 42.8 49.5 68.3 92.8 111.6 119.7
All Age Groups
18-29 105.6 2.8 50.9 59.0 76.5 97.7 127.6 160.9 188.5
30-39 99.1 3.3 48.1 53.4 69.8 93.7 118.5 152.5 180.7
40-49 90.1 2.4 42.8 51.9 64.5 80.0 112.8 140.7 160.0
50-59 84.5 3.5 37.8 48.2 59.3 77.5 106.2 124.6 158.4
60-69 81.6 4.5 36.4 42.2 51.9 80.2 93.7 124.2 149.5
Total
Males 103.0 2.4 46.5 53.7 71.6 94.8 124.6 161.9 190.3
Females 83.0 1.6 37.1 47.5 59.8 78.7 101.3 123.6 138.3
ALL 93.0 1.5 41.7 49.5 64.8 85.8 113.5 143.1 170.7
SE - standard error of mean
Mean(g)
SE Percentile

50
NATIONALNUTRITIONSURVEY2010
ANNEX II
Table 3.3.2: Distribution (%) of percentage of RDA met for total fat among adult Singapore residents, by gender, ethnic and age (years) groups
< 50% < 70% < 100% ≥ 100% ≥ 120% ≥ 150% ≥ 200%
Males
Chinese 2.3 14.6 40.8 59.2 40.5 19.5 6.7
Malay 3.9 17.9 42.3 57.7 40.8 27.7 12.0
Indian 5.6 14.4 37.5 62.5 43.3 25.9 6.9
Females
Chinese 2.3 8.2 36.1 63.9 47.2 26.2 4.7
Malay 3.9 12.5 36.8 63.2 43.0 25.2 10.9
Indian 2.9 14.0 40.9 59.1 40.9 20.6 4.6
All Ethnic Groups
Chinese 2.3 11.4 38.4 61.6 43.9 22.9 5.7
Malay 3.9 15.1 39.4 60.6 41.9 26.4 11.4
Indian 4.4 14.2 39.0 61.0 42.2 23.5 5.9
Males
18-29 0.6 6.8 27.2 72.8 51.7 31.1 12.9
30-39 3.9 13.5 37.7 62.3 46.9 24.4 10.2
40-49 3.1 12.6 40.8 59.2 41.0 21.1 5.3
50-59 2.1 21.5 55.4 44.6 31.4 13.4 3.1
60-69 5.9 22.4 38.8 61.2 32.2 17.2 6.3
Females
18-29 2.2 8.8 29.4 70.6 51.0 30.5 8.0
30-39 0.9 4.5 27.5 72.5 56.2 31.3 7.5
40-49 3.7 10.4 42.2 57.8 36.4 19.6 5.1
50-59 4.5 13.1 43.4 56.6 41.3 22.9 3.2
60-69 0.7 10.5 43.6 56.4 46.3 22.1 3.1
All Age Groups
18-29 1.4 7.9 28.3 71.7 51.3 30.8 10.4
30-39 2.4 8.9 32.5 67.5 51.6 27.9 8.8
40-49 3.4 11.5 41.5 58.5 38.5 20.3 5.2
50-59 3.2 17.5 49.7 50.3 36.1 17.9 3.2
60-69 3.6 17.1 40.9 59.1 38.5 19.4 4.9
Total
Males 2.9 15.1 40.6 59.4 40.9 21.4 7.5
Females 2.6 9.4 36.7 63.3 45.9 25.5 5.6
ALL 2.7 12.2 38.6 61.4 43.4 23.5 6.6

51
NATIONALNUTRITIONSURVEY2010NATIONALNUTRITIONSURVEY2010
ANNEX IIANNEX II
Table 3.3.3: Comparison of mean (CI) fat intake (g) among adult Singapore residents, by gender and ethnic groups
1998 2004 2010
Crude Age-Std(95% CI)
Crude Age-Std(95% CI)
Age-Std(95% CI)
Gender
Males 71.0 69.3(67.1, 71.4)
86.8 85.9(82.7, 89.1)
103.0(98.3, 107.6)
33.7
Females 56.1 55.0(53.4, 56.6)
69.2 68.3(65.8, 70.9)
83.0(79.9, 86.1)
28.0
Ethnic Group
Chinese 62.1 60.7(59.1, 62.3)
76.2 75.7(73.2, 78.2)
92.5(88.8, 96.1)
31.8
Malay 69.1 67.2(63.7, 70.6)
85.2 82.9(77.5, 88.3)
95.4(90.1, 100.6)
28.2
Indian 69.8 69.0(65.6, 72.4)
83.3 81.2(76.5, 85.9)
93.3(88.2, 98.4)
24.3
Overall 63.6 62.2(60.8, 63.5)
77.9 77.0(74.9, 79.2)
93.0(90.1, 95.9)
30.8
Age-Std: Age standardised
CI: Confidence Interval
Table 3.3.4: Comparison of proportion (%) of adult Singapore residents consuming excessive fat (fat contributing ≥ 30% of recommended energy requirements), by gender
1998 2004 2010
Std (95% CI) Std (95% CI) Std (95% CI)
Gender
Males 25.5(22.7, 28.4)
40.1(36.1, 44.2)
59.4(53.8, 64.9)
33.9
Females 25.8(23.1, 28.5)
44.1(39.9, 48.3)
63.3(58.3, 68.4)
37.5
Overall 25.7(23.7, 27.6)
42.1(39.2, 45.1)
61.4(57.6, 65.1)
35.7
Std: Age standardised and calculated based on updated RDA formulae
CI: Confidence Interval
MeanDifference(g)[‘10- ‘98]
Difference(Age-Stdproportion)[‘10- ‘98]

52
NATIONALNUTRITIONSURVEY2010
ANNEX II
Table 3.3.5: Major sources of total fat in the diet of adult Singapore residents by year, 1998, 2004 and 2010
1998(%)
2004(%)
2010(%)
Stir fried vegetables* 12.4 13.6 12.3
Biscuits, pastries, cakes, nuts, titbits, snacks, local snacks** 13.8 12.2 12.4
Rice, noodles, meat dishes and desserts containing coconut milk/cream 10.3 11.3 10.6
Fried noodles 6.7 7.6 5.6
Flavoured rice e.g. chicken rice, nasi briyani, claypot rice etc 6.5 5.7 5.1
* Plain or with meat/seafood/oyster sauce or sambal
** Crackers, puff pastries, nuts, salty snacks, chocolates, etc
Food Items

53
NATIONALNUTRITIONSURVEY2010NATIONALNUTRITIONSURVEY2010
ANNEX IIANNEX II
Table 3.4.1: Mean (SE) and percentile distribution of daily saturated fat intake (weight in grams) among adult Singapore residents, by gender, ethnic and age (years) groups
5th 10th 25th 50th 75th 90th 95th
Males
Chinese 38.1 1.2 16.3 20.2 26.1 34.6 47.3 61.0 73.8
Malay 43.2 1.8 16.3 21.8 29.3 37.9 55.7 73.6 85.5
Indian 42.9 1.7 17.3 20.6 29.9 40.2 54.3 67.3 76.9
Females
Chinese 30.3 0.8 13.4 15.8 20.9 28.5 38.3 46.3 50.8
Malay 33.8 1.1 13.5 17.5 24.4 31.2 41.6 55.5 60.7
Indian 31.9 1.1 11.9 14.8 22.0 30.6 39.9 49.2 56.8
All Ethnic Groups
Chinese 34.2 0.7 14.4 17.5 23.6 31.7 41.3 52.7 63.0
Malay 38.3 1.1 14.9 18.5 25.8 33.4 46.7 63.9 73.9
Indian 37.9 1.1 12.7 17.9 25.5 35.6 47.3 63.2 68.8
Males
18-29 47.0 1.8 22.3 24.7 32.3 41.0 56.2 74.4 85.7
30-39 41.7 2.1 17.2 20.2 27.4 39.0 50.2 73.9 80.5
40-49 38.7 1.4 17.8 22.8 26.8 35.7 48.0 61.4 65.2
50-59 35.1 2.2 16.6 19.0 24.1 29.8 41.2 55.5 61.3
60-69 33.2 2.6 11.1 14.1 22.4 33.6 36.4 56.4 71.8
Females
18-29 34.6 1.3 15.3 18.0 24.5 32.6 43.0 51.3 57.6
30-39 33.8 1.2 15.7 19.0 24.6 32.3 41.5 54.3 58.0
40-49 29.2 1.1 12.7 16.1 20.8 27.2 33.8 44.7 48.7
50-59 27.9 1.6 10.1 13.7 17.1 26.6 35.2 44.8 48.2
60-69 28.4 1.7 12.2 14.9 20.4 26.8 36.3 41.6 46.6
All Age Groups
18-29 40.5 1.1 17.4 21.5 27.6 37.5 49.3 64.6 75.1
30-39 37.6 1.3 16.7 19.7 25.6 34.6 44.9 59.3 73.7
40-49 33.7 1.0 15.5 18.4 23.4 30.4 41.2 53.2 63.5
50-59 31.7 1.5 13.5 14.7 21.5 28.5 39.1 51.3 58.9
60-69 31.0 1.7 12.2 14.8 20.5 29.3 36.6 47.0 57.9
Total
Males 39.4 0.9 16.5 20.4 26.3 36.0 49.7 63.6 75.2
Females 31.0 0.6 13.3 16.1 21.5 29.2 38.7 47.3 56.4
ALL 35.2 0.6 14.5 17.7 24.1 32.3 43.0 56.6 66.2
SE - standard error of mean
Mean(g)
SE Percentile

54
NATIONALNUTRITIONSURVEY2010
ANNEX II
Table 3.4.2: Distribution (%) of percentage of RDA met for saturated fat among adult Singapore residents, by gender, ethnic and age (years) groups
< 50% < 70% < 100% ≥ 100% ≥ 120% ≥ 150% ≥ 200%
Males
Chinese 2.0 9.0 34.7 65.3 53.3 30.0 13.1
Malay 1.5 8.5 24.5 75.5 58.5 37.8 21.8
Indian 4.3 9.5 22.0 78.0 63.8 44.1 19.6
Females
Chinese 2.8 9.5 29.5 70.5 53.3 34.4 11.5
Malay 1.6 8.8 19.4 80.6 67.2 38.5 20.2
Indian 4.7 11.3 26.4 73.6 59.3 40.1 15.7
All Ethnic Groups
Chinese 2.4 9.2 32.1 67.9 53.3 32.2 12.3
Malay 1.6 8.6 21.9 78.1 63.0 38.2 21.0
Indian 4.5 10.3 24.0 76.0 61.8 42.3 17.8
Males
18-29 0.6 1.7 19.4 80.6 68.6 43.4 23.8
30-39 2.1 9.5 26.5 73.5 58.4 38.3 16.9
40-49 2.2 6.3 31.6 68.4 52.0 32.2 11.1
50-59 1.8 12.1 48.8 51.2 43.8 24.4 9.8
60-69 5.4 18.0 28.4 71.6 56.0 24.2 14.6
Females
18-29 3.3 5.3 19.5 80.5 62.6 48.0 19.4
30-39 0.8 4.8 19.0 81.0 66.0 42.7 15.0
40-49 2.9 7.4 32.9 67.1 48.6 24.8 10.4
50-59 5.5 22.2 38.6 61.4 48.8 27.3 8.5
60-69 0.2 7.1 27.9 72.1 53.5 36.8 13.0
All Age Groups
18-29 2.0 3.6 19.5 80.5 65.5 45.8 21.5
30-39 1.4 7.1 22.7 77.3 62.3 40.5 15.9
40-49 2.6 6.9 32.3 67.7 50.2 28.3 10.7
50-59 3.5 16.8 44.0 56.0 46.1 25.7 9.2
60-69 3.1 13.1 28.2 71.8 54.9 29.9 13.9
Total
Males 2.2 9.0 31.8 68.2 55.3 32.8 15.0
Females 2.8 9.5 27.7 72.3 55.9 35.5 13.2
ALL 2.5 9.3 29.8 70.2 55.6 34.2 14.1

55
NATIONALNUTRITIONSURVEY2010NATIONALNUTRITIONSURVEY2010
ANNEX IIANNEX II
Table 3.4.3: Comparison of mean (CI) saturated fat intake (g) among adult Singapore residents, by gender and ethnic groups
1998 2004 2010
Crude Age-Std(95% CI)
Crude Age-Std(95% CI)
Age-Std(95% CI)
Gender
Males 28.7 27.9(27.0, 28.9)
34.8 34.4(33.0, 35.8)
39.4(37.5, 41.2)
11.5
Females 21.9 21.4(20.7, 22.0)
26.9 26.5(25.3, 27.7)
31.0(29.7, 32.3)
9.6
Ethnic Group
Chinese 24.2 23.6(22.9, 24.3)
29.6 29.4(28.3, 30.4)
34.2(32.7, 35.7)
10.6
Malay 29.6 28.9(27.3, 30.4)
36.3 35.4(33.0, 37.8)
38.3(36.2, 40.5)
9.4
Indian 29.2 28.7(27.1, 30.4)
34.1 33.1(31.0, 35.2)
37.9(35.8, 40.1)
9.2
Overall 25.3 24.6(24.0, 25.2)
30.8 30.4(29.5, 31.4)
35.2(34.0, 36.4)
10.6
Age-Std: Age standardised
CI: Confidence Interval
Table 3.4.4: Comparison of proportion (%) of adult Singapore residents consuming excessive saturated fat (saturated fat contributing ≥ 10% of recommended energy requirements), by gender
1998 2004 2010
Std (95% CI) Std (95% CI) Std (95% CI)
Gender
Males 40.4(37.2, 43.7)
58.2(54.0, 62.4)
68.2(62.9, 73.5)
27.8
Females 38.8(35.7, 41.8)
55.2(50.9, 59.5)
72.3(67.4, 77.1)
33.5
Overall 39.6(37.4, 41.8)
56.7(53.7, 59.7)
70.2(66.7, 73.8)
30.6
Std: Age standardised and calculated based on updated RDA formulae
CI: Confidence Interval
MeanDifference(g)[‘10- ‘98]
Difference(Age-Stdproportion)[‘10- ‘98]

56
NATIONALNUTRITIONSURVEY2010
ANNEX II
Table 3.4.5: Major sources of saturated fat in the diet of adult Singapore residents by year, 1998, 2004 and 2010
1998(%)
2004(%)
2010(%)
Rice, noodles, meat dishes and desserts containing coconut milk/cream 13.9 17.5 16.3
Biscuits, pastries, cakes, nuts, titbits, snacks, local snacks** 13.3 11.9 14.4
Stir fried vegetables* 8.7 10.0 9.0
Fried noodles 8.6 9.7 6.1
Coffee, tea and malt beverages containing milk*** 9.7 7.4 5.6
* Plain or with meat/seafood/oyster sauce or sambal
** Crackers, puff pastries, nuts, salty snacks, chocolates, etc
*** Includes full-cream, low fat, skim milk and milk powder, condensed/ evaporated milk, creamer/ whitener
Food Items
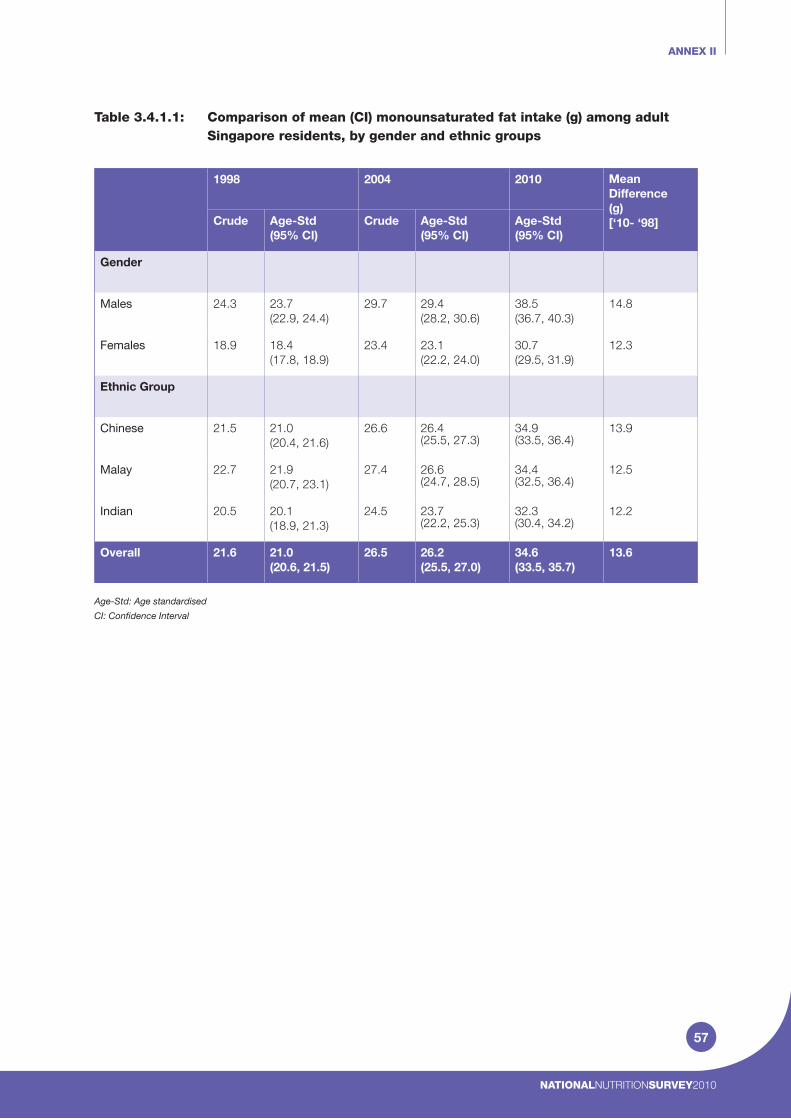
57
NATIONALNUTRITIONSURVEY2010NATIONALNUTRITIONSURVEY2010
ANNEX II ANNEX II
Table 3.4.1.1: Comparison of mean (CI) monounsaturated fat intake (g) among adult Singapore residents, by gender and ethnic groups
1998 2004 2010
Crude Age-Std(95% CI)
Crude Age-Std(95% CI)
Age-Std(95% CI)
Gender
Males 24.3 23.7(22.9, 24.4)
29.7 29.4(28.2, 30.6)
38.5(36.7, 40.3)
14.8
Females 18.9 18.4(17.8, 18.9)
23.4 23.1(22.2, 24.0)
30.7(29.5, 31.9)
12.3
Ethnic Group
Chinese 21.5 21.0(20.4, 21.6)
26.6 26.4(25.5, 27.3)
34.9(33.5, 36.4)
13.9
Malay 22.7 21.9(20.7, 23.1)
27.4 26.6(24.7, 28.5)
34.4(32.5, 36.4)
12.5
Indian 20.5 20.1(18.9, 21.3)
24.5 23.7(22.2, 25.3)
32.3(30.4, 34.2)
12.2
Overall 21.6 21.0(20.6, 21.5)
26.5 26.2(25.5, 27.0)
34.6(33.5, 35.7)
13.6
Age-Std: Age standardised
CI: Confidence Interval
MeanDifference(g)[‘10- ‘98]
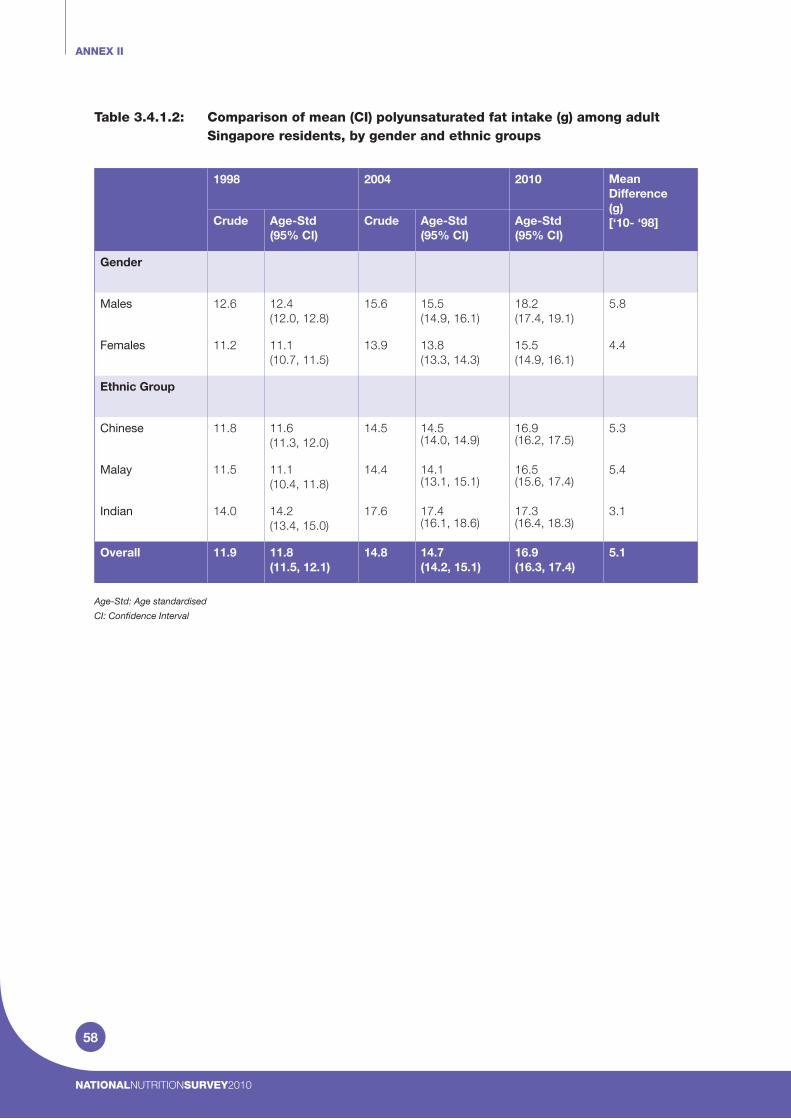
58
NATIONALNUTRITIONSURVEY2010
ANNEX II
Table 3.4.1.2: Comparison of mean (CI) polyunsaturated fat intake (g) among adult Singapore residents, by gender and ethnic groups
1998 2004 2010
Crude Age-Std(95% CI)
Crude Age-Std(95% CI)
Age-Std(95% CI)
Gender
Males 12.6 12.4(12.0, 12.8)
15.6 15.5(14.9, 16.1)
18.2(17.4, 19.1)
5.8
Females 11.2 11.1(10.7, 11.5)
13.9 13.8(13.3, 14.3)
15.5(14.9, 16.1)
4.4
Ethnic Group
Chinese 11.8 11.6(11.3, 12.0)
14.5 14.5(14.0, 14.9)
16.9(16.2, 17.5)
5.3
Malay 11.5 11.1(10.4, 11.8)
14.4 14.1(13.1, 15.1)
16.5(15.6, 17.4)
5.4
Indian 14.0 14.2(13.4, 15.0)
17.6 17.4(16.1, 18.6)
17.3(16.4, 18.3)
3.1
Overall 11.9 11.8(11.5, 12.1)
14.8 14.7(14.2, 15.1)
16.9(16.3, 17.4)
5.1
Age-Std: Age standardised
CI: Confidence Interval
MeanDifference(g)[‘10- ‘98]

59
NATIONALNUTRITIONSURVEY2010NATIONALNUTRITIONSURVEY2010
ANNEX II ANNEX II
Mean Fat Intake (g) PUFA/ SFA MUFA/ SFA SFA/ SFA
Males
Chinese 101.9 0.49 1.03 1.00
Malay 107.2 0.44 0.90 1.00
Indian 104.9 0.46 0.85 1.00
Females
Chinese 83.1 0.54 1.04 1.00
Malay 84.5 0.45 0.91 1.00
Indian 79.3 0.50 0.88 1.00
All Ethnic Groups
Chinese 92.5 0.52 1.04 1.00
Malay 95.4 0.44 0.91 1.00
Indian 93.3 0.48 0.86 1.00
Males
18-29 122.4 0.47 1.00 1.00
30-39 108.1 0.47 0.97 1.00
40-49 102.3 0.49 1.00 1.00
50-59 91.3 0.47 0.99 1.00
60-69 87.4 0.50 1.01 1.00
Females
18-29 90.1 0.48 0.99 1.00
30-39 90.4 0.52 1.00 1.00
40-49 79.3 0.56 1.01 1.00
50-59 76.9 0.56 1.05 1.00
60-69 74.6 0.49 0.96 1.00
All Age Groups
18-29 105.6 0.47 1.00 1.00
30-39 99.1 0.50 0.99 1.00
40-49 90.1 0.53 1.00 1.00
50-59 84.5 0.52 1.02 1.00
60-69 81.6 0.50 0.98 1.00
Total
Males 103.0 0.48 1.00 1.00
Females 83.0 0.53 1.00 1.00
ALL 93.0 0.50 1.00 1.00
Table 3.4.1.3: Ratio of fatty acids relative to saturated fatty acid intake among adult Singapore residents, by gender, ethnic and age (years) groups

60
NATIONALNUTRITIONSURVEY2010
ANNEX II
PUFA MUFA SFA PUFA MUFA SFA
Males
Chinese 18.0 (0.5) 38.8 (1.2) 38.1 (1.2) 5.5 (0.09) 11.7 (0.15) 11.5 (0.17)
Malay 18.4 (0.8) 38.8 (1.6) 43.2 (1.8) 5.5 (0.08) 11.4 (0.14) 12.8 (0.16)
Indian 19.2 (0.8) 36.4 (1.6) 42.9 (1.7) 5.7 (0.15) 10.7 (0.28) 12.6 (0.28)
Females
Chinese 15.7 (0.4) 31.1 (0.8) 30.3 (0.8) 6.1 (0.09) 11.9 (0.13) 11.5 (0.15)
Malay 14.7 (0.5) 30.4 (1.0) 33.8 (1.1) 5.5 (0.09) 11.4 (0.13) 12.7 (0.16)
Indian 15.1 (0.4) 27.4 (0.9) 31.9 (1.1) 6.1 (0.09) 10.9 (0.16) 12.6 (0.22)
All Ethnic Groups
Chinese 16.9 (0.3) 34.9 (0.7) 34.2 (0.7) 5.8 (0.07) 11.8 (0.10) 11.5 (0.11)
Malay 16.5 (0.5) 34.4 (1.0) 38.3 (1.1) 5.5 (0.06) 11.4 (0.10) 12.7 (0.11)
Indian 17.3 (0.5) 32.3 (1.0) 37.9 (1.1) 5.9 (0.09) 10.8 (0.17) 12.6 (0.18)
Males
18-29 21.4 (0.8) 45.9 (1.6) 47.0 (1.8) 5.8 (0.08) 12.4 (0.15) 12.6 (0.20)
30-39 19.2 (1.0) 40.3 (2.2) 41.7 (2.1) 5.7 (0.11) 11.9 (0.26) 12.3 (0.21)
40-49 18.5 (0.6) 38.4 (1.5) 38.7 (1.4) 5.7 (0.11) 11.6 (0.21) 11.8 (0.21)
50-59 16.0 (0.8) 34.1 (1.9) 35.1 (2.2) 5.2 (0.12) 10.9 (0.27) 11.3 (0.41)
60-69 15.5 (1.5) 32.5 (2.8) 33.2 (2.6) 5.2 (0.28) 10.8 (0.38) 11.0 (0.36)
Females
18-29 15.7 (0.5) 33.7 (1.2) 34.6 (1.3) 5.8 (0.12) 12.3 (0.13) 12.6 (0.23)
30-39 16.9 (0.6) 33.4 (1.3) 33.8 (1.2) 6.1 (0.10) 12.0 (0.21) 12.1 (0.18)
40-49 15.5 (0.6) 29.0 (1.0) 29.2 (1.1) 6.3 (0.17) 11.6 (0.16) 11.7 (0.19)
50-59 14.9 (0.7) 28.6 (1.4) 27.9 (1.6) 6.0 (0.16) 11.4 (0.23) 11.0 (0.31)
60-69 13.6 (1.0) 27.2 (1.8) 28.4 (1.7) 5.4 (0.27) 10.8 (0.39) 11.3 (0.32)
All Age Groups
18-29 18.4 (0.5) 39.6 (1.1) 40.5 (1.1) 5.8 (0.07) 12.3 (0.10) 12.6 (0.15)
30-39 18.0 (0.6) 36.8 (1.3) 37.6 (1.3) 5.9 (0.08) 12.0 (0.17) 12.2 (0.14)
40-49 16.9 (0.4) 33.4 (1.0) 33.7 (1.0) 6.0 (0.11) 11.6 (0.13) 11.7 (0.14)
50-59 15.5 (0.5) 31.5 (1.3) 31.7 (1.5) 5.6 (0.11) 11.1 (0.18) 11.1 (0.26)
60-69 14.7 (0.9) 30.1 (1.8) 31.0 (1.7) 5.3 (0.20) 10.8 (0.27) 11.1 (0.24)
Total
Males 18.2 (0.4) 38.5 (0.9) 39.4 (0.9) 5.5 (0.07) 11.6 (0.12) 11.8 (0.13)
Females 15.5 (0.3) 30.7 (0.6) 31.0 (0.6) 6.0 (0.07) 11.7 (0.10) 11.8 (0.12)
ALL 16.9 (0.3) 34.6 (0.6) 35.2 (0.6) 5.8 (0.05) 11.6 (0.08) 11.8 (0.09)
SE - standard error of mean
Table 3.4.1.4: Mean (SE) fatty acid intake and mean (SE) percent contribution to total energy intake among adult Singapore residents, by gender, ethnic and age (years) groups
Mean Intake (g) (SE) Energy Contribution (%) (SE)

61
NATIONALNUTRITIONSURVEY2010NATIONALNUTRITIONSURVEY2010
ANNEX II ANNEX II
Table 3.5.1: Mean (SE) and percentile distribution of daily carbohydrate intake (weight in grams) among adult Singapore residents, by gender, ethnic and age (years) groups
5th 10th 25th 50th 75th 90th 95th
Males
Chinese 369.1 6.5 214.6 248.0 293.5 361.2 426.7 517.1 558.6
Malay 397.1 15.2 204.2 240.5 287.4 372.4 474.6 586.5 663.7
Indian 400.3 11.5 212.0 236.4 298.8 388.5 472.8 552.4 643.7
Females
Chinese 294.6 5.2 168.6 187.9 233.2 286.2 342.6 406.5 458.3
Malay 314.2 8.8 146.1 181.2 235.9 294.5 385.6 471.2 529.2
Indian 301.2 6.8 164.2 193.0 231.5 286.5 358.8 427.8 483.2
All Ethnic Groups
Chinese 331.7 4.7 183.5 207.1 261.7 321.9 384.8 467.2 522.0
Malay 353.8 9.1 171.4 204.6 261.9 328.5 418.3 536.2 596.9
Indian 355.6 7.8 191.0 211.9 261.1 334.9 434.7 516.3 578.9
Males
18-29 414.6 12.8 228.6 267.6 325.0 379.3 487.1 577.9 653.2
30-39 380.8 13.6 181.9 214.9 287.7 361.2 472.3 532.0 574.6
40-49 371.5 8.5 224.7 244.9 296.0 358.9 442.1 500.4 539.1
50-59 361.0 11.3 234.8 261.7 283.0 358.5 420.2 468.8 552.9
60-69 348.5 16.1 189.4 214.5 288.1 347.6 387.7 458.4 481.4
Females
18-29 307.2 8.9 156.7 184.6 235.5 295.5 370.7 428.3 465.6
30-39 311.6 7.9 174.2 199.7 260.7 296.6 356.3 427.6 480.2
40-49 287.0 8.7 156.9 186.8 219.7 272.0 330.3 394.8 461.6
50-59 289.1 9.9 155.0 188.9 231.3 264.4 335.3 394.2 447.8
60-69 297.3 10.9 171.2 181.9 218.8 290.2 347.4 394.6 436.3
All Age Groups
18-29 358.9 8.5 183.7 212.2 268.4 339.7 418.2 525.0 580.0
30-39 345.6 8.3 180.1 213.1 270.3 322.3 422.4 512.9 534.6
40-49 326.6 7.0 181.4 195.9 247.2 314.7 380.6 471.5 528.7
50-59 327.1 9.1 180.4 210.7 254.8 322.4 379.6 435.7 547.3
60-69 325.5 11.3 180.1 201.3 270.9 315.4 384.7 433.8 464.2
Total
Males 376.6 5.4 213.5 246.8 293.8 363.2 441.4 523.2 575.0
Females 298.2 4.2 165.2 188.2 233.3 287.1 346.6 416.9 466.1
ALL 337.4 3.9 183.0 207.2 261.9 323.6 395.7 481.4 543.2
SE - standard error of mean
Mean(g)
SE Percentile
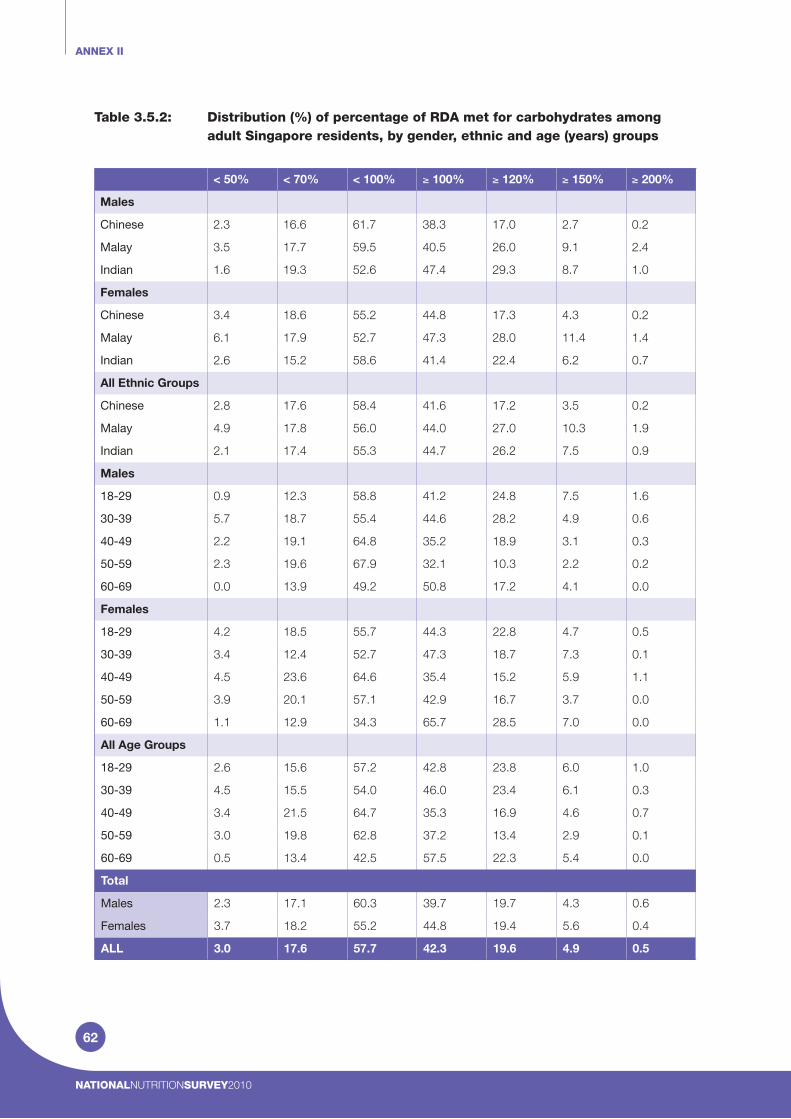
62
NATIONALNUTRITIONSURVEY2010
ANNEX II
Table 3.5.2: Distribution (%) of percentage of RDA met for carbohydrates among adult Singapore residents, by gender, ethnic and age (years) groups
< 50% < 70% < 100% ≥ 100% ≥ 120% ≥ 150% ≥ 200%
Males
Chinese 2.3 16.6 61.7 38.3 17.0 2.7 0.2
Malay 3.5 17.7 59.5 40.5 26.0 9.1 2.4
Indian 1.6 19.3 52.6 47.4 29.3 8.7 1.0
Females
Chinese 3.4 18.6 55.2 44.8 17.3 4.3 0.2
Malay 6.1 17.9 52.7 47.3 28.0 11.4 1.4
Indian 2.6 15.2 58.6 41.4 22.4 6.2 0.7
All Ethnic Groups
Chinese 2.8 17.6 58.4 41.6 17.2 3.5 0.2
Malay 4.9 17.8 56.0 44.0 27.0 10.3 1.9
Indian 2.1 17.4 55.3 44.7 26.2 7.5 0.9
Males
18-29 0.9 12.3 58.8 41.2 24.8 7.5 1.6
30-39 5.7 18.7 55.4 44.6 28.2 4.9 0.6
40-49 2.2 19.1 64.8 35.2 18.9 3.1 0.3
50-59 2.3 19.6 67.9 32.1 10.3 2.2 0.2
60-69 0.0 13.9 49.2 50.8 17.2 4.1 0.0
Females
18-29 4.2 18.5 55.7 44.3 22.8 4.7 0.5
30-39 3.4 12.4 52.7 47.3 18.7 7.3 0.1
40-49 4.5 23.6 64.6 35.4 15.2 5.9 1.1
50-59 3.9 20.1 57.1 42.9 16.7 3.7 0.0
60-69 1.1 12.9 34.3 65.7 28.5 7.0 0.0
All Age Groups
18-29 2.6 15.6 57.2 42.8 23.8 6.0 1.0
30-39 4.5 15.5 54.0 46.0 23.4 6.1 0.3
40-49 3.4 21.5 64.7 35.3 16.9 4.6 0.7
50-59 3.0 19.8 62.8 37.2 13.4 2.9 0.1
60-69 0.5 13.4 42.5 57.5 22.3 5.4 0.0
Total
Males 2.3 17.1 60.3 39.7 19.7 4.3 0.6
Females 3.7 18.2 55.2 44.8 19.4 5.6 0.4
ALL 3.0 17.6 57.7 42.3 19.6 4.9 0.5

63
NATIONALNUTRITIONSURVEY2010NATIONALNUTRITIONSURVEY2010
ANNEX II ANNEX II
Table 3.5.3: Comparison of mean (CI) carbohydrate intake (g) among adult Singapore residents, by gender and ethnic groups
1998 2004 2010
Crude Age-Std(95% CI)
Crude Age-Std(95% CI)
Age-Std(95% CI)
Gender
Males 347.6 344.7(337.5, 352.0)
378.5 376.0(364.8, 387.1)
376.6(365.9, 387.3)
31.9
Females 270.2 268.5(263.2, 273.7)
295.6 293.5(285.2, 301.8)
298.2(290.0, 306.5)
29.7
Ethnic Group
Chinese 304.9 302.8(297.1, 308.4)
331.9 330.8(322.1, 339.4)
331.7(322.4, 340.9)
28.9
Malay 320.3 317.2(306.1, 328.2)
356.4 349.3(331.3, 367.3)
353.8(335.9, 371.7)
36.6
Indian 334.4 331.0(319.4, 342.7)
352.9 346.7(330.5, 362.9)
355.6(340.3, 370.9)
24.6
Overall 309.0 306.7(301.9, 311.5)
336.7 334.4(327.0, 341.8)
337.4(329.8, 345.0)
30.7
Age-Std: Age standardised
CI: Confidence Interval
Table 3.5.4: Comparison of proportion (%) of adult Singapore residents consuming excessive carbohydrates (carbohydrates contributing ≥ 60% of recommended energy requirement), by gender
1998 2004 2010
Std (95% CI) Std (95% CI) Std (95% CI)
Gender
Males 34.1(30.9, 37.2)
40.1(36.0, 44.2)
39.7(33.8, 45.6)
5.6
Females 31.4(28.5, 34.3)
41.0(36.9, 45.2)
44.8(39.8, 49.8)
13.4
Overall 32.7(30.6, 34.9)
40.6(37.7, 43.5)
42.3(38.4, 46.1)
9.9
Std: Age standardised and calculated based on updated RDA formulae
CI: Confidence Interval
MeanDifference(g)[‘10- ‘98]
Difference(Age-Stdproportion)[‘10- ‘98]

64
NATIONALNUTRITIONSURVEY2010
ANNEX II
Table 3.6.1: Mean (SE) and percentile distribution of daily cholesterol intake (weight in milligrams) among adult Singapore residents, by gender, ethnic and age (years) groups
5th 10th 25th 50th 75th 90th 95th
Males
Chinese 396 13.0 162 189 265 361 483 622 739
Malay 377 18.8 123 162 231 323 485 684 818
Indian 299 14.0 78 98 177 273 377 509 629
Females
Chinese 313 10.9 88 130 213 308 395 497 567
Malay 296 18.2 114 130 189 250 380 495 562
Indian 204 9.6 54 77 125 173 255 388 424
All Ethnic Groups
Chinese 354 8.7 125 161 231 332 435 566 661
Malay 335 13.4 118 141 201 276 407 580 705
Indian 256 9.1 70 87 143 219 349 453 534
Males
18-29 456 17.5 192 230 328 432 524 705 869
30-39 403 26.2 136 161 249 373 482 657 910
40-49 373 16.4 126 166 236 323 511 619 719
50-59 338 21.3 158 183 204 318 436 555 631
60-69 330 27.9 106 136 204 326 377 481 674
Females
18-29 341 16.6 126 167 239 322 396 564 608
30-39 331 17.7 98 143 219 302 423 500 618
40-49 282 15.5 89 143 188 249 342 483 554
50-59 264 22.1 40 79 142 247 369 417 452
60-69 270 21.5 88 118 133 282 347 461 512
All Age Groups
18-29 396 12.9 158 194 268 349 488 609 753
30-39 366 16.1 113 151 229 334 439 598 725
40-49 325 11.4 114 159 204 288 403 560 626
50-59 303 16.4 79 126 195 297 401 459 590
60-69 303 18.8 108 125 167 308 363 483 527
Total
Males 382 10.1 138 178 243 344 474 621 731
Females 300 8.7 83 125 192 285 383 488 566
ALL 341 6.9 111 142 216 323 423 562 661
SE - standard error of mean
Mean(mg)
SE Percentile

65
NATIONALNUTRITIONSURVEY2010NATIONALNUTRITIONSURVEY2010
ANNEX II ANNEX II
Table 3.6.2: Distribution (%) of percentage of RDA met for cholesterol among adult Singapore residents, by gender, ethnic and age (years) groups
< 50% < 70% < 100% ≥ 100% ≥ 120% ≥ 150% ≥ 200%
Males
Chinese 4.2 15.1 31.5 68.5 50.4 28.9 11.1
Malay 7.8 19.5 46.1 53.9 40.3 28.7 14.6
Indian 19.0 36.4 54.0 46.0 33.7 15.5 6.0
Females
Chinese 14.3 24.6 48.4 51.6 32.7 13.4 3.6
Malay 14.5 35.7 63.6 36.4 26.9 12.3 3.4
Indian 36.3 64.0 81.9 18.1 11.7 3.8 0.8
All Ethnic Groups
Chinese 9.3 19.9 40.0 60.0 41.5 21.1 7.3
Malay 11.3 28.0 55.2 44.8 33.3 20.1 8.7
Indian 26.8 48.8 66.6 33.4 23.8 10.2 3.6
Males
18-29 0.6 6.4 19.9 80.1 65.7 41.7 15.5
30-39 7.8 17.3 33.6 66.4 52.9 30.7 14.3
40-49 7.2 16.3 44.6 55.4 43.2 29.7 11.4
50-59 4.5 26.0 42.5 57.5 38.9 15.9 6.1
60-69 15.3 26.8 39.8 60.2 30.5 16.5 6.6
Females
18-29 8.3 16.1 42.8 57.2 31.5 14.6 6.2
30-39 11.4 23.0 49.7 50.3 38.4 16.1 5.7
40-49 11.4 34.4 63.2 36.8 23.1 12.2 1.6
50-59 29.5 40.7 59.3 40.7 30.4 6.4 1.7
60-69 28.6 41.8 54.0 46.0 23.6 11.9 0.0
All Age Groups
18-29 4.6 11.4 31.8 68.2 47.9 27.7 10.7
30-39 9.6 20.2 41.8 58.2 45.6 23.3 10.0
40-49 9.5 25.9 54.5 45.5 32.5 20.4 6.2
50-59 16.3 32.9 50.4 49.6 34.9 11.4 4.0
60-69 21.3 33.6 46.2 53.8 27.4 14.4 3.7
Total
Males 6.4 18.2 36.2 63.8 47.0 27.2 10.9
Females 16.5 30.1 54.0 46.0 29.8 12.3 3.3
ALL 11.5 24.2 45.1 54.9 38.4 19.8 7.1

66
NATIONALNUTRITIONSURVEY2010
ANNEX II
Table 3.6.3: Comparison of mean (CI) cholesterol intake (mg) among adult Singapore residents, by gender and ethnic groups
1998 2004 2010
Crude Age-Std(95% CI)
Crude Age-Std(95% CI)
Age-Std(95% CI)
Gender
Males 291 283(273, 294)
324 320(306, 334)
382(362, 402)
99
Females 220 214(207, 221)
246 243(232, 254)
300(283, 317)
86
Ethnic Group
Chinese 255 249(241, 256)
286 284(273, 295)
354(337, 372)
105
Malay 275 265(248, 283)
312 302(279, 325)
335(309, 361)
70
Indian 224 220(205, 235)
226 219(201, 237)
256(238, 274)
36
Overall 255 249(242, 255)
285 281(272, 290)
341(327, 354)
92
Age-Std: Age standardised
CI: Confidence Interval
Table 3.6.4: Comparison of proportion (%) of adult Singapore residents consuming excessive cholesterol (≥ 300mg), by gender
1998 2004 2010
Std (95% CI) Std (95% CI) Std (95% CI)
Gender
Males 37.6(34.4, 40.8)
47.8(43.6, 51.9)
63.8(58.5, 69.2)
26.2
Females 20.3(17.8, 22.8)
26.2(22.6, 29.9)
46.0(41.0, 51.1)
25.7
Overall 29.0(26.9, 31.1)
36.9(34.1, 39.7)
54.9(51.2, 58.7)
25.9
Std: Age standardised and calculated based on updated RDA formulae
CI: Confidence Interval
MeanDifference(mg)[‘10- ‘98]
Difference(age-stdproportion)[‘10- ‘98]

67
NATIONALNUTRITIONSURVEY2010NATIONALNUTRITIONSURVEY2010
ANNEX II ANNEX II
Table 3.7.1: Mean (SE) and percentile distribution of daily dietary fibre intake (weight in grams) among adult Singapore residents, by gender, ethnic and age (years) groups
5th 10th 25th 50th 75th 90th 95th
Males
Chinese 23.9 0.5 13.1 14.4 17.5 22.2 28.9 34.5 40.5
Malay 24.8 0.9 10.2 13.0 17.0 22.4 30.6 38.5 43.9
Indian 30.5 1.0 14.2 16.2 22.2 29.5 37.7 43.1 50.7
Females
Chinese 22.6 0.6 10.5 13.1 16.6 21.5 27.5 31.7 37.3
Malay 21.1 0.7 8.7 11.6 15.1 19.9 25.6 32.9 38.1
Indian 24.7 0.8 11.6 12.6 17.1 23.9 30.4 37.8 42.2
All Ethnic Groups
Chinese 23.3 0.4 12.1 13.6 17.0 22.0 27.7 33.5 39.1
Malay 22.9 0.6 9.6 12.2 15.7 20.9 27.5 36.1 40.1
Indian 27.9 0.7 11.9 14.3 19.1 27.2 34.7 41.5 46.2
Males
18-29 26.6 0.9 13.2 14.4 19.1 25.2 31.1 40.4 49.0
30-39 25.4 1.1 10.8 14.4 17.5 23.9 32.2 38.8 42.7
40-49 24.6 0.7 13.0 13.5 18.2 23.6 29.5 34.9 39.5
50-59 23.8 1.0 13.0 13.6 17.4 22.6 29.9 34.3 38.0
60-69 23.3 1.2 12.3 15.2 18.1 21.8 27.0 34.6 42.7
Females
18-29 21.2 1.0 8.8 12.5 14.7 20.8 25.9 30.5 32.3
30-39 23.8 1.0 12.7 14.0 16.4 21.8 28.2 37.1 42.8
40-49 21.9 0.7 9.3 12.9 16.4 20.9 25.9 31.4 37.0
50-59 24.2 1.0 9.1 13.5 18.9 23.7 30.1 35.6 39.2
60-69 21.8 1.2 10.4 11.9 15.0 22.7 27.2 29.8 35.0
All Age Groups
18-29 23.8 0.7 11.7 13.3 16.2 22.5 29.0 35.8 44.8
30-39 24.6 0.7 12.7 14.3 17.0 22.6 29.6 38.6 42.8
40-49 23.2 0.5 11.7 13.2 17.1 22.2 27.6 34.1 38.9
50-59 24.0 0.7 11.6 13.6 17.9 23.3 30.1 35.1 39.8
60-69 22.6 0.9 11.7 13.3 16.0 21.9 27.2 33.1 38.2
Total
Males 24.8 0.4 13.0 14.3 18.0 22.8 30.0 37.9 42.3
Females 22.6 0.4 10.3 12.9 16.2 21.5 27.5 33.1 39.0
ALL 23.7 0.3 11.8 13.5 17.0 22.3 28.6 35.8 41.1
SE - standard error of mean
Mean(g)
SE Percentile

68
NATIONALNUTRITIONSURVEY2010
ANNEX II
Table 3.7.2: Distribution (%) of percentage of RDA met for dietary fibre among adult Singapore residents, by gender, ethnic and age (years) groups
< 50% < 70% < 100% ≥ 100% ≥ 120% ≥ 150% ≥ 200%
Males
Chinese 4.1 27.0 64.1 35.9 17.4 5.2 0.5
Malay 9.8 32.7 62.8 37.2 25.4 9.3 2.0
Indian 3.6 14.0 36.7 63.3 45.2 16.6 4.5
Females
Chinese 4.5 15.1 42.1 57.9 37.1 12.8 4.3
Malay 7.1 20.9 54.8 45.2 28.6 13.1 2.6
Indian 3.8 15.4 38.2 61.8 47.9 24.2 5.7
All Ethnic Groups
Chinese 4.3 21.0 53.1 46.9 27.3 9.0 2.5
Malay 8.4 26.5 58.6 41.4 27.1 11.3 2.3
Indian 3.7 14.6 37.4 62.6 46.4 20.0 5.1
Males
18-29 5.8 23.6 58.6 41.4 24.6 10.0 0.6
30-39 6.1 28.7 56.5 43.5 25.8 6.9 1.4
40-49 5.5 25.2 58.5 41.5 20.8 5.6 1.2
50-59 4.0 32.7 62.4 37.6 14.9 4.6 0.4
60-69 1.7 16.2 70.8 29.2 25.6 10.2 3.4
Females
18-29 6.5 23.8 49.8 50.2 30.4 7.1 3.9
30-39 3.1 12.5 40.9 59.1 36.2 18.4 5.8
40-49 4.7 18.2 47.8 52.2 32.1 12.1 3.9
50-59 6.5 10.5 38.0 62.0 42.5 16.7 3.8
60-69 2.1 12.9 38.2 61.8 50.6 17.8 3.3
All Age Groups
18-29 6.2 23.7 54.0 46.0 27.6 8.5 2.3
30-39 4.5 20.5 48.5 51.5 31.1 12.7 3.6
40-49 5.1 21.5 52.8 47.2 26.8 9.1 2.6
50-59 5.2 22.2 50.9 49.1 27.9 10.3 2.0
60-69 1.9 14.7 56.2 43.8 36.8 13.6 3.4
Total
Males 4.8 26.2 60.7 39.3 21.8 7.1 1.2
Females 4.9 16.0 43.6 56.4 36.8 14.0 4.2
ALL 4.8 21.1 52.2 47.8 29.3 10.5 2.7

69
NATIONALNUTRITIONSURVEY2010NATIONALNUTRITIONSURVEY2010
ANNEX II ANNEX II
Table 3.7.3: Comparison of mean (CI) dietary fibre intake (g) among adult Singapore residents, by gender and ethnic groups
1998 2004 2010
Crude Age-Std(95% CI)
Crude Age-Std(95% CI)
Age-Std(95% CI)
Gender
Males 22.0 21.8(21.3, 22.4)
26.7 26.6(25.8, 27.4)
24.8(23.9, 25.7)
3.0
Females 18.6 18.5(18.1, 19.0)
23.1 23.0(22.3, 23.7)
22.6(21.7, 23.5)
4.1
Ethnic Group
Chinese 19.7 19.5(19.1, 19.9)
24.2 24.1(23.5, 24.7)
23.3(22.5, 24.0)
3.8
Malay 21.1 21.1(20.3, 21.9)
25.9 25.7(24.4, 27.0)
22.9(21.7, 24.0)
1.8
Indian 25.7 25.6(24.4, 26.7)
30.5 30.0(28.5, 31.6)
27.9(26.5, 29.2)
2.3
Overall 20.3 20.2(19.8, 20.5)
24.9 24.8(24.2, 25.3)
23.7(23.1, 24.3)
3.5
Age-Std: Age standardised
CI: Confidence Interval
Table 3.7.4: Comparison of proportion (%) of adult Singapore residents consuming insufficient dietary fibre (< 70% RDA), by gender
1998 2004 2010
Std (95% CI) Std (95% CI) Std (95% CI)
Gender
Males 33.0(29.7, 36.2)
19.8(16.4, 23.3)
26.2(21.6, 30.8)
-6.8
Females 26.9(24.0, 29.9)
11.0(8.3, 13.7)
16.0(12.7, 19.2)
-10.9
Overall 30.0(27.8, 32.1)
15.4(13.2, 17.6)
21.1(18.3, 23.9)
-8.9
Std: Age standardised and calculated based on updated RDA formulae
CI: Confidence Interval
MeanDifference(mg)[‘10- ‘98]
Difference(Age-Stdproportion)[‘10- ‘98]

70
NATIONALNUTRITIONSURVEY2010
ANNEX II
Table 3.8.1: Mean (SE) and percentile distribution of daily iron intake (weight in milligrams) among adult Singapore residents, by gender, ethnic and age (years) groups
5th 10th 25th 50th 75th 90th 95th
Males
Chinese 18.6 0.4 10.6 11.2 13.9 17.3 22.2 27.3 31.4
Malay 19.2 0.7 8.4 10.4 13.2 17.4 23.1 29.5 35.5
Indian 20.5 0.8 8.2 10.9 15.0 19.3 25.4 29.8 33.3
Females
Chinese 16.9 0.4 8.7 10.0 12.6 16.6 20.0 23.3 27.5
Malay 16.4 0.5 6.8 9.0 11.5 15.2 20.3 27.3 29.0
Indian 16.2 0.4 7.6 9.3 12.1 15.7 19.4 23.4 26.4
All Ethnic Groups
Chinese 17.8 0.3 9.8 10.8 13.2 17.0 20.5 25.9 29.7
Malay 17.8 0.5 7.6 9.6 12.3 16.2 21.5 28.3 31.0
Indian 18.5 0.5 8.2 9.8 13.4 17.5 22.5 28.7 29.9
Males
18-29 21.7 0.8 11.3 12.9 15.1 19.8 26.3 31.3 41.4
30-39 19.3 0.8 9.0 10.7 14.0 18.0 23.7 30.5 33.1
40-49 18.7 0.5 10.5 11.2 14.3 17.7 22.2 26.9 30.2
50-59 17.3 0.7 9.3 10.8 13.4 15.9 19.7 26.3 27.4
60-69 17.5 0.9 9.9 11.1 12.8 17.5 17.9 24.7 31.7
Females
18-29 16.6 0.5 8.1 10.0 12.6 16.8 20.0 22.8 27.4
30-39 18.4 0.9 9.2 11.2 13.9 16.6 20.4 27.9 31.3
40-49 15.9 0.5 8.0 9.7 11.8 14.5 19.2 22.3 26.6
50-59 16.8 0.6 7.0 9.9 12.6 17.3 19.8 23.8 25.3
60-69 15.9 0.8 6.8 9.0 11.5 16.2 19.3 23.3 24.4
All Age Groups
18-29 19.1 0.5 9.8 10.8 13.9 17.9 22.5 27.6 31.5
30-39 18.8 0.6 9.2 11.0 13.9 17.2 22.0 29.8 33.0
40-49 17.2 0.4 8.7 10.4 12.7 16.4 20.5 25.7 29.2
50-59 17.1 0.5 9.0 10.6 13.1 16.1 19.8 24.7 27.4
60-69 16.8 0.7 9.2 10.0 12.3 16.6 18.4 23.8 28.8
Total
Males 18.9 0.4 10.3 11.2 13.9 17.6 22.5 28.6 32.2
Females 16.8 0.3 8.1 9.9 12.3 16.4 20.0 23.7 27.6
ALL 17.8 0.2 9.3 10.6 13.2 17.0 20.8 26.6 30.2
SE - standard error of mean
Mean(mg)
SE Percentile

71
NATIONALNUTRITIONSURVEY2010NATIONALNUTRITIONSURVEY2010
ANNEX II ANNEX II
Table 3.8.2: Distribution (%) of percentage of RDA met for iron among adult Singapore residents, by gender, ethnic and age (years) groups
< 50% < 70% < 100% ≥ 100% ≥ 120% ≥ 150% ≥ 200%
Males
Chinese 0.0 0.0 0.2 99.8 99.6 98.5 85.9
Malay 0.0 0.0 0.5 99.5 97.8 93.8 83.0
Indian 0.0 0.0 0.0 100.0 99.2 93.0 86.4
Females
Chinese 5.4 24.5 61.5 38.5 21.1 15.1 9.5
Malay 10.0 34.5 66.8 33.2 22.1 13.8 5.4
Indian 8.8 27.9 64.7 35.3 18.7 9.1 4.4
All Ethnic Groups
Chinese 2.7 12.3 31.0 69.0 60.2 56.6 47.5
Malay 5.2 18.0 35.1 64.9 58.2 52.0 42.5
Indian 4.0 12.6 29.2 70.8 62.9 55.2 49.4
Males
18-29 0.0 0.0 0.0 100.0 100.0 99.0 93.1
30-39 0.0 0.0 0.0 100.0 99.5 95.1 84.2
40-49 0.0 0.0 0.2 99.8 98.5 97.7 85.1
50-59 0.0 0.0 0.9 99.1 98.9 95.8 82.7
60-69 0.0 0.0 0.0 100.0 100.0 99.6 81.9
Females
18-29 6.5 27.5 68.1 31.9 10.1 3.5 0.0
30-39 5.6 22.4 65.6 34.4 17.3 9.6 1.0
40-49 8.7 37.4 72.6 27.4 8.1 3.7 1.1
50-59 7.9 29.8 74.6 25.4 13.2 3.4 0.8
60-69 0.0 0.0 0.0 100.0 94.3 90.5 70.7
All Age Groups
18-29 3.4 14.2 35.3 64.7 53.4 49.5 44.8
30-39 2.8 11.4 33.4 66.6 57.8 51.6 41.9
40-49 4.6 19.9 38.6 61.4 50.5 47.8 40.5
50-59 3.7 14.1 35.6 64.4 58.5 52.2 44.1
60-69 0.0 0.0 0.0 100.0 97.4 95.5 76.9
Total
Males 0.0 0.0 0.3 99.7 99.3 97.2 85.5
Females 6.4 26.3 62.6 37.4 21.0 14.3 8.4
ALL 3.2 13.2 31.4 68.6 60.2 55.8 47.0

72
NATIONALNUTRITIONSURVEY2010
ANNEX II
Table 3.8.3: Comparison of mean (CI) iron intake (mg) among adult Singapore residents, by gender and ethnic groups
1998 2004 2010
Crude Age-Std(95% CI)
Crude Age-Std(95% CI)
Age-Std(95% CI)
Gender
Males 15.2 15.0(14.6, 15.4)
17.8 17.7(17.0, 18.3)
18.9(18.2, 19.6)
3.9
Females 12.7 12.5(12.3, 12.8)
15.1 15.0(14.5, 15.4)
16.8(16.2, 17.3)
4.3
Ethnic Group
Chinese 14.0 13.8(13.5, 14.1)
16.4 16.4(15.9, 16.9)
17.8(17.2, 18.3)
4.0
Malay 13.7 13.5(12.9, 14.0)
16.4 16.1(15.2, 17.0)
17.8(16.8, 18.7)
4.3
Indian 13.8 13.6(13.1, 14.2)
16.2 15.9(15.1, 16.8)
18.5(17.6, 19.5)
4.9
Overall 13.9 13.8(13.5, 14.0)
16.4 16.3(15.9, 16.7)
17.8(17.4, 18.3)
4.0
Age-Std: Age standardised
CI: Confidence Interval
Table 3.8.4: Comparison of proportion (%) of adult Singapore residents consuming insufficient iron (< 70% RDA), by gender
1998 2004 2010
Std (95% CI) Std (95% CI) Std (95% CI)
Gender
Males 0.0(0.0, 0.0)
0.3(0.0, 0.7)
0.0(0.0, 0.0)
0.0
Females 52.4(49.2, 55.6)
35.9(31.8, 39.9)
26.3(22.2, 30.4)
-26.1
Overall 26.1(24.2, 28.1)
18.2(15.9, 20.5)
13.2(11.0, 15.3)
-12.9
Std: Age standardised
CI: Confidence Interval
MeanDifference(mg)[‘10- ‘98]
Difference(Age-Stdproportion)[‘10- ‘98]
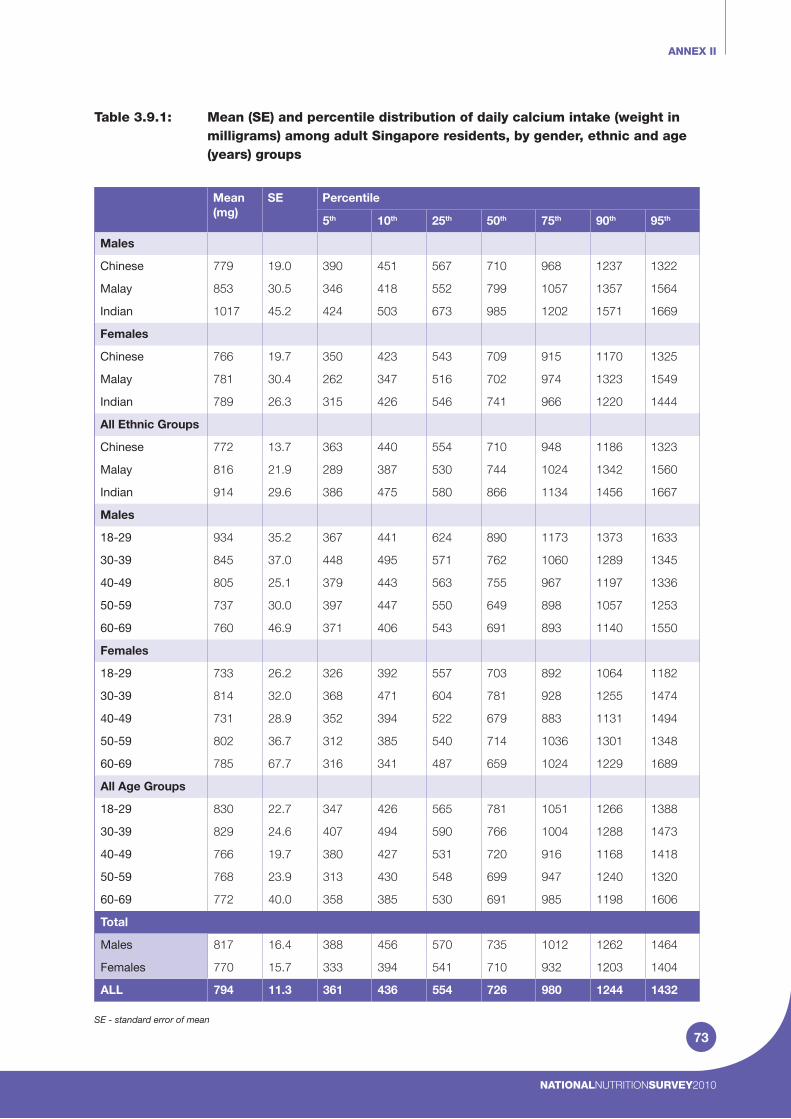
73
NATIONALNUTRITIONSURVEY2010NATIONALNUTRITIONSURVEY2010
ANNEX II ANNEX II
Table 3.9.1: Mean (SE) and percentile distribution of daily calcium intake (weight in milligrams) among adult Singapore residents, by gender, ethnic and age (years) groups
5th 10th 25th 50th 75th 90th 95th
Males
Chinese 779 19.0 390 451 567 710 968 1237 1322
Malay 853 30.5 346 418 552 799 1057 1357 1564
Indian 1017 45.2 424 503 673 985 1202 1571 1669
Females
Chinese 766 19.7 350 423 543 709 915 1170 1325
Malay 781 30.4 262 347 516 702 974 1323 1549
Indian 789 26.3 315 426 546 741 966 1220 1444
All Ethnic Groups
Chinese 772 13.7 363 440 554 710 948 1186 1323
Malay 816 21.9 289 387 530 744 1024 1342 1560
Indian 914 29.6 386 475 580 866 1134 1456 1667
Males
18-29 934 35.2 367 441 624 890 1173 1373 1633
30-39 845 37.0 448 495 571 762 1060 1289 1345
40-49 805 25.1 379 443 563 755 967 1197 1336
50-59 737 30.0 397 447 550 649 898 1057 1253
60-69 760 46.9 371 406 543 691 893 1140 1550
Females
18-29 733 26.2 326 392 557 703 892 1064 1182
30-39 814 32.0 368 471 604 781 928 1255 1474
40-49 731 28.9 352 394 522 679 883 1131 1494
50-59 802 36.7 312 385 540 714 1036 1301 1348
60-69 785 67.7 316 341 487 659 1024 1229 1689
All Age Groups
18-29 830 22.7 347 426 565 781 1051 1266 1388
30-39 829 24.6 407 494 590 766 1004 1288 1473
40-49 766 19.7 380 427 531 720 916 1168 1418
50-59 768 23.9 313 430 548 699 947 1240 1320
60-69 772 40.0 358 385 530 691 985 1198 1606
Total
Males 817 16.4 388 456 570 735 1012 1262 1464
Females 770 15.7 333 394 541 710 932 1203 1404
ALL 794 11.3 361 436 554 726 980 1244 1432
SE - standard error of mean
Mean(mg)
SE Percentile

74
NATIONALNUTRITIONSURVEY2010
ANNEX II
Table 3.9.2: Distribution (%) of percentage of RDA met for calcium among adult Singapore residents, by gender, ethnic and age (years) groups
< 50% < 70% < 100% ≥ 100% ≥ 120% ≥ 150% ≥ 200%
Males
Chinese 11.1 38.6 66.8 33.2 19.5 10.7 1.1
Malay 12.6 32.1 55.0 45.0 30.2 14.0 4.8
Indian 5.6 19.0 35.3 64.7 48.7 21.1 9.9
Females
Chinese 11.9 34.5 66.1 33.9 17.1 6.7 2.3
Malay 16.9 37.5 63.6 36.4 23.1 10.9 2.5
Indian 10.6 34.5 60.0 40.0 23.5 10.1 1.8
All Ethnic Groups
Chinese 11.5 36.5 66.5 33.5 18.3 8.7 1.7
Malay 14.8 34.9 59.5 40.5 26.5 12.4 3.6
Indian 7.9 26.0 46.4 53.6 37.3 16.1 6.2
Males
18-29 9.0 20.9 42.1 57.9 42.7 24.0 5.7
30-39 3.3 22.2 53.4 46.6 35.6 15.2 3.4
40-49 6.1 24.6 53.9 46.1 26.0 10.9 2.3
50-59 18.3 52.2 81.9 18.1 7.4 4.4 0.9
60-69 17.7 64.2 78.8 21.2 7.8 6.8 0.4
Females
18-29 10.3 27.7 66.8 33.2 21.7 3.7 0.2
30-39 6.1 19.7 50.0 50.0 21.9 11.2 3.0
40-49 10.4 38.1 68.8 31.2 17.0 8.2 4.3
50-59 15.7 45.0 71.5 28.5 16.5 7.9 2.5
60-69 27.9 52.0 69.9 30.1 14.2 7.6 0.5
All Age Groups
18-29 9.7 24.4 54.9 45.1 31.8 13.5 2.8
30-39 4.7 21.0 51.7 48.3 28.7 13.1 3.2
40-49 8.4 31.8 61.8 38.2 21.2 9.5 3.3
50-59 17.1 48.8 77.0 23.0 11.7 6.1 1.7
60-69 22.3 58.7 74.8 25.2 10.7 7.1 0.4
Total
Males 10.6 35.4 61.5 38.5 24.4 12.7 2.6
Females 12.5 35.0 65.1 34.9 18.7 7.7 2.3
ALL 11.6 35.2 63.3 36.7 21.5 10.0 2.5

75
NATIONALNUTRITIONSURVEY2010NATIONALNUTRITIONSURVEY2010
ANNEX II ANNEX II
Table 3.9.3: Comparison of mean (CI) calcium intake (mg) among adult Singapore residents, by gender and ethnic groups
1998 2004 2010
Crude Age-Std(95% CI)
Crude Age-Std(95% CI)
Age-Std(95% CI)
Gender
Males 529 526(509, 543)
657 653(629, 677)
817(785, 849)
291
Females 472 470(457, 484)
598 594(573, 615)
770(740, 801)
300
Ethnic Group
Chinese 479 476(463, 488)
601 598(579, 616)
772(745, 799)
296
Malay 575 577(550, 604)
728 724(682, 765)
816(773, 859)
239
Indian 605 602(571, 634)
731 715(675, 755)
914(856, 972)
312
Overall 501 498(487, 509)
627 623(607, 639)
794(772, 816)
296
Age-Std: Age standardised
CI: Confidence Interval
Table 3.9.4: Comparison of proportion (%) of adult Singapore residents consuming insufficient calcium (< 70% RDA), by gender
1998 2004 2010
Std (95% CI) Std (95% CI) Std (95% CI)
Gender
Males 69.1(66.1, 72.1)
48.9(44.8, 53.1)
35.4(29.4, 41.4)
-33.7
Females 77.3(74.8, 79.8)
58.9(54.8, 63.0)
35.0(29.9, 40.0)
-42.3
Overall 73.2(71.2, 75.1)
53.9(51.0, 56.9)
35.2(31.3, 39.1)
-38.0
Std: Age standardised
CI: Confidence Interval
MeanDifference(mg)[‘10- ‘98]
Difference(Age-Stdproportion)[‘10- ‘98]

76
NATIONALNUTRITIONSURVEY2010
ANNEX II
Table 3.10.1: Mean (SE) and percentile distribution of daily vitamin A intake (weight in micrograms) among adult Singapore residents, by gender, ethnic and age (years) groups
5th 10th 25th 50th 75th 90th 95th
Males
Chinese 973 23.0 515 570 743 935 1130 1466 1604
Malay 975 31.1 388 481 648 928 1197 1529 1718
Indian 1061 30.6 474 578 789 1004 1221 1551 1743
Females
Chinese 1001 32.9 398 547 714 952 1184 1465 1652
Malay 898 30.9 287 395 621 885 1153 1428 1600
Indian 889 27.6 376 478 627 868 1108 1367 1502
All Ethnic Groups
Chinese 987 20.2 447 552 729 946 1160 1466 1643
Malay 935 22.2 327 451 640 907 1177 1479 1657
Indian 984 21.4 427 525 704 977 1184 1501 1630
Males
18-29 1062 36.8 471 597 785 1000 1215 1561 1766
30-39 1021 37.2 580 625 753 985 1184 1599 1675
40-49 995 33.7 501 537 727 965 1173 1445 1650
50-59 901 35.4 426 535 651 827 1091 1330 1459
60-69 936 57.3 444 460 692 959 1015 1207 1779
Females
18-29 901 31.0 393 480 661 917 1084 1397 1463
30-39 1090 90.5 427 552 727 1001 1208 1517 1839
40-49 978 38.6 418 506 677 948 1223 1496 1785
50-59 970 41.2 356 547 715 948 1180 1503 1588
60-69 908 70.7 334 396 546 866 1197 1336 1579
All Age Groups
18-29 978 24.2 440 550 713 933 1153 1480 1615
30-39 1056 49.6 503 606 748 988 1201 1555 1720
40-49 986 25.9 470 535 702 954 1205 1494 1699
50-59 934 27.9 375 538 702 874 1147 1398 1559
60-69 923 45.1 389 439 607 916 1134 1317 1710
Total
Males 983 18.1 465 558 740 948 1151 1487 1669
Females 975 25.5 397 503 679 928 1180 1462 1626
ALL 979 15.6 428 537 713 944 1171 1472 1645
SE - standard error of mean
Mean(mcg)
SE Percentile

77
NATIONALNUTRITIONSURVEY2010NATIONALNUTRITIONSURVEY2010
ANNEX II ANNEX II
Table 3.10.2: Distribution (%) of percentage of RDA met for vitamin A among adult Singapore residents, by gender, ethnic and age (years) groups
< 50% < 70% < 100% ≥ 100% ≥ 120% ≥ 150% ≥ 200%
Males
Chinese 1.3 6.3 25.8 74.2 54.1 25.3 8.7
Malay 4.0 14.5 34.3 65.7 52.4 30.2 10.8
Indian 0.9 6.7 23.0 77.0 66.5 34.6 14.1
Females
Chinese 3.3 9.2 28.6 71.4 55.5 29.5 9.2
Malay 9.4 19.1 38.2 61.8 48.4 26.1 7.0
Indian 4.7 13.9 39.3 60.7 43.0 24.3 5.3
All Ethnic Groups
Chinese 2.3 7.7 27.2 72.8 54.8 27.4 9.0
Malay 6.8 16.9 36.3 63.7 50.3 28.0 8.8
Indian 2.6 10.0 30.4 69.6 55.9 29.9 10.1
Males
18-29 0.7 6.5 24.1 75.9 62.0 32.9 14.1
30-39 0.1 2.8 23.2 76.8 60.9 30.9 11.4
40-49 2.0 8.0 26.6 73.4 58.5 29.6 9.7
50-59 3.4 9.4 27.5 72.5 42.6 21.3 4.6
60-69 1.7 11.5 34.0 66.0 54.5 18.4 9.0
Females
18-29 3.9 11.2 36.1 63.9 51.9 18.4 2.9
30-39 3.6 8.0 27.4 72.6 58.9 30.5 10.4
40-49 3.5 11.2 33.4 66.6 52.7 28.4 9.4
50-59 6.8 9.0 25.3 74.7 53.4 34.4 11.7
60-69 4.2 20.8 34.3 65.7 46.4 33.7 7.8
All Age Groups
18-29 2.3 9.0 30.3 69.7 56.7 25.4 8.3
30-39 1.9 5.5 25.3 74.7 59.9 30.7 10.9
40-49 2.8 9.7 30.2 69.8 55.4 29.0 9.5
50-59 5.0 9.2 26.5 73.5 47.7 27.5 7.9
60-69 2.8 15.6 34.2 65.8 50.8 25.2 8.4
Total
Males 1.6 7.4 26.6 73.4 55.3 27.0 9.6
Females 4.4 11.1 31.1 68.9 53.3 28.5 8.5
ALL 3.0 9.3 28.8 71.2 54.3 27.8 9.1

78
NATIONALNUTRITIONSURVEY2010
ANNEX II
Table 3.10.3: Comparison of mean (CI) vitamin A intake (mcg) among adult Singapore residents, by gender and ethnic groups
1998 2004 2010
Crude Age-Std(95% CI)
Crude Age-Std(95% CI)
Age-Std(95% CI)
Gender
Males 853 863(826, 889)
1073 1075(1018, 1132)
983(948, 1019)
120
Females 850 863(825, 902)
1081 1081(1029, 1132)
975(925, 1025)
112
Ethnic Group
Chinese 827 832(802, 862)
1046 1045(999, 1091)
987(948, 1027)
155
Malay 940 991(919, 1063)
1153 1166(1087, 1245)
935(891, 978)
-56
Indian 969 980(913, 1046)
1265 1263(1169, 1356)
984(942, 1025)
4
Overall 852 863(837, 889)
1077 1078(1039, 1116)
979(949, 1010)
116
Age-Std: Age standardised
CI: Confidence Interval
Table 3.10.4: Comparison of proportion (%) of adult Singapore residents consuming insufficient vitamin A (< 70% RDA), by gender
1998 2004 2010
Std (95% CI) Std (95% CI) Std (95% CI)
Gender
Males 24.5(21.6, 27.5)
17.2(14.0, 20.5)
7.4(5.1, 9.7)
-17.1
Females 30.1(27.1, 33.1)
12.2(9.5, 15.0)
11.1(8.1, 14.1)
-19.0
Overall 27.3(25.2, 29.4)
14.7(12.6, 16.9)
9.3(7.4, 11.2)
-18.0
Std: Age standardised
CI: Confidence Interval
MeanDifference(mcg)[‘10- ‘98]
Difference(Age-Stdproportion)[‘10- ‘98]

79
NATIONALNUTRITIONSURVEY2010NATIONALNUTRITIONSURVEY2010
ANNEX II ANNEX II
Table 3.11.1: Mean (SE) and percentile distribution of daily vitamin C (weight in milligrams) intake among adult Singapore residents, by gender, ethnic and age (years) groups
5th 10th 25th 50th 75th 90th 95th
Males
Chinese 131 3.6 54 66 90 121 162 207 231
Malay 118 4.8 37 45 71 104 154 201 242
Indian 136 6.0 57 71 91 124 158 216 241
Females
Chinese 138 5.0 51 65 82 123 176 235 277
Malay 114 4.6 31 45 68 107 154 203 211
Indian 119 4.3 47 57 74 106 154 192 232
All Ethnic Groups
Chinese 134 3.1 54 66 87 123 167 216 241
Malay 116 3.3 33 46 69 106 154 203 230
Indian 129 3.8 52 65 86 120 156 202 237
Males
18-29 133 5.6 45 60 89 127 162 210 240
30-39 130 6.4 47 65 90 114 155 207 236
40-49 129 5.4 56 65 84 116 165 195 237
50-59 129 6.2 51 58 91 124 167 215 221
60-69 127 8.4 55 68 85 120 142 192 229
Females
18-29 124 7.7 46 56 80 112 162 199 241
30-39 136 8.0 48 64 81 126 176 213 264
40-49 134 6.6 47 58 88 123 166 223 277
50-59 147 10.6 50 64 83 132 188 234 266
60-69 110 8.9 43 52 67 94 158 188 211
All Age Groups
18-29 129 4.8 46 59 85 119 162 204 240
30-39 133 5.2 48 64 87 123 166 211 239
40-49 132 4.3 50 62 84 121 166 216 267
50-59 137 6.2 51 60 91 128 172 221 236
60-69 120 6.4 49 66 75 109 142 192 213
Total
Males 130 2.8 51 64 88 120 160 207 235
Females 132 3.9 47 61 80 120 167 220 266
ALL 131 2.4 49 62 85 120 166 214 240
SE - standard error of mean
Mean(mg)
SE Percentile

80
NATIONALNUTRITIONSURVEY2010
ANNEX II
Table 3.11.2: Distribution (%) of percentage of RDA met for vitamin C among adult Singapore residents, by gender, ethnic and age (years) groups
< 50% < 70% < 100% ≥ 100% ≥ 120% ≥ 150% ≥ 200%
Males
Chinese 4.1 13.1 35.8 64.2 47.1 26.0 9.3
Malay 14.1 27.0 50.4 49.6 38.8 23.4 9.7
Indian 3.0 10.5 33.6 66.4 47.5 25.3 10.7
Females
Chinese 1.9 7.0 25.7 74.3 65.6 47.2 26.5
Malay 9.7 20.2 35.3 64.7 52.9 35.3 18.3
Indian 3.5 11.0 32.0 68.0 54.7 38.9 17.8
All Ethnic Groups
Chinese 3.0 10.0 30.7 69.3 56.4 36.6 17.9
Malay 11.8 23.4 42.5 57.5 46.2 29.6 14.2
Indian 3.3 10.7 32.9 67.1 50.8 31.4 13.9
Males
18-29 7.0 15.8 32.6 67.4 51.0 27.6 10.7
30-39 5.3 12.8 41.7 58.3 43.0 23.0 9.7
40-49 4.7 17.3 40.8 59.2 43.4 26.7 8.5
50-59 5.2 13.8 34.6 65.4 47.9 28.9 11.1
60-69 4.3 13.5 39.0 61.0 43.6 18.2 6.0
Females
18-29 3.9 10.7 26.7 73.3 62.4 36.5 19.2
30-39 3.1 7.9 27.8 72.2 65.5 47.4 27.0
40-49 3.9 10.0 23.9 76.1 64.0 47.7 22.8
50-59 2.0 7.5 25.3 74.7 68.7 53.9 32.1
60-69 3.3 11.7 43.2 56.8 42.7 30.2 18.5
All Age Groups
18-29 5.4 13.2 29.6 70.4 56.9 32.2 15.1
30-39 4.2 10.3 34.7 65.3 54.4 35.4 18.5
40-49 4.3 13.4 31.8 68.2 54.3 37.8 16.0
50-59 3.7 10.8 30.2 69.8 57.7 40.7 21.0
60-69 3.9 12.7 40.9 59.1 43.2 23.6 11.6
Total
Males 5.4 14.7 37.6 62.4 46.0 25.5 9.5
Females 3.3 9.4 27.8 72.2 62.6 44.6 24.4
ALL 4.3 12.0 32.7 67.3 54.3 35.1 16.9

81
NATIONALNUTRITIONSURVEY2010NATIONALNUTRITIONSURVEY2010
ANNEX II ANNEX II
Table 3.11.3: Comparison of mean (CI) vitamin C intake (mg) among adult Singapore residents, by gender and ethnic groups
1998 2004 2010
Crude Age-Std(95% CI)
Crude Age-Std(95% CI)
Age-Std(95% CI)
Gender
Males 142 143(137, 150)
164 164(156, 172)
130(124, 135)
-13
Females 141 141(135, 148)
177 177(168, 186)
132(125, 140)
-9
Ethnic Group
Chinese 143 143(138, 149)
172 172(165, 179)
134(128, 141)
-9
Malay 130 133(125, 141)
154 157(145, 170)
116(110, 123)
-17
Indian 147 150(139, 161)
178 180(167, 192)
129(121, 136)
-21
Overall 142 142(138, 147)
170 171(165, 177)
131(126, 136)
-11
Age-Std: Age standardised
CI: Confidence Interval
Table 3.11.4: Comparison of proportion (%) of adult Singapore residents consuming insufficient vitamin C (< 70% RDA), by gender
1998 2004 2010
Std (95% CI) Std (95% CI) Std (95% CI)
Gender
Males 24.6(21.7, 27.5)
17.4(14.3, 20.5)
14.7(11.5, 17.9)
-9.9
Females 15.9(13.4, 18.3)
8.8(6.3, 11.2)
9.4(6.9, 11.8)
-6.5
Overall 20.2(18.3, 22.1)
13.1(11.1, 15.1)
12.0(10.0, 14.0)
-8.2
Std: Age standardised and calculated based on updated RDA formulae
CI: Confidence Interval
MeanDifference(mg)[‘10- ‘98]
Difference(Age-Stdproportion)[‘10- ‘98]

82
NATIONALNUTRITIONSURVEY2010
ANNEX II
3.16 3.
45
2.87
1.78
1.79
1.77
1.27
1.22 1.31
0.76
Rice and alternatives
7
4
2
6
6.90
Food groups
No.
of s
ervi
ngs
5
1
0
3
Wholegrains Fruit Vegetables Meat and alternatives
7.78
Figure 4.1.1: Mean daily intake of Healthy Diet Pyramid Food Groups (servings) among adult Singapore residents, by gender
9
86.
01
0.65 0.
87
Total
Male
Female

83
NATIONALNUTRITIONSURVEY2010NATIONALNUTRITIONSURVEY2010
ANNEX II ANNEX II
Table 4.1.1(a): Mean (SE) daily intake of Healthy Diet Pyramid Food Groups (servings) among adult Singapore residents, by gender and ethnic groups
Fruit Vegetables Meat andAlternatives
Total WholegrainProducts
Males
Chinese 7.66 (0.15) 0.63 (0.07) 1.19 (0.06) 1.82 (0.06) 3.63 (0.13)
Malay 8.20 (0.42) 0.59 (0.07) 1.14 (0.07) 1.58 (0.08) 3.08 (0.12)
Indian 8.00 (0.27) 0.90 (0.12) 1.52 (0.11) 1.89 (0.11) 2.78 (0.12)
Females
Chinese 5.94 (0.14) 0.92 (0.08) 1.34 (0.11) 1.86 (0.07) 3.01 (0.09)
Malay 6.31 (0.20) 0.57 (0.05) 1.19 (0.09) 1.40 (0.06) 2.66 (0.09)
Indian 6.13 (0.17) 0.91 (0.10) 1.30 (0.07) 1.67 (0.07) 2.11 (0.08)
Total
Chinese 6.80 (0.12) 0.78 (0.06) 1.26 (0.06) 1.84 (0.04) 3.32 (0.08)
Malay 7.21 (0.24) 0.58 (0.04) 1.17 (0.06) 1.49 (0.05) 2.86 (0.08)
Indian 7.16 (0.18) 0.90 (0.08) 1.42 (0.07) 1.79 (0.07) 2.48 (0.07)
Table 4.1.1(b): Mean (SE) daily intake of Healthy Diet Pyramid Food Groups (servings) among adult Singapore residents, by gender and age (years) groups
Fruit Vegetables Meat andAlternatives
Total WholegrainProducts
Males
18-29 8.42 (0.33) 0.68 (0.11) 1.06 (0.08) 1.91 (0.10) 4.02 (0.15)
30-39 7.83 (0.30) 0.61 (0.10) 1.11 (0.10) 1.93 (0.11) 3.52 (0.24)
40-49 7.71 (0.22) 0.65 (0.10) 1.26 (0.08) 1.76 (0.07) 3.49 (0.17)
50-59 7.51 (0.24) 0.66 (0.12) 1.38 (0.12) 1.73 (0.09) 3.18 (0.24)
60-69 7.29 (0.39) 0.67 (0.20) 1.30 (0.16) 1.59 (0.14) 2.93 (0.27)
Females
18-29 6.01 (0.22) 0.64 (0.15) 1.13 (0.16) 1.66 (0.07) 3.01 (0.11)
30-39 6.26 (0.19) 0.74 (0.11) 1.27 (0.10) 1.90 (0.14) 3.19 (0.15)
40-49 5.85 (0.22) 0.70 (0.09) 1.10 (0.07) 1.94 (0.11) 2.69 (0.12)
50-59 5.70 (0.31) 1.27 (0.18) 1.85 (0.28) 1.75 (0.10) 2.78 (0.19)
60-69 6.53 (0.31) 1.17 (0.20) 1.18 (0.13) 1.39 (0.14) 2.54 (0.20)
Total
18-29 7.17 (0.22) 0.66 (0.09) 1.10 (0.09) 1.78 (0.06) 3.50 (0.10)
30-39 7.03 (0.19) 0.68 (0.07) 1.19 (0.07) 1.91 (0.09) 3.35 (0.14)
40-49 6.72 (0.18) 0.68 (0.07) 1.18 (0.05) 1.86 (0.07) 3.06 (0.10)
50-59 6.66 (0.23) 0.94 (0.11) 1.60 (0.15) 1.74 (0.07) 2.99 (0.16)
60-69 6.95 (0.27) 0.89 (0.15) 1.25 (0.10) 1.50 (0.10) 2.76 (0.17)
Rice and Alternatives
Rice and Alternatives

84
NATIONALNUTRITIONSURVEY2010
ANNEX II
677.
5 749.
6
605.
5
462.
5
497.
2
427.
7
183.
3
184.
3
182.
4
177.
4
170.
7
184.
0
26.1
Rice and alternatives
700
400
200
600
Food groups
Wei
ght i
n gr
ams 500
100
0
300
Wholegrains Fruit Vegetables Meat and alternatives
Figure 4.1.2: Mean daily intake of Healthy Diet Pyramid Food Groups (weight in grams) among adult Singapore residents, by gender
800
21.5
30.6
Total
Male
Female

85
NATIONALNUTRITIONSURVEY2010NATIONALNUTRITIONSURVEY2010
ANNEX II ANNEX II
Table 4.1.2(a): Mean (SE) daily intake of Healthy Diet Pyramid Food Groups (weight in grams) among adult Singapore residents, by gender and ethnic groups
Fruit Vegetables Meat andAlternatives
Total WholegrainProducts
Males
Chinese 747.2 (19.1) 21.3 (2.7) 165.9 (8.8) 187.1 (5.6) 491.4 (17.5)
Malay 760.7 (37.5) 17.2 (2.5) 161.3 (11.3) 162.4 (8.0) 488.0 (17.5)
Indian 751.8 (31.4) 27.6 (4.2) 211.8 (13.1) 192.2 (11.3) 544.5 (23.3)
Females
Chinese 609.0 (19.0) 33.6 (3.4) 187.4 (16.0) 191.3 (6.7) 426.0 (12.6)
Malay 593.8 (19.9) 16.2 (1.8) 169.6 (12.3) 145.4 (6.3) 438.0 (19.8)
Indian 596.3 (25.9) 30.1 (4.3) 180.2 (9.8) 171.1 (7.7) 424.6 (19.6)
Total
Chinese 677.7 (14.0) 27.5 (2.2) 176.7 (9.2) 189.2 (4.4) 458.5 (10.8)
Malay 673.6 (21.5) 16.7 (1.5) 165.6 (8.4) 153.5 (5.1) 461.9 (13.5)
Indian 681.7 (21.4) 28.8 (3.0) 197.6 (8.7) 182.7 (7.1) 490.4 (15.9)
Table 4.1.2(b): Mean (SE) daily intake of Healthy Diet Pyramid Food Groups (weight in grams) among adult Singapore residents, by gender and age (years) groups
Rice and Alternatives
Fruit Vegetables Meat andAlternatives
Total WholegrainProducts
Males
18-29 786.1 (29.2) 18.8 (3.0) 152.7 (11.0) 194.1 (10.1) 567.5 (21.7)
30-39 751.3 (29.9) 19.9 (3.3) 159.4 (14.6) 196.7 (11.0) 519.8 (24.3)
40-49 746.2 (24.1) 22.3 (3.8) 175.5 (12.0) 181.2 (7.4) 507.5 (21.9)
50-59 746.0 (44.1) 23.9 (6.0) 186.7 (16.2) 177.3 (9.4) 441.9 (31.0)
60-69 702.7 (37.2) 22.6 (7.1) 179.0 (23.7) 168.2 (13.3) 438.4 (49.8)
Females
18-29 592.3 (33.5) 21.6 (7.1) 162.0 (21.3) 170.3 (7.4) 418.4 (15.9)
30-39 615.2 (22.3) 25.9 (4.5) 180.2 (14.4) 195.9 (14.4) 478.3 (20.4)
40-49 579.4 (26.9) 25.0 (3.6) 155.1 (9.9) 200.3 (10.9) 403.4 (19.0)
50-59 594.1 (39.0) 44.6 (6.3) 253.8 (44.2) 181.2 (10.2) 438.8 (25.3)
60-69 694.1 (44.5) 43.0 (8.5) 163.1 (18.2) 143.6 (13.9) 382.2 (38.6)
Total
18-29 685.6 (23.1) 20.2 (4.0) 157.5 (12.3) 181.7 (6.3) 490.2 (14.5)
30-39 682.1 (19.3) 23.0 (2.8) 170.0 (10.3) 196.3 (9.1) 498.7 (16.1)
40-49 657.6 (19.3) 23.7 (2.6) 164.7 (7.8) 191.4 (6.8) 452.2 (14.8)
50-59 674.4 (31.7) 33.7 (4.4) 218.4 (23.3) 179.1 (6.9) 440.4 (20.3)
60-69 698.8 (28.6) 31.8 (5.9) 171.8 (15.3) 157.1 (10.0) 413.2 (31.9)
Rice and Alternatives

86
NATIONALNUTRITIONSURVEY2010
ANNEX II
Rice and alternatives≥ 6 servings
Wholegrain products≥ 1 serving
Fruit≥ 2 servings
Vegetables≥ 2 servings
Meat and alternatives≥ 2.5 servings
61.2 66
.6
55.4
31.2 33
.0
29.5
25.4
24.9
25.9
27.0
70
40
20
60
61.8
Food groups
Per
cent
age
(%)
50
10
0
30
76.6
Figure 4.1.3: Proportion of adult Singapore residents (%) meeting the Dietary Guidelines, by gender
90
8047
.0
22.1
31.7
Total
Male
Female

87
NATIONALNUTRITIONSURVEY2010NATIONALNUTRITIONSURVEY2010
ANNEX II ANNEX II
Table 4.1.3(a): Proportion of adult Singapore residents (%) meeting the Dietary Guidelines, by gender and ethnic groups
Fruit Vegetables Meat andAlternatives
≥ 2 servings ≥ 2 servings ≥ 2.5 servings
Males
Chinese 78.6 21.5 24.4 33.5 70.6
Malay 72.0 20.5 21.8 29.3 58.4
Indian 68.9 28.0 31.8 34.2 50.9
Females
Chinese 46.4 33.1 26.2 31.4 59.5
Malay 50.4 24.2 25.2 21.1 51.7
Indian 46.0 32.8 24.5 27.4 29.6
Total
Chinese 62.4 27.4 25.3 32.5 65.0
Malay 60.8 22.4 23.6 25.0 54.9
Indian 58.6 30.2 28.5 31.1 41.3
Table 4.1.3(b): Proportion of adult Singapore residents (%) meeting the Dietary Guidelines, by gender and age (years) groups
Rice and Alternatives
Total
≥ 6 servings
Wholegrain Products≥ 1 serving
Fruit Vegetables Meat andAlternatives
≥ 2 servings ≥ 2 servings ≥ 2.5 servings
Males
18-29 82.9 28.9 17.1 39.2 81.7
30-39 71.4 16.5 19.8 37.4 66.5
40-49 73.7 24.1 24.8 31.8 67.6
50-59 78.3 19.7 35.7 30.8 62.8
60-69 76.1 21.6 25.2 22.5 48.5
Females
18-29 45.0 25.8 19.4 28.9 63.3
30-39 53.8 26.7 21.9 30.0 64.4
40-49 41.3 26.9 22.1 34.8 45.9
50-59 44.9 41.5 39.7 25.8 52.2
60-69 54.7 45.0 28.3 25.2 49.7
Total
18-29 63.2 27.3 18.3 33.9 72.2
30-39 62.5 21.7 20.9 33.7 65.4
40-49 56.5 25.6 23.3 33.4 56.1
50-59 62.6 30.0 37.6 28.5 57.8
60-69 66.5 32.1 26.6 23.7 49.0
Rice and Alternatives
Total≥ 6 servings
Wholegrain Products≥ 1 serving

88
NATIONALNUTRITIONSURVEY2010
ANNEX II
2.87 3.
16
1.90
1.78
1.37
1.27
7
4
2
6
No.
of s
ervi
ngs
5
1
0
3
6.75 6.90
Figure 4.2.1: Comparison of mean daily intake of Healthy Diet Pyramid Food Groups (servings) among adult Singapore residents, NNS 2004 and NNS 2010
9
8
0.19
0.76
2004
2010
Rice and alternatives
Food groups
Wholegrains* Fruit Vegetables Meat and alternatives

89
NATIONALNUTRITIONSURVEY2010NATIONALNUTRITIONSURVEY2010
ANNEX II ANNEX II
497.
1
462.
5
263.
3
183.
3
184.
8
177.
4
700
400
200
600
Wei
ght i
n gr
ams 500
100
0
300
619.
4 677.
5
Figure 4.2.2: Comparison of mean daily intake of Healthy Diet Pyramid Food Groups (weight in grams) among adult Singapore residents, NNS 2004 and NNS 2010
800
11.6
26.1
2004
2010
Rice and alternatives
Food groups
Wholegrains* Fruit Vegetables Meat and alternatives
56.3 61
.2
42.2
31.2
29.0
25.4
70
40
20
60
Per
cent
age
(%)
50
10
0
30
53.8
61.8
Figure 4.2.3: Comparison of proportion of adult Singapore residents (%) meeting the Dietary Guidelines, NNS 2004 and NNS 2010
8.4
27.0
2004
2010
Rice and alternatives≥ 6 servings
Wholegrain products*≥ 1 serving
Fruit≥ 2 servings
Vegetables≥ 2 servings
Meat and alternatives≥ 2.5 servings
Food groups
* Note the differences in questions between NNS 2004 and NNS 2010. In NNS 2004, the option ‘wholemeal/softmeal bread’ was used which included bread higher in fibre (e.g. softmeal bread with fruit). In NNS 2010, the consumption of wholemeal bread, wholemeal cereals and wholegrain noodles was captured.

90
NATIONALNUTRITIONSURVEY2010
ANNEX II
Table 4.3.1: Mean (SE) daily intake of the various food types (weight in grams) among adult Singapore residents, by gender and ethnic groups
Males Females Chinese Malay Indian Total
Bread and breakfast cereals 174.0(9.8)
168.8(8.7)
122.7(7.5)
162.6(8.9)
249.4(17.1)
171.4(6.5)
White bread 31.4(1.3)
24.0(0.9)
22.6(1.1)
36.5(1.7)
25.7(1.3)
27.7(0.8)
Bread with fruits and nuts 2.3(0.4)
1.7(0.2)
2.1(0.4)
2.3(0.4)
1.5(0.3)
2.0(0.2)
Cereals and other types of bread(e.g. roti prata, thosai, chapati)
48.7(2.5)
33.5(2.1)
15.8(1.0)
37.8(2.3)
80.2(4.4)
41.0(1.6)
Wholemeal bread andwholegrain cereals
91.5(9.3)
109.7 (8.3)
82.3(7.3)
86.1(8.4)
142.0 (16.8)
100.7 (6.3)
Rice/Porridge and dishes 523.9(9.2)
376.5(7.5)
489.6(9.9)
439.6(11.1)
403.8(11.0)
449.7(6.2)
Plain rice/porridge 377.5(8.0)
264.2(6.1)
329.0(8.6)
324.7(9.2)
303.9(9.2)
320.4(5.2)
Flavoured rice/porridge 133.3(4.1)
94.0(3.8)
134.0(4.6)
109.1(4.9)
89.0(5.2)
113.5(2.8)
Brown rice/porridge 13.1(1.9)
18.4(2.3)
26.6(2.8)
5.8(2.0)
10.8(2.6)
15.8(1.5)
Noodles dishes 304.3(9.2)
270.5(8.2)
387.9(10.3)
251.0(9.8)
182.6(9.0)
287.3(6.2)
Noodles in soup 85.1(4.2)
92.6(4.3)
133.4(5.5)
70.1(4.7)
45.4(3.5)
88.8(3.0)
Dry noodles 60.8(2.6)
41.0(2.1)
78.1(3.1)
36.3(2.2)
27.4(2.3)
50.9(1.7)
Fried noodles 79.9(3.2)
67.2(2.8)
95.3(3.7)
64.6(3.5)
52.0(3.5)
73.5(2.1)
Noodles in lemak gravy 20.8(1.6)
14.1(1.1)
20.1(1.5)
19.1(1.9)
12.0(1.6)
17.5(1.0)
Instant noodles 44.3(2.4)
40.2(2.6)
45.2(3.1)
47.1(3.2)
33.0(2.5)
42.3(1.7)
Pasta 11.2(1.0)
12.6(1.0)
13.9(1.1)
11.1(1.2)
9.9(1.3)
11.9 (0.7)
Wholegrain noodles 2.2(0.5)
2.7(0.6)
1.9(0.4)
2.7(0.8)
3.0(0.8)
2.4(0.4)
Vegetarian Chinese 16.9(1.5)
16.0(1.3)
21.2(1.7)
6.0(0.9)
20.6(2.1)
16.4(1.0)
Mean daily intake (grams)

91
NATIONALNUTRITIONSURVEY2010NATIONALNUTRITIONSURVEY2010
ANNEX II ANNEX II
Table 4.3.2: Mean (SE) daily intake of the various food types (weight in grams) among adult Singapore residents, by gender and ethnic groups
Males Females Chinese Malay Indian Total
Vegetables & beans/bean products and dishes
236.4(5.5)
241.4(5.6)
232.4(5.9)
205.9(6.9)
282.8(7.5)
238.9(3.9)
Pale green leafy vegetables and dishes
52.0(2.1)
51.7(1.8)
54.2(2.0)
48.3(2.8)
52.2(2.4)
51.8(1.4)
Dark green leafy vegetables and dishes
48.1(1.7)
54.7(1.8)
61.7(2.0)
47.0(2.3)
41.4(1.9)
51.4(1.2)
Tomatoes, carrots, red/yellow peppers and dishes
27.0(1.5)
28.8(1.4)
21.6(1.3)
21.9(1.5)
43.1(2.6)
27.9(1.0)
Legumes/pulses and dishes 23.8(1.4)
25.0(1.5)
18.0(1.2)
14.4(1.1)
43.9(2.6)
24.4(1.0)
Mixed vegetables and dishes 44.0(2.1)
41.4(1.9)
41.0(2.4)
35.7(2.2)
52.4(2.7)
42.7(1.4)
Others (roots/stems) and dishes 41.0(2.0)
39.2(1.9)
35.0(2.1)
38.2(2.5)
49.2(2.7)
40.1(1.4)
Preserved vegetables 0.6(0.1)
0.6(0.1)
0.9(0.2)
0.3(0.1)
0.6(0.1)
0.6(0.1)
Fruits 191.5(6.2)
205.7(6.0)
191.8(6.4)
190.7(8.0)
216.7(8.5)
198.6(4.3)
Orange/red/yellow fruits and juices 73.7(3.8)
77.0(3.2)
76.0(3.5)
74.4(4.5)
75.5(5.3)
75.3(2.5)
Other fruits and juices 116.0(4.0)
127.1(4.0)
114.7(4.2)
114.6(5.4)
138.7(5.5)
121.6(2.9)
Canned fruits 0.6(0.1)
0.2(0.0)
0.2(0.0)
0.6(0.2)
0.3(0.1)
0.4(0.1)
Mixed fruits (dried) 1.2(0.2)
1.5(0.2)
0.9(0.2)
1.1(0.2)
2.2(0.3)
1.4(0.1)
Poultry and dishes 64.1(2.1)
49.9(1.7)
61.7(2.3)
57.6(2.3)
49.4(2.4)
56.9(1.4)
Poultry (without skin) and dishes 31.6(1.7)
32.5(1.6)
29.7(1.7)
28.6(2.1)
39.0(2.2)
32.1(1.1)
Poultry (with skin) and dishes 32.5(1.9)
17.3(1.2)
32.0(2.0)
29.0(2.0)
10.4(1.4)
24.9(1.1)
Mean daily intake (grams)

92
NATIONALNUTRITIONSURVEY2010
ANNEX II
Table 4.3.3: Mean (SE) daily intake of the various food types (weight in grams) among adult Singapore residents, by gender and ethnic groups
Males Females Chinese Malay Indian Total
Meat and dishes 64.3(2.4)
46.2(1.9)
81.2(2.8)
42.8(2.1)
31.3(2.1)
55.2(1.6)
Meat (lean) and dishes 27.6(1.6)
24.9(1.4)
36.0(2.0)
20.5(1.5)
18.4(1.6)
26.2(1.1)
Meat (lean and fat) and dishes 26.0(1.8)
13.4(1.1)
32.7(2.2)
14.4(1.4)
6.7(1.1)
19.7(1.1)
Meat (preserved and cured) and dishes
10.7(0.7)
7.9(0.7)
12.5(1.0)
7.9(0.6)
6.2(0.7)
9.3(0.5)
Fish/Seafood and dishes 81.7(2.5)
75.1(2.2)
70.6(2.4)
99.3(3.4)
67.5(2.8)
78.4(1.7)
Fish and dishes 62.4(1.9)
60.0(1.8)
52.1(1.8)
79.6(2.7)
54.9(2.3)
61.2(1.3)
Other seafood and dishes 19.3(1.2)
15.1(0.8)
18.5(1.1)
19.7(1.5)
12.7(1.1)
17.2(0.7)
Eggs 27.8(1.0)
19.9(0.7)
26.2(0.8)
25.6(1.6)
18.6(0.9)
23.8(0.6)
Milk and dairy products 298.8(10.9)
244.0(8.1)
194.5(8.9)
271.3(12.0)
379.8(13.9)
271.2(6.8)
Milk used with beverages(e.g. in tea, coffee, malt drinks)
217.9 (9.3)
156.2(6.9)
137.5(8.2)
176.1(10.3)
268.0(11.6)
186.8(5.8)
Full cream milk (as a drink) 17.6(2.1)
16.9(2.0)
11.5(1.8)
16.9(2.6)
25.7(3.4)
17.2(1.5)
Reduced fat milk (as a drink) 49.5(4.3)
54.4(3.4)
37.1(2.9)
67.5(5.3)
56.7(6.3)
52.0(2.7)
Yogurt/cheese 13.8(1.5)
16.5(1.3)
8.3(0.8)
10.7(1.1)
29.4(2.9)
15.1(1.0)
Mean daily intake (grams)

93
NATIONALNUTRITIONSURVEY2010NATIONALNUTRITIONSURVEY2010
ANNEX II ANNEX II
Table 4.3.4: Mean (SE) daily intake of the various food types (weight in grams) among adult Singapore residents, by gender and ethnic groups
Males Females Chinese Malay Indian Total
Miscellaneous 492.4(12.5)
376.6(10.6)
489.3(13.9)
471.2(15.0)
317.1(12.4)
434.1(8.3)
Bread spreads 5.4(0.3)
3.9(0.2)
3.9(0.2)
5.8(0.4)
4.5(0.3)
4.6(0.2)
Soup cream/broth/clear 56.2(4.2)
55.0(4.8)
98.3(6.8)
30.0(3.4)
21.8(2.7)
55.6(3.2)
Salad dressings 1.0(0.1)
1.0(0.1)
1.0(0.1)
1.2(0.1)
0.8(0.1)
1.0(0.1)
Desserts in soup 24.4(1.6)
19.5(1.3)
31.8(2.0)
16.1(1.4)
14.1(1.4)
21.9(1.0)
Local snacks – kueh kueh(steamed)
12.5(0.9)
10.4(0.9)
8.8(0.7)
12.6(1.2)
13.9(1.5)
11.4(0.6)
Other desserts/snacks (e.g. dim sum, goreng pisang, Indian rojak)
21.2(1.4)
15.3(1.0)
24.7(1.7)
15.3(1.2)
12.1(0.9)
18.2(0.8)
Biscuits, pastries and cakes 25.6(1.3)
24.1(1.0)
18.1(1.0)
28.7(1.6)
30.4(1.7)
24.9(0.8)
Fast food and soft drinks 168.3(6.6)
115.1(5.5)
127.6(6.4)
183.6(9.5)
117.4(6.4)
141.5(4.4)
Nuts 4.3(0.3)
2.8(0.2)
3.0(0.3)
2.5(0.3)
5.2(0.4)
3.5(0.2)
Titbits (e.g. fried salty snacks,ice-cream, chocolates)
13.7(0.8)
12.1(0.8)
10.8(0.7)
16.3(1.3)
12.4(0.8)
12.9(0.5)
Beverages with creamer or whitener 47.1(5.1)
43.2(4.0)
44.5(4.5)
53.5(6.6)
37.3(6.0)
45.1(3.2)
Beverages without milk or sugar 112.7(7.7)
74.2(5.1)
116.8(8.1)
105.6(8.7)
47.2(5.8)
93.3(4.6)
Soy products 66.2(3.5)
62.6(2.9)
65.2(3.2)
67.0(4.1)
60.4(4.8)
64.4(2.3)
Tofu/beancurd and dishes 11.5(0.6)
14.0(0.9)
13.9(0.8)
12.1(0.9)
11.8(1.1)
12.7(0.5)
Soy milk and beancurd 54.7(3.3)
48.6(2.7)
51.3(3.0)
54.9(3.8)
48.6(4.5)
51.6(2.1)
Alcohol 63.8(8.0)
9.4(2.6)
55.4(8.2)
8.1(4.1)
39.1(7.7)
36.4(4.3)
Mean daily intake (grams)

94
NATIONALNUTRITIONSURVEY2010
ANNEX II
Table 4.3.5: Mean (SE) daily intake of the various food types (weight in grams) among adult Singapore residents, by age (years) groups
18-29 30-39 40-49 50-59 60-69 Total
Breads and breakfast cereals 118.3(7.5)
166.5(10.5)
157.0(10.8)
227.7(25.1)
243.3(24.1)
171.4(6.5)
White bread 27.3(1.7)
28.0(1.6)
29.3(1.6)
26.2(1.8)
26.4(2.3)
27.7(0.8)
Bread with fruits and nuts 2.1(0.6)
2.3(0.5)
1.5(0.2)
2.2(0.5)
1.6(0.7)
2.0(0.2)
Cereals and other types of breads(e.g. roti prata, thosai, chapati)
38.3(2.6)
52.7(4.1)
42.2(3.5)
34.1(3.5)
29.2(3.9)
41.0(1.6)
Wholemeal bread andwholegrain cereals
50.6(6.5)
83.5(9.5)
84.0(10.0)
165.1(24.5)
186.2(23.7)
100.7(6.3)
Rice/Porridge and dishes 486.3(13.4)
450.5(13.2)
434.4(12.0)
426.1(13.3)
440.9(19.6)
449.7(6.2)
Plain rice/porridge 334.1(11.3)
319.5(10.8)
315.9(10.5)
310.2(11.2)
319.6(16.3)
320.4(5.2)
Flavoured rice/porridge 140.4(6.4)
112.9(6.2)
102.9(4.8)
100.1(6.3)
101.3(9.1)
113.5(2.8)
Brown rice/porridge 11.8(2.3)
18.1(4.0)
15.6(2.9)
15.7(3.1)
20.0(4.6)
15.8(1.5)
Noodles dishes 331.5(13.5)
305.2(12.2)
292.7(12.5)
247.9(13.9)
198.2(17.3)
287.3(6.2)
Noodles in soup 103.4(6.1)
99.0(5.9)
89.4(6.8)
77.6(6.9)
49.4(7.1)
88.8(3.0)
Dry noodles 50.9(3.4)
52.8(3.4)
55.3(3.6)
47.9(3.9)
40.5(5.2)
50.9(1.7)
Fried noodles 72.8(4.4)
77.2(4.5)
76.2(4.3)
69.7(4.7)
66.4(7.1)
73.5(2.1)
Noodles in lemak gravy 18.8(2.5)
13.5(1.5)
21.1(2.0)
17.9(2.1)
14.3(2.7)
17.5(1.0)
Instant noodles 65.4(4.8)
43.8(3.0)
38.4(2.8)
25.2(4.1)
23.6(3.6)
42.3(1.7)
Pasta 18.6(1.6)
15.2(1.8)
9.4(1.2)
7.4(1.2)
2.8(0.8)
11.9(0.7)
Wholegrain noodles 1.6(0.5)
3.7(0.9)
2.8(0.8)
2.1(0.8)
1.2(1.0)
2.4(0.4)
Vegetarian Chinese 15.6(2.1)
16.2(2.1)
17.2(2.0)
16.4(1.9)
17.1(3.2)
16.4(1.0)
Mean daily intake (grams)

95
NATIONALNUTRITIONSURVEY2010NATIONALNUTRITIONSURVEY2010
ANNEX II ANNEX II
Table 4.3.6: Mean (SE) daily intake of the various food types (weight in grams) among adult Singapore residents, by age (years) groups
18-29 30-39 40-49 50-59 60-69 Total
Vegetables & beans/bean products and dishes
216.8(7.4)
257.9(8.7)
254.1(8.6)
231.5(8.5)
221.6(10.4)
238.9(3.9)
Pale green leafy vegetables and dishes
51.6(2.8)
55.0(2.6)
54.6(2.8)
49.1(3.8)
43.0(3.5)
51.8(1.4)
Dark green leafy vegetables and dishes
44.0(2.4)
52.3(2.7)
56.8(2.5)
51.0(2.7)
54.0(4.1)
51.4(1.2)
Tomatoes, carrots, red/yellow peppers and dishes
22.7(1.6)
29.2(2.2)
31.7(2.5)
28.4(2.3)
26.7(3.2)
27.9(1.0)
Legumes/pulses and dishes 17.3(1.6)
30.2(2.5)
27.5(2.4)
22.4(1.9)
22.9(2.8)
24.4(1.0)
Mixed vegetables and dishes 40.8(2.8)
47.8(2.8)
41.2(3.0)
43.8(3.7)
37.2(4.0)
42.7(1.4)
Others (roots/stems) and dishes 39.9(2.6)
42.5(3.3)
41.6(3.1)
36.3(2.7)
37.5(3.6)
40.1(1.4)
Preserved vegetables 0.6(0.2)
0.8(0.2)
0.7(0.1)
0.4(0.1)
0.4(0.1)
0.6(0.1)
Fruits 175.5(8.0)
195.8(8.8)
202.1(9.0)
224.1(11.1)
207.1(12.7)
198.6(4.3)
Orange/red/yellow fruits and juices 60.7(3.7)
75.7(5.1)
76.5(5.8)
91.5(6.4)
78.1(6.9)
75.3(2.5)
Other fruits and juices 113.5(5.8)
118.1(5.5)
123.6(5.7)
130.9(7.5)
127.6(9.0)
121.6(2.9)
Canned fruits 0.5(0.1)
0.3(0.1)
0.5(0.2)
0.3(0.1)
0.2(0.1)
0.4(0.1)
Mixed fruits (dried) 0.9(0.2)
1.7(0.3)
1.5(0.3)
1.4(0.3)
1.2(0.4)
1.4(0.1)
Poultry and dishes 71.2(2.9)
62.5(3.1)
50.0(2.2)
48.9(3.4)
41.5(3.3)
56.9(1.4)
Poultry (without skin) and dishes 34.9(2.8)
31.5(2.2)
28.4(1.8)
36.1(3.2)
29.0(2.9)
32.1(1.1)
Poultry (with skin) and dishes 36.3(2.3)
30.9(3.0)
21.6(2.1)
12.8(1.7)
12.5(2.5)
24.9(1.1)
Mean daily intake (grams)

96
NATIONALNUTRITIONSURVEY2010
ANNEX II
Table 4.3.7: Mean (SE) daily intake of the various food types (weight in grams) among adult Singapore residents, by age (years) groups
18-29 30-39 40-49 50-59 60-69 Total
Meat and dishes 69.5(3.2)
56.5(3.2)
50.5(3.4)
48.2(3.4)
42.7(3.8)
55.2(1.6)
Meat (lean) and dishes 27.3(2.2)
25.0(2.2)
24.8(2.0)
29.9(2.8)
23.6(2.7)
26.2(1.1)
Meat (lean and fat) and dishes 26.4(2.3)
20.9(2.1)
19.1(2.6)
13.4(2.0)
13.6(2.6)
19.7(1.1)
Meat (preserved and cured) and dishes
15.8(1.0)
10.5(1.4)
6.6(0.7)
4.8(0.7)
5.5(1.1)
9.3(0.5)
Fish/Seafood and dishes 70.6(3.3)
72.4(3.2)
79.7(3.4)
94.5(4.4)
79.6(4.7)
78.4(1.7)
Fish and dishes 51.5(2.4)
56.0(2.6)
62.2(2.5)
75.6(3.6)
68.8(4.3)
61.2(1.3)
Other seafood and dishes 19.2(1.7)
16.4(1.2)
17.5(1.4)
18.9(1.9)
10.9(1.4)
17.2(0.7)
Eggs 29.5(1 4)
25.2(1.6)
21.9(1.2)
20.4(1.3)
18.4(1.5)
23.8(0.6)
Milk and dairy products 241.8(12.3)
290.9(14.4)
271.4(13.0)
262.7(16.1)
306.2(26.6)
271.2(6.8)
Milk used with beverages (e.g. In tea, coffee, malt drinks)
147.0(9.6)
199.6(12.8)
200.9(11.7)
184.9(13.8)
217.5(21.5)
186.8(5.8)
Full cream milk (as a drink) 21.6(3.5)
27.1(3.8)
11.4(2.1)
10.3(2.7)
10.2(3.4)
17.2(1.5)
Reduced fat milk (as a drink) 59.9(7.2)
45.7(4.4)
45.6(4.7)
53.3(6.2)
61.6(9.4)
52.0(2.7)
Yogurt/cheese 13.2(1.3)
18.6(2.1)
13.6(1.7)
14.1(3.0)
16.9(4.2)
15.1(1.0)
Mean daily intake (grams)

97
NATIONALNUTRITIONSURVEY2010NATIONALNUTRITIONSURVEY2010
ANNEX II ANNEX II
Table 4.3.8: Mean (SE) daily intake of the various food types (weight in grams) among adult Singapore residents, by age (years) groups
18-29 30-39 40-49 50-59 60-69 Total
Miscellaneous 499.2(16.7)
434.5(16.9)
414.7(16.6)
417.3(20.7)
359.5(24.7)
434.1(8.3)
Bread spreads 4.3(0.3)
4.3(0.3)
4.7(0.3)
5.1(0.3)
5.1(0.8)
4.6(0.2)
Soup cream/broth/clear 57.1(5.9)
61.9(8.3)
49.8(5.4)
54.6(6.4)
53.3(9.9)
55.6(3.2)
Salad dressings 1.3(0.1)
1.0(0.1)
1.0(0.2)
0.8(0.2)
0.5(0.1)
1.0(0.1)
Desserts in soup 21.9(2.1)
20.6(1.9)
21.6(2.0)
25.2(2.8)
20.5(2.8)
21.9(1.0)
Local snacks – kueh kueh (steamed) 7.5(1.0)
11.8(1.5)
11.7(1.3)
16.6(1.8)
10.2(1.7)
11.4(0.6)
Other desserts/snacks (e.g. dim sum, goreng pisang, Indian rojak)
24.0(2.4)
17.1(1.3)
17.0(1.7)
15.6(1.4)
15.5(2.2)
18.2(0.8)
Biscuits, pastries and cakes 24.6(1.5)
25.7(2.0)
24.3(1.6)
25.6(2.0)
23.5(2.1)
24.9(0.8)
Fast food and soft drinks 238.4(10.9)
160.5(9.2)
104.6(6.6)
82.5(7.7)
64.8(8.7)
141.5(4.4)
Nuts 2.3(0.3)
3.4(0.3)
4.4(0.4)
4.2(0.6)
3.2(0.8)
3.5(0.2)
Titbits (e.g. fried salty snacks,ice-cream, chocolates)
21.5(1.6)
13.4(0.9)
10.4(0.8)
7.9(1.1)
6.3(1.4)
12.9(0.5)
Beverages with creamer or whitener 32.7(4.9)
40.3(6.3)
57.0(7.6)
45.7(7.4)
55.3(12.0)
45.1(3.2)
Beverages without milk or sugar 63.6(6.9)
74.6(8.0)
108.2(10.6)
133.5(13.8)
101.3(13.6)
93.3(4.6)
Soy products 66.4(4.4)
66.8(4.9)
66.6(5.1)
60.1(4.4)
55.6(6.9)
64.4(2.3)
Tofu/beancurd and dishes 12.4(1.1)
12.2(1.2)
13.7(1.3)
12.3(0.9)
13.3(1.5)
12.7(0.5)
Soy milk and beancurd 54.1(4.2)
54.6(4.7)
52.9(4.6)
47.8(4.1)
42.3(6.6)
51.6(2.1)
Alcohol 35.1(9.2)
23.4(5.3)
37.6(9.6)
50.9(11.2)
42.2(14.8)
36.4(4.3)
SE - standard error of mean
Mean daily intake (grams)

98
NATIONALNUTRITIONSURVEY2010
ANNEX II
Table 5.1.1: Mean (SE) and percentile distribution of urinary sodium (mmol/24hr) among adult Singapore residents, by gender, ethnic and age (years) groups
5th 10th 25th 50th 75th 90th 95th
Gender
Males 164.0 6.6 75.6 81.8 106.0 155.7 210.6 255.6 306.8
Females 123.1 4.4 48.0 63.6 84.5 115.3 155.5 201.9 226.3
Ethnic Group
Chinese 143.2 5.0 62.4 71.7 95.5 135.4 173.1 233.0 255.6
Malay 130.0 6.1 39.7 44.3 84.3 123.5 169.8 213.2 233.0
Indian 148.5 5.5 51.3 62.7 92.0 135.6 196.0 252.8 270.4
Age Group (Years)
18-29 134.4 9.1 41.2 49.3 72.3 122.4 189.7 214.7 235.2
30-39 151.4 8.0 63.7 78.8 102.5 149.9 173.3 234.4 272.2
40-49 153.4 7.2 63.0 82.6 103.0 144.5 192.9 241.6 247.1
50-59 133.4 10.1 74.8 75.1 86.7 118.0 149.9 227.6 260.8
60-69 131.6 7.9 49.9 63.4 88.8 131.7 163.6 188.2 234.3
Total 142.2 4.1 57.2 69.2 93.8 133.0 174.2 231.9 255.7
Mean(mmol/day)
SE Percentile
Table 5.1.2: Mean (SE) and percentile distribution of estimated salt intake^ (g/day) among adult Singapore residents, by gender, ethnic and age (years) groups
5th 10th 25th 50th 75th 90th 95th
Gender
Males 9.6 0.4 4.4 4.8 6.2 9.1 12.3 14.9 17.9
Females 7.2 0.3 2.8 3.7 4.9 6.7 9.1 11.8 13.2
Ethnic Group
Chinese 8.4 0.3 3.7 4.2 5.6 7.9 10.1 13.6 14.9
Malay 7.6 0.4 2.3 2.6 4.9 7.2 9.9 12.5 13.6
Indian 8.7 0.3 3.0 3.7 5.4 7.9 11.5 14.8 15.8
Age Group (Years)
18-29 7.9 0.5 2.4 2.9 4.2 7.2 11.1 12.6 13.8
30-39 8.9 0.5 3.7 4.6 6.0 8.8 10.1 13.7 15.9
40-49 9.0 0.4 3.7 4.8 6.0 8.4 11.3 14.1 14.5
50-59 7.8 0.6 4.4 4.4 5.1 6.9 8.8 13.3 15.3
60-69 7.7 0.5 2.9 3.7 5.2 7.7 9.6 11.0 13.7
Total 8.3 0.2 3.3 4.0 5.5 7.8 10.2 13.6 15.0
^ As in the standard conversion, 1g salt (sodium chloride) was estimated to be 17.1 mmol sodium or 393.4mg sodium.
Mean(g/day)
SE Percentile

99
NATIONALNUTRITIONSURVEY2010NATIONALNUTRITIONSURVEY2010
ANNEX II ANNEX II
Table 5.1.3: Distribution (%) of percentage of RDA met for salt among adult Singapore residents, by gender, ethnic and age (years) groups
< 50% < 70% < 100% ≥ 100% ≥ 120% ≥ 150% ≥ 200%
Gender
Males 1.0 3.3 13.4 86.6 76.7 66.4 38.7
Females 3.0 8.2 25.5 74.5 63.5 39.7 18.2
Ethnic Group
Chinese 1.5 4.4 18.9 81.1 70.5 52.9 27.5
Malay 5.5 14.5 26.1 73.9 62.1 44.5 24.8
Indian 2.7 8.4 20.6 79.4 72.3 55.1 33.9
Age Group (Years)
18-29 6.1 14.8 30.2 69.8 64.7 45.1 34.5
30-39 0.6 0.9 13.9 86.1 75.8 59.4 33.7
40-49 0.4 3.7 10.7 89.3 79.4 62.3 32.5
50-59 0.4 2.7 23.9 76.1 60.1 42.1 13.9
60-69 4.0 9.2 20.4 79.6 66.1 51.6 15.7
Total 2.1 5.9 19.8 80.2 69.7 52.1 27.7

100
NATIONALNUTRITIONSURVEY2010
ANNEX II
1.2
20.5
8.4
70
40
20
60
%
50
10
0
30
55.6
Figure 6.1.1(a): Distribution of breakfast venues frequented by adult Singapore residents (%)
80
0.2
Home /Packed from
home
Workplace /Schoolcanteen
Fast food /Others
Do not eatbreakfast
Restaurant /Coffee house
Hawkercentre / Coffee
shop stall /Food court
14.1
Gender
Males 50.0 0.4 8.4 26.3 1.1 13.8
Females 61.2 0.0 8.3 14.7 1.2 14.5
Ethnic Group
Chinese 54.4 0.2 8.0 24.6 1.4 11.4
Malay 50.9 0.1 11.1 10.4 0.6 26.9
Indian 70.6 0.2 7.1 5.7 0.3 16.2
Age Group (Years)
18-29 46.6 0.0 16.5 9.8 0.9 26.1
30-39 55.1 0.1 10.7 18.6 1.5 14.0
40-49 55.9 0.0 7.1 25.6 0.4 11.0
50-59 58.2 0.7 3.4 29.4 2.5 5.8
60-69 66.8 0.1 2.0 16.3 0.0 14.7
Total 55.6 0.2 8.4 20.5 1.2 14.1
Home / Packed from home
Table 6.1.1(a): Distribution of breakfast venues frequented by adult Singapore residents by gender, ethnic and age (years) groups (%)
Restaurant / Coffee house
Workplace / School canteen
Hawker centre / Coffee shop stall / Food court
Fast food / Others
Do not eat breakfast

101
NATIONALNUTRITIONSURVEY2010NATIONALNUTRITIONSURVEY2010
ANNEX II ANNEX II
0.2
49.9
17.5
70
40
20
60
50
10
0
30 24.8
Figure 6.1.1(b): Distribution of lunch venues frequented by adult Singapore residents (%)
80
3
Home /Packed from
home
Workplace /Schoolcanteen
Fast food /Others
Do not eatlunch
Restaurant /Coffee house
Hawkercentre / Coffee
shop stall /Food court
4.5
Gender
Males 15.4 5.1 19.7 55.8 0.2 3.8
Females 34.2 1.0 15.2 44.1 0.3 5.2
Ethnic Group
Chinese 17.2 3.7 16.2 58.5 0.0 4.4
Malay 42.7 1.0 23.5 24.8 1.5 6.5
Indian 53.7 1.4 18.0 23.9 0.2 2.8
Age Group (Years)
18-29 14.8 1.3 35.7 43.6 0.8 3.7
30-39 20.3 4.1 19.9 51.7 0.2 3.7
40-49 26.6 2.5 11.2 54.1 0.0 5.6
50-59 25.7 0.4 10.8 58.9 0.0 4.2
60-69 45.1 10.0 5.7 33.6 0.0 5.6
Total 24.8 3.0 17.5 49.9 0.2 4.5
Home / Packed from home
Table 6.1.1(b): Distribution of lunch venues frequented by adult Singapore residents, by gender, ethnic and age (years) groups (%)
Restaurant / Coffee house
Workplace / School canteen
Hawker centre / Coffee shop stall / Food court
Fast food / Others
Do not eat lunch
%

102
NATIONALNUTRITIONSURVEY2010
ANNEX II
0.6
28.3
1.7
70
40
20
60
50
10
0
30
65.5
Figure 6.1.1(c): Distribution of dinner venues frequented by adult Singapore residents (%)
80
2.2
Home /Packed from
home
Workplace /Schoolcanteen
Fast food /Others
Do not eatdinner
Restaurant /Coffee house
Hawkercentre / Coffee
shop stall /Food court
1.7
Gender
Males 61.7 2.1 2.3 32.5 0.2 1.2
Females 69.3 2.3 1.2 24.1 1.0 2.1
Ethnic Group
Chinese 59.7 2.6 1.4 34.8 0.6 0.9
Malay 78.8 0.6 3.5 11.1 1.1 4.9
Indian 88.5 1.3 1.2 6.3 0.1 2.5
Age Group (Years)
18-29 54.4 5.4 4.5 33.4 0.9 1.4
30-39 71.3 3.4 1.1 22.3 0.0 1.9
40-49 71.2 1.0 0.7 24.1 0.5 2.4
50-59 58.8 0.4 1.5 37.6 0.8 0.8
60-69 77.1 0.0 0.1 19.8 1.1 1.9
Total 65.5 2.2 1.7 28.3 0.6 1.7
Home / Packed from home
Table 6.1.1(c): Distribution of dinner venues frequented by adult Singapore residents, by gender, ethnic and age (years) groups (%)
Restaurant / Coffee house
Workplace / School canteen
Hawker centre / Coffee shop stall / Food court
Fast food / Others
Do not eat dinner
%

103
NATIONALNUTRITIONSURVEY2010NATIONALNUTRITIONSURVEY2010
ANNEX II ANNEX II
Table 6.1.1.1: Comparison of usual meal venues among adult Singapore residents, 2004 and 2010 (%)
2004 2010
Crude Age-Std (95% CI) Crude Age-Std (95% CI)
Breakfast
Home /Packed from home
58.0 58.7 (55.8, 61.6) 55.6 55.6 (51.9, 59.3) -3.1
Restaurant /Coffee house
0.4 0.4 (0.1,1.0) 0.2 0.2 (0.1, 0.7) -0.2
Workplace /School canteen
13.1 12.8 (11.1, 14.8) 8.4 8.4 (6.8, 10.3)* -4.4
Hawker centre /Coffee shop stall /Food court
21.1 21.0 (18.6, 23.6) 20.5 20.5 (17.5, 23.9) -0.5
Others 0.2 0.2 (0.0, 0.7) 1.2 1.2 (0.7, 2.0) +1.0
Do not eat breakfast 7.2 6.9 (5.7,8.4) 14.1 14.1 (12.1, 16.5)* +7.2
Lunch
Home / Packed from home
27.7 28.9 (26.2, 31.7) 24.8 24.8 (22.1, 27.8) -4.1
Restaurant / Coffee house
1.0 0.9 (0.5, 1.7) 3.0 3.0 (1.3, 6.9) +2.1
Workplace / School canteen
26.2 25.9 (23.5, 28.6) 17.5 17.5 (15.1, 20.1)* -8.4
Hawker centre / Coffee shop stall / Food court
41.9 41.0 (38.1, 44.0) 49.9 49.9 (46.1, 53.8)* +8.9
Others 0.3 0.4 (0.1, 1.0) 0.2 0.2 (0.1, 0.5) -0.2
Do not eat lunch 2.9 2.9 (2.1,4.1) 4.5 4.5 (3.4, 6.0) +1.6
Dinner
Home / Packed from home
73.2 73.6 (70.9, 76.2) 65.5 65.5 (61.6, 69.3)* -8.1
Restaurant / Coffee house
0.3 0.3 (0.1, 0.7) 2.2 2.2 (1.2, 3.9)* +1.9
Workplace / School canteen
4.1 4.1 (3.2, 5.4) 1.7 1.7 (1.1, 2.7)* -2.4
Hawker centre / Coffee shop stall / Food court
21.7 21.3 (19.0, 23.9) 28.3 28.3 (24.7, 32.2)* +7.0
Others 0.1 0.0 (0.0, 0.3) 0.6 0.6 (0.3, 1.4) +0.6
Do not eat dinner 0.6 0.6 (0.4, 1.0) 1.7 1.7 (1.1, 2.5)* +1.1
* Significant differences between 2004 and 2010.
Usual meal venues 2010 vs2004

104
NATIONALNUTRITIONSURVEY2010
ANNEX II
Table 6.1.1.2: Comparison of proportions of adult Singapore residents eating out for lunch and/or dinner, 2004 and 2010 (%)
2004 2010
Crude Age-Std (95% CI) Crude Age-Std (95% CI)
Eating out at hawker centre / coffee shop stall / food court
47.7 46.7 (43.8, 49.7) 56.9 56.9 (53.2, 60.6)* +10.2
Eating out at hawker centre / coffee shop stall / food court / restaurant / coffee house
48.8 47.8 (44.8, 50.8) 60.1 60.1 (56.5, 63.5)* +12.3
* Significant differences between 2004 and 2010.
2010 vs2004

105
NATIONALNUTRITIONSURVEY2010NATIONALNUTRITIONSURVEY2010
ANNEX II ANNEX II
45.1
35.6
19.3
Figure 6.1.2(a): Distribution of frequency of adult Singapore residents dining at hawker centres/coffee shop stalls/food courts (%)
70
40
20
60
50
10
0
30
80
Never or once a week or less 6 times a week or more2-5 times a week
Never or once a weekor less
2-5 times a week 6 times a week or more
Gender
Males 13.8 32.8 53.4
Females 24.7 38.4 36.9
Ethnic Group
Chinese 10.8 34.6 54.6
Malay 38.2 43.1 18.7
Indian 52.9 32.2 14.9
Age Group (Years)
18-29 16.8 46.9 36.3
30-39 18.6 34.1 47.3
40-49 17.3 35.0 47.7
50-59 19.9 22.6 57.5
60-69 27.3 43.4 29.4
Total 19.3 35.6 45.1
Table 6.1.2 (a): Distribution of frequency of adult Singapore residents dining at hawker centres/coffee shop stalls/food courts, by gender, ethnic and age (years) groups (%)
100
90
%

106
NATIONALNUTRITIONSURVEY2010
ANNEX II
0.4
10.0
89.5
Figure 6.1.2(b): Distribution of frequency of adult Singapore residents dining at western fast food restaurants (%)
70
40
20
60
50
10
0
30
80
Never or once a week or less 6 times a week or more2-5 times a week
Never or once a weekor less
2-5 times a week 6 times a week or more
Gender
Males 88.9 10.7 0.4
Females 90.2 9.3 0.5
Ethnic Group
Chinese 90.9 8.7 0.4
Malay 79.3 19.6 1.1
Indian 93.6 6.4 0.0
Age Group (Years)
18-29 71.5 27.8 0.7
30-39 90.0 9.1 0.9
40-49 94.4 5.6 0.0
50-59 96.8 3.2 0.0
60-69 97.6 1.4 1.0
Total 89.5 10.0 0.4
Table 6.1.2(b): Distribution of frequency of adult Singapore residents dining at western fast food restaurants, by gender, ethnic and age (years) groups (%)
100
90
%

107
NATIONALNUTRITIONSURVEY2010NATIONALNUTRITIONSURVEY2010
ANNEX II ANNEX II
Table 6.1.2.1: Comparison of frequency of dining at hawker centres/coffee shop stalls/food courts among adult Singapore residents, 2004 and 2010 (%)
2004 2010
Crude Age-Std (95% CI) Crude Age-Std (95% CI)
Once a week or less (including never)
16.8 17.9 (15.8, 20.2) 19.3 19.3 (17.0, 21.9) +1.4
2-5 times a week 33.9 33.6 (30.8, 36.4) 35.6 35.6 (32.0, 39.4) +2.0
6 times a week or more
49.3 48.6 (45.6, 51.6) 45.1 45.1 (41.3, 49.0) -3.5
2010 vs2004
Table 6.1.2.2: Comparison of frequency of dining at Western fast food restaurants among adult Singapore residents, 2004 and 2010 (%)
2004 2010
Crude Age-Std (95% CI) Crude Age-Std (95% CI)
Once a week or less (including never)
90.0 90.3 (88.6, 91.8) 89.5 89.5 (87.5, 91.2) -0.8
2-5 times a week 9.7 9.4 (7.9, 11.1) 10.0 10.0 (8.4, 12.0) +0.6
6 times a week or more
0.4 0.3 (0.1, 0.7) 0.4 0.4 (0.2, 1.1) +0.1
2010 vs2004
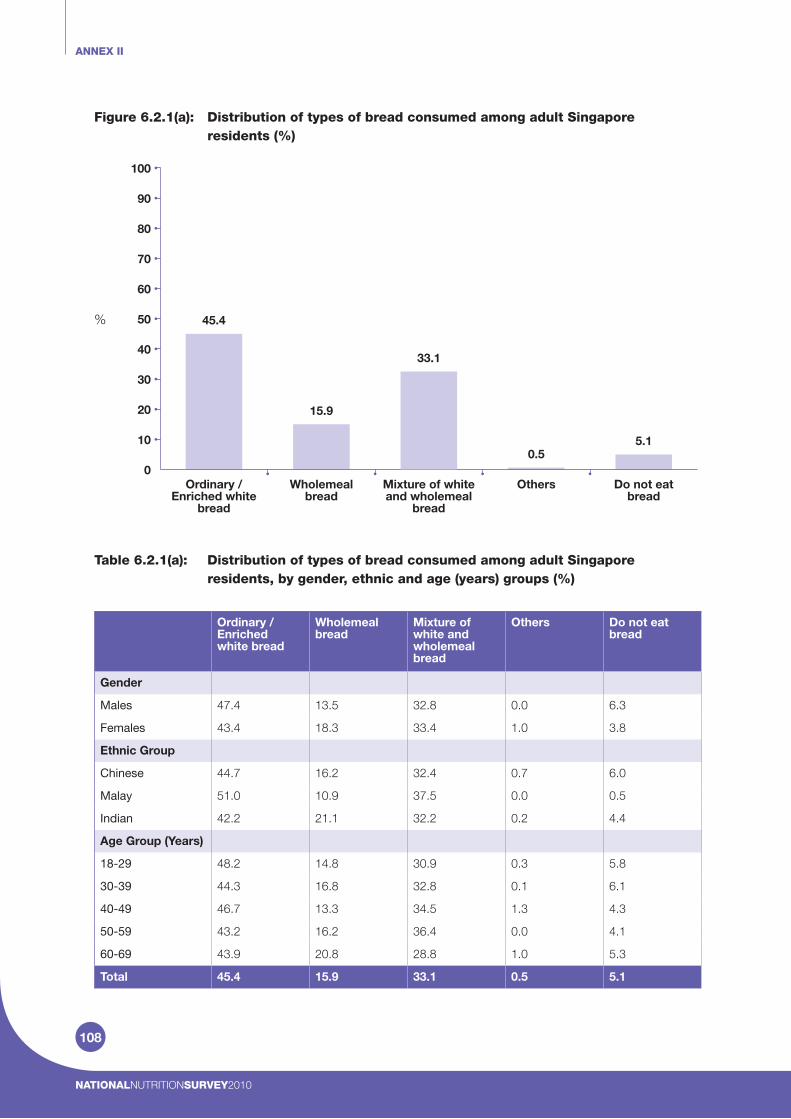
108
NATIONALNUTRITIONSURVEY2010
ANNEX II
5.10.5
15.9
45.4
Figure 6.2.1(a): Distribution of types of bread consumed among adult Singapore residents (%)
70
40
20
60
50
10
0
30
80
Ordinary /Enriched white
bread
Ordinary /Enrichedwhite bread
Wholemealbread
Mixture ofwhite andwholemealbread
Others Do not eatbread
Gender
Males 47.4 13.5 32.8 0.0 6.3
Females 43.4 18.3 33.4 1.0 3.8
Ethnic Group
Chinese 44.7 16.2 32.4 0.7 6.0
Malay 51.0 10.9 37.5 0.0 0.5
Indian 42.2 21.1 32.2 0.2 4.4
Age Group (Years)
18-29 48.2 14.8 30.9 0.3 5.8
30-39 44.3 16.8 32.8 0.1 6.1
40-49 46.7 13.3 34.5 1.3 4.3
50-59 43.2 16.2 36.4 0.0 4.1
60-69 43.9 20.8 28.8 1.0 5.3
Total 45.4 15.9 33.1 0.5 5.1
Table 6.2.1(a): Distribution of types of bread consumed among adult Singapore residents, by gender, ethnic and age (years) groups (%)
100
90
Wholemealbread
Mixture of whiteand wholemeal
bread
Others Do not eatbread
33.1
%

109
NATIONALNUTRITIONSURVEY2010NATIONALNUTRITIONSURVEY2010
ANNEX II ANNEX II
0.6
14.2
4.5
Figure 6.2.1(b): Distribution of types of rice consumed among adult Singapore residents (%)
White rice Brown / red rice Mixture of whiteand brown / red rice
Do not eat rice
Gender
Males 84.3 1.6 14.1 0.0
Females 77.2 7.3 14.4 1.1
Ethnic Group
Chinese 76.2 5.6 17.5 0.7
Malay 95.8 0.9 3.2 0.1
Indian 92.0 1.9 6.1 0.0
Age Group (Years)
18-29 83.4 3.0 11.9 1.7
30-39 81.8 4.7 12.5 1.0
40-49 80.4 4.6 15.0 0.0
50-59 75.8 7.9 16.3 0.0
60-69 84.1 0.1 15.8 0.0
Total 80.7 4.5 14.2 0.6
Table 6.2.1(b): Distribution of types of rice consumed among adult Singapore residents, by gender, ethnic and age (years) groups (%)
80.7
70
40
20
60
50
10
0
30
80
White rice
100
90
Brown / red rice Mixture of whiteand brown / red
rice
Do not eat rice
%
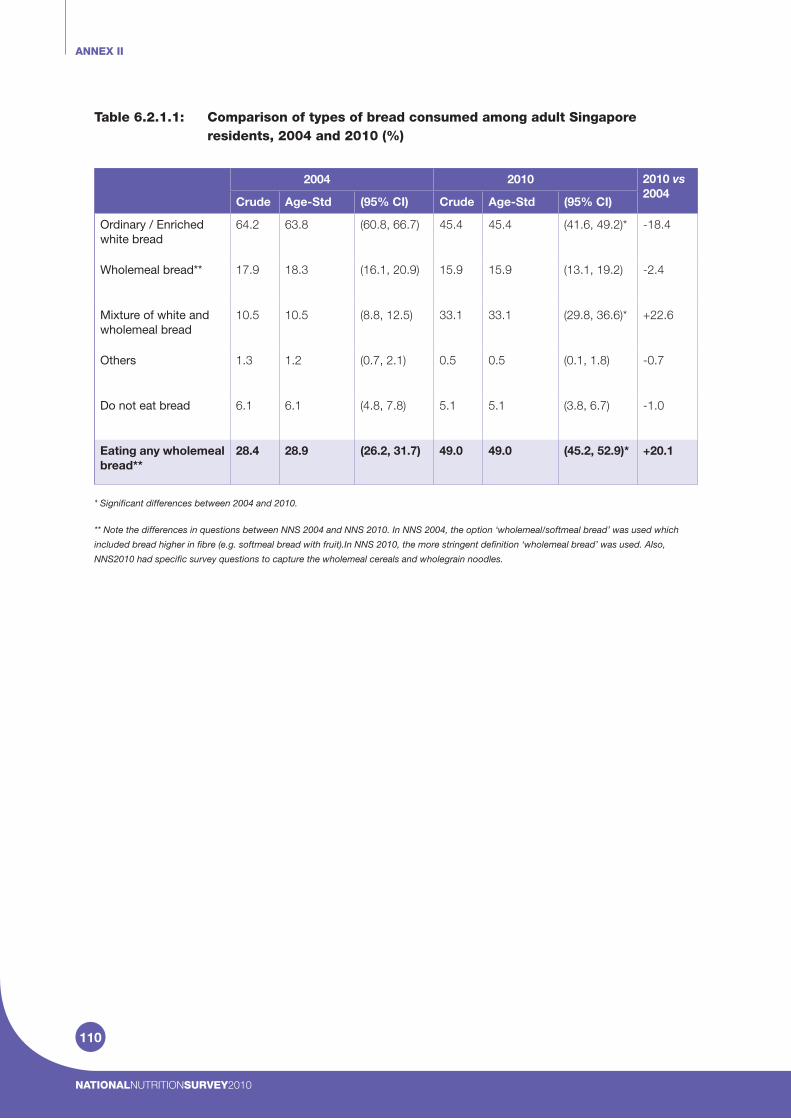
110
NATIONALNUTRITIONSURVEY2010
ANNEX II
Table 6.2.1.1: Comparison of types of bread consumed among adult Singapore residents, 2004 and 2010 (%)
2004 2010
Crude Age-Std (95% CI) Crude Age-Std (95% CI)
Ordinary / Enrichedwhite bread
64.2 63.8 (60.8, 66.7) 45.4 45.4 (41.6, 49.2)* -18.4
Wholemeal bread** 17.9 18.3 (16.1, 20.9) 15.9 15.9 (13.1, 19.2) -2.4
Mixture of white andwholemeal bread
10.5 10.5 (8.8, 12.5) 33.1 33.1 (29.8, 36.6)* +22.6
Others 1.3 1.2 (0.7, 2.1) 0.5 0.5 (0.1, 1.8) -0.7
Do not eat bread 6.1 6.1 (4.8, 7.8) 5.1 5.1 (3.8, 6.7) -1.0
Eating any wholemeal bread**
28.4 28.9 (26.2, 31.7) 49.0 49.0 (45.2, 52.9)* +20.1
* Significant differences between 2004 and 2010.
** Note the differences in questions between NNS 2004 and NNS 2010. In NNS 2004, the option ‘wholemeal/softmeal bread’ was used which
included bread higher in fibre (e.g. softmeal bread with fruit).In NNS 2010, the more stringent definition ‘wholemeal bread’ was used. Also,
NNS2010 had specific survey questions to capture the wholemeal cereals and wholegrain noodles.
2010 vs2004

111
NATIONALNUTRITIONSURVEY2010NATIONALNUTRITIONSURVEY2010
ANNEX II ANNEX II
7.7
32.432.9
0.4
Figure 6.2.2: Distribution of types of oil used for cooking at home among adult Singapore residents (%)
70
40
20
60
50
10
0
30
80
Animal Fat
Animal Fat Blended oil Polyunsaturated Oil
Monounsaturated Oil
Do not cook at home at all
Gender
Males 0.4 35.5 24.5 30.1 9.5
Females 0.3 30.3 28.7 34.7 5.9
Ethnic Group
Chinese 0.4 29.4 25.1 35.4 9.7
Malay 0.5 57.8 22.0 18.1 1.6
Indian 0.2 23.8 43.1 31.2 1.7
Age Group (Years)
18-29 0.5 36.5 27.1 27.7 8.3
30-39 0.0 28.7 29.3 32.6 9.4
40-49 0.5 34.1 30.8 28.7 5.9
50-59 0.3 29.8 22.2 39.5 8.2
60-69 0.7 37.2 21.8 34.4 5.8
Total 0.4 32.9 26.6 32.4 7.7
Table 6.2.2: Distribution of types of oil used for cooking at home among adult Singapore residents, by gender, ethnic and age (years) groups (%)
100
90
Blended oil PolyunsaturatedOil
MonounsaturatedOil
Do not cookat home at all
26.6
%

112
NATIONALNUTRITIONSURVEY2010
ANNEX II
Table 6.2.2.1: Comparison of types of oil used for cooking at home among adult Singapore residents, 2004 and 2010 (%)
2004 2010
Crude Age-Std (95% CI) Crude Age-Std (95% CI)
Animal Fat 0.1 0.1 (0.0, 0.6) 0.4 0.4 (0.2, 1.0) +0.3
Blended oil 42.7 42.7 (39.8, 45.7) 32.9 32.9 (29.4, 36.7)* -9.8
Polyunsaturated oil 31.4 31.3 (28.7, 34.2) 26.6 26.6 (23.7, 29.8) -4.7
Monounsaturated oil 19.0 19.2 (16.9, 21.8) 32.4 32.4 (28.8, 36.3)* +13.2
Do not cook at homeat all
6.7 6.6 (5.3, 8.3) 7.7 7.7 (6.0, 9.8) +1.1
* Significant differences between 2004 and 2010.
2010 vs2004

113
NATIONALNUTRITIONSURVEY2010NATIONALNUTRITIONSURVEY2010
ANNEX II ANNEX II
28.6
13.5
1.4
28.0
Figure 6.2.3: Distribution of types of fat spread used among adult Singapore residents (%)
70
40
20
60
50
10
0
30
80
Butter
Butter Hard margarine
Soft margarine Others Do not use fat spread at all
Gender
Males 32.1 1.9 24.8 13.5 27.8
Females 23.9 0.8 32.2 13.6 29.5
Ethnic Group
Chinese 25.5 1.0 28.4 14.9 30.1
Malay 37.2 3.4 28.0 8.9 22.5
Indian 32.8 0.8 29.9 9.8 26.7
Age Group (Years)
18-29 27.0 1.0 27.0 14.3 30.6
30-39 24.0 1.3 26.4 19.7 28.7
40-49 25.2 2.4 30.6 11.1 30.7
50-59 34.3 1.0 31.5 11.3 21.9
60-69 30.0 0.7 25.2 10.2 33.8
Total 28.0 1.4 28.5 13.5 28.6
Table 6.2.3: Distribution of types of fat spread used among adult Singapore residents, by gender, ethnic and age (years) groups (%)
100
90
Hard margarine Soft margarine Others Do not use fat spread at all
28.5
%

114
NATIONALNUTRITIONSURVEY2010
ANNEX II
Table 6.2.3.1: Comparison of types of fat spread used among adult Singapore residents, 2004 and 2010 (%)
2004 2010
Crude Age-Std (95% CI) Crude Age-Std (95% CI)
Butter 13.8 13.8 (11.9, 16.0) 28.0 28.0 (24.4, 31.9)* +14.2
Hard margarine 1.4 1.4 (0.8, 2.3) 1.4 1.4 (0.9, 2.1) +0.0
Soft margarine 46.5 46.4 (43.5, 49.4) 28.5 28.5 (25.3, 31.9)* -17.9
Others 12.9 12.8 (10.9, 15.0) 13.5 13.5 (11.2, 16.3) +0.7
Do not use fat spreadat all
25.5 25.6 (23.1, 28.3) 28.6 28.6 (25.4, 32.1) +3.0
* Significant differences between 2004 and 2010.
2010 vs2004

115
NATIONALNUTRITIONSURVEY2010NATIONALNUTRITIONSURVEY2010
ANNEX II ANNEX II
0.20.1
38.1
14.4
Figure 6.2.4(a): Distribution of types of milk consumed among adult Singapore residents (%)
70
40
20
60
50
10
0
30
80
Full cream
Full cream Low fat Non-fat Sweetened condensed milk
Others Do not drink milk at all
Gender
Males 16.5 36.4 1.6 0.0 0.0 45.5
Females 12.2 39.8 1.9 0.1 0.3 45.6
Ethnic Group
Chinese 13.0 36.1 1.6 0.1 0.2 49.0
Malay 17.1 47.3 1.8 0.0 0.3 33.5
Indian 19.9 39.8 2.4 0.0 0.0 37.8
Age Group (Years)
18-29 18.1 49.7 2.5 0.0 0.0 29.7
30-39 19.1 35.0 2.9 0.0 0.0 43.1
40-49 11.6 36.6 0.7 0.0 0.0 51.0
50-59 8.8 33.1 1.7 0.0 0.7 55.7
60-69 15.2 35.5 0.4 0.5 0.0 48.5
Total 14.4 38.1 1.7 0.1 0.2 45.5
Table 6.2.4(a): Distribution of types of milk consumed among adult Singapore residents, by gender, ethnic and age (years) groups (%)
100
90
Low fat Sweetened condensed
milk
Others Do not drink milk at all
1.7
Non-fat
45.5%

116
NATIONALNUTRITIONSURVEY2010
ANNEX II
16.9
31.4
7.0
16.8
Figure 6.2.4(b): Distribution of types of milk/milk substitutes added to beverages among adult Singapore residents (%)
70
40
20
60
50
10
0
30
80
Full cream
Full cream Low fat Non-fat Sweetened condensed milk
Others (e.g. sweetener, creamer)
Do not addmilk / milk substitutesat all
Gender
Males 20.9 6.1 1.7 36.5 12.7 22.1
Females 12.7 7.9 2.3 26.2 21.1 29.8
Ethnic Group
Chinese 16.7 5.6 1.3 29.7 17.7 28.9
Malay 9.2 4.9 4.1 44.5 17.4 19.8
Indian 27.4 19.6 3.9 25.4 10.3 13.5
Age Group (Years)
18-29 14.7 4.7 4.6 36.1 16.9 23.0
30-39 16.3 8.2 1.5 31.6 13.5 28.9
40-49 19.4 5.1 1.8 31.9 16.6 25.3
50-59 12.7 9.0 1.0 31.2 17.3 28.7
60-69 24.0 8.8 0.5 22.1 22.4 22.3
Total 16.8 7.0 2.0 31.4 16.9 26.0
Table 6.2.4(b): Distribution of types of milk/milk substitutes added to beverages among adult Singapore residents, by gender, ethnic and age (years) groups (%)
100
90
Low fat Sweetened condensed
milk
Others (e.g. sweetener, creamer)
Do not addmilk / milk substitutes
at all
2.0
Non-fat
26.0
%

117
NATIONALNUTRITIONSURVEY2010NATIONALNUTRITIONSURVEY2010
ANNEX II ANNEX II
Table 6.2.4.1: Comparison of types of milk consumed and types of milk added to beverages among adult Singapore residents, 2004 and 2010 (%)
2004 2010
Crude Age-Std (95% CI) Crude Age-Std (95% CI)
Types of milk consumed
Full cream 10.9 10.7 (9.1, 12.5) 14.4 14.4 (11.5, 17.7) +3.7
Low fat 38.1 37.7 (34.9, 40.6) 38.1 38.1 (34.6, 41.8) +0.4
Non-fat 5.0 5.4 (4.1, 7.1) 1.7 1.7 (0.9, 3.3)* -3.7
Sweetenedcondensed milk
0.5 0.6 (0.3, 1.2) 0.1 0.1 (0.0, 0.5) -0.5
Others 0.2 0.2 (0.1, 1.0) 0.2 0.2 (0.0, 0.7) 0.0
Do not drink milk / milk-based drinks at all
45.2 45.5 (42.5, 48.5) 45.5 45.5 (41.8, 49.4) 0.0
Types of milk added to beverages
Full cream 9.0 9.0 (7.5, 10.8) 16.8 16.8 (13.4, 20.8)* +7.8
Low fat 5.8 6.0 (4.7, 7.7) 7.0 7.0 (5.4, 9.0) +1.0
Non-fat 4.4 4.4 (3.3, 5.7) 2.0 2.0 (1.2, 3.3) -2.4
Sweetenedcondensed milk
35.1 35.0 (32.2, 37.8) 31.4 31.4 (28.1, 34.9) -3.6
Others 18.7 18.7 (16.4, 21.2) 16.9 16.9 (14.5, 19.6) -1.8
Do not add milk /milk substitutes at all
26.8 27.0 (24.4, 29.8) 26.0 26.0 (22.9, 29.3) -1.0
* Significant differences between 2004 and 2010.
2010 vs2004

118
NATIONALNUTRITIONSURVEY2010
ANNEX II
38.6
1.6
59.8
Figure 6.2.5: Distribution of types of sweetening agent added to beverages among adult Singapore residents (%)
70
40
20
60
50
10
0
30
80
Sugar Do not add any sweetening agent at all
Artificial sweetener
100
90
Sugar Artificial sweetener Others(e.g. honey)
Do not add any sweetening agent at all
Gender
Males 64.4 1.2 0.1 34.3
Females 55.1 2.0 0.0 42.9
Ethnic Group
Chinese 58.9 0.9 0.0 40.2
Malay 59.1 4.2 0.0 36.7
Indian 66.6 3.3 0.3 29.8
Age Group (Years)
18-29 61.9 1.0 0.0 37.1
30-39 54.2 0.7 0.0 45.0
40-49 59.9 2.6 0.1 37.4
50-59 61.4 2.0 0.0 36.6
60-69 61.9 1.6 0.0 36.5
Total 59.8 1.6 0.0 38.6
Table 6.2.5: Distribution of types of sweetening agent added to beverages among adult Singapore residents, by gender, ethnic and age (years) groups (%)
%

119
NATIONALNUTRITIONSURVEY2010NATIONALNUTRITIONSURVEY2010
ANNEX II ANNEX II
Table 6.2.5.1: Comparison of types of sweetening agent added to beverages among adult Singapore residents, 2004 and 2010 (%)
2004 2010
Crude Age-Std (95% CI) Crude Age-Std (95% CI)
Sugar 52.2 51.9 (49.0, 54.9) 59.8 59.8 (56.1, 63.4)* +7.9
Artificial sweetener 0.8 0.8 (0.4, 1.7) 1.6 1.6 (1.0, 2.5) +0.8
Others 0.3 0.3 (0.1, 1.1) 0.0 0.0 (0.0, 0.2) -0.3
Do not add any sweetening agent at all
46.7 46.9 (44.0, 49.9) 38.6 38.6 (35.1, 42.3)* -8.3
* Significant differences between 2004 and 2010.
2010 vs2004

120
NATIONALNUTRITIONSURVEY2010
ANNEX II
31.2
23.8
45.0
Figure 6.3.1: Distribution of water intake per day among adult Singapore residents (%)
70
40
20
60
50
10
0
30
80
<1.5L (did not meet) >2L1.5L to 2L
100
90
<1.5L (did not meet) 1.5L to 2L >2L
Gender
Males 44.7 22.4 32.9
Females 45.2 25.2 29.5
Ethnic Group
Chinese 44.5 24.9 30.6
Malay 50.0 20.7 29.4
Indian 41.1 20.6 38.3
Age Group (Years)
18-29 40.6 26.6 32.9
30-39 32.8 28.2 39.0
40-49 44.8 21.5 33.7
50-59 53.7 17.6 28.7
60-69 57.3 27.4 15.4
Total 45.0 23.8 31.2
Table 6.3.1: Distribution of water intake per day among adult Singapore residents, by gender, ethnic and age (years) groups (%)
%

121
NATIONALNUTRITIONSURVEY2010NATIONALNUTRITIONSURVEY2010
ANNEX II ANNEX II
Table 6.3.1.1: Comparison of water intake per day among adult Singapore residents, 2004 and 2010 (%)
2004 2010
Crude Age-Std (95% CI) Crude Age-Std (95% CI)
<1.5L (did not meet) 51.7 52.2 (49.2, 55.1) 45.0 45.0 (41.2, 48.9)* -7.2
1.5 to 2L 27.8 27.5 (24.9, 30.2) 23.8 23.8 (20.9, 27.1) -3.7
>2L 20.6 20.4 (18.1, 22.8) 31.2 31.2 (27.9, 34.8)* +10.8
Consuming 1.5L or more
48.3 47.8 (44.9, 50.8) 55.0 55.0 (51.2, 58.9)* +7.2
* Significant differences between 2004 and 2010.
2010 vs2004

122
NATIONALNUTRITIONSURVEY2010
ANNEX II
7.7
26.5
56.2
Figure 6.3.2: Distribution of weekly frequency of deep fried food consumption among adult Singapore residents (%)
9.6
70
40
20
60
50
10
0
30
80
Do not eat deepfried food at all
100
90
≤ 2 times 3-5 times ≥ 6 times
Do not eat deep fried food at all
≤ 2 times 3-5 times ≥ 6 times
Gender
Males 8.6 54.1 28.6 8.7
Females 10.6 58.4 24.4 6.7
Ethnic Group
Chinese 10.3 58.5 25.2 6.1
Malay 5.1 43.9 34.1 16.9
Indian 10.5 57.4 25.5 6.5
Age Group (Years)
18-29 3.3 47.1 38.0 11.5
30-39 5.5 52.0 33.8 8.7
40-49 10.9 59.1 22.1 7.9
50-59 15.3 65.3 16.7 2.7
60-69 14.2 57.2 20.5 8.1
Total 9.6 56.2 26.5 7.7
Table 6.3.2: Distribution of weekly frequency of deep fried food consumption among adult Singapore residents, by gender, ethnic and age (years) groups (%)
%

123
NATIONALNUTRITIONSURVEY2010NATIONALNUTRITIONSURVEY2010
ANNEX II ANNEX II
Table 6.3.2.1: Comparison of weekly frequency of deep fried food consumption among adult Singapore residents, 2004 and 2010 (%)
2004 2010
Crude Age-Std (95% CI) Crude Age-Std (95% CI)
Do not eat deepfried food
14.0 14.6 (12.5, 17.0) 9.6 9.6 (7.6, 11.9)* -5.0
2 times a week or less 48.5 48.4 (45.4, 51.4) 56.2 56.2 (52.5, 60.0)* +7.8
3-5 times a week 28.1 27.7 (25.2, 30.4) 26.5 26.5 (23.2, 30.0) -1.2
6 times a week or more
9.4 9.2 (7.7, 11.0) 7.7 7.7 (6.3, 9.4) -1.5
Consuming deep fried food more than 2 times per week
37.5 37.0 (34.2, 39.8) 34.2 34.2 (30.7, 37.8) -2.8
* Significant differences between 2004 and 2010.
2010 vs2004
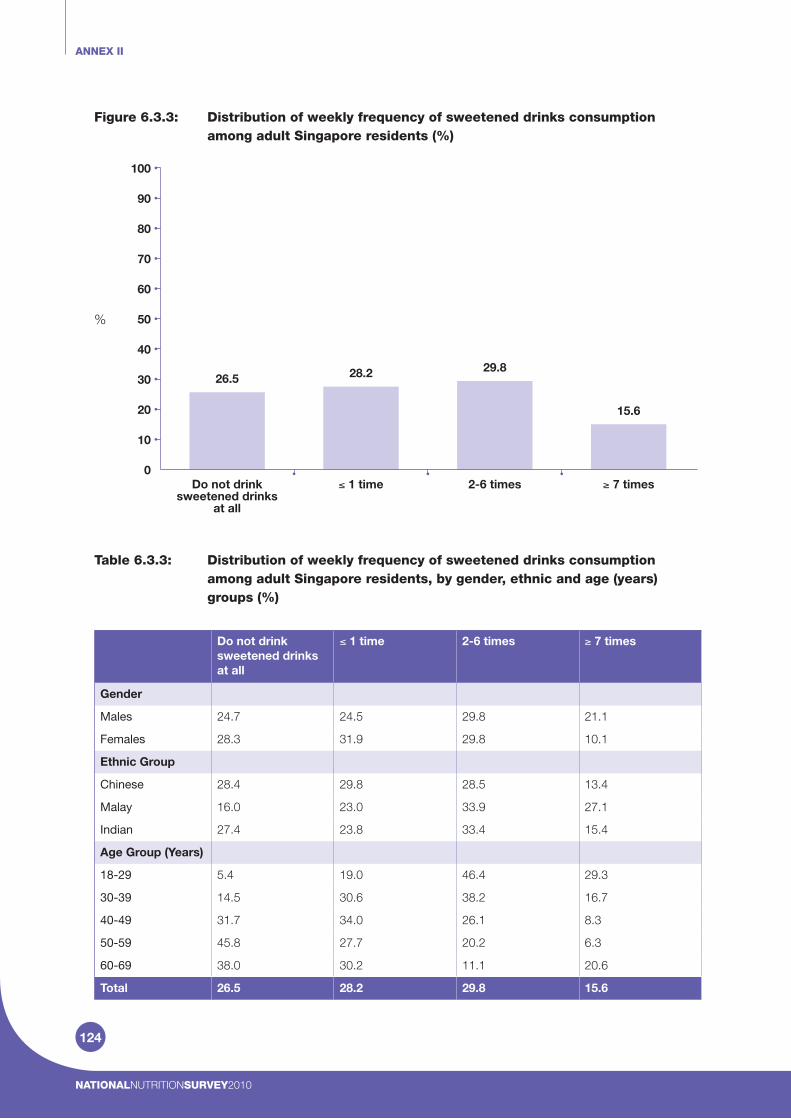
124
NATIONALNUTRITIONSURVEY2010
ANNEX II
15.6
29.828.2
Figure 6.3.3: Distribution of weekly frequency of sweetened drinks consumption among adult Singapore residents (%)
26.5
70
40
20
60
50
10
0
30
80
Do not drink sweetened drinks
at all
100
90
≤ 1 time 2-6 times ≥ 7 times
Do not drink sweetened drinks at all
≤ 1 time 2-6 times ≥ 7 times
Gender
Males 24.7 24.5 29.8 21.1
Females 28.3 31.9 29.8 10.1
Ethnic Group
Chinese 28.4 29.8 28.5 13.4
Malay 16.0 23.0 33.9 27.1
Indian 27.4 23.8 33.4 15.4
Age Group (Years)
18-29 5.4 19.0 46.4 29.3
30-39 14.5 30.6 38.2 16.7
40-49 31.7 34.0 26.1 8.3
50-59 45.8 27.7 20.2 6.3
60-69 38.0 30.2 11.1 20.6
Total 26.5 28.2 29.8 15.6
Table 6.3.3: Distribution of weekly frequency of sweetened drinks consumption among adult Singapore residents, by gender, ethnic and age (years) groups (%)
%

125
NATIONALNUTRITIONSURVEY2010NATIONALNUTRITIONSURVEY2010
ANNEX II ANNEX II
Table 6.3.3.1: Comparison of weekly frequency of sweetened drinks consumption among adult Singapore residents, 2004 and 2010 (%)
2004 2010
Crude Age-Std (95% CI) Crude Age-Std (95% CI)
Do not drink 38.1 39.4 (36.5, 42.4) 26.5 26.5 (22.8, 30.5)* -12.9
Once a week or less 16.1 15.9 (13.8, 18.2) 28.2 28.2 (25.0, 31.6)* +12.3
2-6 times a week 32.3 31.4 (28.8, 34.2) 29.8 29.8 (26.7, 33.0) -1.6
7 times a week or more
13.5 13.3 (11.5, 15.3) 15.6 15.6 (12.8, 18.8) +2.3
Consuming sweetened drinks more than 1 timeper week
45.9 44.7 (41.8, 47.7) 45.4 45.4 (41.6, 49.1) +0.7
* Significant differences between 2004 and 2010.
2010 vs2004

126
NATIONALNUTRITIONSURVEY2010
ANNEX II
8.4
18.7
58.0
Figure 6.3.4: Distribution of weekly frequency of sweet desserts and snacks consumption among adult Singapore residents (%)
14.9
70
40
20
60
50
10
0
30
80
Do not eat sweet desserts and snacks
at all
100
90
≤ 2 times 3-5 times ≥ 6 times
Do not eat sweet desserts and snacks at all
≤ 2 times 3-5 times ≥ 6 times
Gender
Males 13.7 61.7 15.4 9.3
Females 16.1 54.3 22.0 7.6
Ethnic Group
Chinese 14.4 58.3 19.1 8.2
Malay 16.7 55.3 17.3 10.7
Indian 16.0 59.6 17.2 7.1
Age Group (Years)
18-29 6.5 54.1 26.1 13.3
30-39 9.0 59.2 26.7 5.0
40-49 19.0 59.8 15.9 5.2
50-59 17.4 59.5 16.1 7.0
60-69 27.3 56.6 2.1 14.0
Total 14.9 58.0 18.7 8.4
Table 6.3.4: Distribution of weekly frequency of sweet desserts and snacks consumption among adult Singapore residents, by gender, ethnic and age (years) groups (%)
%

127
NATIONALNUTRITIONSURVEY2010NATIONALNUTRITIONSURVEY2010
ANNEX II ANNEX II
Table 6.3.4.1: Comparison by weekly frequency of sweet desserts and snacks consumption among adult Singapore residents, 2004 and 2010 (%)
2004 2010
Crude Age-Std (95% CI) Crude Age-Std (95% CI)
Do not eat sweet desserts and snacks
37.9 38.1 (35.2, 41.1) 14.9 14.9 (12.7, 17.5)* -23.2
Twice a week or less 42.8 42.9 (40.0, 45.9) 58.0 58.0 (54.1, 61.8)* +15.1
3-5 times a week 13.6 13.3 (11.5, 15.4) 18.7 18.7 (16.0, 21.6)* +5.4
6 times a week or more
5.6 5.6 (4.4, 7.1) 8.4 8.4 (5.6, 12.4) +2.8
Consuming sweet desserts and snacks more than 2 times per week
19.3 18.9 (16.8, 21.3) 27.1 27.1 (23.4, 31.1)* +8.2
* Significant differences between 2004 and 2010.
2010 vs2004

128
NATIONALNUTRITIONSURVEY2010
ANNEX II
72.4
19.0
8.6
Figure 6.4.1: Distribution of salt and sauces added at the table among adult Singapore residents (%)
70
40
20
60
50
10
0
30
80
Before tasting the food Do not add salt or saucesat the table
When the food is nottasty enough
100
90
Before tasting the food When the food is not tasty enough
Do not add salt or sauces at the table
Gender
Males 8.8 17.5 73.7
Females 8.4 20.4 71.2
Ethnic Group
Chinese 9.3 19.9 70.9
Malay 6.8 16.9 76.3
Indian 6.1 15.5 78.4
Age Group (Years)
18-29 10.7 24.5 64.9
30-39 8.7 21.3 70.0
40-49 9.3 14.5 76.2
50-59 5.3 18.4 76.3
60-69 9.4 14.9 75.7
Total 8.6 19.0 72.4
Table 6.4.1: Distribution of salt and sauces added at the table among adult Singapore residents, by gender, ethnic and age (years) groups (%)
%
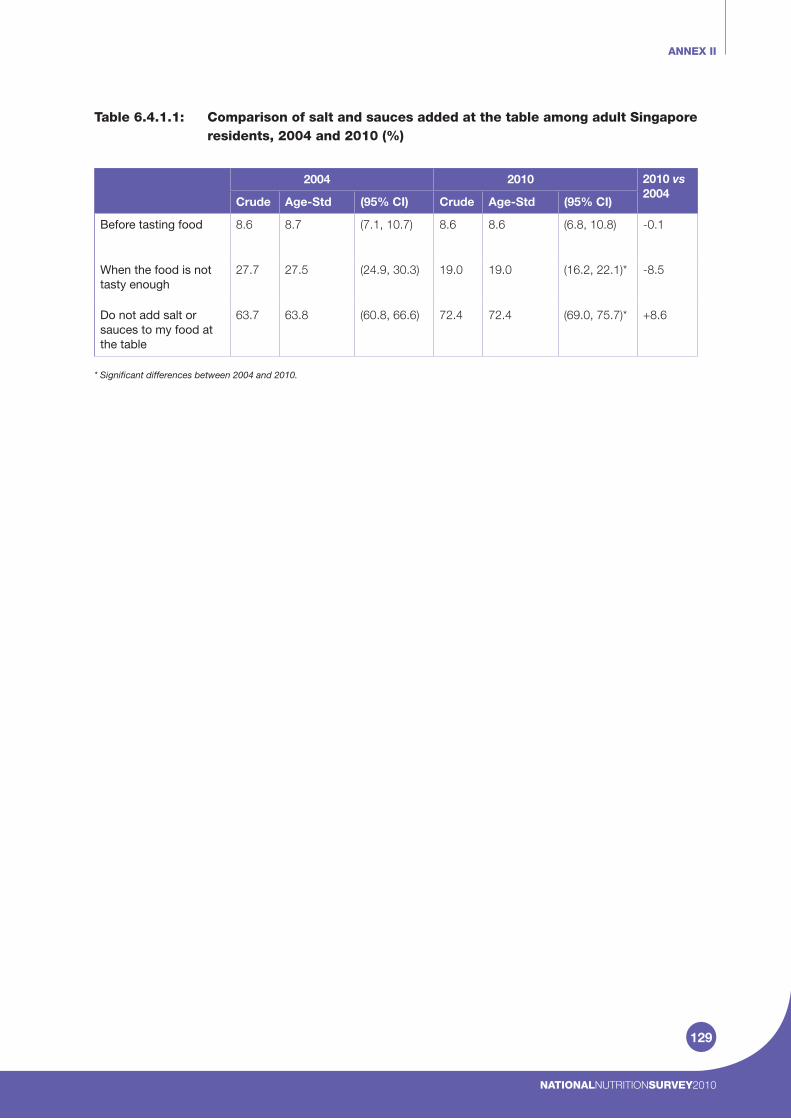
129
NATIONALNUTRITIONSURVEY2010NATIONALNUTRITIONSURVEY2010
ANNEX II ANNEX II
Table 6.4.1.1: Comparison of salt and sauces added at the table among adult Singapore residents, 2004 and 2010 (%)
2004 2010
Crude Age-Std (95% CI) Crude Age-Std (95% CI)
Before tasting food 8.6 8.7 (7.1, 10.7) 8.6 8.6 (6.8, 10.8) -0.1
When the food is not tasty enough
27.7 27.5 (24.9, 30.3) 19.0 19.0 (16.2, 22.1)* -8.5
Do not add salt or sauces to my food at the table
63.7 63.8 (60.8, 66.6) 72.4 72.4 (69.0, 75.7)* +8.6
* Significant differences between 2004 and 2010.
2010 vs2004

130
NATIONALNUTRITIONSURVEY2010
ANNEX II
10.1
20.322.6
Figure 6.4.2(a): Distribution of amount of visible fat trimmed from meat among adult Singapore residents (%)
47.0
70
40
20
60
50
10
0
30
80
All the fat
100
90
Some of the fat None of the fat Do not eat meatat all
All the fat Some of the fat None of the fat Do not eat meat at all
Gender
Males 40.5 26.0 26.2 7.3
Females 53.4 19.3 14.4 12.9
Ethnic Group
Chinese 45.6 25.2 22.3 6.9
Malay 52.1 17.5 18.7 11.7
Indian 49.6 12.0 8.4 30.0
Age Group (Years)
18-29 41.2 28.7 23.0 7.1
30-39 42.4 24.9 20.3 12.4
40-49 52.5 17.3 21.7 8.5
50-59 50.5 18.2 16.9 14.4
60-69 47.8 26.4 19.4 6.5
Total 47.0 22.6 20.3 10.1
Table 6.4.2(a): Distribution of amount of visible fat trimmed from meat among adult Singapore residents, by gender, ethnic and age (years) groups (%)
%

131
NATIONALNUTRITIONSURVEY2010NATIONALNUTRITIONSURVEY2010
ANNEX II ANNEX II
5.3
27.0
19.3
Figure 6.4.2(b): Distribution of amount of skin trimmed from poultry among adult Singapore residents (%)
All the skin Some of the skin None of the skin Do not eat poultry at all
Gender
Males 42.0 19.8 34.9 3.3
Females 54.8 18.7 19.1 7.4
Ethnic Group
Chinese 46.6 21.1 27.8 4.4
Malay 43.7 19.2 34.1 3.0
Indian 67.1 6.7 11.3 14.9
Age Group (Years)
18-29 34.2 29.0 34.8 1.9
30-39 42.9 23.7 27.8 5.6
40-49 51.0 15.0 29.4 4.6
50-59 54.4 15.3 19.4 10.9
60-69 66.6 10.0 21.5 1.9
Total 48.4 19.3 27.0 5.3
Table 6.4.2(b): Distribution of amount of skin trimmed from poultry among adult Singapore residents, by gender, ethnic and age (years) groups (%)
48.4
70
40
20
60
50
10
0
30
80
All the skin
100
90
Some of the skin None of the skin Do not eatpoultry at all
%

132
NATIONALNUTRITIONSURVEY2010
ANNEX II
Table 6.4.2.1: Comparison of amount of visible fat trimmed from meat and skin trimmed from poultry among adult Singapore residents, 2004 and 2010 (%)
2004 2010
Crude Age-Std (95% CI) Crude Age-Std (95% CI)
Amount of fat trimmed from meat
All the fat 47.4 47.5 (44.5, 50.4) 47.0 47.0 (43.2, 50.8) -0.5
Some of the fat 24.3 24.2 (21.7, 26.8) 22.6 22.6 (19.3, 26.4) -1.6
None of the fat 20.5 20.5 (18.2, 23.0) 20.3 20.3 (17.6, 23.3) -0.2
Do not eat meat at all 7.8 7.8 (6.4, 9.5) 10.1 10.1 (8.1, 12.6) +2.3
Amount of skin trimmed from poultry
All the skin 43.4 43.9 (41.0, 46.9) 48.4 48.4 (44.6, 52.3) +4.5
Some of the skin 20.8 20.6 (18.3, 23.1) 19.3 19.3 (16.5, 22.5) -1.3
None of the skin 31.4 31.0 (28.3, 33.8) 27.0 27.0 (24.1, 30.1) -4.0
Do not eat poultryat all
4.4 4.5 (3.5, 5.9) 5.3 5.3 (3.7, 7.6) +0.8
2010 vs2004

133
NATIONALNUTRITIONSURVEY2010NATIONALNUTRITIONSURVEY2010
ANNEX II ANNEX II
73.8
7.43.0
Figure 6.4.3: Distribution of history of dieting for weight loss among adult Singapore residents (%)
Occasionally,in the past
Frequently,in the past
Continually dieting Never dieted
Gender
Males 12.8 1.9 4.2 81.1
Females 18.7 4.1 10.6 66.6
Ethnic Group
Chinese 14.7 2.9 5.7 76.7
Malay 19.6 3.3 15.3 61.7
Indian 17.6 3.5 8.6 70.3
Age Group (Years)
18-29 19.9 6.0 8.9 65.2
30-39 25.6 3.6 6.8 64.1
40-49 15.4 2.0 8.0 74.6
50-59 8.8 1.0 7.9 82.3
60-69 5.3 2.4 3.8 88.4
Total 15.8 3.0 7.4 73.8
Table 6.4.3: Distribution of history of dieting for weight loss among adult Singapore residents, by gender, ethnic and age (years) groups (%)
15.8
70
40
20
60
50
10
0
30
80
Occasionally,in the past
100
90
Frequently,in the past
Continually dieting Never dieted
%

134
NATIONALNUTRITIONSURVEY2010
ANNEX II
Table 6.4.3.1: Comparison of history of dieting for weight loss among adult Singapore residents, 2004 and 2010 (%)
2004 2010
Crude Age-Std (95% CI) Crude Age-Std (95% CI)
Have dieted occasionally, in the past
15.0 14.6 (12.7, 16.7) 15.8 15.8 (13.2, 18.8) +1.2
Have dieted frequently, in the past
4.5 4.4 (3.4, 5.7) 3.0 3.0 (2.0, 4.4) -1.4
Continually dieting to lose weight
7.7 7.7 (6.3, 9.4) 7.4 7.4 (5.8, 9.4) -0.3
Never dieted 72.8 73.3 (70.7, 75.8) 73.8 73.8 (70.5, 77.0) +0.5
2010 vs2004

135
NATIONALNUTRITIONSURVEY2010NATIONALNUTRITIONSURVEY2010
ANNEX II ANNEX III
dietary practices questionnaire (DPQ)
For Official Use Only
Respondent ID:
Age:
Race: C / M / I Gender: M / F
Interviewer ID:
Coder ID:
Name:
Interviewed:
Coded:
Reviewed:
Health Promotion BoardSingapore

136
NATIONALNUTRITIONSURVEY2010
ANNEX III
Please circle ONE most appropriate answer
1. Where do you USUALLY eat breakfast?
1 Home
2 Packed from home
3 Restaurant / coffee house
4 Workplace / polytechnic/ university canteen
5 School / JC canteen
6 Hawker centre / coffee shop stall / food court
7 Fast food restaurant
8 Others(pleasespecify )
9 Do not eat breakfast at all
2. Where do you USUALLY eat lunch?
1 Home
2 Packed from home
3 Restaurant / coffee house
4 Workplace / polytechnic/ university canteen
5 School / JC canteen
6 Hawker centre / coffee shop stall / food court
7 Fast food restaurant
8 Others(pleasespecify )
9 Do not eat lunch at all
3. Where do you USUALLY eat dinner?
1 Home
2 Packed from home
3 Restaurant / coffee house
4 Workplace / polytechnic/ university canteen
5 School / JC canteen
6 Hawker centre / coffee shop stall / food court
7 Fast food restaurant
8 Others(pleasespecify )
9 Do not eat dinner at all
4. How often do you eat at hawker centres, food courts or coffee shops?
per week
5. How often do you eat at western fast food restaurants (e.g. KFC, McDonald’s,
Burger King, etc.)?
per week

137
NATIONALNUTRITIONSURVEY2010NATIONALNUTRITIONSURVEY2010
ANNEX III ANNEX III
6. What type of bread or bread roll do you USUALLY eat?
1 White bread (ordinary/enriched)
2 Wholemeal bread
3 A mixture of white and wholemeal bread
4 Others(pleasespecify )
9 Do not eat bread or bread roll at all
7. What type of rice do you USUALLY eat?
1. White rice
2. Brown or red rice
3. Mixture of white and brown or red rice
4. Others(pleasespecify )
9. Do not eat rice at all
8. What kind of fat spread do you USUALLY use on bread or crackers?
1 Butter
2 Hard margarine (does not require refrigeration)
(please state brand )
3 Soft margarine (requires refrigeration)
(please state brand )
4 Others(pleasespecify )
9 Do not use fat spread at all
9. What types of milk or milk-based drinks (e.g. hot chocolate) do you USUALLY drink?
1 Whole milk/full cream
2 Low fat
3 Skimmed/non-fat
4 Sweetened condensed milk
5 Others(pleasespecify )
9 Do not drink milk or milk-based drinks at all
10. What types of milk/milk substitutes do you USUALLY add to tea, coffee or other beverages?
1 Whole milk/full cream
2 Low fat
3 Skimmed/non-fat
4 Sweetened condensed milk
5 Creamer
6 Others(pleasespecify )
9 Do not add milk/milk substitutes at all

138
NATIONALNUTRITIONSURVEY2010
ANNEX III
11. What type of sweetening agent do you USUALLY add to tea, coffee or other beverages?
1 Sugar
2 Artificial sweeteners e.g. NutraSweet/Equal/Saccharin-based syrups
3 Others(pleasespecify )
9 Do not add any sweetening agent at all
12. How many eggs (including salted or century egg) do you USUALLY eat per week?
number
13. Excluding juices, how many servings of fruit do you USUALLY eat?
(Use showcard & explain what constitutes 1 serving)
Daily ➜ How many servings a day?
Weekly ➜ How many servings a week?
Monthly ➜ How many servings a month?
Less than one serving a month (e.g. once every two months, almost never)
14. How many servings of fruit juices do you USUALLY drink?
(Use showcard & explain what constitutes 1 serving)
Daily ➜ How many servings a day?
Weekly ➜ How many servings a week?
Monthly ➜ How many servings a month?
Less than one serving a month (e.g. once every two months, almost never)
15. How many servings of vegetables do you USUALLY eat?
(Use showcard & explain what constitutes 1 serving)
Daily ➜ How many servings a day?
Weekly ➜ How many servings a week?
Monthly ➜ How many servings a month?
Less than one serving a month (e.g. once every two months, almost never)
16. How often do you drink sweetened drinks? (e.g. soft drinks, fruit drinks, packet drinks, cordials, yoghurt-based drinks and cultured milk drinks, etc.)
per week
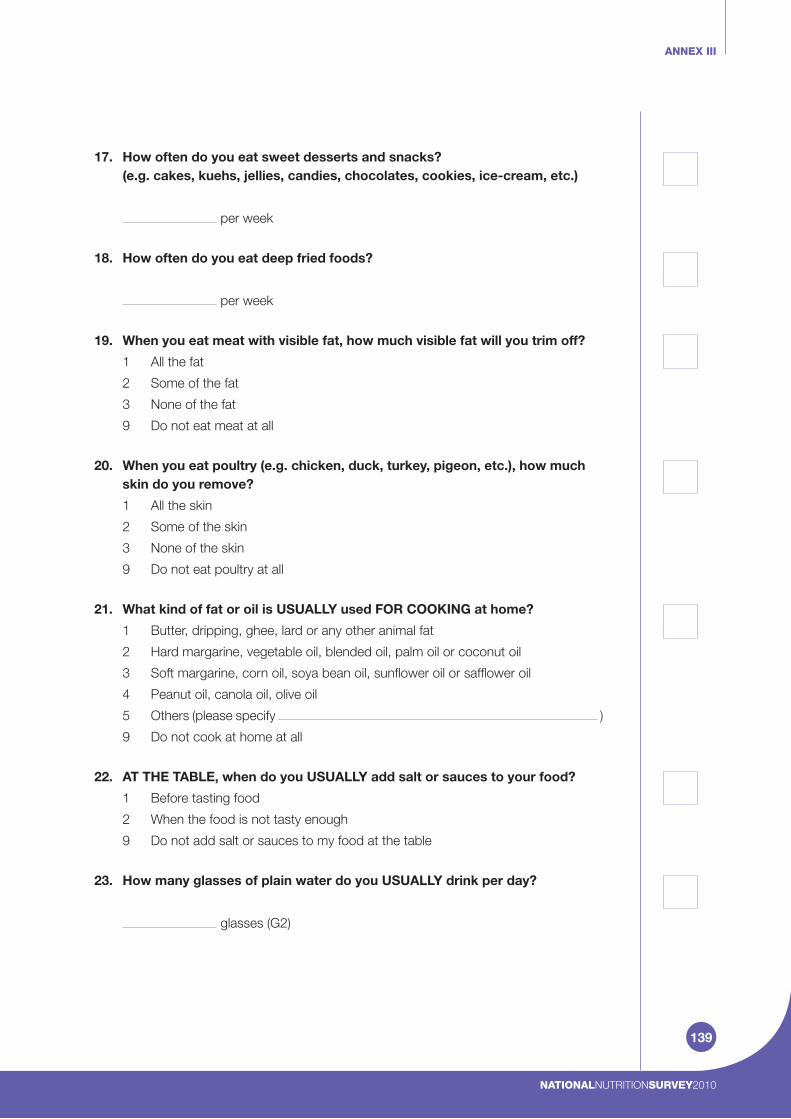
139
NATIONALNUTRITIONSURVEY2010NATIONALNUTRITIONSURVEY2010
ANNEX III ANNEX III
17. How often do you eat sweet desserts and snacks? (e.g. cakes, kuehs, jellies, candies, chocolates, cookies, ice-cream, etc.)
per week
18. How often do you eat deep fried foods?
per week
19. When you eat meat with visible fat, how much visible fat will you trim off?
1 All the fat
2 Some of the fat
3 None of the fat
9 Do not eat meat at all
20. When you eat poultry (e.g. chicken, duck, turkey, pigeon, etc.), how much skin do you remove?
1 All the skin
2 Some of the skin
3 None of the skin
9 Do not eat poultry at all
21. What kind of fat or oil is USUALLY used FOR COOKING at home?
1 Butter, dripping, ghee, lard or any other animal fat
2 Hard margarine, vegetable oil, blended oil, palm oil or coconut oil
3 Soft margarine, corn oil, soya bean oil, sunflower oil or safflower oil
4 Peanut oil, canola oil, olive oil
5 Others(pleasespecify )
9 Do not cook at home at all
22. AT THE TABLE, when do you USUALLY add salt or sauces to your food?
1 Before tasting food
2 When the food is not tasty enough
9 Do not add salt or sauces to my food at the table
23. How many glasses of plain water do you USUALLY drink per day?
glasses (G2)

140
NATIONALNUTRITIONSURVEY2010
ANNEX III
24. Have you ever been on a diet to lose weight?
1 Have dieted occasionally, in the past
2 Have dieted frequently, in the past
3 Continually dieting to lose weight
9 Never dieted
25. Do you USUALLY take health supplements?
1 Yes (Go to Q26)
2 No (End of questionnaire)
26. Please state what supplements, how often and how much you take.
Per day Per week Per month
a Multi-vitamins andminerals(e.g. Centrum™)
b Calcium, alone
c Vitamin D, alone
d Calcium combinedwith vitamin D
e Omega-3 fatty acids(fish oil)
f Others (please specify)
Number of times taken(e.g. once a day, 3 times a week)
Quantity takeneach time(e.g. 2 tablets)
How longhave you beentaking thesupplement?

141
NATIONALNUTRITIONSURVEY2010NATIONALNUTRITIONSURVEY2010
ANNEX III ANNEX IV
Food Frequency Questionnaire
Part A
1. Have you changed your diet in the past one month? Yes / No*
2. If yes, why did you do so?
3. What were the changes you made?
* Please delete whichever is not applicable.

142
NATIONALNUTRITIONSURVEY2010
ANNEX IV
Food Frequency Questionnaire
Part B
A. What type of oil/fat do you/your family use for cooking (pan frying, deep frying, stewing)? Choose from the list.
0. Blended vegetable oil (cooking oil)
1. Polyunsaturated oil (corn, soya, sunflower, safflower, grapeseed, flaxseed)
2. Monounsaturated oil (olive, peanut, canola, rice bran, sesame, mustard)
3. Saturated fat (lard, ghee, tallow, hard margarine, butter, shortening, coconut oil, palm oil)
4. Do not pan fry, deep fry or stew.
B. What type of oil/fat do you/your family use for cooking (stir frying)? Choose from list.
0. Blended vegetable oil (cooking oil)
1. Polyunsaturated oil (corn, soya, sunflower, safflower, grapeseed, flaxseed)
2. Monounsaturated oil (olive, peanut, canola, rice bran, sesame, mustard)
3. Saturated fat (lard, ghee, tallow, hard margarine, butter, shortening, coconut oil, palm oil)
4. Do not stir fry
C. What type of oil/fat do you/your family use for baking/roasting? Choose from list.
0. Blended vegetable oil (cooking oil)
1. Polyunsaturated oil (corn, soya, sunflower, safflower, grapeseed, flaxseed)
2. Monounsaturated oil (olive, peanut, canola, rice bran, sesame, mustard)
3. Saturated fat (lard, ghee, tallow, hard margarine, butter, shortening, coconut oil, palm oil)
4. Do not bake or roast
D. What type of milk do you use with your coffee? Choose from the list.
0. Creamer
1. Sweetened condensed milk
2. Evaporated milk
3. Full cream milk/powder
4. Low fat milk/powder
5. Skimmed milk/powder
6. No added milk
7. Whitener
8. Do not drink coffee

143
NATIONALNUTRITIONSURVEY2010NATIONALNUTRITIONSURVEY2010
ANNEX IV ANNEX IV
E. What type of milk do you use with your tea? Choose from the list.
0. Creamer
1. Sweetened condensed milk
2. Evaporated milk
3. Full cream milk/powder
4. Low fat milk/powder
5. Skimmed milk/powder
6. No added milk
7. Whitener
8. Do not drink tea
F. What type of milk do you use with malt beverages? Choose from the list.
0. Creamer
1. Sweetened condensed milk
2. Evaporated milk
3. Full cream milk/powder
4. Low fat milk/powder
5. Skimmed milk/powder
6. No added milk
7. Whitener
8. Do not drink malt beverages
G. Do you usually ask for less sugar/“less sweet” when ordering beverages?
0. No
1. Yes
H. Do you usually ask for less sugar/“less sweet” when ordering desserts?
0. No
1. Yes

144
NATIONALNUTRITIONSURVEY2010
ANNEX IV
Portion
Per day Per week Per month
Bread
1 White bread, including naan 1 slice or 1 piece
2 Wholemeal bread 1 slice or 1 piece
3 Bread with fruits and nuts 1 slice or 1 piece
Bread spreads used
4 Butter 1 tsp (D2)
5 Margarine 1 tsp (D2)
6 Peanut butter 1 tsp (D2)
7 Jams/honey 1 tsp (D2)
8 Kaya 1 tsp (D2)
Other types of breads
9 Roti prata/murtabak 1 piece
10 Chapati/thosai 1 piece
11 French toast/roti telur/roti john 1 piece
12 Bread buns with coconut/curry/meat fillings
1 piece
Cereals
13 Plain/flavoured breakfast cereals 4 dsp (D1)
14 Mixed (with fruit/nuts) breakfast cereals
4 dsp (D1)
4001 You have indicated that you eat breakfast cereals. How often do you have breakfast cereals made from whole-grains?
4 dsp (D1)
3001 Oats/oatmeal (raw) 4 dsp (D1)
Breads and Cereals
For participants who consume breakfast cereals (#13, 14):
How often do you eat the following:
Number of times eaten
Rarely/Never
Food Item

145
NATIONALNUTRITIONSURVEY2010NATIONALNUTRITIONSURVEY2010
ANNEX IV ANNEX IV
Portion
Per day Per week Per month
15 Plain rice 1 B1
4002 You have indicated that you eatplain rice. How often do you have rice prepared using brown orred rice?
1 B1
16 Plain porridge 1 B1
4003 You have indicated that you eat plain porridge. How often do you have porridge prepared using brown or red rice?
1 B1
Flavoured rice/porridge
17 Fried rice 1 B1
18 Chicken/duck rice 1 portion
19 Mui fan 1 portion
20 Nasi briyani 1 portion
21 Nasi lemak 1 portion
22 Claypot rice 1 portion
23 Glutinuous rice 1 portion
24 Flavoured porridge(e.g. chicken, pork, duck, fish)
1 portion
Rice and Porridge
For participants who consume plain rice (#15):
For participants who consume plain porridge (#16):
How often do you eat the following:
Number of times eaten
Rarely/Never
Food Item

146
NATIONALNUTRITIONSURVEY2010
ANNEX IV
Portion
Per day Per week Per month
Soup noodles
25 Fishball/yong tau foo/wanton/prawn/beef/chicken/ fish slice
1 portion
4004 You have indicated that you eat noodles in soup. How often do you have soup noodles prepared using brown rice beehoon?
1 portion
26 Penang laksa 1 portion
Dry noodles
27 Fishball/yong tau foo/wanton/ minced meat & mushrooms/prawn/ beef/chicken
1 portion
Fried noodles
29 Fried kway teow with cockles 1 portion
30 Fried hor fun 1 portion
31 Fried noodles(incl. Hokkien mee,mee goreng)
1 portion
32 Fried beehoon 1 portion
4005 You have indicated that you eat fried beehoon. How often do you have fried beehoon prepared using brown rice beehoon?
1 portion
Noodles in gravy
28 Lor mee/mee rebus 1 portion
33 Laksa lemak 1 portion
34 Mee siam (with coconut milk) 1 portion
Other noodles
35 Instant noodles 1 portion
905 Boiled noodles / spaghetti / pasta (plain)
1 portion
906 Boiled noodles / spaghetti / pasta with tomato sauce
1 portion
907 Boiled noodles / spaghetti / pasta with cream white sauce
1 portion
4006 You have indicated that you eat boiled spaghetti/pasta. How oftendo you have spaghetti/pasta prepared using wholemealspaghetti/pasta?
1 portion
Noodles (rice noodles, wheat noodles, bean noodles, pasta)
For participants who consume soup noodles (#25):
For participants who consume fried beehoon (#32):
For participants who consume boiled spaghetti/pasta:
How often do you eat the following:
Number of times eaten
Rarely/Never
Food Item

147
NATIONALNUTRITIONSURVEY2010NATIONALNUTRITIONSURVEY2010
ANNEX IV ANNEX IV
Portion
Per day Per week Per month
600 Cream soup 1 B2
601 Clear soup/broth 1 B2
Soups
Venue Portion
Per day Per week Per month
36 Stir fried, plain ½ cup
40 Stir fried, with meat/ seafood ½ cup
44 Stir fried in oyster sauce ½ cup
48 Curry/lemak ½ cup
52 Raw/steamed/in soup ----- 1 cup
53 Stir fried, plain ½ cup
57 Stir fried, with meat/ seafood ½ cup
61 Stir fried in oyster sauce ½ cup
65 Stir fried in sambal belacan/dried prawns
½ cup
69 Raw/steamed/in soup ----- 1 cup
70 Stir fried, plain ½ cup
74 Stir fried, with meat/ seafood ½ cup
78 Curry/lemak ½ cup
82 Raw/steamed/in soup ----- 1 cup
Legumes/pulses, e.g. beans, peas
83 Stir fried, plain ½ cup
87 Stir fried in oyster sauce ½ cup
91 Stir fried in sambal belacan ½ cup
95 Dried legumes (e.g.dhal, dried beans) in gravy
½ cup
354 Raw/steamed/boiled ----- ½ cup
Mixed vegetables
99 Stir fried, plain ½ cup
103 Stir fried, with meat/ seafood ½ cup
107 Stir fried in oyster sauce ½ cup
Vegetables and Beancurd
How often do you eat the following:
Number of times eaten
Rarely/Never
Food Item
How often do you eat the following:
Number of times eaten
Rarely/Never
Food Item
Pale green leafy vegetables (cabbage, pak choy, lettuce, beansprouts, cauliflower etc)
Dark green leafy vegetables (spinach, kai lan, chye sim, kangkong, broccoli etc)
Tomatoes, carrots, red/yellow peppers

148
NATIONALNUTRITIONSURVEY2010
ANNEX IV
Venue Portion
Per day Per week Per month
700 Vegetables battered deep- fried(e.g. tempura)
1 serving
111 Curry/lemak ½ cup
115 Raw/steamed/in soup/ Chinese rojak ----- 1 cup or 1 serving
Tofu/beancurd
116 Fried ½ square
120 Steamed/ in soups ----- ½ square
349 Stir fried potatoes 1 cup
121 Curry lemak 1 cup
125 Soups with meat stock ----- 1 cup
126 Stews 1 cup
704 Preserved vegetables(chye sim, olives etc)
----- 1 D1
How often do you eat the following:
Number of times eaten
Rarely/Never
Food Item
Roots/stems (potatoes, sweet potatoes, corn etc)
Salad dressings
Portion
Per day Per week Per month
130 Creamy dressing – regular (thousand island, mayonnaise, salad cream etc)
2 dsp (D1)
131 Creamy dressing – light/low fat 2 dsp (D1)
132 Oil-based dressing 2 dsp (D1)
How often do you have the following:
Number of times eaten
Rarely/Never
Food Item

149
NATIONALNUTRITIONSURVEY2010NATIONALNUTRITIONSURVEY2010
ANNEX IV ANNEX IV
Fruits
Portion
Per day Per week Per month
133 Orange/red/yellow fresh fruits 1 serving*
134 Other fresh fruits 1 serving*
3002 Fresh fruit juice 1 cup
135 Bananas 1 medium*
136 Durians 5 seeds
137 Canned fruits ½ cup (M1)
800 Mixed fruits (dried) 1 serving*
How often do you eat the following:
Number of times eaten
Rarely/Never
Food Item
Venue Portion
Per day Per week Per month
Poultry - without skin
138 Stir fried 1 serving
142 Pan/deep fried 1 serving
146 Coconut curry 1 serving
150 Curry without coconut 1 serving
154 Stew/braised/roasted 1 serving
158 Steamed ----- 1 serving
Poultry - with skin
159 Stir fried 1 serving
163 Pan/deep fried 1 serving
167 Coconut curry 1 serving
171 Curry without coconut 1 serving
175 Stew/braised/roasted 1 serving
179 Steamed ----- 1 serving
Poultry
How often do you eat the following:
Number of times eaten
Rarely/Never
Food Item

150
NATIONALNUTRITIONSURVEY2010
ANNEX IV
Venue Portion
Per day Per week Per month
Meat - lean
180 Stir fried 1 serving
184 Pan/deep fried 1 serving
188 Coconut curry/rendang 1 serving
192 Curry without coconut 1 serving
196 Stewed/braised 1 serving
200 Roast/grilled/BBQ 1 serving
204 Steamed/soup ----- 1 serving
Meat - lean and fat
205 Stir fried 1 serving
209 Pan/deep fried 1 serving
213 Coconut curry/rendang 1 serving
217 Curry without coconut 1 serving
221 Stewed/braised 1 serving
225 Roast/grilled/BBQ 1 serving
229 Steamed/soup ----- 1 serving
Meat – preserved/cured
230 Sausages One
231 Ham 1 slice
232 Bacon 1 slice
233 Canned (e.g. luncheon meat,corned beef)
Size of 4 square of chocolate
234 Liver and other innards Size of 4 square of chocolate
Meat
How often do you eat the following:
Number of times eaten
Rarely/Never
Food Item

151
NATIONALNUTRITIONSURVEY2010NATIONALNUTRITIONSURVEY2010
ANNEX IV ANNEX IV
Venue Portion
Per day Per week Per month
Fish
3003 Raw (e.g. sashimi) ----- 1 serving
235 Stir fried/pan fried/deep fried 1 serving
239 Deep fried with batter 1 serving
243 Steamed 1 serving
247 Assam pedas 1 serving
251 Coconut curry 1 serving
255 Curry without coconut 1 serving
259 Grilled 1 serving
3004 Canned (e.g. tuna) ------ 1 dsp(D1)
Other seafood
263 Stir fried/pan fried/deep fried 1 serving
267 Deep fried with batter 1 serving
271 Steamed 1 serving
275 Assam pedas 1 serving
279 Coconut curry 1 serving
283 Curry without coconut 1 serving
287 Grilled 1 serving
Fish/Seafood
How often do you eat the following:
Number of times eaten
Rarely/Never
Food Item
Venue Portion
Per day Per week Per month
291 Boiled/poached/in soup/steamed ----- 1 egg
292 Fried/scrambled 1 egg
Egg whites, only
751 Boiled/poached/in soup/steamed ----- 1
752 Fried/scrambled 1
Eggs
How often do you eat the following:
Number of times eaten
Rarely/Never
Food Item
Whole eggs (including salted and century eggs)

152
NATIONALNUTRITIONSURVEY2010
ANNEX IV
Portion
Per day Per week Per month
Desserts in soup
296 With coconut milk/cream (e.g. pulot hitam, bubor cha cha)
1B1
297 Without coconut milk (e.g cheng tng, green bean soup, tau suan)
1B1
Kueh kueh - steamed
298 With coconut/coconut milk /coconut cream (e.g kueh sarlat, kueh dadar, putu mayam, idli)
1 piece
299 Without coconut milk (kueh tutu, soon kway)
1 piece
Others
300 Fried snacks (e.g. you tiao, goreng pisang, Indian rojak)
1 piece
301 Dim sum – steamed (e.g chee cheong fun, dumplings, rice dumplings)
1 serving
302 Dim sum – fried/deep fried (e.g. fried carrot cake, wanton, char siew puff)
1 piece
303 Sweet Indian snacks (e.g. burfi, halwa)
1 piece
Desserts/Local Snacks
How often do you eat the following:
Number of times eaten
Rarely/Never
Food Item
Portion
Per day Per week Per month
304 Plain biscuits 2 pieces
305 Cream filled biscuits/shortbread 2 pieces
306 Puff/flaky pastries (croissants, baked curry puffs etc)
1 piece
307 Plain butter cake/fruit cake 1 piece
308 Sponge cakes 1 piece
309 Cream cakes 1 piece
Biscuits, Pastries and Cakes
How often do you eat the following:
Number of times eaten
Rarely/Never
Food Item

153
NATIONALNUTRITIONSURVEY2010NATIONALNUTRITIONSURVEY2010
ANNEX IV ANNEX IV
Fast Foods
Portion
Per day Per week Per month
310 Burgers, with beef or chicken 1 serving
311 Burgers, fish 1 serving
312 French fries 1 small serving
313 Pizza 2 slices
1100 Mashed potato with gravy 1 regular
How often do you eat the following:
Number of times eaten
Rarely/Never
Food Item
Sweetened beverages
Portion
Per day Per week Per month
314 Sweetened beverages (e.g. soft drinks, packet drinks, yoghurt drinks)
1 G2
How often do you have the following:
Number of times eaten
Rarely/Never
Food Item
Nuts
Portion
Per day Per week Per month
All types of nuts
315 Dry roasted ½ M1 or 1 small pkt
316 Fried ½ M1 or 1 small pkt
How often do you eat the following:
Number of times eaten
Rarely/Never
Food Item
Titbits/Snacks
Portion
Per day Per week Per month
317 Fried salty snacks (crisps, prawn crackers, keropok, salted biscuits etc)
1 small packet or equivalent
318 Ice cream 1 scoop
319 Chocolate 4 squares
How often do you eat the following:
Number of times eaten
Rarely/Never
Food Item

154
NATIONALNUTRITIONSURVEY2010
ANNEX IV
Milk Beverages
Portion
Per day Per week Per month
1300 Coffee* 1 M1 –D/2 tsp
1310 Tea* 1 M1 –D/2 tsp
1320 Malt beverages (e.g. hot chocolate, Horlicks®, Milo®, Ovaltine®)
1 M1 –D/2 tsp
How often do you have the following:
Number of times eaten
Rarely/Never
Food Item
Portion
Per day Per week Per month
353 Sugar 1 tsp (D2)
* Assume no sugar added
How often do you have the following:
Number of times eaten
Rarely/Never
Food Item
Milk & Dairy Products
Portion
Per day Per week Per month
Milk ( as a drink)
341 Full cream milk* (fresh, UHT, powder) 1 G2*
342 Low fat milk* (fresh, UHT, powder) 1 G2*
343 Skimmed milk* (fresh, UHT, powder) 1 G2*
Yoghurt
344 Regular 1 G1
345 Low fat (including frozen yoghurt) 1 G1
Cheese
346 Cheese/cheese spread 1 slice/4dsp
347 Low fat cheese 1 slice
* This could be liquid milk or powdered milk made up to the same amount using instructions on tin.
How often do you have the following:
Number of times eaten
Rarely/Never
Food Item
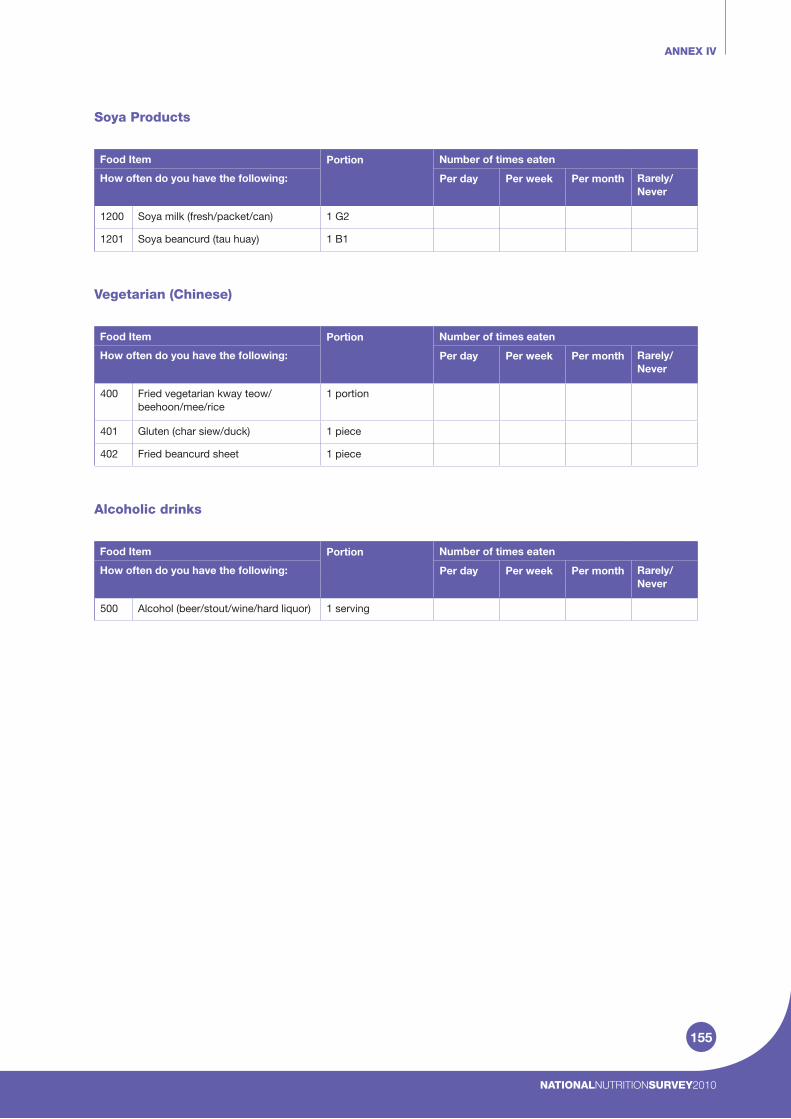
155
NATIONALNUTRITIONSURVEY2010NATIONALNUTRITIONSURVEY2010
ANNEX IV ANNEX IV
Soya Products
Portion
Per day Per week Per month
1200 Soya milk (fresh/packet/can) 1 G2
1201 Soya beancurd (tau huay) 1 B1
How often do you have the following:
Number of times eaten
Rarely/Never
Food Item
Vegetarian (Chinese)
Portion
Per day Per week Per month
400 Fried vegetarian kway teow/beehoon/mee/rice
1 portion
401 Gluten (char siew/duck) 1 piece
402 Fried beancurd sheet 1 piece
How often do you have the following:
Number of times eaten
Rarely/Never
Food Item
Alcoholic drinks
Portion
Per day Per week Per month
500 Alcohol (beer/stout/wine/hard liquor) 1 serving
How often do you have the following:
Number of times eaten
Rarely/Never
Food Item

NOTES

NOTES

NOTES

ISBN 978-981-07-5238-5
Copyright © HPB B E 732-13February 2013