national institute of statistics · national institute of statistics coordinator of publication:...
TRANSCRIPT


NATIONAL INSTITUTE OF STATISTICS Coordinator of publication: Elena Mihaela IAGĂR – Vice-president Coordinators of edition: Silvia PISICĂ – General Director General Department of Demography and Social Statistics Lavinia BĂLTEANU – Director Ruxandra MOLDOVEANU – Deputy Director Department of Indicators on Population and International Migration Authors: Sanda NEDELCU – Expert Monica APOSTOL – Counsellor Bogdan GREABU – Expert Diana POPA – Expert Mirela IONIŢĂ – Expert Department of Indicators on Population and International Migration Sofica MUŞAT – Head of Office Department of Social Statistics Radu Mugur OPREA – Head of Office Department of IT Aplication Projection and Maintenance Statistics Make-up and layout: Bogdan GREABU – Expert Department of Indicators on Population and International Migration Pre-press and printing: General division of IT and Statistical Infrastructure Division of Statistical Publications Editing Coordonators: Gheorghe VAIDA-Muntean – General Director Vitty-Cristian CHIRAN – Director Cover: Alexandru Popescu – Counsellor Photo: Vitty-Cristian CHIRAN – Director Electronic publication on CD-ROM: Elena ISTRATE - Expert Department of Statistical Data Dissemination/ Internet, Intranet and Electronic Publications Team © NIS 2016 Reproducing the content of this publication, complety or partly, in original or modified, as well as its starage in a retrieval system, or trasmitted, in any form and by ony means on forbidden without the written permision of the National Istitute of Statistics. Using the content of this publication with explanatory or justifying title in articles, studies, books is allowed only charly and precisely indicating the source.

Information presented in this paper was obtained from “Household Labour Force Survey” (AMIGO), carried out in 2015. The survey assures the collection of informatin necessary for the evaluation of economically active population and for pointing out the seasonal phenomena taking place on the labour market.
LABOUR FORCE IN ROMANIA EMPLOYMENT AND UNEMPLOYMENT
2015
ISSN 1842-3671ISSN-L 1584-8159

Content 3
Content
I. THE METHODOLOGY AND ORGANIZATION OF THE SURVEY (AMIGO)
1. Survey objectives .............................................................................................................................. 112. Basic concepts - revised definitions ................................................................................................. 113. Survey coverage ............................................................................................................................... 184. Registration method .......................................................................................................................... 185. Reference and registration period .................................................................................................... 186. Sampling plan ................................................................................................................................... 187. Weighting method ............................................................................................................................. 19
II. THE RESULTS OF THE SURVEY (AMIGO)
Synthesis ............................................................................................................................................... 23 1. General characteristics ..................................................................................................................... 252. Economically active population ........................................................................................................ 293. Employment ...................................................................................................................................... 304. Unemployment .................................................................................................................................. 395. Economically inactive population ..................................................................................................... 426. Labour status at regional level ..................................................................................................43
III. TABLES
1. Annual evolutions 1996-20151.1. Population by labour status, by gender and urban/rural area, in the 1996-2015 period .................................................................................................................. 49 1.2. Activity rate of population aged 15 years and over by groups of age, gender
and urban/rural area, in the 1996-2015 period ................................................................51 1.3. Employment rate of population aged 15 years and over by groups of age,
gender and urban/rural area, in the 1996-2015 period ....................................................53 1.4. Unemployment rate by groups of age, gender and urban/rural area in the
1996-2015 period .................................................................................................................. 55
2. Year 20152.1. Main indicators of labour market, by gender and urban/rural area ..................................57 2.2. Population by labour status, gender, urban/rural area and groups of age.......................58 2.3. Population aged 15 years and over by groups of age, gender, urban/rural
area and level of education..............................................................................................60 2.4. Population aged 15 years and over by labour status, gender, urban/rural
area, marital status and groups of age ............................................................................62 2.5. Young population (15-24 years) by labour status, gender, urban/rural area
and groups of age............................................................................................................64

4 Labour force in Romania: Employment and unemployment - 2015
2.6. Young population (15-24 years) by groups of age, gender, urban/rural area and participation in formal education ...............................................................................65
2.7. Elderly population (50 years and over) by labour status, gender, urban/rural area and groups of age....................................................................................................66
2.8. Population aged 15 years and over by groups of age, gender and urban/rural area, by labour status and relationship with labour market .............................................67
2.9. Economically active population by status in employment, gender, urban/rural area and by activities of the national economy................................................................69
2.10. Economically active population by ownership type of workplace, gender, urban/rural area and activities of the national economy ..................................................72
2.11. Economically active population by groups of occupations, gender, urban/rural area and activities of the national economy ..................................................76
2.12. Economically active population by status in employment, gender, urban/rural area and groups of occupations ......................................................................................82
2.13. Economically active population by groups of age, gender, urban/rural area and level of education......................................................................................................85
2.14. Employment by groups of age, gender, urban/rural area and level of education .........................................................................................................................87
2.15. Employment by groups of age, gender, urban/rural area and participation in formal education ..............................................................................................................89
2.16. Employment by groups of age, gender, urban/rural area and activities of the national economy.............................................................................................................90
2.17. Employment by sectors of activity, level of education, gender and urban/rural area..................................................................................................................................93
2.18. Employment by ownership type of workplace, gender, urban/rural area and activities of the national economy....................................................................................95
2.19. Employees by the ownership type of workplace, by gender, urban/rural area and activities of the national economy.............................................................................98
2.20. Employees who carried out shift work, by groups of age, gender, urban/rural area and activities of the national economy...................................................................101
2.21. Employees with labour contract by working regime, gender, urban/rural area, ownership type of workplace, activities of the national economy, groups of occupations and groups of age......................................................................................104
2.22. Employees with other types of labour agreement by working regime, gender, urban/rural area, ownership type of workplace, activity sectors of the national economy, groups of occupations and groups of age .....................................................109
2.23. Employees with permanent working regime by gender, urban/rural area, ownership type of workplace, activities of the national economy, groups of occupations, usual and actual duration of working week...............................................114
2.24. Employees with temporary working regime by gender, urban/rural area, ownership type of workplace, activities of the national economy, groups of occupations, usual and actual duration of working week...............................................116
2.25. Employees with temporary working regime by gender, urban/rural area, period and main reason of being temporarily employed................................................117
2.26. Employment by status in employment, gender, urban/rural area and activities of the national economy.................................................................................................118

Content 5
2.27. Employment by groups of age, gender, urban/rural area and groups of occupations....................................................................................................................121
2.28. Employment by level of education, gender, urban/rural area and groups of occupations....................................................................................................................124 2.29. Employment by status in employment, gender, urban/rural area and groups of occupations................................................................................................................127
2.30. Employment by status in employment, groups of age, gender and urban/rural area................................................................................................................................129
2.31. Employers by activity sectors of the national economy and number of hired employees .....................................................................................................................129
2.32. Employment and employees by working programme, gender, urban/rural area and groups of age..................................................................................................130
2.33. Employment and employees by working programme, gender, urban/rural area and activities of the national economy...................................................................131
2.34. Employment by status in employment, gender, urban/rural area, working programme and usual duration of the working week .....................................................134
2.35. Employment by status in employment, gender, urban/rural area, working programme and actual duration of the working week ...................................................136
2.36. Employment and employees with part-time working programme by activity sectors of the national economy, gender, urban/rural area and usual duration of working week .............................................................................................................139
2.37. Employment and employees with full-time working programme by usual duration of working week, gender, urban/rural area and activities of the national economy...........................................................................................................140
2.38. Employment and employees with full-time working programme by actual
duration of working week, gender, urban/rural area and activities of the national economy ..........................................................................................................146
2.39. Employment and employees with full-time working programme by actual duration of working week, gender, urban/rural area and groups of occupations....................................................................................................................152
2.40. Employed persons whose hours actually worked during the working week were different from the person’s usual hours of work, by groups of age, gender, urban/rural area and reasons ..........................................................................158
2.41. Employed persons whose hours actually worked during the working week were less than the usual hours of work by status in employment, gender, urban/rural area and reasons for reduced activity .........................................................160
2.42. Employed persons whose hours actually worked during the working week were more than the usual hours of work by status in employment, gender, urban/rural area and reasons ........................................................................................161
2.43. Usual average duration of the working week for employment, by status in employment, gender, urban/rural area and activities of the national economy .............162
2.44. Usual average duration of the working week for employment, by status in employment, gender, urban/rural area and groups of occupations ...............................165
2.45. Actual average duration of the working week for employment, by status in employment, gender, urban/rural area and activities of the national economy .............167
2.46. Actual average duration of the working week for employment, by status in employment, gender, urban/rural area and groups of occupation .................................171

6 Labour force in Romania: Employment and unemployment - 2015
2.47. Employment by groups of age, gender, urban/rural area and willingness to work ...............................................................................................................................173
2.48. Employed persons who carried out atypical work in the main activity in the last four weeks by groups of age, gender, urban/rural area, type and frequency of work ..........................................................................................................174
2.49. Employed persons who carried out atypical work in the main activity in the last four weeks by type and frequency of work, by gender, urban/rural area and activities of the national economy...........................................................................176
2.50. Persons having secondary activity, by gender and urban/rural area, by level of education and groups of age .....................................................................................181
2.51. Persons having secondary activity, by working programme, gender, urban/rural area, status in employment, number of actual hours worked in a week, activities of the national economy and groups of occupation of the main activity ...................................................................................................................182
2.52. Persons having secondary activity by gender, urban/rural area, status in employment, number of actual hours worked in a week, activity sectors of the national economy and groups of occupation of the secondary activity..........................184
2.53. Employed persons looking for another job, by gender, urban/rural area, groups of age, level of education, status in employment, working programme and reason for looking for another job. ..........................................................................185
2.54. Employed persons looking for another job, by type of job and working programme sought, by gender, urban/rural area, current working programme and groups of age..........................................................................................................186
2.55. Employed persons looking for another job and available to work, by gender, urban/rural area, groups of age and reasons that would make them to refuse a job ...............................................................................................................................188
2.56. Underemployed workers by gender, urban/rural area, groups of age, status in employment and activity sectors of the national economy.........................................188
2.57. Unemployed by work experience, by gender, urban/rural area and groups of age.................................................................................................................................189
2.58. Unemployed by groups of age, by gender, urban/rural area and level of education .......................................................................................................................190 2.59. Unemployed by groups of age, gender and urban/rural area by participation
in formal education ........................................................................................................192 2.60. Unemployed by groups of age, by gender, urban/rural area by
unemployment duration .................................................................................................193 2.61. Unemployed by work experience, unemployment duration, gender,
urban/rural area and level of education .........................................................................194 2.62. Unemployed by work experience, unemployment duration, gender,
urban/rural area and participation in formal education ..................................................196 2.63. Unemployed by relationship to the head of the household, by gender,
urban/rural area, work experience and duration of unemployment ...............................197 2.64. Unemployed who have previously worked by groups of age, gender,
urban/rural area and the reason for leaving last job ......................................................199 2.65. Unemployed who have previously worked by unemployment duration, by
gender, urban/rural area and the leaving last job .........................................................201

Content 7
2.66. Unemployed who have previously worked by groups of age, gender, urban/rural area and economic activity of the unit in which person last worked ...........................................................................................................................203
2.67. Unemployed who have previously worked by groups of age, gender, urban/rural area and by ownership type of the unit in which person last worked ...........................................................................................................................204
2.68. Unemployed who have previously worked by groups of age, gender, urban/rural area and occupation at the last job .............................................................205
2.69. Unemployed who have previously worked by groups of age, gender, urban/rural area and status in employment in the last job .............................................207
2.70. Unemployed who have previously worked as employees and stopped work in the past 3 years, by the reason for leaving the last job, gender, urban/rural area and economic activity of the unit in which person last worked ..............................208
2.71. Unemployed by groups of age, gender, urban/rural area and type of job and working programme sought ...........................................................................................209
2.72. Unemployed by groups of age, gender, urban/rural area and the reasons that would make them to refuse a job...................................................................................211
2.73. Economically inactive population by inactivity categories, by gender, urban/rural area and groups of age ...............................................................................213
2.74. Economically inactive population aged 15 years and over by groups of age, gender, urban/rural area and level of education ............................................................215
2.75. Economically inactive population aged 15 years and over by groups of age, gender, urban/rural area by participation in formal education .......................................217
2.76. Economically inactive persons aged 15 years and over, who have previously worked, by groups of age, gender, urban/rural area by reason for leaving the last .................................................................................................................................218
2.77. Economically inactive population aged 15 years and over by level of attachment to the labour market, gender, urban/rural area, work experience and groups of age .........................................................................................................220
2.78. Potential additional labour force by gender, urban/rural area and inactivity category ........................................................................................................................222
2.79. Inactive persons not seeking work but available to work by groups of age, gender, urban/rural area and the reasons that would make them to refuse a job .................................................................................................................................223
2.80. Discouraged persons in finding any job, by gender, urban/rural area, discouragement reasons and groups of age .................................................................225
2.81. Population by labour status, macroregions, regions, gender, urban/rural area and groups of age..........................................................................................................226
2.82. Structure of population by labour status, by macroregions, regions, gender, urban/rural area and groups of age ...............................................................................235
2.83. Structure of employment by groups of age, macroregions, regions, gender, urban/rural area and activity sectors of the national economy ......................................245
2.84. Structure of employment by status in employment, by macroregions, regions, gender, urban/rural area and groups of age ..................................................................251
2.85. Structure of employment by groups of age, macroregions, regions, gender, urban/rural area and level of education .........................................................................264

8 Labour force in Romania: Employment and unemployment - 2015
2.86. Activity rate of working age population (15-64 years) by level of education, macroregions, regions, gender and urban/rural area ....................................................277
2.87. Employment rate of working age population (15-64 years) by level of
education, macroregions, regions, gender and urban/rural area...................................279 2.88. Unemployment rate by level of education, macroregions, regions, gender
and urban/rural area ......................................................................................................281

The methodology and organization of survey (AMIGO)
I

The methodology and organization of survey (AMIGO) 11
1. Survey objectives
The situation existent on the labour market in Romania, the evolution of phenomena of employment, unemployment and economically inactivity represent the objectives of “The Households Labour Force Survey (AMIGO)”. Conceived as important source of inter-census information on labour force, the survey provides, in a coherent manner, essential data about all the population segments, with several possibilities of correlation and structuring by various demographic, social and economic characteristics, under the conditions of international comparability. Starting with 1996, the household labour force survey is quarterly carried out, as a continuous research, thus allowing to get short-term data on the size and structure of labour force supply and to point out seasonal phenomena taking place on the labour market. The last regulations of the European Commission have changed the definition of employment and unemployment coverage. For total harmonisation with the European Union principles and methodologies in the field of employment and unemployment statistics, the questionnaires of the AMIGO survey have been redesigned in 2002. In conclusion, beginning with the first quarter 2002, the definitions of the main indicators of employment and unemployment have been revised according to the new European regulations.
2. Basic concepts - reviseddefinitions
Resident population include allpersons (Romanian citizenship, foreign or without citizenship), who have their usual residence in Romania, for a period of at least 12 months.
Working age population, accordingto this survey, includes all the persons aged 15-64 years. In order to assure the comparability, the definition of this population category has used the age limits used at international level.
Ratio of economic dependencerepresents the number of persons not in employment (non-economically active persons or unemployed) per 1000 employed persons.
Economically active populationcomprises all the persons providing the available labour force for the production of goods and services in the reference period, including employment and unemployment. The population categories, by labour status, are broken down by the priority principle of employment as against unemployment and unemployment as against non-economically activity.
Activity rate represents the weight ofactive persons in the age group x in total population of the same age group x.
Employment comprise all thepersons aged 15 years and over who have carried out an economic activity producing goods or services of at least one hour1) in the reference period (one week), in order to get income as salary, payment in kind or other benefits. It was adopted the standard criteria of "at least one hour" recommended by the International Labour Office (ILO) to define the employment in order to ensure the data comparability at international level, as well as from the following considerations:
- including part-time programme, occasional or seasonal activities;
- providing the correlation between the worked time and the production volume;
- defining the unemployment as total lack of work;
- evaluating the underemployment dimensions.
Beginning with 2002, according to European standards and recommendations, there are also included in employment:
- persons with status in employment of employer,self-employed,contributing family worker or member of an agricultural holding or of a co-operative, temporarily absent from work during the reference week, who are sure to return to their job within a period of at most three months, their absence reasons being the following: leave, sick leave, maternity or
1) At least 15 hours for self-employed and contributingfamily workers from agriculture - previously 2011.

12 Labour force in Romania: Employment and unemployment - 2015
paternity leave (in the limit of a period stipulated by the law), parental leave, without pay leave, study leave, labour conflict or strike, disease, temporary disability, training or vocational courses, work temporary ceasing because of meteorological conditions, unfavourable economic conjuncture, shortage of raw materials or energy, technical incidents;
- employees temporarily absent from work who carry on receiving at least 50% of their salary from the employer or who are sure to return to their job within a period of at most three months.
Beginning with 2011, the self-employed and contributing family workers in agriculture are considered employed persons only if they are the owners of the agricultural production (but not necessary the owners of the land) obtained and fulfil one of the following conditions:
a) the agricultural production is, even inpart, for sale or for change in kind (barter);
b) the agricultural production is
exclusively for own consumption, if this represents a substantial1) part of the total household consumption. Are excluded from employment, persons who:
- carry out minor2) agricultural activities, for recreation purpose, hobby or for obtaining, in additional, food, this without being an important part of total household consumption;
- carry out agricultural activities (with a duration of over 10 hours/week), agricultural production being exclusively for the own consumption, but this one do not represents a substantial part of the total household consumption.
Besides persons who have a job or have worked during the reference week, no matter of their status in employment, the following persons are also considered employed:
- persons who during the reference week have carried out a certain work, paid or entailing income, even if they were attending the compulsory school training, were pensioners or
1) At least 50% of the household total consumption.2) Whose duration, in the reference week, does notexceed 10 hours.
received a pension, were registered at the National Agency for Employment, receiving or not the unemployment benefit;
- paid apprentices and trainees, who work with full-time or part-time working programme;
- members of armed forces. Employment rate represents the
weight of employed persons of age group x in total population of the same age group x.
Usual working programme ofemployed persons has been defined as full-time or part-time according to their statement. Generally, for the employees it is considered the "full-time" programme that programme of full-time work, as it is stipulated by the collective labour contract (normal duration) and the "part-time" program whose duration stipulated by the individual labour contract is significantly lower than normal duration.
Underemployed persons areemployed persons who are working part-time and who wish and are available to work more hours than at present.
Usual duration of the working weekis considered the duration of a typical working week, not the duration stipulated by the collective labour contract or other conventions or agreements. This duration also comprises the overtime, if these hours are systematically carried out
ILO3) unemployed are persons aged15-74 years old who in the reference period fulfil the following conditions:
- have no job and do not carry out an activity in order to get income;
- are looking for a job, in the last 4 weeks (including the reference week) using various active methods to find it: having been in contact with the public employment office or with a private agency to find work, applying to the employers directly, taking recruitment test or examination, or being interviewed, taking steps to start an activity on own account, placing or answering job advertisements, studying job advertisements, asking among friends, relatives, colleagues, trade; unions to find work, other
3) According with International Labour Office.

The methodology and organization of survey (AMIGO) 13
methods besides those mentioned above;
- are available to start work in the next two weeks (including the week when the interview is carried out), if they find a job at once.
Also, among the ILO unemployed, there are included:
- persons who usually belong to the non-economically active population, (pupils, students, and pensioners), but who stated that they have looked for a job by means of active methods and are available to start work.
Beginning with 2002, the following persons are also considered unemployed:
- persons with status in employment of employer, self-employed, contributing family worker or member of an agricultural holding or of a co-operative, temporarily absent from work during the reference week, who are not sure to return to their job within a period of at most three months, available to start work and who have actively looked for a job;
- employees absent from work, who did not receive at least 50% of their salary from the employer and are not sure to return to their job in a period of at most three months, available to start work and who have actively looked for a job;
- jobless persons, available to work, who did not look for a job in the last 4 weeks because they have already found it or because they have taken the steps before for an activity on own account and are to start work in less than 3 months.
ILO unemployment rate representsthe ratio of ILO unemployed of age group x in economically active population of age group x.
Long-term unemployment raterepresents the weight of ILO unemployed under unemployment for 12 months and over in economically active population.
Long-term unemployment rate foryoung people (aged 15-24 years) represents the weight of ILO young people unemployed under unemployment for 6 months and over in economically active population.
Incidence of long-term unemployment represents the weight of
long-term unemployed (12 months and over) in total unemployed.
Incidence of long-term unemployment for young people (aged 15-24 years) represents the weight of long- term unemployed (6 months and over) in total young people unemployed.
Weight of young unemployed intotal young people is determined by the ratio of unemployed aged 15-24 years in total population aged 15-24 years.
Registered unemployed are personswho stated that in the reference period were registered at the agencies for employment, no matter if they received or not unemployment benefit. Employed population has been broken down by economic activity, status in employment and occupation in the (main or secondary) job.
The economic activity has been setup considering the following:
- activity of the economic and social unit (autonomous body, commercial company, institution, organisation, association etc.), if the unit has no subunits;
- activity of the subunit (of plant-type, factory, section, computing office, transport base, platform, canteen, enterprise shop etc.), if the interviewees stated such a job;
- main activity of the economic and social unit for senior officials or persons carrying out auxiliary activities (administrative, marketing, consulting, supply - sale, accounting etc.);
- activity determined by the occupation, for persons working on their own account:
- activity of the job for the supported person, for contributing family workers.
The population has been broken down by groups of activities, using the Classification of the Activities in the National Economy (NACE Rev.2).
Status in employment representsthe situation of a person when getting income in the activity carried out, namely:

14 Labour force in Romania: Employment and unemployment - 2015
- Employee4) - is considered that person who carries out his activity based on a labour contract within an economic or social unit - irrespectively of its ownership type - or for private persons, getting a remuneration as salary, in cash or in kind, as commission etc. The “labour contract” comprise also any other kind of labour agreement (in write or verbal form), another than the labour contract / status (job) agreement.
- Employees have been broken down by the working regime, being considered as permanent employee that person with labour contract on an indefinite period of time and temporary employee that person with labour contract on a definite (limited) period.
- Employer - is that person who carries out his occupation (trade) in his own unit (enterprise, agency, workshop, shop, office, farm etc.), for whose activity he has employed one or several employees. This category also includes employers, who are also employees of their own enterprise, as well as holders of management agreements or franchise that use employees.
- Self-employed - is that person who carries out his activity in his own unit or in individual business, hiring no employee, being helped or not by contributing family members. This status also includes independent entrepreneurs (peddlers, coaches, women taking care of children, carters, private taxi-drivers etc.), free-lancers (strolling musicians, fine artists, lawyers), occasional day-workers, holders of management or franchise contracts who do not use employees, individual farmers or those who work in agricultural associations.
- Contributing family worker - is that person who carries out his activity within an economic family unit run by a family member or relative, not receiving remuneration as salary or pay in kind. Such a unit is considered peasant’s (agricultural) household. If
4) Including persons on military service until 2007.
several persons of a household work in their own agricultural household, one of them - generally the household head - is considered self-employed, while the others are considered contributing family workers.
- Member of an agricultural holding or of a non agricultural co-operative - is considered that person who has worked either as owner of agricultural land within an agricultural holding constituted according to the Law 36/1991, or as member of a craftsmen, consumer or credit co-operative.
For employees, the earning fromthe main activity represents the net value of the last monthly earning received before the reference week and include, added to employment wage, also other kind of payments from the wages found, the net profit and other founds constituted at the unit level (prizes award, incentives, commissions extra hours payments, any kind of bonuses equivalent value for meal tickets, etc), tips etc. Based on this variable, are determined the earning intervals which divide the employees series, in breeder order, in 10 groups (deciles or deciles groups).
The population breakdown byoccupation has taken into account the function or trade of economically active persons effectively carried out, the occupation meaning the useful activity, getting income (in cash or in kind) carried out by one person, generally within an economic and social unit
Beginning with 2011, the employmentwas broken down by groups of occupations using the new Classification of Occupations in Romania according to International Standard Classification of Occupations ISCO-08 (COR 2008).
Working at home comprisesprofessional activities carried out totally or partly at the interviewed home; it is performed especially by free-lancers - self-employed, as well as by some employees. In case of employees, “working at home” is meant as a mutual agreement between employee and employer thus some work is regularly carried out at the employee domicile in a regularly way.

The methodology and organization of survey (AMIGO) 15
Atypical work refers to the mainactivity carried out in the evening (starting with 1800hrs), in the night (starting with 2200hrs), on Saturday, on Sunday, as well as the shift work.
Economically inactive populationcomprises, according to this survey, all the persons who have worked no hour and who were not unemployed in the reference period, being in one of the following situations:
- pupils or students; - pensioners (of all the categories); - housekeepers (who carry out only
housing activities in the household); - persons supported by other persons
or by the state or support themselves from other income (rents, interests, etc.).
Beginning with 2002, there are also considered economically inactive persons:
- persons who have declared that in the reference week had a job where they were absent are not sure they return their job in three months period at most and who do not receive at least 50% of salary from the employer, are not available to start work and who have not actively looked for a job.
Economically inactive persons whoare seeking for a job, but are not immediately available to start working are persons aged 15-74 years, neither employed nor in unemployment, who looked for a job, during the 4 weeks previous to the interview, but are not available to start work in the next 2 weeks. This category includes:
- persons who found a job and will start the activity in less than 3 months, but are not available to start work in the next 2 weeks;
- persons who found a job and will start their activity after 3 months or more;
- persons who actively looked for a job in the 4 weeks previous to the interview but were not available to start working in the following two weeks;
- persons who looked for job,
using exclusively passive methods, during the 4 weeks previous to the interview, even if they are available to start working.
Economically inactive personswho are not seeking for a job, but are immediately available to start working are persons aged 15-74 years, neither employed nor in unemployment (economically inactive persons), who wish to work, and are available to start working in the next 2 weeks, but did not look for a job during the 4 weeks previous to the interview.
Potential additional labour forcerepresents the sum of the two categories: „economically inactive persons who are searching for a job, but are not available to start working” and „ economically inactive persons who are not searching for a job, but are available to start working”.
Discouraged persons are economically inactive persons available to work in the next two weeks (including the week when the interview is carried out), who have declared that in the last 4 weeks (including the reference week) they looked for a job using passive methods or do not look for a job,from the following reasons:
- believed there were no vacant jobs or did not know where to look for them;
- are not professionally prepared; - believe that they will not find a job
because of their age; - looked for a job another time and
found nothing.
Educational process includes alllearning activities in order to improve knowledge, qualification and competence, for personal, civic or social purpose and/or related to the career and supposes to take before the decision to learn, for improving knowledge, information, competence, understanding, qualification, behaviour. It is, developed:
- within the national education system (formal education);
- outside the national education system taking part in courses, seminars, conferences, etc. (non-formal education).

16 Labour force in Romania: Employment and unemployment - 2015
The grouping of data by the level ofeducation graduated has been done having in view:
- the level of education graduated, certificated by a diploma or another document which certify the studies completion;
- the correspondence between the levels of education (according to the national legislation) and the levels of education defined according to International StandardClassification of Education ISCED 2011.
In this publication, the data referring to the level of education were grouped in this way:
low (ISCED levels 0-2): no schoolgraduated, primary, gymnasium. In gymnasium level were also included the graduates of short vocational, complementary or apprentices programmes (at most 2 years), if the total number of years of studies (from the beginning of primary education until to the graduation of vocational education) was of at most 10 years;
medium (ISCED levels 3-4): highschool education (inferior or superior cycle), vocational, complementary or apprentices education (longer than 2 years), speciality post-high school or technical foremens education;
superior (ISCED levels 5-8): short-term university (university colleges, sections of sub-engineers / conductor architects of superior education institutions), long-term university (long-term university education, bachelor and master programmes), post-
university, doctoral (Ph.D.) and post-doctoral programmes.
The highest level of educationcompleted by adult persons (25-64 years) points out structure of population aged 25-64 years by level of education graduated: low, medium, high; it is calculated as ratio between population aged 25-64 years of each category, according to level of education and total population of the same age group.
Long-life learning (adult participation in education and training) is determined by ratio between population aged 25-64 years attending a type of education or training in the last four weeks before the interview, for population aged 25-64 years.
Youth education attainment levelrepresents the weight of young people aged 20-24 years, graduates of a type of education or training at educational level at least medium, in total young people aged 20-24 years.
Early school leavers represents ratioof population aged 18-24 with elementary (low) level of education, who do not attend any type of education (formal or non-formal) in the last four weeks before the interview, in total population aged 18-24 years.
The rate young people neither inemployment nor in education or training represents the proportion of young people who neither were in any education or training (formal and non-formal) nor worked, in total number of the young people in the same age group.

The methodology and organization of survey (AMIGO) 17
Population was broken down at territorial level according to the criteria of the Regulation1059/2003 regarding the setting up of a common classification of territorial statistical units and European regulations issued by EUROSTAT corresponding with the Nomenclature of Territorial Units for Statistics (NUTS).
The presented data are for the next levels: national (NUTS0); macroregion (NUTS1); region of development (NUTS2).
The composition of the development macroregions (NUTS1) and the regions (NUTS2) in Romania is the following:
MACROREGIONS / DEVELOPMENT REGIONS / COUNTIES 1. MACROREGION ONE
1.1. REGION NORTH-WEST 1.2. REGION CENTER Bihor AlbaBistriţa-Năsăud Braşov Cluj CovasnaMaramureş HarghitaSatu Mare Mureş Sălaj Sibiu
2. MACROREGION TWO2.1. REGION NORTH-EAST 2.2. REGION SOUTH-EAST
Bacău Brăila Botoşani Buzău Iaşi Constanţa Neamţ Galaţi Suceava TulceaVaslui Vrancea
3. MACROREGION THREE3.1. REGION SOUTH MUNTENIA 3.2. REGION BUCHAREST-ILFOV
Argeş BucharestCălăraşi IlfovDâmboviţaGiurgiuIalomiţaPrahovaTeleorman
4. MACROREGION FOUR4.1. REGION SOUTH-WEST OLTENIA 4.2. REGION WEST
Dolj AradGorj Caraş-Severin Mehedinţi HunedoaraOlt Timiş Vâlcea
18 Labour force in Romania: Employment and unemployment - 2015
3. Survey coverage
The survey covered persons with usual residence in Romania, for a period of at least 12 months, members of the households from the selected dwellings.
Household means the group of two orseveral persons who usually live together, being generally relatives and managing the house in common, entirely or partly taking part in the income getting and spending. The person who does not belong to a household and who declares to live alone and manages the house by himself is considered as a single person household. There are also considered as members of the household those persons absent from home for a longer period of time (even longer than 6 months), living, at the survey time, somewere else in the country or abroad5) if they keep ties with their household, namely: persons under military service, pupils and students left for study, persons left to work, convicts and prisoners, hospitalised persons or those temporarily found in the sanatoria for treatment or recovery. Persons permanently living in collective units (elderly, handicapped, workers hostels, sanatoria etc.) have not been included in this survey.
4. Registration method
Data were collected by means of the face-to-face interview. The information have been registered in the questionnaires of the survey, interviewing the persons aged 15 years and over, at the domicile of the households from the surveyed dwellings.
5. Reference and registrationperiod
The interviews have been uniformly spread over the quarter, the survey being a continuous one. Reference period (for most of the questions) was the week, from Monday to Sunday, before the registration. For certain questions, there are also other reference periods: the last four weeks, the last year, the next two
5) Persons living abroad are considered to be membersof the household only if the duration of stay abroad is shorter than 12 months.
weeks, the last three months of the current year or of the similar period of the previous year.
6. Sampling plan
The survey has been carried out on a random sample of dwellings, representative at national level, using a two-level sampling plan. The representativeness refers both to the household’s structure, and to the population distribution by areas, sex and age groups. The structure differences, occurring because of the situation in the field at the moment of the survey carrying out, are cancelled applying some adjustment proceedings according to the non-response rate by residence areas and depending on the population distribution by areas, sex and age groups, these distributions being obtained from exhaustive sources of demographic research. The sampling plan relied on the building up, in the first level, of the Multifunctional Sample of Territorial Areas (“master” EMZOT sample) comprising 792 research centres (primary sampling units), broken down in all the counties and sectors of Bucharest municipality. EMZOT was carried out based on the data from the Population and Housing Census of March 2011 and will be periodically updated. In order to size the sample in the second level (28512 dwellings/quarter with all the component households), it has been taken into account to get some estimations of the main surveyed characteristics affected by errors in the 3% limit and guaranteed with a 97% probability. The sample is built up based on the dwellings rotation proceeding (“rotational scheme 2-2-2”), having as basic principle the following technique: a dwelling is surveyed for two successive quarters, it is temporarily taken out from the survey in the next two quarters, it is introduced again in the survey in the next two quarters, then it is taken out for good from the survey. Therefore, a dwelling is administered for 6 quarters, being interviewed 4 times. According to the applied scheme, each quarter, there are kept in the sample 50% of the dwellings of previous quarter, 25% of the dwellings surveyed two quarters ago, while the other 25% are totally new dwellings. Thus, it is kept a 50% cover of

The methodology and organization of survey (AMIGO) 19
the samples from one quarter of one year to the same quarter of previous year. Implementing this scheme has aimed at the following:
- reducing the non-response rate and the errors resulting from recurrent surveys (both of the respondents, and of the interviewers);
- avoiding the burden on the same groups of dwellings, keeping them in the survey for longer periods of time;
- balancing the quality requirements for the estimators of the surveyed characteristics at a given moment and in time;
- improving the estimations for the evaluation of the changes in time (from one quarter to another and from one year to another);
- reducing the discontinuities in the time series.
7. Weighting method
For each of the four quarters of 2015 expansion of the survey results at national level was based on the weighting coefficients computed for the persons in the sample who responded to the interview. In order to compute these coefficients quarterly non-response rate was taken into account as well as the distribution of the resident population on gender, urban/rural area and regions at the 1st of January (for quarters I and II) and at the 1st of July (for quarters III and IV). Response rates in year 2015 were: 87.16% in the 1st quarter, 87.49% in the 2nd quarter,
87.79% in the 3rd quarter, 89.08% in the 4th quarter. Weighted annual results were computed as an average of the weighted quarterly results. In order to determine the weighting coefficients, the following stages have been passed: calculation of basic weights:
- basic weight for a dwelling represents the reverse of general probability to include the dwelling in the sample survey;
- all households of a dwelling “borrow” basic weight of that dwelling;
treatment of total non-response:- is carried out by means of
homogeneous response groups method, using as explanatory variables the county and the residence area;
- in this stage, basic weights of respondent households are adjusted with the reverse of the response rate;
adjustment method the sample andcalculation of final weights:
- the adjustment is carried out in order to improve the estimations quality by a final adjustment of the weights in the previous stage;
- the adjustment method used is called calibration. It is performed at level of development region using as variables the population by sex and age group, residence area and total households. Using this method determines the increase of the estimations accuracy.
* * *
The National Institute of Statistics has carried out, by means of the county statistical offices, the practical organisation of this survey and has conducted it in the field.

The results of survey (AMIGO)
II
The information presented in this paper were obtained from the household labour force survey (AMIGO) carried out during year 2015. Yearly data were computed as average of the weighted quarterly results and were estimated based on resident population estimated in conditions of comparability with the Housing and Population Census from 2011, being comparable with series published for the years 2004-2014. The detailed results are presented in the tables of the paper. In order to have an accurate interpretation of various indicators, it should be taken into account the methodological concepts and definitions from the first part of the paper.
Synthesis In 2015, economically active population was of 9159 thousand persons, of which 8535 thousand were employed persons and 624 thousand unemployed *). The employment rate of working age population (15-64 years) was 61.4%, having higher values for men (69.5%, as against 53.2% for women) and close values for the two residence areas (61.7% in rural area and 61.3% in urban area). 24.5% of young people (aged 15-24 years) and 41.1% of elderly people (aged 55-64 years) were employed. The highest level of employment rate for working age persons was registered among graduates of superior level of education (85.3%). As the level of education decreases, the employment rate also decreases. Thus, 64.9% of persons with medium level of education and only 42.6% of those with low level of education were employed. The employment rate for population aged 20-64 years was 66.0%, at a distance of 4.0 percentage points compared to the national target of 70% set in the Context of Europe 2020. Employment rate had higher values for men (74.7% as against 57.2% for women) and for persons in rural area (66.9% as against 65.4% for persons in urban area). The unemployment rate was 6.8%. By gender, the gap between the two rates was 1.7 percentage points (7.5% for men as against 5.8% for women), while by residential area it was 0.4 percentage points (7.0% for urban area as compared to 6.6% for rural area). The unemployment rate had the highest level (21.7%) among young people (aged 15-24 years). The unemployment affects to a greater extent the graduates of medium and low level of education, for which the unemployment rate was 7.2%, respectively 8.1% as compared with the rate registered for unemployed with superior level of education (4.1%). The long-term unemployment rate (unemployed for one year and over) was of 3.0%. The share of persons being under unemployment for one year and over in total unemployment was 43.9%. The long-term unemployment rate registered close values both by gender (43.8% for men as compared to 44.1% for women), and by area (43.3% for persons living in urban and 44.6% for rural area). The long-term unemployment rate for young people (aged 15-24 years) - under unemployment for six months and over - was 13.1% and the incidence of long-term unemployment among youth was 60.6%.
*) Defined according to the International Labour Office criteria.

The results of survery 25
1. General characteristics
In 2015, the main categories of the population by participation in economic activity were as follows:
Figure 1 - Categories of population in 2015
Populaţion aged 15 years and over
Total ------------------------ 16792 thousand % women:------------------------------------- 51.6 % urban:--------------------------------------- 54.6 %15-24 years: ------------------------------- 13.0
Contributing family workersTotal:---------------- 505 thousand% women: ------------------------67.4% urban: --------------------------- 4.8
Employees Total:-------------- 6015 thousand% women: ------------------------43.9% urban: --------------------------70.7%15-24 years:-------------------- 4.9
Employers and self-employedTotal:-------------- 1168 thousand% women: ------------------------27.2% urban: --------------------------23.5
of which
Employment Total: --------------------------- 8535 thousand % women: ------------------------------------- 43.2 % urban: --------------------------------------- 54.6 %15-24 years:----------------------------------6.3
Part time employed population Total: ----------------------------- 847 thousand % women:------------------------------------- 46.2 % urban:--------------------------------------- 13.0 %15-24 years: ------------------------------- 12.1
Full-time employed populationTotal: --------------------------- 7688 thousand % women: ------------------------------------- 42.9 % urban: --------------------------------------- 59.2 %15-24 years:----------------------------------5.6
Unemployed Total: ----------------------------- 624 thousand % women: -------------------------------------36.7 % urban: ---------------------------------------56.2 %15-24 years:--------------------------------23.8
Unemployed with unemployment duration<1 year
Total: ----------------------------- 350 thousand% women:------------------------------------- 36.6% urban: --------------------------------------- 56.7%15-24 years:-------------------------------- 26.6
Long-term unemploymentTotal: ----------------------------- 274 thousand % women: -------------------------------------36.8 % urban: ---------------------------------------55.4 %15-24 years:--------------------------------20.1
Economically inactive populationTotal: ----------------------------7633 thousand % women: ------------------------------------- 62.1 % urban: --------------------------------------- 54.3 %15-24 years:-------------------------------- 19.7
Housewives Total: --------------1339 thousand% women:------------------------ 99.8% urban:-------------------------- 45.4%15-24 years: --------------------9.8
Pensioners and welfare beneficiaries
Total: --------------4511 thousand% women:------------------------ 58.2% urban:-------------------------- 56.6%15-24 years: ---------------------- -
Pupils,studentsTotal:---------------1282 thousand% women:------------------------ 49.9% urban:-------------------------- 59.1%15-24 years: ------------------ 97.1
of
which

26 Labour force in Romania: Employment and unemployment - 2015
In 2015, out of the total population: 53.8% lived in urban areas, 46.1% were economically active persons and 43.0% were employed persons.
The ratio of economic dependency expressed by the number of the persons not in employment (inactive or unemployed) per 1000 employed persons was in 2015 of 1327‰ increasing from the previous year (1313 ‰).
The value of this indicator was higher for women (1753‰, as against 1003‰ for men), and for persons living in rural area (1367‰ as compared to 1293‰ for urban area).
Working age population (13404 thousand persons) represented 67.5% of the total population. Out of them, 61.4% were in employment, 4.7% were unemployed and 33.9% were economically inactive persons.
Out of the total population of the country, 84.6% were persons aged 15 years and over and 54.6% of them were living in urban area. Gender structure of the population aged 15 years and over is characterized by a slight predominance of women (1065 women per 1000 men). Figure 2 represent the age structure of the population of 15 years and over for the main categories of the population: employed persons, unemployed and economically inactive persons.
Figure 2 - Distribution of population aged 15 years and over by labour status, gender and groups of age, in 2015
- thousand persons-
0400800120016002000
Men
65 years >
55-64 years
45-54 years
35-44 years
25-34 years
15-24years
0 400 800 1200 1600 2000
Women
Employed persons Unemployed Economically inactive persons
Population level of education
The distribution of population aged 15 years and over by level of education points out that in 2015, almost half (49.4%) had medium level of education. Persons with low level of education represented 37.5% of the population aged 15 years and over and those with superior level of education held a weight of 13.1%. Women represented the majority of superior education graduates (51.5%) and also those living in urban area (85.7%).
The majority of graduates of medium level of education lived in urban area (61.6%) but, regarding gender distribution the largest share was held by men (53.0%). The population aged 30-34 years with higher education represented 25.6% of the population in he same age group. By gender the values of this indicator were relatively close (27.2% for women and 24.2% for men) but by residence area the difference was significant (37.4% in urban area compared to 8.1% in rural area).

The results of survery 27
Distribution of population aged 25-64 years by the highest level of education graduated points out that in 2015 most of the persons in this age group (57.8%) had medium level of education.
Persons with superior level of education held a weight of 17.2%; by gender, the weights were close (16.4% for men and 17.9% for women). By residence area, significant differences were registered: 25.5% for persons with residence in urban area, as against only 5.7% for persons living in rural area.
Table 1 - Structure of population aged 25-64 years by level of education, gender and urban/rural area, in 2015
Total Men Women Urban Rural
Total persons aged 25-64 years (thousand persons) 11215 5639 5576 6492 4723
Level of the graduated school - in % as against total -
Superior (short-term and long-term university including master, Ph.D., post-Ph.D. and post-university studies) 17.2 16.4 17.9 25.5 5.7
Medium (post high-school of speciality, high-school and vocational, complementary or of apprentices) 57.8 61.2 54.5 60.8 53.8
Low (gymnasium, primary and without education) 25.0 22.4 27.6 13.7 40.5
Young people aged 20-24 years having graduated at least medium education level represented 79.7% of total young people belonging to this age group. By gender, this ratio had close values: 79.3%
in the case of men and 80.2% in the case of women. By residence area, the difference was of 19.4 percentage points in favor of urban area (88.8% compared to 69.4% in rural area).
Participation of population aged 15 years and over in education or training
Out of population aged 15 years and over, in the month before the interview, 8.5% attended a type of education or training within national education system (formal education) or outside of it (non-formal education). By gender the proportion was close: 8.8% for men and 8.3% for women. A higher difference was registered by residence areas: 9.4% for persons with residence in urban area, as against 7.5% for persons with residence in rural area. The participation degree in at least one type of education or training was 1.5% for employed persons, 3.1% for unemployed and 16.9% for economically inactive persons aged 15 years and over.
In 2015, the long-life learning (the percentage of the population aged 25-64 years participating in education or training) was of 1.3%.
Early school leavers (the ratio of population aged 18-24 years with low level of education, who did not attend any type of formal or non-formal education or training in the last four weeks before the interview, in total population aged 18-24 years) was of 19.1% in 2015. This rate had, in 2015, close values by gender (19.5% for men and 18.5% for women), but registered significant difference by residential area (28.5% in rural area to 10.1% in urban area).
The rate of young people (15-24 years) neither in employment nor in education or training was in 2015 18.1%, higher for women (21.4% as against 15.0% for men) and for persons residing in rural area (21.0% as against 15.1% for young people living in urban area).
28 Labour force in Romania: Employment and unemployment - 2015
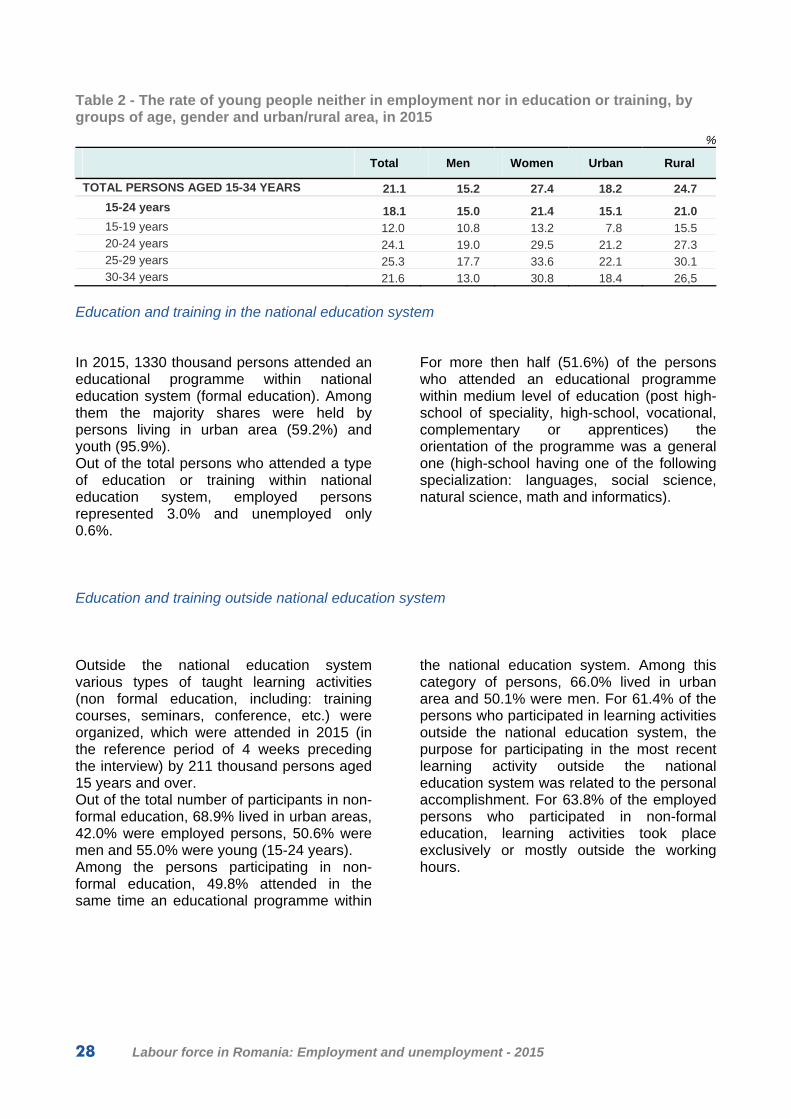
Table 2 - The rate of young people neither in employment nor in education or training, by groups of age, gender and urban/rural area, in 2015
%
Total Men Women Urban Rural
TOTAL PERSONS AGED 15-34 YEARS 21.1 15.2 27.4 18.2 24.7
15-24 years 18.1 15.0 21.4 15.1 21.0 15-19 years 12.0 10.8 13.2 7.8 15.5 20-24 years 24.1 19.0 29.5 21.2 27.3 25-29 years 25.3 17.7 33.6 22.1 30.1 30-34 years 21.6 13.0 30.8 18.4 26,5
Education and training in the national education system
In 2015, 1330 thousand persons attended an educational programme within national education system (formal education). Among them the majority shares were held by persons living in urban area (59.2%) and youth (95.9%). Out of the total persons who attended a type of education or training within national education system, employed persons represented 3.0% and unemployed only 0.6%.
For more then half (51.6%) of the persons who attended an educational programme within medium level of education (post high-school of speciality, high-school, vocational, complementary or apprentices) the orientation of the programme was a general one (high-school having one of the following specialization: languages, social science, natural science, math and informatics).
Education and training outside national education system
Outside the national education system various types of taught learning activities (non formal education, including: training courses, seminars, conference, etc.) were organized, which were attended in 2015 (in the reference period of 4 weeks preceding the interview) by 211 thousand persons aged 15 years and over. Out of the total number of participants in non-formal education, 68.9% lived in urban areas, 42.0% were employed persons, 50.6% were men and 55.0% were young (15-24 years). Among the persons participating in non-formal education, 49.8% attended in the same time an educational programme within
the national education system. Among this category of persons, 66.0% lived in urban area and 50.1% were men. For 61.4% of the persons who participated in learning activities outside the national education system, the purpose for participating in the most recent learning activity outside the national education system was related to the personal accomplishment. For 63.8% of the employed persons who participated in non-formal education, learning activities took place exclusively or mostly outside the working hours.
The results of survery 29
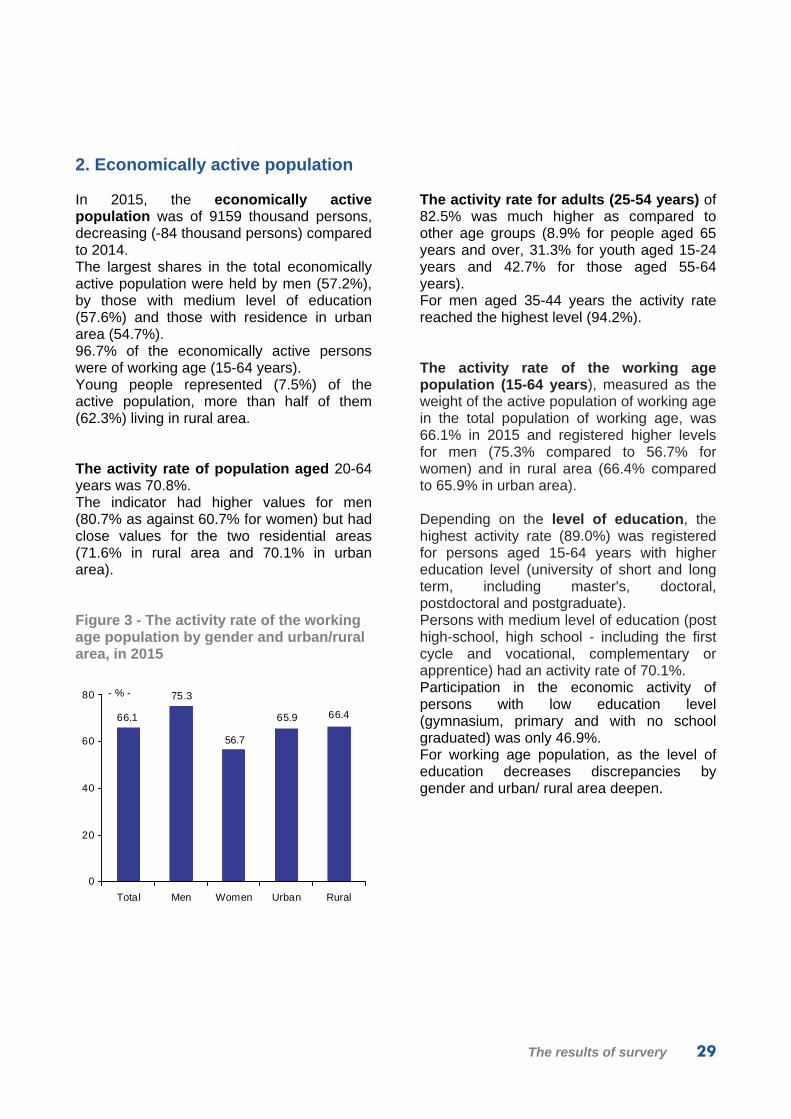
2. Economically active population
In 2015, the economically active population was of 9159 thousand persons, decreasing (-84 thousand persons) compared to 2014. The largest shares in the total economically active population were held by men (57.2%), by those with medium level of education (57.6%) and those with residence in urban area (54.7%). 96.7% of the economically active persons were of working age (15-64 years). Young people represented (7.5%) of the active population, more than half of them (62.3%) living in rural area.
The activity rate of population aged 20-64 years was 70.8%. The indicator had higher values for men (80.7% as against 60.7% for women) but had close values for the two residential areas (71.6% in rural area and 70.1% in urban area).
Figure 3 - The activity rate of the working age population by gender and urban/rural area, in 2015
- % -
66.466.1
75.3
56.7
65.9
0
20
40
60
80
Total Men Women Urban Rural
The activity rate for adults (25-54 years) of 82.5% was much higher as compared to other age groups (8.9% for people aged 65 years and over, 31.3% for youth aged 15-24 years and 42.7% for those aged 55-64 years). For men aged 35-44 years the activity rate reached the highest level (94.2%).
The activity rate of the working age population (15-64 years), measured as the weight of the active population of working age in the total population of working age, was 66.1% in 2015 and registered higher levels for men (75.3% compared to 56.7% for women) and in rural area (66.4% compared to 65.9% in urban area).
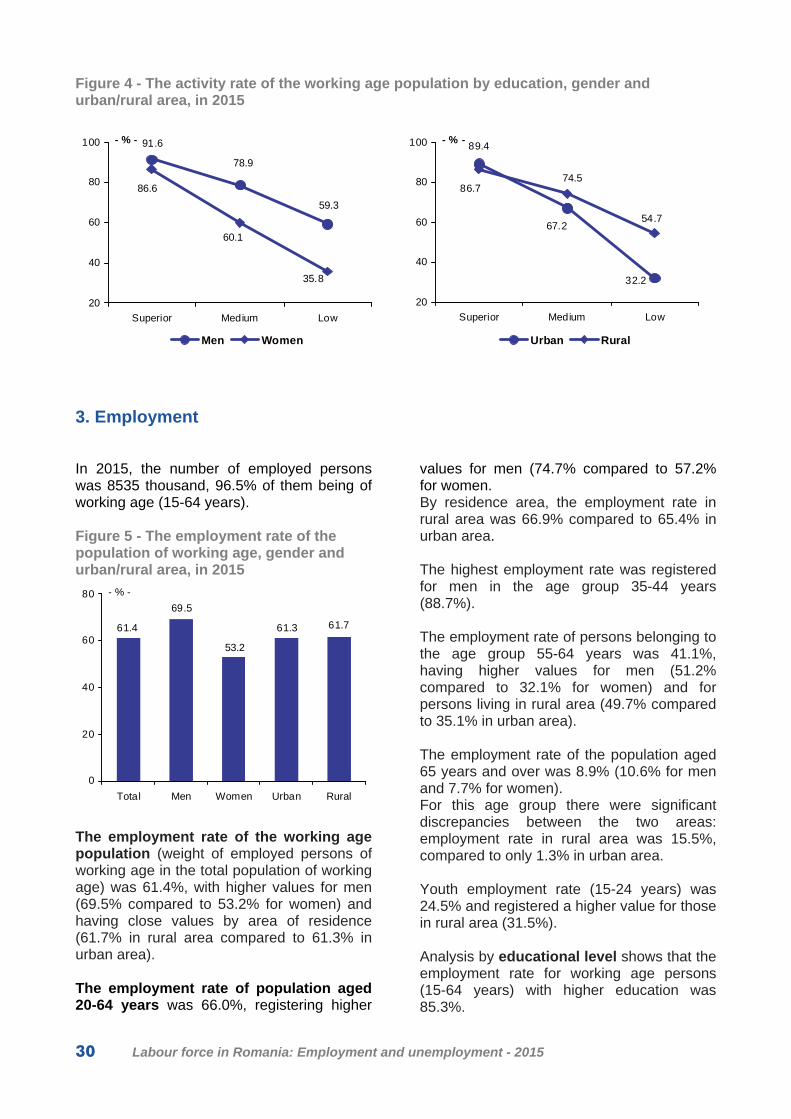
Depending on the level of education, the highest activity rate (89.0%) was registered for persons aged 15-64 years with higher education level (university of short and long term, including master's, doctoral, postdoctoral and postgraduate). Persons with medium level of education (post high-school, high school - including the first cycle and vocational, complementary or apprentice) had an activity rate of 70.1%. Participation in the economic activity of persons with low education level (gymnasium, primary and with no school graduated) was only 46.9%. For working age population, as the level of education decreases discrepancies by gender and urban/ rural area deepen.
30 Labour force in Romania: Employment and unemployment - 2015
Figure 4 - The activity rate of the working age population by education, gender and urban/rural area, in 2015
91.6
78.9
59.3
86.6
60.1
35.8
20
40
60
80
100
Superior Medium Low
- % -
Men Women
89.4
67.2
32.2
86.774.5
54.7
20
40
60
80
100
Superior Medium Low
- % -
Urban Rural
3. Employment
In 2015, the number of employed persons was 8535 thousand, 96.5% of them being of working age (15-64 years).
Figure 5 - The employment rate of the population of working age, gender and urban/rural area, in 2015
- % -
61.761.4
69.5
53.2
61.3
0
20
40
60
80
Total Men Women Urban Rural
The employment rate of the working age population (weight of employed persons of working age in the total population of working age) was 61.4%, with higher values for men (69.5% compared to 53.2% for women) and having close values by area of residence (61.7% in rural area compared to 61.3% in urban area).
The employment rate of population aged 20-64 years was 66.0%, registering higher
values for men (74.7% compared to 57.2% for women. By residence area, the employment rate in rural area was 66.9% compared to 65.4% in urban area.
The highest employment rate was registered for men in the age group 35-44 years (88.7%).
The employment rate of persons belonging to the age group 55-64 years was 41.1%, having higher values for men (51.2% compared to 32.1% for women) and for persons living in rural area (49.7% compared to 35.1% in urban area).
The employment rate of the population aged 65 years and over was 8.9% (10.6% for men and 7.7% for women). For this age group there were significant discrepancies between the two areas: employment rate in rural area was 15.5%, compared to only 1.3% in urban area.
Youth employment rate (15-24 years) was 24.5% and registered a higher value for those in rural area (31.5%).
Analysis by educational level shows that the employment rate for working age persons (15-64 years) with higher education was 85.3%.

The results of survery 31
For higher education graduates, employment rate of men exceeded by 5.2 percentage points that of women’s while by area of residence employment rate of persons in urban area was higher with 3.9 percentage points than for persons living in rural area.
64.9% of persons with medium level of education were employed. In this case important differences were recorded by gender (16.5 percentage points in favor of
men) and by residence areas (6.8 percentage points more for persons in rural area compared to urban area).
Among persons with low education level just 42.6% were employed. For them, the largest discrepancy (23.8 percentage points) was recorded by residence area: in urban area employment rate was 27.1%, compared to 50.9% in rural area.
Table 3 - Employment rate of the working age population by level of education, gender and urban/ rural area, in 2015
Total Men Women Urban Rural
TOTAL 61.4 69.5 53.2 61.3 61.7
Superior (short-term and long-term university including master, Ph.D., post-Ph.D. and post-university studies) 85.3 88.0 82.9 85.9 82.0
Medium (post high-school of specialty, high-school and vocational, complementary or of apprentices) 64.9 72.7 56.2 62.3 69.0
Low (gymnasium, primary and without education) 42.6 53.2 33.2 27.1 50.9
The analysis of the distribution by groups of age of employed persons pointed out that the higher weights were hold by persons in adult age groups: 29.4% of employed persons were aged between 35-44 years, 24.1% were aged 25-34 years and 23.7% were aged 45-54 years.
Young people represented only 6.3% of employment, having a higher percentage in rural area (64.8%). Employed persons in the adult age group (25-54 years) were concentrated (59.1%) in urban area, while, 58.9% of employed
persons 55 years and over, lived in rural area.
The structure by age groups of employed women did not significantly differ from that of employed men.
However, it can be noticed that there are significant differences between the two areas of residence: employed persons aged 25-54 years represented 83.5% of total employment in urban area and 69.5% of the number of employed persons in rural area.

32 Labour force in Romania: Employment and unemployment - 2015
Figure 6 - Employment distribution by gender, urban/rural area and age groups, in 2015
Men
55-64 years
13.5%65 years +
3.0%
15-24 years
6.8%
25-54 years
76.7% Women
55-64 years
12.5%
65 years +
4.2%
15-24 years
5.6%
25-54 years
77.7%
Total
55-64 years
13.0%
65 years +
3.5%
15-24
years
6.3%
25-54
years
77.2%
Urban
55-64
years
12.0%
65 years +
0.4%
15-24 years
4.1%
25-54 years
83.5%Rural
55-64 years
14.3%
65 years +
7.2%
15-24 years
9.0%
25-54 years
69.5%
The distribution of employment by educational level shows that the largest shares were hold by high school graduates (36.9%). The share of persons with higher education was 20.2% (of which 50.6% were
women) and the share of persons with primary education or no education was 3.4% (55.0% of the persons in this category being men).
Figure 7 - Employed population by level of education in 2015
1724
3147
14691620
295280
0
800
1600
2400
3200
University Post high-schoolspeciality or
tehnical foremen
High-school Vocational Gymnasium Primary and noeducation
Th
ou
san
d p
erso
ns

The results of survery 33
Employment distribution by status in employment shows that the share of employees (71.0%) was the highest in total employment.
In 2015, self-employed and contributing family workers represented 27.9% of the total employment, 86.8% of them living in rural area.
Table 4 - Employment distribution by gender and urban/rural area, by status in employment, in 2015
Total Men Women Urban Rural
TOTAL EMPLOYMENT (thousand persons) 8535 4848 3687 4662 3873
- in % as against total -
Employee 71.0 70.1 72.2 91.8 46.0
Employer 1.1 1.5 0.7 1.5 0.7
Self-employed 18.3 22.9 12.2 5.8 33.4
Contributing family worker 9.6 5.5 14.9 0.9 19.9
Women accounted for most of the contributing family workers (67.4%), held a weight of 43.9% in the category of employees and 28.8% in that of the self-employed.
The highest discrepancy by gender is noticed among employers, the number of women in this category being 2.9 times lower than the number of men.
Young employed persons (aged 15-24 years) worked mainly as employees (56.1%) and as contributing family workers (30.8%).
In 2015, 60.4% of employees worked in services, 36.7% in industry and constructions and 2.9% in agricultural activities.
The breakdown of employees by working regime shows that that most of them (98.6%) were permanent employees.
Of the 85 thousand employees with temporary working regime, 85.4% indicated as the main reason for temporary employment that have not found a permanent job, 69.1% were employed for a period of 4-12 months, 65.3% were men and 60.2% lived in urban area.
More than three quarters (92.6%) have worked in the private sector, 36.4% were unskilled workers and 23.1% worked in constructions.
For 47.6% of employees with temporary work regime, the actual duration of the working week was 40 hours. In 2015, the number of employers was 96 thousand, of which 54.6% worked in small enterprises with one to five employees. The employer’s predominant activity was trade (45.0%). Of the total number of employers, 9.7% worked in manufacturing, 8.6% in construction, 7.9% in transport and storage, and 7.2% in hotels and restaurants.
Distribution of employed population by ownership type shows that the private sector absorbed 82.4% of the employed persons; out of these persons, 58.4% were men and 50.3% lived in urban area.
Figure 8 - Employment by ownership type and gender, in 2015
673
4109
66
2922
731
34
0 1500 3000 4500
Public
Private
Mixed
- thousand persons -
Men Women

34 Labour force in Romania: Employment and unemployment - 2015
The public sector concentrated 16.4% of the employment, the majority (74.7%) of persons employed in the public sector lived in urban area and 52.1% were women. 1.2% of employed persons worked in the mixed sector, mostly men (66.4%) and persons living in urban area (75.9%).
The distribution of employment by groups of occupations reveals that in 2015, higher shares were held by skilled workers in agriculture, forestry and fishing (21.4%) - of which 34.2% were aged 55 years and over - and by crafts and related workers (15.8%).
In the group of managers, the number of men was 2.2 times higher than women.
Women predominated in the groups of clerical support workers (62.1%), services and sales workers (60.6%), professionals (56.2%) and technicians and associate professionals (54.4%).
Men held the majority in the groups of craft and related workers (79.5%), among managers (68.5%), unskilled workers (57.1%) and in the group of skilled workers in agriculture, forestry and fishing (54.8%).
34.2% of young people (15-24 years) and 44.1% of elderly (55 and over) worked as skilled workers in agriculture forestry and fisheries.
Table 5 - Employment population by gender, urban/rural area and groups of occupation, in 2015
Total Men Women Urban Rural
TOTAL EMPLOYMENT (thousand persons) 8535 4848 3687 4662 3873
- in % as against total -
Managers 2.2 2.7 1.6 3.0 1.2
Professionals 14.8 11.4 19.2 23.0 4.9
Technicians and associate professionals 5.8 4.6 7.3 8.7 2.2
Clerical support workers 4.4 2.9 6.3 6.4 1.9
Services and sales workers 14.5 10.1 20.4 19.2 9.0
Skilled workers in agriculture, forestry and fishing 21.4 20.6 22.4 2.6 43.9
Craft and related workers 15.8 22.2 7.5 17.5 13.9
Other categories of occupations 21.1 25.5 15.3 19.6 23.0
By activities of national economy, it is noted that, 25.6% of employed persons worked in agriculture.
Among persons employed in non-agricultural sectors, 24.4% worked in manufacturing, 18.1% in trade and 10.0% in construction. Among the activities in which most of employed persons were women, most significant are: health and social assistance
(79.0%), education (75.8%), financial intermediation and insurances (65.1%), hotels and restaurants (59.9%), professional scientific and technical activities (55.7%) and wholesale and retail (54.7%). The distribution of working age employed persons (15-64 years) by activity sectors reveals that 47.5% of them worked in services, 29.4% in industry and construction and 23.1% in the agricultural sector.

The results of survery 35
Table 6 - Distribution of employment in non-agricultural activities by gender, in 2015
Economic activities Total Men Women
TOTAL (thousand persons) 6352 3608 2744
- in % as against total - Mining and quarrying 1.2 1.7 0.4 Manufacturing 24.4 25.1 23.5Production and supply of electric and thermal energy, gas, hot water
and air conditioning 1.3 1.9 0.5Water distribution; sanitation, waste administration, decontamination
activities 1.4 1.8 0.8Constructions 10.0 16.4 1.6Wholesale and retail; repair of motors vehicles and motorcycles 18.1 14.4 22.9 Transport and storage 7.5 11.1 2.8 Hotels and restaurants 2.9 2.1 4.1 Information and communications 2.7 2.8 2.6 Financial intermediation and insurance 1.6 1.0 2.5 Real estate transactions 0.3 0.3 0.3 Professional, scientific and technical activities 2.9 2.3 3.7 Activities of administrative services and activities of support services 3.2 4.2 2.0 Public administration and defense; social insurance of public system 7.0 7.8 5.9 Education 5.6 2.4 9.8Health and social assistance 6.1 2.2 11.2 Showbiz, cultural and recreation activities 0.9 0.8 1.0 Other activities of the national economy 2.9 1.7 4.4
Usual average duration of the working week in the main job for employed persons was, in 2015, 39.8 hours per week, with variations from 35.6 hours per week in agriculture, forestry and fishing to 41.5 hours in constructions.
Actual average duration of the working week was 38.5 hours, higher for employers and employees (43.0 respectively 40.7 hours per week).
396 thousand persons, representing 4.6% of the total employment worked less than usual duration of the working week; of these, 64.6% were living in rural area and 50.3% were women. Among the main reasons for working less most important were: bad weather (32.3%), maternity, paternity or parental leave (childcare leave of up to 2 years) (18.5%), variable hours (14.2%) public holidays and days off (13.3%) and annual holiday (11.8%).
A total of 215 thousand persons, representing 2.5% of the total employment worked more than usual duration of the working week, mainly due to: variable hours (53.1%) and overtime (43.3%).
The majority of them (64.5%) were men, 67.9% were living in rural area and 49.2% were employees.
6.5% of employers, 4.4% of self-employed, and only 1.7% of employees worked more weekly hours than the usual duration of the working week.
Employed persons with full-time working program represented 90.1% of the total employment; for 87.3% of them the usual duration of the working week in the main job was at least 40 hours.
14.0% of employed persons could not state the usual duration of the working week; this category of employed persons represented 7.7% of the persons having a full-time job and 70.6% of those having a part-time job.
Of the 847 thousand employed persons having a part-time job, 87.0% lived in rural area and 53.8% were men. Self-employed workers and contributing family workers accounted for 94.4% of this population.
Employment distribution by working programme and actual duration of the working week in the main activity reveals that persons working part-time and
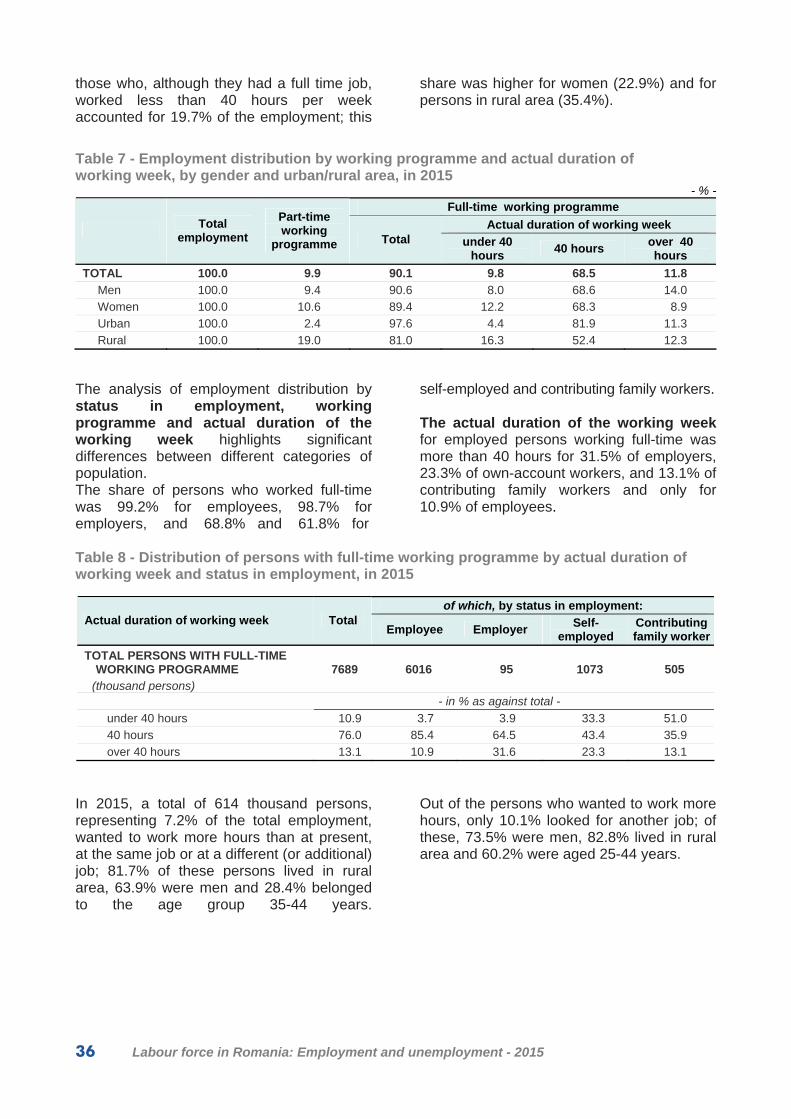
36 Labour force in Romania: Employment and unemployment - 2015
those who, although they had a full time job, worked less than 40 hours per week accounted for 19.7% of the employment; this
share was higher for women (22.9%) and for persons in rural area (35.4%).
Table 7 - Employment distribution by working programme and actual duration of working week, by gender and urban/rural area, in 2015
- % - Full-time working programme
Actual duration of working week Total employment
Part-time working
programme Total under 40 hours
40 hours over 40 hours
TOTAL 100.0 9.9 90.1 9.8 68.5 11.8
Men 100.0 9.4 90.6 8.0 68.6 14.0Women 100.0 10.6 89.4 12.2 68.3 8.9
Urban 100.0 2.4 97.6 4.4 81.9 11.3
Rural 100.0 19.0 81.0 16.3 52.4 12.3
The analysis of employment distribution by status in employment, working programme and actual duration of the working week highlights significant differences between different categories of population. The share of persons who worked full-time was 99.2% for employees, 98.7% for employers, and 68.8% and 61.8% for
self-employed and contributing family workers.
The actual duration of the working week for employed persons working full-time was more than 40 hours for 31.5% of employers, 23.3% of own-account workers, and 13.1% of contributing family workers and only for 10.9% of employees.
Table 8 - Distribution of persons with full-time working programme by actual duration of working week and status in employment, in 2015
of which, by status in employment: Actual duration of working week Total
Employee Employer Self-
employed Contributing family worker
TOTAL PERSONS WITH FULL-TIME WORKING PROGRAMME
(thousand persons) 7689 6016 95 1073 505
- in % as against total -
under 40 hours 10.9 3.7 3.9 33.3 51.0
40 hours 76.0 85.4 64.5 43.4 35.9
over 40 hours 13.1 10.9 31.6 23.3 13.1
In 2015, a total of 614 thousand persons, representing 7.2% of the total employment, wanted to work more hours than at present, at the same job or at a different (or additional) job; 81.7% of these persons lived in rural area, 63.9% were men and 28.4% belonged to the age group 35-44 years.
Out of the persons who wanted to work more hours, only 10.1% looked for another job; of these, 73.5% were men, 82.8% lived in rural area and 60.2% were aged 25-44 years.
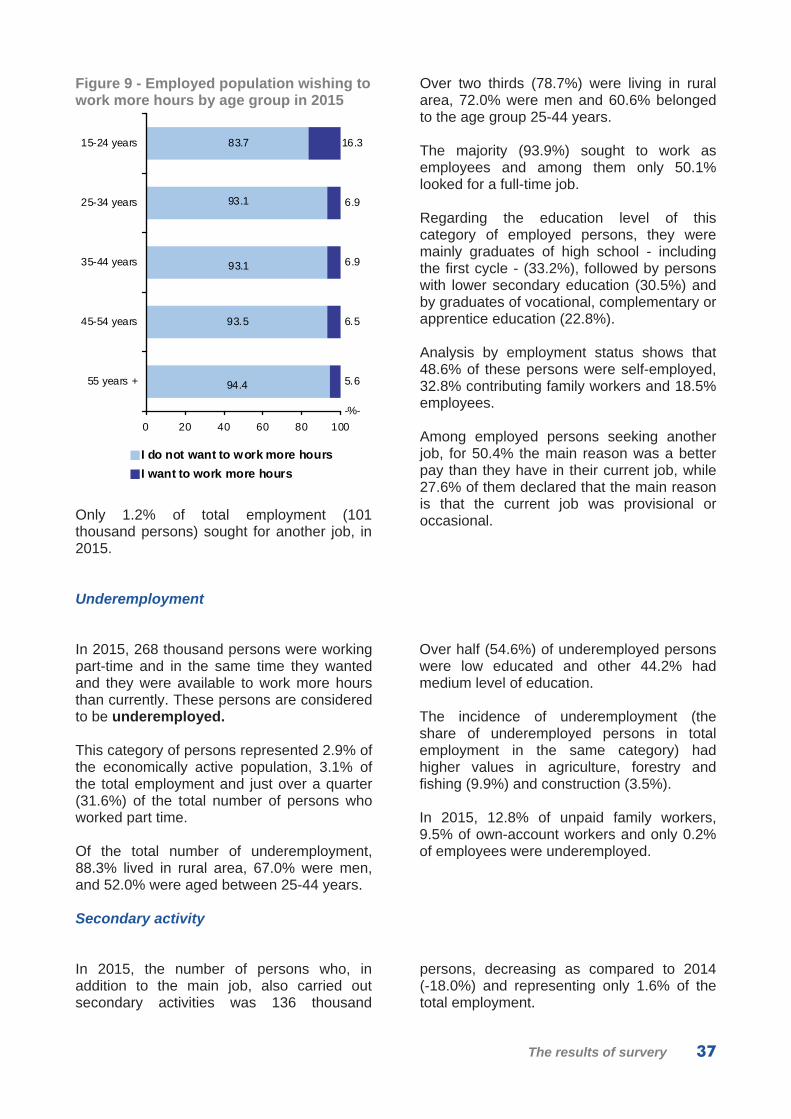
The results of survery 37
Figure 9 - Employed population wishing to work more hours by age group in 2015
83.7
93.1
94.4
93.5
93.1
6.9
16.3
6.5
5.6
6.9
0 20 40 60 80 100
55 years +
45-54 years
35-44 years
25-34 years
15-24 years
-%-
I do not want to work more hours
I want to work more hours
Only 1.2% of total employment (101 thousand persons) sought for another job, in 2015.
Over two thirds (78.7%) were living in rural area, 72.0% were men and 60.6% belonged to the age group 25-44 years.
The majority (93.9%) sought to work as employees and among them only 50.1% looked for a full-time job.
Regarding the education level of this category of employed persons, they were mainly graduates of high school - including the first cycle - (33.2%), followed by persons with lower secondary education (30.5%) and by graduates of vocational, complementary or apprentice education (22.8%).
Analysis by employment status shows that 48.6% of these persons were self-employed, 32.8% contributing family workers and 18.5% employees.
Among employed persons seeking another job, for 50.4% the main reason was a better pay than they have in their current job, while 27.6% of them declared that the main reason is that the current job was provisional or occasional.
Underemployment
In 2015, 268 thousand persons were working part-time and in the same time they wanted and they were available to work more hours than currently. These persons are considered to be underemployed.
This category of persons represented 2.9% of the economically active population, 3.1% of the total employment and just over a quarter (31.6%) of the total number of persons who worked part time.
Of the total number of underemployment, 88.3% lived in rural area, 67.0% were men, and 52.0% were aged between 25-44 years.
Over half (54.6%) of underemployed persons were low educated and other 44.2% had medium level of education.
The incidence of underemployment (the share of underemployed persons in total employment in the same category) had higher values in agriculture, forestry and fishing (9.9%) and construction (3.5%).
In 2015, 12.8% of unpaid family workers, 9.5% of own-account workers and only 0.2% of employees were underemployed.
Secondary activity
In 2015, the number of persons who, in addition to the main job, also carried out secondary activities was 136 thousand
persons, decreasing as compared to 2014 (-18.0%) and representing only 1.6% of the total employment.

38 Labour force in Romania: Employment and unemployment - 2015
Higher weights were recorded for men (1.8% compared to only 1.3% for women) for the persons aged 35-44 years and 45-54 years (both 2.0%) among graduates of vocational schools (2.8%) and for those in rural area (2.9% compared to only 0.5% in urban area), where in 96.1% of cases, the second activity took place in the agricultural sector.
Among those who also had a second job, 83.2% lived in rural area, 84.1% were adults (25-54 years) and 65.7% were men.
Among persons with secondary activities: 96.0% were self employed or contributing family workers; of these, 85.8% lived in rural area and 88.6% were employees in the main job.
Employed persons who were employees in both, the main and the secondary job, accounted for only 3.2% of those with multiple activities.
The average duration of the working week in the second job was 13.1 hours per week.
Table 9 - Distribution of persons who had a secondary activity by gender, urban/rural area, age groups and education level, in 2015
Total Men Women Urban Rural
ALL PERSONS WHO HAVE A SECONDARY ACTIVITY (thousand persons) 136 89 47 23 113
- in % as against total -
Age groups
15-24 years 5.0 5.5 4.2 2.2 5.6
25-34 years 18.2 16.6 21.2 14.8 18.9
35-44 years 36.9 34.7 41.0 39.5 36.3
45-54 years 29.0 31.0 25.2 29.5 28.9
55 years and over 10.9 12.2 8.4 14.0 10.3
Education level
Higher (short-term and long-term university including master, Ph.D., post-Ph.D. and post-university studies)
11.4 8.5 17.1 20.2 9.7
Medium (post high-school of specialty, high-school and vocational, complementary or of apprentices)
72.7 74.8 68.6 75.3 72.2
Low (gymnasium, primary and without education) 15.9 16.7 14.3 4.5 18.1
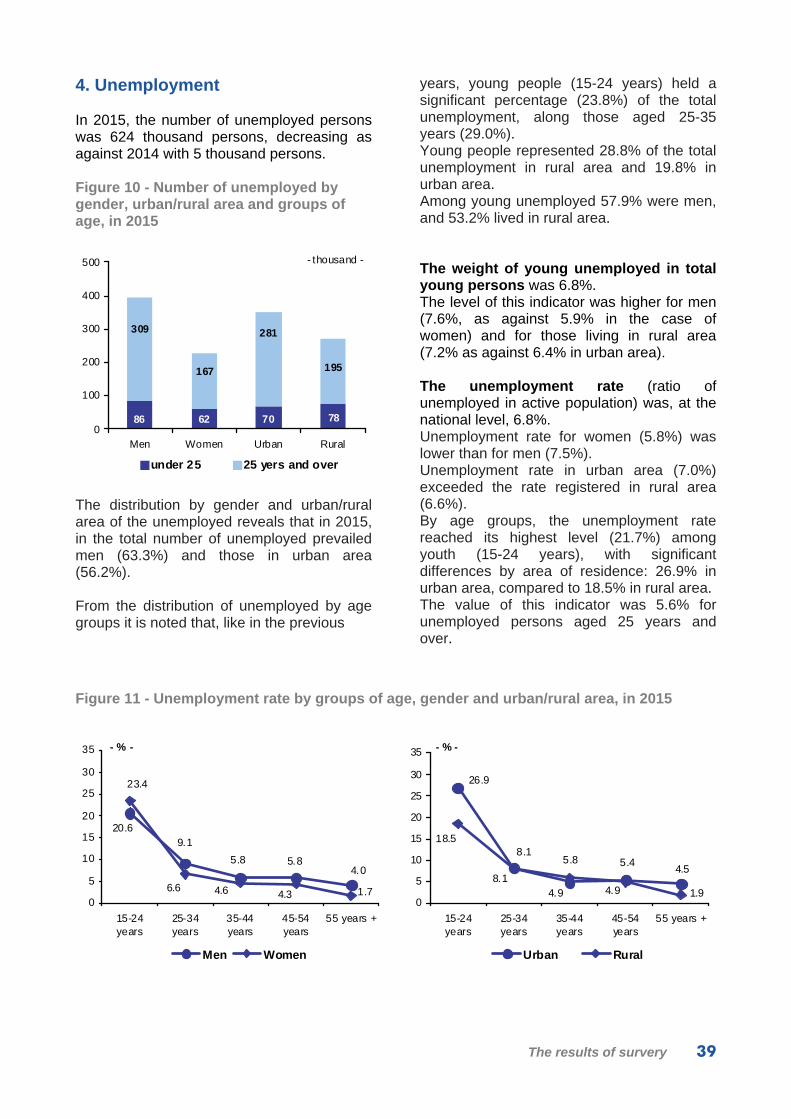
The results of survery 39
4. Unemployment
In 2015, the number of unemployed persons was 624 thousand persons, decreasing as against 2014 with 5 thousand persons.
Figure 10 - Number of unemployed by gender, urban/rural area and groups of age, in 2015
- thousand -
86 62 70 78
309
167
281
195
0
100
200
300
400
500
Men Women Urban Rural
under 25 25 yers and over
The distribution by gender and urban/rural area of the unemployed reveals that in 2015, in the total number of unemployed prevailed men (63.3%) and those in urban area (56.2%).
From the distribution of unemployed by age groups it is noted that, like in the previous
years, young people (15-24 years) held a significant percentage (23.8%) of the total unemployment, along those aged 25-35 years (29.0%). Young people represented 28.8% of the total unemployment in rural area and 19.8% in urban area. Among young unemployed 57.9% were men, and 53.2% lived in rural area.
The weight of young unemployed in total young persons was 6.8%. The level of this indicator was higher for men (7.6%, as against 5.9% in the case of women) and for those living in rural area (7.2% as against 6.4% in urban area).
The unemployment rate (ratio of unemployed in active population) was, at the national level, 6.8%. Unemployment rate for women (5.8%) was lower than for men (7.5%). Unemployment rate in urban area (7.0%) exceeded the rate registered in rural area (6.6%). By age groups, the unemployment rate reached its highest level (21.7%) among youth (15-24 years), with significant differences by area of residence: 26.9% in urban area, compared to 18.5% in rural area. The value of this indicator was 5.6% for unemployed persons aged 25 years and over.
Figure 11 - Unemployment rate by groups of age, gender and urban/rural area, in 2015
20.69.1
5.8 5.84.0
23.4
6.6 4.6 4.3 1.70
5
10
15
20
25
30
35
15-24years
25-34years
35-44years
45-54years
55 years +
- % -
Men Women
4.55.4
4.9
8.1
26.9
1.94.9
5.8
8.1
18.5
0
5
10
15
20
25
30
35
15-24years
25-34years
35-44years
45-54years
55 years +
- % -
Urban Rural

40 Labour force in Romania: Employment and unemployment - 2015
From the distribution by level of education it can be noticed that the largest share in the total unemployment are held by high school graduates (42.6%); 21.3% had lower secondary education (gymnasium), and
16.4% were graduates of vocational, complementary or apprentice schools. In total number of unemployed, university graduates accounted for 11.8%, and among them 53.7% were women.
Figure 12 - Unemployed distribution by level of education and gender, in 2015
8.7
1.4
40.8
20.022.3
6.8
17.3
45.7
10.0
19.5
4.13.4
05
101520253035404550
University Post high-schoolspeciality or
tehnical foremen
Hihg-school Vocational Gymnasium Primary and noeducation
- % -
Men Women
Unemployment affected to a greater extent low and medium level of education graduates, for which the unemployment rate was 8.1%, respectively 7.2%. For persons with higher education, the unemployment rate was 4.1%.
The highest unemployment rate (15.5%) was registered persons with low education level in urban areas. The lowest unemployment rate (3.9%) was recorded for men with high level of education living in urban area.
Table 10 - Unemployment rate by level of education, by gender and urban/rural area, in 2015 - % -
Total Men Women Urban Rural
TOTAL 6.8 7.5 5.8 7.0 6.6
Superior (short-term and long-term university including master, Ph.D., post-Ph.D. and post-university studies) 4.1 3.9 4.4 3.9 5.3
Medium (post high-school of specialty, high-school and vocational, complementary or of apprentices) 7.2 7.8 6.4 7.3 7.1
Low (gymnasium, primary and without education) 8.1 9.6 6.1 15.5 6.1
In 2015 unemployed with work experience (those who worked before entering into unemployment) represented 53.5% of total unemployed. Among the unemployed with work experience 67.2% were men, 63.3% lived in urban area, 42.0% had high school education, and 5.2% were young (15-24 years). The main reason for leaving the last job was job lost due to dismissal or redundancy
(51.0%). Important shares also held those who ended a temporary activity (20.4%), those whose unit went bankrupt (14.3%). Persons who ceased work at the last job due to resignation represented only (7.4%). Out of the 253 thousand unemployed who ceased work in the last 8 years, in their last job: 91.6% worked in establishments belonging to the private sector, 87.2% were employees, 24.7% worked in manufacturing

The results of survery 41
and 23.8% worked as craft and related trades workers. Among the unemployed who never worked 43.4% were high school graduates, 58.8% were men, 52.1% lived in rural areas and 45.1% were young (15-24 years).
The average unemployment duration in 2015 was 13.6 months, close to the value registered for the previous year (13.1 months). The shortest average duration of unemployment was recorded for young persons (15-24 years), for women and for those living in the urban area (both 10.9 months) and the longest (15.4 months) for women over 45 years.
Long-term unemployed (in unemployment for 12 months and over) represented 43.9% of total unemployed. Among the long-term unemployed 63.2% were men, and 55.4% lived in urban area. Long-term unemployment was significant among high school graduates (45.8%), graduates of vocational, complementary or apprentice schools (44.3%) and graduates of post-high schools (43.8%). In 2015, 49.0% of the unemployed in the age group 45-54 years, 46.5% of those aged 25-34 years and 44.2% of those aged 35-44 years and over were unemployed for 12 months or more.
Figure 13 - Distribution of unemployed persons by unemployment duration, in 2015
0-5 months36.8%
6-11 months19.3%
24 months and over20.6%
12-23 months23.3%
The incidence of long-term unemployment among young people (weight of unemployed aged 15-24 years for six months
and over, in total unemployed in the same age group) was 60.6%. Higher values of this indicator were recorded for men (61.2%) and for people in rural area (62.4%).
The long-term unemployment rate (weight of unemployed for 12 months and over in active population) was 3.0%. By gender, this indicator registered values of 3.3% for men and 2.6% for women, and by residence area, 3.0% in urban area compared to 2.9% in rural area.
Table 11 - Long-term unemployment in 2015
- % -
Total Men Women Urban Rural
Long-term unemployment rate
TOTAL 3.0 3.3 2.6 3.0 2.9
of which: 15-24 years 13.1 12.6 14.0 15.8 11.5
25 years and over
2.6 2.9 2.2 2.7 2.4
Incidence of long-term unemployment
TOTAL 43.9 43.8 44.1 43.3 44.6
of which: 15-24 years 60.6 61.2 59.9 58.6 62.4
25 years and over
46.0 45.1 47.7 46.2 45.6
The very long-term unemployment rate (weight of unemployed for two years and over in active population) was 1.4%.
Of the total number of unemployed, less than a quarter (16.9%) would accept a job under any circumstances (not indicating any reason to refuse a job in the eventuality they would find one).
Among the unemployed who indicated one or more reasons which would make them to a refuse a job (518 thousand persons), only 23.4% declared a single reason to do so.
Among the persons in this category of unemployed (121 thousand persons), the main reasons to refuse a job were the lack of a formal employment contract (26.4%), and a change of residence (24.5%).

42 Labour force in Romania: Employment and unemployment - 2015
5. Economically inactive population
Economically inactive population was 10700 thousand in 2015, representing 53.9% of total population. Economically inactive persons living in urban area held the majority (53.1%) and women had a superior weight (58.3%) as against men.
Economically inactive population aged 15 years and over was 7633 thousand persons, of which 59.5% were aged between 15-64 years.
Of the total number of economically inactive persons aged 15 years and over, 19.7% were young (15-24 years).
The distribution of economically inactive persons aged 15 years and over by category of inactivity shows that pensioners and welfare recipients represented more than half (59.1%) of total.
Pupils and students aged 15 years and over held, in 2015, a weight of 16.8% in the inactive population in the same age group.
Table 12 - Distribution of economically inactive population aged 15 years and over by inactivity categories, gender and urban/rural area, in 2015
Total Men Women Urban Rural
TOTAL ECONOMICALLY INACTIVE POPULATION AGED 15 YEARS AND OVER (thousand persons)
7633 2890 4743 4148 3485
- in % as against total -
Pupils and students 16.8 22.2 13.5 18.2 15.1
Pensioners 59.1 65.2 55.4 61.5 56.2
Housewives 17.5 0.1 28.2 14.7 21.0
Other situation 6.6 12.5 2.9 5.6 7.7
Among the inactive population aged 15-74 years (6066 thousand persons), 361 thousand persons were part of the potential additional labor force (down by 19 thousand persons from the previous year). Of these: - 357 thousand persons were available to start work but did not seek a job. In 2015, the percentage ratio of this category of persons and the active population was 3.9%. - only an insignificant number of persons who
were part of the potential labor force were seeking a job but were not available to start work. Among these, 54.7% lived in rural area, 55.0% were women and 48.6% were aged between 15-34 years. Over half (50.7%) of the people in the potential additional labor force had medium education level and another 43.7% had low level of education.
Table 13 - Potential additional labour force by groups of age, gender and urban/rural area, in year 2015
Total Men Women Urban Rural
POTENTIAL ADDITIONAL LABOUR FORCE - TOTAL (thousand persons)
361 163 198 164 197
- in % as against total -
15-24 years 23.9 29.4 19.4 22.1 25.525-34 years 24.7 23.3 25.9 23.6 25.735-44 years 22.8 18.2 26.6 22.1 23.445-54 years 18.2 16.6 19.5 20.0 16.655 years and over 10.4 12.5 8.6 12.2 8.8
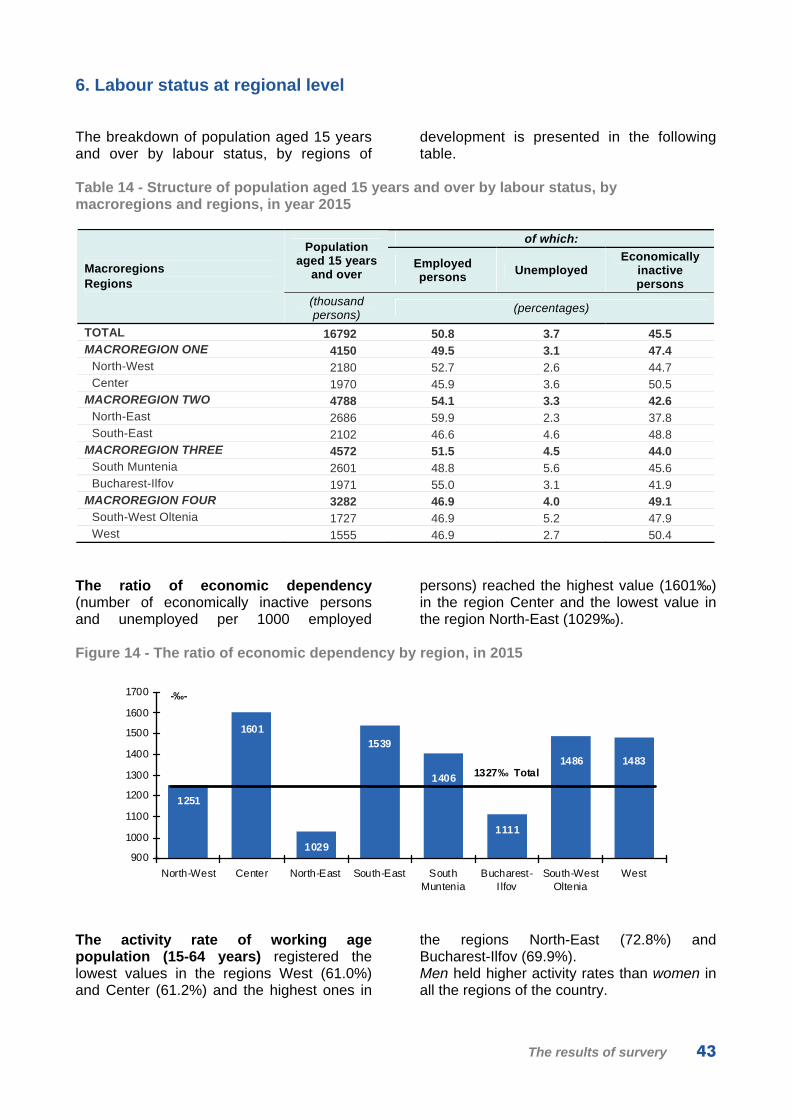
The results of survery 43
6. Labour status at regional level
The breakdown of population aged 15 years and over by labour status, by regions of
development is presented in the following table.
Table 14 - Structure of population aged 15 years and over by labour status, by macroregions and regions, in year 2015
of which: Population
aged 15 years and over
Employed persons
Unemployed Economically
inactive persons
Macroregions Regions
(thousand persons)
(percentages)
TOTAL 16792 50.8 3.7 45.5MACROREGION ONE 4150 49.5 3.1 47.4
North-West 2180 52.7 2.6 44.7Center 1970 45.9 3.6 50.5
MACROREGION TWO 4788 54.1 3.3 42.6North-East 2686 59.9 2.3 37.8South-East 2102 46.6 4.6 48.8
MACROREGION THREE 4572 51.5 4.5 44.0South Muntenia 2601 48.8 5.6 45.6Bucharest-Ilfov 1971 55.0 3.1 41.9
MACROREGION FOUR 3282 46.9 4.0 49.1South-West Oltenia 1727 46.9 5.2 47.9West 1555 46.9 2.7 50.4
The ratio of economic dependency (number of economically inactive persons and unemployed per 1000 employed
persons) reached the highest value (1601‰) in the region Center and the lowest value in the region North-East (1029‰).
Figure 14 - The ratio of economic dependency by region, in 2015
1251
1601
1029
1539
1406
1111
1486 1483
900
1000
1100
1200
1300
1400
1500
1600
1700
North-West Center North-East South-East SouthMuntenia
Bucharest-I lfov
South-WestOltenia
West
-‰-
1327‰ Total
The activity rate of working age population (15-64 years) registered the lowest values in the regions West (61.0%) and Center (61.2%) and the highest ones in
the regions North-East (72.8%) and Bucharest-Ilfov (69.9%). Men held higher activity rates than women in all the regions of the country.

44 Labour force in Romania: Employment and unemployment - 2015
In 4 of the 8 regions, the activity rates for working age population in rural area were higher than in urban area: North-East (10.8 percentages points), South-West Oltenia (4.4 percentages points), South-Muntenia (1.9 percentage points) and South-East (0.2 percentage points).
At the opposite pole there are the other three regions, where the activity rate in rural area is outrun by the one registered in urban area; the highest differences being noticed in the region Center (10.5 percentages points). In the region West, the activity rate was the same in both areas.
Figure 15 - Activity rate of working age population (15-64 years) by regions, gender and urban/rural area, in 2015
61.062.9
69.966.963.3
72.8
61.266.6
71.672.5
77.976.775.8
79.2
71.175.0
50.352.9
62.6
56.6
50.4
66.0
51.2
58.1
40
50
60
70
80
90
North-West Center North-East South-East SouthMuntenia
Bucharest-Ilfov
South-WestOltenia
West
- % -
Total Men Women
61.0
68.265.5
66.8
63.265.8
70.8
60.7
77.6
63.4
67.7
62.2
65.1
61.0
64.6
55.0
40
50
60
70
80
North-West Center North-East South-East SouthMuntenia
Bucharest-Ilfov
South-WestOltenia
West
- % -
Urban Rural
The employment rate of working age population (15-64 years) reached the highest values in the regions North-East (69.9%) and Bucharest-Ilfov (66.2%), and the lowest in the regions South-West Oltenia (56.2%) and Center (56.7%). No matter the region, the employment rate of working age population was higher for men than for women; the gap between the two rates had values from 12.3 percentages points in the region North-East to 22.2 percentages points in the region South-East.
The employment rate of the working age population in urban areas has surpassed that of rural areas in four of the eight regions; the most notable differences being registered in Center (11.3 percentage points) and Bucharest-Ilfov (7.3 percentage points). In other regions, the employment rate was higher in rural areas than in urban areas, the biggest differences occurring in the North-East (12.0 percentage points) and South-West Oltenia (4.3 percentage points).

The results of survery 45
Figure 16 - Employment rate of working age population (15-64 years), by regions, gender and urban/rural area, in 2015
69.963.4
56.7 57.559.7
66.2
56.257.7
67.6
63.0
73.0
68.068.4
75.9
65.671.3
47.6
55.4
63.6
46.2 51.047.749.0
59.9
40
50
60
70
80
North-West Center North-East South-East South-Muntenia
Bucharest-Ilfov
South-WestOltenia
West
- % -
Total Men Women
67.0
58.1
54.058.357.0
63.3
61.365.0
57.1
58.3
59.7
60.758.1
50.0
75.3
61.5
40
50
60
70
80
North-West Center North-East South-East SouthMuntenia
Bucharest-Ilfov
South-WestOltenia
West
- % -
Urban Rural
In 2015, the region South Muntenia concentrated 23.4% of the total unemployment, followed by the South East (15.6%) and South-West Oltenia (14.5%). The lowest share in total unemployment was held by region West (6.6%), with only 41 thousand unemployed.
The unemployment rate reached the highest values in the regions: South Muntenia (10.3%) and South-West Oltenia (10.1%) and the lowest ones in the regions: North-East (3.6%) and North-West (4.6%).
Figure 17 - The number of unemployed and the unemployment rate by regions, in 2015
5672
6197
146
60
91
41
5.4
10.1
5.3
10.3
9.0
3.6
7.4
4.6
0
20
40
60
80
100
120
140
160
North-West Center North-East South-East SouthMuntenia
Bucharest-Ilfov
South-WestOltenia
West
Th
ou
sand
per
so
ns
0
2
4
6
8
10
12
Un
em
plo
ym
ent
rate
(%
)
Unemployed Unemployment rate

46 Labour force in Romania: Employment and unemployment - 2015
The gender gap in the unemployment rate (expressed as the difference between the unemployment rate for men and the unemployment rate for women) shows that the unemployment rate was higher for men than women in all eight regions.
The highest differences between the two rates (men compared to women) were recorded in South-West Oltenia (5.8 percentage points) and in Bucharest-Ilfov (2.0 percentage points) and the lowest in North-West (0.3 percentage points) and North-East and West (both with 0.6 percentage points).
Figure 18 - The unemployment rate by regions and gender, in 2015
4.8
7.7
3.9
9.611.0
6.2
12.5
5.6
5.0
6.9
3.3
8.26.7
4.2
9.3
4.5
0
2
4
6
8
10
12
14
North-West Center North-East South-East South-Muntenia
Bucharest-Ilfov
South-WestOltenia
West
- % -
Men Women
The urban area is characterized by higher unemployment rates than rural in almost all regions of the country, except Center and West, where the unemployment rate in the rural area was higher with 2.7 percentage points, and respectively, with 1.6 percentage points. The highest unemployment rate was recorded in the urban area of the region
South Muntenia (11.4%) and the lowest one in rural area of the region North-East (2.6%). The deepest disparity between the two areas of residence expressed by the difference between unemployment rate for persons in urban area and for that in rural area was registered in the region North-East (2.6 percentages points) and South Muntenia (1.8 percentage points).
Figure 19 - The unemployment rate by regions and urban/rural area, in 2015
4.8
5.4
10.911.4
9.8
5.2
6.44.7
9.1
4.6
2.6
6.49.4
4.0
9.6
8.1
0
2
4
6
8
10
12
North-West Center North-East South-East SouthMuntenia
Bucharest-Ilfov
South-West West
- % -
Urban Rural
* * *
Data presented in the annexed tables provide a detailed image over the multitude aspects characterizing the labour market in Romania.

Tables
1. Annual evolutions 1996-20152. Year 2015
III

Statistical data presented in this paper were obtained based on the information collected through “Households Labour Force Survey” (AMIGO). In order to have an accurate interpretation of various indicators, the methodological concepts and definitions from the first part of this paper should be taken into account. Extended annual data for each year were obtained as the average of quarterly extended data. Due to the revision of the definitions applied starting with 2002, in 1996-2015 data series, the indicators corresponding to 1996-2001 period, on the main categories of population (economically active, employment, unemployment and economically inactive) are not fully comparable with those corresponding to the next years series. Annual data on labor force in Romania (active population, the employed and unemployed), for the period 1996-2001 have been recalculated taking into account population estimate Population and Housing Census of March 2002. 2004-2015 data series was computed taking into account the criterion of usual residence, in accordance with the results of the Population and Housing Census 2011.
Notes: 1. Owing to the rounding of the final decimal part of the extension coefficients to 5 decimals, there are seldom small differences between some estimated totals at level of various types of tables and what results from the total.
2. In the tables, the headings marked with * as well as values published between brackets means thatweighted data are not reliable due to the low number of observed cases.
3. The data which have values between 6500-11499 interval (persons) have a low degree ofreliability; the variation coefficients (VC) are between 0.20 – 0.30.
4. In the tables, in the headings marked with - means “no existing data”.
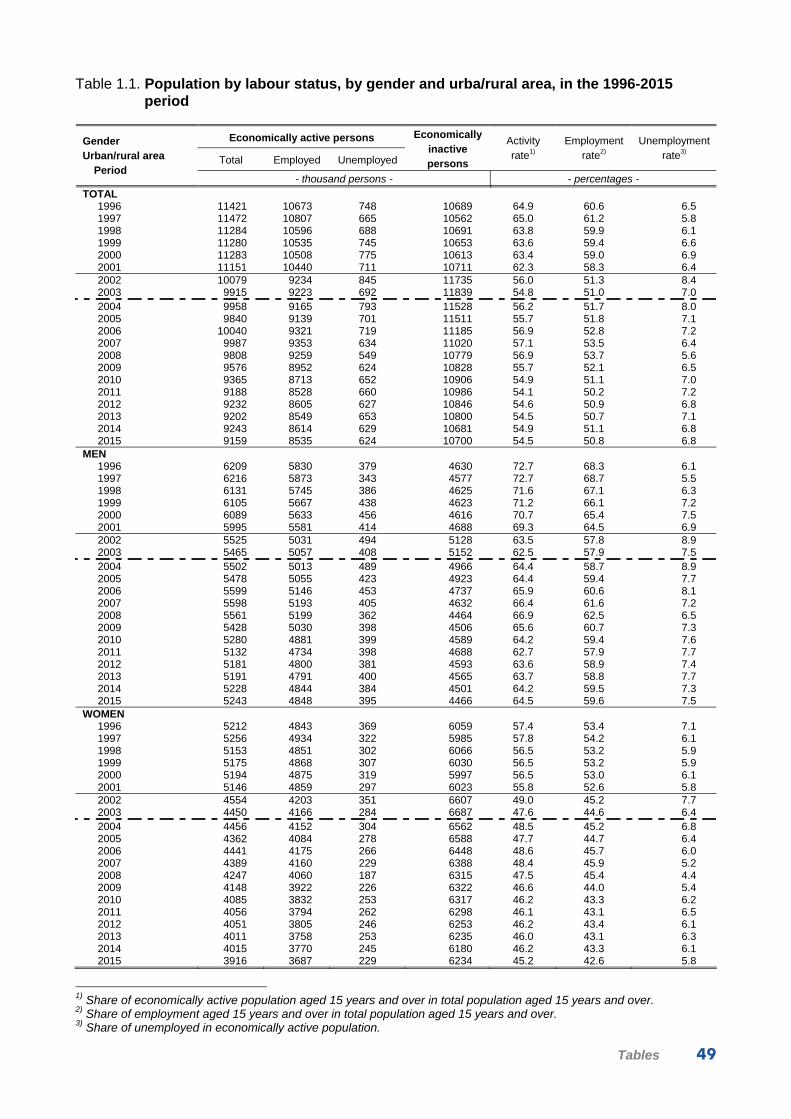
Tables 49
Table 1.1. Population by labour status, by gender and urba/rural area, in the 1996-2015 period
Economically active persons
Total Employed Unemployed
Economically inactive persons
Activity rate1)
Employment rate2)
Unemployment rate3)
Gender Urban/rural area
Period - thousand persons - - percentages -
TOTAL 1996 11421 10673 748 10689 64.9 60.6 6.51997 11472 10807 665 10562 65.0 61.2 5.81998 11284 10596 688 10691 63.8 59.9 6.11999 11280 10535 745 10653 63.6 59.4 6.62000 11283 10508 775 10613 63.4 59.0 6.92001 11151 10440 711 10711 62.3 58.3 6.42002 10079 9234 845 11735 56.0 51.3 8.42003 9915 9223 692 11839 54.8 51.0 7.02004 9958 9165 793 11528 56.2 51.7 8.02005 9840 9139 701 11511 55.7 51.8 7.12006 10040 9321 719 11185 56.9 52.8 7.22007 9987 9353 634 11020 57.1 53.5 6.42008 9808 9259 549 10779 56.9 53.7 5.62009 9576 8952 624 10828 55.7 52.1 6.52010 9365 8713 652 10906 54.9 51.1 7.02011 9188 8528 660 10986 54.1 50.2 7.22012 9232 8605 627 10846 54.6 50.9 6.82013 9202 8549 653 10800 54.5 50.7 7.12014 9243 8614 629 10681 54.9 51.1 6.82015 9159 8535 624 10700 54.5 50.8 6.8
MEN1996 6209 5830 379 4630 72.7 68.3 6.11997 6216 5873 343 4577 72.7 68.7 5.51998 6131 5745 386 4625 71.6 67.1 6.31999 6105 5667 438 4623 71.2 66.1 7.22000 6089 5633 456 4616 70.7 65.4 7.52001 5995 5581 414 4688 69.3 64.5 6.92002 5525 5031 494 5128 63.5 57.8 8.92003 5465 5057 408 5152 62.5 57.9 7.52004 5502 5013 489 4966 64.4 58.7 8.92005 5478 5055 423 4923 64.4 59.4 7.72006 5599 5146 453 4737 65.9 60.6 8.12007 5598 5193 405 4632 66.4 61.6 7.22008 5561 5199 362 4464 66.9 62.5 6.52009 5428 5030 398 4506 65.6 60.7 7.32010 5280 4881 399 4589 64.2 59.4 7.62011 5132 4734 398 4688 62.7 57.9 7.72012 5181 4800 381 4593 63.6 58.9 7.42013 5191 4791 400 4565 63.7 58.8 7.72014 5228 4844 384 4501 64.2 59.5 7.32015 5243 4848 395 4466 64.5 59.6 7.5
WOMEN1996 5212 4843 369 6059 57.4 53.4 7.11997 5256 4934 322 5985 57.8 54.2 6.11998 5153 4851 302 6066 56.5 53.2 5.91999 5175 4868 307 6030 56.5 53.2 5.92000 5194 4875 319 5997 56.5 53.0 6.12001 5146 4859 297 6023 55.8 52.6 5.82002 4554 4203 351 6607 49.0 45.2 7.72003 4450 4166 284 6687 47.6 44.6 6.42004 4456 4152 304 6562 48.5 45.2 6.82005 4362 4084 278 6588 47.7 44.7 6.42006 4441 4175 266 6448 48.6 45.7 6.02007 4389 4160 229 6388 48.4 45.9 5.22008 4247 4060 187 6315 47.5 45.4 4.42009 4148 3922 226 6322 46.6 44.0 5.42010 4085 3832 253 6317 46.2 43.3 6.22011 4056 3794 262 6298 46.1 43.1 6.52012 4051 3805 246 6253 46.2 43.4 6.12013 4011 3758 253 6235 46.0 43.1 6.32014 4015 3770 245 6180 46.2 43.3 6.12015 3916 3687 229 6234 45.2 42.6 5.8
1) Share of economically active population aged 15 years and over in total population aged 15 years and over.2) Share of employment aged 15 years and over in total population aged 15 years and over.3) Share of unemployed in economically active population.
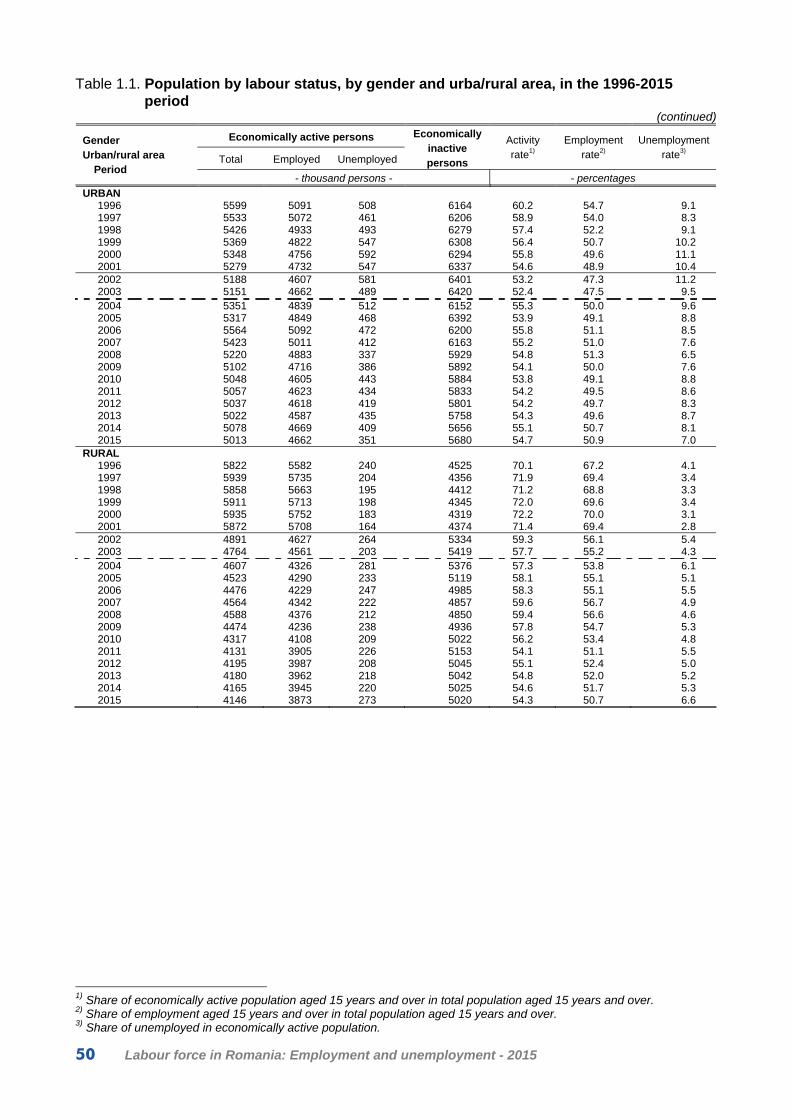
50 Labour force in Romania: Employment and unemployment - 2015
Table 1.1. Population by labour status, by gender and urba/rural area, in the 1996-2015 period
(continued)
Economically active persons
Total Employed Unemployed
Economically inactive persons
Activity rate1)
Employment rate2)
Unemployment rate3)
Gender Urban/rural area
Period - thousand persons - - percentages
URBAN1996 5599 5091 508 6164 60.2 54.7 9.11997 5533 5072 461 6206 58.9 54.0 8.31998 5426 4933 493 6279 57.4 52.2 9.11999 5369 4822 547 6308 56.4 50.7 10.22000 5348 4756 592 6294 55.8 49.6 11.12001 5279 4732 547 6337 54.6 48.9 10.42002 5188 4607 581 6401 53.2 47.3 11.22003 5151 4662 489 6420 52.4 47.5 9.52004 5351 4839 512 6152 55.3 50.0 9.62005 5317 4849 468 6392 53.9 49.1 8.82006 5564 5092 472 6200 55.8 51.1 8.52007 5423 5011 412 6163 55.2 51.0 7.62008 5220 4883 337 5929 54.8 51.3 6.52009 5102 4716 386 5892 54.1 50.0 7.62010 5048 4605 443 5884 53.8 49.1 8.82011 5057 4623 434 5833 54.2 49.5 8.62012 5037 4618 419 5801 54.2 49.7 8.32013 5022 4587 435 5758 54.3 49.6 8.72014 5078 4669 409 5656 55.1 50.7 8.12015 5013 4662 351 5680 54.7 50.9 7.0
RURAL1996 5822 5582 240 4525 70.1 67.2 4.11997 5939 5735 204 4356 71.9 69.4 3.41998 5858 5663 195 4412 71.2 68.8 3.31999 5911 5713 198 4345 72.0 69.6 3.42000 5935 5752 183 4319 72.2 70.0 3.12001 5872 5708 164 4374 71.4 69.4 2.82002 4891 4627 264 5334 59.3 56.1 5.42003 4764 4561 203 5419 57.7 55.2 4.32004 4607 4326 281 5376 57.3 53.8 6.12005 4523 4290 233 5119 58.1 55.1 5.12006 4476 4229 247 4985 58.3 55.1 5.52007 4564 4342 222 4857 59.6 56.7 4.92008 4588 4376 212 4850 59.4 56.6 4.62009 4474 4236 238 4936 57.8 54.7 5.32010 4317 4108 209 5022 56.2 53.4 4.82011 4131 3905 226 5153 54.1 51.1 5.52012 4195 3987 208 5045 55.1 52.4 5.02013 4180 3962 218 5042 54.8 52.0 5.22014 4165 3945 220 5025 54.6 51.7 5.32015 4146 3873 273 5020 54.3 50.7 6.6
1) Share of economically active population aged 15 years and over in total population aged 15 years and over.2) Share of employment aged 15 years and over in total population aged 15 years and over.3) Share of unemployed in economically active population.

Tables 51
Table 1.2. Activity rate of population aged 15 years and over by groups of age, gender and urban/rural area, in the 1996-2015 period
- % -
Groups of age Gender
Urban/rural area Period
Total population
aged 15 years and over
Total 15-64 years 15-24
years 25-34 years
35-44 years
45-54 years
55-64 years
65 years and over
TOTAL 1996 64.9 70.8 49.9 85.5 88.2 80.3 50.5 32.4 1997 65.0 70.8 47.8 84.9 88.3 81.0 52.5 33.9 1998 63.8 69.3 45.5 83.4 87.0 79.1 51.6 34.9 1999 63.6 69.0 43.9 83.8 86.8 78.9 50.7 36.1 2000 63.4 68.8 43.1 84.4 86.5 77.9 50.5 35.9 2001 62.3 67.7 41.6 83.1 86.1 76.0 49.3 35.6 2002 56.0 63.6 38.9 80.7 83.4 71.9 38.3 18.5 2003 54.8 62.4 34.2 79.4 82.8 71.9 38.8 17.9 2004 56.2 64.6 39.0 82.4 84.3 73.4 38.4 15.7 2005 55.7 64.2 35.1 82.5 84.5 74.2 40.4 15.1 2006 56.9 66.2 34.7 84.3 87.6 77.2 42.1 14.2 2007 57.1 66.1 34.2 84.1 87.6 77.4 41.7 16.1 2008 56.9 66.5 34.3 84.7 87.3 77.0 43.4 14.7 2009 55.7 65.9 33.4 83.7 86.7 76.2 43.0 12.7 2010 54.9 64.9 31.2 82.1 86.2 76.0 42.1 12.4 2011 54.1 64.1 30.7 81.3 85.0 75.1 41.4 12.0 2012 54.6 64.8 30.5 80.8 85.0 77.5 43.0 11.8 2013 54.5 64.9 30.1 80.4 84.5 79.0 43.4 11.3 2014 54.9 65.7 29.6 81.6 84.5 79.8 44.6 10.8 2015 54.5 66.1 31.3 81.5 85.7 79.8 42.7 8.9
MEN 1996 72.7 78.1 56.1 92.7 94.4 87.9 59.7 38.2 1997 72.7 77.9 53.7 92.0 94.3 88.6 61.4 39.8 1998 71.6 76.6 51.5 90.8 93.2 87.3 60.4 40.8 1999 71.2 75.9 50.5 90.9 92.8 86.7 58.2 41.8 2000 70.7 75.7 49.3 91.5 92.7 85.6 57.4 40.9 2001 69.3 74.1 46.6 89.8 91.9 84.0 55.8 40.5 2002 63.5 70.7 44.2 88.2 90.1 80.7 44.2 21.2 2003 62.5 69.6 39.9 87.1 89.9 80.5 44.6 21.3 2004 64.4 72.4 45.2 91.4 91.7 82.1 45.2 18.1 2005 64.4 72.5 41.1 92.3 93.0 83.0 48.0 17.7 2006 65.9 74.6 40.7 93.9 95.7 86.2 51.0 16.8 2007 66.4 74.8 40.9 93.9 95.4 86.8 51.2 19.9 2008 66.9 76.1 41.4 94.1 96.5 87.8 54.1 17.4 2009 65.6 75.1 39.4 93.0 95.5 86.7 53.2 15.3 2010 64.2 73.7 36.5 91.0 94.6 86.0 52.3 14.6 2011 62.7 72.1 35.3 89.2 92.7 83.7 51.3 13.7 2012 63.6 73.2 35.3 89.3 93.1 86.1 53.6 13.7 2013 63.7 73.4 35.1 89.1 92.7 87.5 53.9 13.0 2014 64.2 74.3 34.8 89.8 93.0 88.3 55.4 12.5 2015 64.5 75.3 37.0 91.3 94.2 88.8 53.8 10.6
WOMEN 1996 57.4 63.7 43.4 78.1 82.1 73.1 42.4 28.2 1997 57.8 63.9 41.6 77.5 82.2 73.8 44.7 29.7 1998 56.5 62.2 39.1 75.7 80.8 71.4 43.9 30.7 1999 56.5 62.1 36.9 76.5 80.8 71.5 44.1 32.0 2000 56.5 62.1 36.5 77.1 80.3 70.4 44.6 32.3 2001 55.8 61.3 36.3 76.2 80.2 68.3 43.8 32.2 2002 49.0 56.7 33.4 72.9 76.6 63.5 33.2 16.6 2003 47.6 55.3 28.2 71.5 75.6 63.7 33.6 15.6 2004 48.5 56.9 32.6 73.1 76.9 65.2 32.5 13.9 2005 47.7 56.1 28.8 72.5 75.9 65.9 33.7 13.3 2006 48.6 57.8 28.3 74.3 79.3 68.6 34.2 12.4 2007 48.4 57.4 27.2 74.1 79.8 68.4 33.4 13.5 2008 47.5 57.0 26.7 75.0 77.9 66.4 34.0 12.8 2009 46.6 56.7 26.9 74.0 77.6 65.8 33.9 10.9 2010 46.2 56.2 25.6 72.9 77.5 66.3 33.1 11.0 2011 46.1 56.1 25.8 73.0 77.0 66.6 32.7 10.8 2012 46.2 56.4 25.5 72.0 76.6 68.9 33.7 10.6 2013 46.0 56.3 24.7 71.1 75.9 70.4 34.1 10.2 2014 46.2 56.9 24.0 72.8 75.6 71.2 35.0 9.7 2015 45.2 56.7 25.2 71.0 76.7 70.6 32.8 7.7

52 Labour force in Romania: Employment and unemployment - 2015
Table 1.2. Activity rate of population aged 15 years and over by groups of age, gender and urban/rural area, in the 1996-2015 period
(continued) - % -
Groups of age Gender
Urban/rural area Period
Total population
aged 15 years and over
Total 15-64 years 15-24
years 25-34 years
35-44 years
45-54 years
55-64 years
65 years and over
URBAN 1996 60.2 67.2 40.2 86.5 89.3 78.0 25.9 5.3 1997 58.9 65.9 36.4 85.3 88.7 77.9 26.1 5.4 1998 57.4 64.4 35.4 83.8 87.5 76.0 24.0 5.0 1999 56.4 63.4 34.2 83.5 86.7 75.0 21.9 4.7 2000 55.8 62.8 33.3 84.1 86.2 73.3 21.3 4.5 2001 54.6 61.7 32.2 83.2 85.9 70.7 20.6 4.0 2002 53.2 60.5 31.5 82.9 83.9 69.6 18.2 2.0 2003 52.4 59.7 28.2 81.3 83.6 70.0 19.9 2.2 2004 55.3 63.0 31.6 84.3 86.3 74.4 23.4 2.2 2005 53.9 61.7 27.2 83.9 85.5 73.9 24.6 2.0 2006 55.8 64.3 26.8 86.4 89.5 77.8 29.4 2.2 2007 55.2 63.7 26.5 86.1 88.9 77.1 27.9 2.5 2008 54.8 64.0 26.8 86.9 88.5 75.7 31.5 1.8 2009 54.1 63.8 26.4 86.1 88.6 75.2 31.8 1.3 2010 53.8 63.5 25.1 85.3 88.6 75.7 31.8 1.2 2011 54.2 63.9 25.5 85.3 88.6 76.4 32.7 1.3 2012 54.2 64.1 24.7 84.0 87.8 79.1 33.9 1.2 2013 54.3 64.5 23.8 84.1 87.4 80.6 35.0 1.1 2014 55.1 65.8 23.0 86.1 88.1 82.1 36.7 1.0 2015 54.7 65.9 23.8 84.6 88.3 80.7 36.8 1.3
RURAL 1996 70.1 75.4 61.0 84.0 86.1 83.2 69.4 49.3 1997 71.9 77.1 61.5 84.2 87.4 85.0 73.2 51.8 1998 71.2 75.7 58.2 82.8 86.1 83.3 73.7 54.0 1999 72.0 76.2 56.5 84.2 86.9 84.3 74.4 56.3 2000 72.2 76.7 56.2 84.7 86.9 84.5 75.3 56.3 2001 71.4 75.6 54.3 83.1 86.4 84.0 74.5 56.2 2002 59.3 67.8 48.9 77.9 82.6 75.6 56.5 29.4 2003 57.7 66.0 42.3 77.1 81.5 75.0 56.6 28.5 2004 57.3 66.7 49.7 79.9 80.9 71.9 51.6 24.7 2005 58.1 67.9 46.8 80.6 82.8 74.7 55.8 24.7 2006 58.3 68.8 46.2 81.3 84.4 76.2 56.1 23.4 2007 59.6 69.5 45.3 81.3 85.7 77.9 57.5 26.7 2008 59.4 69.9 43.8 81.7 85.6 79.0 58.2 24.7 2009 57.8 68.9 41.7 80.1 84.4 77.6 57.8 21.7 2010 56.2 66.8 38.4 77.5 83.1 76.6 56.0 21.5 2011 54.1 64.4 36.8 75.4 80.2 73.2 53.3 20.6 2012 55.1 65.8 37.4 76.1 81.5 75.2 55.5 20.5 2013 54.8 65.5 37.0 74.8 80.7 76.7 55.0 19.8 2014 54.6 65.5 36.5 74.9 80.1 76.6 55.7 19.2 2015 54.3 66.4 38.7 77.0 82.3 78.6 51.1 15.5
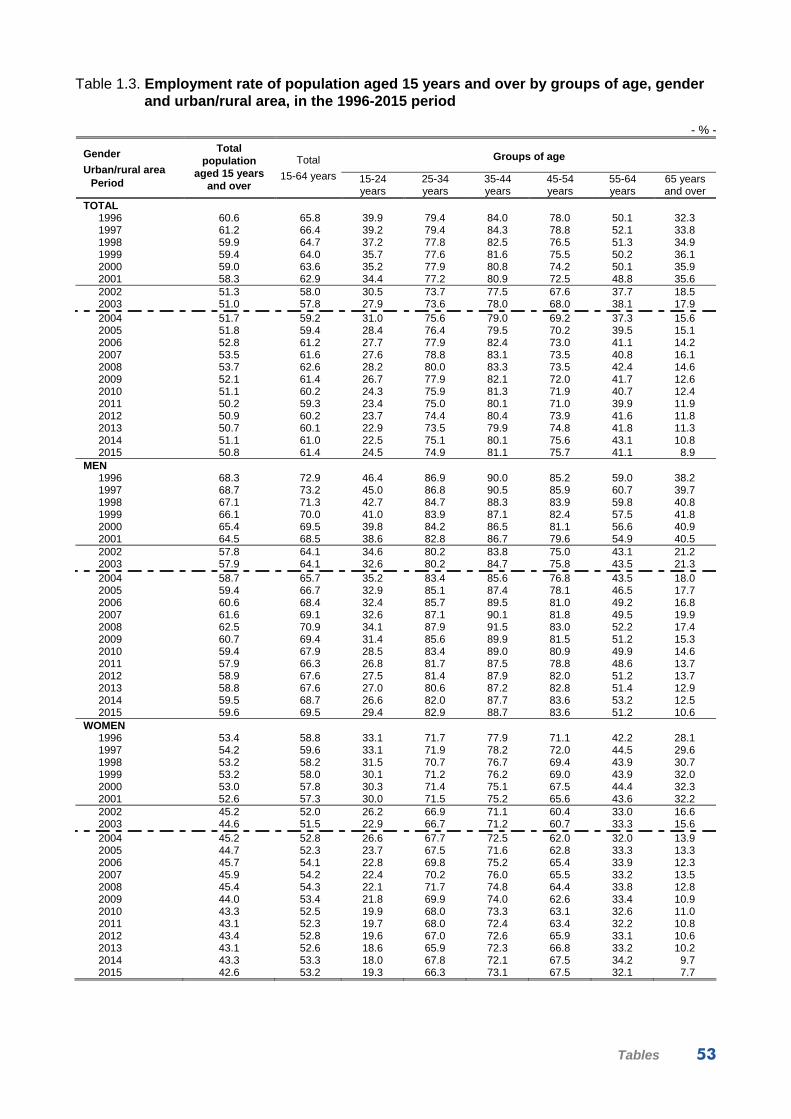
Tables 53
Table 1.3. Employment rate of population aged 15 years and over by groups of age, gender and urban/rural area, in the 1996-2015 period
- % -
Groups of age Gender
Urban/rural area Period
Total population
aged 15 years and over
Total
15-64 years 15-24 years
25-34 years
35-44 years
45-54 years
55-64 years
65 years and over
TOTAL 1996 60.6 65.8 39.9 79.4 84.0 78.0 50.1 32.3 1997 61.2 66.4 39.2 79.4 84.3 78.8 52.1 33.8 1998 59.9 64.7 37.2 77.8 82.5 76.5 51.3 34.9 1999 59.4 64.0 35.7 77.6 81.6 75.5 50.2 36.1 2000 59.0 63.6 35.2 77.9 80.8 74.2 50.1 35.9 2001 58.3 62.9 34.4 77.2 80.9 72.5 48.8 35.6 2002 51.3 58.0 30.5 73.7 77.5 67.6 37.7 18.5 2003 51.0 57.8 27.9 73.6 78.0 68.0 38.1 17.9 2004 51.7 59.2 31.0 75.6 79.0 69.2 37.3 15.6 2005 51.8 59.4 28.4 76.4 79.5 70.2 39.5 15.1 2006 52.8 61.2 27.7 77.9 82.4 73.0 41.1 14.2 2007 53.5 61.6 27.6 78.8 83.1 73.5 40.8 16.1 2008 53.7 62.6 28.2 80.0 83.3 73.5 42.4 14.6 2009 52.1 61.4 26.7 77.9 82.1 72.0 41.7 12.6 2010 51.1 60.2 24.3 75.9 81.3 71.9 40.7 12.4 2011 50.2 59.3 23.4 75.0 80.1 71.0 39.9 11.9 2012 50.9 60.2 23.7 74.4 80.4 73.9 41.6 11.8 2013 50.7 60.1 22.9 73.5 79.9 74.8 41.8 11.3 2014 51.1 61.0 22.5 75.1 80.1 75.6 43.1 10.8 2015 50.8 61.4 24.5 74.9 81.1 75.7 41.1 8.9
MEN 1996 68.3 72.9 46.4 86.9 90.0 85.2 59.0 38.2 1997 68.7 73.2 45.0 86.8 90.5 85.9 60.7 39.7 1998 67.1 71.3 42.7 84.7 88.3 83.9 59.8 40.8 1999 66.1 70.0 41.0 83.9 87.1 82.4 57.5 41.8 2000 65.4 69.5 39.8 84.2 86.5 81.1 56.6 40.9 2001 64.5 68.5 38.6 82.8 86.7 79.6 54.9 40.5 2002 57.8 64.1 34.6 80.2 83.8 75.0 43.1 21.2 2003 57.9 64.1 32.6 80.2 84.7 75.8 43.5 21.3 2004 58.7 65.7 35.2 83.4 85.6 76.8 43.5 18.0 2005 59.4 66.7 32.9 85.1 87.4 78.1 46.5 17.7 2006 60.6 68.4 32.4 85.7 89.5 81.0 49.2 16.8 2007 61.6 69.1 32.6 87.1 90.1 81.8 49.5 19.9 2008 62.5 70.9 34.1 87.9 91.5 83.0 52.2 17.4 2009 60.7 69.4 31.4 85.6 89.9 81.5 51.2 15.3 2010 59.4 67.9 28.5 83.4 89.0 80.9 49.9 14.6 2011 57.9 66.3 26.8 81.7 87.5 78.8 48.6 13.7 2012 58.9 67.6 27.5 81.4 87.9 82.0 51.2 13.7 2013 58.8 67.6 27.0 80.6 87.2 82.8 51.4 12.9 2014 59.5 68.7 26.6 82.0 87.7 83.6 53.2 12.5 2015 59.6 69.5 29.4 82.9 88.7 83.6 51.2 10.6
WOMEN 1996 53.4 58.8 33.1 71.7 77.9 71.1 42.2 28.1 1997 54.2 59.6 33.1 71.9 78.2 72.0 44.5 29.6 1998 53.2 58.2 31.5 70.7 76.7 69.4 43.9 30.7 1999 53.2 58.0 30.1 71.2 76.2 69.0 43.9 32.0 2000 53.0 57.8 30.3 71.4 75.1 67.5 44.4 32.3 2001 52.6 57.3 30.0 71.5 75.2 65.6 43.6 32.2 2002 45.2 52.0 26.2 66.9 71.1 60.4 33.0 16.6 2003 44.6 51.5 22.9 66.7 71.2 60.7 33.3 15.6 2004 45.2 52.8 26.6 67.7 72.5 62.0 32.0 13.9 2005 44.7 52.3 23.7 67.5 71.6 62.8 33.3 13.3 2006 45.7 54.1 22.8 69.8 75.2 65.4 33.9 12.3 2007 45.9 54.2 22.4 70.2 76.0 65.5 33.2 13.5 2008 45.4 54.3 22.1 71.7 74.8 64.4 33.8 12.8 2009 44.0 53.4 21.8 69.9 74.0 62.6 33.4 10.9 2010 43.3 52.5 19.9 68.0 73.3 63.1 32.6 11.0 2011 43.1 52.3 19.7 68.0 72.4 63.4 32.2 10.8 2012 43.4 52.8 19.6 67.0 72.6 65.9 33.1 10.6 2013 43.1 52.6 18.6 65.9 72.3 66.8 33.2 10.2 2014 43.3 53.3 18.0 67.8 72.1 67.5 34.2 9.7 2015 42.6 53.2 19.3 66.3 73.1 67.5 32.1 7.7

54 Labour force in Romania: Employment and unemployment - 2015
Table 1.3. Employment rate of population aged 15 years and over by groups of age, gender and urban/rural area, in the 1996-2015 period
(continued) - % -
Groups of age Gender
Urban/rural area Period
Total population
aged 15 years and over
Total 15-64 years 15-24
years 25-34 years
35-44 years
45-54 years
55-64 years
65 years and over
URBAN 1996 54.7 61.1 28.8 79.4 84.1 74.7 25.3 5.2 1997 54.0 60.3 26.7 78.6 83.8 74.8 25.5 5.4 1998 52.2 58.5 25.7 76.7 82.0 72.2 23.5 4.9 1999 50.7 56.9 24.3 75.7 80.4 70.2 21.0 4.7 2000 49.6 55.8 23.4 75.5 78.7 68.0 20.6 4.5 2001 48.9 55.2 23.3 75.2 79.0 65.9 19.8 4.0 2002 47.3 53.7 22.2 74.4 76.8 64.2 17.2 2.0 2003 47.5 54.0 20.9 74.3 77.6 65.1 18.9 2.2 2004 50.0 56.9 23.3 76.7 81.0 69.3 21.8 2.1 2005 49.1 56.2 20.2 76.8 80.1 69.3 23.3 1.9 2006 51.1 58.9 19.7 79.2 83.9 73.0 28.3 2.1 2007 51.0 58.8 20.2 80.1 83.6 72.6 26.8 2.4 2008 51.3 59.9 21.0 81.7 84.1 71.8 30.3 1.8 2009 50.0 58.9 19.7 79.9 83.5 70.3 30.6 1.3 2010 49.1 57.9 17.5 77.7 82.7 70.6 30.1 1.2 2011 49.5 58.4 17.4 78.1 83.0 71.6 30.7 1.2 2012 49.7 58.7 17.1 76.5 82.3 74.8 32.1 1.2 2013 49.6 58.9 16.2 75.9 82.1 75.4 32.9 1.1 2014 50.7 60.5 15.5 78.5 82.9 77.2 34.8 1.0 2015 50.9 61.3 17.4 77.8 84.0 76.4 35.1 1.3
RURAL 1996 67.2 71.8 52.8 79.4 83.6 81.9 69.1 49.3 1997 69.4 74.0 54.3 80.5 85.3 83.9 72.9 51.8 1998 68.8 72.7 51.7 79.2 83.5 82.2 73.5 54.0 1999 69.6 73.2 50.5 80.1 84.0 83.0 74.2 56.3 2000 70.0 73.8 50.8 80.8 84.4 83.2 75.1 56.3 2001 69.4 73.1 49.5 79.8 84.1 82.6 74.3 56.2 2002 56.1 63.7 41.6 72.7 78.7 73.0 56.2 29.4 2003 55.2 62.9 37.2 72.7 78.6 72.9 56.3 28.5 2004 53.8 62.2 42.1 74.2 75.8 69.0 51.1 24.7 2005 55.1 64.1 40.6 75.8 78.5 71.8 55.2 24.7 2006 55.1 64.6 39.4 76.0 80.1 73.1 55.3 23.4 2007 56.7 65.7 38.1 76.8 82.5 75.0 56.8 26.6 2008 56.6 66.4 37.5 77.4 82.2 76.2 57.3 24.7 2009 54.7 64.8 35.1 75.0 80.4 74.5 56.6 21.7 2010 53.4 63.3 32.3 73.1 79.6 73.8 55.0 21.5 2011 51.1 60.5 30.4 70.4 76.3 70.2 52.3 20.6 2012 52.4 62.2 31.3 71.3 77.9 72.7 54.6 20.5 2013 52.0 61.8 30.5 69.8 77.2 74.0 54.1 19.8 2014 51.7 61.7 29.8 70.1 76.6 73.5 54.8 19.2 2015 50.7 61.7 31.5 70.7 77.5 74.8 49.7 15.5

Tables 55
Table 1.4. Unemployment rate by groups of age, gender and urban/rural area in the 1996-2015 period
- % -
Groups of age Gender
Urban/rural area Period
TOTAL
15-24 years 25-34 years 35-44 years 45-54 years 55 years and over
TOTAL 1996 6.5 20.0 7.1 4.8 2.9 0.6 1997 5.8 18.0 6.4 4.4 2.7 0.5 1998 6.1 18.2 6.7 5.2 3.4 0.4 1999 6.6 18.8 7.4 5.9 4.3 0.5 2000 6.9 18.4 7.7 6.6 4.8 0.5 2001 6.4 17.2 7.1 6.0 4.6 0.5 2002 8.4 21.7 8.7 7.1 6.0 1.0 2003 7.0 18.5 7.4 5.8 5.3 1.1 2004 8.0 20.5 8.2 6.3 5.8 1.8 2005 7.1 19.1 7.4 5.9 5.4 1.5 2006 7.2 20.2 7.6 5.9 5.4 1.7 2007 6.4 19.3 6.4 5.1 5.1 1.5 2008 5.6 17.6 5.6 4.6 4.4 1.7 2009 6.5 20.0 6.9 5.3 5.5 2.1 2010 7.0 22.1 7.6 5.7 5.4 2.5 2011 7.2 23.9 7.7 5.8 5.4 2.8 2012 6.8 22.6 8.0 5.4 4.6 2.6 2013 7.1 23.7 8.6 5.4 5.2 2.8 2014 6.8 24.0 7.9 5.2 5.3 2.6 2015 6.8 21.7 8.1 5.3 5.2 3.0
MEN 1996 6.1 17.3 6.3 4.7 3.0 0.8 1997 5.5 16.1 5.8 4.1 3.0 0.8 1998 6.3 17.2 6.8 5.3 3.9 0.7 1999 7.2 18.9 7.7 6.1 4.9 0.7 2000 7.5 19.3 8.0 6.7 5.3 0.8 2001 6.9 17.3 7.8 5.7 5.2 0.9 2002 8.9 21.7 9.0 7.0 7.0 1.7 2003 7.5 18.3 7.9 5.8 5.9 1.6 2004 8.9 22.0 8.8 6.7 6.5 2.7 2005 7.7 19.9 7.8 6.0 5.9 2.2 2006 8.1 20.5 8.7 6.4 6.1 2.6 2007 7.2 20.3 7.3 5.5 5.7 2.3 2008 6.5 17.7 6.6 5.1 5.5 2.7 2009 7.3 20.5 7.9 5.9 6.0 3.0 2010 7.6 22.1 8.3 5.9 5.9 3.5 2011 7.7 24.0 8.4 5.6 5.9 4.2 2012 7.4 22.2 8.8 5.6 4.8 3.6 2013 7.7 23.2 9.5 5.9 5.3 3.7 2014 7.3 23.6 8.7 5.7 5.3 3.4 2015 7.5 20.6 9.1 5.8 5.8 4.0
WOMEN 1996 7.1 23.6 8.2 5.1 2.7 0.4 1997 6.1 20.5 7.2 4.9 2.4 0.3 1998 5.9 19.6 6.6 5.1 2.8 0.1 1999 5.9 18.5 6.9 5.7 3.5 0.2 2000 6.1 17.1 7.3 6.5 4.1 0.2 2001 5.8 17.2 6.2 6.3 3.8 0.2 2002 7.7 21.7 8.3 7.2 4.8 0.3 2003 6.4 18.7 6.7 5.9 4.6 0.5 2004 6.8 18.3 7.4 5.7 4.9 0.8 2005 6.4 17.8 6.9 5.7 4.7 0.7 2006 6.0 19.7 6.0 5.2 4.7 0.6 2007 5.2 17.6 5.1 4.7 4.2 0.5 2008 4.4 17.3 4.4 3.9 3.1 0.4 2009 5.4 19.2 5.5 4.6 4.8 1.1 2010 6.2 22.1 6.7 5.4 4.8 1.2 2011 6.5 23.7 6.8 6.0 4.8 1.0 2012 6.1 23.0 6.8 5.2 4.4 1.2 2013 6.3 24.6 7.4 4.7 5.1 1.7 2014 6.1 24.7 6.9 4.6 5.2 1.6 2015 5.8 23.4 6.6 4.6 4.3 1.7

56 Labour force in Romania: Employment and unemployment - 2015
Table 1.4. Unemployment rate by groups of age, gender and urban/rural area in the 1996-2015 period
(continued)
- % -
Groups of age Gender
Urban/rural area Period
TOTAL
15-24 years 25-34 years 35-44 years 45-54 years 55 years and over
URBAN 1996 9.1 28.5 8.3 5.8 4.2 2.5 1997 8.3 26.6 7.9 5.5 4.0 2.3 1998 9.1 27.2 8.5 6.3 5.1 2.0 1999 10.2 29.1 9.3 7.3 6.5 3.2 2000 11.1 29.5 10.2 8.8 7.3 2.9 2001 10.4 27.8 9.7 8.0 6.9 3.3 2002 11.2 29.5 10.2 8.5 7.7 4.8 2003 9.5 25.8 8.7 7.2 7.0 4.8 2004 9.6 26.2 8.9 6.2 6.8 6.4 2005 8.8 25.6 8.4 6.3 6.3 4.7 2006 8.5 26.4 8.3 6.3 6.2 3.8 2007 7.6 23.5 6.9 6.0 5.9 3.6 2008 6.5 21.8 5.9 5.0 5.1 3.5 2009 7.6 25.6 7.2 5.8 6.5 3.8 2010 8.8 30.3 8.9 6.7 6.7 5.3 2011 8.6 31.8 8.4 6.4 6.3 5.8 2012 8.3 30.6 9.0 6.3 5.5 5.3 2013 8.7 32.3 9.7 6.1 6.4 5.8 2014 8.1 32.6 8.9 5.9 6.0 5.0 2015 7.0 26.9 8.1 4.9 5.4 4.5
RURAL 1996 4.1 13.5 5.5 2.9 1.5 0.2 1997 3.4 11.7 4.5 2.4 1.3 0.2 1998 3.3 11.3 4.4 3.0 1.3 0.1 1999 3.4 10.6 4.9 3.4 1.6 0.1 2000 3.1 9.6 4.6 2.9 1.5 0.1 2001 2.8 8.8 4.0 2.6 1.6 0.1 2002 5.4 14.9 6.6 4.8 3.5 0.3 2003 4.3 11.9 5.7 3.6 2.8 0.3 2004 6.1 15.2 7.1 6.3 4.0 0.6 2005 5.1 13.4 6.0 5.2 3.8 0.6 2006 5.5 14.8 6.4 5.1 4.1 0.9 2007 4.9 15.7 5.5 3.7 3.7 0.7 2008 4.6 14.2 5.2 4.0 3.5 1.0 2009 5.3 15.8 6.5 4.7 3.9 1.3 2010 4.8 15.8 5.6 4.2 3.6 1.1 2011 5.5 17.5 6.5 4.8 4.0 1.1 2012 5.0 16.3 6.3 4.3 3.3 1.1 2013 5.2 17.6 6.8 4.3 3.6 1.1 2014 5.3 18.3 6.4 4.4 4.1 1.1 2015 6.6 18.5 8.1 5.8 4.9 1.9

Tables 57
Table 2.1. Main indicators of labour market, by gender and urban/rural area
- % -
Gender Urban/rural area Indicators of labour market Total
Men Women Urban Rural
Employment rate of population aged 20-64 years
66.0 74.7 57.2 65.4 66.9
Unemployment rate 6.8 7.5 5.8 7.0 6.6
Long-term unemployment rate 3.0 3.3 2.6 3.0 2.9
Long-term unemployment rate for young people
13.1 12.6 14.0 15.8 11.5
Long-term unemployment incidence 43.9 43.8 44.1 43.3 44.6
Long-term unemployment incidence for young people 60.6 61.2 59.9 58.6 62.4
Underemployed persons (% in active population)
2.9 3.4 2.3 0.6 5.7
Potential additional labour force (% in active population)
3.9 3.1 5.1 3.3 4.8
Early schools leavers for young people (18-24 years)
19.1 19.5 18.5 10.1 28.5
Weight of persons aged 30-34 years with superior level of education
25.6 24.2 27.2 37.4 8.1
Young people aged 20-24 having at least medium education level 79.7 79.3 80.2 88.8 69.4
Long-life learning 1.3 1.3 1.3 1.7 0.7
Rate of young people neither in employment nor in education or training (15-24 years) 18.1 15.0 21.4 15.1 21.0

58 Labour force in Romania: Employment and unemployment - 2015
Table 2.2. Population by labour status, gender, urban/rural area and groups of age
Economically active persons
Total Employed Unemployed
Economically
inactive
persons
Activity
rate1)
Employment
rate 2)
Unemployment
rate 3)
Gender Urban/rural area
Groups of age - persons - - percentages -
TOTAL 9159296 8535386 623910 10700141 54.5 50.8 6.8under 15 years - - - 3066872 - - -15-19 years 139797 98655 41142 942461 12.9 9.1 29.420-24 years 544490 437411 107079 561326 49.2 39.6 19.725-29 years 1130926 1016070 114855 278959 80.2 72.1 10.230-34 years 1110698 1044365 66332 228758 82.9 78.0 6.035-39 years 1341147 1268447 72701 223683 85.7 81.1 5.440-44 years 1304588 1236768 67821 219534 85.6 81.1 5.245-49 years 1292557 1224708 67849 267256 82.9 78.5 5.250-54 years 837331 794966 42366 270843 75.6 71.7 5.155-59 years 780604 745907 34697 595632 56.7 54.2 4.460-64 years 376039 367505 8534 956893 28.2 27.6 2.365 years and over 301119 300583 * 3087925 8.9 8.9 0.2
MEN 5243245 4848347 394898 4465950 64.5 59.6 7.5under 15 years - - - 1576142 - - -15-19 years 85409 62922 22487 469342 15.4 11.3 26.320-24 years 332099 268713 63386 241796 57.9 46.8 19.125-29 years 659335 584883 74451 76586 89.6 79.5 11.330-34 years 641622 597207 44414 47686 93.1 86.6 6.935-39 years 754447 709901 44546 45046 94.4 88.8 5.940-44 years 735088 692770 42317 46764 94.0 88.6 5.845-49 years 729705 684555 45150 69131 91.3 85.7 6.250-54 years 473908 448981 24928 82532 85.2 80.7 5.355-59 years 459394 434080 25314 202635 69.4 65.6 5.560-64 years 227922 220225 7697 387414 37.0 35.8 3.465 years and over 144316 144110 * 1220875 10.6 10.6 0.1
WOMEN 3916051 3687038 229012 6234192 45.2 42.6 5.8under 15 years - - - 1490730 - - -15-19 years 54387 35733 18654 473119 10.3 6.8 34.320-24 years 212391 168698 43692 319530 39.9 31.7 20.625-29 years 471591 431187 40404 202373 70.0 64.0 8.630-34 years 469076 447158 21918 181071 72.1 68.8 4.735-39 years 586700 558546 28154 178638 76.7 73.0 4.840-44 years 569501 543997 25504 172770 76.7 73.3 4.545-49 years 562852 540153 22699 198125 74.0 71.0 4.050-54 years 363423 345985 17438 188311 65.9 62.7 4.855-59 years 321210 311827 9382 392996 45.0 43.7 2.960-64 years 148117 147280 * 569479 20.6 20.5 0.665 years and over 156802 156474 * 1867050 7.7 7.7 0.2
1) Share of economically active population in groups of age x in total population in the same groups of age x. 2) Share of employment in groups of age x in total population in the same groups of age x. 3) Share of unemployed in economically active population.

Tables 59
Table 2.2. Population by labour status, gender, urban/rural area and groups of age
(continued) Economically active persons
Total Employed Unemployed
Economically
inactive
persons
Activity
rate1)
Employment
rate 2)
Unemployment
rate 3)
Gender Urban/rural area
Groups of age - persons - - percentages -
URBAN 5012926 4662492 350434 5679825 54.7 50.9 7.0under 15 years - - - 1532079 - - -15-19 years 26451 12892 13559 470779 5.3 2.6 51.320-24 years 231564 175723 55841 357441 39.3 29.8 24.125-29 years 698308 627279 71029 142857 83.0 74.6 10.230-34 years 690338 649464 40874 110038 86.3 81.1 5.935-39 years 788763 749859 38904 104260 88.3 84.0 4.940-44 years 726797 691148 35650 96260 88.3 84.0 4.945-49 years 749467 709759 39708 141959 84.1 79.6 5.350-54 years 492954 465497 27457 154277 76.2 71.9 5.655-59 years 447792 425824 21968 378599 54.2 51.5 4.960-64 years 139906 134722 * 629614 18.2 17.5 3.765 years and over 20585 20325 * 1561663 1.3 1.3 1.3
RURAL 4146370 3872894 273477 5020316 54.3 50.7 6.6under 15 years - - - 1534793 - - -15-19 years 113346 85763 27583 471682 19.4 14.7 24.320-24 years 312925 261688 51237 203885 60.5 50.6 16.425-29 years 432617 388791 43826 136102 76.1 68.4 10.130-34 years 420360 394902 25458 118720 78.0 73.3 6.135-39 years 552384 518588 33796 119423 82.2 77.2 6.140-44 years 577791 545620 32171 123274 82.4 77.8 5.645-49 years 543091 514949 28142 125296 81.3 77.0 5.250-54 years 344378 329469 14909 116566 74.7 71.5 4.355-59 years 332812 320084 12729 217032 60.5 58.2 3.860-64 years 236132 232783 * 327280 41.9 41.3 1.465 years and over 280533 280258 * 1526262 15.5 15.5 0.1
1) Share of economically active population in groups of age x in total population in the same groups of age x. 2) Share of employment in groups of age x in total population in the same groups of age x. 3) Share of unemployed in economically active population.
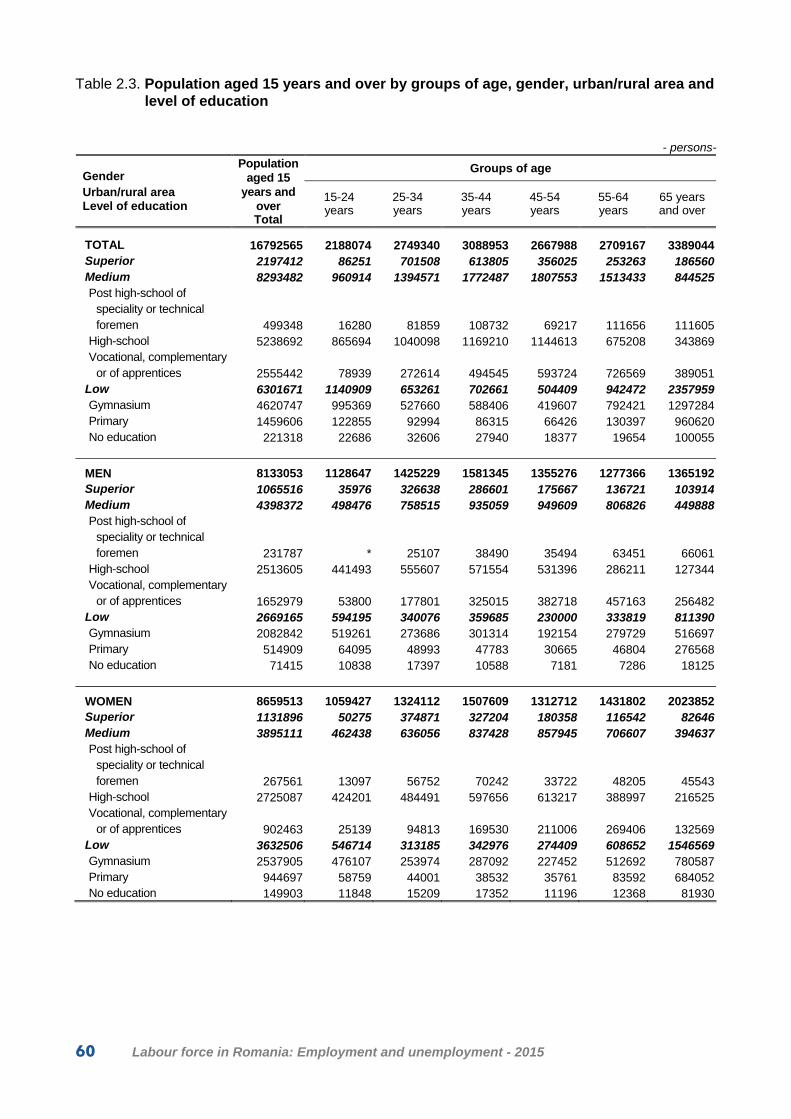
60 Labour force in Romania: Employment and unemployment - 2015
Table 2.3. Population aged 15 years and over by groups of age, gender, urban/rural area and level of education
- persons-
Groups of age Gender Urban/rural area Level of education
Population aged 15
years and over Total
15-24 years
25-34 years
35-44 years
45-54 years
55-64 years
65 years and over
TOTAL 16792565 2188074 2749340 3088953 2667988 2709167 3389044Superior 2197412 86251 701508 613805 356025 253263 186560Medium 8293482 960914 1394571 1772487 1807553 1513433 844525Post high-school of
speciality or technical foremen 499348 16280 81859 108732 69217 111656 111605
High-school 5238692 865694 1040098 1169210 1144613 675208 343869Vocational, complementary
or of apprentices 2555442 78939 272614 494545 593724 726569 389051Low 6301671 1140909 653261 702661 504409 942472 2357959Gymnasium 4620747 995369 527660 588406 419607 792421 1297284Primary 1459606 122855 92994 86315 66426 130397 960620No education 221318 22686 32606 27940 18377 19654 100055
MEN 8133053 1128647 1425229 1581345 1355276 1277366 1365192Superior 1065516 35976 326638 286601 175667 136721 103914Medium 4398372 498476 758515 935059 949609 806826 449888Post high-school of
speciality or technical foremen 231787 * 25107 38490 35494 63451 66061
High-school 2513605 441493 555607 571554 531396 286211 127344Vocational, complementary
or of apprentices 1652979 53800 177801 325015 382718 457163 256482Low 2669165 594195 340076 359685 230000 333819 811390Gymnasium 2082842 519261 273686 301314 192154 279729 516697Primary 514909 64095 48993 47783 30665 46804 276568No education 71415 10838 17397 10588 7181 7286 18125
WOMEN 8659513 1059427 1324112 1507609 1312712 1431802 2023852Superior 1131896 50275 374871 327204 180358 116542 82646Medium 3895111 462438 636056 837428 857945 706607 394637Post high-school of
speciality or technical foremen 267561 13097 56752 70242 33722 48205 45543
High-school 2725087 424201 484491 597656 613217 388997 216525Vocational, complementary
or of apprentices 902463 25139 94813 169530 211006 269406 132569Low 3632506 546714 313185 342976 274409 608652 1546569Gymnasium 2537905 476107 253974 287092 227452 512692 780587Primary 944697 58759 44001 38532 35761 83592 684052No education 149903 11848 15209 17352 11196 12368 81930
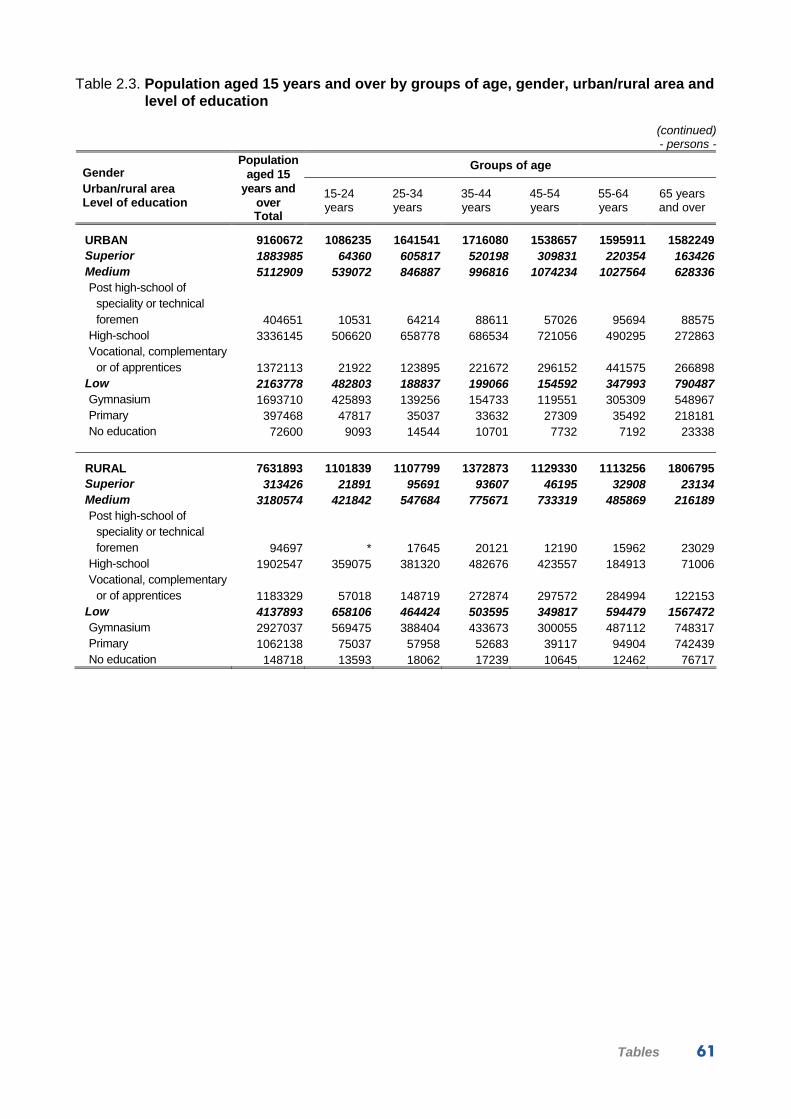
Tables 61
Table 2.3. Population aged 15 years and over by groups of age, gender, urban/rural area and level of education
(continued) - persons -
Groups of age Gender Urban/rural area Level of education
Population aged 15
years and over Total
15-24 years
25-34 years
35-44 years
45-54 years
55-64 years
65 years and over
URBAN 9160672 1086235 1641541 1716080 1538657 1595911 1582249Superior 1883985 64360 605817 520198 309831 220354 163426Medium 5112909 539072 846887 996816 1074234 1027564 628336Post high-school of
speciality or technical foremen 404651 10531 64214 88611 57026 95694 88575
High-school 3336145 506620 658778 686534 721056 490295 272863Vocational, complementary
or of apprentices 1372113 21922 123895 221672 296152 441575 266898Low 2163778 482803 188837 199066 154592 347993 790487Gymnasium 1693710 425893 139256 154733 119551 305309 548967Primary 397468 47817 35037 33632 27309 35492 218181No education 72600 9093 14544 10701 7732 7192 23338
RURAL 7631893 1101839 1107799 1372873 1129330 1113256 1806795Superior 313426 21891 95691 93607 46195 32908 23134Medium 3180574 421842 547684 775671 733319 485869 216189Post high-school of
speciality or technical foremen 94697 * 17645 20121 12190 15962 23029
High-school 1902547 359075 381320 482676 423557 184913 71006Vocational, complementary
or of apprentices 1183329 57018 148719 272874 297572 284994 122153Low 4137893 658106 464424 503595 349817 594479 1567472Gymnasium 2927037 569475 388404 433673 300055 487112 748317Primary 1062138 75037 57958 52683 39117 94904 742439No education 148718 13593 18062 17239 10645 12462 76717

62 Labour force in Romania: Employment and unemployment - 2015
Table 2.4. Population aged 15 years and over by labour status, gender, urban/rural area, marital status and groups of age
Economically active persons Population aged 15
years and over Total
Total Employed Unemployed
Economically
inactive
persons
Activity
rate1)
Employment
rate 2)
Unemploy-
ment
rate 3)
Gender Urban/rural area Marital status Groups of age
- persons - - percentages -
TOTAL 16792565 9159296 8535386 623910 7633269 54.5 50.8 6.8
15-24 years 2188073 684286 536066 148221 1503787 31.3 24.5 21.725-34 years 2749340 2241624 2060436 181188 507716 81.5 74.9 8.135-44 years 3088953 2645736 2505214 140521 443217 85.7 81.1 5.345-54 years 2667988 2129889 2019674 110215 538099 79.8 75.7 5.255-64 years 2709168 1156643 1113412 43230 1552525 42.7 41.1 3.765 years and over 3389044 301119 300583 * 3087925 8.9 8.9 0.2
Unmarried 4131669 2236225 1920733 315493 1895444 54.1 46.5 14.1
15-24 years 2043882 609727 471613 138113 1434155 29.8 23.1 22.725-34 years 1222068 1022295 901662 120633 199773 83.7 73.8 11.835-44 years 440477 361183 325151 36032 79294 82.0 73.8 10.045-54 years 231343 174024 156959 17064 57319 75.2 67.8 9.855-64 years 133469 62711 59061 * 70758 47.0 44.3 5.865 years and over 60431 * * - 54145 10.4 10.4 -
Married 9690034 6023909 5766488 257422 3666125 62.2 59.5 4.3
15-24 years 130868 68734 59350 9383 62134 52.5 45.4 13.725-34 years 1449349 1156189 1101614 54575 293160 79.8 76.0 4.735-44 years 2431525 2094186 2003828 90358 337339 86.1 82.4 4.345-54 years 2059030 1660530 1587574 72956 398500 80.6 77.1 4.455-64 years 1923379 857563 827818 29745 1065816 44.6 43.0 3.565 years and over 1695883 186707 186303 * 1509176 11.0 11.0 0.2
Widower 2141201 356321 342279 14042 1784880 16.6 16.0 3.9
15-24 years 7988 * * * * 27.5 25.6 7.025-34 years 13843 11488 10406 * * 83.0 75.2 9.435-44 years 35939 30198 27644 * * 84.0 76.9 8.545-54 years 118066 82743 77799 * 35323 70.1 65.9 6.055-64 years 425048 131455 126204 * 293593 30.9 29.7 4.065 years and over 1540316 98241 98184 * 1442075 6.4 6.4 0.1
Divorced 829660 542840 505887 36953 286820 65.4 61.0 6.8
15-24 years * * * * * 68.0 57.4 15.725-34 years 64079 51651 46754 * 12428 80.6 73.0 9.535-44 years 181010 160168 148591 11578 20842 88.5 82.1 7.245-54 years 259549 212592 197342 15250 46957 81.9 76.0 7.255-64 years 227272 104914 100329 * 122358 46.2 44.1 4.465 years and over 92414 9885 9810 * 82529 10.7 10.6 0.8
1) Share of economically active population in groups of age x in total population in the same groups of age x. 2) Share of employment in groups of age x in total population in the same groups of age x. 3) Share of unemployed in economically active population.

Tables 63
Table 2.4. Population aged 15 years and over by labour status, gender, urban/rural area, marital status and groups of age
(continued) Economically active persons Population
aged 15 years and
over Total
Total Employed Unemployed
Economically
inactive
persons
Activity
rate1)
Employment
rate 2)
Unemploy-
ment
rate 3)
Gender Urban/rural area Marital status Groups of age
- persons - - percentages -
MEN 8133053 5243245 4848347 394898 2889808 64.5 59.6 7.515-24 years 1128646 417508 331634 85874 711138 37.0 29.4 20.625-34 years 1425228 1300956 1182090 118866 124272 91.3 82.9 9.135-44 years 1581345 1489535 1402671 86863 91810 94.2 88.7 5.845-54 years 1355276 1203613 1133536 70077 151663 88.8 83.6 5.855-64 years 1277365 687316 654305 33011 590049 53.8 51.2 4.865 years and over 1365191 144316 144110 * 1220875 10.6 10.6 0.1
Unmarried 2468598 1533553 1321567 211986 935045 62.1 53.5 13.8Married 4837989 3344228 3189028 155200 1493761 69.1 65.9 4.6Widower 482224 116684 109341 7343 365540 24.2 22.7 6.3Divorced 344242 248780 228411 20369 95462 72.3 66.4 8.2
WOMEN 8659513 3916051 3687038 229012 4743462 45.2 42.6 5.8
15-24 years 1059427 266778 204431 62347 792649 25.2 19.3 23.425-34 years 1324111 940667 878346 62322 383444 71.0 66.3 6.635-44 years 1507608 1156201 1102543 53658 351407 76.7 73.1 4.645-54 years 1312711 926275 886138 40137 386436 70.6 67.5 4.355-64 years 1431802 469327 459107 10220 962475 32.8 32.1 2.265 years and over 2023852 156802 156474 * 1867050 7.7 7.7 0.2
Unmarried 1663072 702673 599166 103507 960399 42.3 36.0 14.7Married 4852046 2679682 2577460 102222 2172364 55.2 53.1 3.8Widow 1658976 239636 232938 6699 1419340 14.4 14.0 2.8Divorced 485418 294060 277475 16584 191358 60.6 57.2 5.6
URBAN 9160672 5012926 4662492 350434 4147746 54.7 50.9 7.0
15-24 years 1086235 258015 188615 69400 828220 23.8 17.4 26.925-34 years 1641540 1388646 1276743 111903 252894 84.6 77.8 8.135-44 years 1716080 1515560 1441007 74554 200520 88.3 84.0 4.945-54 years 1538657 1242420 1175256 67164 296237 80.7 76.4 5.455-64 years 1595911 587698 560546 27152 1008213 36.8 35.1 4.665 years and over 1582248 20585 20325 * 1561663 1.3 1.3 1.3
Unmarried 2170070 1146305 978392 167913 1023765 52.8 45.1 14.6Married 5456085 3430696 3278243 152454 2025389 62.9 60.1 4.4Widower 1026372 112342 104356 7986 914030 10.9 10.2 7.1Divorced 508144 323582 301501 22081 184562 63.7 59.3 6.8
RURAL 7631893 4146370 3872894 273477 3485523 54.3 50.7 6.6
15-24 years 1101838 426271 347451 78820 675567 38.7 31.5 18.525-34 years 1107799 852977 783693 69284 254822 77.0 70.7 8.135-44 years 1372873 1130175 1064208 65968 242698 82.3 77.5 5.845-54 years 1129330 887468 844418 43051 241862 78.6 74.8 4.955-64 years 1113257 568945 552866 16078 544312 51.1 49.7 2.865 years and over 1806795 280533 280258 * 1526262 15.5 15.5 0.1
Unmarried 1961599 1089920 942340 147580 871679 55.6 48.0 13.5Married 4233949 2593213 2488245 104968 1640736 61.2 58.8 4.0Widower 1114827 243978 237922 * 870849 21.9 21.3 2.5Divorced 321517 219259 204386 14873 102258 68.2 63.6 6.8
1) Share of economically active population in groups of age x in total population in the same groups of age x. 2) Share of employment in groups of age x in total population in the same groups of age x. 3) Share of unemployed in economically active population.

64 Labour force in Romania: Employment and unemployment - 2015
Table 2.5. Young population (15-24 years) by labour status, gender, urban/rural area and groups of age
- persons -
Economically active persons Economically inactive
persons Gender Urban/rural area Groups of age
Population
aged 15-24
years
Total
Total of which:
employed Total
of which:
pupils, students
TOTAL 2188074 684286 536066 1503787 124486615 years 228044 8624 6636 219420 20670116-18 years 658490 72140 52806 586350 53651919-22 years 885091 334805 253885 550287 42389423-24 years 416448 268718 222739 147730 77752
MEN 1128647 417508 331634 711138 62198215 years 114258 * * 108831 10279516-18 years 342218 44008 33744 298210 27740419-22 years 457282 209815 161846 247467 20544723-24 years 214888 158258 131807 56630 36336
WOMEN 1059427 266778 204431 792649 62288415 years 113786 * * 110590 10390616-18 years 316272 28132 19062 288140 25911519-22 years 427809 124990 92039 302819 21844723-24 years 201560 110460 90932 91100 41416
URBAN 1086235 258015 188615 828220 72794915 years 102839 * * 100837 9738816-18 years 304876 10222 * 294654 28181319-22 years 456901 113860 77338 343041 29204123-24 years 221619 131932 105101 89688 56706
RURAL 1101839 426271 347451 675567 51691715 years 125205 6622 * 118584 10931316-18 years 353615 61919 47407 291696 25470619-22 years 428190 220945 176547 207245 13185323-24 years 194828 136786 117637 58042 21046

Tables 65
Table 2.6. Young population (15-24 years) by groups of age, gender, urban/rural area and participation in formal education
- persons -
Groups of age Gender Urban/rural area
Level of education
Population
aged 15-24
years
Total
15 years 16-18 years 19-22 years 23-24 years
TOTAL 2188074 228044 658490 885091 416448Higher (including short-term university,
master, Ph.D., post-Ph.D and post-
university studies) 446983 - 9894 358016 79073Medium and low 827982 209014 533393 79762 *No one 913108 19030 115203 447313 331561
MEN 1128647 114258 342218 457282 214888Higher (including master, Ph.D., post-Ph.D
and post-university studies) 216613 - * 175142 38014Medium and low 419659 104126 277406 36476 *No one 492374 10132 61355 245664 175223
WOMEN 1059427 113786 316272 427809 201560Higher (including master, Ph.D., post-Ph.D
and post-university studies) 230370 - * 182873 41059Medium and low 408323 104888 255986 43287 *No one 420734 8898 53848 201649 156338
URBAN 1086235 102839 304876 456901 221619Higher (including master, Ph.D., post-Ph.D
and post-university studies) 319892 - 6524 255259 58110Medium and low 423495 97602 276317 45143 *No one 342847 * 22035 156499 159077
RURAL 1101839 125205 353615 428190 194828Higher (including master, Ph.D., post-Ph.D
and post-university studies) 127091 - * 102756 20964Medium and low 404487 111412 257076 34619 *No one 570261 13794 93168 290814 172485

66 Labour force in Romania: Employment and unemployment - 2015
Table 2.7. Elderly population (50 years and over) by labour status, gender, urban/rural area, and groups of age
- persons -
Economically active persons Economically inactive persons
Unemployed of which:
Gender Urban/rural area
Groups of age
Population aged 50
years and over
Total
Total EmployedTotal
of which: with
unemploy-ment
duration of 12 months and over
Total Pensioners, beneficiaries
of social assistence
Housewives
TOTAL 7206386 2295093 2208962 86131 38718 4911293 4399439 41031650-56 years 1625442 1172934 1114351 58583 27684 452508 226499 17748457-61 years 1393565 630184 606294 23890 9118 763381 619150 11077462-64 years 798335 190856 187732 * * 607479 560772 3770165-69 years 1042992 178055 177662 * * 864937 827835 3296770-74 years 779165 123064 122921 * * 656101 631603 2154275-79 years 789592 - - - - 789592 769830 1742480 years and over 777294 - - - - 777294 763750 12424
MEN 3198997 1305541 1247396 58145 25225 1893456 1815469 *
50-56 years 810349 668477 632540 35938 16836 141872 104684 *57-61 years 660760 379865 360538 19327 7205 280895 251945 *62-64 years 362697 112883 110208 * * 249814 242619 *65-69 years 462938 90150 90018 * * 372788 370677 -70-74 years 324444 54167 54092 * - 270277 268560 -75-79 years 303195 - - - - 303195 302732 -80 years and over 274615 - - - - 274615 274253 -
WOMEN 4007389 989552 961566 27986 13494 3017837 2583970 409275
50-56 years 815093 504457 481812 22645 10848 310636 121815 17718157-61 years 732805 250319 245756 * * 482486 367205 11018862-64 years 435638 77973 77524 * * 357665 318153 3754965-69 years 580054 87905 87644 * * 492149 457158 3296770-74 years 454721 68898 68830 * * 385823 363044 2154275-79 years 486397 - - - - 486397 467098 1742480 years and over 502680 - - - - 502680 489497 12424
URBAN 3825391 1101237 1046369 54869 25504 2724153 2488871 191284
50-56 years 957595 690313 652460 37853 18747 267282 152784 9095857-61 years 832868 332845 318186 14660 * 500022 434353 5005062-64 years 452679 57494 55398 * * 395186 376562 1599365-69 years 534887 16230 16045 * * 518657 503764 1392470-74 years 362915 * * * - 358559 348514 922075-79 years 359177 - - - - 359177 352025 692080 years and over 325270 - - - - 325270 320869 *
RURAL 3380995 1193856 1162593 31263 13214 2187139 1910568 219032
50-56 years 667846 482621 461891 20730 8937 185225 73714 8652657-61 years 560697 297339 288109 9230 * 263359 184797 6072462-64 years 345656 133362 132334 * * 212294 184210 2170965-69 years 508105 161824 161617 * * 346281 324071 1904370-74 years 416251 118709 118641 * * 297541 283089 1232275-79 years 430415 - - - - 430415 417805 1050480 years and over 452024 - - - - 452024 442881 8205

Tables 67
Table 2.8. Population aged 15 years and over by groups of age, gender and urban/rural area, by labour status and relationship with labour market
- persons -
Groups of age Gender Urban/rural area
Labour status Relationship with labour
market
Population aged 15 years
and over
Total
15-24 years
25-34 years
35-44 years
45-54 years
55-64 years
65 years and over
TOTAL 16792565 2188074 2749340 3088953 2667988 2709167 3389044
Employed persons 8535386 536066 2060436 2505214 2019674 1113412 300583
Not seek for another job 8434266 517832 2030324 2474086 2002739 1108750 300536
Seek for another job, but not
available to start working 1) * * - * * - -
Seek for another job and available to
start working 1) 100198 18108 30112 30570 16697 * *
Unemployed persons 623910 148221 181188 140521 110215 43230 *
Economically inactive persons 7633269 1503787 507716 443217 538099 1552525 3087925
Not seek for a job and not available to
start working 1) 7272178 1417429 418482 360789 472516 1516023 3086939
Not seek for a job, but available to
start working 1) 356685 85409 88182 81226 64856 36027 *
Seek for a job, but not available to
start working 1) * * * * * * - MEN 8133053 1128647 1425229 1581345 1355276 1277366 1365192
Employed persons 4848347 331634 1182090 1402671 1133536 654305 144110
Not seek for another job 4775526 317845 1161678 1379618 1121199 651124 144062
Seek for another job, but not
available to start working 1) * * - * * - -
Seek for another job and available to
start working 1) 72099 13664 20413 22626 12167 * *
Unemployed persons 394898 85874 118866 86863 70077 33011 *
Economically inactive persons 2889808 711138 124272 91810 151663 590049 1220875
Not seek for a job and not available to
start working 1) 2727193 663393 86433 62142 124710 570379 1220136
Not seek for a job, but available to
start working 1) 159815 47248 37192 28853 26416 19366 *
Seek for a job, but not available to
start working 1) * * * * * * -
WOMEN 8659513 1059427 1324112 1507609 1312712 1431802 2023852
Employed persons 3687038 204431 878346 1102543 886138 459107 156474
Not seek for another job 3658740 199987 868646 1094468 881540 457626 156474
Seek for another job, but not
available to start working 1) * - - * * - -
Seek for another job and available to
start working 1) 28098 * 9700 7943 * * -
Unemployed persons 229012 62347 62322 53658 40137 10220 *
Economically inactive persons 4743462 792649 383444 351407 386436 962475 1867050
Not seek for a job and not available to
start working 1) 4544985 754037 332048 298647 347806 945644 1866803
Not seek for a job, but available to
start working 1) 196870 38161 50989 52373 38440 16661 *
Seek for a job, but not available to
start working 1) * * * * * * -
1) The availability to start working refers to the next two weeks (including the week of the interview).
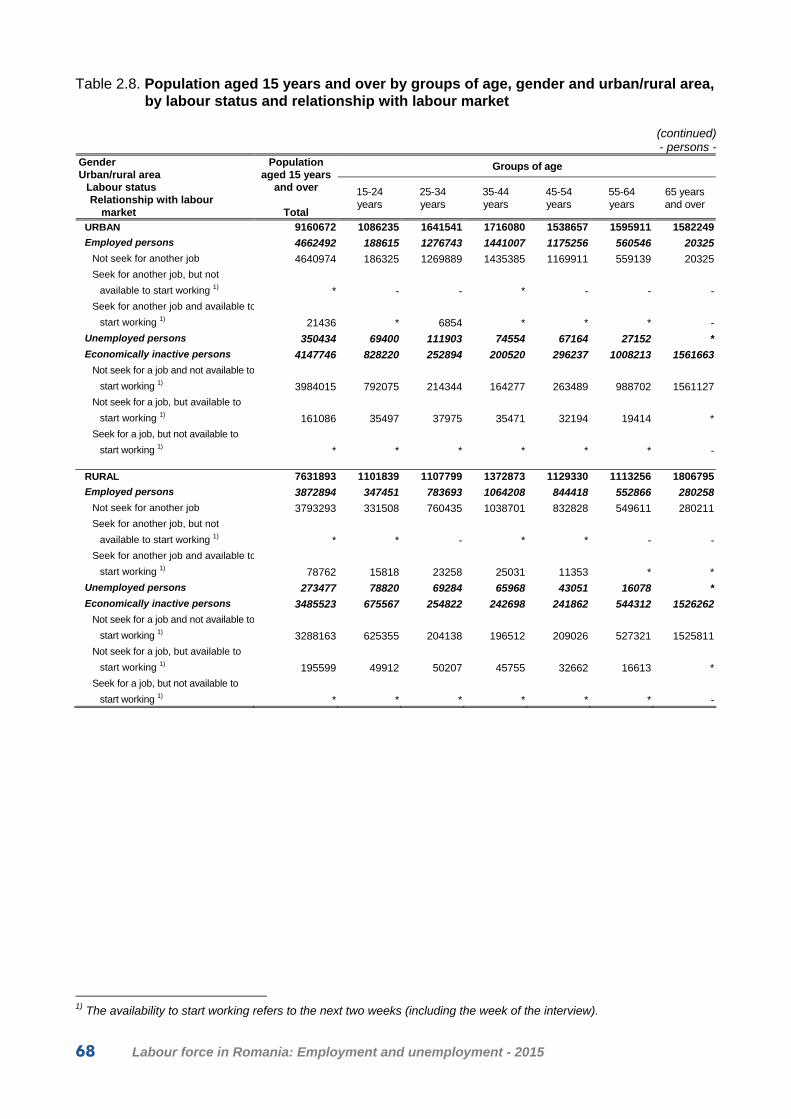
68 Labour force in Romania: Employment and unemployment - 2015
Table 2.8. Population aged 15 years and over by groups of age, gender and urban/rural area, by labour status and relationship with labour market
(continued) - persons -
Groups of age Gender Urban/rural area
Labour status Relationship with labour
market
Population aged 15 years
and over
Total
15-24 years
25-34 years
35-44 years
45-54 years
55-64 years
65 years and over
URBAN 9160672 1086235 1641541 1716080 1538657 1595911 1582249
Employed persons 4662492 188615 1276743 1441007 1175256 560546 20325
Not seek for another job 4640974 186325 1269889 1435385 1169911 559139 20325
Seek for another job, but not
available to start working 1) * - - * - - -
Seek for another job and available to
start working 1) 21436 * 6854 * * * -
Unemployed persons 350434 69400 111903 74554 67164 27152 *
Economically inactive persons 4147746 828220 252894 200520 296237 1008213 1561663
Not seek for a job and not available to
start working 1) 3984015 792075 214344 164277 263489 988702 1561127
Not seek for a job, but available to
start working 1) 161086 35497 37975 35471 32194 19414 *
Seek for a job, but not available to
start working 1) * * * * * * - RURAL 7631893 1101839 1107799 1372873 1129330 1113256 1806795
Employed persons 3872894 347451 783693 1064208 844418 552866 280258
Not seek for another job 3793293 331508 760435 1038701 832828 549611 280211
Seek for another job, but not
available to start working 1) * * - * * - -
Seek for another job and available to
start working 1) 78762 15818 23258 25031 11353 * *
Unemployed persons 273477 78820 69284 65968 43051 16078 *
Economically inactive persons 3485523 675567 254822 242698 241862 544312 1526262
Not seek for a job and not available to
start working 1) 3288163 625355 204138 196512 209026 527321 1525811
Not seek for a job, but available to
start working 1) 195599 49912 50207 45755 32662 16613 *
Seek for a job, but not available to
start working 1) * * * * * * -
1) The availability to start working refers to the next two weeks (including the week of the interview).

Tables 69
Table 2.9. Economically active population by status in employment, gender, urban/rural area and by activities of the national economy
- persons -
Status in employment
Gender Urban/rural area
Activities of the national economy
Economically active
population
Total Employee Employer
Self-employed
Contributing family worker
Member of an agricultural
holding or of a non
agricultural cooperative
Unemployed who ceased
working for at least 8 years or who have
never worked
TOTAL 9159296 6282700 97037 1588714 819477 * 371005Agriculture, forestry and fishing 2212346 187672 * 1217839 802047 * -Mining and quarrying 75110 74640 * * - - -Manufacturing 1613887 1576583 9584 25537 * - -Production and supply of electric and
thermal energy, gas, hot water and air conditioning 84020 83829 * * - - -
Water distribution; sanitation, waste administration, decontamination activities 88637 84590 * * * - -
Constructions 676990 508592 8376 158915 * - -Wholesale and retail; repair of motors
vehicles and motorcycles 1198654 1093562 43390 54910 6792 - -Transport and storage 485766 457130 7643 20993 - - -Hotels and restaurants 198935 188565 7139 * - - -Information and communications 177106 162846 * 7619 * - -Financial intermediation and insurance 108249 107231 * * - - -Real estate transactions 22646 19182 * * * - -Professional, scientific and technical
activities 188395 165222 * 18736 - - -Activities of administrative services
and activities of support services 217595 213067 * * * - -Public administration and defence;
social insurance of public system 446264 446264 - - - - -Education 357720 355141 * * - - -Health and social assistance 391216 378485 * 10446 - - -Showbiz, cultural and recreation
activities 58612 51859 * * * - -Other activities of the national
economy 186144 128240 * 53757 * - -
Unemployed who ceased working for at least 8 years or who have never worked 371005 - - - - - 371005
MEN 5243245 3540582 72046 1135868 268473 * 225913Agriculture, forestry and fishing 1264447 149138 * 851819 260277 * -Mining and quarrying 63250 62865 * * - - -Manufacturing 943782 914384 7434 20846 * - -Production and supply of electric and
thermal energy, gas, hot water and air conditioning 69859 69668 * * - - -
Water distribution; sanitation, waste administration, decontamination activities 67234 63595 * * * - -
Constructions 631335 464154 7661 158501 * - -Wholesale and retail; repair of motors
vehicles and motorcycles 544628 474453 30700 36794 * - -Transport and storage 407755 380058 7336 20361 - - -Hotels and restaurants 80104 73110 * * - - -Information and communications 104336 95059 * * * - -Financial intermediation and insurance 37803 37243 * * - - -Real estate transactions 12969 10071 * * * - -Professional, scientific and technical
activities 83485 70806 * 9539 - - -Activities of administrative services
and activities of support services 160857 158604 * * * - -

70 Labour force in Romania: Employment and unemployment - 2015
Table 2.9. Economically active population by status in employment, gender, urban/rural area and by activities of the national economy
(continued) - persons -
Status in employment
Gender Urban/rural area
Activities of the national economy
Economically active
population
Total
Employee Employer Self-
employed
Contributing family worker
Member of an agricultural
holding or of a non
agricultural cooperative
Unemployed who ceased
working for at least 8 years or who have
never worked
Public administration and defence; social insurance of public system 283407 283407 - - - - -
Education 86897 85341 * * - - -Health and social assistance 81699 77955 * * - - -Showbiz, cultural and recreation
activities 30628 25204 * * * - -Other activities of the national
economy 62856 45467 * 16341 * - -
Unemployed who ceased working for at least 8 years or who have never worked 225913 - - - - - 225913
WOMEN 3916051 2742118 24991 452846 551003 - 145093Agriculture, forestry and fishing 947899 38534 * 366020 541770 - -Mining and quarrying 11859 11775 - * - - -Manufacturing 670105 662200 * * * - -Production and supply of electric and
thermal energy, gas, hot water and air conditioning 14160 14160 - - - - -
Water distribution; sanitation, waste administration, decontamination activities 21403 20995 * - * - -
Constructions 45655 44438 * * * - -Wholesale and retail; repair of motors
vehicles and motorcycles 654026 619108 12690 18116 * - -Transport and storage 78011 77072 * * - - -Hotels and restaurants 118831 115455 * * - - -Information and communications 72770 67786 * * * - -Financial intermediation and insurance 70445 69987 * * - - -Real estate transactions 9678 9111 - * - - -Professional, scientific and technical
activities 104910 94416 * 9197 - - -Activities of administrative services
and activities of support services 56737 54463 * * - - -Public administration and defence;
social insurance of public system 162857 162857 - - - - -Education 270823 269800 * * - - -Health and social assistance 309517 300530 * 8161 - - -Showbiz, cultural and recreation
activities 27984 26655 - * * - -Other activities of the national
economy 123288 82774 * 37416 * - -
Unemployed who ceased working for at least 8 years or who have never worked 145093 - - - - - 145093
URBAN 5012926 4435288 70018 278007 44216 - 185397Agriculture, forestry and fishing 187624 59093 * 89539 37683 - -Mining and quarrying 44837 44576 * - - - -Manufacturing 1045842 1028006 6760 10391 * - -Production and supply of electric and
thermal energy, gas, hot water and air conditioning 61920 61772 * - - - -
Water distribution; sanitation, waste administration, decontamination activities 61083 57518 * * * - -
Constructions 382218 315377 * 60845 * - -

Tables 71
Table 2.9. Economically active population by status in employment, gender, urban/rural area and by activities of the national economy
(continued) - persons -
Status in employment
Gender Urban/rural area
Activities of the national economy
Economically active
population
Total
Employee Employer Self-
employed
Contributing family worker
Member of an agricultural
holding or of a non
agricultural cooperative
Unemployed who ceased
working for at least 8 years or who have
never worked
Wholesale and retail; repair of motors vehicles and motorcycles 898385 827263 30838 36826 * - -
Transport and storage 336153 318781 * 12573 - - -Hotels and restaurants 152273 143358 * * - - -Information and communications 153072 147473 * * - - -Financial intermediation and insurance 98971 98148 * * - - -Real estate transactions 20189 16921 * * * - -Professional, scientific and technical
activities 165879 145671 * 16358 - - -Activities of administrative services
and activities of support services 137916 135080 * * - - -Public administration and defence;
social insurance of public system 334734 334734 - - - - -Education 265802 264313 * * - - -Health and social assistance 311520 301045 * 8629 - - -Showbiz, cultural and recreation
activities 46842 42186 * * - - -Other activities of the national
economy 122271 93974 * 24589 * - -
Unemployed who ceased working for at least 8 years or who have never worked 185397 - - - - - 185397
RURAL 4146370 1847412 27020 1310706 775261 * 185609Agriculture, forestry and fishing 2024722 128579 * 1128300 764364 * -Mining and quarrying 30273 30064 - * - - -Manufacturing 568045 548577 * 15146 * - -Production and supply of electric and
thermal energy, gas, hot water and air conditioning 22100 22057 - * - - -
Water distribution; sanitation, waste administration, decontamination activities 27554 27072 * * - - -
Constructions 294772 193215 * 98069 * - -Wholesale and retail; repair of motors
vehicles and motorcycles 300269 266299 12552 18084 * - -Transport and storage 149613 138349 * 8420 - - -Hotels and restaurants 46662 45207 * * - - -Information and communications 24035 15373 * * * - -Financial intermediation and insurance 9277 9083 * * - - -Real estate transactions * * * * - - -Professional, scientific and technical
activities 22516 19552 * * - - -Activities of administrative services
and activities of support services 79679 77988 * * * - -Public administration and defence;
social insurance of public system 111530 111530 - - - - -Education 91918 90829 * * - - -Health and social assistance 79696 77441 * * - - -Showbiz, cultural and recreation
activities 11770 9672 - * * - -Other activities of the national
economy 63873 34267 * 29168 * - -
Unemployed who ceased working for at least 8 years or who have never worked 185609 - - - - - 185609

72 Labour force in Romania: Employment and unemployment - 2015
Table 2.10. Economically active population by ownership type of workplace, gender, urban/rural area and activities of the national economy
- persons -
Ownership type of workplace Gender Urban/rural area
Activities of the national economy
Economically active
population
Total Public 1) Private 2) Mixed
Unemployed who ceased working
for at least 8 years or who have never
worked
TOTAL 9159296 1422936 7262889 102465 371005Agriculture, forestry and fishing 2212346 24735 2185809 * -Mining and quarrying 75110 42163 30155 * -Manufacturing 1613887 24601 1554074 35211 -Production and supply of electric and thermal energy, gas,
hot water and air conditioning 84020 34130 40151 9739 -Water distribution; sanitation, waste administration,
decontamination activities 88637 23810 59244 * -Constructions 676990 15733 658397 * -Wholesale and retail; repair of motors vehicles and
motorcycles 1198654 14784 1175660 8210 -Transport and storage 485766 85802 381323 18640 -Hotels and restaurants 198935 * 191413 * -Information and communications 177106 * 167156 * -Financial intermediation and insurance 108249 9504 96781 * -Real estate transactions 22646 * 21076 * -Professional, scientific and technical activities 188395 25200 161983 * -Activities of administrative services and activities of
support services 217595 25480 190108 * -Public administration and defence; social insurance of
public system 446264 446264 - - -Education 357720 325552 30104 * -Health and social assistance 391216 270879 117421 * -Showbiz, cultural and recreation activities 58612 17941 40105 * -Other activities of the national economy 186144 22721 161928 * -
Unemployed who ceased working for at least 8 years
or who have never worked 371005 - - - 371005
MEN 5243245 685173 4264028 68132 225913Agriculture, forestry and fishing 1264447 21365 1241499 * -Mining and quarrying 63250 35681 25246 * -Manufacturing 943782 17395 899819 26568 -Production and supply of electric and thermal energy, gas,
hot water and air conditioning 69859 29456 32263 8140 -Water distribution; sanitation, waste administration,
decontamination activities 67234 16500 46462 * -Constructions 631335 13847 615135 * -Wholesale and retail; repair of motors vehicles and
motorcycles 544628 * 535362 * -
1) Public includes: “state (public)” and “public of national and local interest”. 2) Private includes: “private”, “co-operative” and “community”.

Tables 73
Table 2.10. Economically active population by ownership type of workplace, gender, urban/rural area and activities of the national economy
(continued) - persons -
Ownership type of workplace Gender Urban/rural area
Activities of the national economy
Economically active
population
Total Public 1) Private 2) Mixed
Unemployed who ceased working
for at least 8 years or who have never
worked
Transport and storage 407755 59581 334646 13528 -Hotels and restaurants 80104 * 77615 * -Information and communications 104336 * 98487 * -Financial intermediation and insurance 37803 * 34161 * -Real estate transactions 12969 * 12212 - -Professional, scientific and technical activities 83485 11871 70878 * -Activities of administrative services and activities of
support services 160857 17779 141589 * -Public administration and defence; social insurance of
public system 283407 283407 - - -Education 86897 76745 9767 * -Health and social assistance 81699 59257 22191 * -Showbiz, cultural and recreation activities 30628 8604 21928 * -Other activities of the national economy 62856 17495 44769 * -
Unemployed who ceased working for at least 8 years
or who have never worked 225913 - - - 225913
WOMEN 3916051 737764 2998861 34333 145093Agriculture, forestry and fishing 947899 * 944310 * -Mining and quarrying 11859 * * * -Manufacturing 670105 7206 654255 8644 -Production and supply of electric and thermal energy, gas,
hot water and air conditioning 14160 * 7889 * -Water distribution; sanitation, waste administration,
decontamination activities 21403 7311 12783 * -Constructions 45655 * 43261 * -Wholesale and retail; repair of motors vehicles and
motorcycles 654026 8555 640298 * -Transport and storage 78011 26221 46677 * -Hotels and restaurants 118831 * 113799 * -Information and communications 72770 * 68669 * -Financial intermediation and insurance 70445 * 62620 * -Real estate transactions 9678 * 8864 * -Professional, scientific and technical activities 104910 13329 91105 * -Activities of administrative services and activities of
support services 56737 7701 48519 * -Public administration and defence; social insurance of
public system 162857 162857 - - -Education 270823 248806 20338 * -
1) Public includes: “state (public)” and “public of national and local interest”. 2) Private includes: “private”, “co-operative” and “community”.

74 Labour force in Romania: Employment and unemployment - 2015
Table 2.10. Economically active population by ownership type of workplace, gender, urban/rural area and activities of the national economy
(continued) - persons -
Ownership type of workplace Gender Urban/rural area
Activities of the national economy
Economically active
population
Total Public 1) Private 2) Mixed
Unemployed who ceased working
for at least 8 years or who have never
worked
Health and social assistance 309517 211622 95230 * -Showbiz, cultural and recreation activities 27984 9336 18177 * -Other activities of the national economy 123288 * 117159 * -
Unemployed who ceased working for at least 8 years
or who have never worked 145093 - - - 145093
URBAN 5012926 1061333 3688590 77605 185397Agriculture, forestry and fishing 187624 11065 175911 * -Mining and quarrying 44837 30652 12138 * -Manufacturing 1045842 19334 999889 26619 -Production and supply of electric and thermal energy, gas,
hot water and air conditioning 61920 26068 28411 7441 -Water distribution; sanitation, waste administration,
decontamination activities 61083 17834 38807 * -Constructions 382218 9985 370574 * -Wholesale and retail; repair of motors vehicles and
motorcycles 898385 10923 881225 * -Transport and storage 336153 62056 260532 13565 -Hotels and restaurants 152273 * 146996 * -Information and communications 153072 * 143843 * -Financial intermediation and insurance 98971 8294 88928 * -Real estate transactions 20189 * 18857 - -Professional, scientific and technical activities 165879 21346 143579 * -Activities of administrative services and activities of
support services 137916 19513 116797 * -Public administration and defence; social insurance of
public system 334734 334734 - - -Education 265802 239043 25134 * -Health and social assistance 311520 211862 96983 * -Showbiz, cultural and recreation activities 46842 14219 32056 * -Other activities of the national economy 122271 13298 107931 * -
Unemployed who ceased working for at least 8 years
or who have never worked 185397 - - - 185397
1) Public includes: “state (public)” and “public of national and local interest”. 2) Private includes: “private”, “co-operative” and “community”.

Tables 75
Table 2.10. Economically active population by ownership type of workplace, gender, urban/rural area and activities of the national economy
(continued) - persons -
Ownership type of workplace Gender Urban/rural area
Activities of the national economy
Economically active
population
Total Public 1) Private 2) Mixed
Unemployed who ceased working
for at least 8 years or who have never
worked
RURAL 4146370 361603 3574299 24860 185609Agriculture, forestry and fishing 2024722 13670 2009897 * -Mining and quarrying 30273 11511 18017 * -Manufacturing 568045 * 554185 8592 -Production and supply of electric and thermal energy, gas,
hot water and air conditioning 22100 8062 11741 * -Water distribution; sanitation, waste administration,
decontamination activities 27554 * 20437 * -Constructions 294772 * 287823 * -Wholesale and retail; repair of motors vehicles and
motorcycles 300269 * 294435 * -Transport and storage 149613 23747 120791 * -Hotels and restaurants 46662 * 44418 * -Information and communications 24035 * 23313 * -Financial intermediation and insurance 9277 * 7853 * -Real estate transactions * * * * -Professional, scientific and technical activities 22516 * 18403 * -Activities of administrative services and activities of
support services 79679 * 73311 * -Public administration and defence; social insurance of
public system 111530 111530 - - -Education 91918 86509 * * -Health and social assistance 79696 59017 20438 * -Showbiz, cultural and recreation activities 11770 * 8049 - -Other activities of the national economy 63873 9423 53997 * -
Unemployed who ceased working for at least 8 years
or who have never worked 185609 - - - 185609
1) Public includes: “state (public)” and “public of national and local interest”. 2) Private includes: “private”, “co-operative” and “community”.
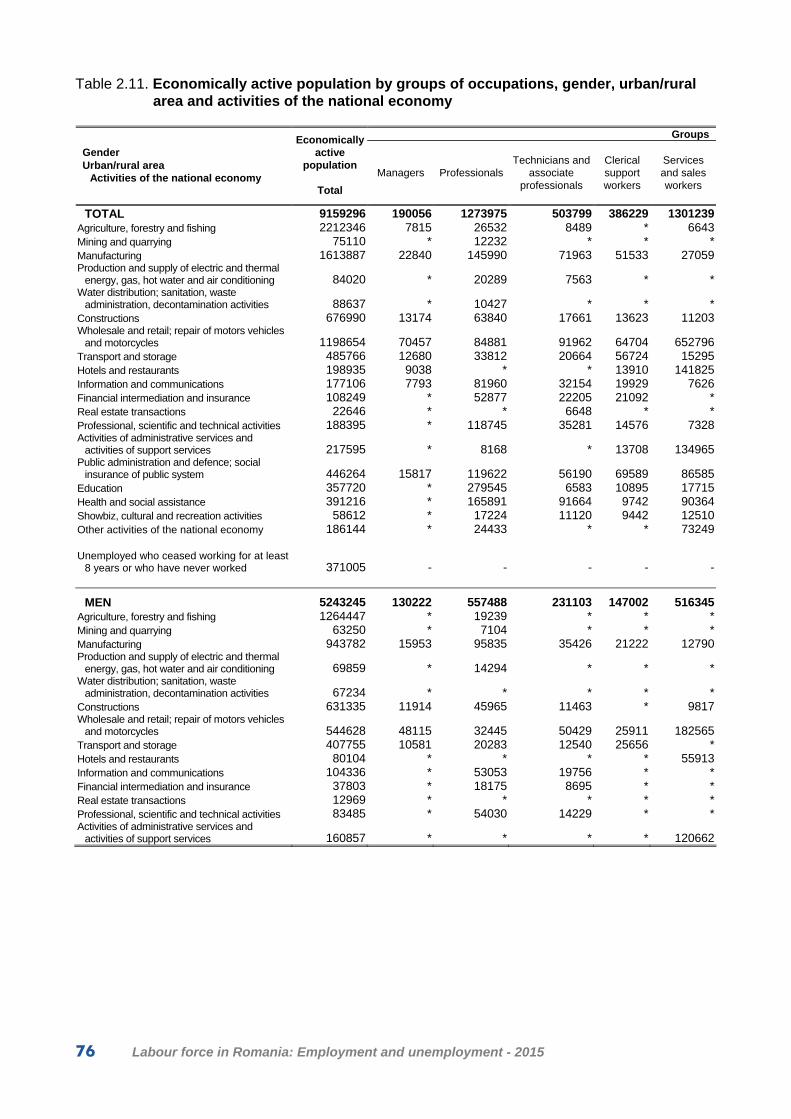
76 Labour force in Romania: Employment and unemployment - 2015
Table 2.11. Economically active population by groups of occupations, gender, urban/rural area and activities of the national economy
Groups
Gender Urban/rural area
Activities of the national economy
Economically active
population
Total
Managers Professionals
Technicians and
associate professionals
Clerical support workers
Services and sales workers
TOTAL 9159296 190056 1273975 503799 386229 1301239Agriculture, forestry and fishing 2212346 7815 26532 8489 * 6643Mining and quarrying 75110 * 12232 * * *Manufacturing 1613887 22840 145990 71963 51533 27059Production and supply of electric and thermal
energy, gas, hot water and air conditioning 84020 * 20289 7563 * *Water distribution; sanitation, waste
administration, decontamination activities 88637 * 10427 * * *Constructions 676990 13174 63840 17661 13623 11203Wholesale and retail; repair of motors vehicles
and motorcycles 1198654 70457 84881 91962 64704 652796Transport and storage 485766 12680 33812 20664 56724 15295Hotels and restaurants 198935 9038 * * 13910 141825Information and communications 177106 7793 81960 32154 19929 7626Financial intermediation and insurance 108249 * 52877 22205 21092 *Real estate transactions 22646 * * 6648 * *Professional, scientific and technical activities 188395 * 118745 35281 14576 7328Activities of administrative services and
activities of support services 217595 * 8168 * 13708 134965Public administration and defence; social
insurance of public system 446264 15817 119622 56190 69589 86585Education 357720 * 279545 6583 10895 17715Health and social assistance 391216 * 165891 91664 9742 90364Showbiz, cultural and recreation activities 58612 * 17224 11120 9442 12510Other activities of the national economy 186144 * 24433 * * 73249
Unemployed who ceased working for at least
8 years or who have never worked 371005 - - - - -
MEN 5243245 130222 557488 231103 147002 516345Agriculture, forestry and fishing 1264447 * 19239 * * *Mining and quarrying 63250 * 7104 * * *Manufacturing 943782 15953 95835 35426 21222 12790Production and supply of electric and thermal
energy, gas, hot water and air conditioning 69859 * 14294 * * *Water distribution; sanitation, waste
administration, decontamination activities 67234 * * * * *Constructions 631335 11914 45965 11463 * 9817Wholesale and retail; repair of motors vehicles
and motorcycles 544628 48115 32445 50429 25911 182565Transport and storage 407755 10581 20283 12540 25656 *Hotels and restaurants 80104 * * * * 55913Information and communications 104336 * 53053 19756 * *Financial intermediation and insurance 37803 * 18175 8695 * *Real estate transactions 12969 * * * * *Professional, scientific and technical activities 83485 * 54030 14229 * *Activities of administrative services and
activities of support services 160857 * * * * 120662

Tables 77
- persons - of occupations
Skilled workers in agriculture, forestry and
fishing
Craft and related workers
Other categories of occupations
of which:
elementary occupations
Unemployed who ceased
working for at least 8 years or who have
never worked
Gender Urban/rural area
Activities of the national economy
1835133 1413903 1883956 868664 371005 TOTAL 1809914 18773 331593 296287 - Agriculture, forestry and fishing
* 18662 36280 * - Mining and quarrying 8479 708239 577783 147776 - Manufacturing
- 39930 10394 * -Production and supply of electric and thermal
energy, gas, hot water and air conditioning
- 19992 43870 34022 -Water distribution; sanitation, waste
administration, decontamination activities * 418945 137406 101589 - Constructions
* 110374 122364 67233 -Wholesale and retail; repair of motors vehicles
and motorcycles * 32117 314301 17401 - Transport and storage * * 22732 16162 - Hotels and restaurants
9416 12434 * * - Information and communications * * * * - Financial intermediation and insurance - * * * - Real estate transactions - * * * - Professional, scientific and technical activities
* * 45703 38716 -Activities of administrative services and
activities of support services
* * 92559 17951 -Public administration and defence; social
insurance of public system * * 35921 32832 - Education * * 24793 13671 - Health and social assistance * * * * - Showbiz, cultural and recreation activities * 9301 65980 63076 - Other activities of the national economy
- - - - 371005Unemployed who ceased working for at least
8 years or who have never worked
1007979 1127320 1299874 505889 225913 MEN 990386 18628 218961 183783 - Agriculture, forestry and fishing
* 18158 32849 * - Mining and quarrying 7609 441336 313611 85455 - Manufacturing
- 39119 8935 * -Production and supply of electric and thermal
energy, gas, hot water and air conditioning
- 19497 36083 26729 -Water distribution; sanitation, waste
administration, decontamination activities * 414164 132945 97726 - Constructions
* 106673 98204 44606 -Wholesale and retail; repair of motors vehicles
and motorcycles * 31046 302322 12662 - Transport and storage - * 9514 * - Hotels and restaurants * 9159 * * - Information and communications * - * - - Financial intermediation and insurance - * * * - Real estate transactions - * * * - Professional, scientific and technical activities
* * 22400 16299 -Activities of administrative services and
activities of support services
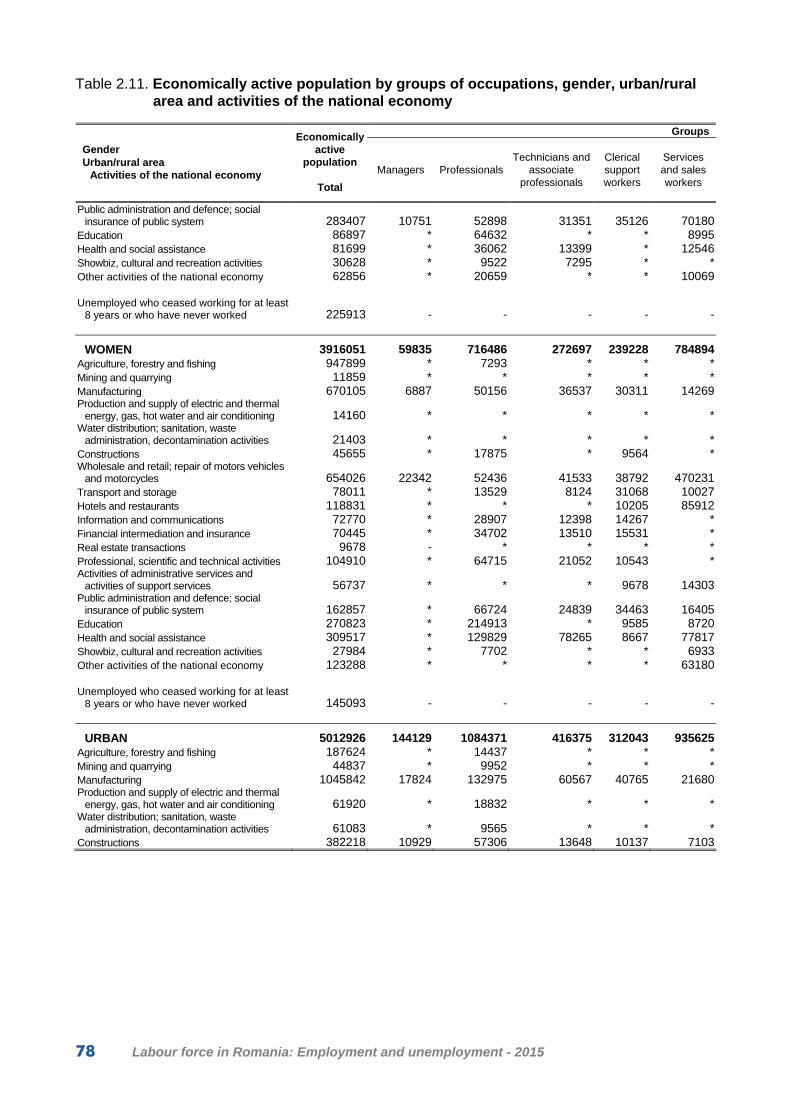
78 Labour force in Romania: Employment and unemployment - 2015
Table 2.11. Economically active population by groups of occupations, gender, urban/rural area and activities of the national economy
Groups
Gender Urban/rural area
Activities of the national economy
Economically active
population
Total
Managers Professionals
Technicians and
associate professionals
Clerical support workers
Services and sales workers
Public administration and defence; social insurance of public system 283407 10751 52898 31351 35126 70180
Education 86897 * 64632 * * 8995Health and social assistance 81699 * 36062 13399 * 12546Showbiz, cultural and recreation activities 30628 * 9522 7295 * *Other activities of the national economy 62856 * 20659 * * 10069
Unemployed who ceased working for at least
8 years or who have never worked 225913 - - - - -
WOMEN 3916051 59835 716486 272697 239228 784894Agriculture, forestry and fishing 947899 * 7293 * * *Mining and quarrying 11859 * * * * *Manufacturing 670105 6887 50156 36537 30311 14269Production and supply of electric and thermal
energy, gas, hot water and air conditioning 14160 * * * * *Water distribution; sanitation, waste
administration, decontamination activities 21403 * * * * *Constructions 45655 * 17875 * 9564 *Wholesale and retail; repair of motors vehicles
and motorcycles 654026 22342 52436 41533 38792 470231Transport and storage 78011 * 13529 8124 31068 10027Hotels and restaurants 118831 * * * 10205 85912Information and communications 72770 * 28907 12398 14267 *Financial intermediation and insurance 70445 * 34702 13510 15531 *Real estate transactions 9678 - * * * *Professional, scientific and technical activities 104910 * 64715 21052 10543 *Activities of administrative services and
activities of support services 56737 * * * 9678 14303Public administration and defence; social
insurance of public system 162857 * 66724 24839 34463 16405Education 270823 * 214913 * 9585 8720Health and social assistance 309517 * 129829 78265 8667 77817Showbiz, cultural and recreation activities 27984 * 7702 * * 6933Other activities of the national economy 123288 * * * * 63180
Unemployed who ceased working for at least
8 years or who have never worked 145093 - - - - -
URBAN 5012926 144129 1084371 416375 312043 935625Agriculture, forestry and fishing 187624 * 14437 * * *Mining and quarrying 44837 * 9952 * * *Manufacturing 1045842 17824 132975 60567 40765 21680Production and supply of electric and thermal
energy, gas, hot water and air conditioning 61920 * 18832 * * *Water distribution; sanitation, waste
administration, decontamination activities 61083 * 9565 * * *Constructions 382218 10929 57306 13648 10137 7103

Tables 79
(continued)
- persons - of occupations
Skilled workers in agriculture, forestry and
fishing
Craft and related workers
Other categories of occupations
of which:
elementary occupations
Unemployed who ceased
working for at least 8 years or who have never worked
Gender Urban/rural area
Activities of the national economy
* * 77315 7226 -Public administration and defence; social
insurance of public system - * * * - Education * * 11828 * - Health and social assistance * * * * - Showbiz, cultural and recreation activities * 8198 15739 13787 - Other activities of the national economy
- - - - 225913Unemployed who ceased working for at least
8 years or who have never worked
827154 286583 584082 362776 145093 WOMEN 819528 * 112632 112504 - Agriculture, forestry and fishing
* * * * - Mining and quarrying * 266903 264172 62321 - Manufacturing
- * * * -Production and supply of electric and thermal
energy, gas, hot water and air conditioning
- * 7786 7293 -Water distribution; sanitation, waste
administration, decontamination activities * * * * - Constructions
* * 24160 22628 -Wholesale and retail; repair of motors vehicles
and motorcycles * * 11978 * - Transport and storage * * 13218 13188 - Hotels and restaurants * * * * - Information and communications - * * * - Financial intermediation and insurance - * * * - Real estate transactions - * * * - Professional, scientific and technical activities
* * 23303 22417 -Activities of administrative services and
activities of support services
- * 15245 10725 -Public administration and defence; social
insurance of public system * * 29637 29221 - Education - * 12965 12363 - Health and social assistance - * * * - Showbiz, cultural and recreation activities * * 50241 49289 - Other activities of the national economy
- - - - 145093Unemployed who ceased working for at least
8 years or who have never worked
124637 851814 958534 328194 185397 URBAN 118573 * 37597 29136 - Agriculture, forestry and fishing
- 8926 21125 * - Mining and quarrying * 448039 322207 66247 - Manufacturing
- 24905 7298 * -Production and supply of electric and thermal
energy, gas, hot water and air conditioning
- 11892 29136 23648 -Water distribution; sanitation, waste
administration, decontamination activities * 220011 62334 42847 - Constructions

80 Labour force in Romania: Employment and unemployment - 2015
Table 2.11. Economically active population by groups of occupations, gender, urban/rural area and activities of the national economy
Groups
Gender Urban/rural area
Activities of the national economy
Economically active
population
Total
Managers Professionals
Technicians and
associate professionals
Clerical support workers
Services and sales workers
Wholesale and retail; repair of motors vehicles and motorcycles 898385 52639 76575 77749 55147 478663
Transport and storage 336153 9667 31821 17177 40936 12551Hotels and restaurants 152273 8421 * * 10770 108188Information and communications 153072 7520 75454 30253 18511 7295Financial intermediation and insurance 98971 * 50502 20511 18184 *Real estate transactions 20189 * * * * *Professional, scientific and technical activities 165879 * 107314 28571 13247 6740Activities of administrative services and
activities of support services 137916 * * * 11007 78902Public administration and defence; social
insurance of public system 334734 7994 96468 40409 55528 58660Education 265802 * 214205 * 8464 12824Health and social assistance 311520 * 145949 79298 8823 54269Showbiz, cultural and recreation activities 46842 * 14656 8537 8118 11028Other activities of the national economy 122271 * 16047 * * 62466
Unemployed who ceased working for at least
8 years or who have never worked 185397 - - - - -
RURAL 4146370 45927 189604 87424 74186 365614Agriculture, forestry and fishing 2024722 * 12095 * * *Mining and quarrying 30273 * * * * *Manufacturing 568045 * 13015 11395 10767 *Production and supply of electric and thermal
energy, gas, hot water and air conditioning 22100 * * * * *Water distribution; sanitation, waste
administration, decontamination activities 27554 * * * * *Constructions 294772 * 6534 * * *Wholesale and retail; repair of motors vehicles
and motorcycles 300269 17819 8306 14213 9557 174134Transport and storage 149613 * * * 15788 *Hotels and restaurants 46662 * * * * 33636Information and communications 24035 * 6505 * * *Financial intermediation and insurance 9277 * * * * *Real estate transactions * * * * * *Professional, scientific and technical activities 22516 * 11431 6710 * *Activities of administrative services and
activities of support services 79679 * * * * 56063Public administration and defence; social
insurance of public system 111530 7824 23154 15781 14060 27925Education 91918 * 65341 * * *Health and social assistance 79696 * 19943 12366 * 36094Showbiz, cultural and recreation activities 11770 * * * * *Other activities of the national economy 63873 * 8386 * * 10783
Unemployed who ceased working for at least
8 years or who have never worked 185609 - - - - -

Tables 81
(continued)
- persons - of occupations
Skilled workers in agriculture, forestry and
fishing
Craft and related workers
Other categories of occupations
of which:
elementary occupations
Unemployed who ceased
working for at least 8 years or who have never worked
Gender Urban/rural area
Activities of the national economy
* 76896 80178 43223 -Wholesale and retail; repair of motors vehicles
and motorcycles * 21200 202625 8490 - Transport and storage * * 15394 10883 - Hotels and restaurants * 9210 * * - Information and communications * * * * - Financial intermediation and insurance - * * * - Real estate transactions - * * * - Professional, scientific and technical activities
* * 31731 26853 -Activities of administrative services and
activities of support services
* * 72492 12067 -Public administration and defence; social
insurance of public system * * 19962 18696 - Education * * 15567 8707 - Health and social assistance * * * * - Showbiz, cultural and recreation activities * 7379 27475 25403 - Other activities of the national economy
- - - - 185397Unemployed who ceased working for at least
8 years or who have never worked
1710496 562089 925422 540470 185609 RURAL 1691340 13119 293996 267150 - Agriculture, forestry and fishing
* 9736 15155 * - Mining and quarrying 6695 260200 255576 81529 - Manufacturing
- 15025 * * -Production and supply of electric and thermal
energy, gas, hot water and air conditioning
- 8100 14734 10374 -Water distribution; sanitation, waste
administration, decontamination activities * 198934 75072 58742 - Constructions
* 33478 42186 24010 -Wholesale and retail; repair of motors vehicles
and motorcycles - 10917 111675 8911 - Transport and storage - * 7338 * - Hotels and restaurants
8368 * * * - Information and communications - - * * - Financial intermediation and insurance - * * * - Real estate transactions - * * * - Professional, scientific and technical activities
* * 13972 11864 -Activities of administrative services and
activities of support services
* * 20068 * -Public administration and defence; social
insurance of public system * * 15959 14136 - Education - * 9226 * - Health and social assistance * * * * - Showbiz, cultural and recreation activities * * 38505 37673 - Other activities of the national economy
- - - - 185609Unemployed who ceased working for at least
8 years or who have never worked

82 Labour force in Romania: Employment and unemployment - 2015
Table 2.12. Economically active population by status in employment, gender, urban/rural area and groups of occupations
- persons -
Status in employment
Gender Urban/rural area
Groups of occupations
Economically active
population
Total Employee Employer
Self-employed
Contributing family worker
Member of an agricultural
holding or of a non
agricultural cooperative
Unemployed who ceased working for at least 8
years or who have never
worked
TOTAL 9159296 6282700 97037 1588714 819477 * 371005Managers 190056 128153 58551 * - - -Professionals 1273975 1232002 10904 30977 * - -Technicians and associate professionals 503799 493308 * 9116 * - -Clerical support workers 386229 383467 * * - - -Service and sales workers 1301239 1212263 23060 61016 * - -Skilled workers in agriculture, forestry and fishing 1835133 60763 * 1035574 738409 - -Craft and related trades workers 1413903 1246586 * 161786 * * -Other categories of occupations 1883956 1526159 * 284685 72389 * -
of which: Elementary occupations 868664 533994 * 262241 72183 * -
Unemployed who ceased working for at least 8 years or who have never worked 371005 - - - - - 371005
MEN 5243245 3540582 72046 1135868 268473 * 225913Managers 130222 82576 44903 * - - -Professionals 557488 533187 7877 16424 - - -Technicians and associate professionals 231103 224473 * * * - -Clerical support workers 147002 145345 * * - - -Service and sales workers 516345 469851 15908 29048 * - -Skilled workers in agriculture, forestry and fishing 1007979 45420 * 725345 236879 - -Craft and related trades workers 1127320 964926 * 158010 * * -Other categories of occupations 1299874 1074805 * 196935 27411 * -
of which: Elementary occupations 505889 303261 * 175067 27314 * -
Unemployed who ceased working for at least 8 years or who have never worked 225913 - - - - - 225913

Tables 83
Table 2.12. Economically active population by status in employment, gender, urban/rural area and groups of occupations
(continued) - persons -
Status in employment
Gender Urban/rural area
Groups of occupations
Economically active
population
Total Employee Employer
Self-employed
Contributing family worker
Member of an agricultural
holding or of a non
agricultural cooperative
Unemployed who ceased working for at least 8
years or who have never
worked
WOMEN 3916051 2742118 24991 452846 551003 - 145093Managers 59835 45577 13648 * - - -Professionals 716486 698815 * 14553 * - -Technicians and associate professionals 272697 268835 * * - - -Clerical support workers 239228 238122 * * - - -Service and sales workers 784894 742412 7152 31969 * - -Skilled workers in agriculture, forestry and fishing 827154 15342 * 310228 501530 - -Craft and related trades workers 286583 281660 * * * - -Other categories of occupations 584082 451354 - 87750 44978 - -
of which: Elementary occupations 362776 230733 - 87174 44869 - -
Unemployed who ceased working for at least 8 years or who have never worked 145093 - - - - - 145093 URBAN 5012926 4435288 70018 278007 44216 - 185397Managers 144129 100908 40865 * - - -Professionals 1084371 1048916 8231 27223 - - -Technicians and associate professionals 416375 407970 * 7433 - - -Clerical support workers 312043 310194 * * - - -Service and sales workers 935625 870605 18130 44751 * - -Skilled workers in agriculture, forestry and fishing 124637 13186 * 76422 34971 - -Craft and related trades workers 851814 785096 * 65078 * - -Other categories of occupations 958534 898412 * 53382 6521 - -
of which: Elementary occupations 328194 280761 * 40880 6521 - -
Unemployed who ceased working for at least 8 years or who have never worked 185397 - - - - - 185397
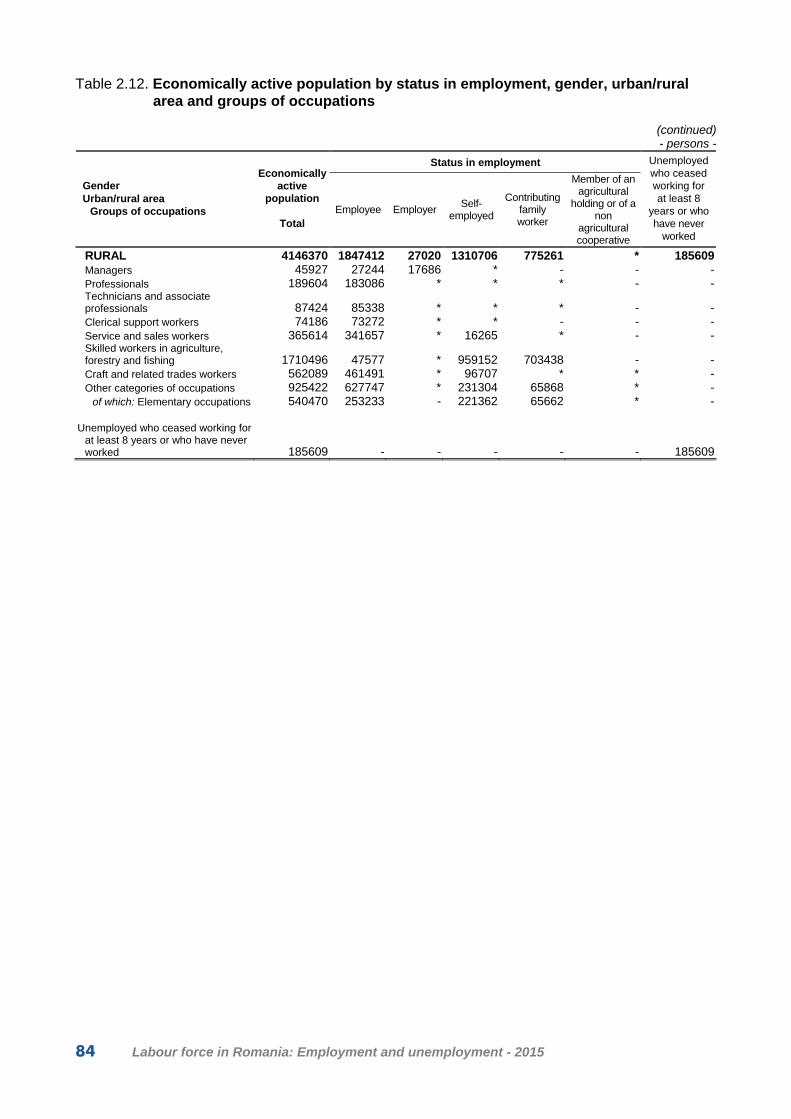
84 Labour force in Romania: Employment and unemployment - 2015
Table 2.12. Economically active population by status in employment, gender, urban/rural area and groups of occupations
(continued) - persons -
Status in employment
Gender Urban/rural area
Groups of occupations
Economically active
population
Total Employee Employer
Self-employed
Contributing family worker
Member of an agricultural
holding or of a non
agricultural cooperative
Unemployed who ceased working for at least 8
years or who have never
worked
RURAL 4146370 1847412 27020 1310706 775261 * 185609Managers 45927 27244 17686 * - - -Professionals 189604 183086 * * * - -Technicians and associate professionals 87424 85338 * * * - -Clerical support workers 74186 73272 * * - - -Service and sales workers 365614 341657 * 16265 * - -Skilled workers in agriculture, forestry and fishing 1710496 47577 * 959152 703438 - -Craft and related trades workers 562089 461491 * 96707 * * -Other categories of occupations 925422 627747 * 231304 65868 * -
of which: Elementary occupations 540470 253233 - 221362 65662 * -
Unemployed who ceased working for at least 8 years or who have never worked 185609 - - - - - 185609

Tables 85
Table 2.13. Economically active population by groups of age, gender, urban/rural area and level of education
- persons -
Groups of age Gender Urban/rural area
Level of education
Economically active
population
Total
15-24 years
25-34 years
35-44 years
45-54 years
55-64 years
65 years and over
TOTAL 9159296 684286 2241624 2645736 2129889 1156643 301119Superior 1798271 56521 649632 592399 336286 155166 8266Medium 5277225 408120 1155352 1542635 1470883 642026 58210Post high-school of
speciality or technical foremen 293688 12295 72280 103748 62666 37865 *
High-school 3412697 327466 853513 1006230 921273 289650 14565Vocational,
complementary or of apprentices 1570840 68358 229559 432657 486944 314511 38812
Low 2083800 219645 436639 510702 322720 359451 234642Gymnasium 1753202 187241 377249 448596 285045 304074 150997Primary 293858 26125 49318 52499 33600 50948 81368No education 36739 * 10072 9606 * * *
MEN 5243245 417508 1300956 1489535 1203613 687316 144316Superior 886081 23764 312979 284205 167765 92152 *Medium 3160420 249803 704212 888898 853063 419882 44562Post high-school of
speciality or technical foremen 119536 * 24425 37279 31297 20768 *
High-school 1913159 198630 515189 547056 481890 161633 8761Vocational,
complementary or of apprentices 1127725 48782 164597 304564 339877 237481 32424
Low 1196744 143941 283765 316431 182785 175282 94539Gymnasium 1008088 120456 240729 271902 158691 148693 67619Primary 166926 19275 36166 38986 21595 24864 26040No education 21729 * 6871 * * * *
WOMEN 3916051 266778 940667 1156201 926275 469327 156802Superior 912190 32757 336654 308194 168521 63014 *Medium 2116805 158316 451140 653736 617819 222145 13649Post high-school of
speciality or technical foremen 174152 9904 47855 66469 31370 17097 *
High-school 1499537 128836 338324 459174 439382 128017 *Vocational,
complementary or of apprentices 443115 19576 64962 128092 147067 77030 *
Low 887056 75705 152874 194271 139935 184168 140103Gymnasium 745114 66786 136520 176695 126354 155381 83378Primary 126932 6850 13152 13513 12005 26085 55327No education 15011 * * * * * *

86 Labour force in Romania: Employment and unemployment - 2015
Table 2.13. Economically active population by groups of age, gender, urban/rural area and level of education
(continued) - persons -
Groups of age Gender Urban/rural area
Level of education
Economically active
population
Total
15-24 years
25-34 years
35-44 years
45-54 years
55-64 years
65 years and over
URBAN 5012926 258015 1388646 1515560 1242420 587698 20585Superior 1542003 42556 564228 504029 293227 134303 *Medium 3020590 171117 711237 878546 869606 381458 8626Post high-school of
speciality or technical foremen 235746 8565 58097 84963 52231 30979 *
High-school 2065176 144562 547573 599072 580012 191111 *Vocational,
complementary or of apprentices 719668 17990 105567 194512 237363 159367 *
Low 450332 44343 113181 132985 79588 71938 8298Gymnasium 375785 35645 92861 110088 67868 62540 6784Primary 65198 7544 17459 19658 11007 8074 *No education 9350 * * * * * *
RURAL 4146370 426271 852977 1130175 887468 568945 280533Superior 256268 13966 85404 88371 43059 20863 *Medium 2256635 237003 444115 664088 601277 260568 49584Post high-school of
speciality or technical foremen 57942 * 14183 18785 10436 6886 *
High-school 1347521 182904 305940 407158 341261 98539 11719Vocational,
complementary or of apprentices 851172 50369 123992 238145 249580 155144 33943
Low 1633467 175303 323458 377716 243133 287513 226344Gymnasium 1377418 151596 284389 338508 217178 241534 144213Primary 228660 18581 31859 32841 22593 42875 79912No education 27390 * 7211 * * * *

Tables 87
Table 2.14. Employment by groups of age, gender, urban/rural area and level of education
- persons - of which, in working age
Groups of age Gender Urban/rural area
Level of education
Employment
Total
Total 15-64 years
15-24 years
25-34 years
35-44 years
45-54 years
55-64 years
TOTAL 8535386 8234802 536066 2060436 2505214 2019674 1113412Superior 1724319 1716053 43428 611195 579486 330042 151902Medium 4896066 4838005 316684 1059906 1458315 1389453 613647Post high-school of
speciality or technical foremen 280531 275773 8584 67910 100918 61646 36716
High-school 3146712 3132146 250052 780827 953596 867589 280083Vocational, complementary
or of apprentices 1468823 1430086 58049 211170 403801 460217 296849Low 1915001 1680744 175953 389335 467413 300180 347863Gymnasium 1620385 1469720 151501 339924 415746 267301 295248Primary 264645 183331 19929 41977 43231 29659 48535No education 29971 27693 * 7434 8437 * *
MEN 4848347 4704238 331634 1182090 1402671 1133536 654305Superior 851818 846602 18325 294394 279246 165098 89538Medium 2914611 2870200 197713 636795 835554 802112 398026Post high-school of
speciality or technical foremen 114112 110811 * 21750 36467 30677 19900
High-school 1751895 1743134 154281 465483 515928 451723 155719Vocational, complementary
or of apprentices 1048604 1016255 41415 149562 283158 319712 222407Low 1081918 987436 115596 250902 287871 166325 166741Gymnasium 919915 852353 98098 215294 250484 145982 142495Primary 144763 118723 14422 30757 32547 18243 22753No education 17240 16360 * * * * *
WOMEN 3687038 3530565 204431 878346 1102543 886138 459107Superior 872501 869450 25103 316801 300240 164943 62363Medium 1981454 1967806 118972 423111 622761 587341 215621Post high-school of
speciality or technical foremen 166419 164962 6567 46160 64451 30969 16816
High-school 1394816 1389012 95771 315344 437667 415866 124364Vocational, complementary
or of apprentices 420219 413831 16634 61608 120643 140505 74442Low 833083 693309 60357 138433 179542 133854 181122Gymnasium 700470 617368 53404 124630 165262 121319 152753Primary 119882 64609 * 11221 10684 11415 25782No education 12731 11333 * * * * *

88 Labour force in Romania: Employment and unemployment - 2015
Table 2.14. Employment by groups of age, gender, urban/rural area and level of education (continued) - persons -
of which, in working age Groups of age
Gender Urban/rural area
Level of education
Employment
Total
Total 15-64 years
15-24 years
25-34 years
35-44 years
45-54 years
55-64 years
URBAN 4662492 4642167 188615 1276743 1441007 1175256 560546Superior 1481576 1477915 33743 532611 493374 287149 131039Medium 2800305 2791829 126954 651855 831486 819038 362496Post high-school of
speciality or technical foremen 225904 225068 * 55111 82568 51287 29912
High-school 1908792 1905946 107650 501858 567824 544903 183712Vocational, complementary
or of apprentices 665609 660815 13115 94887 181093 222848 148873Low 380611 372423 27918 92277 116147 69070 67012Gymnasium 323262 316535 23469 77488 97344 59345 58888Primary 51209 49807 * 13405 15967 9293 7016No education * * * * * * *
RURAL 3872894 3592635 347451 783693 1064208 844418 552866Superior 242743 238137 9685 78584 86112 42893 20863Medium 2095760 2046177 189730 408050 626829 570415 251152Post high-school of
speciality or technical foremen 54628 50706 * 12799 18350 10359 6804
High-school 1237919 1226200 142402 278969 385772 322687 96371Vocational, complementary
or of apprentices 803213 769270 44934 116283 222708 237369 147976Low 1534390 1308322 148035 297058 351266 231110 280852Gymnasium 1297123 1153185 128032 262435 318403 207955 236360Primary 213437 133524 15804 28572 27264 20366 41519No education 23831 21612 * * * * *

Tables 89
Table 2.15. Employment by groups of age, gender, urban/rural area and participation in formal education
- persons -
of which, in working age
Groups of age Gender Urban/rural area
Level of education
Employment
Total Total
15-64 years 15-24 years
25-34 years
35-44 years
45-54 years
55-64 years
TOTAL 8535386 8234802 536066 2060436 2505214 2019674 1113412Higher (including short-
term university, master,
Ph.D., post-Ph.D and
post-university studies) 24762 24762 12596 9416 * * *Medium and low 15660 15660 11741 * * * -No one 8494963 8194380 511729 2048007 2502857 2018485 1113302
MEN 4848347 4704238 331634 1182090 1402671 1133536 654305
Higher (including short-
term university, master,
Ph.D., post-Ph.D and
post-university studies) 11460 11460 * * * * *Medium and low 7452 7452 * * * * -No one 4829434 4685325 319635 1176904 1401875 1132716 654195
WOMEN 3687038 3530565 204431 878346 1102543 886138 459107
Higher (including short-
term university, master,
Ph.D., post-Ph.D and
post-university studies) 13302 13302 6693 * * * -Medium and low 8208 8208 * * * - -No one 3665529 3509055 192094 871103 1100983 885769 459107
URBAN 4662492 4642167 188615 1276743 1441007 1175256 560546
Higher (including short-
term university, master,
Ph.D., post-Ph.D and
post-university studies) 19672 19672 9238 8190 * * -Medium and low * * * * * * -No one 4637051 4616726 176680 1266051 1439291 1174158 560546
RURAL 3872894 3592635 347451 783693 1064208 844418 552866
Higher (including short-
term university, master,
Ph.D., post-Ph.D and
post-university studies) * * * * * * *Medium and low 9890 9890 9044 * * - -No one 3857912 3577654 335049 781956 1063566 844327 552756

90 Labour force in Romania: Employment and unemployment - 2015
Table 2.16. Employment by groups of age, gender, urban/rural area and activities of the national economy
- persons -
of which, in working age
Groups of age
Gender Urban/rural area
Activities of the national economy
Employment
Total
Total 15-64 years
15-24 years
25-34 years
35-44 years
45-54 years
55-64 years
TOTAL 8535386 8234802 536066 2060436 2505214 2019674 1113412Agriculture, forestry and fishing 2183834 1900167 213385 359034 478493 425404 423851Mining and quarrying 73098 73098 * 13511 27753 22724 8389Manufacturing 1551426 1549156 88785 376411 473632 424515 185813Production and supply of electric and
thermal energy, gas, hot water and air conditioning 82524 82421 * 11852 24003 32104 13490
Water distribution; sanitation, waste administration, decontamination activities 85747 85606 * 15364 22936 28267 14428
Constructions 636315 633264 39120 163784 201785 154529 74046Wholesale and retail; repair of motors
vehicles and motorcycles 1148989 1146575 78275 372380 352798 262018 81104Transport and storage 475339 473809 14879 109524 155942 140850 52614Hotels and restaurants 185988 185881 23488 66315 46789 38355 10934Information and communications 172840 171876 11972 80236 46169 21801 11698Financial intermediation and insurance 104778 104683 * 41334 33261 18793 7654Real estate transactions 22029 21960 * * * 6653 *Professional, scientific and technical
activities 185469 184422 * 69483 60472 32652 16925Activities of administrative services
and activities of support services 204085 203589 12582 47292 58086 57419 28209Public administration and defence;
social insurance of public system 441716 440928 * 102785 173214 111472 47441Education 355006 353150 * 75300 127058 87045 57994Health and social assistance 387894 386762 * 78736 145732 104611 51344Showbiz, cultural and recreation
activities 56593 56593 6508 18208 14477 11406 *Other activities of the national
economy 181715 180863 13396 53051 56915 39055 18445
MEN 4848347 4704238 331634 1182090 1402671 1133536 654305Agriculture, forestry and fishing 1240572 1109266 134654 219218 283396 253319 218679Mining and quarrying 61425 61425 * 11834 25210 16730 6930Manufacturing 906129 904651 59407 218197 262189 233903 130954Production and supply of electric and
thermal energy, gas, hot water and air conditioning 68587 68519 * 9289 21423 25116 11930
Water distribution; sanitation, waste administration, decontamination activities 64458 64317 * 11882 17474 19984 11075
Constructions 591746 588695 38590 150890 187383 141254 70578Wholesale and retail; repair of motors
vehicles and motorcycles 520326 518604 35112 177453 150900 113508 41631Transport and storage 398730 397276 13625 89524 134371 114230 45526Hotels and restaurants 74646 74646 12783 30724 16884 11358 *Information and communications 102239 101752 * 47637 27921 12340 7489Financial intermediation and insurance 36605 36510 * 14682 10462 * *Real estate transactions 12515 12515 * * * * *Professional, scientific and technical
activities 82250 81400 * 31067 25391 13705 8912Activities of administrative services
and activities of support services 150085 149760 8841 31824 42383 43828 22885

Tables 91
Table 2.16. Employment by groups of age, gender, urban/rural area and activities of the national economy
(continued) - persons -
of which, in working age
Groups of age
Gender Urban/rural area
Activities of the national economy
Employment
Total
Total 15-64 years
15-24 years
25-34 years
35-44 years
45-54 years
55-64 years
Public administration and defence; social insurance of public system 280610 279937 * 72365 110522 66717 26075
Education 85995 84507 * 17453 27240 19925 19415Health and social assistance 81389 80963 * 18115 28688 21116 12633Showbiz, cultural and recreation
activities 29228 29228 * 9035 7714 * *Other activities of the national
economy 60813 60269 * 17098 19576 11885 7261
WOMEN 3687038 3530565 204431 878346 1102543 886138 459107Agriculture, forestry and fishing 943262 790901 78731 139816 195096 172085 205172Mining and quarrying 11674 11674 - * * * *Manufacturing 645297 644506 29377 158214 211443 190612 54859Production and supply of electric and
thermal energy, gas, hot water and air conditioning 13938 13902 * * * 6988 *
Water distribution; sanitation, waste administration, decontamination activities 21289 21289 * * * 8283 *
Constructions 44569 44569 * 12894 14402 13275 *Wholesale and retail; repair of motors
vehicles and motorcycles 628663 627971 43163 194927 201898 148510 39473Transport and storage 76609 76532 * 20000 21571 26620 7088Hotels and restaurants 111341 111234 10705 35591 29905 26996 8037Information and communications 70601 70124 * 32599 18248 9462 *Financial intermediation and insurance 68173 68173 * 26652 22799 13022 *Real estate transactions 9515 9445 * * * * *Professional, scientific and technical
activities 103218 103022 * 38416 35081 18948 8013Activities of administrative services
and activities of support services 54000 53829 * 15468 15703 13592 *Public administration and defence;
social insurance of public system 161106 160991 * 30420 62692 44755 21366Education 269011 268644 * 57847 99818 67120 38578Health and social assistance 306505 305799 * 60622 117044 83495 38710Showbiz, cultural and recreation
activities 27365 27365 * 9173 6763 * *Other activities of the national
economy 120902 120594 8947 35953 37339 27170 11185
URBAN 4662492 4642167 188615 1276743 1441007 1175256 560546Agriculture, forestry and fishing 180745 170217 14126 37314 43405 42368 33005Mining and quarrying 43896 43896 * 9023 17026 12562 *Manufacturing 1002490 1001147 39507 237032 286637 295160 142811Production and supply of electric and
thermal energy, gas, hot water and air conditioning 61103 60999 * 9250 16691 24178 10092
Water distribution; sanitation, waste administration, decontamination activities 58793 58793 * 10485 15462 18732 11516
Constructions 358837 356663 12945 91707 107551 93045 51415

92 Labour force in Romania: Employment and unemployment - 2015
Table 2.16. Employment by groups of age, gender, urban/rural area and activities of the national economy
(continued) - persons -
of which, in working age
Groups of age
Gender Urban/rural area
Activities of the national economy
Employment
Total
Total 15-64 years
15-24 years
25-34 years
35-44 years
45-54 years
55-64 years
Wholesale and retail; repair of motors vehicles and motorcycles 858147 856805 46648 284869 260682 199235 65370
Transport and storage 328796 327933 8420 80237 105041 94678 39556Hotels and restaurants 143335 143228 15272 52345 36012 30412 9187Information and communications 149396 149339 9411 73841 39936 17086 9064Financial intermediation and insurance 95593 95593 * 39736 29405 16786 6580Real estate transactions 19636 19567 * * * * *Professional, scientific and technical
activities 163068 162315 * 63756 51322 28566 14820Activities of administrative services
and activities of support services 130119 129623 6769 31142 35278 34494 21940Public administration and defence;
social insurance of public system 331615 331495 * 78281 133811 80772 33999Education 263264 262011 * 54979 93217 65064 45459Health and social assistance 309450 308600 * 66012 114870 81614 40852Showbiz, cultural and recreation
activities 44823 44823 * 14606 11846 9294 *Other activities of the national
economy 119386 119120 * 36838 37902 25008 13096
RURAL 3872894 3592635 347451 783693 1064208 844418 552866Agriculture, forestry and fishing 2003089 1729950 199259 321721 435087 383036 390846Mining and quarrying 29202 29202 * * 10727 10162 *Manufacturing 548936 548009 49278 139379 186995 129355 43003Production and supply of electric and
thermal energy, gas, hot water and air conditioning 21422 21422 * * 7312 7927 *
Water distribution; sanitation, waste administration, decontamination activities 26954 26812 * * 7474 9534 *
Constructions 277478 276601 26176 72076 94235 61484 22630Wholesale and retail; repair of motors
vehicles and motorcycles 290842 289770 31627 87511 92116 62783 15733Transport and storage 146543 145876 * 29287 50901 46171 13058Hotels and restaurants 42653 42653 8216 13970 10777 7942 *Information and communications 23444 22537 * * * * *Financial intermediation and insurance 9185 9090 * * * * *Real estate transactions * * * * * * *Professional, scientific and technical
activities 22401 22107 * * 9150 * *Activities of administrative services
and activities of support services 73966 73966 * 16150 22808 22925 *Public administration and defence;
social insurance of public system 110101 109432 * 24505 39403 30701 13442Education 91742 91140 * 20321 33841 21981 12534Health and social assistance 78444 78162 * 12724 30862 22997 10492Showbiz, cultural and recreation
activities 11770 11770 * * * * *Other activities of the national
economy 62329 61743 7121 16212 19013 14048 *

Tables 93
Table 2.17. Employment by sectors of activity, level of education, gender and urban/rural area - persons -
Sectors of activity Gender Urban/rural area
Level of education
Employment
Total Agriculture
Industry and
constructions Services
TOTAL 8535386 2183834 2429111 3922440Superior 1724319 39315 341092 1343912Medium 4896066 892005 1724813 2279247Post high-school of speciality or technical
foremen 280531 14170 50476 215885High-school 3146712 472371 1038337 1636004Vocational, complementary or of
apprentices 1468823 405464 636000 427358Low 1915001 1252514 363206 299281Gymnasium 1620385 1028727 328825 262833Primary 264645 200241 31867 32537No education 29971 23546 * *
MEN 4848347 1240572 1692344 1915431Superior 851818 23694 218493 609632Medium 2914611 560273 1203392 1150946Post high-school of speciality or technical
foremen 114112 7255 34791 72066High-school 1751895 267121 688779 795995Vocational, complementary or of
apprentices 1048604 285898 479821 282885Low 1081918 656605 270460 154853Gymnasium 919915 545426 241961 132527Primary 144763 97321 26832 20611No education 17240 13858 * *
WOMEN 3687038 943262 736767 2007010Superior 872501 15621 122599 734281Medium 1981454 331732 521421 1128301Post high-school of speciality or technical
foremen 166419 6915 15685 143819High-school 1394816 205250 349557 840009Vocational, complementary or of
apprentices 420219 119567 156179 144473Low 833083 595909 92746 144428Gymnasium 700470 483301 86863 130306Primary 119882 102920 * 11927No education 12731 9687 * *

94 Labour force in Romania: Employment and unemployment - 2015
Table 2.17. Employment by sectors of activity, level of education, gender and urban/rural area
(continued) - persons -
Sectors of activity Gender Urban/rural area
Level of education
Employment
Total Agriculture
Industry and
constructions Services
URBAN 4662492 180745 1525120 2956627Superior 1481576 17522 301330 1162725Medium 2800305 96764 1069820 1633721Post high-school of speciality or technical
foremen 225904 * 40124 183705High-school 1908792 55730 673034 1180028Vocational, complementary or of
apprentices 665609 38959 356662 269988Low 380611 66460 153970 160181Gymnasium 323262 52368 136943 133951Primary 51209 12250 15524 23435No education * * * *
RURAL 3872894 2003089 903992 965813Superior 242743 21793 39762 181188Medium 2095760 795242 654993 645526Post high-school of speciality or technical
foremen 54628 12095 10352 32180High-school 1237919 416641 365303 455976Vocational, complementary or of
apprentices 803213 366506 279338 157369Low 1534390 1186054 209236 139100Gymnasium 1297123 976359 191882 128882Primary 213437 187991 16343 9102No education 23831 21705 * *

Tables 95
Table 2.18. Employment by ownership type of workplace, gender, urban/rural area and activities of the national economy
- persons -
Ownership type of workplace Gender Urban/rural area
Activities of the national economy
Employment
Total Public 1) Private 2) Mixed
TOTAL 8535386 1403507 7031340 100538Agriculture, forestry and fishing 2183834 23113 2158983 *Mining and quarrying 73098 41596 28753 *Manufacturing 1551426 22589 1494247 34590Production and supply of electric and thermal
energy, gas, hot water and air conditioning 82524 33486 39530 9508Water distribution; sanitation, waste administration,
decontamination activities 85747 23200 56965 *Constructions 636315 14506 619166 *Wholesale and retail; repair of motors vehicles and
motorcycles 1148989 14420 1126455 8114Transport and storage 475339 84116 372778 18444Hotels and restaurants 185988 * 178467 *Information and communications 172840 * 163244 *Financial intermediation and insurance 104778 9279 93736 *Real estate transactions 22029 * 20459 *Professional, scientific and technical activities 185469 24913 159343 *Activities of administrative services and activities of
support services 204085 24337 177743 *Public administration and defence; social insurance
of public system 441716 441716 - -Education 355006 323387 29556 *Health and social assistance 387894 268936 116042 *Showbiz, cultural and recreation activities 56593 17686 38341 *Other activities of the national economy 181715 22686 157533 *
MEN 4848347 672815 4108776 66756Agriculture, forestry and fishing 1240572 19744 1219310 *Mining and quarrying 61425 35114 23987 *Manufacturing 906129 15591 864276 26261Production and supply of electric and thermal
energy, gas, hot water and air conditioning 68587 28855 31822 7910Water distribution; sanitation, waste administration,
decontamination activities 64458 15962 44224 *Constructions 591746 12968 576642 *Wholesale and retail; repair of motors vehicles and
motorcycles 520326 * 511330 *Transport and storage 398730 58524 326803 13403Hotels and restaurants 74646 * 72157 *Information and communications 102239 * 96648 *Financial intermediation and insurance 36605 * 33266 *Real estate transactions 12515 * 11758 -Professional, scientific and technical activities 82250 11871 69643 *Activities of administrative services and activities of
support services 150085 17008 131587 *
1) Public includes: “state (public)” and “public of national and local interest”. 2) Private includes: “private”, “co-operative” and “community”.

96 Labour force in Romania: Employment and unemployment - 2015
Table 2.18. Employment by ownership type of workplace, gender, urban/rural area and activities of the national economy
(continued) - persons -
Ownership type of workplace Gender Urban/rural area
Activities of the national economy
Employment
Total Public 1) Private 2) Mixed
Public administration and defence; social insurance of public system 280610 280610 - -
Education 85995 75844 9767 *Health and social assistance 81389 58947 22191 *Showbiz, cultural and recreation activities 29228 8493 20639 *Other activities of the national economy 60813 17495 42726 *
WOMEN 3687038 730692 2922564 33782Agriculture, forestry and fishing 943262 * 939673 *Mining and quarrying 11674 * * *Manufacturing 645297 6997 629971 8329Production and supply of electric and thermal
energy, gas, hot water and air conditioning 13938 * 7708 *Water distribution; sanitation, waste administration,
decontamination activities 21289 7238 12741 *Constructions 44569 * 42524 *Wholesale and retail; repair of motors vehicles and
motorcycles 628663 8364 615125 *Transport and storage 76609 25593 45975 *Hotels and restaurants 111341 * 106309 *Information and communications 70601 * 66596 *Financial intermediation and insurance 68173 * 60470 *Real estate transactions 9515 * 8701 *Professional, scientific and technical activities 103218 13042 89700 *Activities of administrative services and activities of
support services 54000 7328 46155 *Public administration and defence; social insurance
of public system 161106 161106 - -Education 269011 247543 19789 *Health and social assistance 306505 209988 93851 *Showbiz, cultural and recreation activities 27365 9193 17702 *Other activities of the national economy 120902 * 114807 *
URBAN 4662492 1047759 3538386 76347Agriculture, forestry and fishing 180745 10387 169775 *Mining and quarrying 43896 30370 11523 *Manufacturing 1002490 17731 958420 26340Production and supply of electric and thermal
energy, gas, hot water and air conditioning 61103 25684 27977 7441Water distribution; sanitation, waste administration,
decontamination activities 58793 17358 36992 *Constructions 358837 8837 348558 *
1) Public includes: “state (public)” and “public of national and local interest”. 2) Private includes: “private”, “co-operative” and “community”.

Tables 97
Table 2.18. Employment by ownership type of workplace, gender, urban/rural area and activities of the national economy
(continued) - persons -
Ownership type of workplace Gender Urban/rural area
Activities of the national economy
Employment
Total Public 1) Private 2) Mixed
Wholesale and retail; repair of motors vehicles and motorcycles 858147 10558 841351 *
Transport and storage 328796 61040 254387 13369Hotels and restaurants 143335 * 138058 *Information and communications 149396 * 140522 *Financial intermediation and insurance 95593 8069 85976 *Real estate transactions 19636 * 18304 -Professional, scientific and technical activities 163068 21059 141055 *Activities of administrative services and activities of
support services 130119 18720 109794 *Public administration and defence; social insurance
of public system 331615 331615 - -Education 263264 237054 24585 *Health and social assistance 309450 211003 95772 *Showbiz, cultural and recreation activities 44823 13965 30292 *Other activities of the national economy 119386 13298 105046 *
RURAL 3872894 355748 3492955 24191Agriculture, forestry and fishing 2003089 12726 1989208 *Mining and quarrying 29202 11227 17230 *Manufacturing 548936 * 535827 8250Production and supply of electric and thermal
energy, gas, hot water and air conditioning 21422 7802 11553 *Water distribution; sanitation, waste administration,
decontamination activities 26954 * 19972 *Constructions 277478 * 270608 *Wholesale and retail; repair of motors vehicles and
motorcycles 290842 * 285104 *Transport and storage 146543 23077 118391 *Hotels and restaurants 42653 * 40409 *Information and communications 23444 * 22722 *Financial intermediation and insurance 9185 * 7760 *Real estate transactions * * * *Professional, scientific and technical activities 22401 * 18288 *Activities of administrative services and activities of
support services 73966 * 67949 *Public administration and defence; social insurance
of public system 110101 110101 - -Education 91742 86333 * *Health and social assistance 78444 57933 20271 *Showbiz, cultural and recreation activities 11770 * 8049 -Other activities of the national economy 62329 9389 52487 *
1) Public includes: “state (public)” and “public of national and local interest”. 2) Private includes: “private”, “co-operative” and “community”.

98 Labour force in Romania: Employment and unemployment - 2015
Table 2.19. Employees by the ownership type of workplace, by gender, urban/rural area and activities of the national economy
- persons - Ownership type of workplace Gender
Urban/rural area Activities of the national economy
Employees
Total Public 1) Private 2) Mixed
TOTAL 6062244 1403332 4558374 100538Agriculture, forestry and fishing 177757 23113 152905 *Mining and quarrying 72628 41421 28458 *Manufacturing 1514970 22589 1457791 34590Production and supply of electric and thermal
energy, gas, hot water and air conditioning 82334 33486 39339 9508Water distribution; sanitation, waste
administration, decontamination activities 81700 23200 52918 *Constructions 475979 14506 458829 *Wholesale and retail; repair of motors vehicles
and motorcycles 1045590 14420 1023057 8114Transport and storage 447079 84116 344518 18444Hotels and restaurants 177050 * 169529 *Information and communications 158579 * 148983 *Financial intermediation and insurance 103760 9279 92718 *Real estate transactions 18565 * 16995 *Professional, scientific and technical activities 162296 24913 136170 *Activities of administrative services and activities
of support services 199558 24337 173215 *Public administration and defence; social
insurance of public system 441716 441716 - -Education 352428 323387 26977 *Health and social assistance 375197 268936 103345 *Showbiz, cultural and recreation activities 50161 17686 31908 *Other activities of the national economy 124899 22686 100717 *
MEN 3398595 672724 2659115 66756Agriculture, forestry and fishing 140530 19744 119267 *Mining and quarrying 61039 35024 23692 *Manufacturing 877281 15591 835429 26261Production and supply of electric and thermal
energy, gas, hot water and air conditioning 68396 28855 31631 7910Water distribution; sanitation, waste
administration, decontamination activities 60820 15962 40586 *Constructions 432626 12968 417522 *Wholesale and retail; repair of motors vehicles
and motorcycles 451358 * 442362 *Transport and storage 371409 58524 299482 13403Hotels and restaurants 68244 * 65755 *Information and communications 92962 * 87371 *Financial intermediation and insurance 36045 * 32706 *Real estate transactions 9617 * 8860 -Professional, scientific and technical activities 69571 11871 56964 *Activities of administrative services and activities
of support services 147831 17008 129334 *Public administration and defence; social
insurance of public system 280610 280610 - -Education 84440 75844 8211 *Health and social assistance 77645 58947 18447 *Showbiz, cultural and recreation activities 24124 8493 15535 *Other activities of the national economy 44047 17495 25960 *
1) Public includes: “state (public)” and “public of national and local interest”. 2) Private includes: “private”, “co-operative” and “community”.

Tables 99
Table 2.19. Employees by the ownership type of workplace, by gender, urban/rural area and activities of the national economy
(continued) - persons -
Ownership type of workplace Gender Urban/rural area
Activities of the national economy
Employees
Total Public 1) Private 2) Mixed
WOMEN 2663649 730608 1899258 33782Agriculture, forestry and fishing 37227 * 33638 *Mining and quarrying 11589 * * *Manufacturing 637688 6997 622362 8329Production and supply of electric and thermal
energy, gas, hot water and air conditioning 13938 * 7708 *Water distribution; sanitation, waste
administration, decontamination activities 20881 7238 12332 *Constructions 43353 * 41308 *Wholesale and retail; repair of motors vehicles
and motorcycles 594232 8364 580695 *Transport and storage 75670 25593 45036 *Hotels and restaurants 108806 * 103774 *Information and communications 65617 * 61612 *Financial intermediation and insurance 67715 * 60012 *Real estate transactions 8948 * 8134 *Professional, scientific and technical activities 92725 13042 79207 *Activities of administrative services and activities
of support services 51726 7328 43882 *Public administration and defence; social
insurance of public system 161106 161106 - -Education 267988 247543 18766 *Health and social assistance 297551 209988 84897 *Showbiz, cultural and recreation activities 26036 9193 16373 *Other activities of the national economy 80852 * 74757 *
URBAN 4280039 1047759 3155932 76347Agriculture, forestry and fishing 55050 10387 44079 *Mining and quarrying 43636 30370 11262 *Manufacturing 985175 17731 941105 26340Production and supply of electric and thermal
energy, gas, hot water and air conditioning 60955 25684 27830 7441Water distribution; sanitation, waste
administration, decontamination activities 55228 17358 33427 *Constructions 295173 8837 284894 *Wholesale and retail; repair of motors vehicles
and motorcycles 788050 10558 771255 *Transport and storage 311630 61040 237221 13369Hotels and restaurants 135683 * 130406 *Information and communications 143797 * 134923 *Financial intermediation and insurance 94769 8069 85153 *Real estate transactions 16369 * 15037 -Professional, scientific and technical activities 142860 21059 120847 *Activities of administrative services and activities
of support services 127283 18720 106958 *Public administration and defence; social
insurance of public system 331615 331615 - -Education 261775 237054 23096 *Health and social assistance 299008 211003 85329 *Showbiz, cultural and recreation activities 40488 13965 25957 *Other activities of the national economy 91494 13298 77155 *
1) Public includes: “state (public)” and “public of national and local interest”. 2) Private includes: “private”, “co-operative” and “community”.

100 Labour force in Romania: Employment and unemployment - 2015
Table 2.19. Employees by the ownership type of workplace, by gender, urban/rural area and activities of the national economy
(continued) - persons -
Ownership type of workplace Gender Urban/rural area
Activities of the national economy
Employees
Total Public 1) Private 2) Mixed
RURAL 1782205 355573 1402441 24191Agriculture, forestry and fishing 122707 12726 108826 *Mining and quarrying 28993 11052 17196 *Manufacturing 529795 * 516686 8250Production and supply of electric and thermal
energy, gas, hot water and air conditioning 21379 7802 11510 *Water distribution; sanitation, waste
administration, decontamination activities 26472 * 19491 *Constructions 180806 * 173935 *Wholesale and retail; repair of motors vehicles
and motorcycles 257540 * 251802 *Transport and storage 135450 23077 107298 *Hotels and restaurants 41367 * 39123 *Information and communications 14782 * 14060 *Financial intermediation and insurance 8990 * 7565 *Real estate transactions * * * *Professional, scientific and technical activities 19436 * 15323 *Activities of administrative services and activities
of support services 72275 * 66257 *Public administration and defence; social
insurance of public system 110101 110101 - -Education 90653 86333 * *Health and social assistance 76189 57933 18015 *Showbiz, cultural and recreation activities 9672 * * -Other activities of the national economy 33404 9389 23562 *
1) Public includes: “state (public)” and “public of national and local interest”. 2) Private includes: “private”, “co-operative” and “community”.

Tables 101
Table 2.20. Employees who carried out shift work, by groups of age, gender, urban/rural area and activities of the national economy
- persons -
Groups of age Gender Urban/rural area
Activities of the national economy
Employees who carried
out shift work
Total
15-24 years
25-34 years
35-44 years
45-54 years
55 years and over
TOTAL 1565717 94055 414845 499542 405905 151370Agriculture, forestry and fishing 15677 * * * * *Mining and quarrying 30476 * 7149 13876 7645 *Manufacturing 450173 29625 111885 139753 121021 47888Production and supply of electric and thermal
energy, gas, hot water and air conditioning 20870 * * * 9629 *Water distribution; sanitation, waste
administration, decontamination activities 14696 * * * * *Constructions 21954 * * * 6932 *Wholesale and retail; repair of motors vehicles
and motorcycles 322582 26930 103157 103265 70975 18255Transport and storage 147773 * 30630 45547 50882 17141Hotels and restaurants 97832 14442 39841 22147 16363 *Information and communications 19376 * 8702 * * *Financial intermediation and insurance * * * * * *Real estate transactions * * * * * *Professional, scientific and technical activities * * * * * *Activities of administrative services and activities
of support services 100072 * 18234 27266 32653 16302Public administration and defence; social
insurance of public system 88340 * 29476 36749 17555 *Education 14931 * * * * *Health and social assistance 170540 * 32904 66770 45067 22768Showbiz, cultural and recreation activities 11618 * * * * *Other activities of the national economy 27586 * 10414 8673 * *
MEN 861120 55279 229904 262715 218464 94759Agriculture, forestry and fishing 13237 * * * * *Mining and quarrying 28161 * 6827 13010 6657 *Manufacturing 271360 21126 69917 79671 66431 34216Production and supply of electric and thermal
energy, gas, hot water and air conditioning 19742 * * * 8805 *Water distribution; sanitation, waste
administration, decontamination activities 11984 * * * * *Constructions 21164 * * * 6583 *Wholesale and retail; repair of motors vehicles
and motorcycles 90851 10310 34812 25282 15703 *Transport and storage 131325 * 28166 41126 43238 15516Hotels and restaurants 40042 7552 19361 7879 * *Information and communications 9897 * * * * *Financial intermediation and insurance * * * * * *Real estate transactions * - * * * -Professional, scientific and technical activities * * * * * *Activities of administrative services and activities
of support services 90332 * 15223 24857 29508 15418

102 Labour force in Romania: Employment and unemployment - 2015
Table 2.20. Employees who carried out shift work, by groups of age, gender, urban/rural area and activities of the national economy
(continued) - persons -
Groups of age Gender Urban/rural area
Activities of the national economy
Employees who carried
out shift work
Total
15-24 years
25-34 years
35-44 years
45-54 years
55 years and over
Public administration and defence; social insurance of public system 81082 * 27928 34184 15121 *
Education * * * * * *Health and social assistance 33394 * 7065 12038 8249 *Showbiz, cultural and recreation activities * * * * * *Other activities of the national economy * * * * * *
WOMEN 704598 38776 184941 236828 187441 56612Agriculture, forestry and fishing * * * * * -Mining and quarrying * - * * * *Manufacturing 178813 8500 41969 60083 54590 13671Production and supply of electric and thermal
energy, gas, hot water and air conditioning * - * * * -Water distribution; sanitation, waste
administration, decontamination activities * * * * * *Constructions * - - * * *Wholesale and retail; repair of motors vehicles
and motorcycles 231731 16620 68345 77983 55273 13510Transport and storage 16448 * * * 7644 *Hotels and restaurants 57790 6890 20480 14268 12238 *Information and communications 9478 * * * * *Financial intermediation and insurance * * * * * *Real estate transactions * * - * - *Professional, scientific and technical activities * - * * * -Activities of administrative services and activities
of support services 9740 * * * * *Public administration and defence; social
insurance of public system 7258 - * * * *Education 11167 - * * * *Health and social assistance 137146 * 25838 54733 36818 16912Showbiz, cultural and recreation activities 7014 * * * * *Other activities of the national economy 23609 * 8320 7712 * *
URBAN 1160428 58864 320082 361812 300260 119410Agriculture, forestry and fishing * * * * * *Mining and quarrying 22868 * * 10869 * *Manufacturing 298661 15135 76705 85007 85094 36720Production and supply of electric and thermal
energy, gas, hot water and air conditioning 16445 * * * 7264 *Water distribution; sanitation, waste
administration, decontamination activities 9769 * * * * *Constructions 16381 * * * * *

Tables 103
Table 2.20. Employees who carried out shift work, by groups of age, gender, urban/rural area and activities of the national economy
(continued) - persons -
Groups of age Gender Urban/rural area
Activities of the national economy
Employees who carried
out shift work
Total
15-24 years
25-34 years
35-44 years
45-54 years
55 years and over
Wholesale and retail; repair of motors vehicles and motorcycles 254764 18796 84775 79226 56678 15290
Transport and storage 110734 * 24161 35623 35630 13431Hotels and restaurants 77052 10150 32356 17267 12999 *Information and communications 18506 * 8487 * * *Financial intermediation and insurance * * * * * *Real estate transactions * - * * * -Professional, scientific and technical activities * * * * * *Activities of administrative services and activities
of support services 59659 * 10124 14744 20241 12191Public administration and defence; social
insurance of public system 69577 * 23664 28422 14040 *Education 13435 - * * * *Health and social assistance 142710 * 27344 55337 38410 19506Showbiz, cultural and recreation activities 10755 * * * * *Other activities of the national economy 24067 * 9019 7692 * *
RURAL 405289 35190 94763 137730 105645 31960Agriculture, forestry and fishing 10576 * * * * *Mining and quarrying 7608 * * * * *Manufacturing 151512 14490 35181 54746 35927 11168Production and supply of electric and thermal
energy, gas, hot water and air conditioning * - * * * *Water distribution; sanitation, waste
administration, decontamination activities * * * * * *Constructions * * * * * *Wholesale and retail; repair of motors vehicles
and motorcycles 67818 8134 18381 24040 14297 *Transport and storage 37039 * * 9923 15252 *Hotels and restaurants 20779 * 7485 * * *Information and communications * * * * * *Financial intermediation and insurance * - * - * -Real estate transactions * * - - * *Professional, scientific and technical activities * - * * * *Activities of administrative services and activities
of support services 40412 * 8110 12522 12412 *Public administration and defence; social
insurance of public system 18763 * * 8327 * *Education * * - * * *Health and social assistance 27830 * * 11433 6657 *Showbiz, cultural and recreation activities * * * * * *Other activities of the national economy * - * * * *

104 Labour force in Romania: Employment and unemployment - 2015
Table 2.21. Employees with labour contract by working regime, gender, urban/rural area, ownership type of workplace, activities of the national economy, groups of occupations and groups of age
- persons -
With labour contract of which:
Gender Urban/rural area
Ownership type of workplace Activities of the national economy Groups of occupations Groups of age
Total
Employees Total with
permanent working regime
with temporary working regime
TOTAL 6062244 6001469 5941773 59696
Ownership type of workplace Public 1) 1403332 1397946 1393408 *Private 2) 4558374 4503078 4448407 54672Mixed 100538 100445 99958 *
Activities of the national economy Agriculture, forestry and fishing 177757 165504 155462 10042Mining and quarrying 72628 72581 72581 -Manufacturing 1514970 1510925 1500547 10378Production and supply of electric and thermal energy, gas, hot
water and air conditioning 82334 82263 82263 -Water distribution; sanitation, waste administration,
decontamination activities 81700 81355 80797 *Constructions 475979 465915 451913 14002Wholesale and retail; repair of motors vehicles and motorcycles 1045590 1037076 1032505 *Transport and storage 447079 443319 440474 *Hotels and restaurants 177050 174276 168289 *Information and communications 158579 158504 157908 *Financial intermediation and insurance 103760 103356 103189 *Real estate transactions 18565 18423 18423 -Professional, scientific and technical activities 162296 161342 160771 *Activities of administrative services and activities of support
services 199558 196470 194003 *Public administration and defence; social insurance of public
system 441716 438719 437623 *Education 352428 351419 349964 *Health and social assistance 375197 373901 372142 *Showbiz, cultural and recreation activities 50161 49560 49002 *Other activities of the national economy 124899 116561 113918 *
Groups of occupations Managers 126117 125183 124751 *Professionals 1219479 1216825 1213463 *Technicians and associate professionals 481284 478648 476856 *Clerical support workers 370537 368857 367270 *Service and sales workers 1156022 1145613 1136515 9097Skilled workers in agriculture, forestry and fishing 58090 54949 46597 8352Craft and related trades workers 1191191 1183224 1168462 14761Other categories of occupations 1459525 1428171 1407858 20312
of which: Elementary occupations 498474 471971 456504 15467
Groups of age 15-24 years 300523 291746 279891 1185525-34 years 1626344 1607435 1585635 2180135-44 years 1935356 1921093 1908831 1226145-54 years 1525679 1512822 1502575 1024755-64 years 662254 657309 653870 *65 years and over 12087 11064 10971 *
1) Public includes: “state (public)” and “public of national and local interest”. 2) Private includes: “private”, “co-operative” and “community”.

Tables 105
Table 2.21. Employees with labour contract by working regime, gender, urban/rural area, ownership type of workplace, activities of the national economy, groups of occupations and groups of age
(continued) - persons -
With labour contract of which:
Gender Urban/rural area
Ownership type of workplace Activities of the national economy Groups of occupations Groups of age
Total
Employees Total with
permanent working regime
with temporary working regime
MEN 3398595 3358531 3320178 38353
Ownership type of workplace Public 1) 672724 669342 666670 *Private 2) 2659115 2622527 2587207 35320Mixed 66756 66663 66302 *
Activities of the national economy Agriculture, forestry and fishing 140530 130897 124331 6566Mining and quarrying 61039 60991 60991 -Manufacturing 877281 874522 867897 6625Production and supply of electric and thermal energy, gas, hot
water and air conditioning 68396 68325 68325 -Water distribution; sanitation, waste administration,
decontamination activities 60820 60475 59916 *Constructions 432626 422562 408604 13958Wholesale and retail; repair of motors vehicles and motorcycles 451358 446424 443371 *Transport and storage 371409 367860 365249 *Hotels and restaurants 68244 67083 66466 *Information and communications 92962 92962 92674 *Financial intermediation and insurance 36045 35866 35866 -Real estate transactions 9617 9617 9617 -Professional, scientific and technical activities 69571 68721 68430 *Activities of administrative services and activities of support
services 147831 145503 143866 *Public administration and defence; social insurance of public
system 280610 278532 277688 *Education 84440 84214 83919 *Health and social assistance 77645 77530 77162 *Showbiz, cultural and recreation activities 24124 23955 23639 *Other activities of the national economy 44047 42490 42164 *
Groups of occupations Managers 81029 80211 79778 *Professionals 528475 527228 525890 *Technicians and associate professionals 217813 216382 215123 *Clerical support workers 139873 138997 138512 *Service and sales workers 444215 439328 437449 *Skilled workers in agriculture, forestry and fishing 43288 40614 34334 *Craft and related trades workers 919204 911885 897699 14186Other categories of occupations 1024699 1003888 991392 12495
of which: Elementary occupations 277446 261192 252551 8641
Groups of age 15-24 years 178555 172832 165565 726725-34 years 906295 892524 878523 1400135-44 years 1053919 1044342 1036078 826445-54 years 832746 824640 818000 664055-64 years 417379 415220 413132 *65 years and over 9701 8974 8881 *
1) Public includes: “state (public)” and “public of national and local interest”. 2) Private includes: “private”, “co-operative” and “community”.

106 Labour force in Romania: Employment and unemployment - 2015
Table 2.21. Employees with labour contract by working regime, gender, urban/rural area, ownership type of workplace, activities of the national economy, groups of occupations and groups of age
(continued) - persons -
With labour contract of which:
Gender Urban/rural area
Ownership type of workplace Activities of the national economy Groups of occupations Groups of age
Total
Employees Total with
permanent working regime
with temporary working regime
WOMEN 2663649 2642938 2621594 21343
Ownership type of workplace Public 1) 730608 728604 726739 *Private 2) 1899258 1880552 1861200 19352Mixed 33782 33782 33656 *
Activities of the national economy Agriculture, forestry and fishing 37227 34607 31131 *Mining and quarrying 11589 11589 11589 -Manufacturing 637688 636403 632650 *Production and supply of electric and thermal energy, gas, hot
water and air conditioning 13938 13938 13938 -Water distribution; sanitation, waste administration,
decontamination activities 20881 20881 20881 -Constructions 43353 43353 43309 *Wholesale and retail; repair of motors vehicles and motorcycles 594232 590652 589134 *Transport and storage 75670 75458 75225 *Hotels and restaurants 108806 107193 101823 *Information and communications 65617 65543 65233 *Financial intermediation and insurance 67715 67490 67322 *Real estate transactions 8948 8806 8806 -Professional, scientific and technical activities 92725 92621 92341 *Activities of administrative services and activities of support
services 51726 50967 50137 *Public administration and defence; social insurance of public
system 161106 160187 159935 *Education 267988 267205 266045 *Health and social assistance 297551 296372 294980 *Showbiz, cultural and recreation activities 26036 25605 25363 *Other activities of the national economy 80852 74071 71754 *
Groups of occupations Managers 45088 44973 44973 -Professionals 691004 689597 687573 *Technicians and associate professionals 263472 262267 261733 *Clerical support workers 230663 229860 228757 *Service and sales workers 711807 706285 699066 7219Skilled workers in agriculture, forestry and fishing 14801 14335 12263 *Craft and related trades workers 271988 271339 270764 *Other categories of occupations 434826 424283 416466 7817
of which: Elementary occupations 221028 210779 203953 6827
Groups of age 15-24 years 121968 118914 114326 *25-34 years 720050 714912 707111 780035-44 years 881437 876751 872753 *45-54 years 692933 688182 684576 *55-64 years 244875 242089 240738 *65 years and over * * * -
1) Public includes: “state (public)” and “public of national and local interest”. 2) Private includes: “private”, “co-operative” and “community”.

Tables 107
Table 2.21. Employees with labour contract by working regime, gender, urban/rural area, ownership type of workplace, activities of the national economy, groups of occupations and groups of age
(continued) - persons -
With labour contract of which:
Gender Urban/rural area
Ownership type of workplace Activities of the national economy Groups of occupations Groups of age
Total
Employees Total with
permanent working regime
with temporary working regime
URBAN 4280039 4252639 4227689 24950
Ownership type of workplace Public 1) 1047759 1044460 1042780 *Private 2) 3155932 3131888 3108885 23003Mixed 76347 76292 76024 *
Activities of the national economy Agriculture, forestry and fishing 55050 52018 50314 *Mining and quarrying 43636 43636 43636 -Manufacturing 985175 983942 979501 *Production and supply of electric and thermal energy, gas, hot
water and air conditioning 60955 60955 60955 -Water distribution; sanitation, waste administration,
decontamination activities 55228 55015 54900 *Constructions 295173 291184 285367 *Wholesale and retail; repair of motors vehicles and motorcycles 788050 782843 780122 *Transport and storage 311630 309618 308096 *Hotels and restaurants 135683 134157 130128 *Information and communications 143797 143797 143200 *Financial intermediation and insurance 94769 94404 94236 *Real estate transactions 16369 16227 16227 -Professional, scientific and technical activities 142860 142355 142068 *Activities of administrative services and activities of support
services 127283 125394 124748 *Public administration and defence; social insurance of public
system 331615 329487 328938 *Education 261775 261071 260562 *Health and social assistance 299008 298479 297694 *Showbiz, cultural and recreation activities 40488 40067 39877 *Other activities of the national economy 91494 87991 87120 *
Groups of occupations Managers 98872 98522 98522 -Professionals 1037550 1036404 1034174 *Technicians and associate professionals 397831 395430 393940 *Clerical support workers 298530 297087 296084 *Service and sales workers 830114 823429 818145 *Skilled workers in agriculture, forestry and fishing 12200 11599 10725 *Craft and related trades workers 749170 746490 738804 7686Other categories of occupations 855772 843679 837295 *
of which: Elementary occupations 259477 249548 245278 *
Groups of age 15-24 years 165063 162135 158316 *25-34 years 1190626 1181253 1171413 984035-44 years 1335477 1330529 1325629 *45-54 years 1077765 1071239 1067171 *55-64 years 503150 500259 498028 *65 years and over 7958 7224 7131 *
1) Public includes: “state (public)” and “public of national and local interest”. 2) Private includes: “private”, “co-operative” and “community”.

108 Labour force in Romania: Employment and unemployment - 2015
Table 2.21. Employees with labour contract by working regime, gender, urban/rural area, ownership type of workplace, activities of the national economy, groups of occupations and groups of age
(continued) - persons -
With labour contract of which:
Gender Urban/rural area
Ownership type of workplace Activities of the national economy Groups of occupations Groups of age
Total
Employees Total with
permanent working regime
with temporary working regime
RURAL 1782205 1748830 1714084 34746
Ownership type of workplace Public 1) 355573 353486 350628 *Private 2) 1402441 1371190 1339521 31669Mixed 24191 24154 23934 *
Activities of the national economy Agriculture, forestry and fishing 122707 113486 105148 8338Mining and quarrying 28993 28945 28945 -Manufacturing 529795 526983 521045 *Production and supply of electric and thermal energy, gas, hot
water and air conditioning 21379 21308 21308 -Water distribution; sanitation, waste administration,
decontamination activities 26472 26340 25897 *Constructions 180806 174731 166546 8185Wholesale and retail; repair of motors vehicles and motorcycles 257540 254233 252383 *Transport and storage 135450 133700 132378 *Hotels and restaurants 41367 40119 38161 *Information and communications 14782 14708 14708 -Financial intermediation and insurance 8990 8952 8952 -Real estate transactions * * * -Professional, scientific and technical activities 19436 18987 18702 *Activities of administrative services and activities of support
services 72275 71077 69255 *Public administration and defence; social insurance of public
system 110101 109232 108685 *Education 90653 90348 89402 *Health and social assistance 76189 75422 74448 *Showbiz, cultural and recreation activities 9672 9493 9125 *Other activities of the national economy 33404 28570 26798 *
Groups of occupations Managers 27244 26661 26229 *Professionals 181929 180421 179289 *Technicians and associate professionals 83453 83218 82916 *Clerical support workers 72007 71770 71186 *Service and sales workers 325908 322184 318371 *Skilled workers in agriculture, forestry and fishing 45890 43350 35872 7478Craft and related trades workers 442022 436734 429659 7075Other categories of occupations 603752 584492 570563 13929
of which: Elementary occupations 238997 222423 211227 11197
Groups of age 15-24 years 135461 129611 121575 803625-34 years 435719 426182 414222 1196135-44 years 599879 590564 583202 736245-54 years 447914 441583 435404 *55-64 years 159104 157050 155841 *65 years and over * * * -
1) Public includes: “state (public)” and “public of national and local interest”. 2) Private includes: “private”, “co-operative” and “community”.

Tables 109
Table 2.22. Employees with other types of labour agreement by working regime, gender, urban/rural area, ownership type of workplace, activity sectors of the national economy, groups of occupations and groups of age
- persons -
With other types of labour agreement
of which: Gender Urban/rural area
Ownership type of workplace Activity sectors of the national economy Groups of occupations Groups of age
Total
Employees Total with
permanent
working regime
with temporary
working regime
TOTAL 6062244 60775 35586 25189
Ownership type of workplace
Public 1) 1403332 * * *
Private 2) 4558374 55295 31379 23916
Mixed 100538 * * -
Activity sectors of the national economy
Agriculture 177757 12253 * 6568
Industry and constructions 2227611 14572 7300 7272
Services 3656877 33950 22602 11349
Groups of occupations
Managers and professionals 1345596 * * *
Technicians and associate professionals 481284 * * *
Service and sales workers 1156022 10410 8207 *
Craft and related trades workers 1191191 7968 * *
Other categories of occupations 1888151 36174 17758 18416
of which: elementary occupations 498474 26503 11062 15441
Groups of age
15-24 years 300523 8777 * *
25-34 years 1626344 18909 11929 6980
35-44 years 1935356 14263 7426 6838
45-54 years 1525679 12857 8056 *
55-64 years 662254 * * *
65 years and over 12087 * * *
1) Public includes: “state (public)” and “public of national and local interest”. 2) Private includes: “private”, “co-operative” and “community”.

110 Labour force in Romania: Employment and unemployment - 2015
Table 2.22. Employees with other types of labour agreement by working regime, gender, urban/rural area, ownership type of workplace, activity sectors of the national economy, groups of occupations and groups of age
(continued) - persons -
With other types of labour agreement
of which:
Gender Urban/rural area
Ownership type of workplace Activity sectors of the national economy Groups of occupations Groups of age
Total
Employees Total with
permanent
working regime
with temporary
working regime
MEN 3398595 40064 22975 17089
Ownership type of workplace
Public 1) 672724 * * *
Private 2) 2659115 36589 20174 16415
Mixed 66756 * * -
Activitiy sectors of the national economy
Agriculture 140530 9632 * *
Industry and constructions 1500162 13286 * 6862
Services 1757904 17145 11204 *
Groups of occupations
Managers and professionals 609504 * * *
Technicians and associate professionals 217813 * * *
Service and sales workers 444215 * * *
Craft and related trades workers 919204 7319 * *
Other categories of occupations 1207860 24362 12338 12024
of which: elementary occupations 277446 16254 6777 9477
Groups of age
15-24 years 178555 * * *
25-34 years 906295 13771 8075 *
35-44 years 1053919 9577 * *
45-54 years 832746 8106 * *
55-64 years 417379 * * *
65 years and over 9701 * * *
1) Public includes: “state (public)” and “public of national and local interest”. 2) Private includes: “private”, “co-operative” and “community”.

Tables 111
Table 2.22. Employees with other types of labour agreement by working regime, gender, urban/rural area, ownership type of workplace, activity sectors of the national economy, groups of occupations and groups of age
(continued) - persons -
With other types of labour agreement
of which:
Gender Urban/rural area
Ownership type of workplace Activity sectors of the national economy Groups of occupations Groups of age
Total
Employees Total with
permanent
working regime
with temporary
working regime
WOMEN 2663649 20711 12611 8100
Ownership type of workplace
Public 1) 730608 * * *
Private 2) 1899258 18707 11205 7501
Mixed 33782 - - -
Activity sectors of the national economy
Agriculture 37227 * * *
Industry and constructions 727449 * * *
Services 1898973 16805 11398 *
Groups of occupations
Managers and professionals 736092 * * *
Technicians and associate professionals 263472 * * *
Service and sales workers 711807 * * *
Craft and related trades workers 271988 * * *
Other categories of occupations 680290 11813 * *
of which: elementary occupations 221028 10249 * *
Groups of age
15-24 years 121968 * * *
25-34 years 720050 * * *
35-44 years 881437 * * *
45-54 years 692933 * * *
55-64 years 244875 * * *
65 years and over * * * *
1) Public includes: “state (public)” and “public of national and local interest”. 2) Private includes: “private”, “co-operative” and “community”.

112 Labour force in Romania: Employment and unemployment - 2015
Table 2.22. Employees with other types of labour agreement by working regime, gender, urban/rural area, ownership type of workplace, activity sectors of the national economy, groups of occupations and groups of age
(continued) - persons -
With other types of labour agreement
of which:
Gender Urban/rural area
Ownership type of workplace Activity sectors of the national economy Groups of occupations Groups of age
Total
Employees Total with
permanent
working regime
with temporary
working regime
URBAN 4280039 27399 18563 8836
Ownership type of workplace
Public 1) 1047759 * * *
Private 2) 3155932 24044 15479 8566
Mixed 76347 * * -
Activity sectors of the national economy
Agriculture 55050 * * *
Industry and constructions 1440168 * * *
Services 2784821 18932 13639 *
Groups of occupations
Managers and professionals 1136422 * * *
Technicians and associate professionals 397831 * * *
Service and sales workers 830114 6685 * *
Craft and related trades workers 749170 * * *
Other categories of occupations 1166502 14137 7936 *
of which: elementary occupations 259477 9929 * *
Groups of age
15-24 years 165063 * * *
25-34 years 1190626 9373 6767 *
35-44 years 1335477 * * *
45-54 years 1077765 6526 * *
55-64 years 503150 * * *
65 years and over 7958 * * *
1) Public includes: “state (public)” and “public of national and local interest”. 2) Private includes: “private”, “co-operative” and “community”.

Tables 113
Table 2.22. Employees with other types of labour agreement by working regime, gender, urban/rural area, ownership type of workplace, activity sectors of the national economy, groups of occupations and groups of age
(continued) - persons -
With other types of labour agreement
of which:
Gender Urban/rural area
Ownership type of workplace Activity sectors of the national economy Groups of occupations Groups of age
Total
Employees Total with
permanent
working regime
with temporary
working regime
RURAL 1782205 33375 17023 16352
Ownership type of workplace
Public 1) 355573 * * *
Private 2) 1402441 31251 15900 15351
Mixed 24191 * * -
Activity sectors of the national economy
Agriculture 122707 9221 * *
Industry and constructions 787443 9136 * *
Services 872055 15018 8963 *
Groups of occupations
Managers and professionals 209173 * * *
Technicians and associate professionals 83453 * * -
Service and sales workers 325908 * * *
Craft and related trades workers 442022 * * *
Other categories of occupations 721649 22037 9822 12215
of which: elementary occupations 238997 16573 * 10096
Groups of age
15-24 years 135461 * * *
25-34 years 435719 9536 * *
35-44 years 599879 9315 * *
45-54 years 447914 * * *
55-64 years 159104 * * *
65 years and over * * * *
1) Public includes: “state (public)” and “public of national and local interest”. 2) Private includes: “private”, “co-operative” and “community”.

114 Labour force in Romania: Employment and unemployment - 2015
Table 2.23. Employees with permanent working regime by gender, urban/rural area, ownership type of workplace, activities of the national economy, groups of occupations, usual and actual duration of working week
- persons -
Gender Urban/rural area Ownership type of workplace
Activities of the national economy
Groups of occupations
Usual duration of working week
Actual duration of working week
Employees with
permanent
working regime Men Women Urban Rural
TOTAL 5977359 3343153 2634206 4246252 1731107
Ownership type of working place Public 1) 1397523 669378 728144 1045809 351714Private 2) 4479786 2607380 1872405 3124364 1355421Mixed 100051 66395 33656 76079 23971
Activities of the national economy Agriculture, forestry and fishing 161146 129677 31470 51628 109518Mining and quarrying 72581 60991 11589 43636 28945Manufacturing 1503281 869757 633525 980401 522881Production and supply of electric and thermal
energy, gas, hot water and air conditioning 82263 68325 13938 60955 21308Water distribution; sanitation, waste
administration, decontamination activities 80909 60028 20881 55012 25897Constructions 456366 413057 43309 287965 168401Wholesale and retail; repair of motors vehicles
and motorcycles 1038605 446195 592410 783787 254818Transport and storage 443021 367584 75437 309687 133334Hotels and restaurants 170578 67307 103271 131218 39360Information and communications 157982 92674 65308 143200 14782Financial intermediation and insurance 103311 35950 67360 94320 8990Real estate transactions 18565 9617 8948 16369 *Professional, scientific and technical activities 161317 68872 92445 142358 18958Activities of administrative services and
activities of support services 196049 145309 50740 126089 69961Public administration and defence; social
insurance of public system 440295 279616 160679 331066 109229Education 350592 84028 266563 260884 89707Health and social assistance 372857 77235 295621 298078 74778Showbiz, cultural and recreation activities 49423 23808 25615 40298 9125Other activities of the national economy 118219 43120 75099 89301 28918
1) Public includes: “state (public)” and “public of national and local interest”. 2) Private includes: “private”, “co-operative” and “community”.

Tables 115
Table 2.23. Employees with permanent working regime by gender, urban/rural area, ownership type of workplace, activities of the national economy, groups of occupations, usual and actual duration of working week
(continued) - persons -
Gender Urban/rural area Ownership type of workplace
Activities of the national economy
Groups of occupations
Usual duration of working week
Actual duration of working week
Employees with
permanent
working regime Men Women Urban Rural
Groups of occupations
Managers 125419 80447 44973 98872 26547Professionals 1215387 526925 688462 1034904 180483Technicians and associate professionals 479090 216339 262751 395939 83151Clerical support workers 368820 139318 229502 297468 71352Service and sales workers 1144722 440840 703882 823597 321125Skilled workers in agriculture, forestry and
fishing 48379 35951 12428 11146 37233Craft and related trades workers 1173257 902025 271232 740899 432358Other categories of occupations 1422284 1001308 420977 843427 578857
of which: Elementary occupations 467566 259328 208238 249863 217704
Usual duration of working week under 40 hours 83385 39351 44034 63117 2026840 hours 5273366 2898252 2375114 3752526 1520839over 40 hours 522654 336054 186600 374140 148514No usual duration can be indicated 97954 69497 28457 56469 41485
Actual duration of working week under 40 hours 248692 96178 152514 177328 7136440 hours 5098702 2832875 2265827 3637670 1461032over 40 hours 629965 414100 215865 431254 198711

116 Labour force in Romania: Employment and unemployment - 2015
Table 2.24. Employees with temporary working regime by gender, urban/rural area, ownership type of workplace, activities of the national economy, groups of occupations, usual and actual duration of working week
- persons -
Gender Urban/rural area Ownership type of workplace Activity sectors of the national economy Groups of occupations Usual duration of working week Actual duration of working week
Employees with
temporary working regime
Men Women Urban Rural
TOTAL 84885 55442 29443 33786 51099
Ownership type of workplace Public 1) * * * * *Private 2) 78588 51735 26853 31568 47020Mixed * * * * *
Activity sectors of the national economy Agriculture 16610 10853 * * 13189Industry and constructions 32211 28003 * 12199 20011Services 36064 16586 19478 18166 17898
Groups of occupations Managers * * * - *Professionals * * * * *Technicians and associate professionals * * * * *Clerical support workers * * * * *Service and sales workers 11300 * 7925 6517 *Skilled workers in agriculture, forestry and fishing 9710 7337 * * 8657Craft and related trades workers 17934 17178 * 8270 9663Other categories of occupations 37240 23391 13849 12346 24895
of which: Elementary occupations 30908 18118 12790 9615 21293
Usual duration of working week under 40 hours * * * * *40 hours 42617 27123 15494 17967 24651over 40 hours 24795 17525 7270 9180 15615No usual duration can be indicated 12285 8937 * * 7500
Actual duration of working week under 40 hours 13974 7683 * * 827140 hours 40412 26407 14006 16853 23559over 40 hours 30498 21352 9146 11230 19268
1) Public includes: “state (public)” and “public of national and local interest”. 2) Private includes: “private”, “co-operative” and “community”.
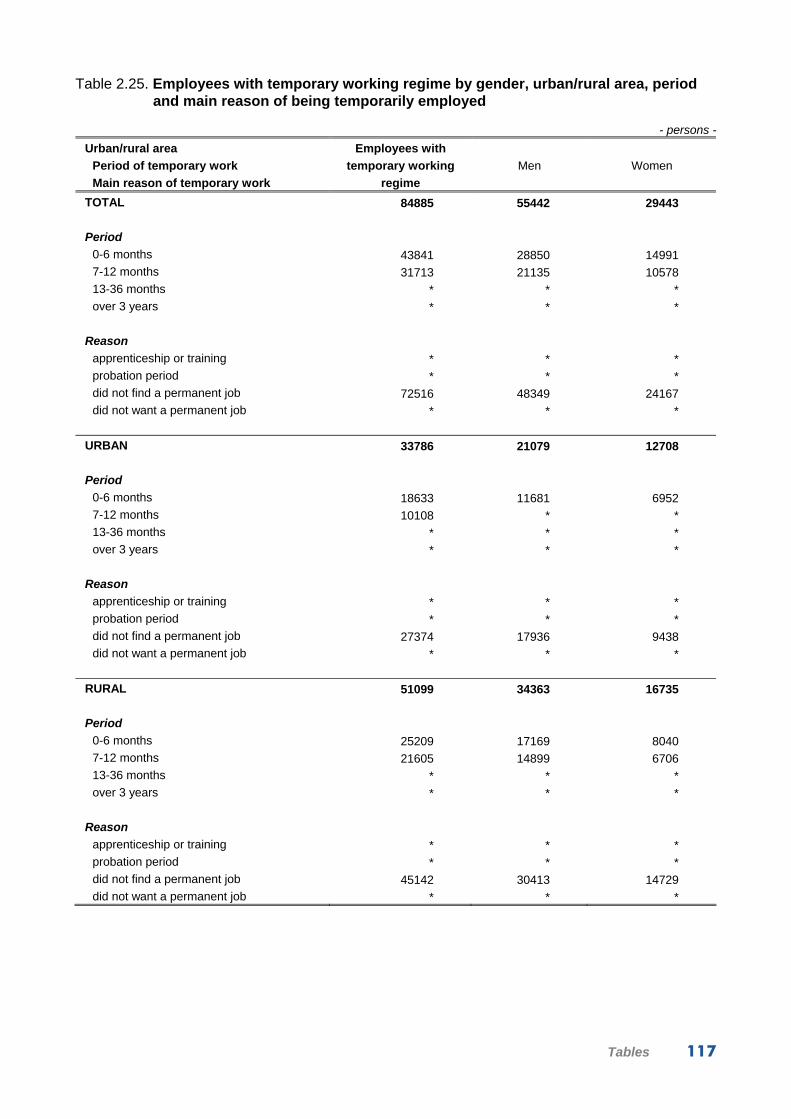
Tables 117
Table 2.25. Employees with temporary working regime by gender, urban/rural area, period and main reason of being temporarily employed
- persons -
Urban/rural area
Period of temporary work
Main reason of temporary work
Employees with
temporary working
regime
Men Women
TOTAL 84885 55442 29443 Period
0-6 months 43841 28850 14991 7-12 months 31713 21135 10578 13-36 months * * * over 3 years * * *
Reason apprenticeship or training * * * probation period * * * did not find a permanent job 72516 48349 24167 did not want a permanent job * * *
URBAN 33786 21079 12708 Period
0-6 months 18633 11681 6952 7-12 months 10108 * * 13-36 months * * * over 3 years * * *
Reason
apprenticeship or training * * * probation period * * * did not find a permanent job 27374 17936 9438 did not want a permanent job * * *
RURAL 51099 34363 16735 Period
0-6 months 25209 17169 8040 7-12 months 21605 14899 6706 13-36 months * * * over 3 years * * *
Reason
apprenticeship or training * * * probation period * * * did not find a permanent job 45142 30413 14729 did not want a permanent job * * *
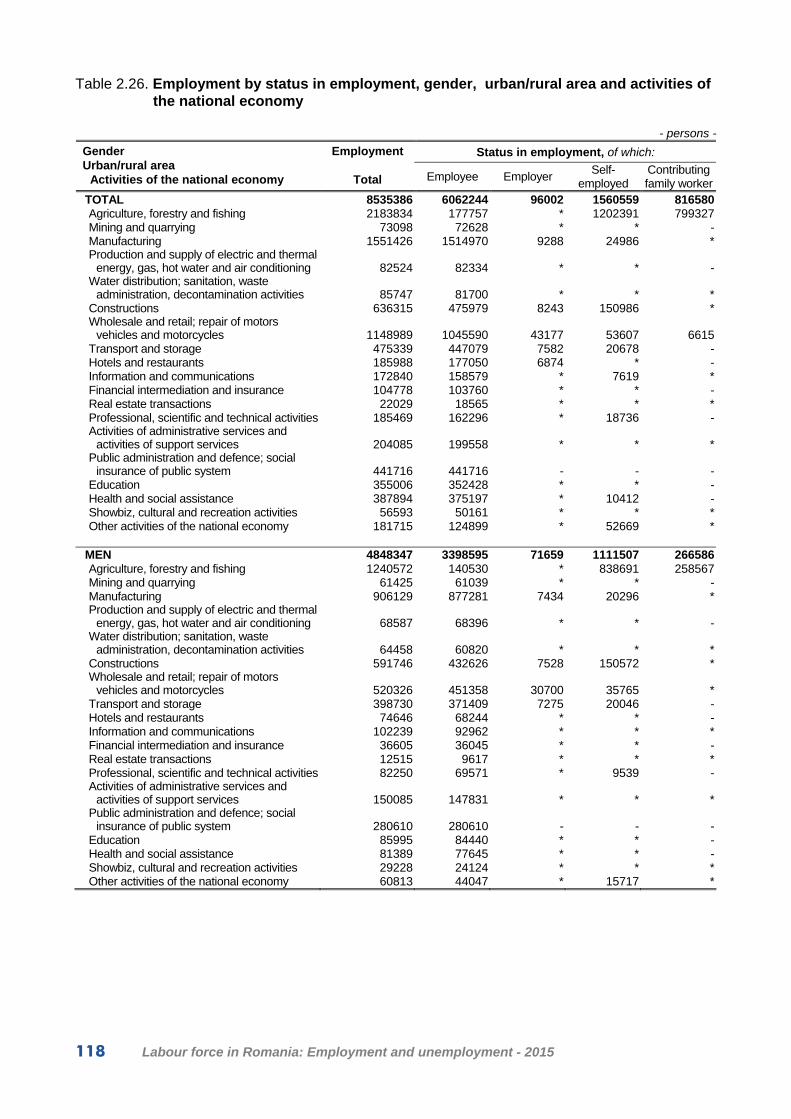
118 Labour force in Romania: Employment and unemployment - 2015
Table 2.26. Employment by status in employment, gender, urban/rural area and activities of the national economy
- persons -
Status in employment, of which: Gender Urban/rural area
Activities of the national economy
Employment
Total Employee Employer Self-
employed Contributing family worker
TOTAL 8535386 6062244 96002 1560559 816580Agriculture, forestry and fishing 2183834 177757 * 1202391 799327Mining and quarrying 73098 72628 * * -Manufacturing 1551426 1514970 9288 24986 *Production and supply of electric and thermal
energy, gas, hot water and air conditioning 82524 82334 * * -Water distribution; sanitation, waste
administration, decontamination activities 85747 81700 * * *Constructions 636315 475979 8243 150986 *Wholesale and retail; repair of motors
vehicles and motorcycles 1148989 1045590 43177 53607 6615Transport and storage 475339 447079 7582 20678 -Hotels and restaurants 185988 177050 6874 * -Information and communications 172840 158579 * 7619 *Financial intermediation and insurance 104778 103760 * * -Real estate transactions 22029 18565 * * *Professional, scientific and technical activities 185469 162296 * 18736 -Activities of administrative services and
activities of support services 204085 199558 * * *Public administration and defence; social
insurance of public system 441716 441716 - - -Education 355006 352428 * * -Health and social assistance 387894 375197 * 10412 -Showbiz, cultural and recreation activities 56593 50161 * * *Other activities of the national economy 181715 124899 * 52669 *
MEN 4848347 3398595 71659 1111507 266586Agriculture, forestry and fishing 1240572 140530 * 838691 258567Mining and quarrying 61425 61039 * * -Manufacturing 906129 877281 7434 20296 *Production and supply of electric and thermal
energy, gas, hot water and air conditioning 68587 68396 * * -Water distribution; sanitation, waste
administration, decontamination activities 64458 60820 * * *Constructions 591746 432626 7528 150572 *Wholesale and retail; repair of motors
vehicles and motorcycles 520326 451358 30700 35765 *Transport and storage 398730 371409 7275 20046 -Hotels and restaurants 74646 68244 * * -Information and communications 102239 92962 * * *Financial intermediation and insurance 36605 36045 * * -Real estate transactions 12515 9617 * * *Professional, scientific and technical activities 82250 69571 * 9539 -Activities of administrative services and
activities of support services 150085 147831 * * *Public administration and defence; social
insurance of public system 280610 280610 - - -Education 85995 84440 * * -Health and social assistance 81389 77645 * * -Showbiz, cultural and recreation activities 29228 24124 * * *Other activities of the national economy 60813 44047 * 15717 *
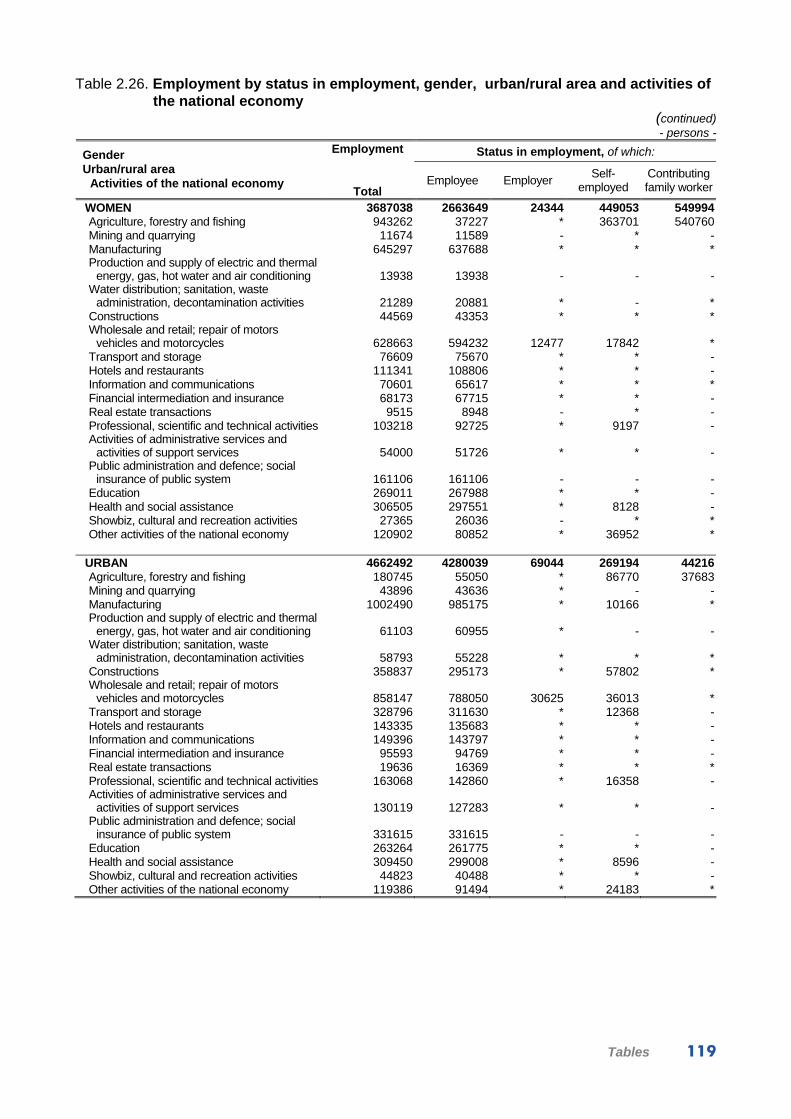
Tables 119
Table 2.26. Employment by status in employment, gender, urban/rural area and activities of the national economy
(continued) - persons -
Status in employment, of which: Gender Urban/rural area
Activities of the national economy
Employment
Total Employee Employer
Self-employed
Contributing family worker
WOMEN 3687038 2663649 24344 449053 549994Agriculture, forestry and fishing 943262 37227 * 363701 540760Mining and quarrying 11674 11589 - * -Manufacturing 645297 637688 * * *Production and supply of electric and thermal
energy, gas, hot water and air conditioning 13938 13938 - - -Water distribution; sanitation, waste
administration, decontamination activities 21289 20881 * - *Constructions 44569 43353 * * *Wholesale and retail; repair of motors
vehicles and motorcycles 628663 594232 12477 17842 *Transport and storage 76609 75670 * * -Hotels and restaurants 111341 108806 * * -Information and communications 70601 65617 * * *Financial intermediation and insurance 68173 67715 * * -Real estate transactions 9515 8948 - * -Professional, scientific and technical activities 103218 92725 * 9197 -Activities of administrative services and
activities of support services 54000 51726 * * -Public administration and defence; social
insurance of public system 161106 161106 - - -Education 269011 267988 * * -Health and social assistance 306505 297551 * 8128 -Showbiz, cultural and recreation activities 27365 26036 - * *Other activities of the national economy 120902 80852 * 36952 *
URBAN 4662492 4280039 69044 269194 44216Agriculture, forestry and fishing 180745 55050 * 86770 37683Mining and quarrying 43896 43636 * - -Manufacturing 1002490 985175 * 10166 *Production and supply of electric and thermal
energy, gas, hot water and air conditioning 61103 60955 * - -Water distribution; sanitation, waste
administration, decontamination activities 58793 55228 * * *Constructions 358837 295173 * 57802 *Wholesale and retail; repair of motors
vehicles and motorcycles 858147 788050 30625 36013 *Transport and storage 328796 311630 * 12368 -Hotels and restaurants 143335 135683 * * -Information and communications 149396 143797 * * -Financial intermediation and insurance 95593 94769 * * -Real estate transactions 19636 16369 * * *Professional, scientific and technical activities 163068 142860 * 16358 -Activities of administrative services and
activities of support services 130119 127283 * * -Public administration and defence; social
insurance of public system 331615 331615 - - -Education 263264 261775 * * -Health and social assistance 309450 299008 * 8596 -Showbiz, cultural and recreation activities 44823 40488 * * -Other activities of the national economy 119386 91494 * 24183 *

120 Labour force in Romania: Employment and unemployment - 2015
Table 2.26. Employment by status in employment, gender, urban/rural area and activities of the national economy
(continued) - persons -
Status in employment, of which: Gender Urban/rural area
Activities of the national economy
Employment
Total Employee Employer Self-
employed Contributing family worker
RURAL 3872894 1782205 26958 1291366 772364Agriculture, forestry and fishing 2003089 122707 * 1115621 761644Mining and quarrying 29202 28993 - * -Manufacturing 548936 529795 * 14820 *Production and supply of electric and thermal
energy, gas, hot water and air conditioning 21422 21379 - * -Water distribution; sanitation, waste
administration, decontamination activities 26954 26472 * * -Constructions 277478 180806 * 93185 *Wholesale and retail; repair of motors
vehicles and motorcycles 290842 257540 12552 17593 *Transport and storage 146543 135450 * 8310 -Hotels and restaurants 42653 41367 * * -Information and communications 23444 14782 * * *Financial intermediation and insurance 9185 8990 * * -Real estate transactions * * * * -Professional, scientific and technical activities 22401 19436 * * -Activities of administrative services and
activities of support services 73966 72275 * * *Public administration and defence; social
insurance of public system 110101 110101 - - -Education 91742 90653 * * -Health and social assistance 78444 76189 * * -Showbiz, cultural and recreation activities 11770 9672 - * *Other activities of the national economy 62329 33404 * 28486 *

Tables 121
Table 2.27. Employment by groups of age, gender, urban/rural area and groups of occupations
- persons -
of which, in working age:
Groups of age Gender Urban/rural area
Groups of occupations
Employment
Total Total 15-64 years 15-24
years 25-34 years
35-44 years
45-54 years
55-64 years
TOTAL 8535386 8234802 536066 2060436 2505214 2019674 1113412Managers 187517 185792 * 42915 61570 56412 23206Professionals 1260599 1256626 26800 387088 434620 267824 140294Technicians and associate professionals 491776 490836 21019 148248 164265 109446 47858Clerical support workers 373161 372966 19889 117791 113158 88350 33778Service and sales workers 1242225 1240023 84327 352347 381182 306783 115384Skilled workers in agriculture, forestry and fishing 1823451 1562922 183507 288857 383496 344584 362477Craft and related trades workers 1353580 1349506 65215 296747 409977 393320 184247Other categories of occupations 1803077 1776130 133620 426442 556945 452955 206168
of which: Elementary occupations 819186 794256 85052 190853 217977 192223 108151
MEN 4848347 4704238 331634 1182090 1402671 1133536 654305Managers 128492 126796 * 26967 41227 40087 17414Professionals 552064 549225 10410 174522 179939 113531 70822Technicians and associate professionals 224443 223840 11431 71545 71105 44984 24775Clerical support workers 141530 141335 8215 46445 40878 30975 14822Service and sales workers 489178 487674 36135 146209 143221 110895 51214Skilled workers in agriculture, forestry and fishing 998600 879054 112733 170854 215314 196743 183410Craft and related trades workers 1076669 1073241 51341 239085 321909 301716 159191Other categories of occupations 1237372 1223071 100268 306464 389077 294606 132657
of which: Elementary occupations 467924 455558 61388 121061 126074 95129 51906

122 Labour force in Romania: Employment and unemployment - 2015
Table 2.27. Employment by groups of age, gender, urban/rural area and groups of occupations
(continued) - persons -
of which, in working age:
Groups of age Gender Urban/rural area
Groups of occupations
Employment
Total Total 15-64 years 15-24
years 25-34 years
35-44 years
45-54 years
55-64 years
WOMEN 3687038 3530565 204431 878346 1102543 886138 459107Managers 59026 58996 * 15948 20343 16325 *Professionals 708535 707401 16390 212566 254681 154292 69472Technicians and associate professionals 267333 266996 9588 76703 93160 64463 23083Clerical support workers 231631 231631 11674 71346 72280 57374 18956Service and sales workers 753047 752349 48192 206138 237961 195888 64169Skilled workers in agriculture, forestry and fishing 824851 683868 70774 118003 168183 147841 179067Craft and related trades workers 276910 276265 13874 57662 88068 91605 25057Other categories of occupations 565706 553059 33352 119978 167868 158349 73511
of which: Elementary occupations 351262 338698 23664 69792 91902 97094 56246
URBAN 4662492 4642167 188615 1276743 1441007 1175256 560546
Managers 141590 140821 * 35395 45197 40644 18406Professionals 1072263 1069288 20773 335250 365295 229371 118599Technicians and associate professionals 406236 405600 15407 126434 137250 88991 37519Clerical support workers 300240 300045 13787 100788 88653 68927 27890Service and sales workers 893089 891637 52322 262815 266252 221219 89029Skilled workers in agriculture, forestry and fishing 122782 113916 12003 24331 25907 27364 24311Craft and related trades workers 814073 811670 26410 171904 224461 252244 136650Other categories of occupations 912219 909190 46735 219827 287991 246496 108142
of which: Elementary occupations 303367 300947 23604 72009 82108 84676 38552

Tables 123
Table 2.27. Employment by groups of age, gender, urban/rural area and groups of occupations
(continued) - persons -
of which, in working age:
Groups of age Gender Urban/rural area
Groups of occupations
Employment
Total Total 15-64 years 15-24
years 25-34 years
35-44 years
45-54 years
55-64 years
RURAL 3872894 3592635 347451 783693 1064208 844418 552866Managers 45927 44971 * 7520 16373 15768 *Professionals 188337 187338 * 51839 69326 38453 21694Technicians and associate professionals 85540 85236 * 21814 27015 20456 10339Clerical support workers 72921 72921 * 17003 24505 19423 *Service and sales workers 349136 348387 32005 89532 114931 85564 26354Skilled workers in agriculture, forestry and fishing 1700669 1449007 171505 264526 357589 317220 338167Craft and related trades workers 539507 537836 38805 124843 185516 141076 47597Other categories of occupations 890858 866940 86885 206616 268954 206459 98026
of which: Elementary occupations 515819 493308 61448 118845 135869 107547 69599

124 Labour force in Romania: Employment and unemployment - 2015
Table 2.28. Employment by level of education, gender, urban/rural area and groups of occupations
- persons -
Level of education Superior Medium Low Gender
Urban/rural area Groups of occupations
Employ-ment
Total
Post-Ph.D., Ph.D., post-university studies, master, short-term and
long-term university
Post high-school of
speciality or technical foremen
High-school
Vocational complementary or of apprentice
Gymnasium PrimaryWithout
education
TOTAL 8535386 1724319 280531 3146712 1468823 1620385 264645 29971
Managers 187517 119014 * 51378 9357 * * -
Professionals 1260599 1084962 66958 97973 6600 * * *
Technicians and
associate
professionals 491776 168106 94985 205797 17373 * * -
Clerical support
workers 373161 125196 16176 204117 17861 9159 * -
Service and
sales workers 1242225 133313 37111 778647 176583 108134 7616 *
Skilled workers in
agriculture,
forestry and
fishing 1823451 14821 10886 378443 338344 894930 171067 14961
Craft and related
trades workers 1353580 15971 20738 637059 487965 177409 13646 *
Other categories
of occupations 1803077 62936 29154 793297 414739 418903 70732 13317
of which:
Elementary
occupations 819186 7696 * 262840 153217 311472 66220 13030
MEN 4848347 851818 114112 1751895 1048604 919915 144763 17240
Managers 128492 79500 * 36603 6877 * * -
Professionals 552064 508720 10776 26602 * * * -
Technicians and
associate
professionals 224443 77343 30231 102604 11549 * * -
Clerical support
workers 141530 42759 7443 74288 12435 * * -
Service and
sales workers 489178 73535 18846 271847 78898 42074 * *
Skilled workers in
agriculture,
forestry and
fishing 998600 7133 * 205938 230536 461915 79147 8681

Tables 125
Table 2.28. Employment by educational level, gender, urban/rural area and groups of occupations
(continued) - persons -
Level of education Superior Medium Low Gender
Urban/rural area Groups of occupations
Employ-ment
Total
Post-Ph.D., Ph.D., post-university studies, master, short-term and
long-term university
Post high-school of
speciality or technical foremen
High-school
Vocational complementary or of apprentice
Gymnasium Primary Without
education
Craft and related
trades workers 1076669 11766 15829 492408 402269 140923 13041 *
Other categories
of occupations 1237372 51063 23051 541606 302210 263779 47862 7800
of which:
Elementary
occupations 467924 * * 131010 95423 184660 43982 7513
WOMEN 3687038 872501 166419 1394816 420219 700470 119882 12731
Managers 59026 39514 * 14776 * * - -
Professionals 708535 576241 56182 71371 * * * *
Technicians and
associate
professionals 267333 90763 64754 103194 * * * -
Clerical support
workers 231631 82437 8733 129829 * * * -
Service and
sales workers 753047 59778 18265 506801 97685 66060 * *
Skilled workers in
agriculture,
forestry and
fishing 824851 7689 * 172504 107808 433015 91920 *
Craft and related
trades workers 276910 * * 144651 85696 36486 * *
Other categories
of occupations 565706 11873 * 251691 112528 155124 22869 *
of which:
Elementary
occupations 351262 * * 131830 57794 126812 22238 * URBAN 4662492 1481576 225904 1908792 665609 323262 51209 *
Managers 141590 97104 * 35263 * * * -
Professionals 1072263 945194 56116 65359 * * * -
Technicians and
associate
professionals 406236 147911 81256 161067 12513 * * -
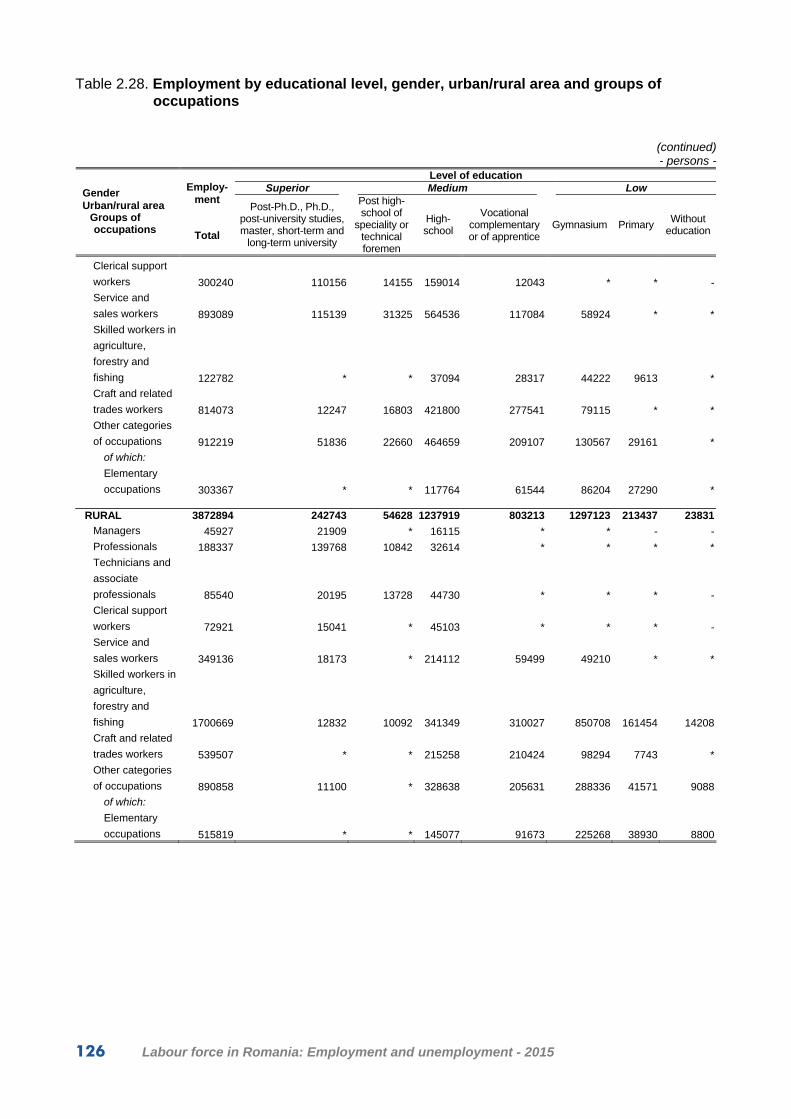
126 Labour force in Romania: Employment and unemployment - 2015
Table 2.28. Employment by educational level, gender, urban/rural area and groups of occupations
(continued) - persons -
Level of education Superior Medium Low Gender
Urban/rural area Groups of occupations
Employ-ment
Total
Post-Ph.D., Ph.D., post-university studies, master, short-term and
long-term university
Post high-school of
speciality or technical foremen
High-school
Vocational complementary or of apprentice
Gymnasium Primary Without
education
Clerical support
workers 300240 110156 14155 159014 12043 * * -
Service and
sales workers 893089 115139 31325 564536 117084 58924 * *
Skilled workers in
agriculture,
forestry and
fishing 122782 * * 37094 28317 44222 9613 *
Craft and related
trades workers 814073 12247 16803 421800 277541 79115 * *
Other categories
of occupations 912219 51836 22660 464659 209107 130567 29161 *
of which:
Elementary
occupations 303367 * * 117764 61544 86204 27290 * RURAL 3872894 242743 54628 1237919 803213 1297123 213437 23831
Managers 45927 21909 * 16115 * * - -
Professionals 188337 139768 10842 32614 * * * *
Technicians and
associate
professionals 85540 20195 13728 44730 * * * -
Clerical support
workers 72921 15041 * 45103 * * * -
Service and
sales workers 349136 18173 * 214112 59499 49210 * *
Skilled workers in
agriculture,
forestry and
fishing 1700669 12832 10092 341349 310027 850708 161454 14208
Craft and related
trades workers 539507 * * 215258 210424 98294 7743 *
Other categories
of occupations 890858 11100 * 328638 205631 288336 41571 9088
of which:
Elementary
occupations 515819 * * 145077 91673 225268 38930 8800

Tables 127
Table 2.29. Employment by status in employment, gender, urban/rural area and groups of occupations
- persons -
Status in employment, of which: Gender
Urban/rural area
Groups of occupations
Employment
Total Employee Employer Self-
employed
Contributing
family
worker
TOTAL 8535386 6062244 96002 1560559 816580Managers 187517 126117 58108 * -Professionals 1260599 1219479 10688 30341 *Technicians and associate professionals 491776 481284 * 9116 *Clerical support workers 373161 370537 * * -Services and sales workers 1242225 1156022 22884 58596 *Skilled workers in agriculture, forestry and
fishing 1823451 58090 * 1028653 736321Craft and related workers 1353580 1191191 * 157007 *Other categories of occupations 1803077 1459525 * 271347 71757
of which: Elementary occupations 819186 498474 * 249128 71551
MEN 4848347 3398595 71659 1111507 266586Managers 128492 81029 44780 * -Professionals 552064 528475 7801 15788 -Technicians and associate professionals 224443 217813 * * *Clerical support workers 141530 139873 * * -Services and sales workers 489178 444215 15781 27821 *Skilled workers in agriculture, forestry and
fishing 998600 43288 * 719352 235625Craft and related workers 1076669 919204 * 153232 *Other categories of occupations 1237372 1024699 * 185269 26955
of which: Elementary occupations 467924 277446 * 163587 26858
WOMEN 3687038 2663649 24344 449053 549994Managers 59026 45088 13328 * -Professionals 708535 691004 * 14553 *Technicians and associate professionals 267333 263472 * * -Clerical support workers 231631 230663 * * -Services and sales workers 753047 711807 7103 30775 *Skilled workers in agriculture, forestry and
fishing 824851 14801 * 309301 500696Craft and related workers 276910 271988 * * *Other categories of occupations 565706 434826 - 86078 44802
of which: Elementary occupations 351262 221028 - 85541 44693

128 Labour force in Romania: Employment and unemployment - 2015
Table 2.29. Employment by status in employment, gender, urban/rural area and groups of occupations
(continued) - persons -
Status in employment, of which: Gender
Urban/rural area
Groups of occupations
Employment
Total Employee Employer Self-
employed
Contributing
family
worker
URBAN 4662492 4280039 69044 269194 44216Managers 141590 98872 40422 * -Professionals 1072263 1037550 8015 26697 -Technicians and associate professionals 406236 397831 * 7433 -Clerical support workers 300240 298530 * * -Services and sales workers 893089 830114 17953 42883 *Skilled workers in agriculture, forestry and
fishing 122782 12200 * 75553 34971Craft and related workers 814073 749170 * 63263 *Other categories of occupations 912219 855772 * 49707 6521
of which: Elementary occupations 303367 259477 * 37336 6521
RURAL 3872894 1782205 26958 1291366 772364Managers 45927 27244 17686 * -Professionals 188337 181929 * * *Technicians and associate professionals 85540 83453 * * *Clerical support workers 72921 72007 * * -Services and sales workers 349136 325908 * 15713 *Skilled workers in agriculture, forestry and
fishing 1700669 45890 * 953100 701350Craft and related workers 539507 442022 * 93744 *Other categories of occupations 890858 603752 * 221640 65236
of which: Elementary occupations 515819 238997 - 211792 65030

Tables 129
Table 2.30. Employment by status in employment, groups of age, gender and urban/rural area
- persons -
Status in employment, of which: Gender Urban/rural area
Groups of age
Employment
Total Employee Employer Self-employed Contributing family worker
TOTAL 8535386 6062244 96002 1560559 816580Total 15-64 years 8234802 6050157 95035 1357222 732388
15-24 years 536066 300523 * 69072 16530325-34 years 2060436 1626344 15123 243204 17576535-44 years 2505214 1935356 34124 381446 15428845-54 years 2019674 1525679 32098 350794 11110355-64 years 1113412 662254 12524 312705 12593065 years and over 300583 12087 * 203338 84192
MEN 4848347 3398595 71659 1111507 266586
Total 15-64 years 4704238 3388894 70884 988075 25638415-24 years 331634 178555 * 54015 9805225-34 years 1182090 906295 10664 181353 8377935-44 years 1402671 1053919 24884 283165 4070445-54 years 1133536 832746 24162 257483 1914555-64 years 654305 417379 10162 212059 1470565 years and over 144110 9701 * 123432 10202
WOMEN 3687038 2663649 24344 449053 549994
Total 15-64 years 3530565 2661263 24151 369147 47600415-24 years 204431 121968 * 15057 6725125-34 years 878346 720050 * 61851 9198635-44 years 1102543 881437 9241 98281 11358445-54 years 886138 692933 7935 93311 9195855-64 years 459107 244875 * 100646 11122465 years and over 156474 * * 79906 73990
URBAN 4662492 4280039 69044 269194 44216
Total 15-64 years 4642167 4272081 68591 260947 4054815-24 years 188615 165063 * 14636 825725-34 years 1276743 1190626 11093 65472 955335-44 years 1441007 1335477 24297 72763 847045-54 years 1175256 1077765 23187 67391 691255-64 years 560546 503150 9354 40686 735665 years and over 20325 7958 * 8247 *
RURAL 3872894 1782205 26958 1291366 772364
Total 15-64 years 3592635 1778076 26444 1096275 69184015-24 years 347451 135461 * 54436 15704725-34 years 783693 435719 * 177733 16621235-44 years 1064208 599879 9827 308684 14581845-54 years 844418 447914 8910 283403 10419055-64 years 552866 159104 * 272019 11857365 years and over 280258 * * 195091 80524
Table 2.31. Employers by activity sectors of the national economy and number of hired employees
- persons -
Activity sectors of the national economy Number of employees Total
Agriculture Industry and constructions Services
EMPLOYERS, by groups of employees 96002 * 18416 73227 of which: by groups of hired employees
1-10 employees 81999 * 11518 67295 of which under 5 employees 52412 * * 46522
11-19 employees 8524 * * * 20-49 employees * * * * 50 employees and over * - * *
Total number of hired employees 679392 38032 239634 401726

130 Labour force in Romania: Employment and unemployment - 2015
Table 2.32. Employment and employees by working programme, gender, urban/rural area and groups of age
- persons- Employment of which: employees
By working programme By working programme Gender Urban/rural area
Groups of age Total full-time part-time
Total full-time part-time
TOTAL 8535386 7688588 846798 6062244 6015754 46490Total 15-64 years 8234802 7509762 725040 6050157 6004258 45899
15-24 years 536066 433188 102878 300523 294888 *25-34 years 2060436 1918510 141926 1626344 1612528 1381635-44 years 2505214 2349043 156171 1935356 1925815 954145-54 years 2019674 1863955 155719 1525679 1515594 1008555-64 years 1113412 945067 168346 662254 655433 682165 years and over 300583 178826 121758 12087 11496 *
MEN 4848347 4392358 455989 3398595 3376849 21746
Total 15-64 years 4704238 4302663 401574 3388894 3367407 2148715-24 years 331634 266413 65222 178555 175888 *25-34 years 1182090 1098599 83491 906295 899108 718635-44 years 1402671 1315994 86678 1053919 1049831 *45-54 years 1133536 1047555 85981 832746 828190 *55-64 years 654305 574103 80203 417379 414389 *65 years and over 144110 89695 54414 9701 9442 *
WOMEN 3687038 3296229 390809 2663649 2638905 24744
Total 15-64 years 3530565 3207099 323466 2661263 2636851 2441215-24 years 204431 166775 37657 121968 119000 *25-34 years 878346 819911 58435 720050 713420 663035-44 years 1102543 1033050 69493 881437 875984 *45-54 years 886138 816399 69739 692933 687404 *55-64 years 459107 370964 88143 244875 241044 *65 years and over 156474 89130 67343 * * *
URBAN 4662492 4552568 109924 4280039 4253761 26277
Total 15-64 years 4642167 4537491 104676 4272081 4246261 2582015-24 years 188615 178400 10215 165063 161843 *25-34 years 1276743 1252735 24008 1190626 1183664 696235-44 years 1441007 1416034 24973 1335477 1330542 *45-54 years 1175256 1148192 27064 1077765 1071238 652755-64 years 560546 542130 18417 503150 498974 *65 years and over 20325 15077 * 7958 7501 *
RURAL 3872894 3136020 736874 1782205 1761993 20213
Total 15-64 years 3592635 2972271 620364 1778076 1757997 2007915-24 years 347451 254787 92664 135461 133045 *25-34 years 783693 665774 117919 435719 428864 685435-44 years 1064208 933010 131198 599879 595273 *45-54 years 844418 715762 128655 447914 444355 *55-64 years 552866 402937 149929 159104 156459 *65 years and over 280258 163749 116510 * * *

Tables 131
Table 2.33. Employment and employees by working programme, gender, urban/rural area and activities of the national economy
- persons -
Employment of which: employees By working programme
By working programme
Gender Urban/rural area
Activities of the national economy Total full-time part-time
Total full-time part-time
TOTAL 8535386 7688588 846798 6062244 6015754 46490Agriculture, forestry and fishing 2183834 1465552 718282 177757 173138 *Mining and quarrying 73098 72931 * 72628 72461 *Manufacturing 1551426 1541607 9819 1514970 1511809 *Production and supply of electric and thermal
energy, gas, hot water and air conditioning 82524 82524 - 82334 82334 -Water distribution; sanitation, waste
administration, decontamination activities 85747 83684 * 81700 80978 *Constructions 636315 596254 40061 475979 471766 *Wholesale and retail; repair of motors vehicles
and motorcycles 1148989 1126422 22567 1045590 1037617 7974Transport and storage 475339 468203 7136 447079 444520 *Hotels and restaurants 185988 183375 * 177050 174437 *Information and communications 172840 168548 * 158579 157233 *Financial intermediation and insurance 104778 103587 * 103760 102904 *Real estate transactions 22029 20386 * 18565 17865 *Professional, scientific and technical activities 185469 180901 * 162296 160439 *Activities of administrative services and
activities of support services 204085 200469 * 199558 197129 *Public administration and defence; social
insurance of public system 441716 440334 * 441716 440334 *Education 355006 352429 * 352428 350129 *Health and social assistance 387894 385550 * 375197 373167 *Showbiz, cultural and recreation activities 56593 53442 * 50161 48583 *Other activities of the national economy 181715 162391 19324 124899 118912 *
MEN 4848347 4392358 455989 3398595 3376849 21746Agriculture, forestry and fishing 1240572 873181 367392 140530 137388 *Mining and quarrying 61425 61258 * 61039 60872 *Manufacturing 906129 899917 * 877281 876091 *Production and supply of electric and thermal
energy, gas, hot water and air conditioning 68587 68587 - 68396 68396 -Water distribution; sanitation, waste
administration, decontamination activities 64458 63110 * 60820 60587 *Constructions 591746 552090 39656 432626 428690 *Wholesale and retail; repair of motors vehicles
and motorcycles 520326 507107 13219 451358 447762 *Transport and storage 398730 392476 * 371409 369678 *Hotels and restaurants 74646 74001 * 68244 67599 *Information and communications 102239 99829 * 92962 92102 *Financial intermediation and insurance 36605 36144 * 36045 35788 *Real estate transactions 12515 11760 * 9617 9509 *Professional, scientific and technical activities 82250 79915 * 69571 68633 *Activities of administrative services and
activities of support services 150085 148290 * 147831 146646 *Public administration and defence; social
insurance of public system 280610 279791 * 280610 279791 *Education 85995 85631 * 84440 84134 *Health and social assistance 81389 81166 * 77645 77423 *Showbiz, cultural and recreation activities 29228 26683 * 24124 23116 *Other activities of the national economy 60813 51424 9389 44047 42645 *

132 Labour force in Romania: Employment and unemployment - 2015
Table 2.33. Employment and employees by working programme, gender, urban/rural area and activities of the national economy
(continued) - persons-
Employment of which: employees By working programme
By working programme
Gender Urban/rural area
Activities of the national economy Total full-time part-time
Total full-time part-time
WOMEN 3687038 3296229 390809 2663649 2638905 24744Agriculture, forestry and fishing 943262 592372 350890 37227 35750 *Mining and quarrying 11674 11674 - 11589 11589 -Manufacturing 645297 641690 * 637688 635718 *Production and supply of electric and thermal
energy, gas, hot water and air conditioning 13938 13938 - 13938 13938 -Water distribution; sanitation, waste
administration, decontamination activities 21289 20575 * 20881 20391 *Constructions 44569 44164 * 43353 43076 *Wholesale and retail; repair of motors vehicles
and motorcycles 628663 619315 9348 594232 589855 *Transport and storage 76609 75727 * 75670 74842 *Hotels and restaurants 111341 109373 * 108806 106838 *Information and communications 70601 68719 * 65617 65131 *Financial intermediation and insurance 68173 67443 * 67715 67116 *Real estate transactions 9515 8626 * 8948 8356 *Professional, scientific and technical activities 103218 100986 * 92725 91807 *Activities of administrative services and
activities of support services 54000 52179 * 51726 50483 *Public administration and defence; social
insurance of public system 161106 160543 * 161106 160543 *Education 269011 266797 * 267988 265995 *Health and social assistance 306505 304384 * 297551 295744 *Showbiz, cultural and recreation activities 27365 26759 * 26036 25467 *Other activities of the national economy 120902 110967 9935 80852 76267 *
URBAN 4662492 4552568 109924 4280039 4253761 26277Agriculture, forestry and fishing 180745 132652 48093 55050 53807 *Mining and quarrying 43896 43896 - 43636 43636 -Manufacturing 1002490 998586 * 985175 983712 *Production and supply of electric and thermal
energy, gas, hot water and air conditioning 61103 61103 - 60955 60955 -Water distribution; sanitation, waste
administration, decontamination activities 58793 56862 * 55228 54638 *Constructions 358837 345488 13349 295173 293306 *Wholesale and retail; repair of motors vehicles
and motorcycles 858147 842305 15842 788050 782722 *Transport and storage 328796 325216 * 311630 309772 *Hotels and restaurants 143335 141509 * 135683 133856 *Information and communications 149396 147654 * 143797 142721 *Financial intermediation and insurance 95593 94559 * 94769 94070 *Real estate transactions 19636 18161 * 16369 15837 *Professional, scientific and technical activities 163068 159657 * 142860 141445 *Activities of administrative services and
activities of support services 130119 128269 * 127283 125800 *Public administration and defence; social
insurance of public system 331615 330675 * 331615 330675 *Education 263264 261655 * 261775 260338 *Health and social assistance 309450 308429 * 299008 298042 *Showbiz, cultural and recreation activities 44823 43445 * 40488 39678 *Other activities of the national economy 119386 112447 6939 91494 88751 *
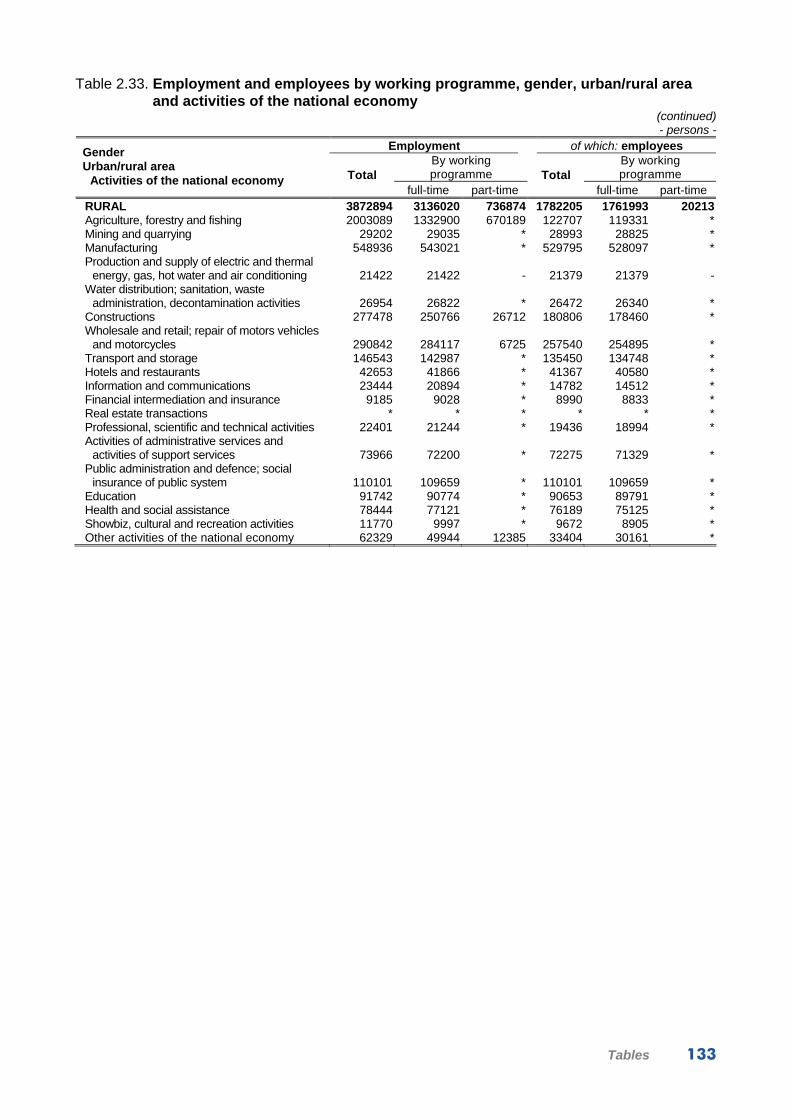
Tables 133
Table 2.33. Employment and employees by working programme, gender, urban/rural area and activities of the national economy
(continued) - persons -
Employment of which: employees By working programme
By working programme
Gender Urban/rural area
Activities of the national economy Total full-time part-time
Total full-time part-time
RURAL 3872894 3136020 736874 1782205 1761993 20213Agriculture, forestry and fishing 2003089 1332900 670189 122707 119331 *Mining and quarrying 29202 29035 * 28993 28825 *Manufacturing 548936 543021 * 529795 528097 *Production and supply of electric and thermal
energy, gas, hot water and air conditioning 21422 21422 - 21379 21379 -Water distribution; sanitation, waste
administration, decontamination activities 26954 26822 * 26472 26340 *Constructions 277478 250766 26712 180806 178460 *Wholesale and retail; repair of motors vehicles
and motorcycles 290842 284117 6725 257540 254895 *Transport and storage 146543 142987 * 135450 134748 *Hotels and restaurants 42653 41866 * 41367 40580 *Information and communications 23444 20894 * 14782 14512 *Financial intermediation and insurance 9185 9028 * 8990 8833 *Real estate transactions * * * * * *Professional, scientific and technical activities 22401 21244 * 19436 18994 *Activities of administrative services and
activities of support services 73966 72200 * 72275 71329 *Public administration and defence; social
insurance of public system 110101 109659 * 110101 109659 *Education 91742 90774 * 90653 89791 *Health and social assistance 78444 77121 * 76189 75125 *Showbiz, cultural and recreation activities 11770 9997 * 9672 8905 *Other activities of the national economy 62329 49944 12385 33404 30161 *

134 Labour force in Romania: Employment and unemployment - 2015
Table 2.34. Employment by status in employment, gender, urban/rural area, working programme and usual duration of the working week
- persons -
Status in employment, of which: Gender Urban/rural area Working programme
Usual duration of the working week
Employment
Total Employee Employer Self-
employed Contributing family worker
TOTAL 8535386 6062244 96002 1560559 816580
Full-time 7688588 6015754 94775 1073043 50501501-35 hours 345542 53099 * 166249 12491336-39 hours 35226 6844 * 17509 1080140 hours 5949616 5314113 60741 409709 16505341-45 hours 97618 60997 * 27216 817246 hours and over 665015 486452 20114 137076 21373no usual duration can be indicated 595569 94249 11333 315285 174703
Part-time 846798 46490 * 487516 311565
01-10 hours 8055 - * * *11-20 hours 126725 21344 * 61639 4350421-30 hours 96708 * - 57842 3257131 hours and over 17094 * - 9458 *no usual duration can be indicated 598215 15991 * 355239 226148
MEN 4848347 3398595 71659 1111507 266586
Full-time 4392358 3376849 70882 779824 164803
01-35 hours 153332 28370 * 94810 2924336-39 hours 15646 * * 10644 *40 hours 3339202 2924385 43945 310990 5988241-45 hours 62052 38128 * 20895 *46 hours and over 448033 315451 16521 106977 9084no usual duration can be indicated 374094 67944 9047 235508 61596
Part-time 455989 21746 * 331683 101783
01-10 hours * - * * *11-20 hours 52042 6705 * 33205 1197921-30 hours 50151 * - 38050 877931 hours and over 11830 * - 7650 *no usual duration can be indicated 338310 10490 * 251131 76218
WOMEN 3687038 2663649 24344 449053 549994
Full-time 3296229 2638905 23893 293219 340212
01-35 hours 192210 24729 * 71439 9567036-39 hours 19580 * - 6865 844240 hours 2610415 2389728 16796 98719 10517241-45 hours 35567 22869 * * *46 hours and over 216982 171001 * 30098 12290no usual duration can be indicated 221475 26305 * 79777 113107
Part-time 390809 24744 * 155834 209781
01-10 hours * - - * *11-20 hours 74683 14639 * 28434 3152521-30 hours 46557 * - 19792 2379231 hours and over * * - * *no usual duration can be indicated 259905 * * 104108 149930

Tables 135
Table 2.34. Employment by status in employment, gender, urban/rural area, working programme and usual duration of the working week
(continued) - persons -
Status in employment, of which: Gender Urban/rural area Working programme
Usual duration of the working week
Employment
Total Employee Employer Self-
employed Contributing family worker
URBAN 4662492 4280039 69044 269194 44216
Full-time 4552568 4253761 68161 206627 2401901-35 hours 70805 43383 * 16558 990336-39 hours 6910 * - * *40 hours 3928935 3769537 44427 105134 983741-45 hours 57223 48276 * 7434 *46 hours and over 401390 335044 15276 49349 *no usual duration can be indicated 87305 52331 * 26636 *
Part-time 109924 26277 * 62567 20197
01-10 hours * - * * -11-20 hours 17129 13158 * * *21-30 hours 10432 * - * *31 hours and over 7206 * - * *no usual duration can be indicated 74453 8923 * 49914 14998
RURAL 3872894 1782205 26958 1291366 772364
Full-time 3136020 1761993 26614 866416 480996
01-35 hours 274737 9716 * 149691 11501036-39 hours 28316 * * 15993 1059740 hours 2020681 1544576 16315 304575 15521641-45 hours 40396 12721 * 19781 771946 hours and over 263625 151409 * 87727 19651no usual duration can be indicated 508265 41917 * 288649 172803
Part-time 736874 20213 * 424949 291368
01-10 hours 7350 - * * *11-20 hours 109596 8187 * 58933 4243221-30 hours 86277 * - 52531 3004231 hours and over 9889 * - * *no usual duration can be indicated 523762 7068 * 305326 211150

136 Labour force in Romania: Employment and unemployment - 2015
Table 2.35. Employment by status in employment, gender, urban/rural area, working programme and actual duration of the working week
- persons-
Status in employment, of which: Gender Urban/rural area
Working programme Actual duration of the working
week
Employment
Total Employee Employer Self-employed Contributing family worker
TOTAL 8535386 6062244 96002 1560559 816580
Full-time 7688588 6015754 94775 1073043 505015under 11 hours 133922 118124 * 9740 *11-20 hours 149493 18346 * 72216 5791621-30 hours 365840 52125 * 182557 13005031-35 hours 136140 24319 * 66302 4464336-37 hours 31151 7130 - 14717 930438-39 hours 23213 * * 12248 1019940 hours 5843531 5135543 61163 465424 18140141-42 hours 42744 22646 * 15356 *43-45 hours 93077 48122 * 31990 1170546-50 hours 717075 516823 20934 143708 3561051-60 hours 143921 68023 * 56116 1413861 hours and over 8480 * * * *
Part-time 846798 46490 * 487516 311565under 11 hours 35938 * * 16691 1774311-20 hours 385711 25954 * 206392 15285021-30 hours 291199 12266 * 173528 10519731 hours and over 133951 7009 * 90905 35775
MEN 4848347 3398595 71659 1111507 266586
Full-time 4392358 3376849 70882 779824 164803
under 11 hours 34725 27661 * * *11-20 hours 71187 8557 * 46692 1506321-30 hours 188498 31158 * 116579 4009631-35 hours 67444 14739 * 40120 1211836-37 hours 15292 * - 9812 *38-39 hours 10490 * * 7466 *40 hours 3326334 2856891 44914 358078 6645141-42 hours 25292 12685 * 11186 *43-45 hours 61424 31977 * 25098 *46-50 hours 478424 339344 16592 108875 1361451-60 hours 105942 47653 * 47917 *61 hours and over 7307 * * * *
Part-time 455989 21746 * 331683 101783under 11 hours 15427 * * 9642 *11-20 hours 173902 9098 * 123257 4125521-30 hours 176133 7741 * 127625 4070131 hours and over 90528 * * 71159 14802

Tables 137
Table 2.35. Employment by status in employment, gender, urban/rural area, working programme and actual duration of the working week
(continued) - persons -
Status in employment, of which: Gender Urban/rural area
Working programme Actual duration of the working
week
Employment
Total Employee Employer Self-employed Contributing family worker
WOMEN 3687038 2663649 24344 449053 549994
Full-time 3296229 2638905 23893 293219 340212under 11 hours 99197 90463 * * *11-20 hours 78306 9789 * 25524 4285321-30 hours 177342 20967 * 65978 8995531-35 hours 68696 9579 * 26182 3252536-37 hours 15859 * - * 686438-39 hours 12723 * - * 739640 hours 2517197 2278652 16249 107346 11495041-42 hours 17452 9961 * * *43-45 hours 31653 16146 * 6892 795046-50 hours 238651 177479 * 34833 2199651-60 hours 37979 20370 * 8199 850661 hours and over * * * * *
Part-time 390809 24744 * 155834 209781under 11 hours 20511 * - 7049 1271911-20 hours 211809 16856 * 83135 11159421-30 hours 115066 * * 45903 6449531 hours and over 43423 * * 19746 20973
URBAN 4662492 4280039 69044 269194 44216
Full-time 4552568 4253761 68161 206627 24019
under 11 hours 87173 83292 * * *11-20 hours 21574 12519 * * *21-30 hours 58189 40823 * 12492 *31-35 hours 32408 16647 * 8701 *36-37 hours 6585 * - * -38-39 hours * * - * *40 hours 3816717 3652671 44995 110519 853241-42 hours 21593 19842 * * -43-45 hours 40852 33442 * * *46-50 hours 408183 350031 15046 41763 *51-60 hours 54168 36347 * 13612 *61 hours and over * * * * -
Part-time 109924 26277 * 62567 20197under 11 hours * * * * *11-20 hours 46536 16578 * 21277 831321-30 hours 35525 * * 22118 820931 hours and over 24838 * * 17422 *

138 Labour force in Romania: Employment and unemployment - 2015
Table 2.35. Employment by status in employment, gender, urban/rural area, working programme and actual duration of the working week
(continued) - persons -
Status in employment, of which: Gender Urban/rural area
Working programme Actual duration of the working
week
Employment
Total Employee Employer Self-employed Contributing family worker
RURAL 3872894 1782205 26958 1291366 772364
Full-time 3136020 1761993 26614 866416 480996under 11 hours 46749 34832 * 6655 *11-20 hours 127919 * * 65871 5571321-30 hours 307652 11302 * 170065 12582731-35 hours 103731 7672 * 57601 3821636-37 hours 24566 * - 13505 930438-39 hours 21668 * * 11452 999440 hours 2026814 1482873 16168 354905 17286941-42 hours 21151 * - 13983 *43-45 hours 52226 14680 * 25703 1140446-50 hours 308893 166792 * 101946 3426651-60 hours 89753 31676 * 42504 1383761 hours and over * * * * *
Part-time 736874 20213 * 424949 291368under 11 hours 32913 * * 14940 1739211-20 hours 339175 9377 * 185115 14453621-30 hours 255674 7276 - 151410 9698831 hours and over 109113 * * 73483 32452

Tables 139
Table 2.36. Employment and employees with part-time working programme by activity sectors of the national economy, gender, urban/rural area and usual duration of working week
- persons - Employed persons with part-time
working programme of which : employees
Activity sectors of the national economy
Activity sectors of the national economy
Gender Urban/rural area
Usual duration of working week TOTAL
Agriculture Industry and constructions
ServicesTotal
Agriculture Industry and constructions
Services
TOTAL 846798 718282 52111 76406 46490 * 8263 3360801-10 hours 8055 7103 * * - - - -11-20 hours 126725 99353 * 21253 21344 * * 1698421-24 hours 15791 14265 * * * * - *25-30 hours 80918 68524 * * * * * *31 hours and over 17094 12304 * * * * * *No usual duration
can be indicated 598215 516732 36997 44486 15991 * * 10280
MEN 455989 367392 47384 41213 21746 * * 1307801-10 hours * * * * - - - -11-20 hours 52042 41316 * 6625 6705 * * *21-24 hours 7185 * * * * * - *25-30 hours 42966 34083 * * * * * *31 hours and over 11830 8485 * * * * * *No usual duration
can be indicated 338310 274284 35283 28743 10490 * * *
WOMEN 390809 350890 * 35192 24744 * * 2053001-10 hours * * - * - - - -11-20 hours 74683 58037 * 14628 14639 * * 1263721-24 hours 8606 8010 - * * * - *25-30 hours 37951 34441 * * * * * *31 hours and over * * * * * * * *No usual duration
can be indicated 259905 242448 * 15743 * * * *
URBAN 109924 48093 19184 42647 26277 * * 2111301-10 hours * * * * - - - -11-20 hours 17129 * * 12646 13158 * * 1095921-24 hours * - * * * - - *25-30 hours 9505 * * * * * * *31 hours and over 7206 * * * * * * *No usual duration
can be indicated 74453 37537 12981 23936 8923 * * 6777
RURAL 736874 670189 32926 33759 20213 * * 1249501-10 hours 7350 6899 * * - - - -11-20 hours 109596 97310 * 8607 8187 * * *21-24 hours 14864 14265 * * * * - *25-30 hours 71413 64091 * * * * * *31 hours and over 9889 8428 * * * * * *No usual duration
can be indicated 523762 479196 24016 20550 7068 * * *

140 Labour force in Romania: Employment and unemployment - 2015
Table 2.37. Employment and employees with full-time working programme by usual duration of working week, gender, urban/rural area and activities of the national economy
Employed persons with full-time working programme
Usual duration of working week Gender Urban/rural area
Activities of the national economy
TOTAL 1-35 hours
36-39 hours
40 hours
41-45 hours
46 hours and over
No usual duration can be
indicated TOTAL 7688588 345542 35226 5949616 97618 665015 595569Agriculture, forestry and fishing 1465552 276310 26447 551573 31706 123477 456039Mining and quarrying 72931 13842 * 53745 * * *Manufacturing 1541607 * * 1397083 17611 109660 13437Production and supply of electric and
thermal energy, gas, hot water and air conditioning 82524 * - 79634 * * *
Water distribution; sanitation, waste administration, decontamination activities 83684 * * 74878 * * *
Constructions 596254 * * 449953 8356 96052 36685Wholesale and retail; repair of motors
vehicles and motorcycles 1126422 * * 951933 15002 134315 19492Transport and storage 468203 * * 388362 * 54198 20257Hotels and restaurants 183375 * - 143225 * 33510 *Information and communications 168548 * * 150705 * 7392 *Financial intermediation and insurance 103587 * - 96120 * * *Real estate transactions 20386 * * 17488 * * *Professional, scientific and technical
activities 180901 * * 164962 * * *Activities of administrative services and
activities of support services 200469 * * 178147 * 18176 *Public administration and defence; social
insurance of public system 440334 * * 421549 * 11977 *Education 352429 21430 * 320220 * * *Health and social assistance 385550 * * 346783 * 22887 7583Showbiz, cultural and recreation activities 53442 * * 45237 * * *Other activities of the national economy 162391 * * 118018 * 25451 10449
MEN 4392358 153332 15646 3339202 62052 448033 374094Agriculture, forestry and fishing 873181 113464 11808 360132 21311 96558 269908Mining and quarrying 61258 13781 * 43080 * * *Manufacturing 899917 * * 805574 10094 72173 9652Production and supply of electric and
thermal energy, gas, hot water and air conditioning 68587 * - 65990 * * *
Water distribution; sanitation, waste administration, decontamination activities 63110 * - 55702 * * *
Constructions 552090 * * 408815 7780 94788 35605Wholesale and retail; repair of motors
vehicles and motorcycles 507107 * * 419168 7869 63087 13365Transport and storage 392476 * * 318378 * 50149 19037Hotels and restaurants 74001 * - 54558 * 16040 *Information and communications 99829 * * 88256 * * *Financial intermediation and insurance 36144 - - 33690 * * *Real estate transactions 11760 * * 9852 * * *Professional, scientific and technical
activities 79915 * * 71551 * * *Activities of administrative services and
activities of support services 148290 - * 129533 * 15475 *Public administration and defence; social
insurance of public system 279791 * * 266445 * 9335 *Education 85631 * * 75130 * * *Health and social assistance 81166 * * 71038 * * *Showbiz, cultural and recreation activities 26683 * * 21539 * * *Other activities of the national economy 51424 * * 40772 * * *

Tables 141
- persons -
of which: employees Usual duration of working week
Total 1-35 hours
36-39 hours
40 hours
41-45 hours
46 hours and over
No usual duration can be
indicated
Gender Urban/rural area
Activities of the national economy
6015754 53099 6844 5314113 60997 486452 94249 TOTAL 173138 * - 125664 * 32992 9932 Agriculture, forestry and fishing
72461 13842 * 53620 * * * Mining and quarrying 1511809 * * 1380225 16660 104073 9214 Manufacturing
82334 * - 79443 * * *
Production and supply of electric and thermal energy, gas, hot water and air conditioning
80978 * * 73478 * * *Water distribution; sanitation, waste
administration, decontamination activities 471766 * - 387711 * 63124 13933 Constructions
1037617 * * 897781 11687 114676 10110Wholesale and retail; repair of motors
vehicles and motorcycles 444520 * - 375583 * 47572 16937 Transport and storage 174437 * - 138953 * 30460 * Hotels and restaurants 157233 * - 146584 * * * Information and communications 102904 - - 95698 * * * Financial intermediation and insurance 17865 * * 15791 * * * Real estate transactions
160439 * * 151403 * * *Professional, scientific and technical
activities
197129 * * 175259 * 18054 *Activities of administrative services and
activities of support services
440334 * * 421549 * 11977 *Public administration and defence; social
insurance of public system 350129 21430 * 318570 * * * Education 373167 * * 338195 * 21782 * Health and social assistance 48583 * - 42641 * * * Showbiz, cultural and recreation activities
118912 * * 95963 * 11355 * Other activities of the national economy
3376849 28370 * 2924385 38128 315451 67944 MEN 137388 * - 96999 * 28120 8779 Agriculture, forestry and fishing
60872 13781 * 42955 * * * Mining and quarrying 876091 * - 792686 9463 67050 * Manufacturing
68396 * - 65799 * * *
Production and supply of electric and thermal energy, gas, hot water and air conditioning
60587 * - 54396 * * *Water distribution; sanitation, waste
administration, decontamination activities 428690 * - 347436 * 61980 12853 Constructions
447762 * * 383607 * 50242 *Wholesale and retail; repair of motors
vehicles and motorcycles 369678 * - 306036 * 43878 15810 Transport and storage 67599 * - 51817 * 13539 * Hotels and restaurants 92102 - - 85019 * * * Information and communications 35788 - - 33334 * * * Financial intermediation and insurance
9509 * * 8425 * * * Real estate transactions
68633 * * 64179 * * *Professional, scientific and technical
activities
146646 - * 127890 * 15475 *Activities of administrative services and
activities of support services
279791 * * 266445 * 9335 *Public administration and defence; social
insurance of public system 84134 * * 74012 * * * Education 77423 * * 68132 * * * Health and social assistance 23116 * - 19648 * * * Showbiz, cultural and recreation activities 42645 * - 35571 * * * Other activities of the national economy
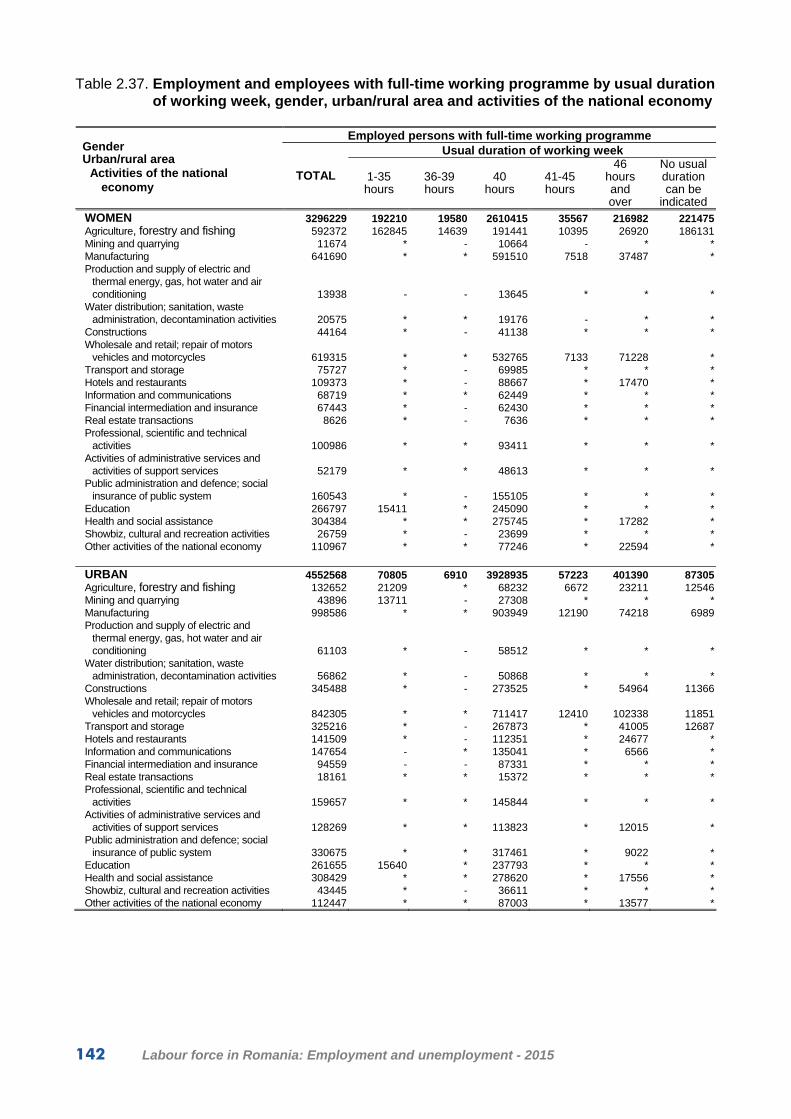
142 Labour force in Romania: Employment and unemployment - 2015
Table 2.37. Employment and employees with full-time working programme by usual duration of working week, gender, urban/rural area and activities of the national economy
Employed persons with full-time working programme
Usual duration of working week Gender Urban/rural area
Activities of the national economy
TOTAL 1-35 hours
36-39 hours
40 hours
41-45 hours
46 hours and over
No usual duration can be
indicated WOMEN 3296229 192210 19580 2610415 35567 216982 221475Agriculture, forestry and fishing 592372 162845 14639 191441 10395 26920 186131Mining and quarrying 11674 * - 10664 - * *Manufacturing 641690 * * 591510 7518 37487 *Production and supply of electric and
thermal energy, gas, hot water and air conditioning 13938 - - 13645 * * *
Water distribution; sanitation, waste administration, decontamination activities 20575 * * 19176 - * *
Constructions 44164 * - 41138 * * *Wholesale and retail; repair of motors
vehicles and motorcycles 619315 * * 532765 7133 71228 *Transport and storage 75727 * - 69985 * * *Hotels and restaurants 109373 * - 88667 * 17470 *Information and communications 68719 * * 62449 * * *Financial intermediation and insurance 67443 * - 62430 * * *Real estate transactions 8626 * - 7636 * * *Professional, scientific and technical
activities 100986 * * 93411 * * *Activities of administrative services and
activities of support services 52179 * * 48613 * * *Public administration and defence; social
insurance of public system 160543 * - 155105 * * *Education 266797 15411 * 245090 * * *Health and social assistance 304384 * * 275745 * 17282 *Showbiz, cultural and recreation activities 26759 * - 23699 * * *Other activities of the national economy 110967 * * 77246 * 22594 *
URBAN 4552568 70805 6910 3928935 57223 401390 87305Agriculture, forestry and fishing 132652 21209 * 68232 6672 23211 12546Mining and quarrying 43896 13711 - 27308 * * *Manufacturing 998586 * * 903949 12190 74218 6989Production and supply of electric and
thermal energy, gas, hot water and air conditioning 61103 * - 58512 * * *
Water distribution; sanitation, waste administration, decontamination activities 56862 * - 50868 * * *
Constructions 345488 * - 273525 * 54964 11366Wholesale and retail; repair of motors
vehicles and motorcycles 842305 * * 711417 12410 102338 11851Transport and storage 325216 * - 267873 * 41005 12687Hotels and restaurants 141509 * - 112351 * 24677 *Information and communications 147654 - * 135041 * 6566 *Financial intermediation and insurance 94559 - - 87331 * * *Real estate transactions 18161 * * 15372 * * *Professional, scientific and technical
activities 159657 * * 145844 * * *Activities of administrative services and
activities of support services 128269 * * 113823 * 12015 *Public administration and defence; social
insurance of public system 330675 * * 317461 * 9022 *Education 261655 15640 * 237793 * * *Health and social assistance 308429 * * 278620 * 17556 *Showbiz, cultural and recreation activities 43445 * - 36611 * * *Other activities of the national economy 112447 * * 87003 * 13577 *
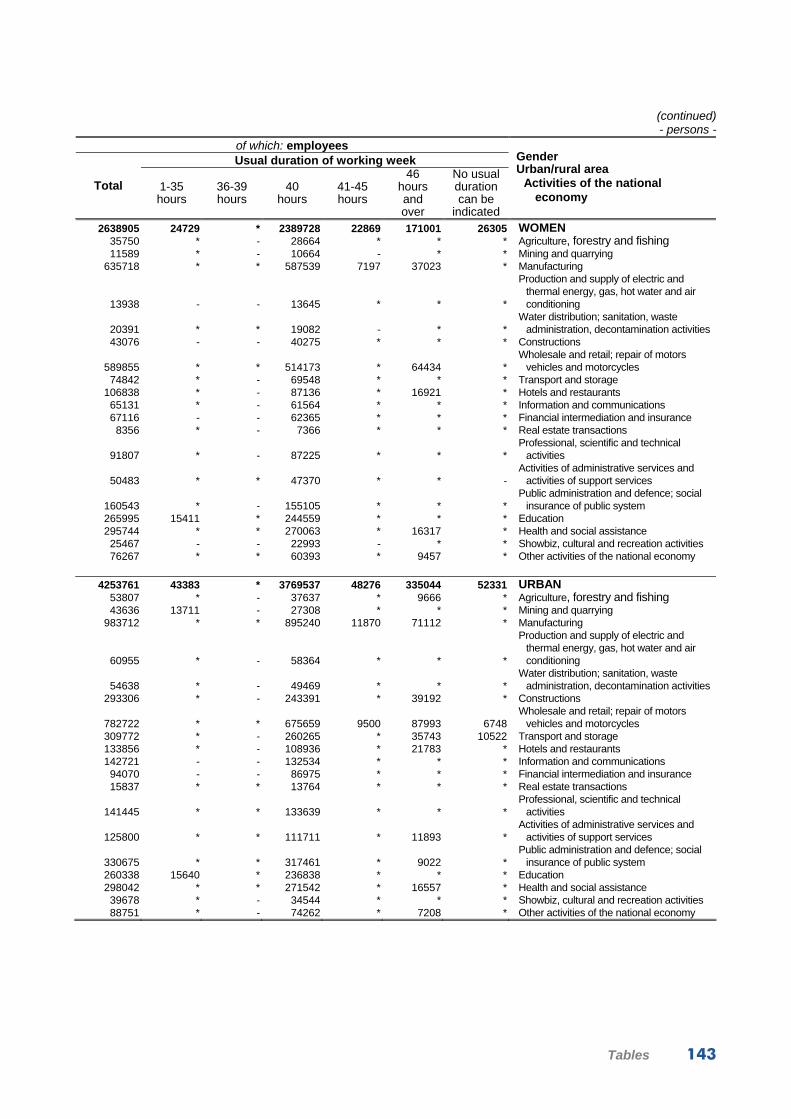
Tables 143
(continued) - persons -
of which: employees Usual duration of working week
Total 1-35 hours
36-39 hours
40 hours
41-45 hours
46 hours and over
No usual duration can be
indicated
Gender Urban/rural area
Activities of the national economy
2638905 24729 * 2389728 22869 171001 26305 WOMEN 35750 * - 28664 * * * Agriculture, forestry and fishing 11589 * - 10664 - * * Mining and quarrying
635718 * * 587539 7197 37023 * Manufacturing
13938 - - 13645 * * *
Production and supply of electric and thermal energy, gas, hot water and air conditioning
20391 * * 19082 - * *Water distribution; sanitation, waste
administration, decontamination activities 43076 - - 40275 * * * Constructions
589855 * * 514173 * 64434 *Wholesale and retail; repair of motors
vehicles and motorcycles 74842 * - 69548 * * * Transport and storage
106838 * - 87136 * 16921 * Hotels and restaurants 65131 * - 61564 * * * Information and communications 67116 - - 62365 * * * Financial intermediation and insurance
8356 * - 7366 * * * Real estate transactions
91807 * - 87225 * * *Professional, scientific and technical
activities
50483 * * 47370 * * -Activities of administrative services and
activities of support services
160543 * - 155105 * * *Public administration and defence; social
insurance of public system 265995 15411 * 244559 * * * Education 295744 * * 270063 * 16317 * Health and social assistance 25467 - - 22993 - * * Showbiz, cultural and recreation activities 76267 * * 60393 * 9457 * Other activities of the national economy
4253761 43383 * 3769537 48276 335044 52331 URBAN 53807 * - 37637 * 9666 * Agriculture, forestry and fishing 43636 13711 - 27308 * * * Mining and quarrying
983712 * * 895240 11870 71112 * Manufacturing
60955 * - 58364 * * *
Production and supply of electric and thermal energy, gas, hot water and air conditioning
54638 * - 49469 * * *Water distribution; sanitation, waste
administration, decontamination activities 293306 * - 243391 * 39192 * Constructions
782722 * * 675659 9500 87993 6748Wholesale and retail; repair of motors
vehicles and motorcycles 309772 * - 260265 * 35743 10522 Transport and storage 133856 * - 108936 * 21783 * Hotels and restaurants 142721 - - 132534 * * * Information and communications 94070 - - 86975 * * * Financial intermediation and insurance 15837 * * 13764 * * * Real estate transactions
141445 * * 133639 * * *Professional, scientific and technical
activities
125800 * * 111711 * 11893 *Activities of administrative services and
activities of support services
330675 * * 317461 * 9022 *Public administration and defence; social
insurance of public system 260338 15640 * 236838 * * * Education 298042 * * 271542 * 16557 * Health and social assistance 39678 * - 34544 * * * Showbiz, cultural and recreation activities 88751 * - 74262 * 7208 * Other activities of the national economy

144 Labour force in Romania: Employment and unemployment - 2015
Table 2.37. Employment and employees with full-time working programme by usual duration of working week, gender, urban/rural area and activities of the national economy
Employed persons with full-time working programme
Usual duration of working week Gender Urban/rural area
Activities of the national economy
TOTAL 1-35 hours
36-39 hours
40 hours
41-45 hours
46 hours and over
No usual duration can be
indicated RURAL 3136020 274737 28316 2020681 40396 263625 508265Agriculture, forestry and fishing 1332900 255101 25665 483341 25034 100267 443493Mining and quarrying 29035 * * 26437 - * *Manufacturing 543021 * * 493134 * 35443 *Production and supply of electric and
thermal energy, gas, hot water and air conditioning 21422 - - 21123 * * *
Water distribution; sanitation, waste administration, decontamination activities 26822 * * 24010 * * *
Constructions 250766 * * 176428 * 41087 25319Wholesale and retail; repair of motors
vehicles and motorcycles 284117 * * 240516 * 31978 7641Transport and storage 142987 * * 120489 * 13193 7570Hotels and restaurants 41866 * - 30874 * 8833 *Information and communications 20894 * * 15664 * * *Financial intermediation and insurance 9028 * - 8789 - * *Real estate transactions * - - * - - *Professional, scientific and technical
activities 21244 * - 19118 * * *Activities of administrative services and
activities of support services 72200 * * 64323 * * *Public administration and defence; social
insurance of public system 109659 * * 104088 * * *Education 90774 * * 82427 * * *Health and social assistance 77121 * * 68163 * * *Showbiz, cultural and recreation activities 9997 * * 8626 - * *Other activities of the national economy 49944 * * 31015 * 11873 *

Tables 145
(continued) - persons-
of which: employees Usual duration of working week
Total 1-35 hours
36-39 hours
40 hours
41-45 hours
46 hours and over
No usual duration can be
indicated
Gender Urban/rural area
Activities of the national economy
1761993 9716 * 1544576 12721 151409 41917 RURAL 119331 * - 88026 * 23326 7411 Agriculture, forestry and fishing
28825 * * 26312 - * * Mining and quarrying 528097 * - 484985 * 32960 * Manufacturing
21379 - - 21079 * * *
Production and supply of electric and thermal energy, gas, hot water and air conditioning
26340 * * 24010 * * *Water distribution; sanitation, waste
administration, decontamination activities 178460 * - 144321 * 23933 7777 Constructions
254895 * * 222121 * 26682 *Wholesale and retail; repair of motors
vehicles and motorcycles 134748 * - 115318 * 11829 * Transport and storage 40580 * - 30017 * 8676 * Hotels and restaurants 14512 * - 14050 - * * Information and communications
8833 - - 8724 - * * Financial intermediation and insurance * - - * - - - Real estate transactions
18994 * - 17764 * * *Professional, scientific and technical
activities
71329 * * 63548 * * *Activities of administrative services and
activities of support services
109659 * * 104088 * * *Public administration and defence; social
insurance of public system 89791 * * 81732 * * * Education 75125 * * 66653 * * * Health and social assistance
8905 * - 8096 - * * Showbiz, cultural and recreation activities 30161 * * 21702 * * * Other activities of the national economy

146 Labour force in Romania: Employment and unemployment - 2015
Table 2.38. Employment and employees with full-time working programme by actual duration of working week, gender, urban/rural area and activities of the national economy
Employed persons with full-time working programme
Actual duration of working week Gender Urban/rural area
Activities of the national economy
TOTAL 0 hours 1-35
hours 36-39 hours
40 hours
41-45 hours
46 hours and over
TOTAL 7688588 121129 664265 54364 5843531 135821 869477Agriculture, forestry and fishing 1465552 * 535607 43768 609171 58832 216426Mining and quarrying 72931 * 14122 * 52565 * *Manufacturing 1541607 31167 17300 * 1328358 21463 142716Production and supply of electric and
thermal energy, gas, hot water and air conditioning 82524 * * * 78411 * *
Water distribution; sanitation, waste administration, decontamination activities 83684 * * * 74346 * 6566
Constructions 596254 10450 16433 * 443953 9654 115027Wholesale and retail; repair of motors
vehicles and motorcycles 1126422 25645 13486 * 920837 16532 149260Transport and storage 468203 * * - 381605 * 70811Hotels and restaurants 183375 * * - 137073 * 37407Information and communications 168548 * * * 147160 * 9406Financial intermediation and insurance 103587 * * * 94849 * *Real estate transactions 20386 * * * 17364 * *Professional, scientific and technical
activities 180901 * * * 162521 * 8010Activities of administrative services and
activities of support services 200469 * * * 173449 * 21460Public administration and defence; social
insurance of public system 440334 * * * 414208 * 16193Education 352429 18297 24146 * 302613 * *Health and social assistance 385550 * 7641 * 338670 * 28990Showbiz, cultural and recreation activities 53442 * * * 44936 * *Other activities of the national economy 162391 * * * 121441 * 27150
MEN 4392358 30010 331845 25781 3326334 86716 591673Agriculture, forestry and fishing 873181 * 252823 20608 402778 37986 157546Mining and quarrying 61258 * 13884 * 42312 * *Manufacturing 899917 7503 10588 * 777441 12197 91751Production and supply of electric and
thermal energy, gas, hot water and air conditioning 68587 * * * 64941 * *
Water distribution; sanitation, waste administration, decontamination activities 63110 * * - 55425 * *
Constructions 552090 8255 15752 * 404973 9222 113150Wholesale and retail; repair of motors
vehicles and motorcycles 507107 * 7716 * 413111 8983 74327Transport and storage 392476 * * - 313668 * 66181Hotels and restaurants 74001 * * - 53334 * 17715Information and communications 99829 * * * 86823 * *Financial intermediation and insurance 36144 * * - 33327 * *Real estate transactions 11760 - * * 10015 * *Professional, scientific and technical
activities 79915 * * * 71346 * *Activities of administrative services and
activities of support services 148290 * * * 126960 * 18410Public administration and defence; social
insurance of public system 279791 * * * 261995 * 13058Education 85631 * 7115 * 73194 * *Health and social assistance 81166 * * * 69898 * 7394Showbiz, cultural and recreation activities 26683 - * * 21970 * *Other activities of the national economy 51424 * * * 42822 * *

Tables 147
- persons -
of which: employees Actual duration of working week
Total 0 hours 1-35
hours 36-39 hours
40 hours
41-45 hours
46 hours and over
Gender Urban/rural area
Activities of the national economy
6015754 116064 96850 7824 5135543 70769 588705 TOTAL 173138 * * * 123330 * 41067 Agriculture, forestry and fishing
72461 * 14038 * 52440 * * Mining and quarrying 1511809 30932 12345 * 1311726 20492 136041 Manufacturing
82334 * * * 78220 * *
Production and supply of electric and thermal energy, gas, hot water and air conditioning
80978 * * * 72947 * *Water distribution; sanitation, waste
administration, decontamination activities 471766 8677 * * 373906 6780 76798 Constructions
1037617 25268 8422 * 865774 13106 124633Wholesale and retail; repair of motors
vehicles and motorcycles 444520 * * - 368642 * 62508 Transport and storage 174437 * * - 132276 * 33951 Hotels and restaurants 157233 * * * 142848 * 7577 Information and communications 102904 * * * 94312 * * Financial intermediation and insurance
17865 * * * 15583 * * Real estate transactions
160439 * * * 148566 * *Professional, scientific and technical
activities
197129 * * * 170518 * 21262Activities of administrative services and
activities of support services
440334 * * * 414208 * 16193Public administration and defence; social
insurance of public system 350129 18297 23992 * 301005 * * Education 373167 * 6725 * 329495 * 27429 Health and social assistance 48583 * * * 42117 - * Showbiz, cultural and recreation activities
118912 * * * 97631 * 12507 Other activities of the national economy
3376849 26883 55232 * 2856891 44662 389992 MEN 137388 * * * 95574 * 34638 Agriculture, forestry and fishing
60872 * 13884 * 42187 * * Mining and quarrying 876091 7268 6745 * 764802 11459 85710 Manufacturing
68396 * * * 64750 * *
Production and supply of electric and thermal energy, gas, hot water and air conditioning
60587 * * - 54119 * *Water distribution; sanitation, waste
administration, decontamination activities 428690 * * * 335789 * 75041 Constructions
447762 * * * 376500 7014 57651Wholesale and retail; repair of motors
vehicles and motorcycles 369678 * * - 301234 * 58234 Transport and storage
67599 * * - 50167 * 14809 Hotels and restaurants 92102 * * - 83439 * * Information and communications 35788 * * - 32971 * * Financial intermediation and insurance 9509 - * * 8504 * * Real estate transactions
68633 - * * 63605 * *Professional, scientific and technical
activities
146646 * * * 125393 * 18333Activities of administrative services and
activities of support services
279791 * * * 261995 * 13058Public administration and defence; social
insurance of public system 84134 * 7073 * 72118 * * Education 77423 * * * 66701 * 7125 Health and social assistance 23116 - * * 19856 - * Showbiz, cultural and recreation activities 42645 * * * 37186 * * Other activities of the national economy
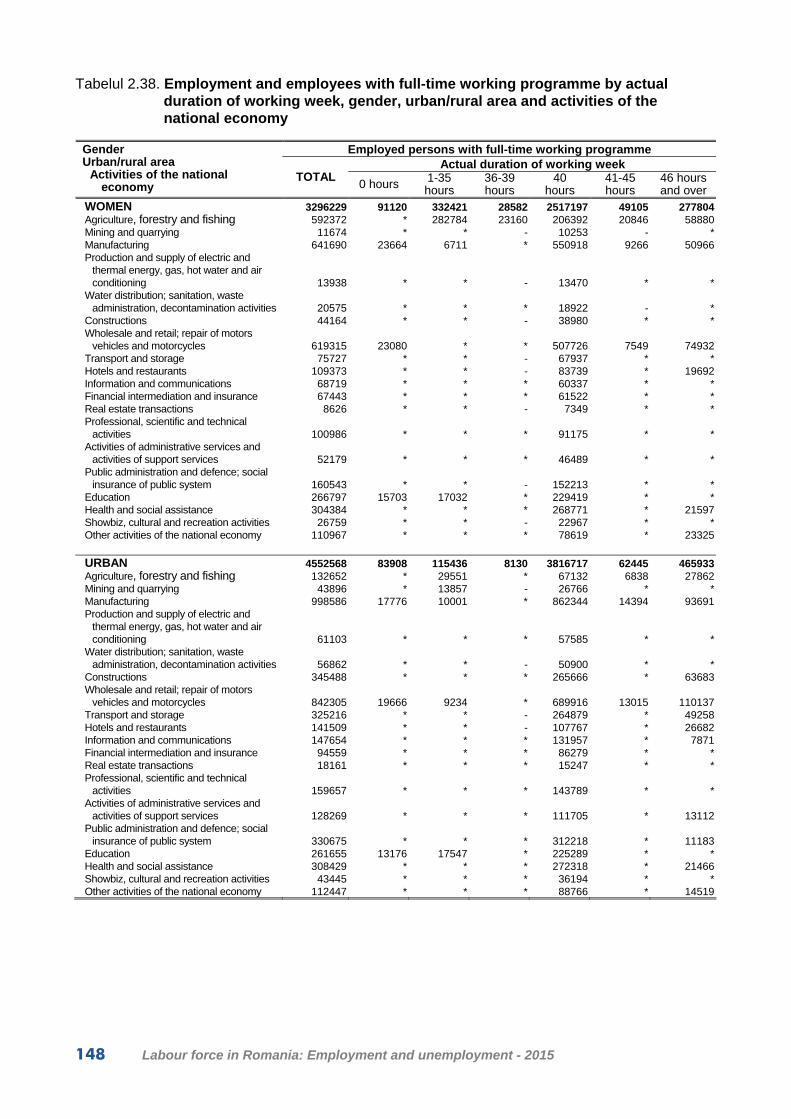
148 Labour force in Romania: Employment and unemployment - 2015
Tabelul 2.38. Employment and employees with full-time working programme by actual duration of working week, gender, urban/rural area and activities of the national economy
Employed persons with full-time working programme
Actual duration of working week Gender Urban/rural area
Activities of the national economy
TOTAL 0 hours 1-35
hours 36-39 hours
40 hours
41-45 hours
46 hours and over
WOMEN 3296229 91120 332421 28582 2517197 49105 277804Agriculture, forestry and fishing 592372 * 282784 23160 206392 20846 58880Mining and quarrying 11674 * * - 10253 - *Manufacturing 641690 23664 6711 * 550918 9266 50966Production and supply of electric and
thermal energy, gas, hot water and air conditioning 13938 * * - 13470 * *
Water distribution; sanitation, waste administration, decontamination activities 20575 * * * 18922 - *
Constructions 44164 * * - 38980 * *Wholesale and retail; repair of motors
vehicles and motorcycles 619315 23080 * * 507726 7549 74932Transport and storage 75727 * * - 67937 * *Hotels and restaurants 109373 * * - 83739 * 19692Information and communications 68719 * * * 60337 * *Financial intermediation and insurance 67443 * * * 61522 * *Real estate transactions 8626 * * - 7349 * *Professional, scientific and technical
activities 100986 * * * 91175 * *Activities of administrative services and
activities of support services 52179 * * * 46489 * *Public administration and defence; social
insurance of public system 160543 * * - 152213 * *Education 266797 15703 17032 * 229419 * *Health and social assistance 304384 * * * 268771 * 21597Showbiz, cultural and recreation activities 26759 * * - 22967 * *Other activities of the national economy 110967 * * * 78619 * 23325
URBAN 4552568 83908 115436 8130 3816717 62445 465933Agriculture, forestry and fishing 132652 * 29551 * 67132 6838 27862Mining and quarrying 43896 * 13857 - 26766 * *Manufacturing 998586 17776 10001 * 862344 14394 93691Production and supply of electric and
thermal energy, gas, hot water and air conditioning 61103 * * * 57585 * *
Water distribution; sanitation, waste administration, decontamination activities 56862 * * - 50900 * *
Constructions 345488 * * * 265666 * 63683Wholesale and retail; repair of motors
vehicles and motorcycles 842305 19666 9234 * 689916 13015 110137Transport and storage 325216 * * - 264879 * 49258Hotels and restaurants 141509 * * - 107767 * 26682Information and communications 147654 * * * 131957 * 7871Financial intermediation and insurance 94559 * * * 86279 * *Real estate transactions 18161 * * * 15247 * *Professional, scientific and technical
activities 159657 * * * 143789 * *Activities of administrative services and
activities of support services 128269 * * * 111705 * 13112Public administration and defence; social
insurance of public system 330675 * * * 312218 * 11183Education 261655 13176 17547 * 225289 * *Health and social assistance 308429 * * * 272318 * 21466Showbiz, cultural and recreation activities 43445 * * * 36194 * *Other activities of the national economy 112447 * * * 88766 * 14519

Tables 149
(continued) - persons -
of which: employees Actual duration of working week
Total 0 hours 1-35
hours 36-39 hours
40 hours
41-45 hours
46 hours and over
Gender Urban/rural area
Activities of the national economy
2638905 89181 41618 * 2278652 26106 198713 WOMEN 35750 * * - 27756 * * Agriculture, forestry and fishing 11589 * * - 10253 - * Mining and quarrying
635718 23664 * * 546924 9033 50331 Manufacturing
13938 * * - 13470 * *
Production and supply of electric and thermal energy, gas, hot water and air conditioning
20391 * * * 18828 - *Water distribution; sanitation, waste
administration, decontamination activities 43076 * * - 38117 * * Constructions
589855 22945 * * 489273 * 66982Wholesale and retail; repair of motors
vehicles and motorcycles 74842 * * - 67408 * * Transport and storage
106838 * * - 82109 * 19142 Hotels and restaurants 65131 * * * 59409 * * Information and communications 67116 * * * 61341 * * Financial intermediation and insurance
8356 * * - 7079 * * Real estate transactions
91807 * * - 84960 * *Professional, scientific and technical
activities
50483 * * * 45125 * *Activities of administrative services and
activities of support services
160543 * * - 152213 * *Public administration and defence; social
insurance of public system 265995 15703 16919 * 228887 * * Education 295744 * * * 262794 * 20304 Health and social assistance 25467 * * - 22261 - * Showbiz, cultural and recreation activities 76267 * * * 60445 * 9846 Other activities of the national economy
4253761 81581 71701 * 3652671 53284 388608 URBAN 53807 * * - 37430 * 11350 Agriculture, forestry and fishing 43636 * 13857 - 26766 * * Mining and quarrying
983712 17776 7937 * 853692 13966 90176 Manufacturing
60955 * * * 57437 * *
Production and supply of electric and thermal energy, gas, hot water and air conditioning
54638 * * - 49501 * *Water distribution; sanitation, waste
administration, decontamination activities 293306 * * - 234831 * 46774 Constructions
782722 19522 * * 653505 10286 92973Wholesale and retail; repair of motors
vehicles and motorcycles 309772 * * - 256352 * 43347 Transport and storage 133856 * * - 103919 * 23486 Hotels and restaurants 142721 * * * 129366 * 6896 Information and communications 94070 * * * 85846 * * Financial intermediation and insurance 15837 * * * 13555 * * Real estate transactions
141445 * * * 131400 * *Professional, scientific and technical
activities
125800 * * * 109473 * 12990Activities of administrative services and
activities of support services
330675 * * * 312218 * 11183Public administration and defence; social
insurance of public system 260338 13176 17434 * 224334 * * Education 298042 * * * 264490 * 20219 Health and social assistance 39678 * * * 33904 - * Showbiz, cultural and recreation activities 88751 * * - 74652 * 7877 Other activities of the national economy

150 Labour force in Romania: Employment and unemployment - 2015
Table 2.38. Employment and employees with full-time working programme by actual duration of working week, gender, urban/rural area and activities of the national economy
Employed persons with full-time working programme
Actual duration of working week Gender Urban/rural area
Activities of the national economy
TOTAL 0 hours 1-35
hours 36-39 hours
40 hours
41-45 hours
46 hours and over
RURAL 3136020 37222 548829 46234 2026814 73376 403544Agriculture, forestry and fishing 1332900 * 506056 42985 542038 51994 188564Mining and quarrying 29035 * * * 25799 - *Manufacturing 543021 13391 7299 * 466015 7069 49026Production and supply of electric and
thermal energy, gas, hot water and air conditioning 21422 * * - 20826 * *
Water distribution; sanitation, waste administration, decontamination activities 26822 * * * 23446 * *
Constructions 250766 * 10978 * 178287 * 51344Wholesale and retail; repair of motors
vehicles and motorcycles 284117 * * * 230921 * 39123Transport and storage 142987 * * - 116726 * 21553Hotels and restaurants 41866 * * - 29306 * 10726Information and communications 20894 * * * 15204 * *Financial intermediation and insurance 9028 * * - 8570 - *Real estate transactions * - - - * - *Professional, scientific and technical
activities 21244 * * - 18732 * *Activities of administrative services and
activities of support services 72200 * * * 61744 * 8348Public administration and defence; social
insurance of public system 109659 * * * 101990 * *Education 90774 * 6600 * 77324 * *Health and social assistance 77121 * * * 66351 * 7524Showbiz, cultural and recreation activities 9997 - * * 8743 * *Other activities of the national economy 49944 * * * 32675 * 12631

Tables 151
(continued) - persons -
of which: employees Actual duration of working week
Total 0 hours 1-35
hours 36-39 hours
40 hours
41-45 hours
46 hours and over
Gender Urban/rural area
Activities of the national economy
1761993 34483 25149 * 1482873 17484 200097 RURAL 119331 * * * 85900 * 29717 Agriculture, forestry and fishing
28825 * * * 25674 - * Mining and quarrying 528097 13157 * * 458034 6526 45865 Manufacturing
21379 * * - 20783 * *
Production and supply of electric and thermal energy, gas, hot water and air conditioning
26340 * * * 23446 * *Water distribution; sanitation, waste
administration, decontamination activities 178460 * * * 139075 * 30024 Constructions
254895 * * * 212268 * 31660Wholesale and retail; repair of motors
vehicles and motorcycles 134748 * * - 112290 * 19161 Transport and storage 40580 * * - 28356 * 10464 Hotels and restaurants 14512 * * - 13482 - * Information and communications
8833 * * - 8466 - * Financial intermediation and insurance * - - - * - - Real estate transactions
18994 * * - 17166 * *Professional, scientific and technical
activities
71329 * * * 61045 * 8272Activities of administrative services and
activities of support services
109659 * * * 101990 * *Public administration and defence; social
insurance of public system 89791 * 6558 * 76671 * * Education 75125 * * * 65005 * 7210 Health and social assistance
8905 - * - 8213 - * Showbiz, cultural and recreation activities 30161 * * * 22979 * * Other activities of the national economy
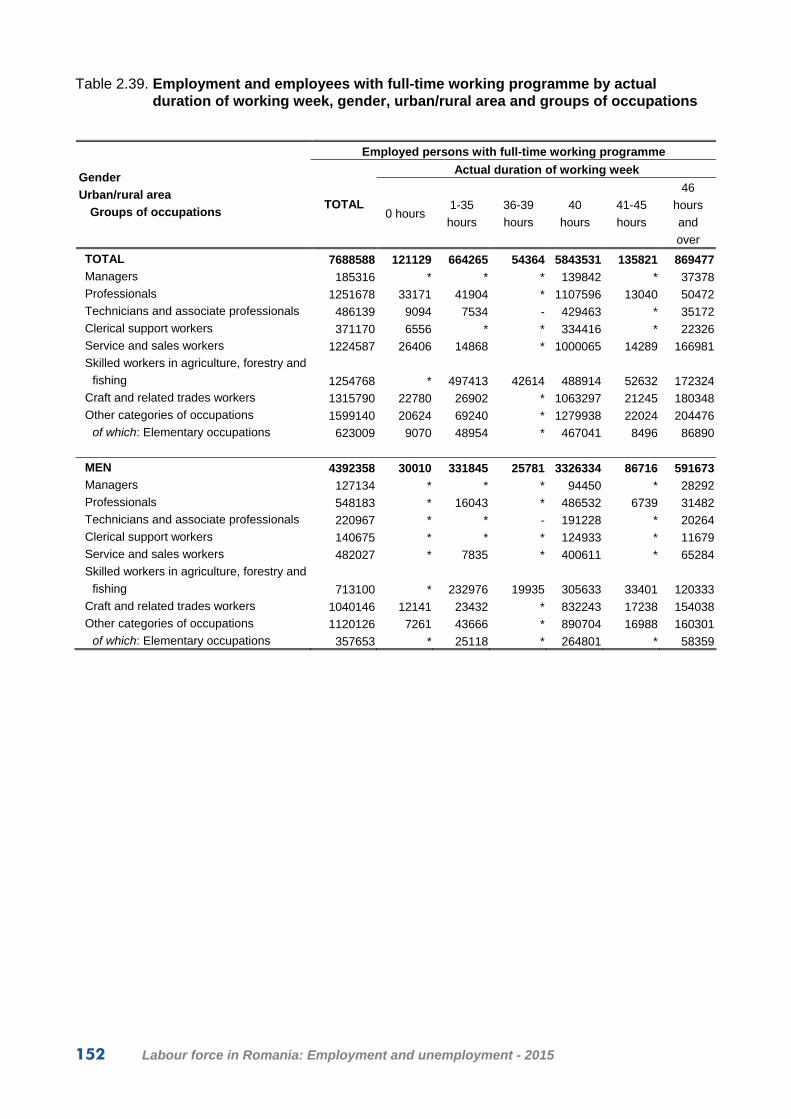
152 Labour force in Romania: Employment and unemployment - 2015
Table 2.39. Employment and employees with full-time working programme by actual duration of working week, gender, urban/rural area and groups of occupations
Employed persons with full-time working programme
Actual duration of working week Gender
Urban/rural area
Groups of occupations TOTAL
0 hours 1-35
hours
36-39
hours
40
hours
41-45
hours
46
hours
and
over
TOTAL 7688588 121129 664265 54364 5843531 135821 869477Managers 185316 * * * 139842 * 37378Professionals 1251678 33171 41904 * 1107596 13040 50472Technicians and associate professionals 486139 9094 7534 - 429463 * 35172Clerical support workers 371170 6556 * * 334416 * 22326Service and sales workers 1224587 26406 14868 * 1000065 14289 166981Skilled workers in agriculture, forestry and
fishing 1254768 * 497413 42614 488914 52632 172324Craft and related trades workers 1315790 22780 26902 * 1063297 21245 180348Other categories of occupations 1599140 20624 69240 * 1279938 22024 204476
of which: Elementary occupations 623009 9070 48954 * 467041 8496 86890
MEN 4392358 30010 331845 25781 3326334 86716 591673Managers 127134 * * * 94450 * 28292Professionals 548183 * 16043 * 486532 6739 31482Technicians and associate professionals 220967 * * - 191228 * 20264Clerical support workers 140675 * * * 124933 * 11679Service and sales workers 482027 * 7835 * 400611 * 65284Skilled workers in agriculture, forestry and
fishing 713100 * 232976 19935 305633 33401 120333Craft and related trades workers 1040146 12141 23432 * 832243 17238 154038Other categories of occupations 1120126 7261 43666 * 890704 16988 160301
of which: Elementary occupations 357653 * 25118 * 264801 * 58359
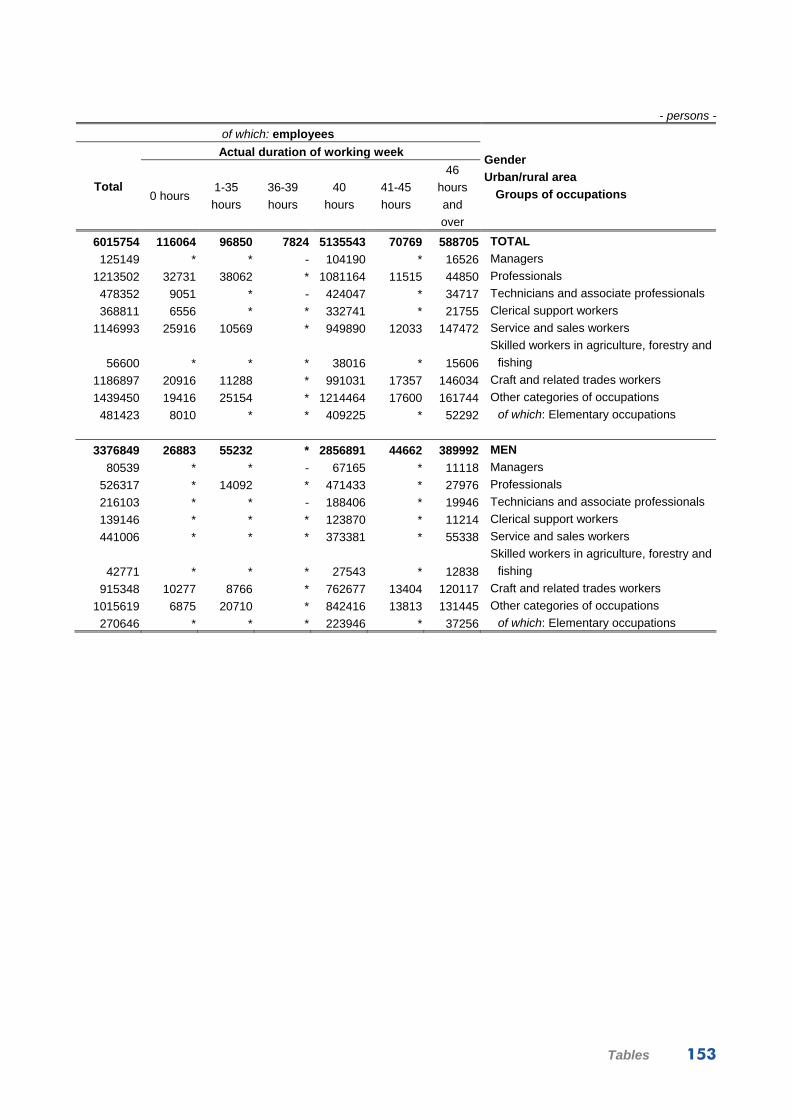
Tables 153
- persons -
of which: employees
Actual duration of working week
Total 0 hours
1-35
hours
36-39
hours
40
hours
41-45
hours
46
hours
and
over
Gender
Urban/rural area
Groups of occupations
6015754 116064 96850 7824 5135543 70769 588705 TOTAL
125149 * * - 104190 * 16526 Managers
1213502 32731 38062 * 1081164 11515 44850 Professionals
478352 9051 * - 424047 * 34717 Technicians and associate professionals
368811 6556 * * 332741 * 21755 Clerical support workers
1146993 25916 10569 * 949890 12033 147472 Service and sales workers
56600 * * * 38016 * 15606
Skilled workers in agriculture, forestry and
fishing
1186897 20916 11288 * 991031 17357 146034 Craft and related trades workers
1439450 19416 25154 * 1214464 17600 161744 Other categories of occupations
481423 8010 * * 409225 * 52292 of which: Elementary occupations
3376849 26883 55232 * 2856891 44662 389992 MEN
80539 * * - 67165 * 11118 Managers
526317 * 14092 * 471433 * 27976 Professionals
216103 * * - 188406 * 19946 Technicians and associate professionals
139146 * * * 123870 * 11214 Clerical support workers
441006 * * * 373381 * 55338 Service and sales workers
42771 * * * 27543 * 12838
Skilled workers in agriculture, forestry and
fishing
915348 10277 8766 * 762677 13404 120117 Craft and related trades workers
1015619 6875 20710 * 842416 13813 131445 Other categories of occupations
270646 * * * 223946 * 37256 of which: Elementary occupations
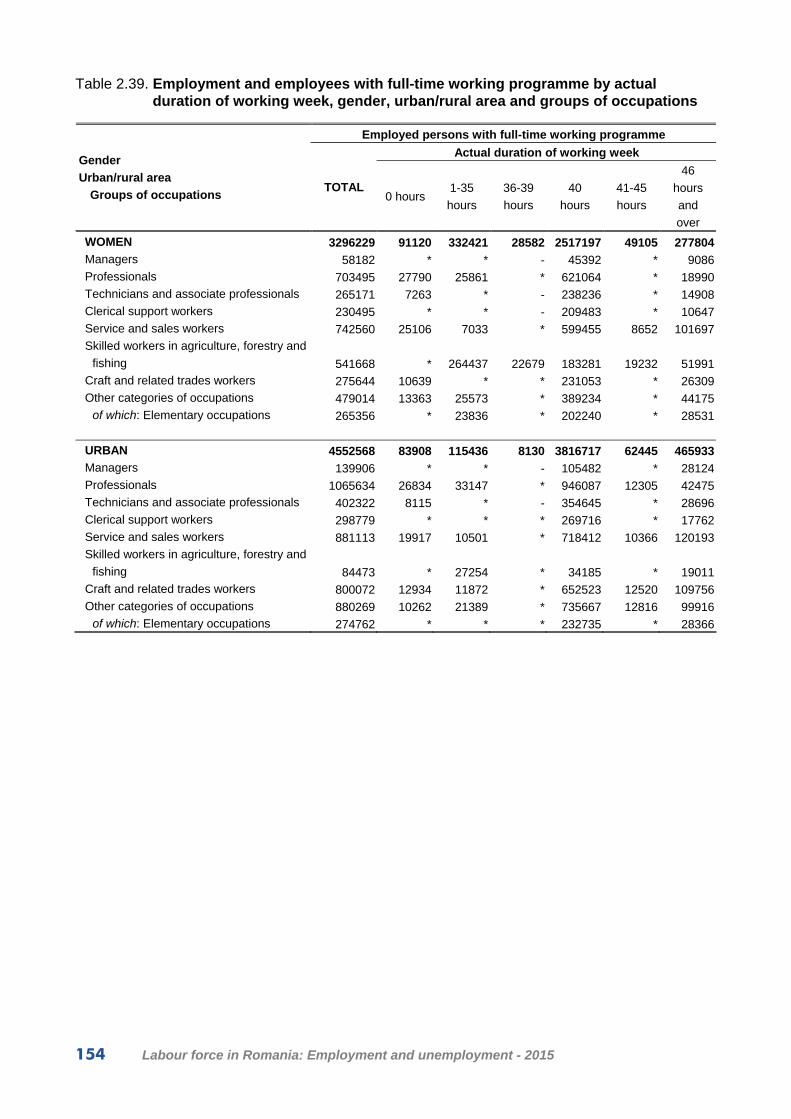
154 Labour force in Romania: Employment and unemployment - 2015
Table 2.39. Employment and employees with full-time working programme by actual duration of working week, gender, urban/rural area and groups of occupations
Employed persons with full-time working programme
Actual duration of working week Gender
Urban/rural area
Groups of occupations TOTAL
0 hours 1-35
hours
36-39
hours
40
hours
41-45
hours
46
hours
and
over
WOMEN 3296229 91120 332421 28582 2517197 49105 277804Managers 58182 * * - 45392 * 9086Professionals 703495 27790 25861 * 621064 * 18990Technicians and associate professionals 265171 7263 * - 238236 * 14908Clerical support workers 230495 * * - 209483 * 10647Service and sales workers 742560 25106 7033 * 599455 8652 101697Skilled workers in agriculture, forestry and
fishing 541668 * 264437 22679 183281 19232 51991Craft and related trades workers 275644 10639 * * 231053 * 26309Other categories of occupations 479014 13363 25573 * 389234 * 44175
of which: Elementary occupations 265356 * 23836 * 202240 * 28531
URBAN 4552568 83908 115436 8130 3816717 62445 465933Managers 139906 * * - 105482 * 28124Professionals 1065634 26834 33147 * 946087 12305 42475Technicians and associate professionals 402322 8115 * - 354645 * 28696Clerical support workers 298779 * * * 269716 * 17762Service and sales workers 881113 19917 10501 * 718412 10366 120193Skilled workers in agriculture, forestry and
fishing 84473 * 27254 * 34185 * 19011Craft and related trades workers 800072 12934 11872 * 652523 12520 109756Other categories of occupations 880269 10262 21389 * 735667 12816 99916
of which: Elementary occupations 274762 * * * 232735 * 28366

Tables 155
(continued) - persons -
of which: employees
Actual duration of working week
Total 0 hours
1-35
hours
36-39
hours
40
hours
41-45
hours
46
hours
and
over
Gender
Urban/rural area
Groups of occupations
2638905 89181 41618 * 2278652 26106 198713 WOMEN
44610 * * - 37025 * * Managers
687185 27653 23970 * 609732 * 16875 Professionals
262249 7220 * - 235641 * 14770 Technicians and associate professionals
229665 * * - 208871 * 10541 Clerical support workers
705987 24665 * * 576508 7237 92134 Service and sales workers
13829 - * - 10474 * *
Skilled workers in agriculture, forestry and
fishing
271549 10639 * * 228354 * 25917 Craft and related trades workers
423831 12541 * * 372048 * 30300 Other categories of occupations
210777 * * * 185279 * 15035 of which: Elementary occupations
4253761 81581 71701 * 3652671 53284 388608 URBAN
98307 * * - 81520 * 13080 Managers
1033142 26394 29679 * 923701 11043 37803 Professionals
395771 8115 * - 349803 * 28385 Technicians and associate professionals
297206 * * * 268635 * 17382 Clerical support workers
824451 19645 7889 * 682221 8517 105318 Service and sales workers
11490 * - - 7977 * *
Skilled workers in agriculture, forestry and
fishing
747159 12287 6503 * 622169 11180 94855 Craft and related trades workers
846236 9805 18488 * 716645 12304 88774 Other categories of occupations
251393 * * * 218395 * 22367 of which: Elementary occupations

156 Labour force in Romania: Employment and unemployment - 2015
Table 2.39. Employment and employees with full-time working programme by actual duration of working week, gender, urban/rural area and groups of occupations
Employed persons with full-time working programme
Actual duration of working week Gender
Urban/rural area
Groups of occupations TOTAL
0 hours 1-35
hours
36-39
hours
40
hours
41-45
hours
46
hours
and
over
RURAL 3136020 37222 548829 46234 2026814 73376 403544Managers 45410 * * * 34360 * 9254Professionals 186044 * 8757 * 161509 * 7996Technicians and associate professionals 83817 * * - 74819 * *Clerical support workers 72391 * * - 64700 * *Service and sales workers 343474 * * * 281654 * 46789Skilled workers in agriculture, forestry and
fishing 1170295 * 470159 41831 454728 49502 153312Craft and related trades workers 515718 9847 15030 * 410774 8725 70592Other categories of occupations 718871 10362 47851 * 544270 9209 104561
of which: Elementary occupations 348247 * 43233 * 234306 * 58524

Tables 157
(continued) - persons -
of which: employees
Actual duration of working week
Total 0 hours
1-35
hours
36-39
hours
40
hours
41-45
hours
46
hours
and
over
Gender
Urban/rural area
Groups of occupations
1761993 34483 25149 * 1482873 17484 200097 RURAL
26842 * * - 22671 * * Managers
180360 * 8383 * 157464 * 7048 Professionals
82581 * * - 74244 * * Technicians and associate professionals
71605 * * - 64106 * * Clerical support workers
322542 * * * 267668 * 42154 Service and sales workers
45110 * * * 30039 * 12595
Skilled workers in agriculture, forestry and
fishing
439738 8629 * * 368862 * 51179 Craft and related trades workers
593214 9611 6666 * 497819 * 72970 Other categories of occupations
230029 * * * 190830 * 29924 of which: Elementary occupations

158 Labour force in Romania: Employment and unemployment - 2015
Table 2.40. Employed persons whose hours actually worked during the working week were different from the person’s usual hours of work, by groups of age, gender, urban/rural area and reasons
- persons -
of which, in working age:
Groups of age Gender Urban/ rural area
Reasons for the difference between the actual and usual duration of the working week
Employed persons whose hours
actually worked during the working week were different from the person’s
usual hours of work Total
Total 15-64 years
15-24 years
25-34 years
35-44 years
45-54 years
55-64 years
TOTAL 610689 569080 50869 160171 161781 113209 83051Actual duration less than usual
duration 395532 367145 34451 113792 100857 63573 54470Annual holidays 46560 46214 * 12430 15410 10350 *Maternity or paternity leave 40680 40680 * 25797 9888 * *Parental leave (childcare leave of up
to 2 years) 32511 32511 * 23264 6719 * *Leave for own illness, injury or
temporary disability 12828 11007 * * * * *Slack work for technical or economical
reasons or labour dispute 8941 8941 * * * * *Variable hours 56090 49893 6859 9790 13965 9584 9695Days off, holidays 52555 49711 * 12398 15961 11499 7160Personal or family reason 7790 7046 * * * * *Bad weather 127585 111673 12219 20926 28879 24736 24912Other reasons 9993 9470 * * * * *
Actual duration more than usual duration 215156 201935 16418 46379 60923 49635 28580Variable hours 114282 102251 9940 22322 27920 23671 18398Overtime 93075 92303 * 23268 30242 24213 9096Other reasons 7800 7381 * * * * *
MEN 335372 315713 30266 77607 88262 71779 47799Actual duration less than usual
duration 196602 183585 18092 45470 50084 39406 30533Annual holidays 22824 22667 * 6830 * * *Maternity or paternity leave * * - * * * *Parental leave (childcare leave of up
to 2 years) * * - * * * *Leave for own illness, injury or
temporary disability 7430 6639 * * * * *Slack work for technical or economical
reasons or labour dispute 8159 8159 * * * * *Variable hours 35583 32722 * 7705 7959 6959 *Days off, holidays 30287 28868 * 7276 9106 * *Personal or family reason * * * * * * *Bad weather 78235 70722 7959 15265 18122 16012 13364Other reasons * * * * * * *
Actual duration more than usual duration 138770 132128 12174 32137 38178 32373 17267Variable hours 73859 67695 7543 16168 18790 15201 9992Overtime 59997 59654 * 15454 17448 15813 6798Other reasons * * * * * * *
WOMEN 275317 253367 20603 82564 73519 41430 35252
Actual duration less than usual duration 198930 183560 16359 68322 50774 24167 23938Annual holidays 23736 23547 * * 9004 * *Maternity or paternity leave 37285 37285 * 24679 7976 * *Parental leave (childcare leave of up
to 2 years) 29975 29975 * 21335 6511 * -Leave for own illness, injury or
temporary disability * * * * * * *Slack work for technical or economical
reasons or labour dispute * * - * * * *
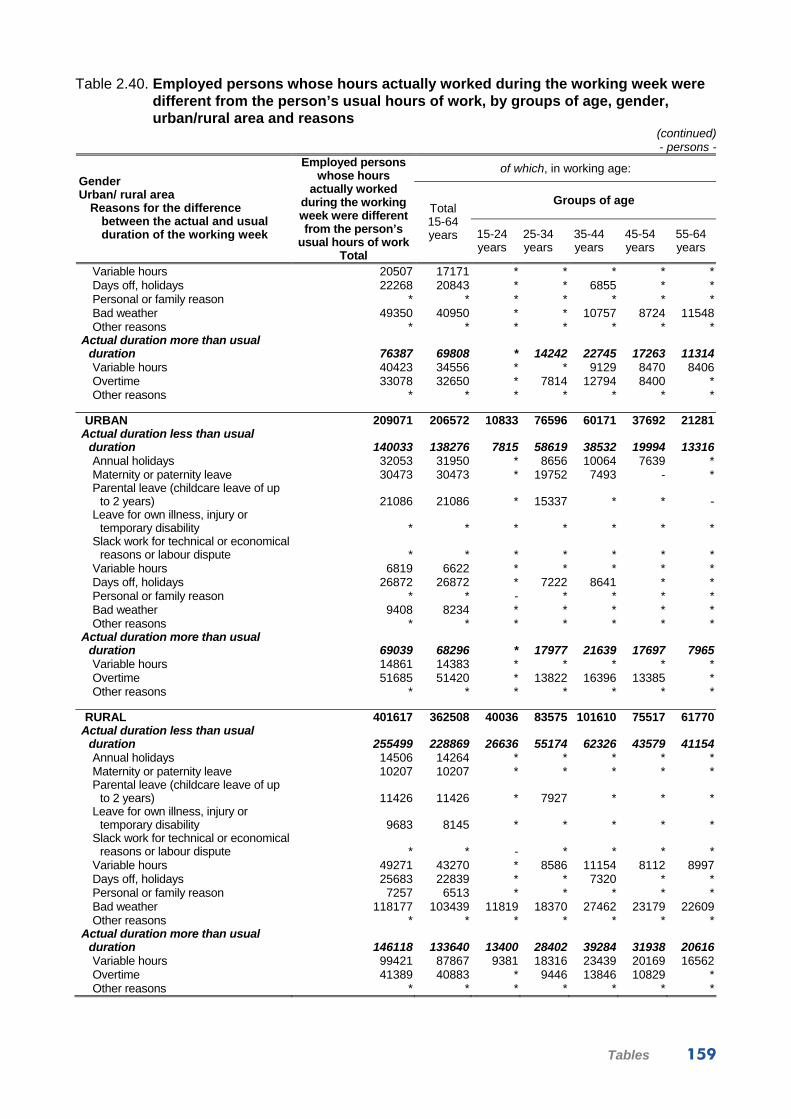
Tables 159
Table 2.40. Employed persons whose hours actually worked during the working week were different from the person’s usual hours of work, by groups of age, gender, urban/rural area and reasons
(continued) - persons -
of which, in working age:
Groups of age
Gender Urban/ rural area
Reasons for the difference between the actual and usual duration of the working week
Employed persons whose hours
actually worked during the working week were different from the person’s
usual hours of work Total
Total 15-64 years 15-24
years25-34 years
35-44 years
45-54 years
55-64 years
Variable hours 20507 17171 * * * * *Days off, holidays 22268 20843 * * 6855 * *Personal or family reason * * * * * * *Bad weather 49350 40950 * * 10757 8724 11548Other reasons * * * * * * *
Actual duration more than usual duration 76387 69808 * 14242 22745 17263 11314Variable hours 40423 34556 * * 9129 8470 8406Overtime 33078 32650 * 7814 12794 8400 *Other reasons * * * * * * *
URBAN 209071 206572 10833 76596 60171 37692 21281
Actual duration less than usual duration 140033 138276 7815 58619 38532 19994 13316Annual holidays 32053 31950 * 8656 10064 7639 *Maternity or paternity leave 30473 30473 * 19752 7493 - *Parental leave (childcare leave of up
to 2 years) 21086 21086 * 15337 * * -Leave for own illness, injury or
temporary disability * * * * * * *Slack work for technical or economical
reasons or labour dispute * * * * * * *Variable hours 6819 6622 * * * * *Days off, holidays 26872 26872 * 7222 8641 * *Personal or family reason * * - * * * *Bad weather 9408 8234 * * * * *Other reasons * * * * * * *
Actual duration more than usual duration 69039 68296 * 17977 21639 17697 7965Variable hours 14861 14383 * * * * *Overtime 51685 51420 * 13822 16396 13385 *Other reasons * * * * * * *
RURAL 401617 362508 40036 83575 101610 75517 61770
Actual duration less than usual duration 255499 228869 26636 55174 62326 43579 41154Annual holidays 14506 14264 * * * * *Maternity or paternity leave 10207 10207 * * * * *Parental leave (childcare leave of up
to 2 years) 11426 11426 * 7927 * * *Leave for own illness, injury or
temporary disability 9683 8145 * * * * *Slack work for technical or economical
reasons or labour dispute * * - * * * *Variable hours 49271 43270 * 8586 11154 8112 8997Days off, holidays 25683 22839 * * 7320 * *Personal or family reason 7257 6513 * * * * *Bad weather 118177 103439 11819 18370 27462 23179 22609Other reasons * * * * * * *
Actual duration more than usual duration 146118 133640 13400 28402 39284 31938 20616Variable hours 99421 87867 9381 18316 23439 20169 16562Overtime 41389 40883 * 9446 13846 10829 *Other reasons * * * * * * *
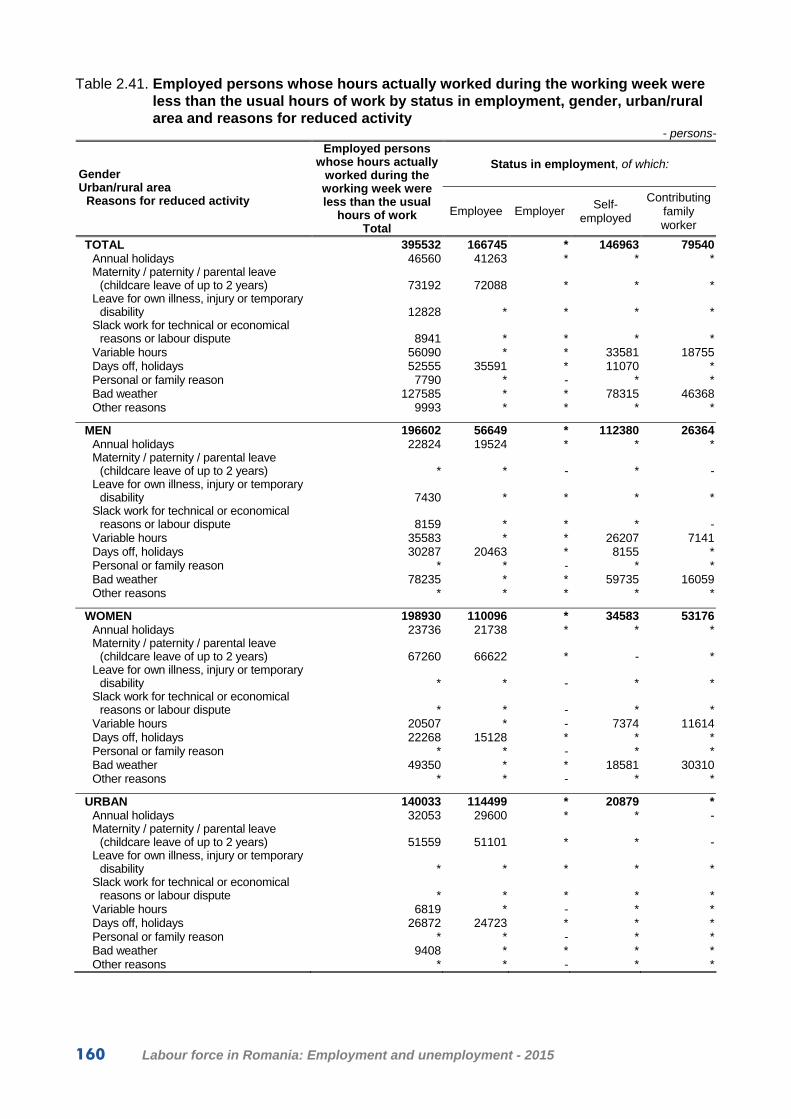
160 Labour force in Romania: Employment and unemployment - 2015
Table 2.41. Employed persons whose hours actually worked during the working week were less than the usual hours of work by status in employment, gender, urban/rural area and reasons for reduced activity
- persons-
Status in employment, of which: Gender Urban/rural area
Reasons for reduced activity
Employed persons whose hours actually
worked during the working week were less than the usual
hours of work Total
Employee Employer Self-
employed
Contributing family worker
TOTAL 395532 166745 * 146963 79540Annual holidays 46560 41263 * * *Maternity / paternity / parental leave
(childcare leave of up to 2 years) 73192 72088 * * *Leave for own illness, injury or temporary
disability 12828 * * * *Slack work for technical or economical
reasons or labour dispute 8941 * * * *Variable hours 56090 * * 33581 18755Days off, holidays 52555 35591 * 11070 *Personal or family reason 7790 * - * *Bad weather 127585 * * 78315 46368Other reasons 9993 * * * *
MEN 196602 56649 * 112380 26364Annual holidays 22824 19524 * * *Maternity / paternity / parental leave
(childcare leave of up to 2 years) * * - * -Leave for own illness, injury or temporary
disability 7430 * * * *Slack work for technical or economical
reasons or labour dispute 8159 * * * -Variable hours 35583 * * 26207 7141Days off, holidays 30287 20463 * 8155 *Personal or family reason * * - * *Bad weather 78235 * * 59735 16059Other reasons * * * * *
WOMEN 198930 110096 * 34583 53176Annual holidays 23736 21738 * * *Maternity / paternity / parental leave
(childcare leave of up to 2 years) 67260 66622 * - *Leave for own illness, injury or temporary
disability * * - * *Slack work for technical or economical
reasons or labour dispute * * - * *Variable hours 20507 * - 7374 11614Days off, holidays 22268 15128 * * *Personal or family reason * * - * *Bad weather 49350 * * 18581 30310Other reasons * * - * *
URBAN 140033 114499 * 20879 *Annual holidays 32053 29600 * * -Maternity / paternity / parental leave
(childcare leave of up to 2 years) 51559 51101 * * -Leave for own illness, injury or temporary
disability * * * * *Slack work for technical or economical
reasons or labour dispute * * * * *Variable hours 6819 * - * *Days off, holidays 26872 24723 * * *Personal or family reason * * - * *Bad weather 9408 * * * *Other reasons * * - * *
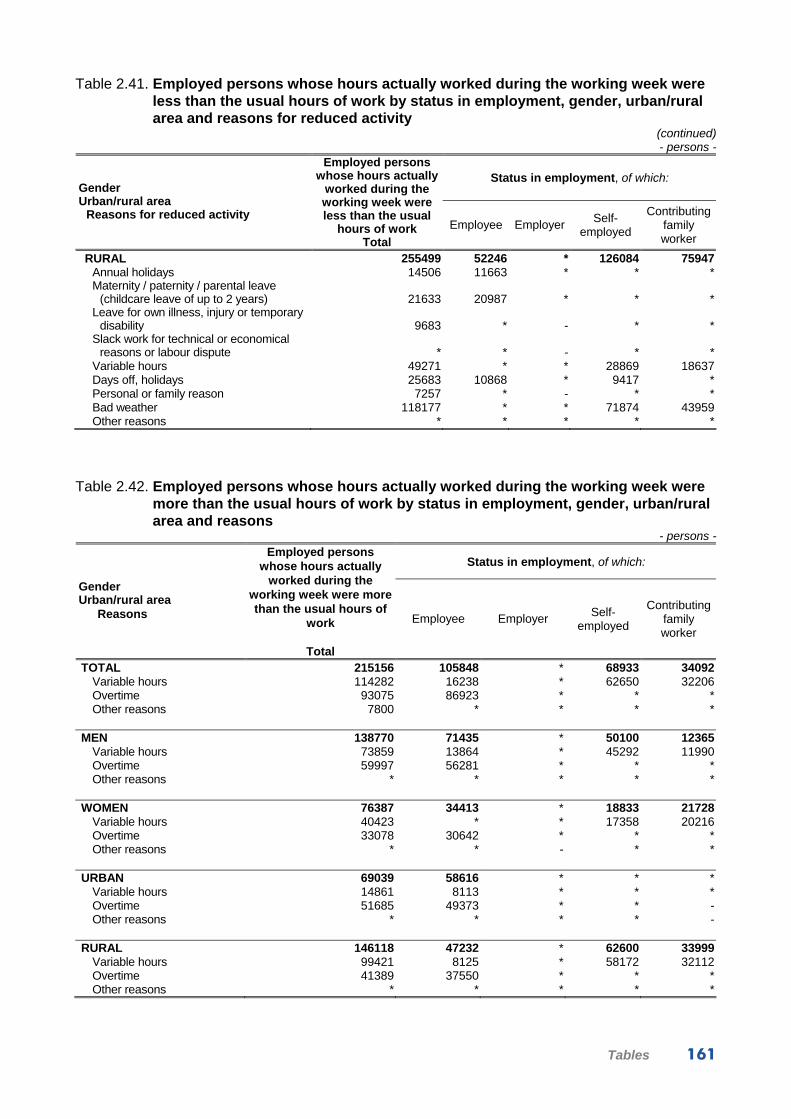
Tables 161
Table 2.41. Employed persons whose hours actually worked during the working week were less than the usual hours of work by status in employment, gender, urban/rural area and reasons for reduced activity
(continued) - persons -
Status in employment, of which: Gender Urban/rural area
Reasons for reduced activity
Employed persons whose hours actually
worked during the working week were less than the usual
hours of work Total
Employee Employer Self-
employed
Contributing family worker
RURAL 255499 52246 * 126084 75947Annual holidays 14506 11663 * * *Maternity / paternity / parental leave
(childcare leave of up to 2 years) 21633 20987 * * *Leave for own illness, injury or temporary
disability 9683 * - * *Slack work for technical or economical
reasons or labour dispute * * - * *Variable hours 49271 * * 28869 18637Days off, holidays 25683 10868 * 9417 *Personal or family reason 7257 * - * *Bad weather 118177 * * 71874 43959Other reasons * * * * *
Table 2.42. Employed persons whose hours actually worked during the working week were
more than the usual hours of work by status in employment, gender, urban/rural area and reasons
- persons -
Status in employment, of which:
Gender Urban/rural area
Reasons
Employed persons whose hours actually
worked during the working week were more than the usual hours of
work
Total
Employee Employer Self-employed
Contributing family worker
TOTAL 215156 105848 * 68933 34092Variable hours 114282 16238 * 62650 32206Overtime 93075 86923 * * *Other reasons 7800 * * * *
MEN 138770 71435 * 50100 12365
Variable hours 73859 13864 * 45292 11990Overtime 59997 56281 * * *Other reasons * * * * *
WOMEN 76387 34413 * 18833 21728
Variable hours 40423 * * 17358 20216Overtime 33078 30642 * * *Other reasons * * - * *
URBAN 69039 58616 * * *
Variable hours 14861 8113 * * *Overtime 51685 49373 * * -Other reasons * * * * -
RURAL 146118 47232 * 62600 33999
Variable hours 99421 8125 * 58172 32112Overtime 41389 37550 * * *Other reasons * * * * *

162 Labour force in Romania: Employment and unemployment - 2015
Table 2.43. Usual average duration of the working week for employment, by status in employment, gender, urban/rural area and activities of the national economy
- hours/week -
Usual average duration of the working week for: Status in employment, of which:
Employee of which:
by working programme
Gender Urban/rural area
Activities of the national economy
Employ-ment
TOTAL Total
full-time part-time
Employer Self-employed
Contributing family worker
TOTAL 39.8 40.6 40.7 23.4 42.3 37.0 33.2Agriculture, forestry and fishing 35.6 42.0 42.2 28.9 40.5 35.4 33.1Mining and quarrying 38.5 38.5 38.5 20.0 - 40.0 -Manufacturing 40.6 40.6 40.6 23.3 44.1 38.5 36.9Production and supply of electric and thermal
energy, gas, hot water and air conditioning 40.2 40.2 40.2 - 39.9 40.3 -Water distribution; sanitation, waste
administration, decontamination activities 40.4 40.5 40.6 20.0 40.0 38.1 39.2Constructions 41.5 41.4 41.4 24.9 42.6 41.8 41.1Wholesale and retail; repair of motors vehicles
and motorcycles 41.0 40.9 41.0 24.5 42.6 41.4 38.4Transport and storage 41.1 41.0 41.1 20.5 41.4 42.5 -Hotels and restaurants 41.4 41.4 41.6 23.4 42.8 41.1 -Information and communications 40.2 40.3 40.4 22.8 40.0 38.3 35.5Financial intermediation and insurance 40.3 40.3 40.5 21.0 40.0 27.8 -Real estate transactions 39.1 39.1 39.5 26.0 46.1 35.9 -Professional, scientific and technical activities 39.9 40.0 40.1 24.0 41.6 38.2 -Activities of administrative services and
activities of support services 40.6 40.6 40.8 23.5 40.0 40.1 40.1Public administration and defence; social
insurance of public system 40.2 40.2 40.3 26.5 - - -Education 39.0 39.0 39.1 22.1 40.8 39.8 -Health and social assistance 40.3 40.4 40.5 20.4 39.4 39.6 -Showbiz, cultural and recreation activities 39.8 40.1 40.5 20.0 40.1 37.2 25.1Other activities of the national economy 40.5 40.0 40.7 21.8 40.0 42.3 40.0
Sectors of activities
Agriculture 35.6 42.0 42.2 28.9 40.5 35.4 33.1Industry and constructions 40.7 40.7 40.7 23.4 43.3 41.2 38.2Services 40.5 40.5 40.6 22.9 42.1 40.9 37.1
MEN 40.2 40.8 40.8 24.5 42.6 38.2 34.7Agriculture, forestry and fishing 37.5 42.2 42.4 27.9 40.9 37.0 34.6Mining and quarrying 38.1 38.1 38.2 20.0 - 40.0 -Manufacturing 40.7 40.7 40.7 23.0 44.8 38.7 34.6Production and supply of electric and thermal
energy, gas, hot water and air conditioning 40.2 40.2 40.2 - 39.9 40.3 -Water distribution; sanitation, waste
administration, decontamination activities 40.7 40.7 40.7 - 40.0 38.1 40.3Constructions 41.6 41.5 41.6 25.7 42.8 41.8 41.4Wholesale and retail; repair of motors vehicles
and motorcycles 41.0 40.9 41.0 23.3 42.8 41.0 38.6Transport and storage 41.2 41.2 41.2 20.8 41.3 42.4 -Hotels and restaurants 41.7 41.6 41.8 22.0 43.2 40.3 -Information and communications 40.3 40.4 40.5 22.5 40.0 38.5 33.6Financial intermediation and insurance 40.2 40.3 40.4 22.4 39.9 31.7 -Real estate transactions 40.1 39.6 39.6 - 46.1 40.0 -Professional, scientific and technical activities 40.0 40.0 40.1 30.0 41.5 38.9 -Activities of administrative services and
activities of support services 40.9 40.9 40.9 27.4 40.0 40.0 40.1Public administration and defence; social
insurance of public system 40.3 40.3 40.3 31.0 - - -Education 38.9 38.9 38.9 20.0 40.0 41.1 -Health and social assistance 40.5 40.5 40.5 23.2 40.0 39.9 -Showbiz, cultural and recreation activities 39.4 39.7 40.1 20.0 40.1 36.9 -Other activities of the national economy 39.5 39.7 40.1 23.0 40.0 38.7 39.8
Sectors of activities
Agriculture 37.5 42.2 42.4 27.9 40.9 37.0 34.6Industry and constructions 40.9 40.8 40.8 24.3 43.7 41.3 38.1Services 40.7 40.7 40.7 23.9 42.3 40.4 36.3

Tables 163
Table 2.43. Usual average duration of the working week for employment, by status in employment, gender, urban/rural area and activities of the national economy
(continued) - hours/week -
Usual average duration of the working week for: Status in employment, of which:
Employee of which:
by working programme
Gender Urban/rural area
Activities of the national economy
Employ-ment
TOTAL Total
full-time part-time
Employer Self-employed
Contributing family worker
WOMEN 39.2 40.4 40.5 22.8 41.5 34.3 32.6Agriculture, forestry and fishing 32.9 41.4 41.6 31.0 39.8 31.9 32.5Mining and quarrying 40.5 40.5 40.5 - - - -Manufacturing 40.5 40.5 40.5 23.6 41.2 37.6 39.1Production and supply of electric and thermal
energy, gas, hot water and air conditioning 40.1 40.1 40.1 - - - -Water distribution; sanitation, waste
administration, decontamination activities 39.6 39.6 40.1 20.0 39.8 - 35.1Constructions 40.2 40.2 40.3 20.0 40.0 39.7 40.1Wholesale and retail; repair of motors vehicles
and motorcycles 40.9 40.9 41.0 25.1 42.1 42.2 38.4Transport and storage 40.3 40.2 40.4 20.0 44.0 45.2 -Hotels and restaurants 41.2 41.2 41.5 23.8 41.7 42.7 -Information and communications 40.1 40.2 40.3 23.0 40.0 37.6 36.9Financial intermediation and insurance 40.3 40.4 40.5 20.0 40.5 22.3 -Real estate transactions 37.8 38.5 39.4 26.0 - 27.0 -Professional, scientific and technical activities 39.9 40.0 40.2 20.0 42.0 37.5 -Activities of administrative services and
activities of support services 40.0 40.0 40.4 21.1 39.8 40.1 -Public administration and defence; social
insurance of public system 40.2 40.2 40.2 20.0 - - -Education 39.0 39.0 39.2 22.4 41.9 38.1 -Health and social assistance 40.3 40.3 40.4 20.2 38.7 39.6 -Showbiz, cultural and recreation activities 40.3 40.5 40.7 20.0 - 37.8 25.1Other activities of the national economy 40.9 40.1 41.0 21.4 40.0 43.1 40.2
Sectors of activities
Agriculture 32.9 41.4 41.6 31.0 39.8 31.9 32.5Industry and constructions 40.4 40.4 40.5 22.4 40.8 37.8 38.3Services 40.4 40.3 40.5 22.4 41.6 41.4 37.6
URBAN 40.6 40.6 40.6 22.9 42.3 41.3 35.9Agriculture, forestry and fishing 40.0 41.9 41.9 27.7 41.8 40.2 35.2Mining and quarrying 37.3 37.3 37.3 - - - -Manufacturing 40.7 40.6 40.7 23.5 43.8 40.2 40.0Production and supply of electric and thermal
energy, gas, hot water and air conditioning 40.2 40.2 40.2 - 39.9 - -Water distribution; sanitation, waste
administration, decontamination activities 40.5 40.5 40.7 20.0 40.0 40.5 39.2Constructions 41.6 41.3 41.4 24.8 41.6 43.3 39.9Wholesale and retail; repair of motors vehicles
and motorcycles 41.0 40.9 41.0 24.3 42.6 41.5 41.2Transport and storage 41.2 41.1 41.2 20.0 41.5 45.3 -Hotels and restaurants 41.3 41.3 41.5 21.7 43.2 41.3 -Information and communications 40.4 40.4 40.5 22.3 40.0 42.2 -Financial intermediation and insurance 40.4 40.4 40.5 21.2 39.9 28.6 -Real estate transactions 39.0 39.0 39.5 26.7 46.5 35.8 -Professional, scientific and technical activities 39.9 40.0 40.1 24.6 41.8 38.0 -Activities of administrative services and
activities of support services 40.6 40.6 40.8 21.9 40.0 40.1 -Public administration and defence; social
insurance of public system 40.2 40.2 40.3 24.5 - - -Education 39.1 39.0 39.1 23.1 40.0 40.9 -Health and social assistance 40.4 40.4 40.4 20.1 39.3 40.0 -Showbiz, cultural and recreation activities 40.1 40.3 40.5 20.0 40.1 37.2 -Other activities of the national economy 40.5 40.0 40.4 22.0 40.0 42.6 40.2
Sectors of activities
Agriculture 40.0 41.9 41.9 27.7 41.8 40.2 35.2Industry and constructions 40.7 40.6 40.7 23.4 42.7 42.8 39.5Services 40.5 40.5 40.6 22.8 42.2 41.1 41.1

164 Labour force in Romania: Employment and unemployment - 2015
Table 2.43. Usual average duration of the working week for employment, by status in employment, gender, urban/rural area and activities of the national economy
(continued) - hours/week -
Usual average duration of the working week for: Status in employment, of which:
Employee of which:
by working programme
Gender Urban/rural area
Activities of the national economy
Employ-ment
TOTAL Total
full-time part-time
Employer Self-employed
Contributing family worker
RURAL 38.5 40.7 40.8 24.1 42.3 35.8 33.1Agriculture, forestry and fishing 35.0 42.1 42.4 29.0 40.3 34.9 33.0Mining and quarrying 40.3 40.3 40.4 20.0 - 40.0 -Manufacturing 40.5 40.6 40.6 23.2 44.9 37.4 35.4Production and supply of electric and thermal
energy, gas, hot water and air conditioning 40.1 40.1 40.1 - - 40.3 -Water distribution; sanitation, waste
administration, decontamination activities 40.2 40.4 40.4 - - 25.0 -Constructions 41.3 41.5 41.6 24.9 44.7 40.6 41.8Wholesale and retail; repair of motors vehicles
and motorcycles 40.9 40.8 41.0 24.8 42.5 41.4 36.6Transport and storage 40.8 40.9 40.9 23.1 41.3 38.0 -Hotels and restaurants 41.7 41.7 41.9 27.3 39.1 40.7 -Information and communications 38.6 39.6 39.9 23.6 40.0 35.2 35.5Financial intermediation and insurance 39.5 39.7 40.0 20.0 40.5 25.6 -Real estate transactions 39.4 39.4 40.0 20.1 40.2 39.8 -Professional, scientific and technical activities 40.2 40.2 40.4 20.1 40.0 40.4 -Activities of administrative services and
activities of support services 40.7 40.7 40.7 28.2 40.0 40.0 40.1Public administration and defence; social
insurance of public system 40.3 40.3 40.3 31.7 - - -Education 38.9 38.9 39.0 20.7 41.2 36.8 -Health and social assistance 40.3 40.3 40.6 20.7 40.0 37.5 -Showbiz, cultural and recreation activities 38.8 39.1 40.4 20.0 - 37.2 25.1Other activities of the national economy 40.6 39.9 41.6 21.6 40.0 41.9 39.8
Sectors of activities
Agriculture 35.0 42.1 42.4 29.0 40.3 34.9 33.0Industry and constructions 40.7 40.8 40.8 23.3 44.8 40.1 36.4Services 40.4 40.4 40.6 23.0 41.9 40.5 35.9

Tables 165
Table 2.44. Usual average duration of the working week for employment, by status in employment, gender, urban/rural area and groups of occupations
- hours/week -
Usual average duration of the working week for: Status in employment, of which:
Employee of which:
by working programme
Gender Urban/rural area
Groups of occupations
Employ-ment
Total Total
full-time part-time
Employer Self-employed
Contributing family worker
TOTAL 39.8 40.6 40.7 23.4 42.3 37.0 33.2Managers 41.3 40.9 41.0 21.9 42.4 42.5 -Professionals 39.9 39.9 40.0 22.0 40.9 38.8 25.1Technicians and associate
professionals 40.3 40.4 40.5 22.0 41.9 36.0 -Clerical support workers 40.4 40.4 40.5 25.1 33.2 43.1 -Service and sales workers 41.0 41.0 41.1 25.6 42.8 42.0 38.8Skilled workers in agriculture,
forestry and fishing 35.4 43.2 43.3 31.1 27.2 35.9 33.5Craft and related trades workers 41.0 41.0 41.0 23.4 42.0 41.4 34.0Other categories of occupations 40.0 40.6 40.8 22.7 40.0 35.9 29.2
of which: Elementary occupations 38.9 40.5 40.9 22.6 40.1 34.9 29.1
MEN 40.2 40.8 40.8 24.5 42.6 38.2 34.7Managers 41.5 41.0 41.0 24.2 42.6 42.8 -Professionals 40.1 40.1 40.1 23.3 41.5 39.6 -Technicians and associate
professionals 40.4 40.4 40.6 23.3 42.5 36.4 -Clerical support workers 40.6 40.6 40.6 26.4 40.0 41.3 -Service and sales workers 41.0 40.9 40.9 26.4 43.3 41.6 40.0Skilled workers in agriculture,
forestry and fishing 37.2 43.8 43.8 - 29.3 37.2 34.8Craft and related trades workers 41.1 41.0 41.1 23.9 41.5 41.4 31.2Other categories of occupations 40.5 40.8 40.9 24.6 40.0 37.4 34.6
of which: Elementary occupations 39.9 41.1 41.2 26.5 40.1 36.0 34.6
WOMEN 39.2 40.4 40.5 22.8 41.5 34.3 32.6Managers 41.0 40.7 40.9 20.0 42.1 41.4 -Professionals 39.7 39.7 39.8 21.7 39.6 38.0 25.1Technicians and associate
professionals 40.3 40.3 40.4 20.0 41.7 35.2 -Clerical support workers 40.3 40.3 40.4 23.6 25.0 46.6 -Service and sales workers 41.1 41.0 41.1 25.3 41.6 42.3 38.4Skilled workers in agriculture,
forestry and fishing 33.2 41.6 41.9 31.1 20.1 33.0 33.0Craft and related trades workers 40.7 40.7 40.7 20.7 49.8 39.4 37.1Other categories of occupations 38.8 40.0 40.4 21.9 - 33.4 26.2
of which: Elementary occupations 37.8 39.8 40.5 21.5 - 33.3 26.0

166 Labour force in Romania: Employment and unemployment - 2015
Table 2.44. Usual average duration of the working week for employment, by status in employment, gender, urban/rural area and groups of occupations
(continued) - hours/week -
Usual average duration of the working week for: Status in employment, of which:
Employee of which:
by working programme
Gender Urban/rural area
Groups of occupations
Employ-ment
Total Total
full-time part-time
Employer Self-employed
Contributing family worker
URBAN 40.6 40.6 40.6 22.9 42.3 41.3 35.9Managers 41.4 40.9 41.1 20.0 42.5 43.7 -Professionals 39.9 40.0 40.0 22.6 40.8 38.9 -Technicians and associate
professionals 40.3 40.4 40.5 21.7 41.9 35.5 -Clerical support workers 40.4 40.4 40.5 24.7 40.0 44.5 -Service and sales workers 41.1 41.0 41.1 26.0 42.3 42.1 42.5Skilled workers in agriculture,
forestry and fishing 39.1 41.9 42.0 34.8 48.1 40.3 35.0Craft and related trades workers 41.1 41.0 41.0 23.7 42.1 42.7 40.0Other categories of occupations 40.6 40.5 40.7 21.1 39.9 42.8 39.9
of which: Elementary occupations 40.4 40.3 40.7 20.7 40.1 41.4 39.9
RURAL 38.5 40.7 40.8 24.1 42.3 35.8 33.1Managers 41.2 40.6 40.8 25.5 42.2 40.0 -Professionals 39.6 39.6 39.7 20.8 41.1 38.4 25.1Technicians and associate
professionals 40.1 40.2 40.3 22.6 - 38.6 -Clerical support workers 40.3 40.4 40.4 26.9 3.0 40.7 -Service and sales workers 40.9 40.9 41.0 25.0 44.7 41.5 36.5Skilled workers in agriculture,
forestry and fishing 35.0 43.6 43.7 30.0 20.4 35.5 33.4Craft and related trades workers 40.8 40.9 40.9 23.2 41.8 40.4 32.8Other categories of occupations 39.3 40.7 40.9 24.1 39.9 34.0 28.1
of which: Elementary occupations 37.8 40.7 41.1 24.6 - 33.6 28.0

Tables 167
Table 2.45. Actual average duration of the working week for employment, by status in employment, gender, urban/rural area and activities of the national economy
- hours/week -
Actual average duration of the working week for: Status in employment, of which:
Employee of which:
by working programme
Gender Urban/rural area
Activities of the national economy
Employ-ment
Total Total
full-time part-time
Employer Self-
employed Contributing family worker
TOTAL 38.5 40.7 40.8 24.9 43.0 34.2 30.3Agriculture, forestry and fishing 32.7 42.3 42.6 30.6 41.5 33.0 30.2Mining and quarrying 38.7 38.6 38.7 20.0 55.5 36.0 -Manufacturing 40.6 40.7 40.8 25.3 44.3 34.9 33.3Production and supply of electric and
thermal energy, gas, hot water and air conditioning 40.2 40.2 40.2 - 39.9 40.3 -
Water distribution; sanitation, waste administration, decontamination activities 40.2 40.4 40.6 18.9 35.5 35.0 39.2
Constructions 40.8 41.5 41.6 30.1 42.4 38.7 33.7Wholesale and retail; repair of motors
vehicles and motorcycles 40.9 40.9 41.1 24.5 43.5 39.0 33.6Transport and storage 41.3 41.3 41.4 23.9 42.2 40.4 -Hotels and restaurants 41.6 41.5 41.8 25.5 45.1 40.7 -Information and communications 39.8 40.2 40.4 19.4 40.0 35.5 32.5Financial intermediation and insurance 40.1 40.2 40.4 20.7 40.0 26.5 -Real estate transactions 38.6 39.1 39.6 26.6 45.7 33.7 20.0Professional, scientific and technical
activities 39.6 39.8 40.0 23.3 41.3 36.9 -Activities of administrative services and
activities of support services 40.7 40.7 40.9 25.9 42.9 35.6 40.1Public administration and defence; social
insurance of public system 40.2 40.2 40.3 25.0 - - -Education 38.8 38.8 38.9 23.0 40.8 39.0 -Health and social assistance 40.4 40.5 40.6 21.7 39.8 39.9 -Showbiz, cultural and recreation activities 39.2 39.8 40.3 22.7 40.1 35.4 28.4Other activities of the national economy 39.2 39.8 40.7 22.2 41.0 37.9 24.4
Sectors of activities
Agriculture 32.7 42.3 42.6 30.6 41.5 33.0 30.2Industry and constructions 40.6 40.8 40.8 27.1 43.3 38.1 35.3Services 40.4 40.5 40.7 23.6 43.0 38.2 32.5
MEN 39.1 40.9 41.0 26.8 43.4 35.2 31.5Agriculture, forestry and fishing 34.7 42.4 42.7 30.7 43.2 34.4 31.4Mining and quarrying 38.3 38.2 38.3 20.0 55.5 40.0 -Manufacturing 40.7 40.8 40.8 24.7 44.7 35.8 27.7Production and supply of electric and
thermal energy, gas, hot water and air conditioning 40.2 40.2 40.2 - 39.9 40.3 -
Water distribution; sanitation, waste administration, decontamination activities 40.4 40.6 40.7 16.6 34.4 35.0 40.3
Constructions 40.9 41.6 41.7 30.8 42.6 38.7 33.2

168 Labour force in Romania: Employment and unemployment - 2015
Table 2.45. Actual average duration of the working week for employment, by status in employment, gender, urban/rural area and activities of the national economy
(continued) - hours/week -
Actual average duration of the working week for: Status in employment, of which:
Employee of which:
by working programme
Gender Urban/rural area
Activities of the national economy
Employ-ment
Total Total
full-time part-time
Employer Self-
employed Contributing family worker
Wholesale and retail; repair of motors vehicles and motorcycles 41.0 41.0 41.1 25.2 44.0 38.4 32.8
Transport and storage 41.5 41.5 41.6 25.7 42.1 40.3 -Hotels and restaurants 41.9 41.6 41.8 22.3 45.5 40.2 -Information and communications 39.9 40.2 40.4 18.3 40.0 36.5 33.3Financial intermediation and insurance 40.2 40.4 40.5 22.4 39.9 27.9 -Real estate transactions 39.2 39.6 39.7 30.0 45.7 36.2 20.0Professional, scientific and technical
activities 39.6 39.8 40.0 26.1 41.0 37.4 -Activities of administrative services and
activities of support services 41.0 41.0 41.1 30.4 43.1 33.0 40.1Public administration and defence; social
insurance of public system 40.3 40.3 40.4 28.1 - - -Education 38.7 38.6 38.7 19.7 40.0 42.2 -Health and social assistance 40.6 40.6 40.6 27.7 39.5 40.4 -Showbiz, cultural and recreation activities 38.4 39.1 39.9 22.6 40.1 34.9 30.1Other activities of the national economy 37.3 39.7 40.2 26.1 39.6 30.5 39.8
Sectors of activities
Agriculture 34.7 42.4 42.7 30.7 43.2 34.4 31.4Industry and constructions 40.7 40.9 41.0 28.6 43.6 38.3 34.0Services 40.6 40.7 40.8 25.2 43.3 37.1 32.1
WOMEN 37.6 40.4 40.5 23.2 41.8 31.5 29.7Agriculture, forestry and fishing 30.2 41.6 42.1 30.5 38.5 29.8 29.6Mining and quarrying 40.5 40.6 40.6 - - 30.1 -Manufacturing 40.5 40.6 40.6 25.7 42.7 31.1 39.1Production and supply of electric and
thermal energy, gas, hot water and air conditioning 40.1 40.1 40.1 - - - -
Water distribution; sanitation, waste administration, decontamination activities 39.6 39.7 40.2 20.0 39.8 - 35.1
Constructions 40.0 40.1 40.2 20.0 40.0 37.5 40.1Wholesale and retail; repair of motors
vehicles and motorcycles 40.9 40.9 41.0 23.9 42.2 40.1 34.1Transport and storage 40.1 40.1 40.3 20.0 44.0 43.6 -Hotels and restaurants 41.5 41.4 41.7 26.6 43.6 41.5 -Information and communications 39.6 40.2 40.3 21.3 40.0 30.9 32.2Financial intermediation and insurance 40.0 40.1 40.3 20.0 40.5 25.2 -Real estate transactions 37.7 38.4 39.4 26.0 - 27.0 -Professional, scientific and technical
activities 39.6 39.9 40.1 20.4 42.0 36.4 -Activities of administrative services and
activities of support services 39.8 39.9 40.4 21.6 39.8 36.9 -

Tables 169
Table 2.45. Actual average duration of the working week for employment, by status in employment, gender, urban/rural area and activities of the national economy
(continued) - hours/week -
Actual average duration of the working week for: Status in employment, of which:
Employee of which:
by working programme
Gender Urban/rural area
Activities of the national economy
Employ-ment
Total Total
full-time part-time
Employer Self-
employed Contributing family worker
Public administration and defence; social insurance of public system 40.0 40.0 40.1 20.5 - - -
Education 38.9 38.9 39.0 23.6 41.9 33.9 -Health and social assistance 40.4 40.4 40.5 20.9 40.3 39.8 -Showbiz, cultural and recreation activities 40.2 40.4 40.8 23.0 - 37.0 22.7Other activities of the national economy 40.2 39.8 41.0 21.1 41.5 41.1 21.0
Sectors of activities
Agriculture 30.2 41.6 42.1 30.5 38.5 29.8 29.6Industry and constructions 40.4 40.5 40.6 24.1 41.9 31.6 38.3Services 40.2 40.3 40.5 22.5 42.1 39.6 32.7
URBAN 40.4 40.6 40.7 24.3 42.9 38.1 30.3Agriculture, forestry and fishing 36.3 42.0 42.2 33.6 41.2 35.4 29.5Mining and quarrying 37.4 37.3 37.3 - 55.5 - -Manufacturing 40.7 40.7 40.7 24.8 44.2 36.4 40.0Production and supply of electric and
thermal energy, gas, hot water and air conditioning 40.2 40.2 40.2 - 39.9 - -
Water distribution; sanitation, waste administration, decontamination activities 40.3 40.4 40.7 20.0 40.0 37.7 39.2
Constructions 41.2 41.5 41.5 29.4 41.1 39.9 37.2Wholesale and retail; repair of motors
vehicles and motorcycles 40.9 40.9 41.1 24.6 43.5 39.0 34.7Transport and storage 41.4 41.3 41.4 22.8 41.4 44.0 -Hotels and restaurants 41.5 41.4 41.6 24.9 45.3 40.8 -Information and communications 40.2 40.2 40.4 18.4 40.0 38.3 -Financial intermediation and insurance 40.2 40.3 40.4 20.9 39.9 25.8 -Real estate transactions 38.5 39.1 39.5 26.7 45.4 33.6 20.0Professional, scientific and technical
activities 39.6 39.8 39.9 22.9 41.8 37.0 -Activities of administrative services and
activities of support services 40.7 40.7 40.9 24.6 40.0 39.3 -Public administration and defence; social
insurance of public system 40.2 40.2 40.2 25.1 - - -Education 38.9 38.9 38.9 24.5 40.0 38.3 -Health and social assistance 40.4 40.5 40.5 21.5 39.8 40.2 -Showbiz, cultural and recreation activities 39.7 40.0 40.4 24.3 40.1 35.8 -Other activities of the national economy 39.9 39.9 40.5 21.7 41.1 40.0 21.0
Sectors of activities
Agriculture 36.3 42.0 42.2 33.6 41.2 35.4 29.5Industry and constructions 40.7 40.7 40.8 26.3 42.9 39.4 39.3Services 40.5 40.5 40.6 23.4 42.9 39.3 32.5

170 Labour force in Romania: Employment and unemployment - 2015
Table 2.45. Actual average duration of the working week for employment, by status in employment, gender, urban/rural area and activities of the national economy
(continued) - hours/week -
Actual average duration of the working week for: Status in employment, of which:
Employee of which:
by working programme
Gender Urban/rural area
Activities of the national economy
Employ-ment
Total Total
full-time part-time
Employer Self-
employed Contributing family worker
RURAL 36.2 40.8 41.0 25.6 43.3 33.4 30.2Agriculture, forestry and fishing 32.4 42.4 42.7 29.6 41.6 32.8 30.2Mining and quarrying 40.5 40.6 40.7 20.0 - 36.0 -Manufacturing 40.5 40.7 40.8 25.7 44.6 33.8 30.2Production and supply of electric and
thermal energy, gas, hot water and air conditioning 40.0 40.0 40.0 - - 40.3 -
Water distribution; sanitation, waste administration, decontamination activities 39.9 40.2 40.4 14.0 19.9 23.2 -
Constructions 40.4 41.6 41.7 30.6 45.3 37.9 33.0Wholesale and retail; repair of motors
vehicles and motorcycles 40.8 40.9 41.1 24.3 43.5 39.0 32.5Transport and storage 41.1 41.4 41.4 26.8 43.6 35.1 -Hotels and restaurants 42.0 42.0 42.3 26.8 43.0 40.6 -Information and communications 37.2 39.9 40.2 23.6 40.0 32.8 32.5Financial intermediation and insurance 39.3 39.5 39.8 20.0 40.5 29.1 -Real estate transactions 39.5 39.0 40.0 26.5 47.6 39.8 -Professional, scientific and technical
activities 39.7 40.2 40.6 24.2 38.0 35.9 -Activities of administrative services and
activities of support services 40.6 40.8 41.0 27.9 56.6 30.3 40.1Public administration and defence; social
insurance of public system 40.3 40.3 40.4 24.9 - - -Education 38.8 38.7 38.9 20.7 41.2 40.3 -Health and social assistance 40.4 40.5 40.8 21.8 40.0 38.5 -Showbiz, cultural and recreation activities 37.7 38.6 40.2 21.0 - 34.2 28.4Other activities of the national economy 37.9 39.5 41.4 22.7 40.0 36.0 39.8
Sectors of activities
Agriculture 32.4 42.4 42.7 29.6 41.6 32.8 30.2Industry and constructions 40.4 40.9 41.0 27.8 44.4 37.3 31.3Services 40.3 40.6 40.8 23.8 43.2 36.5 32.5

Tables 171
Table 2.46. Actual average duration of the working week for employment, by status in employment, gender, urban/rural area and groups of occupation
- hours/week -
Actual average duration of the working week for:
Status in employment, of which:
Employee of which:
by working programme
Gender Urban/rural area
Groups of occupations
Employment
Total Total full-time part-time
Employer Self-
employed Contributing family worker
TOTAL 38.5 40.7 40.8 24.9 43.0 34.2 30.3Managers 41.8 41.1 41.2 23.5 43.5 39.8 -Professionals 39.8 39.8 39.9 22.7 41.4 37.7 22.7Technicians and associate
professionals 40.3 40.4 40.5 22.7 39.4 34.2 30.1Clerical support workers 40.4 40.4 40.5 24.0 40.0 41.2 -Service and sales workers 41.0 41.0 41.1 25.3 43.2 40.4 33.4Skilled workers in agriculture,
forestry and fishing 32.6 43.3 43.6 33.0 29.3 33.6 30.5Craft and related trades workers 40.7 41.1 41.1 25.5 39.5 38.5 30.8Other categories of occupations 38.9 40.7 40.9 25.1 49.9 32.1 27.8
of which: Elementary occupations 36.5 40.4 41.0 24.8 40.1 31.2 27.8
MEN 39.1 40.9 41.0 26.8 43.4 35.2 31.5Managers 42.1 41.2 41.3 27.0 43.8 39.4 -Professionals 40.1 40.1 40.2 22.8 41.9 38.1 -Technicians and associate
professionals 40.3 40.5 40.6 24.1 35.8 34.3 30.1Clerical support workers 40.7 40.7 40.7 26.4 40.0 41.9 -Service and sales workers 40.9 40.9 41.0 25.9 43.8 39.8 32.7Skilled workers in agriculture,
forestry and fishing 34.4 44.0 44.1 37.7 30.8 34.8 31.5Craft and related trades workers 40.8 41.1 41.2 26.0 38.9 38.6 28.1Other categories of occupations 39.6 41.0 41.1 28.3 49.9 33.2 31.3
of which: Elementary occupations 37.3 41.0 41.3 29.1 40.1 32.2 31.3
WOMEN 37.6 40.4 40.5 23.2 41.8 31.5 29.7Managers 41.1 40.8 41.1 20.0 42.2 41.3 -Professionals 39.6 39.7 39.7 22.6 40.1 37.3 22.7Technicians and associate
professionals 40.2 40.3 40.4 20.7 41.7 34.1 -Clerical support workers 40.2 40.2 40.3 22.3 40.0 40.0 -Service and sales workers 41.0 41.1 41.2 25.0 42.0 40.9 33.7Skilled workers in agriculture,
forestry and fishing 30.5 41.4 42.2 30.6 20.1 30.8 30.0Craft and related trades workers 40.7 40.8 40.8 20.6 49.8 34.4 37.1Other categories of occupations 37.3 40.1 40.5 22.4 - 29.6 25.8
of which: Elementary occupations 35.4 39.7 40.5 22.0 - 29.5 25.7

172 Labour force in Romania: Employment and unemployment - 2015
Table 2.46. Actual average duration of the working week for employment, by status in employment, gender, urban/rural area and groups of occupation
(continued) - hours/week -
Actual average duration of the working week for:
Status in employment, of which:
Employee of which:
by working programme
Gender Urban/rural area
Groups of occupations
Employment
Total Total full-time part-time
Employer Self-
employed Contributing family worker
URBAN 40.4 40.6 40.7 24.3 42.9 38.1 30.3Managers 41.8 41.1 41.2 20.0 43.5 39.6 -Professionals 39.9 39.9 40.0 22.7 40.7 38.1 -Technicians and associate
professionals 40.3 40.4 40.5 22.4 41.9 33.6 -Clerical support workers 40.4 40.4 40.5 23.8 40.0 41.6 -Service and sales workers 41.0 41.0 41.1 25.9 42.8 40.5 32.3Skilled workers in agriculture,
forestry and fishing 35.0 42.0 42.7 30.5 48.1 36.4 29.6Craft and related trades workers 41.0 41.1 41.1 25.3 40.7 39.4 40.0Other categories of occupations 40.4 40.6 40.8 24.2 34.8 37.2 32.8
of which: Elementary occupations 39.4 40.2 40.7 23.3 40.1 34.9 32.8
RURAL 36.2 40.8 41.0 25.6 43.3 33.4 30.2Managers 41.9 41.0 41.2 28.6 43.4 40.0 -Professionals 39.5 39.6 39.7 22.6 43.4 34.8 22.7Technicians and associate
professionals 40.2 40.3 40.5 23.5 15.0 37.0 30.1Clerical support workers 40.4 40.3 40.4 24.6 40.3 40.6 -Service and sales workers 41.0 41.0 41.2 24.3 44.7 40.0 34.3Skilled workers in agriculture,
forestry and fishing 32.5 43.7 43.8 35.4 26.0 33.4 30.5Craft and related trades workers 40.4 41.0 41.1 25.6 38.0 37.9 28.9Other categories of occupations 37.4 40.9 41.1 25.8 64.3 30.9 27.4
of which: Elementary occupations 34.8 40.6 41.2 26.2 - 30.6 27.3
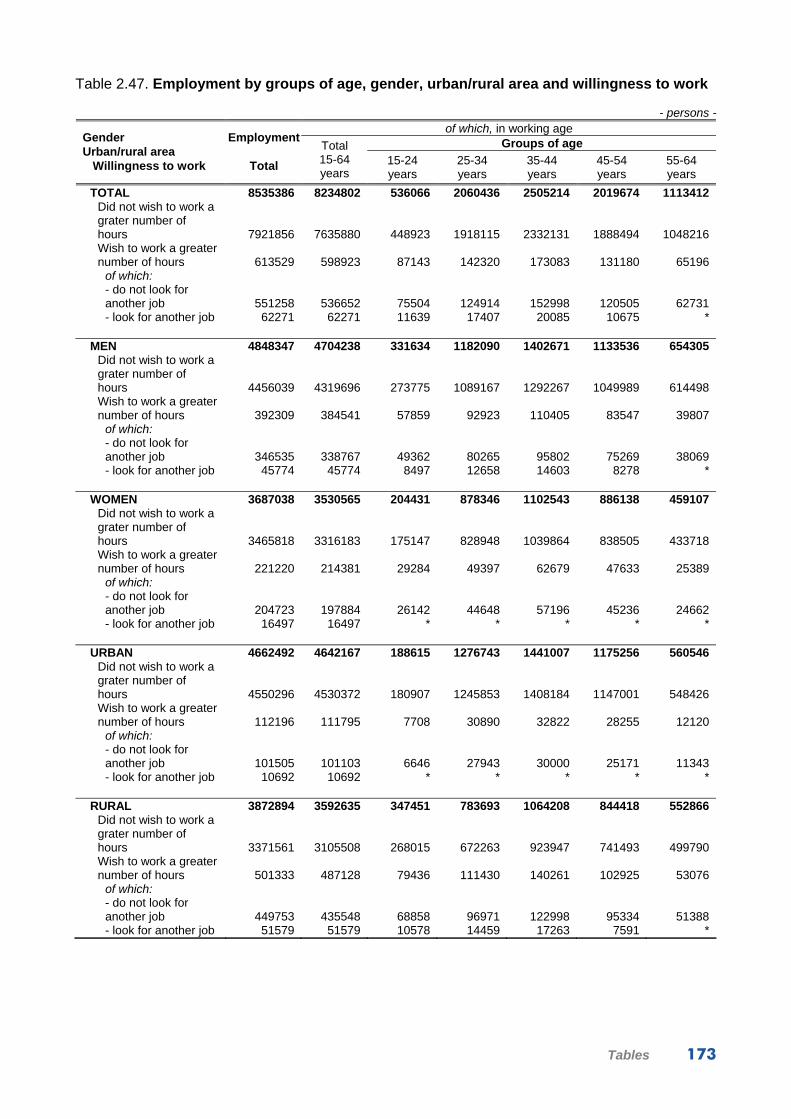
Tables 173
Table 2.47. Employment by groups of age, gender, urban/rural area and willingness to work
- persons - of which, in working age
Groups of age Gender Urban/rural area Willingness to work
Employment
Total
Total 15-64 years
15-24 years
25-34 years
35-44 years
45-54 years
55-64 years
TOTAL 8535386 8234802 536066 2060436 2505214 2019674 1113412 Did not wish to work a grater number of hours 7921856 7635880 448923 1918115 2332131 1888494 1048216 Wish to work a greater number of hours 613529 598923 87143 142320 173083 131180 65196
of which: - do not look for another job 551258 536652 75504 124914 152998 120505 62731 - look for another job 62271 62271 11639 17407 20085 10675 *
MEN 4848347 4704238 331634 1182090 1402671 1133536 654305
Did not wish to work a grater number of hours 4456039 4319696 273775 1089167 1292267 1049989 614498 Wish to work a greater number of hours 392309 384541 57859 92923 110405 83547 39807
of which: - do not look for another job 346535 338767 49362 80265 95802 75269 38069 - look for another job 45774 45774 8497 12658 14603 8278 *
WOMEN 3687038 3530565 204431 878346 1102543 886138 459107
Did not wish to work a grater number of hours 3465818 3316183 175147 828948 1039864 838505 433718 Wish to work a greater number of hours 221220 214381 29284 49397 62679 47633 25389
of which: - do not look for another job 204723 197884 26142 44648 57196 45236 24662 - look for another job 16497 16497 * * * * *
URBAN 4662492 4642167 188615 1276743 1441007 1175256 560546
Did not wish to work a grater number of hours 4550296 4530372 180907 1245853 1408184 1147001 548426 Wish to work a greater number of hours 112196 111795 7708 30890 32822 28255 12120
of which: - do not look for another job 101505 101103 6646 27943 30000 25171 11343 - look for another job 10692 10692 * * * * *
RURAL 3872894 3592635 347451 783693 1064208 844418 552866
Did not wish to work a grater number of hours 3371561 3105508 268015 672263 923947 741493 499790 Wish to work a greater number of hours 501333 487128 79436 111430 140261 102925 53076
of which: - do not look for another job 449753 435548 68858 96971 122998 95334 51388 - look for another job 51579 51579 10578 14459 17263 7591 *

174 Labour force in Romania: Employment and unemployment - 2015
Table 2.48. Employed persons who carried out atypical work in the main activity in the last four weeks by groups of age, gender, urban/rural area, type and frequency of work
- persons -
of which, in working age
Groups of age
Gender Urban/rural area Type and frequency of
work
Employed persons who carried out
atypical work
Total
Total 15-64 years 15-24
years 25-34 years
35-44 years
45-54 years
55-64 years
TOTAL Persons who worked in the evening 2658292 2554865 172882 634658 772555 632602 342168 - usually 1361463 1303092 94829 324428 392682 318428 172725 - sometimes 1296830 1251773 78054 310230 379873 314174 169442 Persons who worked at night 1027286 1021442 51979 246246 340771 267190 115257 - usually 437130 435135 20855 102106 144583 115719 51872 - sometimes 590156 586307 31125 144139 196187 151470 63385 Persons who worked on Saturday 4155193 3917951 293965 944196 1153053 959833 566903 - usually 2514165 2337844 182302 551256 676712 558460 369113 - sometimes 1641028 1580106 111663 392940 476341 401372 197790 Persons who worked on Sunday 2251319 2100998 147203 483675 621591 521428 327101 - usually 1253257 1152882 79643 253934 338546 284424 196335 - sometimes 998061 948116 67560 229741 283045 237004 130766
MEN
Persons who worked in the evening 1578504 1528323 107683 390173 450064 373934 206469 - usually 800749 773000 59941 196009 229186 184824 103039 - sometimes 777755 755323 47741 194163 220878 189111 103429 Persons who worked at night 707315 704585 36941 176828 229409 179965 81443 - usually 302193 301225 14092 73092 98666 78119 37255 - sometimes 405122 403360 22849 103736 130742 101845 44187 Persons who worked on Saturday 2456257 2342387 182777 585443 681856 567234 325078 - usually 1469876 1384091 112770 336804 400135 327162 207220 - sometimes 986382 958296 70006 248639 281721 240072 117858 Persons who worked on Sunday 1255171 1183521 87847 280422 341539 292904 180810 - usually 704889 657116 48876 147712 190411 161052 109065 - sometimes 550282 526405 38970 132710 151128 131851 71745
WOMEN
Persons who worked in the evening 1079788 1026543 65200 244485 322491 258668 135699 - usually 560714 530092 34888 128419 163495 133605 69686 - sometimes 519074 496450 30312 116067 158995 125063 66013 Persons who worked at night 319971 316857 15039 69418 111362 87225 33814 - usually 134937 133910 6763 29014 45917 37600 14616 - sometimes 185035 182947 8276 40403 65445 49625 19198 Persons who worked on Saturday 1698935 1575563 111189 358754 471197 392599 241825 - usually 1044289 953753 69532 214452 276578 231298 161893 - sometimes 654646 621810 41656 144301 194620 161300 79932 Persons who worked on Sunday 996148 917477 59356 203253 280052 228525 146291 - usually 548368 495765 30766 106222 148135 123372 87270 - sometimes 447780 421711 28590 97031 131917 105153 59021

Tables 175
Table 2.48. Employed persons who carried out atypical work in the main activity in the last four weeks by groups of age, gender, urban/rural area, type and frequency of work
(continued) - persons -
of which, in working age
Groups of age
Gender Urban/rural area Type and frequency of
work
Employed persons who carried out
atypical work
Total
Total 15-64 years 15-24
years 25-34 years
35-44 years
45-54 years
55-64 years
URBAN Persons who worked in the evening 1425903 1420895 70389 394305 440141 357972 158088 - usually 697756 695284 39447 191278 215514 172384 76661 - sometimes 728147 725611 30942 203027 224627 185589 81427 Persons who worked at night 691800 690622 26019 175632 227023 180640 81308 - usually 300193 299797 9856 73949 95809 81782 38400 - sometimes 391606 390825 16163 101683 131214 98858 42908 Persons who worked on Saturday 1898697 1886315 97440 520946 576172 482435 209322 - usually 1012400 1003963 57111 278508 303673 253548 111123 - sometimes 886297 882352 40329 242439 272500 228887 98198 Persons who worked on Sunday 1046061 1041476 56546 281957 320720 264632 117620 - usually 510225 507993 28097 136648 155782 129620 57846 - sometimes 535836 533482 28450 145309 164938 135012 59774
RURAL
Persons who worked in the evening 1232389 1133970 102493 240353 332414 274630 184080 - usually 663706 607808 55382 133150 177167 146045 96064 - sometimes 568683 526162 47112 107203 155247 128585 88016 Persons who worked at night 335487 330820 25960 70614 113748 86550 33949 - usually 136937 135339 10999 28158 48774 33937 13471 - sometimes 198550 195482 14962 42456 64974 52612 20478 Persons who worked on Saturday 2256496 2031636 196525 423250 576881 477398 357581 - usually 1501765 1333882 125191 272749 373039 304912 257990 - sometimes 754731 697754 71334 150501 203841 172486 99592 Persons who worked on Sunday 1205257 1059522 90657 201718 300871 256796 209482 - usually 743032 644888 51546 117286 182764 154804 138489 - sometimes 462225 414634 39111 84432 118107 101992 70993

176 Labour force in Romania: Employment and unemployment - 2015
Table 2.49. Employed persons who carried out atypical work in the main activity in the last four weeks by type and frequency of work, by gender, urban/rural area and activities of the national economy
- persons -
Type and frequency of work
Persons who worked
in the evening
Persons who worked at
night
Persons who worked on Saturday
Persons who worked on Sunday
Gender Urban/rural area
Activities of the national
economy
Employed persons whocarried out
atypical work
Total usually sometimes usually sometimes usually sometimes usually sometimes
TOTAL Agriculture, forestry and fishing 1640405 444074 306832 24939 42585 1178878 411678 601615 285787Mining and quarrying 37943 14242 16712 12730 17166 11509 11246 6834 10488Manufacturing 646684 199840 244562 100544 147839 213447 275122 65680 86898Production and supply of electric
and thermal energy, gas, hot water and air conditioning 28147 9362 12661 * 10917 9075 14670 * 9856
Water distribution; sanitation, waste administration, decontamination activities 30243 8998 8639 * * 13034 13835 6622 7074
Constructions 289121 43718 63120 * 9269 151909 115154 11262 18337Wholesale and retail; repair of
motors vehicles and motorcycles 670672 171314 189238 21860 33162 348342 286588 169526 190522Transport and storage 292540 116421 112220 62979 83957 141817 124231 88802 89268Hotels and restaurants 143738 69379 48240 23798 29660 86740 52693 62606 52734Information and communications 59882 16794 22322 * * 21506 23253 9946 9387Financial intermediation and
insurance 16023 * * * * * 6780 * *Real estate transactions 7704 * * * * * * * *Professional, scientific and
technical activities 40460 7975 16599 * * 12391 15898 * 7041Activities of administrative
services and activities of support services 127464 61304 43272 52632 41490 64096 55576 46203 50941
Public administration and defence; social insurance of public system 136618 49010 59655 36664 61040 51765 65909 40502 55749
Education 29252 9080 11432 * * * 8347 * *Health and social assistance 227721 92972 91655 67067 86641 102313 102050 79590 83214Showbiz, cultural and recreation
activities 31551 13030 8375 * * 16991 13323 11981 11164Other activities of the national
economy 125745 29478 34384 * * 76459 41495 37397 20176

Tables 177
Table 2.49. Employed persons who carried out atypical work in the main activity in the last four weeks by type and frequency of work, by gender, urban/rural area and activities of the national economy
(continued)
- persons -
Type and frequency of work
Persons who worked in the
evening
Persons who worked at
night
Persons who worked on Saturday
Persons who worked on Sunday
Gender Urban/rural area
Activities of the national
economy
Employed persons whocarried out
atypical work
Total usually sometimes usually sometimes usually sometimes usually sometimes
MEN Agriculture, forestry and fishing 920551 255556 175366 18411 29640 658948 233649 332480 153599Mining and quarrying 34796 13679 15307 12109 15853 9892 10380 * 9678Manufacturing 396638 120470 152161 67013 96909 132008 168761 44795 55835Production and supply of electric
and thermal energy, gas, hot water and air conditioning 27144 8790 12329 * 10813 8668 14414 * 9564
Water distribution; sanitation, waste administration, decontamination activities 24923 7277 6881 * * 10734 11777 * *
Constructions 281744 42641 61216 * 9058 149400 111968 11216 17305Wholesale and retail; repair of
motors vehicles and motorcycles 284925 63421 72827 12758 18544 150055 116725 58530 59467Transport and storage 267746 106189 103811 58806 79636 130774 115223 81032 81265Hotels and restaurants 60420 30605 20836 11184 13009 39115 19411 29316 20210Information and communications 36384 10284 13308 * * 13605 13315 * *Financial intermediation and
insurance * * * * * * * * *Real estate transactions * * * * * * * * *Professional, scientific and
technical activities 21842 * 8307 * * 8210 9020 * *Activities of administrative
services and activities of support services 107979 54837 38392 48831 39628 53604 49025 41014 45683
Public administration and defence; social insurance of public system 116607 42460 52902 32555 56514 42387 59167 32973 48483
Education 11627 * * * * * * * *Health and social assistance 49576 18588 20451 14791 18506 21819 21856 15476 17019Showbiz, cultural and recreation
activities 18381 7703 * * * 10118 7845 8188 *Other activities of the national
economy 41368 6886 10279 * * 21805 15523 21151 *

178 Labour force in Romania: Employment and unemployment - 2015
Table 2.49. Employed persons who carried out atypical work in the main activity in the last four weeks by type and frequency of work, by gender, urban/rural area and activities of the national economy
(continued) - persons-
Type and frequency of work
Persons who worked in the
evening
Persons who worked at
night
Persons who worked on Saturday
Persons who worked on Sunday
Gender Urban/rural area
Activities of the national
economy
Employed persons whocarried out
atypical work
Total usually sometimes usually sometimes usually sometimes usually sometimes
WOMEN Agriculture, forestry and fishing 719854 188518 131466 6527 12946 519930 178029 269135 132188Mining and quarrying * * * * * * * * *Manufacturing 250046 79370 92400 33531 50930 81439 106362 20885 31064Production and supply of electric
and thermal energy, gas, hot water and air conditioning * * * * * * * * *
Water distribution; sanitation, waste administration, decontamination activities * * * * * * * * *
Constructions 7378 * * * * * * * *Wholesale and retail; repair of
motors vehicles and motorcycles 385747 107893 116411 9102 14618 198287 169864 110996 131055Transport and storage 24793 10233 8409 * * 11043 9008 7770 8004Hotels and restaurants 83317 38774 27403 12614 16651 47625 33282 33289 32524Information and communications 23498 6510 9014 * * 7901 9938 * *Financial intermediation and
insurance 10099 * * * * * * * *Real estate transactions * * * * - * * * *Professional, scientific and
technical activities 18618 * 8292 - * * 6878 * *Activities of administrative
services and activities of support services 19485 * * * * 10492 6551 * *
Public administration and defence; social insurance of public system 20011 6549 6753 * * 9378 6742 7529 7266
Education 17625 * * * * * * * *Health and social assistance 178145 74384 71204 52276 68136 80493 80195 64114 66195Showbiz, cultural and recreation
activities 13170 * * * * 6873 * * *Other activities of the national
economy 84377 22592 24104 * * 54653 25971 16246 14460
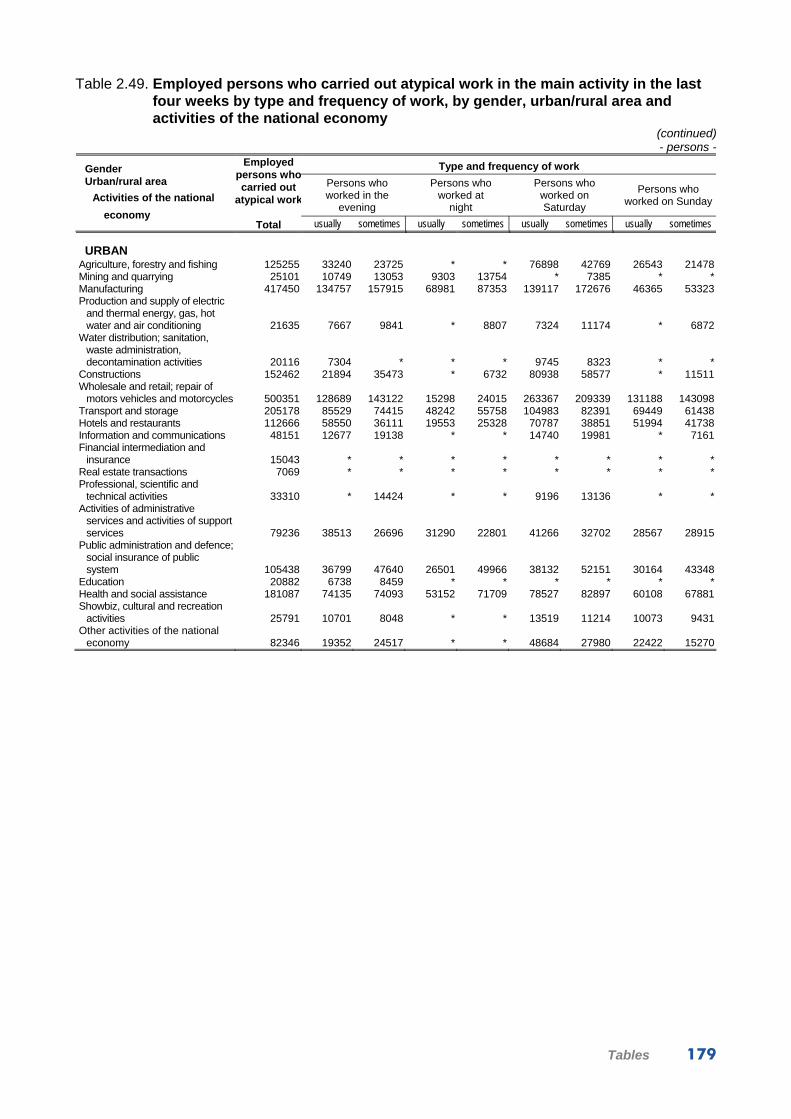
Tables 179
Table 2.49. Employed persons who carried out atypical work in the main activity in the last four weeks by type and frequency of work, by gender, urban/rural area and activities of the national economy
(continued) - persons -
Type and frequency of work Persons who worked in the
evening
Persons who worked at
night
Persons who worked on Saturday
Persons who worked on Sunday
Gender Urban/rural area
Activities of the national
economy
Employed persons whocarried out
atypical work
Total usually sometimes usually sometimes usually sometimes usually sometimes
URBAN Agriculture, forestry and fishing 125255 33240 23725 * * 76898 42769 26543 21478Mining and quarrying 25101 10749 13053 9303 13754 * 7385 * *Manufacturing 417450 134757 157915 68981 87353 139117 172676 46365 53323Production and supply of electric
and thermal energy, gas, hot water and air conditioning 21635 7667 9841 * 8807 7324 11174 * 6872
Water distribution; sanitation, waste administration, decontamination activities 20116 7304 * * * 9745 8323 * *
Constructions 152462 21894 35473 * 6732 80938 58577 * 11511Wholesale and retail; repair of
motors vehicles and motorcycles 500351 128689 143122 15298 24015 263367 209339 131188 143098Transport and storage 205178 85529 74415 48242 55758 104983 82391 69449 61438Hotels and restaurants 112666 58550 36111 19553 25328 70787 38851 51994 41738Information and communications 48151 12677 19138 * * 14740 19981 * 7161Financial intermediation and
insurance 15043 * * * * * * * *Real estate transactions 7069 * * * * * * * *Professional, scientific and
technical activities 33310 * 14424 * * 9196 13136 * *Activities of administrative
services and activities of support services 79236 38513 26696 31290 22801 41266 32702 28567 28915
Public administration and defence; social insurance of public system 105438 36799 47640 26501 49966 38132 52151 30164 43348
Education 20882 6738 8459 * * * * * *Health and social assistance 181087 74135 74093 53152 71709 78527 82897 60108 67881Showbiz, cultural and recreation
activities 25791 10701 8048 * * 13519 11214 10073 9431Other activities of the national
economy 82346 19352 24517 * * 48684 27980 22422 15270

180 Labour force in Romania: Employment and unemployment - 2015
Table 2.49. Employed persons who carried out atypical work in the main activity in the last four weeks by type and frequency of work, by gender, urban/rural area and activities of the national economy
(continued) - persons -
Type and frequency of work Persons who worked in the
evening
Persons who worked at
night
Persons who worked on Saturday
Persons who worked on Sunday
Gender Urban/rural area
Activities of the national
economy
Employed persons whocarried out
atypical work
Total usually sometimes usually sometimes usually sometimes usually sometimes
RURAL Agriculture, forestry and fishing 1515150 410835 283107 20992 37602 1101980 368909 575072 264310Mining and quarrying 12843 * * * * 7308 * * *Manufacturing 229234 65083 86647 31563 60486 74330 102447 19315 33576Production and supply of electric
and thermal energy, gas, hot water and air conditioning 6511 * * * * * * * *
Water distribution; sanitation, waste administration, decontamination activities 10126 * * * * * * * *
Constructions 136660 21824 27647 * * 70971 56577 * 6826Wholesale and retail; repair of
motors vehicles and motorcycles 170321 42626 46116 6562 9147 84975 77249 38338 47423Transport and storage 87361 30892 37805 14737 28199 36834 41840 19353 27831Hotels and restaurants 31072 10828 12129 * * 15953 13841 10611 10996Information and communications 11732 * * * * 6766 * * *Financial intermediation and
insurance * - * - * * * - *Real estate transactions * * * * - * * * *Professional, scientific and
technical activities 7150 * * * * * * * *Activities of administrative
services and activities of support services 48228 22791 16576 21341 18689 22830 22875 17636 22026
Public administration and defence; social insurance of public system 31181 12211 12014 10163 11073 13633 13758 10338 12401
Education 8370 * * * * * * * *Health and social assistance 46635 18837 17562 13915 14933 23786 19153 19482 15333Showbiz, cultural and recreation
activities * * * * * * * * *Other activities of the national
economy 43399 10126 9867 * * 27775 13515 14976 *
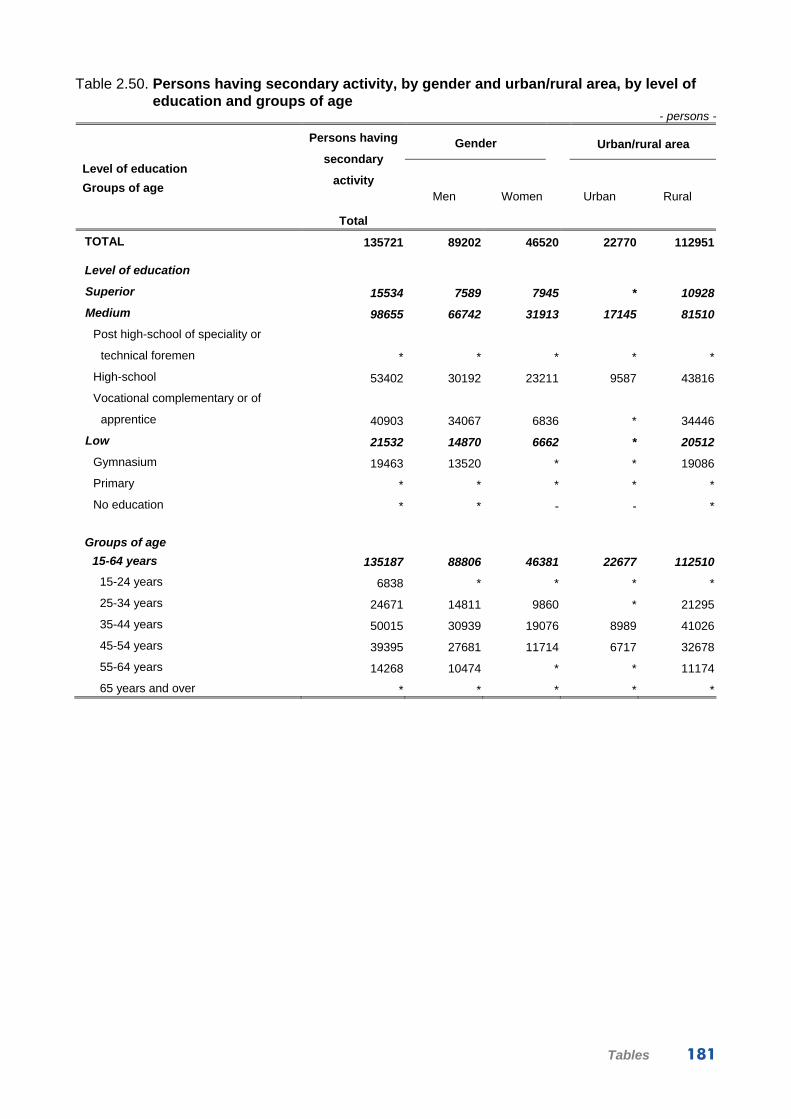
Tables 181
Table 2.50. Persons having secondary activity, by gender and urban/rural area, by level of education and groups of age
- persons -
Gender Urban/rural area
Level of education
Groups of age
Persons having
secondary
activity
Total
Men Women Urban Rural
TOTAL 135721 89202 46520 22770 112951
Level of education
Superior 15534 7589 7945 * 10928
Medium 98655 66742 31913 17145 81510
Post high-school of speciality or
technical foremen * * * * *
High-school 53402 30192 23211 9587 43816
Vocational complementary or of
apprentice 40903 34067 6836 * 34446
Low 21532 14870 6662 * 20512
Gymnasium 19463 13520 * * 19086
Primary * * * * *
No education * * - - *
Groups of age
15-64 years 135187 88806 46381 22677 112510
15-24 years 6838 * * * *
25-34 years 24671 14811 9860 * 21295
35-44 years 50015 30939 19076 8989 41026
45-54 years 39395 27681 11714 6717 32678
55-64 years 14268 10474 * * 11174
65 years and over * * * * *
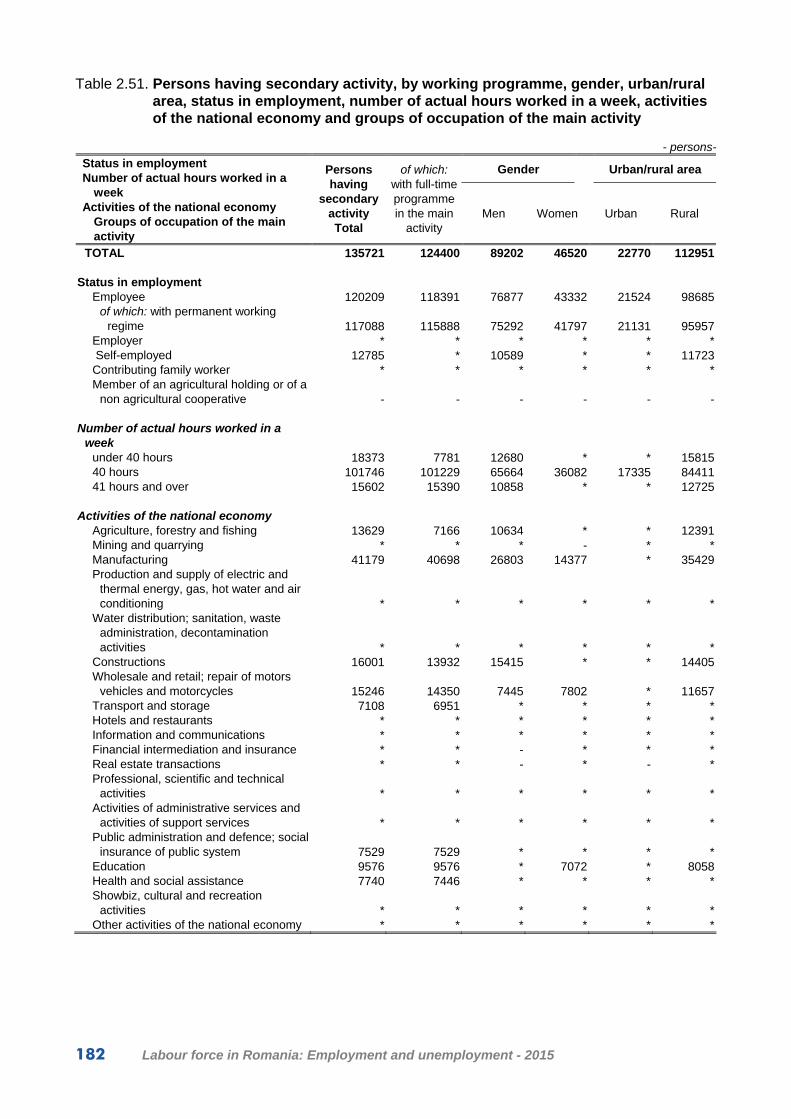
182 Labour force in Romania: Employment and unemployment - 2015
Table 2.51. Persons having secondary activity, by working programme, gender, urban/rural area, status in employment, number of actual hours worked in a week, activities of the national economy and groups of occupation of the main activity
- persons-
Gender Urban/rural area Status in employment Number of actual hours worked in a
week Activities of the national economy
Groups of occupation of the main activity
Persons having
secondary activity Total
of which: with full-time programme in the main
activity Men Women Urban Rural
TOTAL 135721 124400 89202 46520 22770 112951 Status in employment
Employee 120209 118391 76877 43332 21524 98685of which: with permanent working
regime 117088 115888 75292 41797 21131 95957Employer * * * * * * Self-employed 12785 * 10589 * * 11723Contributing family worker * * * * * *Member of an agricultural holding or of a
non agricultural cooperative - - - - - - Number of actual hours worked in a
week under 40 hours 18373 7781 12680 * * 1581540 hours 101746 101229 65664 36082 17335 8441141 hours and over 15602 15390 10858 * * 12725
Activities of the national economy
Agriculture, forestry and fishing 13629 7166 10634 * * 12391Mining and quarrying * * * - * *Manufacturing 41179 40698 26803 14377 * 35429Production and supply of electric and
thermal energy, gas, hot water and air conditioning * * * * * *
Water distribution; sanitation, waste administration, decontamination activities * * * * * *
Constructions 16001 13932 15415 * * 14405Wholesale and retail; repair of motors
vehicles and motorcycles 15246 14350 7445 7802 * 11657Transport and storage 7108 6951 * * * *Hotels and restaurants * * * * * *Information and communications * * * * * *Financial intermediation and insurance * * - * * *Real estate transactions * * - * - *Professional, scientific and technical
activities * * * * * *Activities of administrative services and
activities of support services * * * * * *Public administration and defence; social
insurance of public system 7529 7529 * * * *Education 9576 9576 * 7072 * 8058Health and social assistance 7740 7446 * * * *Showbiz, cultural and recreation
activities * * * * * *Other activities of the national economy * * * * * *

Tables 183
Table 2.51. Persons having secondary activity, by working programme, gender, urban/rural area, status in employment, number of actual hours worked in a week, activities of the national economy and groups of occupation of the main activity
(continued) - persons-
Gender Urban/rural area Status in employment Number of actual hours worked in a
week Activities of the national economy
Groups of occupation of the main activity
Persons having
secondary activity Total
of which: with full-time programme in the main
activity Men Women Urban Rural
Groups of occupations:
Managers * * * * * *Professionals 13895 13539 * 8798 * 9882Technicians and associate professionals * * * * * *Clerical support workers * * * * * *Services and sales workers 21737 20880 8045 13692 * 18209Skilled workers in agriculture, forestry and fishing 7615 * * * * 7431Craft and related workers 41563 39749 36820 * * 35216Other categories of occupations 40056 35948 27661 12395 * 33558
of which: Elementary occupations 16373 12536 9721 6652 * 13363

184 Labour force in Romania: Employment and unemployment - 2015
Table 2.52. Persons having secondary activity by gender, urban/rural area, status in employment, number of actual hours worked in a week, activity sectors of the national economy and groups of occupation of the secondary activity
- persons -
Gender Urban/rural area Status in employment
Number of actual hours worked in a week
Sectors of activity of the national economy
Groups of occupation of the secondary
activity
Persons having
secondary activity
Total
Men Women Urban Rural
TOTAL 135721 89202 46520 22770 112951 Status in employment
Employee * * * * *Employer * * * * * Self-employed 47155 36527 10627 6867 40288Contributing family worker 83072 50041 33031 11662 71410Member of an agricultural holding or of a non
agricultural cooperative - - - - -
Number of actual hours worked in a week under 40 hours 135099 88826 46273 22440 11265840 hours * * * * *41 hours and over * * - - *
Sectors of activity of the national economy
Agriculture 125231 83652 41579 16660 108571Industry and constructions * * * * *Services 8158 * * * *
Groups of occupations:
Managers * * * * *Professionals * * * * *Technicians and associate professionals * * * * -Clerical support workers * * * * *Services and sales workers * * * * *Skilled workers in agriculture, forestry and fishing 111177 74558 36620 12588 98590Craft and related workers * * * * *Other categories of occupations 16330 10422 * * 11614
of which: Elementary occupations 15550 9689 * * 10938
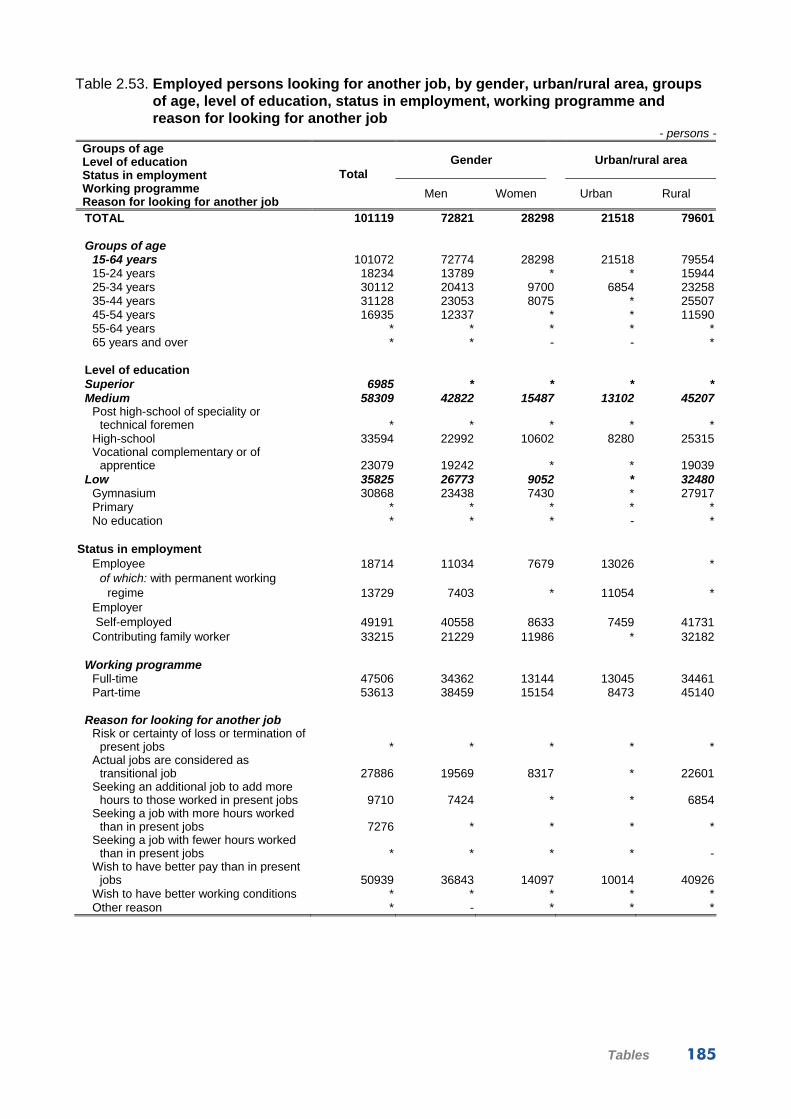
Tables 185
Table 2.53. Employed persons looking for another job, by gender, urban/rural area, groups of age, level of education, status in employment, working programme and reason for looking for another job
- persons -
Gender Urban/rural area Groups of age Level of education Status in employment Working programme Reason for looking for another job
Total
Men Women Urban Rural
TOTAL 101119 72821 28298 21518 79601
Groups of age 15-64 years 101072 72774 28298 21518 7955415-24 years 18234 13789 * * 1594425-34 years 30112 20413 9700 6854 2325835-44 years 31128 23053 8075 * 2550745-54 years 16935 12337 * * 1159055-64 years * * * * *65 years and over * * - - *
Level of education Superior 6985 * * * *Medium 58309 42822 15487 13102 45207
Post high-school of speciality or technical foremen * * * * *
High-school 33594 22992 10602 8280 25315Vocational complementary or of
apprentice 23079 19242 * * 19039Low 35825 26773 9052 * 32480
Gymnasium 30868 23438 7430 * 27917Primary * * * * *No education * * * - *
Status in employment
Employee 18714 11034 7679 13026 *of which: with permanent working
regime 13729 7403 * 11054 *Employer Self-employed 49191 40558 8633 7459 41731Contributing family worker 33215 21229 11986 * 32182
Working programme
Full-time 47506 34362 13144 13045 34461Part-time 53613 38459 15154 8473 45140
Reason for looking for another job
Risk or certainty of loss or termination of present jobs * * * * *
Actual jobs are considered as transitional job 27886 19569 8317 * 22601
Seeking an additional job to add more hours to those worked in present jobs 9710 7424 * * 6854
Seeking a job with more hours worked than in present jobs 7276 * * * *
Seeking a job with fewer hours worked than in present jobs * * * * -
Wish to have better pay than in present jobs 50939 36843 14097 10014 40926
Wish to have better working conditions * * * * *Other reason * - * * *

186 Labour force in Romania: Employment and unemployment - 2015
Table 2.54. Employed persons looking for another job, by type of job and working programme sought, by gender, urban/rural area, current working programme and groups of age
- persons -
Type of job and working programme sought Of which:
Gender Urban/ rural area
Current working programme Groups of age
Total As employee Full time job Part time job
Any other type of job (including as self employed)
TOTAL 101119 94960 47578 41827 *Working programme
Full time 47506 45052 21936 19662 *Part time 53613 49908 25642 22165 *
Groups of age Total 15-64 years 101072 94913 47530 41827 *
15-24 years 18234 17395 7671 8746 *25-34 years 30112 28546 14093 12778 *35-44 years 31128 29302 14725 12647 *45-54 years 16935 15774 9687 * *55-64 years * * * * *65 years and over * * * - -
MEN 72821 67850 33159 30033 *Working programme
Full time 34362 31953 15349 13519 *Part time 38459 35897 17810 16514 *
Groups of age Total 15-64 years 72774 67803 33112 30032 *
15-24 years 13789 12985 * * *25-34 years 20413 18949 8577 9056 *35-44 years 23053 21619 10461 9607 *45-54 years 12337 11565 7423 * *55-64 years * * * * *65 years and over * * * - -
WOMEN 28298 27109 14418 11794 *Working programme
Full time 13144 13099 6587 * *Part time 15154 14010 7831 * *
Groups of age Total 15-64 years 28298 27109 14419 11794 *
15-24 years * * * * *25-34 years 9700 9598 * * *35-44 years 8075 7683 * * *45-54 years * * * * *55-64 years * * * * *65 years and over - - - - -

Tables 187
Table 2.54. Employed persons looking for another job, by type of job and working programme sought, by gender, urban/rural area, current working programme and groups of age
(continued) - persons -
Type of job and working programme sought
Gender Urban/ rural area
Current working programme Groups of age
Total As employee Full time job Part time job
Any other type of job (including as self employed)
URBAN 21518 20098 13880 * *Working programme
Full time 13045 12309 9192 * *Part time 8473 7789 * * *
Groups of age Total 15-64 years 21519 20098 13880 * *
15-24 years * * * * *25-34 years 6854 * * * *35-44 years * * * * *45-54 years * * * * *55-64 years * * * * *65 years and over - - - - -
RURAL 79601 74862 33697 36291 *Working programme
Full time 34461 32743 12744 17184 *Part time 45140 42119 20953 19108 *
Groups of age Total 15-64 years 79554 74814 33651 36292 *
15-24 years 15944 15236 * 8051 *25-34 years 23258 22138 9512 11288 *35-44 years 25507 23916 10933 11192 *45-54 years 11590 10928 * * *55-64 years * * * * *65 years and over * * * - -

188 Labour force in Romania: Employment and unemployment - 2015
Table 2.55. Employed persons looking for another job and available to work, by gender, urban/rural area, groups of age and reasons that would make them to refuse a job
- persons -
Gender Urban/rural area Groups of age Reasons to refuse a job
Total Men Women Urban Rural
TOTAL 100198 72099 28098 21436 78762Groups of age Total 15-64 years 100150 72052 28098 21436 78714
15-24 years 18108 13664 * * 1581825-34 years 30112 20413 9700 6854 2325835-44 years 30570 22626 7943 * 2503145-54 years 16697 12167 * * 1135355-64 years * * * * *65 years and over * * - - *
Reasons to refuse a job None 17901 14830 * * 15660One reason 13831 10769 * * 11257
Change of residence * * * * *Distance from home, commuting * * * * *No formal working contract * * * * *Low wage * * * * *Other reasons * * * * *
Several resons 68465 46500 21965 16620 51845 Table 2.56. Underemployed workers by gender, urban/rural area, groups of age, status in
employment and activity sectors of the national economy
- persons - Gender Urban/rural area Groups of age
Status in employment Activity sectors
Total Men Women Urban Rural
TOTAL 267935 179497 88438 31310 236625 Groups of age
15-24 years 54213 37545 16667 * 5098925-34 years 69037 47490 21548 10078 5895935-44 years 70168 45808 24359 7320 6284745-54 years 51710 32861 18849 6956 4475455-64 years 21973 15095 6879 * 1824265 years and over * * * - *
Status in employment
Employee 14263 7278 6985 7147 7116Non-employee 253672 172219 81453 24163 229509
Sector of economic activity
Agriculture 215813 137858 77954 10982 204831Industry and constructions 26442 25400 * 8784 17658Services 25680 16239 9441 11544 14136

Tables 189
Table 2.57. Unemployed by work experience, by gender, urban/rural area and groups of age
- persons - Gender Urban/ rural area
Groups of age
Unemployed Total
Unemployed who have never worked
Unemployed who have previously worked
TOTAL 623910 290019 33389215-24 years 148221 130845 1737525-34 years 181188 96607 8458135-44 years 140521 39794 10072745-54 years 110215 19046 9116955 years and over 43766 * 40039
MEN 394898 170595 224303
15-24 years 85874 72576 1329825-34 years 118866 60740 5812635-44 years 86863 22869 6399545-54 years 70077 11662 5841655 years and over 33218 * 30469
WOMEN 229012 119424 109589
15-24 years 62347 58269 *25-34 years 62322 35867 2645535-44 years 53658 16925 3673345-54 years 40137 7384 3275355 years and over 10548 * 9570
URBAN 350434 138922 211512
15-24 years 69400 58374 1102725-34 years 111903 54888 5701535-44 years 74554 16108 5844545-54 years 67164 8126 5903955 years and over 27412 * 25987
RURAL 273477 151097 122380
15-24 years 78820 72472 *25-34 years 69284 41718 2756635-44 years 65968 23686 4228245-54 years 43051 10921 3213055 years and over 16354 * 14053
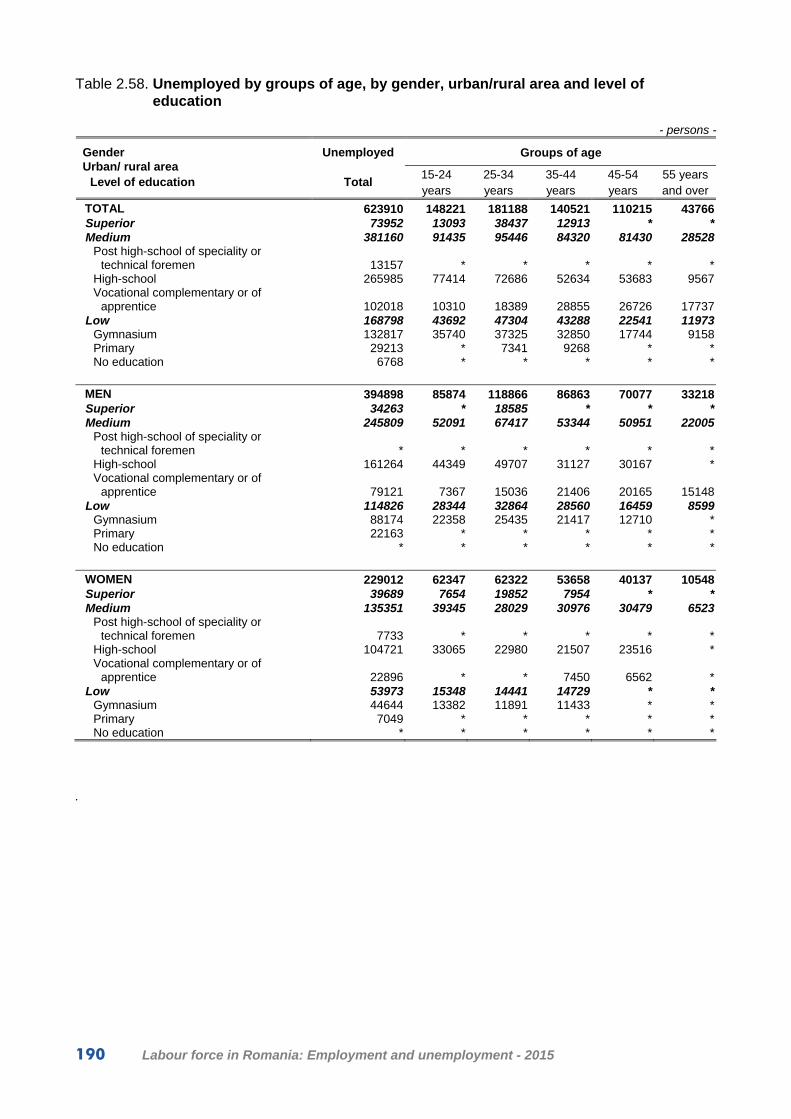
190 Labour force in Romania: Employment and unemployment - 2015
Table 2.58. Unemployed by groups of age, by gender, urban/rural area and level of education
- persons -
Groups of age Gender Urban/ rural area
Level of education
Unemployed
Total 15-24 years
25-34 years
35-44 years
45-54 years
55 years and over
TOTAL 623910 148221 181188 140521 110215 43766Superior 73952 13093 38437 12913 * *Medium 381160 91435 95446 84320 81430 28528
Post high-school of speciality or technical foremen 13157 * * * * *
High-school 265985 77414 72686 52634 53683 9567Vocational complementary or of
apprentice 102018 10310 18389 28855 26726 17737Low 168798 43692 47304 43288 22541 11973
Gymnasium 132817 35740 37325 32850 17744 9158Primary 29213 * 7341 9268 * *No education 6768 * * * * *
MEN 394898 85874 118866 86863 70077 33218Superior 34263 * 18585 * * *Medium 245809 52091 67417 53344 50951 22005
Post high-school of speciality or technical foremen * * * * * *
High-school 161264 44349 49707 31127 30167 *Vocational complementary or of
apprentice 79121 7367 15036 21406 20165 15148Low 114826 28344 32864 28560 16459 8599
Gymnasium 88174 22358 25435 21417 12710 *Primary 22163 * * * * *No education * * * * * *
WOMEN 229012 62347 62322 53658 40137 10548Superior 39689 7654 19852 7954 * *Medium 135351 39345 28029 30976 30479 6523
Post high-school of speciality or technical foremen 7733 * * * * *
High-school 104721 33065 22980 21507 23516 *Vocational complementary or of
apprentice 22896 * * 7450 6562 *Low 53973 15348 14441 14729 * *
Gymnasium 44644 13382 11891 11433 * *Primary 7049 * * * * *No education * * * * * *
.
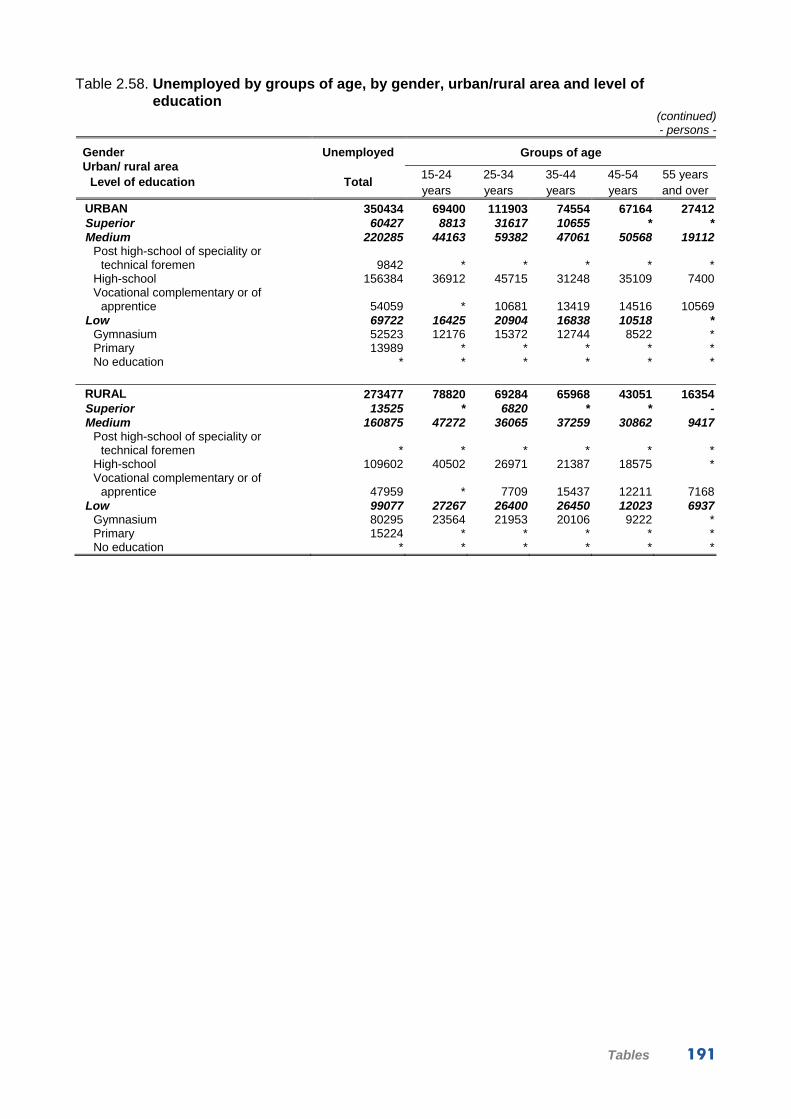
Tables 191
Table 2.58. Unemployed by groups of age, by gender, urban/rural area and level of education
(continued) - persons -
Groups of age Gender Urban/ rural area
Level of education
Unemployed
Total 15-24 years
25-34 years
35-44 years
45-54 years
55 years and over
URBAN 350434 69400 111903 74554 67164 27412Superior 60427 8813 31617 10655 * *Medium 220285 44163 59382 47061 50568 19112
Post high-school of speciality or technical foremen 9842 * * * * *
High-school 156384 36912 45715 31248 35109 7400Vocational complementary or of
apprentice 54059 * 10681 13419 14516 10569Low 69722 16425 20904 16838 10518 *
Gymnasium 52523 12176 15372 12744 8522 *Primary 13989 * * * * *No education * * * * * *
RURAL 273477 78820 69284 65968 43051 16354Superior 13525 * 6820 * * -Medium 160875 47272 36065 37259 30862 9417
Post high-school of speciality or technical foremen * * * * * *
High-school 109602 40502 26971 21387 18575 *Vocational complementary or of
apprentice 47959 * 7709 15437 12211 7168Low 99077 27267 26400 26450 12023 6937
Gymnasium 80295 23564 21953 20106 9222 *Primary 15224 * * * * *No education * * * * * *

192 Labour force in Romania: Employment and unemployment - 2015
Table 2.59. Unemployed by groups of age, gender and urban/rural area by participation in formal education
- persons -
Groups of age Gender Urban/ rural area
Level of education
Unemployed
Total 15-24 years
25-34 years
35-44 years
45-54 years
55 years and over
TOTAL 623910 148221 181188 140521 110215 43766Higher (including short-term university,
master, PHD and post university) * * * * * -Medium and low * * * - - -None 616281 142458 179553 140427 110076 43766
MEN 394898 85874 118866 86863 70077 33218
Higher (including short-term university, master, PHD and post university) * * * - - -
Medium and low * * * - - -None 391557 83583 117816 86863 70077 33218
WOMEN 229012 62347 62322 53658 40137 10548
Higher (including short-term university, master, PHD and post university) * * * * * -
Medium and low * * - - - -None 224723 58876 61737 53564 39999 10548
URBAN 350434 69400 111903 74554 67164 27412
Higher (including short-term university, master, PHD and post university) * * * * * -
Medium and low * * * - - -None 345263 65896 110470 74460 67026 27412
RURAL 273477 78820 69284 65968 43051 16354
Higher (including short-term university, master, PHD and post university) * * * - - -
Medium and low * * - - - -None 271017 76562 69084 65968 43051 16354

Tables 193
Table 2.60. Unemployed by groups of age, by gender, urban/rural area by unemployment duration
- persons -
Groups of age Gender Urban/ rural area
Unemployment duration
Unemployed
Total 15-24 years 25-34 years 35-44 years 45 years and
over
TOTAL 623910 148221 181188 140521 153981Less than 6 months 229578 58353 66059 51771 533956-11 months 120360 34674 30900 26638 2814912-23 months 145680 31936 45281 32583 3588024 months or over 128292 23257 38948 29530 36557
Average unemployment duration (months) 13.6 11.8 14.1 13.7 14.7
MEN 394898 85874 118866 86863 103295
Less than 6 months 145226 33351 42255 33466 361536-11 months 76604 18738 21824 16217 1982512-23 months 90544 18543 28800 19391 2381024 months or over 82525 15242 25987 17789 23507
Average unemployment duration (months) 13.6 12.4 14.1 13.3 14.4
WOMEN 229012 62347 62322 53658 50686
Less than 6 months 84352 25002 23803 18305 172426-11 months 43756 15936 9077 10420 832412-23 months 55137 13394 16481 13192 1207024 months or over 45767 8015 12961 11741 13050
Average unemployment duration (months) 13.5 10.9 14.0 14.3 15.4
URBAN 350434 69400 111903 74554 94576
Less than 6 months 130190 28750 41509 26215 337156-11 months 68366 18730 20034 13466 1613612-23 months 78401 12027 26224 17939 2221024 months or over 73477 9893 24136 16933 22514
Average unemployment duration (months) 13.5 10.9 13.7 14.1 14.6
RURAL 273477 78820 69284 65968 59404
Less than 6 months 99388 29603 24550 25556 196806-11 months 51994 15944 10866 13171 1201212-23 months 67280 19909 19057 14644 1366924 months or over 54815 13364 14812 12596 14043
Average unemployment duration (months) 13.8 12.5 14.7 13.2 14.9

194 Labour force in Romania: Employment and unemployment - 2015
Table 2.61. Unemployed by work experience, unemployment duration, gender, urban/rural area and level of education
- persons -
of which: Unemployment duration Gender Urban/rural area
Level of education
Unemployed
Total
Unemployed who have
never worked
Unemployed who have previously
worked
under 6 months
6-11 months
12-23 months
24 months
and over
TOTAL 623910 290019 333892 229578 120360 145680 128292Superior 73952 41233 32719 26972 14553 18582 13846Medium 381160 158097 223062 135190 73161 89337 83472
Post high-school of speciality or technical foremen 13157 * 7692 * * * *
High-school 265985 125740 140245 94205 49915 64122 57743Vocational complementary or
of apprentice 102018 26892 75125 36538 20293 22130 23057Low 168798 90688 78111 67416 32647 37761 30974
Gymnasium 132817 68996 63821 53808 25422 29702 23885Primary 29213 16650 12563 11031 * * *No education 6768 * * * * * *
MEN 394898 170595 224303 145226 76604 90544 82525Superior 34263 18846 15417 12859 7134 8571 *Medium 245809 96496 149313 86565 47329 57061 54854
Post high-school of speciality or technical foremen * * * * * * *
High-school 161264 74157 87108 55939 30993 39182 35151Vocational complementary or
of apprentice 79121 20781 58340 28610 15519 16810 18181Low 114826 55253 59572 45802 22141 24911 21971
Gymnasium 88174 40627 47547 35268 17138 19359 16409Primary 22163 11417 10746 8994 * * *No education * * * * * * *
WOMEN 229012 119424 109589 84352 43756 55137 45767Superior 39689 22388 17301 14113 7419 10011 8146Medium 135351 61602 73749 48625 25831 32276 28618
Post high-school of speciality or technical foremen 7733 * * * * * *
High-school 104721 51584 53138 38267 18923 24940 22592Vocational complementary or
of apprentice 22896 * 16785 7928 * * *Low 53973 35434 18538 21614 10506 12850 9003
Gymnasium 44644 28369 16275 18540 8284 10343 7476Primary 7049 * * * * * *No education * * * * * * *

Tables 195
Table 2.61. Unemployed by work experience, unemployment duration, gender, urban/rural area and level of education
(continued) - persons -
of which: Unemployment duration Gender Urban/rural area
Level of education
Unemployed
Total
Unemployed who have
never worked
Unemployed who have previously
worked
under 6 months
6-11 months
12-23 months
24 months
and over
URBAN 350434 138922 211512 130190 68366 78401 73477Superior 60427 30498 29929 22383 12349 14750 10945Medium 220285 74334 145951 79038 41822 51752 47674
Post high-school of speciality or technical foremen 9842 * * * * * *
High-school 156384 59325 97058 56014 30640 37381 32350Vocational complementary or
of apprentice 54059 11378 42680 19355 9576 11767 13360Low 69722 34090 35632 28769 14196 11900 14858
Gymnasium 52523 24352 28170 22451 11151 8458 10462Primary 13989 7411 6578 * * * *No education * * * * * * *
RURAL 273477 151097 122380 99388 51994 67280 54815Superior 13525 10735 * * * * *Medium 160875 83764 77111 56152 31339 37586 35798
Post high-school of speciality or technical foremen * * * * * * *
High-school 109602 66415 43187 38192 19276 26741 25393Vocational complementary or
of apprentice 47959 15514 32445 17183 10717 10362 9697Low 99077 56598 42479 38647 18451 25862 16117
Gymnasium 80295 44644 35651 31357 14271 21244 13423Primary 15224 9239 * * * * *No education * * * * * * *

196 Labour force in Romania: Employment and unemployment - 2015
Table 2.62. Unemployed by work experience, unemployment duration, gender, urban/rural area and participation in formal education
- persons -
of which: Unemployment
duration Gender Urban/rural area
Level of education
Unemployed
Total
Unemployed who have
never worked
Unemployed who have previously
worked
Less than 1 year
1 year and over
TOTAL 623910 290019 333892 349938 273972Higher (including short-term university,
master, PHD and post university) * * * * *Medium and low * * * * *None 616281 283605 332676 343571 272709
MEN 394898 170595 224303 221829 173068
Higher (including short-term university, master, PHD and post university) * * * * *
Medium and low * * * * *None 391557 167896 223662 219049 172509
WOMEN 229012 119424 109589 128109 100904
Higher (including short-term university, master, PHD and post university) * * * * *
Medium and low * * - * *None 224723 115709 109014 124523 100201
URBAN 350434 138922 211512 198556 151877
Higher (including short-term university, master, PHD and post university) * * * * *
Medium and low * * * * *None 345263 134743 210520 194222 151041
RURAL 273477 151097 122380 151382 122095
Higher (including short-term university, master, PHD and post university) * * * * *
Medium and low * * * * *None 271017 148862 122155 149349 121668

Tables 197
Table 2.63. Unemployed by relationship to the head of the household, by gender, urban/rural area, working experience and duration of unemployment
- persons -
Relationship to the head of the household Gender Urban/rural area
Working experience Unemployment duration
Unemployed
Total Head of the household
Spouse (or cohabiting partner)
Child or child’s spouse
Other relative
Other
TOTAL 623910 202814 92505 277518 45226 *Of which: unemployed who
received unemployment benefits 51645 18504 9517 20109 * *
Work experience Unemployed who have never worked 290019 52074 26889 174808 32325 *Unemployed who have
previously worked 333892 150740 65616 102710 12901 *Duration of unemployment
Less than 3 months 136692 46952 20296 57824 10229 *3-5 months 92886 30006 12700 42486 7071 *6-11 months 120360 38658 16671 54839 8658 *12-23 months 145680 42532 24760 66411 10823 *24 months and over 128292 44665 18077 55959 8445 *
MEN 394898 170928 9655 182522 29419 *
Of which: unemployed who received unemployment benefits 30546 15652 * 13030 * *
Work experience Unemployed who have never worked 170595 42576 * 104683 19946 *Unemployed who have
previously worked 224303 128352 7635 77839 9473 *Duration of unemployment
Less than 3 months 88381 39198 * 38742 6949 *3-5 months 56844 24169 * 27487 * *6-11 months 76604 33308 * 36162 * *12-23 months 90544 36464 * 42690 7863 *24 months and over 82525 37789 * 37441 * *
WOMEN 229012 31886 82850 94996 15808 *
Of which: unemployed who received unemployment benefits 21099 * 8953 7079 * *
Work experience Unemployed who have never worked 119424 9498 24868 70125 12379 *Unemployed who have
previously worked 109589 22388 57981 24872 * *Duration of unemployment
Less than 3 months 48310 7754 17492 19082 * *3-5 months 36042 * 11805 14999 * *6-11 months 43756 * 15267 18677 * *12-23 months 55137 * 21598 23721 * *24 months and over 45767 6876 16686 18518 * *

198 Labour force in Romania: Employment and unemployment - 2015
Table 2.63. Unemployed by relationship to the head of the household, by gender, urban/rural area, working experience and duration of unemployment
(continued) - persons -
Relationship to the head of the household Gender Urban/rural area
Working experience Unemployment duration
Unemployed
Total Head of the household
Spouse (or cohabiting partner)
Child or child’s spouse
Other relative
Other
URBAN 350434 121264 62207 140319 22879 *Of which: unemployed who
received unemployment benefits 36995 14652 7659 12037 * *
Work experience Unemployed who have never worked 138922 26015 14722 80834 14623 *Unemployed who have
previously worked 211512 95249 47486 59485 8256 *Duration of unemployment
Less than 3 months 78880 29185 13294 30103 * *3-5 months 51309 18063 8831 20491 * *6-11 months 68366 21608 10680 30040 * *12-23 months 78401 25870 16852 30053 * *24 months and over 73477 26537 12551 29632 * *
RURAL 273477 81550 30297 137199 22348 *
Of which: unemployed who received unemployment benefits 14650 * * 8072 * *
Work experience Unemployed who have never worked 151097 26059 12167 93974 17703 *Unemployed who have
previously worked 122380 55491 18130 43225 * *Duration of unemployment
Less than 3 months 57811 17767 7002 27721 * *3-5 months 41577 11944 * 21995 * *6-11 months 51994 17050 * 24799 * *12-23 months 67280 16662 7908 36358 * *24 months and over 54815 18128 * 26327 * *

Tables 199
Table 2.64. Unemployed who have previously worked by groups of age, gender, urban/rural area and the reason for leaving last job
- persons -
Groups of age Gender Urban/rural area Reason for leaving last job
Unemployed who have previously
worked
Total
15-24 years
25-34 years
35-44 years
45-54 years
55 years and over
TOTAL 333892 17375 84581 100727 91169 40039Reason for leaving last job
Dismissed or made redundant 170215 * 38103 51828 53148 22520Employer went out of business or closed
down the business 47623 * 8275 13165 16798 8699A job of limited duration has ended 68156 7301 23155 20322 12441 *Retirement (including partial retirement) * - - * * *Own illness or disability * - * * * *Family responsibilities (including maternity
or parental leave) * * * * * -Resignation 24656 * 8827 7223 * *Other reason 14630 * * * * *
Of which:
Unemployed who have worked before, but they started looking for a job after a period of inactivity 242168 9454 57247 73093 69581 32794
MEN 224303 13298 58126 63995 58416 30469
Reason for leaving last job Dismissed or made redundant 114764 * 26092 32794 35586 17461Employer went out of business or closed
down the business 31979 * * 9038 9740 7019A job of limited duration has ended 52276 * 19002 14149 9249 *Retirement (including partial retirement) * - - * * *Own illness or disability * - * * * *Family responsibilities (including maternity
or parental leave) * - - * - -Resignation 15704 * * * * *Other reason 6802 * * * * *
Of which:
Unemployed who have worked before, but they started looking for a job after a period of inactivity 161626 7161 39120 46317 43678 25350
WOMEN 109589 * 26455 36733 32753 9570
Reason for leaving last job Dismissed or made redundant 55451 * 12011 19035 17561 *Employer went out of business or closed
down the business 15643 * * * 7058 *A job of limited duration has ended 15880 * * * * *Retirement (including partial retirement) * - - - - *Own illness or disability * - - * * *Family responsibilities (including maternity
or parental leave) * * * * * -Resignation 8952 * * * * *Other reason 7828 * * * * *
Of which:
Unemployed who have worked before, but they started looking for a job after a period of inactivity 80543 * 18126 26775 25903 7444

200 Labour force in Romania: Employment and unemployment - 2015
Table 2.64. Unemployed who have previously worked by groups of age, gender, urban/rural area and the main the reason for leaving last job
(continued) - persons -
Groups of age
Gender Urban/rural area Reason for leaving last job
Unemployed who who
have previously
worked
Total
15-24 years
25-34 years
35-44 years
45-54 years
55 years and over
URBAN 211512 11027 57015 58445 59039 25987Reason for leaving last job
Dismissed or made redundant 117553 * 27722 33591 36924 15360Employer went out of business or closed
down the business 32661 * 6652 8530 11033 *A job of limited duration has ended 30304 * 12274 7209 * *Retirement (including partial retirement) * - - - * *Own illness or disability * - * * * *Family responsibilities (including maternity
or parental leave) * * * * * -Resignation 16806 * * * * *Other reason 8321 * * * * *
Of which:
Unemployed who have worked before, but they started looking for a job after a period of inactivity 156518 * 40645 43216 44957 21578
RURAL 122380 * 27566 42282 32130 14053
Reason for leaving last job Dismissed or made redundant 52662 * 10381 18237 16224 7160Employer went out of business or closed
down the business 14961 - * * * *A job of limited duration has ended 37852 * 10881 13112 7577 *Retirement (including partial retirement) * - - * - *Own illness or disability * - * * * *Family responsibilities (including maternity
or parental leave) * - * * - -Resignation 7850 * * * * *Other reason * * * * * *
Of which:
Unemployed who have worked before, but they started looking for a job after a period of inactivity 85650 * 16602 29877 24624 11216

Tables 201
Table 2.65. Unemployed who have previously worked by unemployment duration, by gender, urban/rural area and the reason for leaving last job
- persons -
Unemployment duration Gender Urban/rural area
Reason for leaving last job
Unemployed who have previously
worked
Total Less than 1 year 1 year and over
TOTAL 333892 193898 139993Dismissed or made redundant 170215 87319 82896Employer went out of business or closed down
the business 47623 26447 21176A job of limited duration has ended 68156 48446 19709Retirement (including partial retirement) * * *Own illness or disability * * *Family responsibilities (including maternity or
parental leave) * * *Resignation 24656 17312 7345Other reason 14630 9951 *
Of which:
Unemployed who have worked before, but they started looking for a job after a period of inactivity 242168 137672 104497
MEN 224303 132367 91936
Dismissed or made redundant 114764 58516 56247Employer went out of business or closed down
the business 31979 18886 13093A job of limited duration has ended 52276 37211 15065Retirement (including partial retirement) * * *Own illness or disability * * *Family responsibilities (including maternity or
parental leave) * * -Resignation 15704 11517 *Other reason 6802 * *
Of which:
Unemployed who have worked before, but they started looking for a job after a period of inactivity 161626 93377 68249
WOMEN 109589 61531 48058
Dismissed or made redundant 55451 28803 26648Employer went out of business or closed down
the business 15643 7561 8082A job of limited duration has ended 15880 11236 *Retirement (including partial retirement) * - *Own illness or disability * * *Family responsibilities (including maternity or
parental leave) * * *Resignation 8952 * *Other reason 7828 * *
Of which:
Unemployed who have worked before, but they started looking for a job after a period of inactivity 80543 44295 36248

202 Labour force in Romania: Employment and unemployment - 2015
Table 2.65. Unemployed who have previously worked by unemployment duration, by gender, urban/rural area and the reason for leaving last job
(continued) - persons -
Unemployment duration Gender Urban/rural area
Reason for leaving last job
Unemployed who have previously
worked
Total Less than 1 year 1 year and over
URBAN 211512 122576 88936Dismissed or made redundant 117553 62438 55115Employer went out of business or closed down
the business 32661 17601 15060A job of limited duration has ended 30304 21245 9058Retirement (including partial retirement) * * *Own illness or disability * * *Family responsibilities (including maternity or
parental leave) * * *Resignation 16806 12563 *Other reason 8321 * *
Of which:
Unemployed who have worked before, but they started looking for a job after a period of inactivity 156518 92289 64228
RURAL 122380 71323 51057
Dismissed or made redundant 52662 24881 27781Employer went out of business or closed down
the business 14961 8846 *A job of limited duration has ended 37852 27201 10651Retirement (including partial retirement) * * *Own illness or disability * * *Family responsibilities (including maternity or
parental leave) * * *Resignation 7850 * *Other reason * * *
Of which:
Unemployed who have worked before, but they started looking for a job after a period of inactivity 85650 45382 40268

Tables 203
Table 2.66. Unemployed who have previously worked by groups of age, gender, urban/rural area and economic activity of the unit in which person last worked
- persons -
Unemployed who have previously worked 1) Groups of age
Gender Urban/rural area
Economic activity of the unit in which person last worked
Total
of which: unemployed
for 12 months or more
15-24 years
25-34 years
35-44 years
45-54 years
55 years and over
TOTAL 252905 98170 16969 73460 73262 63688 25527Agriculture 28512 6664 * 7446 9729 7396 *Industry and constructions 109531 48139 7385 25515 31632 32099 12901Services 114862 43368 8201 40499 31901 24194 10067
MEN 168985 63644 13038 49156 46661 40460 19671
Agriculture 23875 * * * 8069 * *Industry and constructions 83116 35436 * 20257 24124 21946 10426Services 61994 22665 * 22443 14468 12634 6903
WOMEN 83920 34526 * 24304 26601 23229 *
Agriculture * * * * * * *Industry and constructions 26416 12703 * * 7508 10153 *Services 52868 20703 * 18056 17433 11560 *
URBAN 165037 64811 10620 49678 43512 42688 18539
Agriculture 6879 * * * * * *Industry and constructions 70779 32420 * 15949 17750 22890 10412Services 87378 30446 6505 32593 23455 17402 7423
RURAL 87868 33359 * 23781 29750 21001 6987Agriculture 21633 * * * 7423 * *Industry and constructions 38752 15718 * 9566 13882 9209 *Services 27483 12922 * 7906 8445 6791 *
1) Excluding unemployed who have stopped work at least 8 years ago.

204 Labour force in Romania: Employment and unemployment - 2015
Table 2.67. Unemployed who have previously worked by groups of age, gender, urban/rural area and by ownership type of the unit in which person last worked
- persons -
Unemployed who have previously worked 1) Groups of age Gender
Urban/rural area Ownership type of the unit
in which person last worked
Total
of which:
unemployed for 12
months or more
15-24 years
25-34 years
35-44 years
45-54 years
55 years and over
TOTAL 252905 98170 16969 73460 73262 63688 25527
Public 2) 19429 9575 * * * 6601 *
Private3) 231549 87535 16062 69236 68279 56272 21700
Mixed * * - * * * *
MEN 168985 63644 13038 49156 46661 40460 19671
Public 2) 12358 * * * * * *
Private 3) 155251 57113 12424 46518 43655 35900 16754
Mixed * * - * * * -
WOMEN 83920 34526 * 24304 26601 23229 *
Public 2) 7071 * * * * * *
Private 3) 76297 30422 * 22718 24624 20372 *
Mixed * * - * * * *
URBAN 165037 64811 10620 49678 43512 42688 18539
Public 2) 13574 * * * * * *
Private 3) 150205 58006 9765 46956 40502 37229 15753
Mixed * * - * * * *
RURAL 87868 33359 * 23781 29750 21001 6987
Public 2) * * * * * * *
Private 3) 81344 29528 * 22280 27777 19043 *
Mixed * * - * * * -
1) Excluding unemployed who have stopped work at least 8 years ago. 2) Public includes: “state (public)” and “public of national and local interest”. 3) Private includes: “private”, “co-operative” and “community”..

Tables 205
Table 2.68. Unemployed who have previously worked by groups of age, gender, urban/rural area and occupation at the last job
- persons -
Unemployed who who have previously worked 1) Groups of age
Gender Urban/rural area
Groups of occupation Total
of which: unemployed for 12
months or more
15-24 years
25-34 years
35-44 years
45-54 years
55 years and over
TOTAL 252905 98170 16969 73460 73262 63688 25527Managers * * * * * * *Professionals 13375 * * * * * *Technicians and associate
professionals 12024 * * * * * *Clerical support workers 13069 * * * * * *Service and sales workers 59014 23747 * 20818 17233 11561 *Skilled workers in agriculture,
forestry and fishing 11682 * * * * * *Craft and related trades workers 60323 24332 * 13583 15844 19397 7904Other categories of occupations 80879 31769 6779 21137 25179 20395 7388
of which: Elementary occupations 49478 16969 * 12974 14988 12313 *
MEN 168985 63644 13038 49156 46661 40460 19671Managers * * - * * - *Professionals * * * * * * *Technicians and associate
professionals 6660 * * * * * *Clerical support workers * * * * * * *Service and sales workers 27167 10559 * 9906 6673 * *Skilled workers in agriculture,
forestry and fishing 9379 * * * * * *Craft and related trades workers 50651 19870 * 11176 13095 15559 7380Other categories of occupations 62503 25006 * 18040 18894 14615 *
of which: Elementary occupations 37965 13150 * 10977 10872 8755 *
WOMEN 83920 34526 * 24304 26601 23229 *Managers * * * * * * -Professionals 7951 * * * * * *Technicians and associate
professionals * * * * * * *Clerical support workers 7597 * * * * * *
1) Excluding unemployed who have stopped work at least 8 years ago.

206 Labour force in Romania: Employment and unemployment - 2015
Table 2.68. Unemployed who have previously worked by groups of age, gender, urban/rural area and occupation at the last job
(continued) - persons -
Unemployed who who have previously worked 1) Groups of age
Gender Urban/rural area
Groups of occupation Total
of which: unemployed for 12
months or more
15-24 years
25-34 years
35-44 years
45-54 years
55 years and over
Service and sales workers 31847 13188 * 10911 10560 6929 *Skilled workers in agriculture,
forestry and fishing * * * * * * *Craft and related trades workers 9673 * * * * * *Other categories of occupations 18376 6763 * * * * *
of which: Elementary occupations 11513 * * * * * *
URBAN 165037 64811 10620 49678 43512 42688 18539Managers * * * * * * *Professionals 12108 * * * * * *Technicians and associate
professionals 10139 * * * * * *Clerical support workers 11803 * * * * * *Service and sales workers 42537 15833 * 16258 12263 7174 *Skilled workers in agriculture,
forestry and fishing * * - * * * -Craft and related trades workers 37741 16803 * 7599 9226 13028 *Other categories of occupations 46314 17743 * 12749 11663 12965 *
of which: Elementary occupations 24827 7431 * * * 7339 *
RURAL 87868 33359 * 23781 29750 21001 6987Managers - - - - - - -Professionals * * * * * * -Technicians and associate
professionals * * * * * * -Clerical support workers * * - * * * -Service and sales workers 16478 7914 * * * * *Skilled workers in agriculture,
forestry and fishing 9827 * * * * * *Craft and related trades workers 22582 7529 * * 6618 * *Other categories of occupations 34565 14026 * 8388 13517 7431 *
of which: Elementary occupations 24650 9538 * 6505 9167 * *
1) Excluding unemployed who have stopped work at least 8 years ago.

Tables 207
Table 2.69. Unemployed who have previously worked by groups of age, gender, urban/rural area and status in employment in the last job
- persons -
Unemployed who who have previously worked 1) Groups of age Gender
Urban/rural area Status in employment in the last job
Total
of which: unemployed for 12
months or more
15-24 years
25-34 years
35-44 years
45-54 years
55 years and over
TOTAL 252905 98170 16969 73460 73262 63688 25527Employee 220456 92314 13197 62608 64271 57753 22628Employer * * * * - * *Self-employed 28154 * * 8617 8246 * *Contributing family worker * * * * * * *Member of an agricultural holding
or of a non agricultural cooperative * * - * - - -
MEN 168985 63644 13038 49156 46661 40460 19671
Employee 141987 59017 9684 40107 39149 35808 17239Employer * * - * - - *Self-employed 24361 * * 7522 7126 * *Contributing family worker * * * * * * *Member of an agricultural holding
or of a non agricultural cooperative * * - * - - -
WOMEN 83920 34526 * 24304 26601 23229 *
Employee 78469 33298 * 22501 25122 21944 *Employer * * * * - * -Self-employed * * * * * * *Contributing family worker * * - * * * -Member of an agricultural holding
or of a non agricultural cooperative - - - - - - -
URBAN 165037 64811 10620 49678 43512 42688 18539
Employee 155250 62725 9220 46038 41258 41103 17631Employer * * * * - * *Self-employed 8813 * * * * * *Contributing family worker - - - - - - -Member of an agricultural holding
or of a non agricultural cooperative - - - - - - -
RURAL 87868 33359 * 23781 29750 21001 6987
Employee 65207 29590 * 16570 23013 16650 *Employer * * - * - - -Self-employed 19341 * * * * * *Contributing family worker * * * * * * *Member of an agricultural holding
or of a non agricultural cooperative * * - * - - -
1) Excluding unemployed who have stopped work at least 8 years ago.

208 Labour force in Romania: Employment and unemployment - 2015
Table 2.70. Unemployed who have previously worked as employees and stopped work in the past 3 years, by the reason for leaving the last job, gender, urban/rural area and economic activity of the unit in which person last worked
- persons -
Reason for leaving the last job
Gender Urban/rural area Economic activity of the unit in which person last worked
Unemployed who
have previously
worked as employees
and stopped work in
the past 3 years
Total
Dismissed
or made
redundant
or employer
went out of
business /
closed
down the
business
A job of
limited
duration has
ended
Resignation Other
reason
TOTAL 165865 110974 28425 19811 6654Agriculture 6960 * * * *Industry and constructions 72303 53585 9584 7388 *Services 86602 53763 16012 11975 *
MEN 107263 73550 19456 12237 *
Agriculture * * * * *Industry and constructions 54621 40882 8081 * *Services 46950 29546 9310 7071 *
WOMEN 58602 37424 8969 7574 *
Agriculture * * * - -Industry and constructions 17682 12703 * * *Services 39652 24216 6702 * *
URBAN 118249 82363 17509 13540 *
Agriculture * * * - *Industry and constructions 48060 37739 * * *Services 66900 42498 11764 9009 *
RURAL 47615 28611 10916 * *Agriculture * * * * -Industry and constructions 24243 15846 * * *Services 19702 11265 * * *

Tables 209
Table 2.71. Unemployed by groups of age, gender, urban/rural area and type of job and working programme sought
- persons -
Groups of age Gender Urban/rural area Type of job and working programme sought
Unemployed
Total 15-24 years
25-34 years
35-44 years
45-54 years
55 years and over
TOTAL 623910 148221 181188 140521 110215 43766Type of job and working programme
sought As employee: 540781 134174 155962 116292 94844 39509
- only full-time 172787 35323 53387 38661 31941 13477- only part-time * * * * * *- full-time but could accept a part-time
job as well 310289 85724 85009 66469 52350 20737- part-time but could accept a full-time
job as well 12581 * * * * *- working programme does not matter 40221 9303 11733 7935 7768 *
Own account 83130 14047 25226 24230 15370 *
MEN 394898 85874 118866 86863 70077 33218Type of job and working programme
sought As employee: 339023 77275 101549 70803 59521 29876
- only full-time 109780 21009 34446 23791 19926 10609- only part-time * * * * * *- full-time but could accept a part-time
job as well 195944 50246 55043 40511 33843 16301- part-time but could accept a full-time
job as well * * * * * *- working programme does not matter 24566 * 8519 * * *
Own account 55874 8599 17317 16060 10557 *
WOMEN 229012 62347 62322 53658 40137 10548Type of job and working programme
sought As employee: 201757 56898 54413 45489 35324 9633
- only full-time 63007 14314 18941 14869 12015 *- only part-time * * * * * -- full-time but could accept a part-time
job as well 114345 35478 29966 25958 18507 *- part-time but could accept a full-time
job as well * * * * * *- working programme does not matter 15655 * * * * *
Own account 27255 * 7909 8169 * *

210 Labour force in Romania: Employment and unemployment - 2015
Table 2.71. Unemployed by groups of age, gender, urban/rural area and type of job and working programme sought
(continued) - persons -
Groups of age Gender Urban/rural area Type of job and working programme sought
Unemployed
Total 15-24 years
25-34 years
35-44 years
45-54 years
55 years and over
URBAN 350434 69400 111903 74554 67164 27412Type of job and working programme
sought As employee: 311202 63260 97737 64168 60216 25822
- only full-time 113846 20302 37534 23472 22313 10226- only part-time * * * * * *- full-time but could accept a part-time
job as well 167547 37238 52040 34833 31029 12406- part-time but could accept a full-time
job as well * * * * * *- working programme does not matter 22422 * * * * *
Own account 39232 * 14167 10386 6948 *
RURAL 273477 78820 69284 65968 43051 16354Type of job and working programme
sought As employee: 229579 70914 58225 52124 34628 13687
- only full-time 58942 15021 15853 15189 9628 *- only part-time * * * * - *- full-time but could accept a part-time
job as well 142742 48485 32969 31636 21321 8331- part-time but could accept a full-time
job as well 8486 * * * * *- working programme does not matter 17799 * * * * *
Own account 43898 7907 11059 13844 8422 *

Tables 211
Table 2.72. Unemployed by groups of age, gender, urban/rural area and the reasons that would make them to refuse a job
- persons -
Groups of age Gender Urban/rural area Reasons to refuse a job
Unemployed
Total 15-24 years
25-34 years
35-44 years
45-54 years
55 years and over
TOTAL 623910 148221 181188 140521 110215 43766None 105627 30959 25826 23722 17574 7547One reason 121460 28021 34580 27356 22399 9103
Change of residence 29790 * 9004 * * *Distance from home 16608 * * * * *Commuting * * * * * *Require lower qualification * * * * * *Require requalification * * - * * -No formal working contract 32059 9235 9001 7113 * *Low wage 15518 * * * * *Inadequate labour relations * * * * * *Unfavorable working conditions 14921 * * * * *Other reason * * * * - *
Several reasons 396824 89241 120782 89444 70241 27116
MEN 394898 85874 118866 86863 70077 33218None 74639 19630 19323 15960 13254 *One reason 82139 18504 22982 18839 15159 6655
Change of residence 18959 * * * * *Distance from home 12393 * * * * *Commuting * * * * * *Require lower qualification * * * * * *Require requalification * * - * * -No formal working contract 20438 * * * * *Low wage 11937 * * * * *Inadequate labour relations * * * * * *Unfavorable working conditions 9608 * * * * *Other reason * * * * - *
Several reasons 238120 47740 76562 52064 41665 20089
WOMEN 229012 62347 62322 53658 40137 10548None 30988 11329 6503 7762 * *One reason 39321 9517 11598 8517 7240 *
Change of residence 10830 * * * * *Distance from home * * * * * *Commuting * * * * * -Require lower qualification * * * * * -Require requalification * - - * - -No formal working contract 11621 * * * * *Low wage * * * * * *Inadequate labour relations * * * * * -Unfavorable working conditions * * * * * *Other reason - - - - - -
Several reasons 158704 41501 44220 37379 28577 7027

212 Labour force in Romania: Employment and unemployment - 2015
Table 2.72. Unemployed by groups of age, gender, urban/rural area and the reasons that would make them to refuse a job
(continued) - persons -
Groups of age Gender Urban/rural area
Reasons to refuse a job
Unemployed
Total 15-24 years
25-34 years
35-44 years
45-54 years
55 years and over
URBAN 350434 69400 111903 74554 67164 27412None 43216 9899 11935 8189 8947 *One reason 59064 11815 18769 12752 11182 *
Change of residence 16572 * * * * *Distance from home * * * * * *Commuting * * * * * *Require lower qualification * * * - * *Require requalification * * - * * -No formal working contract 17988 * * * * *Low wage 7111 * * * * *Inadequate labour relations * * * * * *Unfavorable working conditions * * * * * *Other reason * * * - - *
Several reasons 248153 47686 81199 53613 47036 18620
RURAL 273477 78820 69284 65968 43051 16354None 62410 21060 13891 15532 8627 *One reason 62395 16206 15811 14605 11218 *
Change of residence 13218 * * * * *Distance from home 10776 * * * * *Commuting * * * * * *Require lower qualification * * * * * -Require requalification * * - * * -No formal working contract 14072 * * * * *Low wage 8408 * * * * *Inadequate labour relations * * * * * -Unfavorable working conditions 8623 * * * * *Other reason * - * * - *
Several reasons 148671 41555 39583 35831 23206 8496
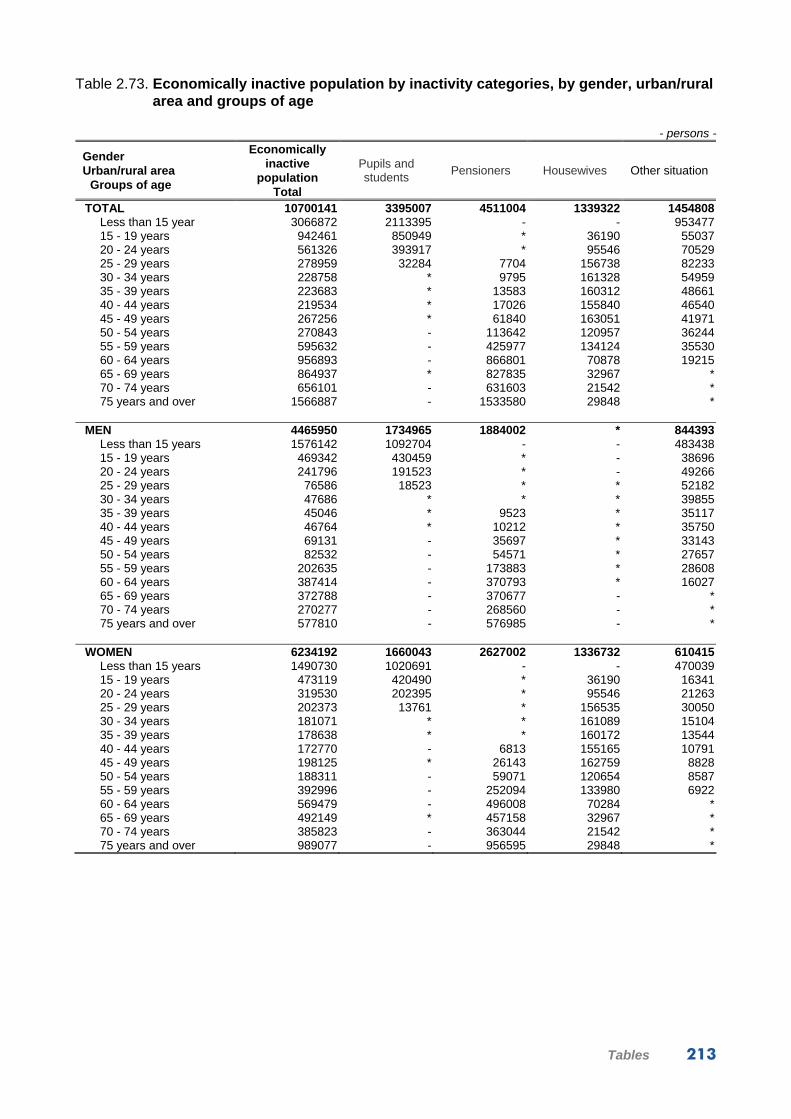
Tables 213
Table 2.73. Economically inactive population by inactivity categories, by gender, urban/rural area and groups of age
- persons -
Gender Urban/rural area
Groups of age
Economically inactive
population Total
Pupils and students
Pensioners Housewives Other situation
TOTAL 10700141 3395007 4511004 1339322 1454808Less than 15 year 3066872 2113395 - - 95347715 - 19 years 942461 850949 * 36190 5503720 - 24 years 561326 393917 * 95546 7052925 - 29 years 278959 32284 7704 156738 8223330 - 34 years 228758 * 9795 161328 5495935 - 39 years 223683 * 13583 160312 4866140 - 44 years 219534 * 17026 155840 4654045 - 49 years 267256 * 61840 163051 4197150 - 54 years 270843 - 113642 120957 3624455 - 59 years 595632 - 425977 134124 3553060 - 64 years 956893 - 866801 70878 1921565 - 69 years 864937 * 827835 32967 *70 - 74 years 656101 - 631603 21542 *75 years and over 1566887 - 1533580 29848 *
MEN 4465950 1734965 1884002 * 844393
Less than 15 years 1576142 1092704 - - 48343815 - 19 years 469342 430459 * - 3869620 - 24 years 241796 191523 * - 4926625 - 29 years 76586 18523 * * 5218230 - 34 years 47686 * * * 3985535 - 39 years 45046 * 9523 * 3511740 - 44 years 46764 * 10212 * 3575045 - 49 years 69131 - 35697 * 3314350 - 54 years 82532 - 54571 * 2765755 - 59 years 202635 - 173883 * 2860860 - 64 years 387414 - 370793 * 1602765 - 69 years 372788 - 370677 - *70 - 74 years 270277 - 268560 - *75 years and over 577810 - 576985 - *
WOMEN 6234192 1660043 2627002 1336732 610415
Less than 15 years 1490730 1020691 - - 47003915 - 19 years 473119 420490 * 36190 1634120 - 24 years 319530 202395 * 95546 2126325 - 29 years 202373 13761 * 156535 3005030 - 34 years 181071 * * 161089 1510435 - 39 years 178638 * * 160172 1354440 - 44 years 172770 - 6813 155165 1079145 - 49 years 198125 * 26143 162759 882850 - 54 years 188311 - 59071 120654 858755 - 59 years 392996 - 252094 133980 692260 - 64 years 569479 - 496008 70284 *65 - 69 years 492149 * 457158 32967 *70 - 74 years 385823 - 363044 21542 *75 years and over 989077 - 956595 29848 *

214 Labour force in Romania: Employment and unemployment - 2015
Table 2.73. Economically inactive population by inactivity categories, by gender, urban/rural area and groups of age
(continued) - persons -
Gender Urban/rural area
Groups of age
Economically inactive
population Total
Pupils and students
Pensioners Housewives Other situation
URBAN 5679825 1757342 2551650 608165 762669Less than 15 years 1532079 1000515 - - 53156415 - 19 years 470779 444385 * 10790 1550720 - 24 years 357441 283564 * 38040 3482525 - 29 years 142857 25244 * 68804 4554430 - 34 years 110038 * * 77147 2567535 - 39 years 104260 * 7978 71344 2431340 - 44 years 96260 * 8084 67828 2022045 - 49 years 141959 * 37477 82927 2116150 - 54 years 154277 - 75072 61553 1765255 - 59 years 378599 - 297521 63764 1731460 - 64 years 629614 - 591106 31683 682465 - 69 years 518657 * 503764 13924 *70 - 74 years 358559 - 348514 9220 *75 years and over 684447 - 672894 11139 *
RURAL 5020316 1637666 1959354 731157 692139
Less than 15 years 1534793 1112879 - - 42191415 - 19 years 471682 406564 * 25400 3953120 - 24 years 203885 110353 * 57505 3570425 - 29 years 136102 7040 * 87934 3668830 - 34 years 118720 * * 84181 2928535 - 39 years 119423 * * 88968 2434840 - 44 years 123274 - 8942 88012 2632045 - 49 years 125296 - 24363 80124 2080950 - 54 years 116566 - 38571 59403 1859255 - 59 years 217032 - 128456 70360 1821660 - 64 years 327280 - 275695 39194 1239065 - 69 years 346281 - 324071 19043 *70 - 74 years 297541 - 283089 12322 *75 years and over 882440 - 860686 18709 *

Tables 215
Table 2.74. Economically inactive population aged 15 years and over by groups of age, gender, urban/rural area and level of education
- persons -
Groups of age
Gender Urban/rural area
Level of education
Economically
inactive
population
aged 15 years
and over
Total
15-24 years
25-34 years
35-44 years
45-54 years
55 – 64 years
65
years
and
over
TOTAL 7633269 1503787 507716 443217 538099 1552525 3087925Superior 399141 29729 51876 21406 19740 98097 178294Medium 3016257 552794 239219 229852 336671 871407 786315
Post high-school of speciality or technical foremen 205660 * 9579 * 6550 73791 106771
High-school 1825995 538228 186585 162980 223340 385558 329304Vocational complementary or of
apprentice 984602 10581 43055 61889 106780 412058 350239Low 4217871 921264 216621 191960 181689 583021 2123317
Gymnasium 2867545 808127 150411 139810 134561 488347 1146287Primary 1165748 96730 43676 33816 32825 79448 879252No education 184578 16407 22534 18333 14302 15225 97777
MEN 2889808 711138 124272 91810 151663 590049 1220875Superior 179435 12211 13659 * 7902 44568 98698Medium 1237951 248673 54303 46160 96545 386944 405326
Post high-school of speciality or technical foremen 112251 * * * * 42684 62685
High-school 600446 242863 40418 24498 49506 124578 118583Vocational complementary or of
apprentice 525254 * 13203 20451 42842 219683 224058Low 1472421 450254 56310 43254 47215 158537 716851
Gymnasium 1074753 398806 32957 29413 33463 131037 449078Primary 347982 44820 12827 8797 9070 21941 250528No education 49686 6628 10526 * * * 17245
WOMEN 4743462 792649 383444 351407 386436 962475 1867050Superior 219706 17518 38217 19010 11837 53529 79595Medium 1778306 304121 184916 183692 240125 484463 380988
Post high-school of speciality or technical foremen 93409 * 8897 * * 31107 44087
High-school 1225549 295365 146167 138481 173834 260980 210721Vocational complementary or of
apprentice 459348 * 29852 41438 63939 192375 126181Low 2745450 471010 160311 148705 134473 424484 1406466
Gymnasium 1792792 409322 117454 110398 101098 357311 697209Primary 817766 51910 30849 25019 23756 57507 628724No education 134892 9778 12008 13289 9619 9666 80532

216 Labour force in Romania: Employment and unemployment - 2015
Table 2.74. Economically inactive population aged 15 years and over by groups of age, gender, urban/rural area and level of education
(continued) - persons -
Groups of age
Gender Urban/rural area
Level of education
Economically
inactive
population
aged 15 years
and over
Total
15-24 years
25-34 years
35-44 years
45-54 years
55 – 64 years
65
years
and
over
URBAN 4147746 828220 252894 200520 296237 1008213 1561663Superior 341982 21804 41589 16169 16604 86052 159765Medium 2092319 367955 135650 118270 204629 646106 619710
Post high-school of speciality or technical foremen 168905 * * * * 64714 87664
High-school 1270969 362057 111205 87462 141045 299184 270017Vocational complementary or of
apprentice 652445 * 18328 27160 58788 282208 262029Low 1713445 438461 75656 66081 75004 276055 782188
Gymnasium 1317925 390248 46396 44645 51684 242769 542183Primary 332270 40273 17578 13974 16301 27419 216725No education 63250 7939 11682 7461 7019 * 23280
RURAL 3485523 675567 254822 242698 241862 544312 1526262Superior 57159 7925 10287 * * 12045 18529Medium 923938 184839 103569 111582 132042 225301 166605
Post high-school of speciality or technical foremen 36755 * * * * 9077 19107
High-school 555026 176171 75380 75518 82295 86374 59287Vocational complementary or of
apprentice 332157 6649 24727 34729 47992 129850 88210Low 2504426 482803 140965 125879 106684 306966 1341128
Gymnasium 1549620 417879 104016 95165 82878 245578 604104Primary 833478 56457 26099 19842 16524 52030 662527No education 121328 8467 10851 10872 7282 9358 74497

Tables 217
Table 2.75. Economically inactive population aged 15 years and over by groups of age, gender, urban/rural area by participation in formal education
- persons -
Groups of age
Gender Urban/rural area
Level of education
Economically inactive
population aged 15 years
and over
Total
15-24 years
25-34 years
35-44 years
45-54 years
55 years and over
TOTAL 7633269 1503787 507716 443217 538099 4640450Higher (including short-term university,
master, PHD and post university) 464059 430371 32440 * * *Medium and low 817554 814495 * * * -None 6351656 258921 472757 441962 537704 4640312
MEN 2889808 711138 124272 91810 151663 1810924
Higher (including short-term university, master, PHD and post university) 228934 209187 19354 * - -
Medium and low 413326 412795 * - - -None 2247547 89156 104387 91417 151663 1810924
WOMEN 4743462 792649 383444 351407 386436 2829525
Higher (including short-term university, master, PHD and post university) 235124 221184 13086 * * *
Medium and low 404228 401700 * * * -None 4104110 169765 368370 350546 386042 2829387
URBAN 4147746 828220 252894 200520 296237 2569876
Higher (including short-term university, master, PHD and post university) 335230 308105 26116 * * *
Medium and low 421596 419844 * * * -None 3390920 100271 225302 199767 295842 2569738
RURAL 3485523 675567 254822 242698 241862 2070574
Higher (including short-term university, master, PHD and post university) 128829 122267 * * - -
Medium and low 395958 394651 * * - -None 2960736 158650 247455 242195 241862 2070574

218 Labour force in Romania: Employment and unemployment - 2015
Table 2.76. Economically inactive population aged 15 years and over, who have previously worked, by groups of age, gender, urban/rural area by reason for leaving the last job
- persons -
Groups of age
Gender Urban/rural area
Reason for leaving the last job
Economically inactive
persons aged 15 years and
over who have previously
worked
Total
15-24 years
25-34 years
35-44 years
45-54 years
55 years and over
TOTAL 4720673 19286 118734 169305 316790 4096558Dismissed or made redundant 185151 * 17264 38530 57981 69750Employer went out of business
or closed down the business 197077 * 9002 18812 38001 130652A job of limited duration has
ended 132450 6799 31001 34164 29081 31406Retirement or early retirement
(including partial retirement) 3439374 - * * 47831 3389412Own illness or disability 578174 * * 21627 109029 442312Family responsibilities (including
maternity or parental leave) 144218 * 43328 43666 26639 25687Resignation 27658 * 8487 8058 * *Other reason 16571 * * * * *
MEN 1945723 7354 35728 56878 126697 1719065
Dismissed or made redundant 68317 * * 14747 17244 30069Employer went out of business
or closed down the business 50048 * * * 10802 33452A job of limited duration has
ended 65976 * 16992 17303 12790 14741Retirement or early retirement
(including partial retirement) 1463088 - * * 30113 1431554Own illness or disability 272560 * * 13652 50763 204376Family responsibilities (including
maternity or parental leave) 6736 * * * * *Resignation 9701 * * * * *Other reason 9297 * * * * *
WOMEN 2774950 11932 83006 112427 190093 2377493
Dismissed or made redundant 116834 * 11377 23783 40736 39681Employer went out of business
or closed down the business 147030 * 7643 14430 27199 97200A job of limited duration has
ended 66474 * 14010 16861 16291 16666Retirement or early retirement
(including partial retirement) 1976286 - - * 17718 1957859Own illness or disability 305614 - * 7975 58266 237936Family responsibilities (including
maternity or parental leave) 137481 * 41862 42425 24579 23776Resignation 17957 * * * * *Other reason 7274 * * * * *
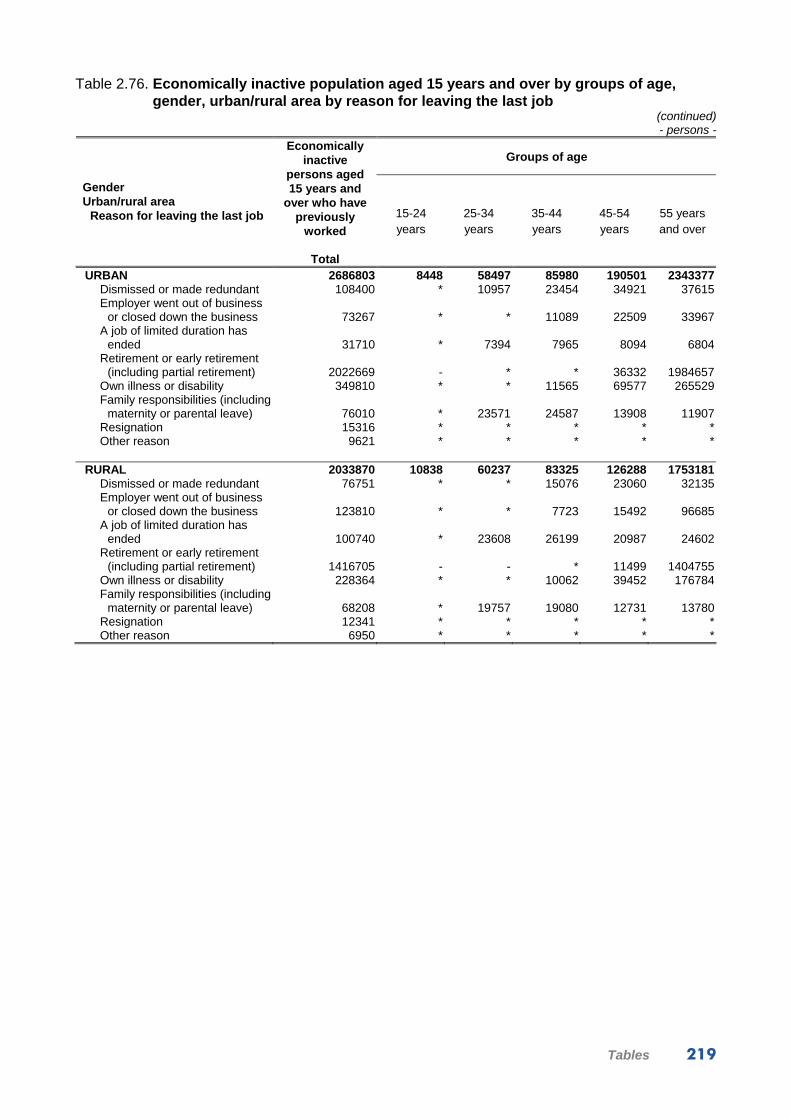
Tables 219
Table 2.76. Economically inactive population aged 15 years and over by groups of age, gender, urban/rural area by reason for leaving the last job
(continued) - persons -
Groups of age
Gender Urban/rural area
Reason for leaving the last job
Economically inactive
persons aged 15 years and
over who have previously
worked
Total
15-24 years
25-34 years
35-44 years
45-54 years
55 years and over
URBAN 2686803 8448 58497 85980 190501 2343377Dismissed or made redundant 108400 * 10957 23454 34921 37615Employer went out of business
or closed down the business 73267 * * 11089 22509 33967A job of limited duration has
ended 31710 * 7394 7965 8094 6804Retirement or early retirement
(including partial retirement) 2022669 - * * 36332 1984657Own illness or disability 349810 * * 11565 69577 265529Family responsibilities (including
maternity or parental leave) 76010 * 23571 24587 13908 11907Resignation 15316 * * * * *Other reason 9621 * * * * *
RURAL 2033870 10838 60237 83325 126288 1753181
Dismissed or made redundant 76751 * * 15076 23060 32135Employer went out of business
or closed down the business 123810 * * 7723 15492 96685A job of limited duration has
ended 100740 * 23608 26199 20987 24602Retirement or early retirement
(including partial retirement) 1416705 - - * 11499 1404755Own illness or disability 228364 * * 10062 39452 176784Family responsibilities (including
maternity or parental leave) 68208 * 19757 19080 12731 13780Resignation 12341 * * * * *Other reason 6950 * * * * *

220 Labour force in Romania: Employment and unemployment - 2015
Table 2.77. Economically inactive population aged 15 years and over by level of attachment to the labour market, gender, urban/rural area, work experience and groups of age
- persons - Potential additional labour force
Gender Urban/rural area
Work experience Groups of age
Economically inactive
population aged 15 years
and over
Total
Inactive persons not seeking work and not
available to work1)
Inactive persons not seeking work but
available to work 1)
Inactive persons seeking work but not available to work 1)
TOTAL 7633269 7272178 356685 *Persons who have never worked 2912596 2715193 196254 *
15-24 years 1484501 1404340 79407 *25-34 years 388982 330821 58007 *35-44 years 273912 238389 35376 *45-54 years 221309 202921 18387 -55-64 years 224286 219219 * *65 years and over 319606 319502 * -
Persons who have previously worked 4720673 4556985 160431 *
15-24 years 19286 13089 * *25-34 years 118734 87661 30174 *35-44 years 169305 122400 45850 *45-54 years 316790 269594 46468 *55-64 years 1328239 1296804 31055 *65 years and over 2768319 2767437 * -
MEN 2889808 2727193 159815 *Persons who have never worked 944085 865174 78404 *
15-24 years 703784 660143 43339 *25-34 years 88544 67814 20620 *35-44 years 34932 27651 7281 -45-54 years 24965 19655 * -55-64 years 38948 36999 * *65 years and over 52912 52912 - -
Persons who who have previously worked 1945723 1862019 81411 *
15-24 years 7354 * * *25-34 years 35728 18619 16573 *35-44 years 56878 34491 21572 *45-54 years 126697 105054 21106 *55-64 years 551102 533380 17511 *65 years and over 1167964 1167224 * -
WOMEN 4743462 4544985 196870 *Persons who have never worked 1968511 1850019 117850 *
15-24 years 780717 744198 36068 *25-34 years 300438 263007 37388 *35-44 years 238980 210738 28095 *45-54 years 196343 183266 13077 -55-64 years 185338 182220 * -65 years and over 266695 266591 * -
Persons who have previously worked 2774950 2694966 79020 *
15-24 years 11932 9839 * -25-34 years 83006 69042 13601 *35-44 years 112427 87909 24278 *45-54 years 190093 164540 25362 *55-64 years 777137 763424 13543 *65 years and over 1600355 1600213 * -
1) Availability to start work refers to the following two weeks (including the week when the interview took place).

Tables 221
Table 2.77. Economically inactive population aged 15 years and over by level of attachment to the labour market, gender, urban/rural area, working experience and groups of age
(continued) - persons -
Potential additional labour force
Gender Urban/rural area
Working experience Groups of age
Economically inactive
population aged 15 years
and over
Total
Inactive persons not seeking work and not
available to work1)
Inactive persons not seeking work but
available to work 1)
Inactive persons seeking work but not available to work 1)
URBAN 4147746 3984015 161086 *Persons who have never worked 1460943 1377515 82974 *
15-24 years 819772 786509 32809 *25-34 years 194397 167567 26831 -35-44 years 114540 101498 13042 -45-54 years 105735 97426 8310 -55-64 years 99840 97858 * -65 years and over 126658 126658 - -
Persons who have previously worked 2686803 2606499 78112 *
15-24 years 8448 * * *25-34 years 58497 46777 11144 *35-44 years 85980 62780 22429 *45-54 years 190501 166064 23884 *55-64 years 908373 890844 17432 *65 years and over 1435005 1434469 * -
RURAL 3485523 3288163 195599 *Persons who have never worked 1451653 1337678 113280 *
15-24 years 664729 617831 46598 *25-34 years 194585 163254 31177 *35-44 years 159372 136892 22334 *45-54 years 115574 105496 10078 -55-64 years 124445 121361 * *65 years and over 192948 192844 * -
Persons who have previously worked 2033870 1950485 82319 *
15-24 years 10838 7524 * -25-34 years 60237 40884 19030 *35-44 years 83325 59620 23421 *45-54 years 126288 103530 22584 *55-64 years 419867 405960 13623 *65 years and over 1333314 1332967 * -
1) Availability to start work refers to the following two weeks (including the week when the interview took place).

222 Labour force in Romania: Employment and unemployment - 2015
Table 2.78. Potential additional labour force by gender, urban/rural area and inactivity category
- persons -
Gender Urban/rural area
Inactivity categories
Potential additional
labour force
Total
Inactive persons not
seeking work but
available to work 1)
Inactive persons
seeking work but not
available to work 1)
TOTAL 361092 356685 *Pupils and students 14863 14776 *Pensioners 9812 9812 -Housewives 151173 150619 *Other situation 185243 181478 *
MEN 162615 159815 *Pupils and students 7881 7881 -Pensioners 6518 6518 -Housewives * * -Other situation 147641 144841 *
WOMEN 198477 196870 *Pupils and students 6983 6895 *Pensioners * * -Housewives 150598 150044 *Other situation 37602 36637 *
URBAN 163732 161086 *Pupils and students 9622 9622 -Pensioners * * -Housewives 67689 67311 *Other situation 80724 78456 *
RURAL 197360 195599 *Pupils and students * * *Pensioners * * -Housewives 83484 83308 *Other situation 104519 103022 *
1) Availability to start work refers to the following two weeks (including the week when the interview took place).

Tables 223
Table 2.79. Inactive persons not seeking work but available to work by groups of age, gender, urban/rural area and the reasons that would make them to refuse a job
- persons -
Groups of age Gender Urban/rural area Reasons to refuse a job
Inactive persons not seeking work but
available to work 1)
Total
15-24 years
25-34 years
35-44 years
45-54 years
55 years and over
TOTAL 356685 85409 88182 81226 64856 37013None 53499 15942 12793 10952 9650 *One reason 86734 21645 22946 18480 14112 9552
Change of residence 20874 * * * * *Distance from home 15176 * * * * *Commuting * * * * * *Require lower qualification * * * * * *Require requalification * * * - * -No formal working contract 21041 6762 * * * *Low wage 9527 * * * * *Inadequate labour relations * * * * * -Unfavorable working conditions 8204 * * * * *Other reason * * * * * *
Several reasons 216452 47822 52443 51793 41094 23300
MEN 159815 47248 37192 28853 26416 20106None 31756 10565 6562 * * *One reason 39820 12771 9806 6650 * *
Change of residence 9113 * * * * *Distance from home * * * * * *Commuting * * * * * *Require lower qualification * * * * * *Require requalification * * - - * -No formal working contract 10296 * * * * *Low wage * * * * * *Inadequate labour relations * * * - - -Unfavorable working conditions * * * * * *Other reason * * - - * *
Several reasons 88239 23913 20824 16139 14940 12423
WOMEN 196870 38161 50989 52373 38440 16908None 21743 * * * * *One reason 46914 8874 13139 11830 8730 *
Change of residence 11761 * * * * *Distance from home 9215 * * * * *Commuting * * * * * *Require lower qualification * * * * * *Require requalification * * * - - -No formal working contract 10745 * * * * *Low wage * * * * * *Inadequate labour relations * * * * * -Unfavorable working conditions * * * * * *Other reason * * * * - *
Several reasons 128213 23909 31619 35654 26155 10877
1) Availability to start work refers to the following two weeks (including the week when the interview took place).

224 Labour force in Romania: Employment and unemployment - 2015
Table 2.79. Inactive persons not seeking work but available to work by groups of age, gender, urban/rural area and the reasons that would make them to refuse a job
(continued) - persons -
Groups of age Gender Urban/rural area
Reasons to refuse a job
Inactive persons not seeking work but
available to work 1)
Total
15-24 years
25-34 years
35-44 years
45-54 years
55 years and over
URBAN 161086 35497 37975 35471 32194 19950None 15266 * * * * *One reason 31596 6598 8364 7161 * *
Change of residence 8922 * * * * *Distance from home * * * * * *Commuting * * * * * -Require lower qualification * * * * * *Require requalification * * - - - -No formal working contract 10614 * * * * *Low wage * * * * * *Inadequate labour relations * * * * * -Unfavorable working conditions * * * * * *Other reason * * * - * *
Several reasons 114224 24244 25712 26015 23530 14723
RURAL 195599 49912 50207 45755 32662 17063None 38233 11288 8894 8657 6725 *One reason 55138 15046 14582 11319 8373 *
Change of residence 11952 * * * * *Distance from home 12311 * * * * *Commuting * * * * * *Require lower qualification * * * * * *Require requalification * * * - * -No formal working contract 10427 * * * * *Low wage * * * * * *Inadequate labour relations * * * * * -Unfavorable working conditions * * * * * *Other reason * * * * - *
Several reasons 102228 23578 26731 25778 17564 8577
1) Availability to start work refers to the following two weeks (including the week when the interview took place).

Tables 225
Table 2.80. Discouraged persons in finding any job, by gender, urban/rural area, discouragement reasons and groups of age
- persons -
Gender Urban/rural area
Discouragement reason Groups of age
Discouraged persons
Total
Men Women Urban Rural
TOTAL 187158 97291 89866 84161 102997
Economically inactive persons available to start working, who: Are seeking for a job, but took no further
steps to this aim * * * * *Are not seeking for a job because:
- they think there are no free jobs or do not know where to look for 33785 22681 11105 * 29184
- they do not feel like being skilled 13297 8365 * * 8620- they have looked for a job some other time,
but didn’t find any 138577 65119 73458 74152 64425
Groups of age 15-24 years 38061 23237 14824 14697 2336325-34 years 50801 27130 23671 21833 2896835-44 years 48625 21431 27194 23536 2508945-54 years 34691 15717 18974 16561 1813055 years and over 14980 9776 * 7533 7447

226 Labour force in Romania: Employment and unemployment - 2015
Table 2.81. Population by labour status, macroregions, regions, gender, urban/rural area and groups of age
Economically active persons Total population Total Employed
Unem-ployed
Economically inactive persons
Activity rate1)
Employ-ment rate 2)
Unem-ployment
rate 3)
Macroregions Regions Gender Urban/rural area
Groups of age - persons - - percentages -
TOTAL15 years and over 16792565 9159296 8535386 623910 7633269 54.5 50.8 6.8 young (15-24 years) 2188074 684286 536066 148221 1503787 31.3 24.5 21.7 working age population (15-64 years) 13403521 8858177 8234803 623375 4545344 66.1 61.4 7.0 elderly (55-64 years) 2709167 1156643 1113412 43230 1552525 42.7 41.1 3.7
MEN 15 years and over 8133053 5243245 4848347 394898 2889808 64.5 59.6 7.5 young (15-24 years) 1128647 417508 331634 85874 711138 37.0 29.4 20.6 working age population (15-64 years) 6767861 5098929 4704237 394691 1668933 75.3 69.5 7.7 elderly (55-64 years) 1277366 687316 654305 33011 590049 53.8 51.2 4.8
WOMEN 15 years and over 8659513 3916051 3687038 229012 4743462 45.2 42.6 5.8 young (15-24 years) 1059427 266778 204431 62347 792649 25.2 19.3 23.4 working age population (15-64 years) 6635661 3759249 3530564 228683 2876412 56.7 53.2 6.1 elderly (55-64 years) 1431802 469327 459107 10220 962475 32.8 32.1 2.2
URBAN 15 years and over 9160672 5012926 4662492 350434 4147746 54.7 50.9 7.0 young (15-24 years) 1086235 258015 188615 69400 828220 23.8 17.4 26.9 working age population (15-64 years) 7578423 4992341 4642167 350174 2586083 65.9 61.3 7.0 elderly (55-64 years) 1595911 587698 560546 27152 1008213 36.8 35.1 4.6
RURAL 15 years and over 7631893 4146370 3872894 273477 3485523 54.3 50.7 6.6 young (15-24 years) 1101839 426271 347451 78820 675567 38.7 31.5 18.5 working age population (15-64 years) 5825098 3865837 3592636 273202 1959261 66.4 61.7 7.1 elderly (55-64 years) 1113256 568945 552866 16078 544312 51.1 49.7 2.8
1.MACROREGION ONE15 years and over 4149689 2179926 2052039 127886 1969763 52.5 49.5 5.9 young (15-24 years) 556647 144847 111427 33420 411800 26.0 20.0 23.1 working age population (15-64 years) 3351321 2146705 2018818 127886 1204616 64.1 60.2 6.0 elderly (55-64 years) 670983 259461 253268 * 411522 38.7 37.7 2.4
MEN 15 years and over 2013747 1251936 1175611 76325 761811 62.2 58.4 6.1 young (15-24 years) 285514 87637 71100 16536 197877 30.7 24.9 18.9 working age population (15-64 years) 1689633 1235467 1159142 76325 454166 73.1 68.6 6.2 elderly (55-64 years) 316124 161820 156980 * 154304 51.2 49.7 3.0
1) Share of economically active population from the groups of age x in total population of the same group of age x.2) Share of employment from the groups of age x in total population of the same group of age x.3) Share of unemployed from the groups of age x in total economically active population of the same group of age x.

Tables 227
Table 2.81. Population by labour status, macroregions, regions, gender, urban/rural area and groups of age
(continued)
Economically active persons Total population Total Employed
Unem-ployed
Economically inactive persons
Activity rate 1)
Employ-ment rate 2)
Unem-ployment
rate 3)
Macroregions Regions Gender Urban/rural area
Groups of age - persons - - percentages -
WOMEN 15 years and over 2135942 927989 876428 51561 1207953 43.4 41.0 5.6 young (15-24 years) 271133 57210 40326 16884 213922 21.1 14.9 29.5 working age population (15-64 years) 1661687 911236 859675 51561 750451 54.8 51.7 5.7 elderly (55-64 years) 354859 97641 96288 * 257218 27.5 27.1 1.4
URBAN
15 years and over 2319930 1286658 1215529 71129 1033271 55.5 52.4 5.5 young (15-24 years) 291099 62940 46968 15972 228159 21.6 16.1 25.4 working age population (15-64 years) 1919515 1283189 1212060 71129 636325 66.8 63.1 5.5 elderly (55-64 years) 403681 157690 154206 * 245991 39.1 38.2 2.2
RURAL
15 years and over 1829759 893267 836510 56757 936492 48.8 45.7 6.4 young (15-24 years) 265548 81907 64459 17448 183641 30.8 24.3 21.3 working age population (15-64 years) 1431806 863514 806757 56757 568292 60.3 56.3 6.6 elderly (55-64 years) 267302 101771 99062 * 165531 38.1 37.1 2.7
1.1.NORTH-WEST
15 years and over 2180081 1204487 1148516 55971 975593 55.2 52.7 4.6 young (15-24 years) 301364 79485 64653 14833 221878 26.4 21.5 18.7 working age population (15-64 years) 1766919 1176385 1120414 55971 590533 66.6 63.4 4.8 elderly (55-64 years) 341990 142538 140447 * 199451 41.7 41.1 1.5
MEN
15 years and over 1054809 680034 647672 32363 374774 64.5 61.4 4.8 young (15-24 years) 153651 47332 40762 6571 106319 30.8 26.5 13.9 working age population (15-64 years) 888643 666268 633906 32363 222374 75.0 71.3 4.9 elderly (55-64 years) 160392 87480 85775 * 72912 54.5 53.5 1.9
WOMEN
15 years and over 1125272 524453 500845 23608 600819 46.6 44.5 4.5 young (15-24 years) 147713 32153 23891 8262 115559 21.8 16.2 25.7 working age population (15-64 years) 878276 510117 486509 23608 368159 58.1 55.4 4.6 elderly (55-64 years) 181598 55058 54672 * 126540 30.3 30.1 0.7
URBAN
15 years and over 1163441 667857 636308 31548 495584 57.4 54.7 4.7 young (15-24 years) 154895 31204 23387 7816 123691 20.1 15.1 25.0 working age population (15-64 years) 976896 666111 634562 31548 310785 68.2 65.0 4.7 elderly (55-64 years) 193991 78592 77677 * 115398 40.5 40.0 1.2
RURAL
15 years and over 1016641 536630 512208 24422 480011 52.8 50.4 4.6 young (15-24 years) 146469 48282 41265 7016 98187 33.0 28.2 14.5 working age population (15-64 years) 790024 510274 485852 24422 279750 64.6 61.5 4.8 elderly (55-64 years) 147999 63946 62770 * 84053 43.2 42.4 1.8
1) Share of economically active population from the groups of age x in total population of the same group of age x. 2) Share of employment from the groups of age x in total population of the same group of age x. 3) Share of unemployed from the groups of age x in total economically active population of the same group of age x.

228 Labour force in Romania: Employment and unemployment - 2015
Table 2.81. Population by labour status, macroregions, regions, gender, urban/rural area and groups of age
(continued)
Economically active persons Total population Total Employed
Unem-ployed
Economically inactive persons
Activity rate 1)
Employ-ment rate 2)
Unem-ployment
rate 3)
Macroregions Regions Gender Urban/rural area
Groups of age - persons - - percentages -
1.2.CENTER 15 years and over 1969607 975438 903523 71916 994169 49.5 45.9 7.4 young (15-24 years) 255283 65361 46774 18588 189922 25.6 18.3 28.4 working age population (15-64 years) 1584401 970319 898404 71916 614082 61.2 56.7 7.4 elderly (55-64 years) 328993 116923 112821 * 212071 35.5 34.3 3.5
MEN
15 years and over 958937 571902 527939 43963 387035 59.6 55.1 7.7 young (15-24 years) 131863 40304 30339 9966 91559 30.6 23.0 24.7 working age population (15-64 years) 800990 569199 525236 43963 231790 71.1 65.6 7.7 elderly (55-64 years) 155732 74340 71205 * 81392 47.7 45.7 4.2
WOMEN
15 years and over 1010670 403536 375583 27953 607134 39.9 37.2 6.9 young (15-24 years) 123420 25057 16435 8622 98363 20.3 13.3 34.4 working age population (15-64 years) 783412 401120 373167 27953 382292 51.2 47.6 7.0 elderly (55-64 years) 173261 42583 41616 * 130679 24.6 24.0 2.3
URBAN
15 years and over 1156489 618801 579221 39581 537688 53.5 50.1 6.4 young (15-24 years) 136204 31736 23580 8155 104468 23.3 17.3 25.7 working age population (15-64 years) 942619 617078 577498 39581 325541 65.5 61.3 6.4 elderly (55-64 years) 209690 79098 76529 * 130593 37.7 36.5 3.2
RURAL
15 years and over 813119 356637 324302 32335 456481 43.9 39.9 9.1 young (15-24 years) 119079 33626 23193 10432 85453 28.2 19.5 31.0 working age population (15-64 years) 641783 353240 320905 32335 288542 55.0 50.0 9.2 elderly (55-64 years) 119303 37825 36291 * 81478 31.7 30.4 4.1
2. MACROREGION TWO 15 years and over 4788078 2748002 2589971 158032 2040075 57.4 54.1 5.8 young (15-24 years) 675435 246031 206514 39517 429405 36.4 30.6 16.1 working age population (15-64 years) 3796921 2605833 2448110 157724 1191087 68.6 64.5 6.1 elderly (55-64 years) 780463 394801 380944 13857 385662 50.6 48.8 3.5
MEN
15 years and over 2348735 1576650 1477736 98913 772085 67.1 62.9 6.3 young (15-24 years) 351256 151740 128845 22896 199516 43.2 36.7 15.1 working age population (15-64 years) 1943713 1510565 1411783 98781 433149 77.7 72.6 6.5 elderly (55-64 years) 372967 225345 215346 9999 147622 60.4 57.7 4.4
WOMEN
15 years and over 2439343 1171353 1112235 59118 1267990 48.0 45.6 5.0 young (15-24 years) 324180 94290 77669 16621 229889 29.1 24.0 17.6 working age population (15-64 years) 1853207 1095269 1036327 58942 757939 59.1 55.9 5.4 elderly (55-64 years) 407496 169456 165598 * 238040 41.6 40.6 2.3
1) Share of economically active population from the groups of age x in total population of the same group of age x. 2) Share of employment from the groups of age x in total population of the same group of age x. 3) Share of unemployed from the groups of age x in total economically active population of the same group of age x.

Tables 229
Table 2.81. Population by labour status, macroregions, regions, gender, urban/rural area and groups of age
(continued)
Economically active persons Total population Total Employed
Unem-ployed
Economically inactive persons
Activity rate 1)
Employ-ment rate 2)
Unem-ployment
rate 3)
Macroregions Regions Gender Urban/rural area
Groups of age - persons - - percentages -
URBAN 15 years and over 2279912 1229957 1138637 91320 1049955 53.9 49.9 7.4 young (15-24 years) 277947 68000 49315 18685 209947 24.5 17.7 27.5 working age population (15-64 years) 1878996 1221714 1130579 91135 657282 65.0 60.2 7.5 elderly (55-64 years) 424997 162155 152283 9872 262842 38.2 35.8 6.1
RURAL
15 years and over 2508166 1518046 1451334 66712 990120 60.5 57.9 4.4 young (15-24 years) 397488 178031 157199 20831 219458 44.8 39.5 11.7 working age population (15-64 years) 1917925 1384120 1317530 66589 533805 72.2 68.7 4.8 elderly (55-64 years) 355467 232646 228661 * 122820 65.4 64.3 1.7
2.1.NORTH-EAST
15 years and over 2685768 1670268 1609602 60666 1015500 62.2 59.9 3.6 young (15-24 years) 410882 163049 147865 15184 247833 39.7 36.0 9.3 working age population (15-64 years) 2134016 1553299 1492708 60591 580717 72.8 69.9 3.9 elderly (55-64 years) 417668 244105 239370 * 173562 58.4 57.3 1.9
MEN
15 years and over 1324234 922903 886799 36105 401331 69.7 67.0 3.9 young (15-24 years) 213691 96458 88334 8124 117232 45.1 41.3 8.4 working age population (15-64 years) 1097845 869654 833625 36030 228190 79.2 75.9 4.1 elderly (55-64 years) 200227 131944 129297 * 68283 65.9 64.6 2.0
WOMEN
15 years and over 1361533 747365 722803 24562 614168 54.9 53.1 3.3 young (15-24 years) 197191 66591 59532 7059 130601 33.8 30.2 10.6 working age population (15-64 years) 1036170 683645 659083 24562 352525 66.0 63.6 3.6 elderly (55-64 years) 217441 112161 110073 * 105280 51.6 50.6 1.9
URBAN
15 years and over 1143812 641769 608335 33434 502043 56.1 53.2 5.2 young (15-24 years) 152803 36547 30279 * 116256 23.9 19.8 17.2 working age population (15-64 years) 949467 634492 601133 33359 314974 66.8 63.3 5.3 elderly (55-64 years) 208320 84217 80982 * 124103 40.4 38.9 3.8
RURAL
15 years and over 1541956 1028498 1001266 27232 513457 66.7 64.9 2.6 young (15-24 years) 258079 126502 117587 8916 131577 49.0 45.6 7.0 working age population (15-64 years) 1184549 918806 891574 27232 265743 77.6 75.3 3.0 elderly (55-64 years) 209348 159888 158388 * 49459 76.4 75.7 0.9
2.2.SOUTH-EAST
15 years and over 2102310 1077735 980369 97365 1024575 51.3 46.6 9.0 young (15-24 years) 264554 82982 58649 24333 181572 31.4 22.2 29.3 working age population (15-64 years) 1662905 1052535 955402 97132 610370 63.3 57.5 9.2 elderly (55-64 years) 362796 150696 141574 9122 212099 41.5 39.0 6.1
1) Share of economically active population from the groups of age x in total population of the same group of age x. 2) Share of employment from the groups of age x in total population of the same group of age x. 3) Share of unemployed from the groups of age x in total economically active population of the same group of age x.

230 Labour force in Romania: Employment and unemployment - 2015
Tablel 2.81. Population by labour status, macroregions, regions, gender, urban/rural area and groups of age
(continued)
Economically active persons Total population Total Employed
Unem-ployed
Economically inactive persons
Activity rate 1)
Employ-ment rate 2)
Unem-ployment
rate 3)
Macroregions Regions Gender Urban/rural area
Groups of age - persons - - percentages -
MEN 15 years and over 1024501 653746 590938 62809 370755 63.8 57.7 9.6 young (15-24 years) 137566 55282 40511 14771 82283 40.2 29.4 26.7 working age population (15-64 years) 845869 640910 578159 62752 204959 75.8 68.4 9.8 elderly (55-64 years) 172740 93401 86049 7352 79339 54.1 49.8 7.9
WOMEN
15 years and over 1077810 423988 389432 34556 653821 39.3 36.1 8.2 young (15-24 years) 126988 27700 18138 9562 99288 21.8 14.3 34.5 working age population (15-64 years) 817037 411624 377244 34380 405412 50.4 46.2 8.4 elderly (55-64 years) 190056 57295 55525 * 132760 30.1 29.2 3.1
URBAN
15 years and over 1136099 588187 530301 57886 547912 51.8 46.7 9.8 young (15-24 years) 125144 31453 19036 12417 93691 25.1 15.2 39.5 working age population (15-64 years) 929528 587221 529445 57776 342308 63.2 57.0 9.8 elderly (55-64 years) 216677 77938 71301 6637 138739 36.0 32.9 8.5
RURAL
15 years and over 966210 489547 450068 39480 476663 50.7 46.6 8.1 young (15-24 years) 139409 51529 39613 11916 87881 37.0 28.4 23.1 working age population (15-64 years) 733375 465313 425956 39357 268063 63.4 58.1 8.5 elderly (55-64 years) 146119 72758 70274 * 73361 49.8 48.1 3.4
3.MACROREGION THREE 15 years and over 4572824 2560636 2354698 205938 2012189 56.0 51.5 8.0 young (15-24 years) 528615 173918 127387 46531 354697 32.9 24.1 26.8 working age population (15-64 years) 3654234 2493629 2287691 205938 1160606 68.2 62.6 8.3 elderly (55-64 years) 725403 291900 274778 17122 433503 40.2 37.9 5.9
MEN
15 years and over 2177178 1438531 1309661 128870 738647 66.1 60.2 9.0 young (15-24 years) 271195 105892 76425 29467 165303 39.0 28.2 27.8 working age population (15-64 years) 1816770 1403139 1274269 128870 413632 77.2 70.1 9.2 elderly (55-64 years) 335647 176822 163680 13143 158825 52.7 48.8 7.4
WOMEN
15 years and over 2395646 1122105 1045037 77068 1273541 46.8 43.6 6.9 young (15-24 years) 257421 68026 50962 17065 189394 26.4 19.8 25.1 working age population (15-64 years) 1837464 1090491 1013423 77068 746973 59.3 55.2 7.1 elderly (55-64 years) 389756 115078 111098 * 274679 29.5 28.5 3.5
URBAN
15 years and over 2802917 1600044 1480071 119973 1202873 57.1 52.8 7.5 young (15-24 years) 293593 80421 61393 19029 213172 27.4 20.9 23.7 working age population (15-64 years) 2312851 1594643 1474670 119973 718208 68.9 63.8 7.5 elderly (55-64 years) 470717 167728 156157 11571 302990 35.6 33.2 6.9
1) Share of economically active population from the groups of age x in total population of the same group of age x. 2) Share of employment from the groups of age x in total population of the same group of age x. 3) Share of unemployed from the groups of age x in total economically active population of the same group of age x.

Tables 231
Table 2.81. Population by labour status, macroregions, regions, gender, urban/rural area and groups of age
(continued)
Economically active persons Total population Total Employed
Unem-ployed
Economically inactive persons
Activity rate 1)
Employ-ment rate 2)
Unem-ployment
rate 3)
Macroregions Regions Gender Urban/rural area
Groups of age - persons - - percentages -
RURAL 15 years and over 1769907 960592 874627 85965 809315 54.3 49.4 8.9 young (15-24 years) 235022 93497 65994 27503 141525 39.8 28.1 29.4 working age population (15-64 years) 1341383 898986 813021 85965 442398 67.0 60.6 9.6 elderly (55-64 years) 254686 124172 118620 * 130514 48.8 46.6 4.5
3.1.SOUTH MUNTENIA
15 years and over 2601223 1415909 1270247 145662 1185314 54.4 48.8 10.3 young (15-24 years) 328941 119792 81151 38641 209148 36.4 24.7 32.3 working age population (15-64 years) 2023147 1353394 1207732 145662 669753 66.9 59.7 10.8 elderly (55-64 years) 414202 177956 168992 8964 236246 43.0 40.8 5.0
MEN
15 years and over 1266118 826112 735209 90903 440006 65.2 58.1 11.0 young (15-24 years) 171656 76463 52146 24317 95193 44.5 30.4 31.8 working age population (15-64 years) 1035342 794431 703528 90903 240911 76.7 68.0 11.4 elderly (55-64 years) 196912 103728 96504 7224 93184 52.7 49.0 7.0
WOMEN
15 years and over 1335105 589797 535038 54759 745308 44.2 40.1 9.3 young (15-24 years) 157285 43329 29005 14324 113956 27.5 18.4 33.1 working age population (15-64 years) 987804 558962 504203 54759 428842 56.6 51.0 9.8 elderly (55-64 years) 217291 74228 72488 * 143062 34.2 33.4 2.3
URBAN
15 years and over 1034500 561413 497449 63963 473088 54.3 48.1 11.4 young (15-24 years) 119405 32811 20954 11857 86594 27.5 17.5 36.1 working age population (15-64 years) 850039 559133 495169 63963 290908 65.8 58.3 11.4 elderly (55-64 years) 187794 62211 58005 * 125583 33.1 30.9 6.8
RURAL
15 years and over 1566721 854496 772797 81698 712225 54.5 49.3 9.6 young (15-24 years) 209536 86981 60197 26785 122555 41.5 28.7 30.8 working age population (15-64 years) 1173105 794261 712562 81698 378845 67.7 60.7 10.3 elderly (55-64 years) 226408 115745 110987 * 110663 51.1 49.0 4.1
3.2.BUCHAREST-ILFOV
15 years and over 1971602 1144727 1084451 60276 826875 58.1 55.0 5.3 young (15-24 years) 199674 54126 46236 7890 145549 27.1 23.2 14.6 working age population (15-64 years) 1631089 1140235 1079959 60276 490853 69.9 66.2 5.3 elderly (55-64 years) 311201 113944 105785 8158 197258 36.6 34.0 7.2
MEN
15 years and over 911061 612419 574452 37967 298642 67.2 63.1 6.2 young (15-24 years) 99539 29429 24279 * 70110 29.6 24.4 17.5 working age population (15-64 years) 781429 608707 570740 37967 172722 77.9 73.0 6.2 elderly (55-64 years) 138735 73095 67175 * 65641 52.7 48.4 8.1
1) Share of economically active population from the groups of age x in total population of the same group of age x. 2) Share of employment from the groups of age x in total population of the same group of age x. 3) Share of unemployed from the groups of age x in total economically active population of the same group of age x.

232 Labour force in Romania: Employment and unemployment - 2015
Table 2.81. Population by labour status, macroregions, regions, gender, urban/rural area and groups of age
(continued)
Economically active persons Total population Total Employed
Unem-ployed
Economically inactive persons
Activity rate 1)
Employ-ment rate 2)
Unem-ployment
rate 3)
Macroregions Regions Gender Urban/rural area
Groups of age - persons - - percentages -
WOMEN 15 years and over 1060540 532308 509999 22309 528233 50.2 48.1 4.2 young (15-24 years) 100136 24697 21957 * 75439 24.7 21.9 11.1 working age population (15-64 years) 849659 531528 509219 22309 318131 62.6 59.9 4.2 elderly (55-64 years) 172466 40849 38610 * 131617 23.7 22.4 5.5
URBAN
15 years and over 1768416 1038631 982622 56009 729785 58.7 55.6 5.4 young (15-24 years) 174189 47611 40439 7172 126578 27.3 23.2 15.1 working age population (15-64 years) 1462810 1035510 979501 56009 427300 70.8 67.0 5.4 elderly (55-64 years) 282924 105517 98152 7365 177407 37.3 34.7 7.0
RURAL
15 years and over 203186 106096 101829 * 97090 52.2 50.1 4.0 young (15-24 years) 25486 6515 * * 18971 25.6 22.7 11.0 working age population (15-64 years) 168278 104725 100458 * 63553 62.2 59.7 4.1 elderly (55-64 years) 28278 8427 7633 * 19851 29.8 27.0 9.4
4.MACROREGION FOUR 15 years and over 3281974 1670732 1538678 132054 1611242 50.9 46.9 7.9 young (15-24 years) 427377 119491 90738 28752 307886 28.0 21.2 24.1 working age population (15-64 years) 2601045 1612011 1480184 131827 989034 62.0 56.9 8.2 elderly (55-64 years) 532318 210480 204423 * 321838 39.5 38.4 2.9
MEN
15 years and over 1593393 976128 885339 90789 617265 61.3 55.6 9.3 young (15-24 years) 220682 72240 55264 16975 148442 32.7 25.0 23.5 working age population (15-64 years) 1317744 949758 859044 90714 367986 72.1 65.2 9.6 elderly (55-64 years) 252628 123328 118299 * 129299 48.8 46.8 4.1
WOMEN
15 years and over 1688582 694604 653339 41265 993977 41.1 38.7 5.9 young (15-24 years) 206695 47251 35474 11777 159443 22.9 17.2 24.9 working age population (15-64 years) 1283302 662253 621140 41113 621048 51.6 48.4 6.2 elderly (55-64 years) 279690 87152 86123 * 192538 31.2 30.8 1.2
URBAN
15 years and over 1757913 896267 828255 68012 861646 51.0 47.1 7.6 young (15-24 years) 223597 46654 30940 15714 176942 20.9 13.8 33.7 working age population (15-64 years) 1467061 892794 824857 67937 574267 60.9 56.2 7.6 elderly (55-64 years) 296516 100125 97900 * 196391 33.8 33.0 2.2
RURAL
15 years and over 1524062 774465 710423 64043 749596 50.8 46.6 8.3 young (15-24 years) 203780 72837 59799 13038 130943 35.7 29.3 17.9 working age population (15-64 years) 1133985 719217 655327 63891 414767 63.4 57.8 8.9 elderly (55-64 years) 235802 110355 106523 * 125447 46.8 45.2 3.5
1) Share of economically active population from the groups of age x in total population of the same group of age x. 2) Share of employment from the groups of age x in total population of the same group of age x. 3) Share of unemployed from the groups of age x in total economically active population of the same group of age x.

Tables 233
Table 2.81. Population by labour status, macroregions, regions, gender, urban/rural area and groups of age
(continued)
Economically active persons Total population Total Employed
Unem-ployed
Economically inactive persons
Activity rate 1)
Employ-ment rate 2)
Unem-ployment
rate 3)
Macroregions Regions Gender Urban/rural area
Groups of age - persons - - percentages -
4.1.SOUTH-WEST OLTENIA 15 years and over 1726783 900092 809403 90690 826690 52.1 46.9 10.1 young (15-24 years) 226069 67661 49196 18464 158408 29.9 21.8 27.3 working age population (15-64 years) 1346239 846722 756186 90538 499515 62.9 56.2 10.7 elderly (55-64 years) 275742 120964 116842 * 154777 43.9 42.4 3.4
MEN
15 years and over 843125 522256 456865 65391 320869 61.9 54.2 12.5 young (15-24 years) 118001 41910 30202 11708 76091 35.5 25.6 27.9 working age population (15-64 years) 687723 498668 433277 65391 189055 72.5 63.0 13.1 elderly (55-64 years) 132706 67738 63722 * 64968 51.0 48.0 5.9
WOMEN
15 years and over 883658 377837 352538 25299 505821 42.8 39.9 6.7 young (15-24 years) 108068 25751 18994 6757 82317 23.8 17.6 26.2 working age population (15-64 years) 658516 348055 322909 25147 310460 52.9 49.0 7.2 elderly (55-64 years) 143036 53226 53120 * 89809 37.2 37.1 0.2
URBAN
15 years and over 793009 410292 365554 44738 382717 51.7 46.1 10.9 young (15-24 years) 102763 19491 9909 9582 83272 19.0 9.6 49.2 working age population (15-64 years) 671232 407458 362720 44738 263774 60.7 54.0 11.0 elderly (55-64 years) 134924 46757 45100 * 88166 34.7 33.4 3.5
RURAL
15 years and over 933774 489801 443849 45951 443973 52.5 47.5 9.4 young (15-24 years) 123306 48170 39287 8882 75136 39.1 31.9 18.4 working age population (15-64 years) 675006 439265 393466 45799 235741 65.1 58.3 10.4 elderly (55-64 years) 140818 74207 71742 * 66611 52.7 50.9 3.3
4.2.WEST
15 years and over 1555193 770640 729275 41365 784553 49.6 46.9 5.4 young (15-24 years) 201308 51830 41542 10288 149477 25.7 20.6 19.8 working age population (15-64 years) 1254808 765288 723998 41290 489520 61.0 57.7 5.4 elderly (55-64 years) 256577 89516 87581 * 167061 34.9 34.1 2.2
MEN
15 years and over 750268 453872 428474 25398 296396 60.5 57.1 5.6 young (15-24 years) 102681 30330 25062 * 72351 29.5 24.4 17.4 working age population (15-64 years) 630021 451090 425767 25323 178931 71.6 67.6 5.6 elderly (55-64 years) 119922 55590 54577 * 64332 46.4 45.5 1.8
WOMEN
15 years and over 804925 316768 300801 15966 488157 39.4 37.4 5.0 young (15-24 years) 98627 21500 16480 * 77126 21.8 16.7 23.3 working age population (15-64 years) 624787 314199 298232 15966 310589 50.3 47.7 5.1 elderly (55-64 years) 136655 33926 33004 * 102729 24.8 24.2 2.7
1) Share of economically active population from the groups of age x in total population of the same group of age x. 2) Share of employment from the groups of age x in total population of the same group of age x. 3) Share of unemployed from the groups of age x in total economically active population of the same group of age x.

234 Labour force in Romania: Employment and unemployment - 2015
Table 2.81. Population by labour status, macroregions, regions, gender, urban/rural area and groups of age
(continued)
Economically active persons Total population Total Employed
Unem-ployed
Economically inactive persons
Activity rate 1)
Employ-ment rate 2)
Unem-ployment
rate 3)
Macroregions Regions Gender Urban/rural area
Groups of age - persons - - percentages -
URBAN 15 years and over 964904 485975 462701 23274 478929 50.4 48.0 4.8 young (15-24 years) 120834 27163 21031 * 93670 22.5 17.4 22.6 working age population (15-64 years) 795829 485336 462137 23199 310493 61.0 58.1 4.8 elderly (55-64 years) 161593 53368 52801 * 108224 33.0 32.7 1.1
RURAL
15 years and over 590288 284665 266574 18091 305623 48.2 45.2 6.4 young (15-24 years) 80474 24667 20511 * 55807 30.7 25.5 16.8 working age population (15-64 years) 458978 279952 261861 18091 179026 61.0 57.1 6.5 elderly (55-64 years) 94984 36148 34780 * 58836 38.1 36.6 3.8
1) Share of economically active population from the groups of age x in total population of the same group of age x. 2) Share of employment from the groups of age x in total population of the same group of age x. 3) Share of unemployed from the groups of age x in total economically active population of the same group of age x.

Tables 235
Table 2.82. Structure of population by labour status, by macroregions, regions, gender, urban/rural area and groups of age
- % -
Economically active persons Macroregions Regions Gender Urban/rural area
Groups of age
Total population Total Employed Unemployed
Economically inactive persons
TOTAL 100.0 46.1 43.0 3.1 53.9 under 15 years 100.0 - - - 100.0 15-24 years 100.0 31.3 24.5 6.8 68.7 25-34 years 100.0 81.5 74.9 6.6 18.5 35-44 years 100.0 85.7 81.1 4.6 14.3 45-54 years 100.0 79.8 75.7 4.1 20.2 55-64 years 100.0 42.7 41.1 1.6 57.3 65 years and over 100.0 8.9 8.9 (0.0) 91.1
MEN 100.0 54.0 49.9 4.1 46.0
under 15 years 100.0 - - - 100.0 15-24 years 100.0 37.0 29.4 7.6 63.0 25-34 years 100.0 91.3 83.0 8.3 8.7 35-44 years 100.0 94.2 88.7 5.5 5.8 45-54 years 100.0 88.8 83.6 5.2 11.2 55-64 years 100.0 53.8 51.2 2.6 46.2 65 years and over 100.0 10.6 10.6 (0.0) 89.4
WOMEN 100.0 38.6 36.3 2.3 61.4
under 15 years 100.0 - - - 100.0 15-24 years 100.0 25.2 19.3 5.9 74.8 25-34 years 100.0 71.0 66.3 4.7 29.0 35-44 years 100.0 76.7 73.1 3.6 23.3 45-54 years 100.0 70.6 67.5 3.1 29.4 55-64 years 100.0 32.8 32.1 0.7 67.2 65 years and over 100.0 7.7 7.7 (0.0) 92.3
URBAN 100.0 46.9 43.6 3.3 53.1
under 15 years 100.0 - - - 100.0 15-24 years 100.0 23.8 17.4 6.4 76.2 25-34 years 100.0 84.6 77.8 6.8 15.4 35-44 years 100.0 88.3 84.0 4.3 11.7 45-54 years 100.0 80.7 76.4 4.3 19.3 55-64 years 100.0 36.8 35.1 1.7 63.2 65 years and over 100.0 1.3 1.3 (0.0) 98.7
RURAL 100.0 45.2 42.2 3.0 54.8
under 15 years 100.0 - - - 100.0 15-24 years 100.0 38.7 31.5 7.2 61.3 25-34 years 100.0 77.0 70.7 6.3 23.0 35-44 years 100.0 82.3 77.5 4.8 17.7 45-54 years 100.0 78.6 74.8 3.8 21.4 55-64 years 100.0 51.1 49.7 1.4 48.9 65 years and over 100.0 15.5 15.5 (0.0) 84.5
1.MACROREGION ONE 100.0 44.2 41.6 2.6 55.8 under 15 years 100.0 - - - 100.0 15-24 years 100.0 26.0 20.0 6.0 74.0 25-34 years 100.0 80.7 75.1 5.6 19.3 35-44 years 100.0 85.3 81.6 3.7 14.7 45-54 years 100.0 79.7 76.6 3.1 20.3 55-64 years 100.0 38.7 37.8 (0.9) 61.3 65 years and over 100.0 4.2 4.2 - 95.8
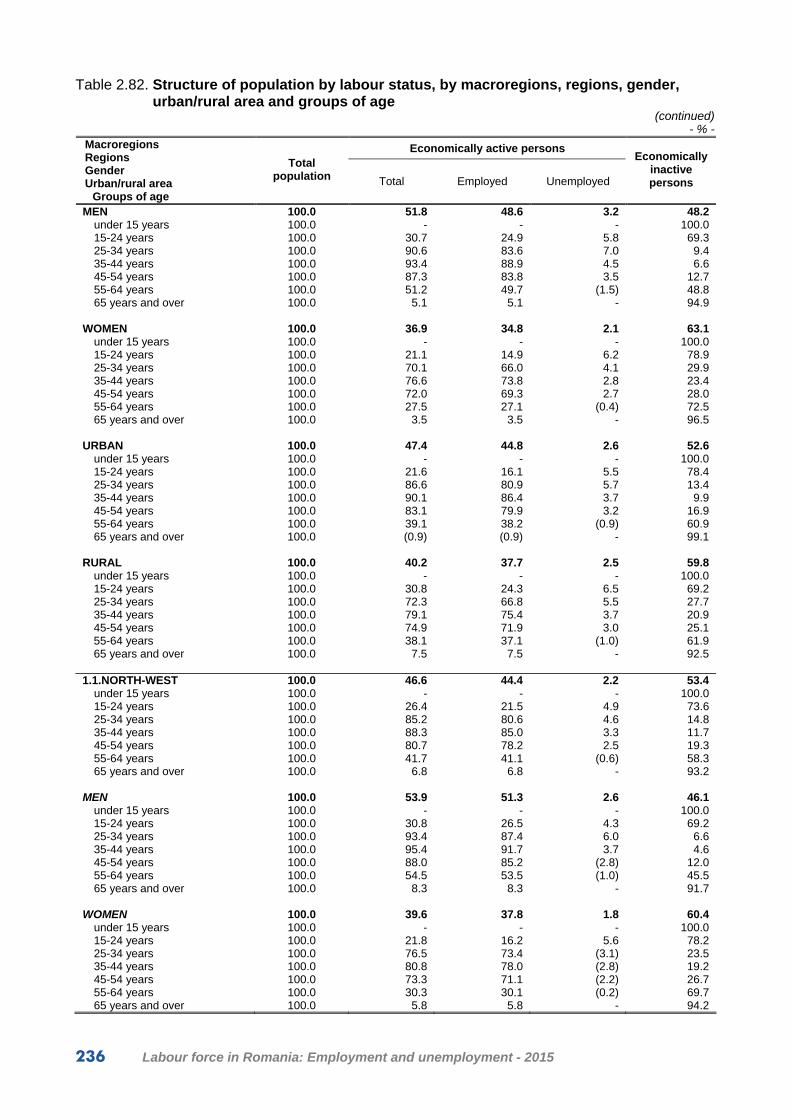
236 Labour force in Romania: Employment and unemployment - 2015
Table 2.82. Structure of population by labour status, by macroregions, regions, gender,
urban/rural area and groups of age (continued)
- % -
Economically active persons Macroregions Regions Gender Urban/rural area
Groups of age
Total population Total Employed Unemployed
Economically inactive persons
MEN 100.0 51.8 48.6 3.2 48.2 under 15 years 100.0 - - - 100.0 15-24 years 100.0 30.7 24.9 5.8 69.3 25-34 years 100.0 90.6 83.6 7.0 9.4 35-44 years 100.0 93.4 88.9 4.5 6.6 45-54 years 100.0 87.3 83.8 3.5 12.7 55-64 years 100.0 51.2 49.7 (1.5) 48.8 65 years and over 100.0 5.1 5.1 - 94.9
WOMEN 100.0 36.9 34.8 2.1 63.1
under 15 years 100.0 - - - 100.0 15-24 years 100.0 21.1 14.9 6.2 78.9 25-34 years 100.0 70.1 66.0 4.1 29.9 35-44 years 100.0 76.6 73.8 2.8 23.4 45-54 years 100.0 72.0 69.3 2.7 28.0 55-64 years 100.0 27.5 27.1 (0.4) 72.5 65 years and over 100.0 3.5 3.5 - 96.5
URBAN 100.0 47.4 44.8 2.6 52.6
under 15 years 100.0 - - - 100.0 15-24 years 100.0 21.6 16.1 5.5 78.4 25-34 years 100.0 86.6 80.9 5.7 13.4 35-44 years 100.0 90.1 86.4 3.7 9.9 45-54 years 100.0 83.1 79.9 3.2 16.9 55-64 years 100.0 39.1 38.2 (0.9) 60.9 65 years and over 100.0 (0.9) (0.9) - 99.1
RURAL 100.0 40.2 37.7 2.5 59.8
under 15 years 100.0 - - - 100.0 15-24 years 100.0 30.8 24.3 6.5 69.2 25-34 years 100.0 72.3 66.8 5.5 27.7 35-44 years 100.0 79.1 75.4 3.7 20.9 45-54 years 100.0 74.9 71.9 3.0 25.1 55-64 years 100.0 38.1 37.1 (1.0) 61.9 65 years and over 100.0 7.5 7.5 - 92.5
1.1.NORTH-WEST 100.0 46.6 44.4 2.2 53.4
under 15 years 100.0 - - - 100.0 15-24 years 100.0 26.4 21.5 4.9 73.6 25-34 years 100.0 85.2 80.6 4.6 14.8 35-44 years 100.0 88.3 85.0 3.3 11.7 45-54 years 100.0 80.7 78.2 2.5 19.3 55-64 years 100.0 41.7 41.1 (0.6) 58.3 65 years and over 100.0 6.8 6.8 - 93.2
MEN 100.0 53.9 51.3 2.6 46.1
under 15 years 100.0 - - - 100.0 15-24 years 100.0 30.8 26.5 4.3 69.2 25-34 years 100.0 93.4 87.4 6.0 6.6 35-44 years 100.0 95.4 91.7 3.7 4.6 45-54 years 100.0 88.0 85.2 (2.8) 12.0 55-64 years 100.0 54.5 53.5 (1.0) 45.5 65 years and over 100.0 8.3 8.3 - 91.7
WOMEN 100.0 39.6 37.8 1.8 60.4
under 15 years 100.0 - - - 100.0 15-24 years 100.0 21.8 16.2 5.6 78.2 25-34 years 100.0 76.5 73.4 (3.1) 23.5 35-44 years 100.0 80.8 78.0 (2.8) 19.2 45-54 years 100.0 73.3 71.1 (2.2) 26.7 55-64 years 100.0 30.3 30.1 (0.2) 69.7 65 years and over 100.0 5.8 5.8 - 94.2

Tables 237
Table 2.82. Structure of population by labour status, by macroregions, regions, gender, urban/rural area and groups of age
(continued) - % -
Economically active persons Macroregions Regions Gender Urban/rural area
Groups of age
Total population Total Employed Unemployed
Economically inactive persons
URBAN 100.0 49.1 46.8 2.3 50.9 under 15 years 100.0 - - - 100.0 15-24 years 100.0 20.1 15.1 5.0 79.9 25-34 years 100.0 90.5 85.9 4.6 9.5 35-44 years 100.0 91.3 87.8 3.5 8.7 45-54 years 100.0 83.4 80.7 (2.7) 16.6 55-64 years 100.0 40.5 40.0 (0.5) 59.5 65 years and over 100.0 (0.9) (0.9) - 99.1
RURAL 100.0 43.8 41.8 2.0 56.2
under 15 years 100.0 - - - 100.0 15-24 years 100.0 33.0 28.2 4.8 67.0 25-34 years 100.0 78.0 73.4 4.6 22.0 35-44 years 100.0 84.8 81.8 (3.0) 15.2 45-54 years 100.0 77.4 75.1 (2.3) 22.6 55-64 years 100.0 43.2 42.4 (0.8) 56.8 65 years and over 100.0 11.6 11.6 - 88.4
1.2.CENTER 100.0 41.5 38.4 3.1 58.5
under 15 years 100.0 - - - 100.0 15-24 years 100.0 25.6 18.3 7.3 74.4 25-34 years 100.0 75.6 68.8 6.8 24.4 35-44 years 100.0 81.9 77.7 4.2 18.1 45-54 years 100.0 78.6 74.8 3.8 21.4 55-64 years 100.0 35.5 34.3 (1.2) 64.5 65 years and over 100.0 (1.3) (1.3) - 98.7
MEN 100.0 49.5 45.7 3.8 50.5
under 15 years 100.0 - - - 100.0 15-24 years 100.0 30.6 23.0 7.6 69.4 25-34 years 100.0 87.4 79.2 8.2 12.6 35-44 years 100.0 91.3 85.9 5.4 8.7 45-54 years 100.0 86.5 82.2 4.3 13.5 55-64 years 100.0 47.7 45.7 (2.0) 52.3 65 years and over 100.0 (1.7) (1.7) - 98.3
WOMEN 100.0 33.8 31.4 2.4 66.2
under 15 years 100.0 - - - 100.0 15-24 years 100.0 20.3 13.3 7.0 79.7 25-34 years 100.0 62.7 57.4 5.3 37.3 35-44 years 100.0 72.0 69.2 (2.8) 28.0 45-54 years 100.0 70.5 67.2 (3.3) 29.5 55-64 years 100.0 24.6 24.0 (0.6) 75.4 65 years and over 100.0 (1.1) (1.1) - 98.9
URBAN 100.0 45.7 42.8 2.9 54.3
under 15 years 100.0 - - - 100.0 15-24 years 100.0 23.3 17.3 6.0 76.7 25-34 years 100.0 82.3 75.4 6.9 17.7 35-44 years 100.0 88.9 85.0 3.9 11.1 45-54 years 100.0 82.9 79.2 3.7 17.1 55-64 years 100.0 37.7 36.5 (1.2) 62.3 65 years and over 100.0 (0.8) (0.8) - 99.2
RURAL 100.0 35.8 32.6 3.2 64.2
under 15 years 100.0 - - - 100.0 15-24 years 100.0 28.2 19.5 8.7 71.8 25-34 years 100.0 65.5 58.8 6.7 34.5 35-44 years 100.0 72.2 67.7 4.5 27.8 45-54 years 100.0 71.7 67.8 (3.9) 28.3 55-64 years 100.0 31.7 30.4 (1.3) 68.3 65 years and over 100.0 (2.0) (2.0) - 98.0

238 Labour force in Romania: Employment and unemployment - 2015
Table 2.82. Structure of population by labour status, by macroregions, regions, gender, urban/rural area and groups of age
(continued) - % -
Economically active persons Macroregions Regions Gender Urban/rural area
Groups of age
Total population Total Employed Unemployed
Economically inactive persons
2.MACROREGION TWO 100.0 47.7 45.0 2.7 52.3 under 15 years 100.0 - - - 100.0 15-24 years 100.0 36.4 30.6 5.8 63.6 25-34 years 100.0 83.0 77.2 5.8 17.0 35-44 years 100.0 85.9 82.0 3.9 14.1 45-54 years 100.0 82.6 78.7 3.9 17.4 55-64 years 100.0 50.6 48.8 1.8 49.4 65 years and over 100.0 14.3 14.3 (0.0) 85.7
MEN 100.0 55.4 51.9 3.5 44.6
under 15 years 100.0 - - - 100.0 15-24 years 100.0 43.2 36.7 6.5 56.8 25-34 years 100.0 92.4 85.5 6.9 7.6 35-44 years 100.0 94.3 89.7 4.6 5.7 45-54 years 100.0 92.0 87.2 4.8 8.0 55-64 years 100.0 60.4 57.7 2.7 39.6 65 years and over 100.0 16.3 16.3 (0.0) 83.7
WOMEN 100.0 40.3 38.2 2.1 59.7
under 15 years 100.0 - - - 100.0 15-24 years 100.0 29.1 24.0 5.1 70.9 25-34 years 100.0 72.5 68.0 4.5 27.5 35-44 years 100.0 76.9 73.8 3.1 23.1 45-54 years 100.0 72.5 69.6 2.9 27.5 55-64 years 100.0 41.6 40.6 (1.0) 58.4 65 years and over 100.0 13.0 13.0 (0.0) 87.0
URBAN 100.0 45.8 42.4 3.4 54.2
under 15 years 100.0 - - - 100.0 15-24 years 100.0 24.5 17.8 6.7 75.5 25-34 years 100.0 83.6 76.5 7.1 16.4 35-44 years 100.0 87.3 83.1 4.2 12.7 45-54 years 100.0 81.9 77.1 4.8 18.1 55-64 years 100.0 38.2 35.9 2.3 61.8 65 years and over 100.0 2.1 2.0 (0.1) 97.9
RURAL 100.0 49.4 47.2 2.2 50.6
under 15 years 100.0 - - - 100.0 15-24 years 100.0 44.8 39.6 5.2 55.2 25-34 years 100.0 82.4 78.0 4.4 17.6 35-44 years 100.0 84.6 81.1 3.5 15.4 45-54 years 100.0 83.3 80.4 2.9 16.7 55-64 years 100.0 65.4 64.3 (1.1) 34.6 65 years and over 100.0 22.7 22.7 (0.0) 77.3
2.1.NORTH-EAST 100.0 51.1 49.3 1.8 48.9
under 15 years 100.0 - - - 100.0 15-24 years 100.0 39.7 36.0 3.7 60.3 25-34 years 100.0 85.9 82.1 3.8 14.1 35-44 years 100.0 89.6 86.8 2.8 10.4 45-54 years 100.0 87.5 84.7 2.8 12.5 55-64 years 100.0 58.4 57.3 (1.1) 41.6 65 years and over 100.0 21.2 21.2 (0.0) 78.8
MEN 100.0 56.9 54.7 2.2 43.1
under 15 years 100.0 - - - 100.0 15-24 years 100.0 45.1 41.3 3.8 54.9 25-34 years 100.0 93.3 88.8 4.5 6.7 35-44 years 100.0 94.9 91.6 3.3 5.1 45-54 years 100.0 92.9 89.6 3.3 7.1 55-64 years 100.0 65.9 64.6 (1.3) 34.1 65 years and over 100.0 23.5 23.5 (0.0) 76.5
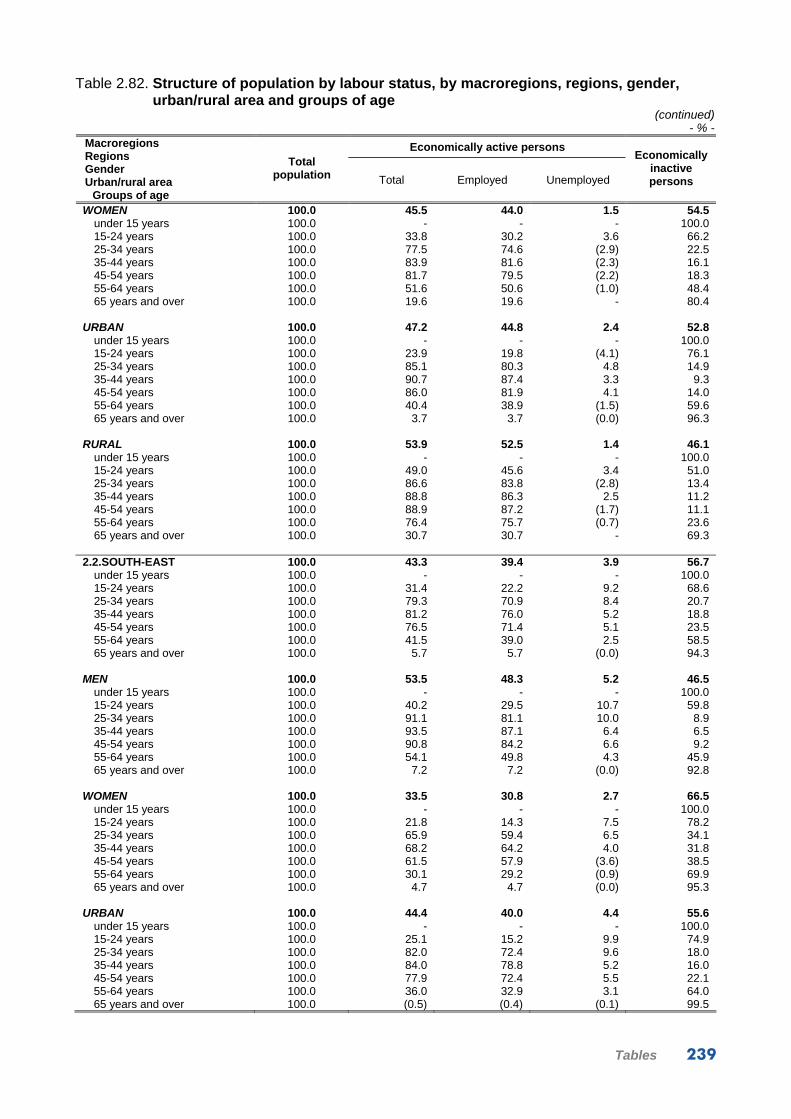
Tables 239
Table 2.82. Structure of population by labour status, by macroregions, regions, gender, urban/rural area and groups of age
(continued) - % -
Economically active persons Macroregions Regions Gender Urban/rural area
Groups of age
Total population Total Employed Unemployed
Economically inactive persons
WOMEN 100.0 45.5 44.0 1.5 54.5 under 15 years 100.0 - - - 100.0 15-24 years 100.0 33.8 30.2 3.6 66.2 25-34 years 100.0 77.5 74.6 (2.9) 22.5 35-44 years 100.0 83.9 81.6 (2.3) 16.1 45-54 years 100.0 81.7 79.5 (2.2) 18.3 55-64 years 100.0 51.6 50.6 (1.0) 48.4 65 years and over 100.0 19.6 19.6 - 80.4
URBAN 100.0 47.2 44.8 2.4 52.8
under 15 years 100.0 - - - 100.0 15-24 years 100.0 23.9 19.8 (4.1) 76.1 25-34 years 100.0 85.1 80.3 4.8 14.9 35-44 years 100.0 90.7 87.4 3.3 9.3 45-54 years 100.0 86.0 81.9 4.1 14.0 55-64 years 100.0 40.4 38.9 (1.5) 59.6 65 years and over 100.0 3.7 3.7 (0.0) 96.3
RURAL 100.0 53.9 52.5 1.4 46.1
under 15 years 100.0 - - - 100.0 15-24 years 100.0 49.0 45.6 3.4 51.0 25-34 years 100.0 86.6 83.8 (2.8) 13.4 35-44 years 100.0 88.8 86.3 2.5 11.2 45-54 years 100.0 88.9 87.2 (1.7) 11.1 55-64 years 100.0 76.4 75.7 (0.7) 23.6 65 years and over 100.0 30.7 30.7 - 69.3
2.2.SOUTH-EAST 100.0 43.3 39.4 3.9 56.7
under 15 years 100.0 - - - 100.0 15-24 years 100.0 31.4 22.2 9.2 68.6 25-34 years 100.0 79.3 70.9 8.4 20.7 35-44 years 100.0 81.2 76.0 5.2 18.8 45-54 years 100.0 76.5 71.4 5.1 23.5 55-64 years 100.0 41.5 39.0 2.5 58.5 65 years and over 100.0 5.7 5.7 (0.0) 94.3
MEN 100.0 53.5 48.3 5.2 46.5
under 15 years 100.0 - - - 100.0 15-24 years 100.0 40.2 29.5 10.7 59.8 25-34 years 100.0 91.1 81.1 10.0 8.9 35-44 years 100.0 93.5 87.1 6.4 6.5 45-54 years 100.0 90.8 84.2 6.6 9.2 55-64 years 100.0 54.1 49.8 4.3 45.9 65 years and over 100.0 7.2 7.2 (0.0) 92.8
WOMEN 100.0 33.5 30.8 2.7 66.5
under 15 years 100.0 - - - 100.0 15-24 years 100.0 21.8 14.3 7.5 78.2 25-34 years 100.0 65.9 59.4 6.5 34.1 35-44 years 100.0 68.2 64.2 4.0 31.8 45-54 years 100.0 61.5 57.9 (3.6) 38.5 55-64 years 100.0 30.1 29.2 (0.9) 69.9 65 years and over 100.0 4.7 4.7 (0.0) 95.3
URBAN 100.0 44.4 40.0 4.4 55.6
under 15 years 100.0 - - - 100.0 15-24 years 100.0 25.1 15.2 9.9 74.9 25-34 years 100.0 82.0 72.4 9.6 18.0 35-44 years 100.0 84.0 78.8 5.2 16.0 45-54 years 100.0 77.9 72.4 5.5 22.1 55-64 years 100.0 36.0 32.9 3.1 64.0 65 years and over 100.0 (0.5) (0.4) (0.1) 99.5

240 Labour force in Romania: Employment and unemployment - 2015
Table 2.82. Structure of population by labour status, by macroregions, regions, gender, urban/rural area and groups of age
(continued) - % -
Economically active persons Macroregions Regions Gender Urban/rural area
Groups of age
Total population Total Employed Unemployed
Economically inactive persons
RURAL 100.0 42.1 38.7 3.4 57.9 under 15 years 100.0 - - - 100.0 15-24 years 100.0 37.0 28.4 8.6 63.0 25-34 years 100.0 75.7 68.8 6.9 24.3 35-44 years 100.0 77.8 72.5 5.3 22.2 45-54 years 100.0 74.5 69.8 4.7 25.5 55-64 years 100.0 49.8 48.1 (1.7) 50.2 65 years and over 100.0 10.4 10.4 (0.0) 89.6
3.MACROREGION THREE 100.0 47.9 44.0 3.9 52.1 under 15 years 100.0 - - - 100.0 15-24 years 100.0 32.9 24.1 8.8 67.1 25-34 years 100.0 83.8 76.2 7.6 16.2 35-44 years 100.0 87.7 82.6 5.1 12.3 45-54 years 100.0 81.5 76.4 5.1 18.5 55-64 years 100.0 40.2 37.9 2.3 59.8 65 years and over 100.0 7.3 7.3 - 92.7
MEN 100.0 55.8 50.8 5.0 44.2
under 15 years 100.0 - - - 100.0 15-24 years 100.0 39.0 28.2 10.8 61.0 25-34 years 100.0 92.0 82.4 9.6 8.0 35-44 years 100.0 95.0 89.4 5.6 5.0 45-54 years 100.0 90.4 84.2 6.2 9.6 55-64 years 100.0 52.7 48.8 3.9 47.3 65 years and over 100.0 9.8 9.8 - 90.2
WOMEN 100.0 40.5 37.7 2.8 59.5
under 15 years 100.0 - - - 100.0 15-24 years 100.0 26.4 19.8 6.6 73.6 25-34 years 100.0 75.3 69.7 5.6 24.7 35-44 years 100.0 80.2 75.7 4.5 19.8 45-54 years 100.0 72.6 68.6 4.0 27.4 55-64 years 100.0 29.5 28.5 (1.0) 70.5 65 years and over 100.0 5.7 5.7 - 94.3
URBAN 100.0 49.2 45.5 3.7 50.8
under 15 years 100.0 - - - 100.0 15-24 years 100.0 27.4 20.9 6.5 72.6 25-34 years 100.0 87.2 80.0 7.2 12.8 35-44 years 100.0 90.3 85.4 4.9 9.7 45-54 years 100.0 82.7 77.5 5.2 17.3 55-64 years 100.0 35.6 33.2 2.4 64.4 65 years and over 100.0 (1.1) (1.1) - 98.9
RURAL 100.0 45.9 41.8 4.1 54.1
under 15 years 100.0 - - - 100.0 15-24 years 100.0 39.8 28.1 11.7 60.2 25-34 years 100.0 76.6 68.1 8.5 23.4 35-44 years 100.0 83.3 77.9 5.4 16.7 45-54 years 100.0 79.3 74.4 4.9 20.7 55-64 years 100.0 48.8 46.6 (2.2) 51.2 65 years and over 100.0 14.4 14.4 - 85.6
3.1.SOUTH MUNTENIA 100.0 46.3 41.5 4.8 53.7
under 15 years 100.0 - - - 100.0 15-24 years 100.0 36.4 24.7 11.7 63.6 25-34 years 100.0 81.1 70.9 10.2 18.9 35-44 years 100.0 85.2 78.4 6.8 14.8 45-54 years 100.0 80.6 74.3 6.3 19.4 55-64 years 100.0 43.0 40.8 2.2 57.0 65 years and over 100.0 10.8 10.8 - 89.2

Tables 241
Table 2.82. Structure of population by labour status, by macroregions, regions, gender, urban/rural area and groups of age
(continued) - % -
Economically active persons Macroregions Regions Gender Urban/rural area
Groups of age
Total population Total Employed Unemployed
Economically inactive persons
MEN 100.0 55.1 49.0 6.1 44.9 under 15 years 100.0 - - - 100.0 15-24 years 100.0 44.5 30.4 14.1 55.5 25-34 years 100.0 91.6 78.9 12.7 8.4 35-44 years 100.0 94.0 86.7 7.3 6.0 45-54 years 100.0 90.5 83.3 7.2 9.5 55-64 years 100.0 52.7 49.0 3.7 47.3 65 years and over 100.0 13.7 13.7 - 86.3
WOMEN 100.0 37.9 34.4 3.5 62.1
under 15 years 100.0 - - - 100.0 15-24 years 100.0 27.5 18.4 9.1 72.5 25-34 years 100.0 69.3 61.9 7.4 30.7 35-44 years 100.0 75.9 69.6 6.3 24.1 45-54 years 100.0 70.0 64.6 5.4 30.0 55-64 years 100.0 34.2 33.4 (0.8) 65.8 65 years and over 100.0 8.9 8.9 - 91.1
URBAN 100.0 46.5 41.2 5.3 53.5
under 15 years 100.0 - - - 100.0 15-24 years 100.0 27.5 17.6 9.9 72.5 25-34 years 100.0 86.0 74.5 11.5 14.0 35-44 years 100.0 88.5 80.6 7.9 11.5 45-54 years 100.0 82.0 74.5 7.5 18.0 55-64 years 100.0 33.1 30.9 (2.2) 66.9 65 years and over 100.0 (1.2) (1.2) - 98.8
RURAL 100.0 46.2 41.8 4.4 53.8
under 15 years 100.0 - - - 100.0 15-24 years 100.0 41.5 28.7 12.8 58.5 25-34 years 100.0 77.6 68.3 9.3 22.4 35-44 years 100.0 82.9 76.9 6.0 17.1 45-54 years 100.0 79.5 74.2 5.3 20.5 55-64 years 100.0 51.1 49.0 (2.1) 48.9 65 years and over 100.0 15.3 15.3 - 84.7
3.2.BUCHAREST-ILFOV 100.0 50.0 47.4 2.6 50.0
under 15 years 100.0 - - - 100.0 15-24 years 100.0 27.1 23.2 3.9 72.9 25-34 years 100.0 86.1 80.9 5.2 13.9 35-44 years 100.0 90.6 87.6 3.0 9.4 45-54 years 100.0 82.7 79.3 3.4 17.3 55-64 years 100.0 36.6 34.0 2.6 63.4 65 years and over 100.0 (1.3) (1.3) - 98.7
MEN 100.0 57.0 53.4 3.6 43.0
under 15 years 100.0 - - - 100.0 15-24 years 100.0 29.6 24.4 (5.2) 70.4 25-34 years 100.0 92.3 85.9 6.4 7.7 35-44 years 100.0 96.4 92.8 3.6 3.6 45-54 years 100.0 90.1 85.4 4.7 9.9 55-64 years 100.0 52.7 48.4 (4.3) 47.3 65 years and over 100.0 (2.9) (2.9) - 97.1
WOMEN 100.0 43.8 42.0 1.8 56.2
under 15 years 100.0 - - - 100.0 15-24 years 100.0 24.7 21.9 (2.8) 75.3 25-34 years 100.0 80.3 76.2 4.1 19.7 35-44 years 100.0 85.1 82.7 (2.4) 14.9 45-54 years 100.0 76.0 73.7 (2.3) 24.0 55-64 years 100.0 23.7 22.4 (1.3) 76.3 65 years and over 100.0 (0.4) (0.4) - 99.6

242 Labour force in Romania: Employment and unemployment - 2015
Table 2.82. Structure of population by labour status, by macroregions, regions, gender, urban/rural area and groups of age
(continued) - % -
Economically active persons Macroregions Regions Gender Urban/rural area
Groups of age
Total population Total Employed Unemployed
Economically inactive persons
URBAN 100.0 50.8 48.0 2.8 49.2 under 15 years 100.0 - - - 100.0 15-24 years 100.0 27.3 23.2 4.1 72.7 25-34 years 100.0 87.7 82.3 5.4 12.3 35-44 years 100.0 91.3 88.1 3.2 8.7 45-54 years 100.0 83.2 79.6 3.6 16.8 55-64 years 100.0 37.3 34.7 2.6 62.7 65 years and over 100.0 (1.0) (1.0) - 99.0
RURAL 100.0 43.6 41.8 (1.8) 56.4
under 15 years 100.0 - - - 100.0 15-24 years 100.0 25.6 (22.8) (2.8) 74.4 25-34 years 100.0 70.7 66.9 (3.8) 29.3 35-44 years 100.0 85.7 84.2 (1.5) (14.3) 45-54 years 100.0 77.9 75.9 (2.0) 22.1 55-64 years 100.0 29.8 27.0 (2.8) 70.2 65 years and over 100.0 (3.9) (3.9) - 96.1
4.MACROREGION FOUR 100.0 43.7 40.2 3.5 56.3 under 15 years 100.0 - - - 100.0 15-24 years 100.0 28.0 21.3 6.7 72.0 25-34 years 100.0 77.0 69.5 7.5 23.0 35-44 years 100.0 82.9 77.0 5.9 17.1 45-54 years 100.0 73.9 69.5 4.4 26.1 55-64 years 100.0 39.5 38.4 (1.1) 60.5 65 years and over 100.0 8.6 8.6 (0.0) 91.4
MEN 100.0 52.2 47.3 4.9 47.8
under 15 years 100.0 - - - 100.0 15-24 years 100.0 32.7 25.0 7.7 67.3 25-34 years 100.0 89.6 79.3 10.3 10.4 35-44 years 100.0 93.8 85.9 7.9 6.2 45-54 years 100.0 84.1 77.8 6.3 15.9 55-64 years 100.0 48.8 46.8 (2.0) 51.2 65 years and over 100.0 9.6 9.6 (0.0) 90.4
WOMEN 100.0 35.6 33.5 2.1 64.4
under 15 years 100.0 - - - 100.0 15-24 years 100.0 22.9 17.2 5.7 77.1 25-34 years 100.0 63.3 58.9 4.4 36.7 35-44 years 100.0 71.3 67.5 3.8 28.7 45-54 years 100.0 63.4 60.9 2.5 36.6 55-64 years 100.0 31.2 30.8 (0.4) 68.8 65 years and over 100.0 8.0 8.0 (0.0) 92.0
URBAN 100.0 43.9 40.6 3.3 56.1
under 15 years 100.0 - - - 100.0 15-24 years 100.0 20.9 13.9 7.0 79.1 25-34 years 100.0 78.3 70.9 7.4 21.7 35-44 years 100.0 84.1 79.6 4.5 15.9 45-54 years 100.0 73.5 69.4 4.1 26.5 55-64 years 100.0 33.8 33.0 (0.8) 66.2 65 years and over 100.0 (1.2) (1.2) (0.0) 98.8
RURAL 100.0 43.5 39.9 3.6 56.5
under 15 years 100.0 - - - 100.0 15-24 years 100.0 35.7 29.3 6.4 64.3 25-34 years 100.0 75.1 67.4 7.7 24.9 35-44 years 100.0 81.2 73.5 7.7 18.8 45-54 years 100.0 74.5 69.6 4.9 25.5 55-64 years 100.0 46.8 45.2 (1.6) 53.2 65 years and over 100.0 14.2 14.1 (0.1) 85.8

Tables 243
Table 2.82. Structure of population by labour status, by macroregions, regions, gender, urban/rural area and groups of age
(continued) - % -
Economically active persons Macroregions Regions Gender Urban/rural area
Groups of age
Total population Total Employed Unemployed
Economically inactive persons
4.1.SOUTH-WEST OLTENIA 100.0 44.7 40.2 4.5 55.3 under 15 years 100.0 - - - 100.0 15-24 years 100.0 29.9 21.7 8.2 70.1 25-34 years 100.0 75.5 65.1 10.4 24.5 35-44 years 100.0 81.5 73.4 8.1 18.5 45-54 years 100.0 76.2 70.2 6.0 23.8 55-64 years 100.0 43.9 42.4 (1.5) 56.1 65 years and over 100.0 14.0 14.0 (0.0) 86.0
MEN 100.0 52.8 46.2 6.6 47.2
under 15 years 100.0 - - - 100.0 15-24 years 100.0 35.5 25.6 9.9 64.5 25-34 years 100.0 88.0 73.3 14.7 12.0 35-44 years 100.0 93.3 81.8 11.5 6.7 45-54 years 100.0 85.4 77.0 8.4 14.6 55-64 years 100.0 51.0 48.0 (3.0) 49.0 65 years and over 100.0 15.2 15.2 - 84.8
WOMEN 100.0 37.0 34.5 2.5 63.0
under 15 years 100.0 - - - 100.0 15-24 years 100.0 23.8 17.6 6.2 76.2 25-34 years 100.0 61.7 56.0 5.7 38.3 35-44 years 100.0 69.1 64.5 4.6 30.9 45-54 years 100.0 66.4 63.0 (3.4) 33.6 55-64 years 100.0 37.2 37.1 (0.1) 62.8 65 years and over 100.0 13.2 13.1 (0.1) 86.8
URBAN 100.0 44.2 39.4 4.8 55.8
under 15 years 100.0 - - - 100.0 15-24 years 100.0 19.0 9.7 9.3 81.0 25-34 years 100.0 76.0 65.1 10.9 24.0 35-44 years 100.0 82.3 75.3 7.0 17.7 45-54 years 100.0 77.3 71.6 5.7 22.7 55-64 years 100.0 34.7 33.4 (1.3) 65.3 65 years and over 100.0 (2.3) (2.3) - 97.7
RURAL 100.0 45.2 40.9 4.3 54.8
under 15 years 100.0 - - - 100.0 15-24 years 100.0 39.1 31.9 7.2 60.9 25-34 years 100.0 74.9 65.0 9.9 25.1 35-44 years 100.0 80.7 71.5 9.2 19.3 45-54 years 100.0 74.9 68.7 6.2 25.1 55-64 years 100.0 52.7 50.9 (1.8) 47.3 65 years and over 100.0 19.5 19.5 (0.0) 80.5
4.2.WEST 100.0 42.6 40.3 2.3 57.4
under 15 years 100.0 - - - 100.0 15-24 years 100.0 25.7 20.6 5.1 74.3 25-34 years 100.0 78.5 73.7 4.8 21.5 35-44 years 100.0 84.3 80.8 3.5 15.7 45-54 years 100.0 71.4 68.7 2.7 28.6 55-64 years 100.0 34.9 34.1 (0.8) 65.1 65 years and over 100.0 (1.8) (1.8) (0.0) 98.2
MEN 100.0 51.5 48.6 2.9 48.5
under 15 years 100.0 - - - 100.0 15-24 years 100.0 29.5 24.4 (5.1) 70.5 25-34 years 100.0 91.1 84.9 6.2 8.9 35-44 years 100.0 94.5 90.6 (3.9) 5.5 45-54 years 100.0 82.5 78.7 (3.8) 17.5 55-64 years 100.0 46.4 45.5 (0.9) 53.6 65 years and over 100.0 (2.3) (2.2) (0.1) 97.7

244 Labour force in Romania: Employment and unemployment - 2015
Table 2.82. Structure of population by labour status, by macroregions, regions, gender, urban/rural area and groups of age
(continued) - % -
Economically active persons Macroregions Regions Gender Urban/rural area
Groups of age
Total population Total Employed Unemployed
Economically inactive persons
WOMEN 100.0 34.1 32.4 1.7 65.9
under 15 years 100.0 - - - 100.0 15-24 years 100.0 21.8 16.7 (5.1) 78.2 25-34 years 100.0 64.8 61.6 (3.2) 35.2 35-44 years 100.0 73.7 70.7 (3.0) 26.3 45-54 years 100.0 60.0 58.6 (1.4) 40.0 55-64 years 100.0 24.8 24.1 (0.7) 75.2 65 years and over 100.0 (1.4) (1.4) - 98.6
URBAN 100.0 43.6 41.5 2.1 56.4
under 15 years 100.0 - - - 100.0 15-24 years 100.0 22.5 17.4 (5.1) 77.5 25-34 years 100.0 80.1 75.2 4.9 19.9 35-44 years 100.0 85.7 83.5 (2.2) 14.3 45-54 years 100.0 70.0 67.4 (2.6) 30.0 55-64 years 100.0 33.0 32.7 (0.3) 67.0 65 years and over 100.0 (0.4) (0.3) (0.1) 99.6
RURAL 100.0 40.8 38.2 2.6 59.2
under 15 years 100.0 - - - 100.0 15-24 years 100.0 30.7 25.5 (5.2) 69.3 25-34 years 100.0 75.3 70.6 (4.7) 24.7 35-44 years 100.0 81.9 76.4 (5.5) 18.1 45-54 years 100.0 73.9 71.0 (2.9) 26.1 55-64 years 100.0 38.1 36.6 (1.5) 61.9 65 years and over 100.0 (3.6) (3.6) - 96.4

Tables 245
Table 2.83. Structure of employment by groups of age, macroregions, regions, gender, urban/rural area and activity sectors of the national economy
of which, in working age
Groups of age Employment
Total
Total 15-64 years
15-24 years
25-34 years
35-44 years
45-54 years
55-64 years
65 years and over
Macroregions Regions Gender Urban/rural area
Activities sectors of the national economy - persons - - percentages -
TOTAL 8535386 96.5 6.3 24.1 29.4 23.7 13.0 3.5 Agriculture 2183834 87.0 9.8 16.4 21.9 19.5 19.4 13.0 Industry and constructions 2429111 99.8 5.5 23.9 30.9 27.3 12.2 (0.2) Services 3922440 99.7 4.8 28.6 32.5 23.8 10.0 0.3
MEN 4848347 97.0 6.8 24.4 28.9 23.4 13.5 3.0
Agriculture 1240572 89.4 10.9 17.7 22.8 20.4 17.6 10.6 Industry and constructions 1692344 99.7 6.1 23.8 30.3 25.8 13.7 (0.3) Services 1915431 99.6 4.9 29.3 31.6 23.1 10.7 0.4
WOMEN 3687038 95.8 5.6 23.8 29.9 24.0 12.5 4.2
Agriculture 943262 83.8 8.3 14.8 20.7 18.2 21.8 16.2 Industry and constructions 736767 99.9 4.2 24.3 32.1 30.5 8.8 (0.1) Services 2007010 99.8 4.7 27.9 33.4 24.4 9.4 (0.2)
URBAN 4662492 99.6 4.1 27.4 30.9 25.2 12.0 0.4
Agriculture 180745 94.2 7.8 20.7 24.0 23.4 18.3 5.8 Industry and constructions 1525120 99.8 3.7 23.4 29.1 29.1 14.5 (0.2) Services 2956627 99.8 4.0 29.8 32.3 23.3 10.4 (0.2)
RURAL 3872894 92.8 9.0 20.2 27.5 21.8 14.3 7.2
Agriculture 2003089 86.4 10.0 16.1 21.7 19.1 19.5 13.6 Industry and constructions 903992 99.8 8.6 24.7 33.9 24.2 8.4 (0.2) Services 965813 99.5 7.3 24.7 33.4 25.1 9.0 (0.5)
1.MACROREGION ONE 2052039 98.4 5.4 26.1 30.3 24.2 12.4 1.6 Agriculture 342643 91.6 8.7 19.8 24.9 21.1 17.1 8.4 Industry and constructions 728388 99.8 5.5 25.0 29.8 26.7 12.8 (0.2) Services 981008 99.7 4.3 29.1 32.5 23.5 10.3 (0.3)
MEN 1175611 98.6 6.1 26.2 29.6 23.3 13.4 1.4
Agriculture 229590 94.4 9.3 22.0 26.0 21.7 15.4 5.6 Industry and constructions 486390 99.7 6.2 25.1 28.8 25.1 14.5 (0.3) Services 459631 99.5 4.3 29.5 32.3 22.3 11.1 (0.5)
WOMEN 876428 98.1 4.6 25.9 31.2 25.4 11.0 1.9
Agriculture 113053 86.0 7.5 15.5 22.5 19.8 20.7 14.0 Industry and constructions 241998 99.9 3.9 24.5 31.9 30.0 9.6 (0.1) Services 521377 99.9 4.3 28.8 32.7 24.5 9.6 (0.1)
URBAN 1215529 99.7 3.9 27.9 30.3 24.9 12.7 (0.3)
Agriculture 34926 97.7 (5.0) 23.6 30.6 20.3 (18.2) (2.3) Industry and constructions 455826 99.8 3.8 23.6 28.2 28.8 15.4 (0.2) Services 724777 99.8 3.8 30.9 31.6 22.8 10.7 (0.2)
RURAL 836510 96.4 7.7 23.4 30.3 23.2 11.8 3.6
Agriculture 307716 90.9 9.1 19.4 24.2 21.2 17.0 9.1 Industry and constructions 272563 99.8 8.2 27.2 32.6 23.3 8.5 (0.2) Services 256231 99.5 5.5 24.2 35.2 25.4 9.2 (0.5)
1.1.NORTH-WEST 1148516 97.6 5.6 26.9 29.6 23.3 12.2 2.4
Agriculture 232424 89.0 8.5 18.8 23.9 19.2 18.6 11.0 Industry and constructions 374697 99.7 6.1 26.4 30.3 25.8 11.1 (0.3) Services 541395 99.7 4.1 30.6 31.5 23.3 10.2 (0.3)
MEN 647672 97.9 6.3 26.6 29.0 22.7 13.3 2.1 Agriculture 145603 92.1 8.6 20.8 25.9 20.1 16.7 7.9 Industry and constructions 248758 99.6 7.1 26.3 28.3 25.2 12.7 (0.4) Services 253311 99.5 4.2 30.2 31.5 21.8 11.8 (0.5)

246 Labour force in Romania: Employment and unemployment - 2015
Table 2.83. Structure of employment by groups of age, macroregions, regions, gender,
urban/rural area and activity sectors of the national economy (continued)
of which, in working age
Groups of age Employment
Total
Total 15-64 years
15-24 years
25-34 years
35-44 years
45-54 years
55-64 years
65 years and over
Macroregions Regions Gender Urban/rural area
Activities sectors of the national economy - persons - - percentages -
WOMEN 500845 97.1 4.8 27.2 30.2 24.0 10.9 2.9 Agriculture 86821 83.8 8.2 15.4 20.6 17.8 21.8 16.2 Industry and constructions 125940 100.0 (4.0) 26.4 34.3 27.2 8.1 (0.0) Services 288084 99.9 4.1 31.0 31.4 24.5 8.9 (0.1)
URBAN 636308 99.7 3.7 29.9 29.6 24.3 12.2 (0.3)
Agriculture 12823 97.6 (1.4) (29.9) (26.8) (16.4) (23.1) (2.4) Industry and constructions 220745 99.8 4.4 24.9 28.5 27.9 14.1 (0.2) Services 402740 99.8 3.4 32.7 30.3 22.6 10.8 (0.2)
RURAL 512208 94.9 8.1 23.0 29.5 22.0 12.3 5.1
Agriculture 219600 88.5 8.9 18.2 23.7 19.4 18.3 11.5 Industry and constructions 153952 99.7 8.5 28.5 32.9 22.9 6.9 (0.3) Services 138656 99.5 6.2 24.7 34.9 25.1 8.6 (0.5)
1.2.CENTER 903523 99.4 5.2 25.1 31.2 25.4 12.5 (0.6)
Agriculture 110219 97.1 9.1 22.0 26.9 25.0 14.1 (2.9) Industry and constructions 353691 99.8 4.8 23.4 29.3 27.7 14.6 (0.2) Services 439613 99.7 4.5 27.3 33.8 23.7 10.4 (0.3)
MEN 527939 99.5 5.7 25.8 30.4 24.1 13.5 (0.5)
Agriculture 83987 98.3 10.5 23.9 26.2 24.5 13.2 (1.7) Industry and constructions 237633 99.8 5.2 23.9 29.3 25.1 16.3 (0.2) Services 206320 99.6 4.4 28.7 33.2 22.9 10.4 (0.4)
WOMEN 375583 99.4 4.4 24.2 32.4 27.3 11.1 (0.6)
Agriculture 26232 93.4 (4.8) (16.0) 29.0 26.6 (17.0) (6.6) Industry and constructions 116058 99.9 (3.9) 22.5 29.2 33.1 11.2 (0.1) Services 233293 99.8 4.6 26.0 34.3 24.5 10.4 (0.2)
URBAN 579221 99.7 4.1 25.8 31.0 25.6 13.2 (0.3)
Agriculture 22103 97.8 (7.1) (20.0) 32.8 (22.6) (15.3) (2.2) Industry and constructions 235080 99.8 3.2 22.4 27.9 29.6 16.7 (0.2) Services 322037 99.7 4.4 28.6 33.2 23.0 10.5 (0.3)
RURAL 324302 99.0 7.2 24.0 31.5 25.1 11.2 (1.0)
Agriculture 88116 97.0 9.6 22.6 25.4 25.6 13.8 (3.0) Industry and constructions 118610 99.8 7.8 25.4 32.1 23.9 10.6 (0.2) Services 117576 99.6 (4.6) 23.7 35.6 25.8 9.9 (0.4)
2.MACROREGION TWO 2589971 94.5 8.0 21.5 27.4 22.9 14.7 5.5 Agriculture 1057052 87.0 11.1 15.9 22.0 18.7 19.3 13.0 Industry and constructions 595711 99.8 7.3 23.2 28.8 27.8 12.7 (0.2) Services 937208 99.6 4.9 26.7 32.7 24.6 10.7 (0.4)
MEN 1477736 95.5 8.7 22.0 27.2 23.0 14.6 4.5
Agriculture 591151 89.4 12.2 16.6 22.6 19.9 18.1 10.6 Industry and constructions 439033 99.8 7.8 23.4 28.9 26.3 13.4 (0.2) Services 447552 99.5 5.0 27.8 31.6 24.0 11.1 (0.5)
WOMEN 1112235 93.2 7.0 20.7 27.8 22.8 14.9 6.8
Agriculture 465901 84.0 9.7 14.9 21.2 17.2 21.0 16.0 Industry and constructions 156678 99.9 5.7 22.4 28.8 32.0 11.0 (0.1) Services 489656 99.8 4.8 25.8 33.7 25.1 10.4 (0.2)
URBAN 1138637 99.3 4.3 25.0 30.1 26.5 13.4 0.7
Agriculture 92269 93.5 8.8 17.2 23.4 25.5 18.6 (6.5) Industry and constructions 360332 99.8 4.6 22.5 26.3 30.3 16.1 (0.2) Services 686035 99.8 3.6 27.3 33.0 24.6 11.3 (0.2)

Tables 247
Table 2.83. Structure of employment by groups of age, macroregions, regions, gender, urban/rural area and activity sectors of the national economy
(continued)
of which, in working age
Groups of age Employment
Total
Total 15-64 years
15-24 years
25-34 years
35-44 years
45-54 years
55-64 years
65 years and over
Macroregions Regions Gender Urban/rural area
Activities sectors of the national economy - persons - - percentages -
RURAL 1451334 90.8 10.8 18.7 25.4 20.1 15.8 9.2 Agriculture 964783 86.4 11.3 15.7 21.9 18.1 19.4 13.6 Industry and constructions 235378 99.9 11.4 24.2 32.7 24.0 7.6 (0.1) Services 251173 99.1 8.4 25.2 31.8 24.4 9.3 (0.9)
2.1.NORTH-EAST 1609602 92.7 9.2 20.8 26.0 21.8 14.9 7.3
Agriculture 798206 85.7 11.8 15.9 20.9 18.2 18.9 14.3 Industry and constructions 317295 99.8 8.6 23.3 28.2 27.4 12.3 (0.2) Services 494100 99.5 5.3 27.4 32.7 24.1 10.0 (0.5)
MEN 886799 94.0 10.0 21.7 25.9 21.8 14.6 6.0
Agriculture 422366 87.9 13.0 16.9 21.2 19.1 17.7 12.1 Industry and constructions 234946 99.8 9.3 24.2 28.3 25.2 12.8 (0.2) Services 229487 99.3 5.0 28.0 32.1 23.5 10.7 (0.7)
WOMEN 722803 91.2 8.2 19.9 26.1 21.8 15.2 8.8
Agriculture 375840 83.3 10.5 14.8 20.6 17.2 20.2 16.7 Industry and constructions 82349 99.8 (6.7) 20.5 27.9 33.8 10.9 (0.2) Services 264614 99.7 5.5 26.9 33.2 24.6 9.5 (0.3)
URBAN 608335 98.8 5.0 25.7 29.0 25.8 13.3 1.2
Agriculture 68951 91.5 10.5 16.6 18.8 24.9 20.7 (8.5) Industry and constructions 185411 99.7 5.4 24.0 25.2 29.4 15.7 (0.3) Services 353973 99.8 3.7 28.4 32.9 24.2 10.6 (0.2)
RURAL 1001266 89.0 11.7 17.9 24.2 19.4 15.8 11.0
Agriculture 729255 85.2 11.9 15.8 21.2 17.6 18.7 14.8 Industry and constructions 131884 99.9 13.1 22.3 32.3 24.7 7.5 (0.1) Services 140127 98.8 9.5 25.0 32.2 23.7 8.4 (1.2)
2.2.SOUTH-EAST 980369 97.5 6.0 22.5 29.8 24.7 14.5 2.5
Agriculture 258846 90.9 8.9 15.9 25.2 20.2 20.7 9.1 Industry and constructions 278415 99.8 5.7 23.1 29.6 28.1 13.3 (0.2) Services 443107 99.8 4.4 26.0 32.7 25.2 11.5 (0.2)
MEN 590938 97.8 6.8 22.6 29.1 24.7 14.6 2.2
Agriculture 168786 93.1 10.2 16.1 26.2 21.7 18.9 6.9 Industry and constructions 204087 99.8 6.2 22.5 29.5 27.5 14.1 (0.2) Services 218065 99.7 4.9 27.7 31.0 24.5 11.6 (0.3)
WOMEN 389432 96.9 4.7 22.4 30.9 24.6 14.3 3.1
Agriculture 90061 86.8 (6.3) 15.5 23.5 17.4 24.1 13.2 Industry and constructions 74328 99.9 (4.6) 24.6 29.6 30.0 11.1 (0.1) Services 225042 99.9 4.0 24.4 34.3 25.8 11.4 (0.1)
URBAN 530301 99.8 3.6 24.2 31.4 27.2 13.4 (0.2)
Agriculture 23318 99.5 (3.8) (18.9) 37.0 (27.2) (12.6) (0.5) Industry and constructions 174921 99.8 (3.6) 21.0 27.5 31.2 16.5 (0.2) Services 332062 99.9 3.6 26.2 33.1 25.1 11.9 (0.1)
RURAL 450068 94.6 8.8 20.5 27.9 21.8 15.6 5.4
Agriculture 235528 90.0 9.4 15.5 24.1 19.5 21.5 10.0 Industry and constructions 103494 99.9 9.3 26.7 33.1 23.0 7.8 (0.1) Services 111046 99.5 7.1 25.4 31.3 25.4 10.3 (0.5)
3.MACROREGION THREE 2354698 97.2 5.4 26.1 30.5 23.5 11.7 2.8 Agriculture 369279 83.7 7.1 13.8 20.4 20.3 22.1 16.3 Industry and constructions 582598 99.6 4.7 23.8 32.7 26.8 11.6 (0.4) Services 1402820 99.7 5.3 30.2 32.2 23.0 9.0 (0.3)
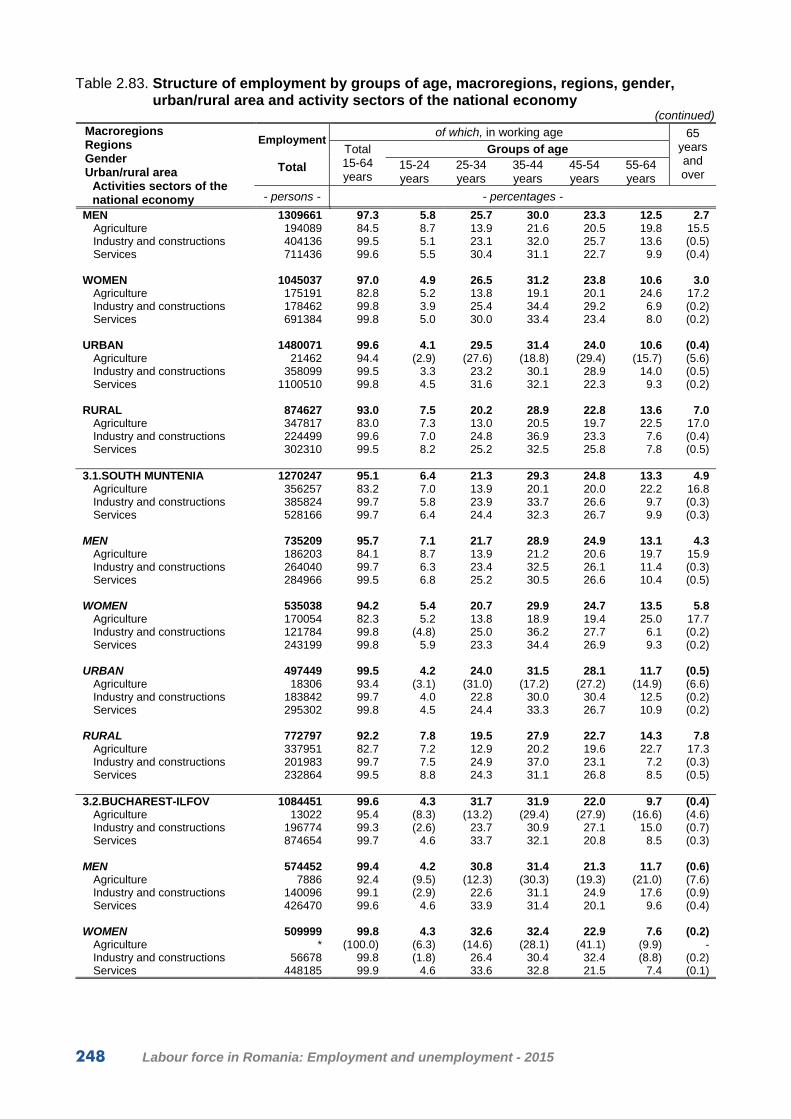
248 Labour force in Romania: Employment and unemployment - 2015
Table 2.83. Structure of employment by groups of age, macroregions, regions, gender, urban/rural area and activity sectors of the national economy
(continued)
of which, in working age
Groups of age Employment
Total
Total 15-64 years
15-24 years
25-34 years
35-44 years
45-54 years
55-64 years
65 years and over
Macroregions Regions Gender Urban/rural area
Activities sectors of the national economy - persons - - percentages -
MEN 1309661 97.3 5.8 25.7 30.0 23.3 12.5 2.7 Agriculture 194089 84.5 8.7 13.9 21.6 20.5 19.8 15.5 Industry and constructions 404136 99.5 5.1 23.1 32.0 25.7 13.6 (0.5) Services 711436 99.6 5.5 30.4 31.1 22.7 9.9 (0.4)
WOMEN 1045037 97.0 4.9 26.5 31.2 23.8 10.6 3.0
Agriculture 175191 82.8 5.2 13.8 19.1 20.1 24.6 17.2 Industry and constructions 178462 99.8 3.9 25.4 34.4 29.2 6.9 (0.2) Services 691384 99.8 5.0 30.0 33.4 23.4 8.0 (0.2)
URBAN 1480071 99.6 4.1 29.5 31.4 24.0 10.6 (0.4)
Agriculture 21462 94.4 (2.9) (27.6) (18.8) (29.4) (15.7) (5.6) Industry and constructions 358099 99.5 3.3 23.2 30.1 28.9 14.0 (0.5) Services 1100510 99.8 4.5 31.6 32.1 22.3 9.3 (0.2)
RURAL 874627 93.0 7.5 20.2 28.9 22.8 13.6 7.0
Agriculture 347817 83.0 7.3 13.0 20.5 19.7 22.5 17.0 Industry and constructions 224499 99.6 7.0 24.8 36.9 23.3 7.6 (0.4) Services 302310 99.5 8.2 25.2 32.5 25.8 7.8 (0.5)
3.1.SOUTH MUNTENIA 1270247 95.1 6.4 21.3 29.3 24.8 13.3 4.9
Agriculture 356257 83.2 7.0 13.9 20.1 20.0 22.2 16.8 Industry and constructions 385824 99.7 5.8 23.9 33.7 26.6 9.7 (0.3) Services 528166 99.7 6.4 24.4 32.3 26.7 9.9 (0.3)
MEN 735209 95.7 7.1 21.7 28.9 24.9 13.1 4.3
Agriculture 186203 84.1 8.7 13.9 21.2 20.6 19.7 15.9 Industry and constructions 264040 99.7 6.3 23.4 32.5 26.1 11.4 (0.3) Services 284966 99.5 6.8 25.2 30.5 26.6 10.4 (0.5)
WOMEN 535038 94.2 5.4 20.7 29.9 24.7 13.5 5.8
Agriculture 170054 82.3 5.2 13.8 18.9 19.4 25.0 17.7 Industry and constructions 121784 99.8 (4.8) 25.0 36.2 27.7 6.1 (0.2) Services 243199 99.8 5.9 23.3 34.4 26.9 9.3 (0.2)
URBAN 497449 99.5 4.2 24.0 31.5 28.1 11.7 (0.5)
Agriculture 18306 93.4 (3.1) (31.0) (17.2) (27.2) (14.9) (6.6) Industry and constructions 183842 99.7 4.0 22.8 30.0 30.4 12.5 (0.2) Services 295302 99.8 4.5 24.4 33.3 26.7 10.9 (0.2)
RURAL 772797 92.2 7.8 19.5 27.9 22.7 14.3 7.8
Agriculture 337951 82.7 7.2 12.9 20.2 19.6 22.7 17.3 Industry and constructions 201983 99.7 7.5 24.9 37.0 23.1 7.2 (0.3) Services 232864 99.5 8.8 24.3 31.1 26.8 8.5 (0.5)
3.2.BUCHAREST-ILFOV 1084451 99.6 4.3 31.7 31.9 22.0 9.7 (0.4)
Agriculture 13022 95.4 (8.3) (13.2) (29.4) (27.9) (16.6) (4.6) Industry and constructions 196774 99.3 (2.6) 23.7 30.9 27.1 15.0 (0.7) Services 874654 99.7 4.6 33.7 32.1 20.8 8.5 (0.3)
MEN 574452 99.4 4.2 30.8 31.4 21.3 11.7 (0.6)
Agriculture 7886 92.4 (9.5) (12.3) (30.3) (19.3) (21.0) (7.6) Industry and constructions 140096 99.1 (2.9) 22.6 31.1 24.9 17.6 (0.9) Services 426470 99.6 4.6 33.9 31.4 20.1 9.6 (0.4)
WOMEN 509999 99.8 4.3 32.6 32.4 22.9 7.6 (0.2)
Agriculture * (100.0) (6.3) (14.6) (28.1) (41.1) (9.9) - Industry and constructions 56678 99.8 (1.8) 26.4 30.4 32.4 (8.8) (0.2) Services 448185 99.9 4.6 33.6 32.8 21.5 7.4 (0.1)

Tables 249
Table 2.83. Structure of employment by groups of age, macroregions, regions, gender, urban/rural area and activity sectors of the national economy
(continued)
of which, in working age
Groups of age Employment
Total
Total 15-64 years
15-24 years
25-34 years
35-44 years
45-54 years
55-64 years
65 years and over
Macroregions Regions Gender Urban/rural area
Activities sectors of the national economy - persons - - percentages -
URBAN 982622 99.7 4.1 32.3 31.4 21.9 10.0 (0.3)
Agriculture * (100.0) (1.8) (7.8) (28.1) (42.0) (20.3) - Industry and constructions 174258 99.3 (2.6) 23.7 30.2 27.2 15.6 (0.7) Services 805208 99.8 4.5 34.2 31.7 20.7 8.7 (0.2)
RURAL 101829 98.7 (5.7) 25.8 36.3 23.4 7.5 (1.3)
Agriculture 9866 93.9 (10.3) (14.9) (29.9) (23.4) (15.4) (6.1) Industry and constructions 22517 98.7 (2.2) (23.4) 35.9 (26.0) (11.2) (1.3) Services 69447 99.3 (6.2) 28.1 37.3 22.5 (5.2) (0.7)
4.MACROREGION FOUR 1538678 96.2 5.9 23.0 29.6 24.4 13.3 3.8 Agriculture 414860 86.2 9.7 17.4 20.6 19.4 19.1 13.8 Industry and constructions 522414 99.9 4.5 23.4 32.6 28.0 11.4 (0.1) Services 601404 99.9 4.4 26.7 33.2 24.6 11.0 (0.1)
MEN 885339 97.0 6.2 23.8 29.4 24.2 13.4 3.0
Agriculture 225743 88.8 10.7 19.3 21.3 20.6 16.9 11.2 Industry and constructions 362785 99.9 5.0 23.0 32.4 26.4 13.1 (0.1) Services 296812 99.8 4.3 28.3 32.0 24.2 11.0 (0.2)
WOMEN 653339 95.1 5.5 22.0 29.8 24.6 13.2 4.9
Agriculture 189117 83.2 8.5 15.2 19.7 18.1 21.7 16.8 Industry and constructions 159629 100.0 (3.4) 24.3 33.2 31.6 7.5 - Services 304593 99.9 4.6 25.0 34.4 25.0 10.9 (0.1)
URBAN 828255 99.6 3.7 26.1 32.0 26.0 11.8 (0.4)
Agriculture 32087 92.1 (11.3) 22.7 22.2 (16.9) (19.0) (7.9) Industry and constructions 350863 99.9 3.0 24.4 32.0 28.5 12.0 (0.1) Services 445305 99.9 3.7 27.7 32.7 24.7 11.1 (0.1)
RURAL 710423 92.2 8.4 19.5 26.8 22.5 15.0 7.8
Agriculture 382773 85.7 9.6 17.0 20.4 19.6 19.1 14.3 Industry and constructions 171551 99.9 7.6 21.4 34.0 26.8 10.1 (0.1) Services 156099 99.8 6.5 23.8 34.6 24.5 10.4 (0.2)
4.1.SOUTH-WEST OLTENIA 809403 93.4 6.1 19.8 28.1 25.0 14.4 6.6
Agriculture 337208 84.4 9.6 16.9 20.5 18.6 18.8 15.6 Industry and constructions 194722 99.9 (3.2) 18.9 32.3 33.5 12.0 (0.1) Services 277473 99.8 3.8 24.0 34.5 26.8 10.7 (0.2)
MEN 456865 94.8 6.6 20.8 28.5 25.0 13.9 5.2
Agriculture 179916 87.2 11.1 18.4 21.0 20.2 16.5 12.8 Industry and constructions 139715 99.9 (3.6) 20.4 33.0 29.9 13.0 (0.1) Services 137233 99.7 (3.7) 24.3 33.9 26.2 11.6 (0.3)
WOMEN 352538 91.6 5.4 18.6 27.6 25.0 15.0 8.4
Agriculture 157292 81.2 7.9 15.2 19.9 16.7 21.5 18.8 Industry and constructions 55006 100.0 (2.0) 15.2 30.4 42.7 (9.7) - Services 140240 99.9 (3.9) 23.7 35.0 27.4 9.9 (0.1)
URBAN 365554 99.2 2.7 22.9 32.0 29.3 12.3 (0.8)
Agriculture 18903 87.2 (5.5) (23.7) (19.3) (17.2) (21.5) (12.8) Industry and constructions 134620 99.9 (2.3) 19.2 31.0 33.3 14.1 (0.1) Services 212030 99.9 (2.7) 25.3 33.7 27.8 10.4 (0.1)
RURAL 443849 88.6 8.8 17.2 25.0 21.4 16.2 11.4
Agriculture 318304 84.2 9.8 16.5 20.6 18.6 18.7 15.8 Industry and constructions 60102 100.0 (5.3) 18.2 35.2 33.8 (7.5) - Services 65443 99.7 (7.2) 19.9 36.9 23.8 11.9 (0.3)

250 Labour force in Romania: Employment and unemployment - 2015
Table 2.83. Structure of employment by groups of age, macroregions, regions, gender, urban/rural area and activity sectors of the national economy
(continued)
of which, in working age
Groups of age Employment
Total
Total 15-64 years
15-24 years
25-34 years
35-44 years
45-54 years
55-64 years
65 years and over
Macroregions Regions Gender Urban/rural area
Activities sectors of the national economy - persons - - percentages -
4.2.WEST 729275 99.3 5.7 26.7 31.2 23.7 12.0 (0.7)
Agriculture 77652 94.1 10.1 19.8 20.7 23.4 20.1 (5.9) Industry and constructions 327692 99.9 5.3 26.1 32.9 24.7 10.9 (0.1) Services 323931 99.9 5.0 29.0 32.1 22.7 11.1 (0.1)
MEN 428474 99.4 5.9 27.1 30.3 23.3 12.8 (0.6)
Agriculture 45827 95.1 (9.1) 23.2 22.2 22.1 18.5 (4.9) Industry and constructions 223069 99.8 5.9 24.6 32.0 24.2 13.1 (0.2) Services 159578 99.9 4.9 31.8 30.3 22.4 10.5 (0.1)
WOMEN 300801 99.1 5.5 26.0 32.4 24.2 11.0 (0.9)
Agriculture 31825 92.8 (11.7) (14.8) (18.7) 25.3 22.3 (7.2) Industry and constructions 104623 100.0 (4.2) 29.2 34.6 25.7 6.3 - Services 164353 99.8 5.1 26.2 33.8 23.0 11.7 (0.2)
URBAN 462701 99.9 4.6 28.5 32.0 23.4 11.4 (0.1)
Agriculture 13184 99.1 (19.5) (21.3) (26.3) (16.5) (15.5) (0.9) Industry and constructions 216243 99.9 3.5 27.6 32.6 25.5 10.7 (0.1) Services 233275 99.9 4.7 29.9 31.7 21.8 11.8 (0.1)
RURAL 266574 98.2 7.7 23.4 29.9 24.2 13.0 (1.8)
Agriculture 64468 93.1 (8.2) 19.5 19.6 24.8 21.0 (6.9) Industry and constructions 111449 99.8 8.8 23.2 33.3 23.1 11.4 (0.2) Services 90656 99.9 (5.9) 26.6 32.9 25.1 9.4 (0.1)

Tables 251
Table 2.84. Structure of employment by status in employment, by macroregions, regions, gender, urban/rural area and groups of age
Status in employment, of which: Macroregions Regions Gender Urban/rural area
Groups of age
Employment
Total Employee Employer Self-employed Contributing family worker
TOTAL - persons - 8535386 6062244 96002 1560559 816580 - in % by groups of age -
Total 15-64 years 96.5 99.8 99.0 87.0 89.7 15-24 years 6.3 5.0 (1.2) 4.4 20.3 25-34 years 24.1 26.8 15.8 15.6 21.5 35-44 years 29.4 31.9 35.5 24.5 18.9 45-54 years 23.7 25.2 33.4 22.5 13.6 55-64 years 13.0 10.9 13.1 20.0 15.4 65 years and over 3.5 0.2 (1.0) 13.0 10.3
MEN - persons - 4848347 3398595 71659 1111507 266586
- in % by groups of age - Total 15-64 years 97.0 99.7 98.9 88.9 96.2
15-24 years 6.8 5.2 (1.4) 4.8 36.8 25-34 years 24.4 26.7 14.9 16.3 31.4 35-44 years 28.9 31.0 34.7 25.5 15.3 45-54 years 23.4 24.5 33.7 23.2 7.2 55-64 years 13.5 12.3 14.2 19.1 5.5 65 years and over 3.0 0.3 (1.1) 11.1 3.8
WOMEN - persons - 3687038 2663649 24344 449053 549994
- in % by groups of age - Total 15-64 years 95.8 99.9 99.2 82.2 86.5
15-24 years 5.6 4.6 (0.6) 3.3 12.2 25-34 years 23.8 27.0 (18.3) 13.8 16.7 35-44 years 29.9 33.1 38.0 21.9 20.7 45-54 years 24.0 26.0 32.6 20.8 16.7 55-64 years 12.5 9.2 (9.7) 22.4 20.2 65 years and over 4.2 (0.1) (0.8) 17.8 13.5
URBAN - persons - 4662492 4280039 69044 269194 44216
- in % by groups of age - Total 15-64 years 99.6 99.8 99.3 96.9 91.7
15-24 years 4.1 3.9 (0.9) 5.5 18.7 25-34 years 27.4 27.8 16.1 24.3 21.6 35-44 years 30.9 31.2 35.2 27.0 19.2 45-54 years 25.2 25.2 33.6 25.0 15.6 55-64 years 12.0 11.7 13.5 15.1 16.6 65 years and over 0.4 0.2 (0.7) 3.1 (8.3)
RURAL - persons - 3872894 1782205 26958 1291366 772364
- in % by groups of age - Total 15-64 years 92.8 99.8 98.1 84.9 89.6
15-24 years 9.0 7.6 (1.9) 4.2 20.3 25-34 years 20.2 24.5 (14.9) 13.8 21.5 35-44 years 27.5 33.7 36.5 23.9 18.9 45-54 years 21.8 25.1 33.0 21.9 13.5 55-64 years 14.3 8.9 (11.8) 21.1 15.4 65 years and over 7.2 (0.2) (1.9) 15.1 10.4

252 Labour force in Romania: Employment and unemployment - 2015
Table 2.84. Structure of employment by status in employment, by macroregions, regions,
gender, urban/rural area and groups of age (continued)
Status in employment, of which: Macroregions Regions Gender Urban/rural area
Groups of age
Employment
Total Employee Employer Self-employed Contributing family worker
1.MACROREGION ONE - persons - 2052039 1646702 21845 292947 90545
- in % by groups of age - Total 15-64 years 98.4 99.8 99.5 92.7 90.7
15-24 years 5.4 4.8 (1.2) 4.6 20.2 25-34 years 26.1 27.4 (19.4) 19.4 26.6 35-44 years 30.3 31.4 39.5 27.0 18.0 45-54 years 24.2 24.9 (29.4) 24.1 11.6 55-64 years 12.4 11.3 (10.0) 17.6 14.3 65 years and over 1.6 (0.2) (0.5) 7.3 9.3
MEN - persons - 1175611 898883 16926 226492 33311
- in % by groups of age - Total 15-64 years 98.6 99.7 99.4 94.4 97.7
15-24 years 6.1 5.4 (1.1) 5.0 34.0 25-34 years 26.2 27.3 (17.6) 20.6 39.6 35-44 years 29.6 30.5 40.9 27.2 (15.8) 45-54 years 23.3 23.6 (28.8) 24.8 (5.2) 55-64 years 13.4 12.9 (11.0) 16.8 (3.1) 65 years and over 1.4 (0.3) (0.6) 5.6 (2.3)
WOMEN - persons - 876428 747819 * 66455 57235
- in % by groups of age - Total 15-64 years 98.1 99.9 (100.0) 87.0 86.6
15-24 years 4.6 4.1 (1.4) (3.3) 12.1 25-34 years 25.9 27.4 (25.8) 15.4 19.0 35-44 years 31.2 32.5 (34.5) 26.2 19.4 45-54 years 25.4 26.5 (31.6) 21.7 15.3 55-64 years 11.0 9.4 (6.7) 20.4 20.8 65 years and over 1.9 (0.1) - 13.0 13.4
URBAN - persons - 1215529 1135843 16008 56799 6879
- in % by groups of age - Total 15-64 years 99.7 99.8 99.3 98.4 99.5
15-24 years 3.9 3.9 - (2.9) (14.6) 25-34 years 27.9 28.3 (20.7) 22.6 (32.0) 35-44 years 30.3 30.3 (37.4) 27.0 (35.4) 45-54 years 24.9 24.9 (30.7) 27.5 (5.9) 55-64 years 12.7 12.4 (10.5) 18.4 (11.6) 65 years and over (0.3) (0.2) (0.7) (1.6) (0.5)
RURAL - persons - 836510 510859 * 236148 83667
- in % by groups of age - Total 15-64 years 96.4 99.8 (100.0) 91.3 89.9
15-24 years 7.7 6.9 (4.4) 5.0 20.7 25-34 years 23.4 25.2 (15.7) 18.7 26.1 35-44 years 30.3 33.9 (45.2) 27.0 16.6 45-54 years 23.2 24.9 (25.9) 23.2 12.0 55-64 years 11.8 8.9 (8.8) 17.4 14.5 65 years and over 3.6 (0.2) - 8.7 10.1

Tables 253
Table 2.84. Structure of employment by status in employment, by macroregions, regions, gender, urban/rural area and groups of age
(continued)
Status in employment, of which: Macroregions Regions Gender Urban/rural area
Groups of age
Employment
Total Employee Employer Self-employed Contributing family worker
1.1.NORTH-WEST - persons -
1148516
887752
13431
177831
69502 - in % by groups of age -
Total 15-64 years 97.6 99.8 99.2 89.6 88.8 15-24 years 5.6 4.9 (1.4) 3.7 21.0 25-34 years 26.9 28.7 (20.0) 18.6 25.1 35-44 years 29.6 31.2 (37.9) 26.4 15.6 45-54 years 23.3 24.3 (29.0) 22.4 11.0 55-64 years 12.2 10.7 (10.9) 18.5 16.1 65 years and over 2.4 (0.2) (0.8) 10.4 11.2
MEN - persons - 647672 481673 9901 132869 23229
- in % by groups of age - Total 15-64 years 97.9 99.7 98.9 91.3 97.4
15-24 years 6.3 5.5 (1.9) (4.1) 36.5 25-34 years 26.6 28.0 (16.2) 20.0 39.4 35-44 years 29.0 30.3 (42.1) 26.2 (13.2) 45-54 years 22.7 23.3 (27.2) 23.3 (5.4) 55-64 years 13.3 12.6 (11.5) 17.7 (2.9) 65 years and over 2.1 (0.3) (1.1) 8.7 (2.6)
WOMEN - persons - 500845 406079 * 44962 46273
- in % by groups of age - Total 15-64 years 97.1 100.0 (100.0) 84.5 84.5
15-24 years 4.8 4.1 - (2.4) (13.2) 25-34 years 27.2 29.6 (30.7) 14.6 18.0 35-44 years 30.2 32.2 (26.2) 26.9 16.8 45-54 years 24.0 25.6 (33.9) 19.8 (13.8) 55-64 years 10.9 8.5 (9.2) 20.8 22.7 65 years and over 2.9 (0.0) - 15.5 15.5
URBAN - persons - 636308 599186 10676 25769 *
- in % by groups of age - Total 15-64 years 99.7 99.8 99.0 98.2 (100.0)
15-24 years 3.7 3.8 - (3.7) - 25-34 years 29.9 30.2 (22.3) 26.1 (40.3) 35-44 years 29.6 29.5 (35.8) 29.2 - 45-54 years 24.3 24.2 (29.6) (24.4) (14.0) 55-64 years 12.2 12.1 (11.3) (14.8) (45.7) 65 years and over (0.3) (0.2) (1.0) (1.8) -
RURAL - persons - 512208 288567 * 152062 68825
- in % by groups of age - Total 15-64 years 94.9 99.8 (100.0) 88.1 88.7
15-24 years 8.1 7.2 (6.9) (3.7) 21.2 25-34 years 23.0 25.7 (11.2) 17.3 25.0 35-44 years 29.5 34.5 (46.1) 25.9 15.8 45-54 years 22.0 24.6 (26.2) 22.1 10.9 55-64 years 12.3 7.8 (9.6) 19.1 15.8 65 years and over 5.1 (0.2) - 11.9 11.3

254 Labour force in Romania: Employment and unemployment - 2015
Table 2.84. Structure of employment by status in employment, by macroregions, regions, gender, urban/rural area and groups of age
(continued)
Status in employment, of which: Macroregions Regions Gender Urban/rural area
Groups of age
Employment
Total Employee Employer Self-employed Contributing family worker
1.2.CENTER - persons - 903523 758950 8414 115116 21043
- in % by groups of age - Total 15-64 years 99.4 99.8 100.0 97.5 96.8
15-24 years 5.2 4.8 (0.8) 6.0 (17.6) 25-34 years 25.1 25.7 (18.5) 20.8 31.3 35-44 years 31.2 31.7 (41.9) 27.9 (26.2) 45-54 years 25.4 25.5 (30.2) 26.6 (13.5) 55-64 years 12.5 12.1 (8.6) 16.2 (8.2) 65 years and over (0.6) (0.2) - (2.5) (3.2)
MEN - persons - 527939 417210 7025 93623 10082
- in % by groups of age - Total 15-64 years 99.5 99.7 100.0 98.8 98.4
15-24 years 5.7 5.2 - (6.3) (28.3) 25-34 years 25.8 26.5 (19.5) 21.6 (39.9) 35-44 years 30.4 30.8 (39.1) 28.6 (21.7) 45-54 years 24.1 23.9 (31.0) 26.8 (4.9) 55-64 years 13.5 13.3 (10.4) 15.5 (3.6) 65 years and over (0.5) (0.3) - (1.2) (1.6)
WOMEN - persons - 375583 341740 * 21493 10961
- in % by groups of age - Total 15-64 years 99.4 99.9 (100.0) 92.2 95.3
15-24 years 4.4 4.2 (4.9) (5.1) (7.7) 25-34 years 24.2 24.7 (13.5) (17.3) (23.3) 35-44 years 32.4 32.8 (55.8) (24.9) (30.3) 45-54 years 27.3 27.6 (25.8) (25.4) (21.5) 55-64 years 11.1 10.6 - (19.5) (12.5) 65 years and over (0.6) (0.1) - (7.8) (4.7)
URBAN - persons - 579221 536657 * 31030 *
- in % by groups of age - Total 15-64 years 99.7 99.8 (100.0) 98.5 (99.4)
15-24 years 4.1 4.1 - (2.3) (16.1) 25-34 years 25.8 26.1 (17.7) (19.7) (31.1) 35-44 years 31.0 31.2 (40.4) 25.1 (39.3) 45-54 years 25.6 25.6 (32.9) 30.0 (5.0) 55-64 years 13.2 12.8 (9.0) 21.4 (7.9) 65 years and over (0.3) (0.2) - (1.5) (0.6)
RURAL - persons - 324302 222292 * 84086 14842
- in % by groups of age - Total 15-64 years 99.0 99.8 (100.0) 97.2 95.7
15-24 years 7.2 6.4 (2.2) (7.4) (18.2) 25-34 years 24.0 24.7 (19.8) 21.2 (31.3) 35-44 years 31.5 33.0 (44.4) 28.9 (20.7) 45-54 years 25.1 25.5 (25.5) 25.3 (17.1) 55-64 years 11.2 10.2 (8.1) 14.4 (8.4) 65 years and over (1.0) (0.2) - (2.8) (4.3)

Tables 255
Table 2.84. Structure of employment by status in employment, by macroregions, regions, gender, urban/rural area and groups of age
(continued)
Status in employment, of which: Macroregions Regions Gender Urban/rural area
Groups of age
Employment
Total Employee Employer Self-employed Contributing family worker
2.MACROREGION TWO - persons - 2589971 1410247 30091 718090 431543
- in % by groups of age - Total 15-64 years 94.5 99.8 98.2 86.3 90.7
15-24 years 8.0 5.2 (1.2) 4.7 23.0 25-34 years 21.5 25.4 (16.6) 14.5 20.8 35-44 years 27.4 31.4 29.9 24.5 19.2 45-54 years 22.9 26.2 33.7 21.7 13.4 55-64 years 14.7 11.6 (16.8) 20.9 14.3 65 years and over 5.5 (0.2) (1.8) 13.7 9.3
MEN - persons - 1477736 802203 21752 516873 136908
- in % by groups of age - Total 15-64 years 95.5 99.7 97.5 88.3 98.0
15-24 years 8.7 5.4 (1.4) 5.1 42.8 25-34 years 22.0 25.5 (12.6) 14.8 30.4 35-44 years 27.2 30.3 (27.9) 25.8 14.4 45-54 years 23.0 25.9 37.4 22.4 6.2 55-64 years 14.6 12.6 (18.2) 20.2 (4.2) 65 years and over 4.5 (0.3) (2.5) 11.7 (2.0)
WOMEN - persons - 1112235 608043 8339 201217 294635
- in % by groups of age - Total 15-64 years 93.2 99.9 100.0 81.3 87.2
15-24 years 7.0 4.9 (0.6) 3.6 13.8 25-34 years 20.7 25.1 (26.7) 13.8 16.3 35-44 years 27.8 33.0 (35.2) 21.0 21.4 45-54 years 22.8 26.6 (24.1) 20.1 16.7 55-64 years 14.9 10.3 (13.4) 22.8 19.0 65 years and over 6.8 (0.1) - 18.7 12.8
URBAN - persons - 1138637 974660 21162 115139 27675
- in % by groups of age - Total 15-64 years 99.3 99.8 99.1 96.3 93.0
15-24 years 4.3 3.7 (1.0) 6.6 (18.4) 25-34 years 25.0 25.3 (18.5) 24.5 (19.1) 35-44 years 30.1 31.0 (28.6) 25.9 (17.9) 45-54 years 26.5 26.9 33.8 23.2 (20.9) 55-64 years 13.4 12.9 (17.2) 16.1 (16.7) 65 years and over 0.7 (0.2) (0.9) (3.7) (7.0)
RURAL - persons - 1451334 435586 8929 602951 403868
- in % by groups of age - Total 15-64 years 90.8 99.8 95.9 84.4 90.5
15-24 years 10.8 8.4 (1.6) 4.3 23.3 25-34 years 18.7 25.4 (11.8) 12.6 20.9 35-44 years 25.4 32.5 (33.0) 24.2 19.3 45-54 years 20.1 24.7 (33.4) 21.5 12.8 55-64 years 15.8 8.8 (16.1) 21.8 14.2 65 years and over 9.2 (0.2) (4.1) 15.6 9.5
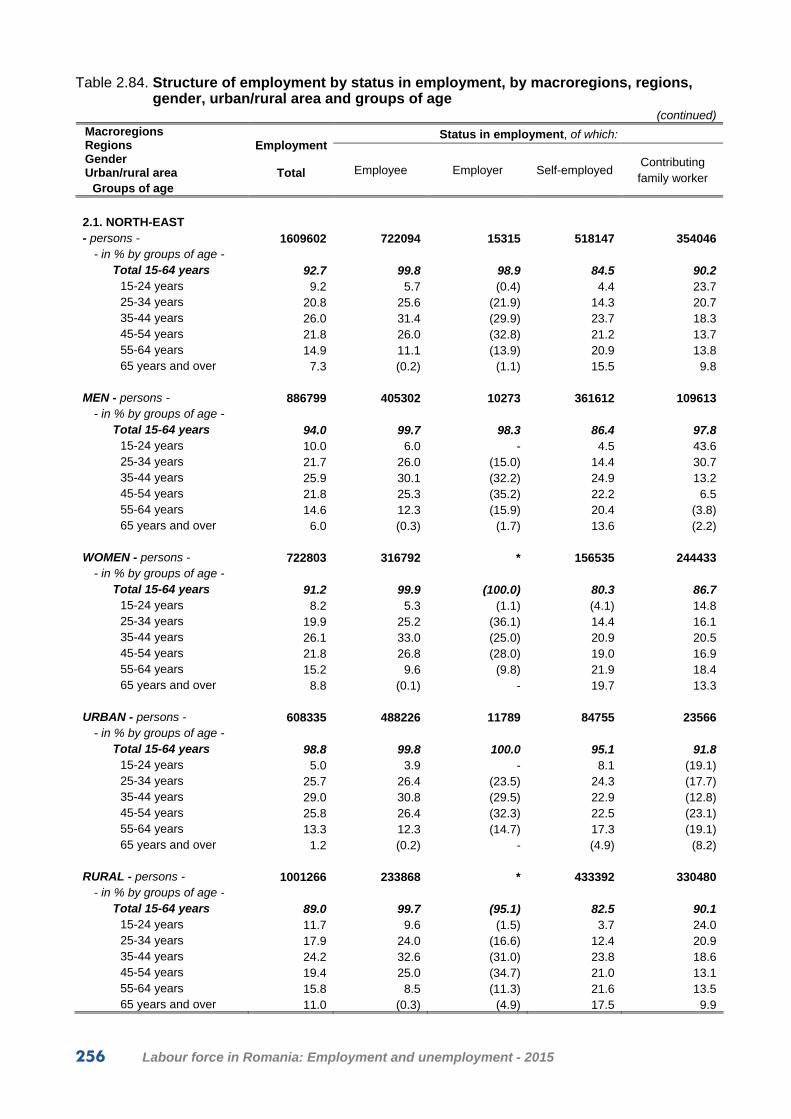
256 Labour force in Romania: Employment and unemployment - 2015
Table 2.84. Structure of employment by status in employment, by macroregions, regions, gender, urban/rural area and groups of age
(continued)
Status in employment, of which: Macroregions Regions Gender Urban/rural area
Groups of age
Employment
Total Employee Employer Self-employed Contributing family worker
2.1. NORTH-EAST - persons - 1609602 722094 15315 518147 354046
- in % by groups of age - Total 15-64 years 92.7 99.8 98.9 84.5 90.2
15-24 years 9.2 5.7 (0.4) 4.4 23.7 25-34 years 20.8 25.6 (21.9) 14.3 20.7 35-44 years 26.0 31.4 (29.9) 23.7 18.3 45-54 years 21.8 26.0 (32.8) 21.2 13.7 55-64 years 14.9 11.1 (13.9) 20.9 13.8 65 years and over 7.3 (0.2) (1.1) 15.5 9.8
MEN - persons - 886799 405302 10273 361612 109613
- in % by groups of age - Total 15-64 years 94.0 99.7 98.3 86.4 97.8
15-24 years 10.0 6.0 - 4.5 43.6 25-34 years 21.7 26.0 (15.0) 14.4 30.7 35-44 years 25.9 30.1 (32.2) 24.9 13.2 45-54 years 21.8 25.3 (35.2) 22.2 6.5 55-64 years 14.6 12.3 (15.9) 20.4 (3.8) 65 years and over 6.0 (0.3) (1.7) 13.6 (2.2)
WOMEN - persons - 722803 316792 * 156535 244433
- in % by groups of age - Total 15-64 years 91.2 99.9 (100.0) 80.3 86.7
15-24 years 8.2 5.3 (1.1) (4.1) 14.8 25-34 years 19.9 25.2 (36.1) 14.4 16.1 35-44 years 26.1 33.0 (25.0) 20.9 20.5 45-54 years 21.8 26.8 (28.0) 19.0 16.9 55-64 years 15.2 9.6 (9.8) 21.9 18.4 65 years and over 8.8 (0.1) - 19.7 13.3
URBAN - persons - 608335 488226 11789 84755 23566
- in % by groups of age - Total 15-64 years 98.8 99.8 100.0 95.1 91.8
15-24 years 5.0 3.9 - 8.1 (19.1) 25-34 years 25.7 26.4 (23.5) 24.3 (17.7) 35-44 years 29.0 30.8 (29.5) 22.9 (12.8) 45-54 years 25.8 26.4 (32.3) 22.5 (23.1) 55-64 years 13.3 12.3 (14.7) 17.3 (19.1) 65 years and over 1.2 (0.2) - (4.9) (8.2)
RURAL - persons - 1001266 233868 * 433392 330480
- in % by groups of age - Total 15-64 years 89.0 99.7 (95.1) 82.5 90.1
15-24 years 11.7 9.6 (1.5) 3.7 24.0 25-34 years 17.9 24.0 (16.6) 12.4 20.9 35-44 years 24.2 32.6 (31.0) 23.8 18.6 45-54 years 19.4 25.0 (34.7) 21.0 13.1 55-64 years 15.8 8.5 (11.3) 21.6 13.5 65 years and over 11.0 (0.3) (4.9) 17.5 9.9
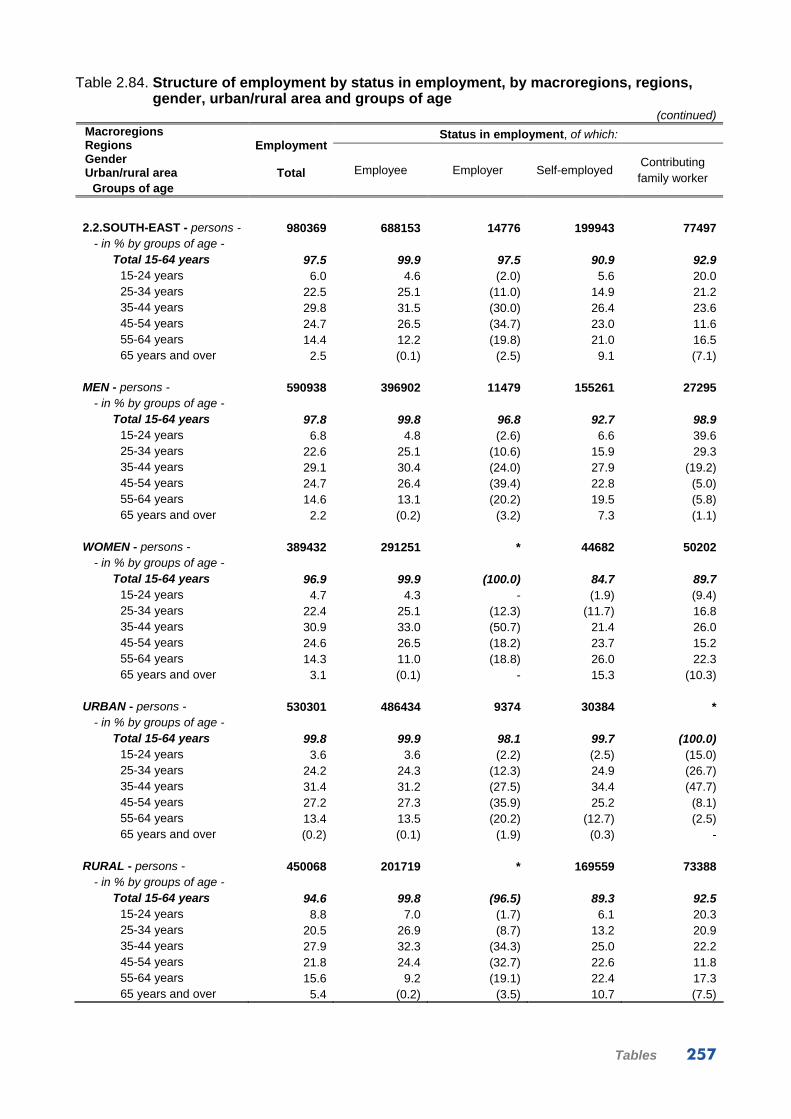
Tables 257
Table 2.84. Structure of employment by status in employment, by macroregions, regions, gender, urban/rural area and groups of age
(continued)
Status in employment, of which: Macroregions Regions Gender Urban/rural area
Groups of age
Employment
Total Employee Employer Self-employed Contributing family worker
2.2.SOUTH-EAST - persons - 980369 688153 14776 199943 77497
- in % by groups of age - Total 15-64 years 97.5 99.9 97.5 90.9 92.9
15-24 years 6.0 4.6 (2.0) 5.6 20.0 25-34 years 22.5 25.1 (11.0) 14.9 21.2 35-44 years 29.8 31.5 (30.0) 26.4 23.6 45-54 years 24.7 26.5 (34.7) 23.0 11.6 55-64 years 14.4 12.2 (19.8) 21.0 16.5 65 years and over 2.5 (0.1) (2.5) 9.1 (7.1)
MEN - persons - 590938 396902 11479 155261 27295
- in % by groups of age - Total 15-64 years 97.8 99.8 96.8 92.7 98.9
15-24 years 6.8 4.8 (2.6) 6.6 39.6 25-34 years 22.6 25.1 (10.6) 15.9 29.3 35-44 years 29.1 30.4 (24.0) 27.9 (19.2) 45-54 years 24.7 26.4 (39.4) 22.8 (5.0) 55-64 years 14.6 13.1 (20.2) 19.5 (5.8) 65 years and over 2.2 (0.2) (3.2) 7.3 (1.1)
WOMEN - persons - 389432 291251 * 44682 50202
- in % by groups of age - Total 15-64 years 96.9 99.9 (100.0) 84.7 89.7
15-24 years 4.7 4.3 - (1.9) (9.4) 25-34 years 22.4 25.1 (12.3) (11.7) 16.8 35-44 years 30.9 33.0 (50.7) 21.4 26.0 45-54 years 24.6 26.5 (18.2) 23.7 15.2 55-64 years 14.3 11.0 (18.8) 26.0 22.3 65 years and over 3.1 (0.1) - 15.3 (10.3)
URBAN - persons - 530301 486434 9374 30384 *
- in % by groups of age - Total 15-64 years 99.8 99.9 98.1 99.7 (100.0)
15-24 years 3.6 3.6 (2.2) (2.5) (15.0) 25-34 years 24.2 24.3 (12.3) 24.9 (26.7) 35-44 years 31.4 31.2 (27.5) 34.4 (47.7) 45-54 years 27.2 27.3 (35.9) 25.2 (8.1) 55-64 years 13.4 13.5 (20.2) (12.7) (2.5) 65 years and over (0.2) (0.1) (1.9) (0.3) -
RURAL - persons - 450068 201719 * 169559 73388
- in % by groups of age - Total 15-64 years 94.6 99.8 (96.5) 89.3 92.5
15-24 years 8.8 7.0 (1.7) 6.1 20.3 25-34 years 20.5 26.9 (8.7) 13.2 20.9 35-44 years 27.9 32.3 (34.3) 25.0 22.2 45-54 years 21.8 24.4 (32.7) 22.6 11.8 55-64 years 15.6 9.2 (19.1) 22.4 17.3 65 years and over 5.4 (0.2) (3.5) 10.7 (7.5)

258 Labour force in Romania: Employment and unemployment - 2015
Table 2.84. Structure of employment by status in employment, by macroregions, regions, gender, urban/rural area and groups of age
(continued)
Status in employment, of which: Macroregions Regions Gender Urban/rural area
Groups of age
Employment
Total Employee Employer Self-employed Contributing family worker
3.MACROREGION THREE - persons - 2354698 1893399 34365 316528 110407
- in % by groups of age - Total 15-64 years 97.2 99.7 99.3 84.9 87.3
15-24 years 5.4 5.2 (1.5) 3.4 16.2 25-34 years 26.1 28.4 (13.8) 15.9 19.1 35-44 years 30.5 32.1 40.2 23.9 17.4 45-54 years 23.5 24.2 34.8 21.9 13.6 55-64 years 11.7 9.8 (9.0) 19.8 21.0 65 years and over 2.8 (0.3) (0.7) 15.1 12.7
MEN - persons - 1309661 1041739 26744 209455 31723
- in % by groups of age - Total 15-64 years 97.3 99.6 99.5 86.0 93.3
15-24 years 5.8 5.4 (1.9) 4.2 34.8 25-34 years 25.7 27.7 (15.3) 17.2 26.5 35-44 years 30.0 31.3 38.4 24.1 (16.2) 45-54 years 23.3 23.8 34.0 21.8 (6.8) 55-64 years 12.5 11.4 (9.9) 18.7 (9.0) 65 years and over 2.7 (0.4) (0.5) 14.0 (6.7)
WOMEN - persons - 1045037 851660 7621 107072 78684
- in % by groups of age - Total 15-64 years 97.0 99.9 98.5 82.7 84.9
15-24 years 4.9 4.9 - (1.9) 8.8 25-34 years 26.5 29.3 (8.6) 13.3 16.1 35-44 years 31.2 33.2 (46.5) 23.4 17.9 45-54 years 23.8 24.6 (37.8) 22.0 16.3 55-64 years 10.6 7.9 (5.6) 22.1 25.8 65 years and over 3.0 (0.1) (1.5) 17.3 15.1
URBAN - persons - 1480071 1388031 23977 64089 *
- in % by groups of age - Total 15-64 years 99.6 99.8 99.6 97.4 (86.4)
15-24 years 4.1 4.1 (1.7) (4.1) (27.9) 25-34 years 29.5 30.0 (12.8) 25.4 (26.1) 35-44 years 31.4 31.5 42.1 29.3 (7.9) 45-54 years 24.0 23.7 34.3 26.9 (10.3) 55-64 years 10.6 10.5 (8.7) 11.7 (14.2) 65 years and over (0.4) (0.2) (0.4) (2.6) (13.6)
RURAL - persons - 874627 505368 10388 252439 106431
- in % by groups of age - Total 15-64 years 93.0 99.6 98.5 81.7 87.3
15-24 years 7.5 8.1 (1.0) 3.3 15.8 25-34 years 20.2 24.0 (16.2) 13.4 18.8 35-44 years 28.9 34.2 (35.7) 22.5 17.8 45-54 years 22.8 25.4 (36.1) 20.6 13.7 55-64 years 13.6 7.9 (9.5) 21.9 21.2 65 years and over 7.0 (0.4) (1.5) 18.3 12.7

Tables 259
Table 2.84. Structure of employment by status in employment, by macroregions, regions, gender, urban/rural area and groups of age
(continued)
Status in employment, of which: Macroregions Regions Gender Urban/rural area
Groups of age
Employment
Total Employee Employer Self-employed Contributing family worker
3.1.SOUTH MUNTENIA - persons - 1270247 863721 17962 278413 110151
- in % by groups of age - Total 15-64 years 95.1 99.8 99.3 83.1 87.3
15-24 years 6.4 6.1 (0.6) 3.6 16.2 25-34 years 21.3 24.2 (12.3) 13.8 19.0 35-44 years 29.3 32.7 37.9 23.0 17.4 45-54 years 24.8 27.0 38.8 21.4 13.7 55-64 years 13.3 9.8 (9.7) 21.3 21.0 65 years and over 4.9 (0.2) (0.7) 16.9 12.7
MEN - persons - 735209 503486 14301 185832 31591
- in % by groups of age - Total 15-64 years 95.7 99.8 99.1 84.7 93.3
15-24 years 7.1 6.5 (0.7) 4.4 34.8 25-34 years 21.7 24.0 (14.6) 15.4 26.4 35-44 years 28.9 31.2 (37.4) 24.1 (16.2) 45-54 years 24.9 27.0 (36.9) 21.2 (6.8) 55-64 years 13.1 11.1 (9.5) 19.6 (9.1) 65 years and over 4.3 (0.2) (0.9) 15.3 (6.7)
WOMEN - persons - 535038 360235 * 92581 78560
- in % by groups of age - Total 15-64 years 94.2 99.9 (100.0) 80.0 84.9
15-24 years 5.4 5.6 - (2.0) 8.8 25-34 years 20.7 24.5 (3.4) 10.6 16.0 35-44 years 29.9 34.7 (40.0) 20.9 17.9 45-54 years 24.7 27.0 (45.9) 21.9 16.4 55-64 years 13.5 8.1 (10.7) 24.6 25.8 65 years and over 5.8 (0.1) - 20.0 15.1
URBAN - persons - 497449 456071 8080 29446 *
- in % by groups of age - Total 15-64 years 99.5 99.9 100.0 95.9 (86.0)
15-24 years 4.2 4.0 - (6.3) (28.8) 25-34 years 24.0 24.8 (6.5) (17.6) (23.7) 35-44 years 31.5 31.8 (40.1) 27.2 (8.2) 45-54 years 28.1 28.0 (41.6) 28.6 (10.6) 55-64 years 11.7 11.3 (11.8) (16.2) (14.7) 65 years and over (0.5) (0.1) - (4.1) (14.0)
RURAL - persons - 772797 407650 9882 248966 106299
- in % by groups of age - Total 15-64 years 92.2 99.8 98.8 81.6 87.3
15-24 years 7.8 8.6 (1.1) 3.3 15.8 25-34 years 19.5 23.5 (17.1) 13.3 18.8 35-44 years 27.9 33.6 (36.2) 22.5 17.8 45-54 years 22.7 25.9 (36.4) 20.6 13.7 55-64 years 14.3 8.2 (8.0) 21.9 21.2 65 years and over 7.8 (0.2) (1.2) 18.4 12.7
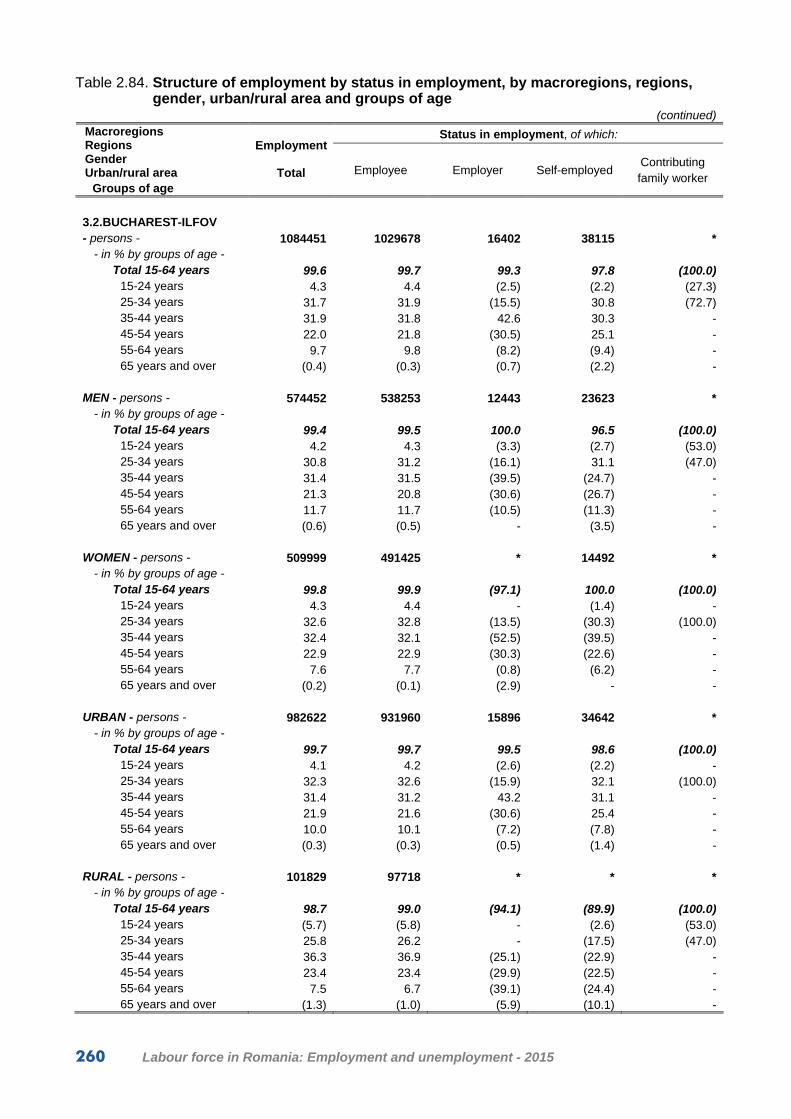
260 Labour force in Romania: Employment and unemployment - 2015
Table 2.84. Structure of employment by status in employment, by macroregions, regions, gender, urban/rural area and groups of age
(continued)
Status in employment, of which: Macroregions Regions Gender Urban/rural area
Groups of age
Employment
Total Employee Employer Self-employed Contributing family worker
3.2.BUCHAREST-ILFOV - persons - 1084451 1029678 16402 38115 *
- in % by groups of age - Total 15-64 years 99.6 99.7 99.3 97.8 (100.0)
15-24 years 4.3 4.4 (2.5) (2.2) (27.3) 25-34 years 31.7 31.9 (15.5) 30.8 (72.7) 35-44 years 31.9 31.8 42.6 30.3 - 45-54 years 22.0 21.8 (30.5) 25.1 - 55-64 years 9.7 9.8 (8.2) (9.4) - 65 years and over (0.4) (0.3) (0.7) (2.2) -
MEN - persons - 574452 538253 12443 23623 *
- in % by groups of age - Total 15-64 years 99.4 99.5 100.0 96.5 (100.0)
15-24 years 4.2 4.3 (3.3) (2.7) (53.0) 25-34 years 30.8 31.2 (16.1) 31.1 (47.0) 35-44 years 31.4 31.5 (39.5) (24.7) - 45-54 years 21.3 20.8 (30.6) (26.7) - 55-64 years 11.7 11.7 (10.5) (11.3) - 65 years and over (0.6) (0.5) - (3.5) -
WOMEN - persons - 509999 491425 * 14492 *
- in % by groups of age - Total 15-64 years 99.8 99.9 (97.1) 100.0 (100.0)
15-24 years 4.3 4.4 - (1.4) - 25-34 years 32.6 32.8 (13.5) (30.3) (100.0) 35-44 years 32.4 32.1 (52.5) (39.5) - 45-54 years 22.9 22.9 (30.3) (22.6) - 55-64 years 7.6 7.7 (0.8) (6.2) - 65 years and over (0.2) (0.1) (2.9) - -
URBAN - persons - 982622 931960 15896 34642 *
- in % by groups of age - Total 15-64 years 99.7 99.7 99.5 98.6 (100.0)
15-24 years 4.1 4.2 (2.6) (2.2) - 25-34 years 32.3 32.6 (15.9) 32.1 (100.0) 35-44 years 31.4 31.2 43.2 31.1 - 45-54 years 21.9 21.6 (30.6) 25.4 - 55-64 years 10.0 10.1 (7.2) (7.8) - 65 years and over (0.3) (0.3) (0.5) (1.4) -
RURAL - persons - 101829 97718 * * *
- in % by groups of age - Total 15-64 years 98.7 99.0 (94.1) (89.9) (100.0)
15-24 years (5.7) (5.8) - (2.6) (53.0) 25-34 years 25.8 26.2 - (17.5) (47.0) 35-44 years 36.3 36.9 (25.1) (22.9) - 45-54 years 23.4 23.4 (29.9) (22.5) - 55-64 years 7.5 6.7 (39.1) (24.4) - 65 years and over (1.3) (1.0) (5.9) (10.1) -

Tables 261
Table 2.84. Structure of employment by status in employment, by macroregions, regions, gender, urban/rural area and groups of age
(continued)
Status in employment, of which: Macroregions Regions Gender Urban/rural area
Groups of age
Employment
Total Employee Employer Self-employed Contributing family worker
4.MACROREGION FOUR - persons - 1538678 1111896 9702 232995 184085
- in % by groups of age - Total 15-64 years 96.2 99.9 99.2 84.6 88.4
15-24 years 5.9 4.5 (0.4) 4.7 16.1 25-34 years 23.0 25.3 (12.0) 13.7 22.3 35-44 years 29.6 32.9 (27.8) 22.0 19.5 45-54 years 24.4 25.9 (36.6) 23.5 15.2 55-64 years 13.3 11.3 (22.4) 20.7 15.3 65 years and over 3.8 (0.1) (0.8) 15.4 11.6
MEN - persons - 885339 655770 * 158687 64645
- in % by groups of age - Total 15-64 years 97.0 99.9 (100.0) 87.0 92.9
15-24 years 6.2 4.7 - 4.7 26.4 25-34 years 23.8 25.6 (13.8) 14.0 31.7 35-44 years 29.4 32.1 (26.2) 23.8 16.4 45-54 years 24.2 25.2 (33.0) 25.1 10.5 55-64 years 13.4 12.3 (27.0) 19.4 (7.9) 65 years and over 3.0 (0.1) - 13.0 (7.1)
WOMEN - persons - 653339 456126 * 74308 119440
- in % by groups of age - Total 15-64 years 95.1 99.9 (97.8) 79.7 86.0
15-24 years 5.5 4.2 (1.0) (4.7) 10.6 25-34 years 22.0 24.8 (8.7) 13.0 17.2 35-44 years 29.8 34.0 (30.8) 18.2 21.2 45-54 years 24.6 27.0 (43.0) 20.2 17.8 55-64 years 13.2 9.9 (14.3) 23.6 19.2 65 years and over 4.9 (0.1) (2.2) 20.3 14.0
URBAN - persons - 828255 781505 7896 33167 *
- in % by groups of age - Total 15-64 years 99.6 99.9 99.0 95.9 (79.8)
15-24 years 3.7 3.5 (0.4) (8.4) (18.3) 25-34 years 26.1 26.3 (10.1) 24.7 (18.3) 35-44 years 32.0 32.4 (27.4) 26.6 (13.3) 45-54 years 26.0 26.1 (36.5) 23.6 (5.5) 55-64 years 11.8 11.6 (24.6) (12.6) (24.4) 65 years and over (0.4) (0.1) (1.0) (4.1) (20.2)
RURAL - persons - 710423 330392 * 199828 178398
- in % by groups of age - Total 15-64 years 92.2 99.9 (100.0) 82.8 88.6
15-24 years 8.4 7.0 - 4.1 16.0 25-34 years 19.5 22.7 (20.3) 11.8 22.4 35-44 years 26.8 34.0 (30.0) 21.2 19.7 45-54 years 22.5 25.5 (36.9) 23.6 15.5 55-64 years 15.0 10.7 (12.8) 22.1 15.0 65 years and over 7.8 (0.1) - 17.2 11.4

262 Labour force in Romania: Employment and unemployment - 2015
Table 2.84. Structure of employment by status in employment, by macroregions, regions, gender, urban/rural area and groups of age
(continued)
Status in employment, of which: Macroregions Regions Gender Urban/rural area
Groups of age
Employment
Total Employee Employer Self-employed Contributing family worker
4.1.SOUTH-WEST OLTENIA - persons 809403 464502 * 180925 158238
- in % by groups of age - Total 15-64 years 93.4 99.9 (100.0) 82.0 87.3
15-24 years 6.1 3.6 - 3.8 16.2 25-34 years 19.8 22.0 (8.9) 13.0 21.5 35-44 years 28.1 33.5 (39.3) 21.8 19.2 45-54 years 25.0 29.3 (38.5) 22.6 14.4 55-64 years 14.4 11.5 (13.3) 20.8 16.0 65 years and over 6.6 (0.1) - 18.0 12.7
MEN - persons - 456865 272042 * 124910 56209
- in % by groups of age - Total 15-64 years 94.8 99.8 (100.0) 85.0 92.2
15-24 years 6.6 3.7 - (3.8) 27.3 25-34 years 20.8 22.3 (9.0) 13.5 30.3 35-44 years 28.5 33.4 (41.3) 23.5 15.3 45-54 years 25.0 27.8 (40.2) 24.8 (10.6) 55-64 years 13.9 12.6 (9.5) 19.4 (8.7) 65 years and over 5.2 (0.2) - 15.0 (7.8)
WOMEN - persons - 352538 192460 * 56015 102029
- in % by groups of age - Total 15-64 years 91.6 100.0 (100.0) 75.1 84.7
15-24 years 5.4 3.4 - (3.7) 10.2 25-34 years 18.6 21.6 (8.6) 12.0 16.7 35-44 years 27.6 33.6 (35.7) 17.8 21.4 45-54 years 25.0 31.5 (35.4) 17.9 16.4 55-64 years 15.0 9.9 (20.3) 23.7 20.0 65 years and over 8.4 (0.0) - 24.9 15.3
URBAN - persons - 365554 339130 * 16890 *
- in % by groups of age - Total 15-64 years 99.2 99.9 (100.0) 92.4 (76.2)
15-24 years 2.7 2.6 - (3.6) (9.2) 25-34 years 22.9 23.0 (9.9) (26.5) (20.9) 35-44 years 32.0 32.6 (37.0) (23.2) (11.4) 45-54 years 29.3 29.7 (38.8) (25.2) (5.8) 55-64 years 12.3 12.0 (14.3) (13.9) (28.9) 65 years and over (0.8) (0.1) - (7.6) (23.8)
RURAL - persons - 443849 125372 * 164035 153427
- in % by groups of age - Total 15-64 years 88.6 99.9 (100.0) 80.9 87.7
15-24 years 8.8 6.2 - (3.8) 16.5 25-34 years 17.2 19.3 (4.0) 11.6 21.5 35-44 years 25.0 35.9 (49.7) 21.6 19.5 45-54 years 21.4 28.5 (37.2) 22.4 14.6 55-64 years 16.2 10.0 (9.1) 21.5 15.6 65 years and over 11.4 (0.1) - 19.1 12.3

Tables 263
Table 2.84. Structure of employment by status in employment, by macroregions, regions, gender, urban/rural area and groups of age
(continued)
Status in employment, of which: Macroregions Regions Gender Urban/rural area
Groups of age
Employment
Total Employee Employer Self-employed Contributing family worker
4.2.WEST - persons - 729275 647395 * 52069 25846
- in % by groups of age - Total 15-64 years 99.3 99.9 (98.1) 93.9 94.7
15-24 years 5.7 5.2 (0.9) (7.8) (15.4) 25-34 years 26.7 27.6 (16.5) 15.9 27.0 35-44 years 31.2 32.4 (11.2) 22.8 (20.9) 45-54 years 23.7 23.5 (33.9) 26.8 (20.6) 55-64 years 12.0 11.2 (35.6) 20.6 (10.8) 65 years and over (0.7) (0.1) (1.9) (6.1) (5.3)
MEN - persons - 428474 383729 * 33777 8436
- in % by groups of age - Total 15-64 years 99.4 99.9 (100.0) 94.0 97.4
15-24 years 5.9 5.4 - (7.8) (20.5) 25-34 years 27.1 27.9 (20.8) (15.6) (41.2) 35-44 years 30.3 31.1 (4.2) 24.9 (23.2) 45-54 years 23.3 23.4 (22.6) 26.5 (9.6) 55-64 years 12.8 12.1 (52.4) (19.2) (2.9) 65 years and over (0.6) (0.1) - (6.0) (2.6)
WOMEN - persons - 300801 263666 * 18293 17410
- in % by groups of age - Total 15-64 years 99.1 99.9 (94.6) 93.7 93.4
15-24 years 5.5 4.8 (2.5) (7.9) (12.9) 25-34 years 26.0 27.2 (8.7) (16.3) (20.2) 35-44 years 32.4 34.3 (23.7) (19.1) (19.8) 45-54 years 24.2 23.7 (53.8) (27.2) (25.9) 55-64 years 11.0 9.9 (5.9) (23.2) (14.6) 65 years and over (0.9) (0.1) (5.4) (6.3) (6.6)
URBAN - persons - 462701 442375 * 16277 *
- in % by groups of age - Total 15-64 years 99.9 99.9 (97.6) 99.5 (100.0)
15-24 years 4.6 4.1 (1.1) (13.3) (68.6) 25-34 years 28.5 28.9 (10.3) (22.8) (4.0) 35-44 years 32.0 32.2 (12.9) (30.2) (23.4) 45-54 years 23.4 23.4 (33.2) (21.9) (4.0) 55-64 years 11.4 11.3 (40.1) (11.3) - 65 years and over (0.1) (0.1) (2.4) (0.5) -
RURAL - persons - 266574 205020 * 35793 24971
- in % by groups of age - Total 15-64 years 98.2 99.9 (100.0) 91.4 94.5
15-24 years 7.7 7.4 - (5.3) (13.5) 25-34 years 23.4 24.7 (41.4) (12.7) 27.8 35-44 years 29.9 32.9 (4.5) 19.5 (20.9) 45-54 years 24.2 23.7 (36.4) 29.0 (21.2) 55-64 years 13.0 11.2 (17.7) 24.9 (11.1) 65 years and over (1.8) (0.1) - (8.6) (5.5)

264 Labour force in Romania: Employment and unemployment - 2015
Table 2.85. Structure of employment by groups of age, macroregions, regions, gender, urban/rural area and level of education
of which, in working age
Groups of age Employment
Total
Total 15-64 years
15-24 years
25-34 years
35-44 years
45-54 years
55-64 years
65 years and over
Macroregions Regions Gender Urban/rural area
Level of education - persons - - percentages -
TOTAL 8535386 96.5 6.3 24.1 29.4 23.7 13.0 3.5 Superior 1724319 99.5 2.5 35.5 33.6 19.1 8.8 0.5 Medium 4896066 98.8 6.5 21.6 29.8 28.4 12.5 1.2
Post high-school of speciality or technical of foremen 280531 98.3 3.0 24.2 36.0 22.0 13.1 (1.7) High-school 3146712 99.5 7.9 24.8 30.3 27.6 8.9 0.5 Vocational, complementary or of apprentices 1468823 97.4 4.0 14.4 27.5 31.3 20.2 2.6
Low 1915001 87.8 9.2 20.3 24.4 15.7 18.2 12.2 Gymnasium 1620385 90.7 9.3 21.0 25.7 16.5 18.2 9.3 Primary or no education 294616 71.6 8.3 16.8 17.5 11.2 17.8 28.4
MEN 4848347 97.0 6.8 24.4 28.9 23.4 13.5 3.0
Superior 851818 99.4 2.1 34.6 32.8 19.4 10.5 (0.6) Medium 2914611 98.5 6.8 21.8 28.7 27.5 13.7 1.5
Post high-school of speciality or technical of foremen 114112 97.1 (1.8) 19.1 31.9 26.9 17.4 (2.9) High-school 1751895 99.5 8.8 26.6 29.4 25.8 8.9 0.5 Vocational, complementary or of apprentices 1048604 96.9 3.9 14.3 27.0 30.5 21.2 3.1
Low 1081918 91.3 10.7 23.2 26.6 15.4 15.4 8.7 Gymnasium 919915 92.7 10.7 23.4 27.2 15.9 15.5 7.3 Primary or no education 162003 83.4 10.8 22.0 23.1 12.5 15.0 16.6
WOMEN 3687038 95.8 5.6 23.8 29.9 24.0 12.5 4.2
Superior 872501 99.7 2.9 36.3 34.4 18.9 7.2 (0.3) Medium 1981454 99.3 6.0 21.4 31.4 29.6 10.9 0.7
Post high-school of speciality or technical of foremen 166419 99.1 4.0 27.7 38.7 18.6 10.1 (0.9) High-school 1394816 99.6 6.9 22.6 31.4 29.8 8.9 (0.4) Vocational, complementary or of apprentices 420219 98.5 4.0 14.7 28.7 33.4 17.7 (1.5)
Low 833083 83.2 7.2 16.6 21.6 16.1 21.7 16.8 Gymnasium 700470 88.1 7.6 17.8 23.6 17.3 21.8 11.9 Primary or no education 132613 57.3 5.2 10.4 10.8 9.5 21.4 42.7
URBAN 4662492 99.6 4.1 27.4 30.9 25.2 12.0 0.4
Superior 1481576 99.8 2.3 36.0 33.3 19.4 8.8 (0.2) Medium 2800305 99.7 4.5 23.3 29.7 29.3 12.9 0.3
Post high-school of speciality or technical of foremen 225904 99.6 (2.7) 24.4 36.6 22.7 13.2 (0.4) High-school 1908792 99.9 5.6 26.3 29.8 28.6 9.6 (0.1) Vocational, complementary or of apprentices 665609 99.3 2.0 14.2 27.2 33.5 22.4 (0.7)
Low 380611 97.8 7.3 24.2 30.5 18.2 17.6 2.2 Gymnasium 323262 97.9 7.3 24.0 30.1 18.3 18.2 2.1 Primary or no education 57349 97.5 (7.8) 25.8 32.8 16.9 14.2 (2.5)
RURAL 3872894 92.8 9.0 20.2 27.5 21.8 14.3 7.2
Superior 242743 98.1 4.0 32.4 35.5 17.6 8.6 (1.9) Medium 2095760 97.6 9.0 19.5 29.9 27.2 12.0 2.4
Post high-school of speciality or technical of foremen 54628 92.8 (4.4) 23.4 33.6 19.0 12.4 (7.2) High-school 1237919 99.1 11.5 22.5 31.2 26.1 7.8 0.9 Vocational, complementary or of apprentices 803213 95.8 5.6 14.5 27.7 29.6 18.4 4.2
Low 1534390 85.3 9.6 19.4 22.9 15.1 18.3 14.7 Gymnasium 1297123 88.9 9.9 20.2 24.6 16.0 18.2 11.1 Primary or no education 237268 65.4 8.4 14.6 13.8 9.8 18.8 34.6

Tables 265
Table 2.85. Structure of employment by groups of age, macroregions, regions, gender,
urban/rural area and level of education (continued)
of which, in working age
Groups of age Employment
Total
Total 15-64 years
15-24 years
25-34 years
35-44 years
45-54 years
55-64 years
65 years and over
Macroregions Regions Gender Urban/rural area
Level of education - persons - - percentages -
1.MACROREGION ONE 2052039 98.4 5.4 26.1 30.3 24.2 12.4 1.6 Superior 449537 99.6 2.0 37.7 32.4 17.9 9.6 (0.4) Medium 1242673 99.5 5.7 22.5 30.0 28.6 12.7 (0.5)
Post high-school of speciality or technical of foremen 75553 98.6 (2.8) 32.0 33.2 18.8 11.8 (1.4) High-school 790457 99.8 7.2 24.3 30.6 28.5 9.2 (0.2) Vocational, complementary or of apprentices 376663 99.0 3.1 16.8 28.2 30.8 20.1 (1.0)
Low 359830 93.0 8.9 24.0 28.4 17.1 14.6 7.0 Gymnasium 301205 94.2 8.6 24.8 28.2 17.9 14.7 5.8 Primary or no education 58624 86.9 (10.3) 19.7 29.6 13.1 14.2 13.1
MEN 1175611 98.6 6.1 26.2 29.6 23.3 13.4 1.4
Superior 222974 99.5 (1.5) 35.8 31.9 18.7 11.6 (0.5) Medium 717240 99.3 6.3 23.3 28.4 27.2 14.1 (0.7)
Post high-school of speciality or technical of foremen 30104 96.7 (2.4) 23.7 30.6 23.7 (16.3) (3.3) High-school 420535 99.8 8.5 26.7 29.3 26.0 9.3 (0.2) Vocational, complementary or of apprentices 266601 98.9 3.2 17.9 26.8 29.5 21.5 (1.1)
Low 235397 95.5 9.6 26.2 31.0 15.9 12.8 4.5 Gymnasium 195623 96.0 9.4 26.8 30.2 16.6 13.0 4.0 Primary or no education 39774 93.2 (10.6) 23.4 34.6 (13.0) (11.6) (6.8)
WOMEN 876428 98.1 4.6 25.9 31.2 25.4 11.0 1.9
Superior 226563 99.7 (2.5) 39.6 32.9 17.1 7.6 (0.3) Medium 525433 99.7 4.8 21.5 32.2 30.4 10.8 (0.3)
Post high-school of speciality or technical of foremen 45449 99.9 (3.0) 37.5 34.9 15.6 (8.9) (0.1) High-school 369922 99.9 5.7 21.7 32.1 31.2 9.2 (0.1) Vocational, complementary or of apprentices 110062 99.2 (2.8) 14.3 31.6 33.9 16.6 (0.8)
Low 124433 88.2 7.4 19.7 23.6 19.3 18.2 11.8 Gymnasium 105583 90.8 7.0 21.1 24.4 20.4 17.9 9.2 Primary or no education 18850 73.6 (9.7) (11.8) (19.1) (13.4) (19.6) (26.4)
URBAN 1215529 99.7 3.9 27.9 30.3 24.9 12.7 (0.3)
Superior 375322 99.8 1.8 38.7 31.4 18.0 9.9 (0.2) Medium 757245 99.8 4.8 22.9 29.4 29.1 13.6 (0.2)
Post high-school of speciality or technical of foremen 60389 99.2 (2.2) 31.2 34.2 19.2 12.4 (0.8) High-school 498353 99.9 6.2 25.2 29.4 29.2 9.9 (0.1) Vocational, complementary or of apprentices 198504 99.5 (2.0) 14.5 28.0 32.0 23.0 (0.5)
Low 82961 99.2 (4.9) 25.7 33.1 17.9 17.6 (0.8) Gymnasium 71674 99.0 (4.6) 25.3 31.9 18.4 18.8 (1.0) Primary or no education 11286 100.0 (6.3) (28.1) (41.1) (15.1) (9.4) -
RURAL 836510 96.4 7.7 23.4 30.3 23.2 11.8 3.6
Superior 74214 98.7 (3.2) 32.9 37.3 17.2 (8.1) (1.3) Medium 485427 99.1 7.1 21.9 31.1 27.7 11.3 (0.9)
Post high-school of speciality or technical of foremen 15164 96.5 (5.0) (35.1) (29.4) (17.3) (9.7) (3.5) High-school 292104 99.7 8.9 22.8 32.7 27.2 8.1 (0.3) Vocational, complementary or of apprentices 178159 98.4 4.3 19.4 28.5 29.4 16.8 (1.6)
Low 276869 91.1 10.0 23.5 27.0 16.9 13.7 8.9 Gymnasium 229531 92.6 9.8 24.7 27.0 17.7 13.4 7.4 Primary or no education 47338 83.8 (11.3) 17.6 26.9 (12.7) 15.3 16.2

266 Labour force in Romania: Employment and unemployment - 2015
Table 2.85. Structure of employment by groups of age, macroregions, regions, gender, urban/rural area and level of education
(continued)
of which, in working age
Groups of age Employment
Total
Total 15-64 years
15-24 years
25-34 years
35-44 years
45-54 years
55-64 years
65 years and over
Macroregions Regions Gender Urban/rural area
Level of education - persons - - percentages -
1.1.NORTH-WEST 1148516 97.6 5.6 26.9 29.6 23.3 12.2 2.4 Superior 235334 99.5 (1.8) 39.8 29.9 18.2 9.8 (0.5) Medium 683953 99.3 5.8 23.3 30.4 27.3 12.5 (0.7)
Post high-school of speciality or technical of foremen 42509 98.5 (2.3) 35.2 30.7 18.4 (11.9) (1.5) High-school 436536 99.7 7.8 25.4 31.6 26.1 8.8 (0.3) Vocational, complementary or of apprentices 204908 98.7 (2.3) 16.3 27.9 31.6 20.6 (1.3)
Low 229229 90.3 9.0 24.2 26.6 16.6 13.9 9.7 Gymnasium 192783 92.2 8.8 25.0 27.4 17.6 13.4 7.8 Primary or no education 36446 80.1 (10.0) 19.7 22.6 (11.1) (16.7) 19.9
MEN 647672 97.9 6.3 26.6 29.0 22.7 13.3 2.1
Superior 116377 99.2 (1.5) 37.5 29.8 18.7 11.7 (0.8) Medium 388897 99.1 6.6 23.3 28.7 26.5 14.0 (0.9)
Post high-school of speciality or technical of foremen 15801 96.0 - (28.2) (29.4) (21.7) (16.7) (4.0) High-school 230173 99.7 9.7 26.7 30.3 24.3 8.7 (0.3) Vocational, complementary or of apprentices 142924 98.5 (2.2) 17.2 26.2 30.6 22.3 (1.5)
Low 142397 93.4 9.4 26.8 29.1 15.7 12.4 6.6 Gymnasium 120018 94.2 9.2 26.9 29.6 16.3 12.2 5.8 Primary or no education 22380 89.2 (10.5) (26.2) (26.1) (12.4) (14.0) (10.8)
WOMEN 500845 97.1 4.8 27.2 30.2 24.0 10.9 2.9
Superior 118957 99.7 (2.0) 42.1 30.1 17.6 7.9 (0.3) Medium 295056 99.7 4.9 23.3 32.6 28.4 10.5 (0.3)
Post high-school of speciality or technical of foremen 26708 100.0 (3.7) 39.4 31.6 (16.3) (9.0) - High-school 206363 99.8 5.8 24.0 33.0 28.2 8.8 (0.2) Vocational, complementary or of apprentices 61985 99.1 (2.4) 14.1 31.7 34.0 16.9 (0.9)
Low 86831 85.0 8.2 20.0 22.5 18.0 16.3 15.0 Gymnasium 72765 88.8 (8.1) 22.0 23.6 19.8 15.3 11.2 Primary or no education 14066 65.6 (9.2) (9.3) (17.0) (8.9) (21.2) (34.4)
URBAN 636308 99.7 3.7 29.9 29.6 24.3 12.2 (0.3)
Superior 191877 99.8 (1.5) 41.3 29.0 17.9 10.1 (0.2) Medium 403561 99.7 4.7 24.3 29.6 28.0 13.1 (0.3)
Post high-school of speciality or technical of foremen 34008 99.0 (1.6) 35.8 31.1 (18.5) (12.0) (1.0) High-school 271484 99.9 6.3 26.6 30.3 27.3 9.4 (0.1) Vocational, complementary or of apprentices 98069 99.5 (1.3) 13.9 27.1 33.4 23.8 (0.5)
Low 40871 99.3 (4.0) 31.9 32.6 17.3 (13.5) (0.7) Gymnasium 36016 99.2 (4.5) 31.3 31.2 (17.9) (14.3) (0.8) Primary or no education * (100.0) - (36.1) (43.2) (13.0) (7.7) -
RURAL 512208 94.9 8.1 23.0 29.5 22.0 12.3 5.1
Superior 43458 98.1 (3.1) 33.2 34.2 19.1 (8.5) (1.9) Medium 280392 98.8 7.5 21.8 31.6 26.2 11.7 (1.2)
Post high-school of speciality or technical of foremen 8501 96.7 (5.5) (32.7) (29.3) (17.9) (11.3) (3.3) High-school 165052 99.4 10.4 23.4 33.7 24.2 7.7 (0.6) Vocational, complementary or of apprentices 106839 97.8 (3.1) 18.4 28.6 29.9 17.8 (2.2)
Low 188358 88.3 10.1 22.5 25.3 16.4 14.0 11.7 Gymnasium 156767 90.6 9.8 23.6 26.5 17.5 13.2 9.4 Primary or no education 31591 77.1 (11.6) (17.2) (19.4) (10.8) (18.1) 22.9

Tables 267
Table 2.85. Structure of employment by groups of age, macroregions, regions, gender, urban/rural area and level of education
(continued)
of which, in working age
Groups of age Employment
Total
Total 15-64 years
15-24 years
25-34 years
35-44 years
45-54 years
55-64 years
65 years and over
Macroregions Regions Gender Urban/rural area
Level of education - persons - - percentages -
1.2.CENTER 903523 99.4 5.2 25.1 31.2 25.4 12.5 (0.6) Superior 214202 99.7 (2.3) 35.4 35.1 17.6 9.3 (0.3) Medium 558719 99.7 5.5 21.6 29.6 30.1 12.9 (0.3)
Post high-school of speciality or technical of foremen 33044 98.7 (3.3) 27.9 36.4 (19.4) (11.7) (1.3) High-school 353921 100.0 6.4 23.0 29.4 31.3 9.9 (0.0) Vocational, complementary or of apprentices 171755 99.4 4.0 17.5 28.7 29.8 19.4 (0.6)
Low 130601 97.8 8.6 23.6 31.6 18.1 15.9 (2.2) Gymnasium 108422 97.7 8.1 24.4 29.6 18.5 17.1 (2.3) Primary or no education 22179 98.1 (10.9) (19.6) 41.2 (16.5) (9.9) (1.9)
MEN 527939 99.5 5.7 25.8 30.4 24.1 13.5 (0.5)
Superior 106597 99.8 (1.5) 33.9 34.3 18.6 11.5 (0.2) Medium 328343 99.6 6.0 23.2 28.1 28.1 14.2 (0.4)
Post high-school of speciality or technical of foremen 14304 97.5 (5.1) (18.7) (32.1) (25.8) (15.8) (2.5) High-school 190362 100.0 7.1 26.6 28.1 28.2 10.0 (0.0) Vocational, complementary or of apprentices 123677 99.3 (4.3) 18.7 27.6 28.2 20.5 (0.7)
Low 93000 98.6 9.9 25.4 33.8 16.3 13.2 (1.4) Gymnasium 75605 98.7 9.6 26.7 31.1 17.0 14.3 (1.3) Primary or no education 17395 98.4 (10.8) (19.7) 45.6 (13.8) (8.5) (1.6)
WOMEN 375583 99.4 4.4 24.2 32.4 27.3 11.1 (0.6)
Superior 107605 99.6 (3.2) 36.7 36.0 16.5 7.2 (0.4) Medium 230377 99.8 4.8 19.2 31.7 33.1 11.0 (0.2)
Post high-school of speciality or technical of foremen 18740 99.7 (1.9) 34.9 39.6 (14.6) (8.7) (0.3) High-school 163559 100.0 5.6 18.8 30.9 35.0 9.7 (0.0) Vocational, complementary or of apprentices 48078 99.4 (3.2) 14.6 31.5 33.7 16.4 (0.6)
Low 37601 95.6 (5.4) 19.2 26.1 22.4 22.5 (4.4) Gymnasium 32817 95.4 (4.6) (19.2) 26.2 21.9 23.5 (4.6) Primary or no education * (97.2) (11.2) (19.2) (25.3) (26.5) (15.0) (2.8)
URBAN 579221 99.7 4.1 25.8 31.0 25.6 13.2 (0.3)
Superior 183446 99.8 (2.2) 35.8 34.1 18.1 9.6 (0.2) Medium 353684 99.8 4.9 21.2 29.2 30.4 14.1 (0.2)
Post high-school of speciality or technical of foremen 26381 99.4 (3.0) 25.3 38.1 (20.2) (12.8) (0.6) High-school 226869 100.0 6.1 23.5 28.2 31.5 10.7 (0.0) Vocational, complementary or of apprentices 100434 99.4 (2.5) 15.1 28.9 30.6 22.3 (0.6)
Low 42091 99.0 (5.7) 19.8 33.6 18.5 21.4 (1.0) Gymnasium 35658 98.8 (4.8) 19.3 32.6 18.8 23.3 (1.2) Primary or no education * (100.0) (11.1) (22.1) (39.4) (16.6) (10.8) -
RURAL 324302 99.0 7.2 24.0 31.5 25.1 11.2 (1.0)
Superior 30757 99.5 (3.2) 32.4 41.6 (14.7) (7.6) (0.5) Medium 205035 99.6 6.5 22.2 30.4 29.7 10.8 (0.4)
Post high-school of speciality or technical of foremen 6663 (96.2) (4.4) (38.3) (29.3) (16.5) (7.7) (3.8) High-school 127051 100.0 6.9 22.0 31.5 31.1 8.5 - Vocational, complementary or of apprentices 71320 99.3 (6.0) 21.0 28.5 28.5 15.3 (0.7)
Low 88510 97.2 9.9 25.5 30.6 17.9 13.3 (2.8) Gymnasium 72764 97.1 9.7 26.9 28.2 18.2 14.1 (2.9) Primary or no education 15747 97.3 (10.8) (18.6) 41.9 (16.4) (9.6) (2.7)
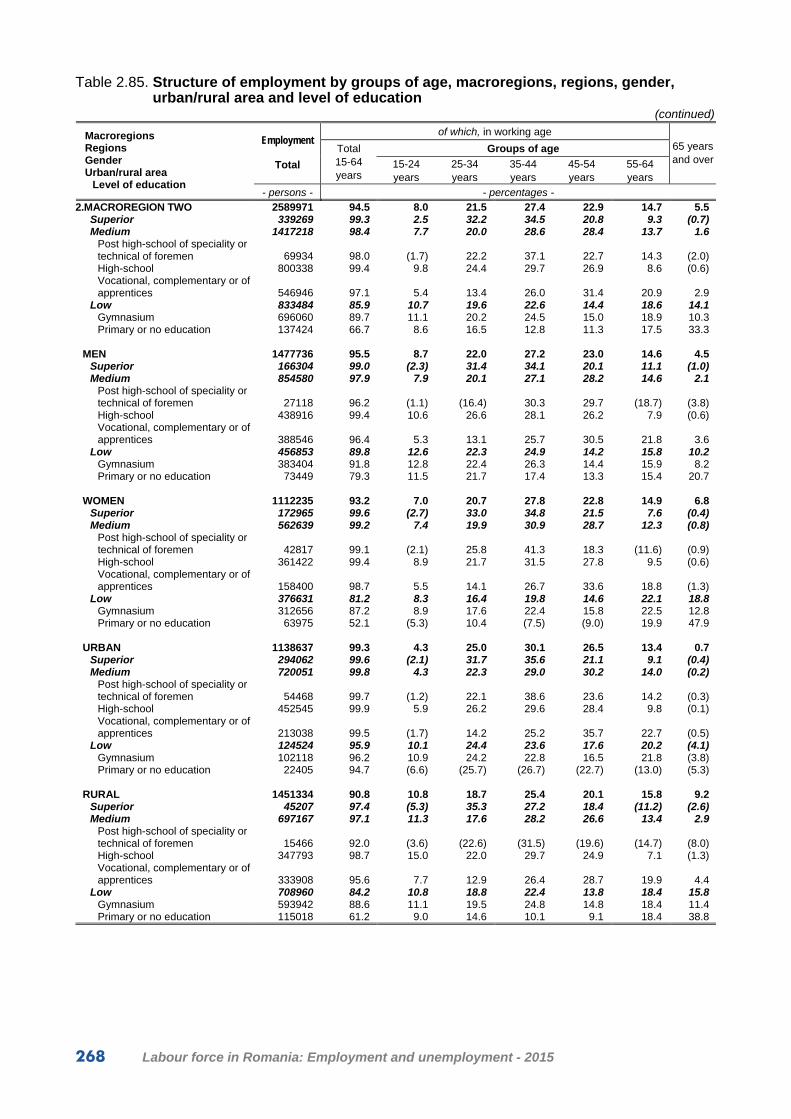
268 Labour force in Romania: Employment and unemployment - 2015
Table 2.85. Structure of employment by groups of age, macroregions, regions, gender, urban/rural area and level of education
(continued)
of which, in working age
Groups of age Employment
Total
Total 15-64 years
15-24 years
25-34 years
35-44 years
45-54 years
55-64 years
65 years and over
Macroregions Regions Gender Urban/rural area
Level of education - persons - - percentages -
2.MACROREGION TWO 2589971 94.5 8.0 21.5 27.4 22.9 14.7 5.5 Superior 339269 99.3 2.5 32.2 34.5 20.8 9.3 (0.7) Medium 1417218 98.4 7.7 20.0 28.6 28.4 13.7 1.6
Post high-school of speciality or technical of foremen 69934 98.0 (1.7) 22.2 37.1 22.7 14.3 (2.0) High-school 800338 99.4 9.8 24.4 29.7 26.9 8.6 (0.6) Vocational, complementary or of apprentices 546946 97.1 5.4 13.4 26.0 31.4 20.9 2.9
Low 833484 85.9 10.7 19.6 22.6 14.4 18.6 14.1 Gymnasium 696060 89.7 11.1 20.2 24.5 15.0 18.9 10.3 Primary or no education 137424 66.7 8.6 16.5 12.8 11.3 17.5 33.3
MEN 1477736 95.5 8.7 22.0 27.2 23.0 14.6 4.5
Superior 166304 99.0 (2.3) 31.4 34.1 20.1 11.1 (1.0) Medium 854580 97.9 7.9 20.1 27.1 28.2 14.6 2.1
Post high-school of speciality or technical of foremen 27118 96.2 (1.1) (16.4) 30.3 29.7 (18.7) (3.8) High-school 438916 99.4 10.6 26.6 28.1 26.2 7.9 (0.6) Vocational, complementary or of apprentices 388546 96.4 5.3 13.1 25.7 30.5 21.8 3.6
Low 456853 89.8 12.6 22.3 24.9 14.2 15.8 10.2 Gymnasium 383404 91.8 12.8 22.4 26.3 14.4 15.9 8.2 Primary or no education 73449 79.3 11.5 21.7 17.4 13.3 15.4 20.7
WOMEN 1112235 93.2 7.0 20.7 27.8 22.8 14.9 6.8
Superior 172965 99.6 (2.7) 33.0 34.8 21.5 7.6 (0.4) Medium 562639 99.2 7.4 19.9 30.9 28.7 12.3 (0.8)
Post high-school of speciality or technical of foremen 42817 99.1 (2.1) 25.8 41.3 18.3 (11.6) (0.9) High-school 361422 99.4 8.9 21.7 31.5 27.8 9.5 (0.6) Vocational, complementary or of apprentices 158400 98.7 5.5 14.1 26.7 33.6 18.8 (1.3)
Low 376631 81.2 8.3 16.4 19.8 14.6 22.1 18.8 Gymnasium 312656 87.2 8.9 17.6 22.4 15.8 22.5 12.8 Primary or no education 63975 52.1 (5.3) 10.4 (7.5) (9.0) 19.9 47.9
URBAN 1138637 99.3 4.3 25.0 30.1 26.5 13.4 0.7
Superior 294062 99.6 (2.1) 31.7 35.6 21.1 9.1 (0.4) Medium 720051 99.8 4.3 22.3 29.0 30.2 14.0 (0.2)
Post high-school of speciality or technical of foremen 54468 99.7 (1.2) 22.1 38.6 23.6 14.2 (0.3) High-school 452545 99.9 5.9 26.2 29.6 28.4 9.8 (0.1) Vocational, complementary or of apprentices 213038 99.5 (1.7) 14.2 25.2 35.7 22.7 (0.5)
Low 124524 95.9 10.1 24.4 23.6 17.6 20.2 (4.1) Gymnasium 102118 96.2 10.9 24.2 22.8 16.5 21.8 (3.8) Primary or no education 22405 94.7 (6.6) (25.7) (26.7) (22.7) (13.0) (5.3)
RURAL 1451334 90.8 10.8 18.7 25.4 20.1 15.8 9.2
Superior 45207 97.4 (5.3) 35.3 27.2 18.4 (11.2) (2.6) Medium 697167 97.1 11.3 17.6 28.2 26.6 13.4 2.9
Post high-school of speciality or technical of foremen 15466 92.0 (3.6) (22.6) (31.5) (19.6) (14.7) (8.0) High-school 347793 98.7 15.0 22.0 29.7 24.9 7.1 (1.3) Vocational, complementary or of apprentices 333908 95.6 7.7 12.9 26.4 28.7 19.9 4.4
Low 708960 84.2 10.8 18.8 22.4 13.8 18.4 15.8 Gymnasium 593942 88.6 11.1 19.5 24.8 14.8 18.4 11.4 Primary or no education 115018 61.2 9.0 14.6 10.1 9.1 18.4 38.8

Tables 269
Table 2.85. Structure of employment by groups of age, macroregions, regions, gender, urban/rural area and level of education
(continued)
of which, in working age
Groups of age Employment
Total
Total 15-64 years
15-24 years
25-34 years
35-44 years
45-54 years
55-64 years
65 years and over
Macroregions Regions Gender Urban/rural area
Level of education - persons - - percentages -
2.1.NORTH-EAST 1609602 92.7 9.2 20.8 26.0 21.8 14.9 7.3 Superior 181273 99.3 (2.2) 31.7 34.1 21.6 9.7 (0.7) Medium 849424 97.9 9.0 19.8 27.8 27.3 14.0 2.1
Post high-school of speciality or technical of foremen 33131 95.7 (0.6) 25.2 36.6 20.4 (12.9) (4.3) High-school 463356 99.3 11.6 25.4 29.1 24.5 8.7 (0.7) Vocational, complementary or of apprentices 352936 96.2 6.2 12.1 25.4 31.6 20.9 3.8
Low 578905 83.2 11.8 19.0 20.8 13.8 17.8 16.8 Gymnasium 487318 87.7 12.2 20.0 23.0 14.5 18.0 12.3 Primary or no education 91587 58.8 9.5 13.8 8.8 10.0 16.7 41.2
MEN 886799 94.0 10.0 21.7 25.9 21.8 14.6 6.0
Superior 89466 99.0 (2.3) 30.3 34.1 20.5 11.8 (1.0) Medium 497572 97.1 8.8 19.9 26.3 27.0 15.1 2.9
Post high-school of speciality or technical of foremen 11478 91.0 - (14.8) (29.5) (29.0) (17.7) (9.0) High-school 246636 99.3 12.0 28.0 26.9 23.6 8.8 (0.7) Vocational, complementary or of apprentices 239458 95.1 6.0 11.8 25.5 30.4 21.4 4.9
Low 299760 87.4 14.1 22.1 22.9 13.7 14.6 12.6 Gymnasium 255437 90.3 14.4 22.7 24.8 13.9 14.5 9.7 Primary or no education 44323 70.7 (12.7) 18.6 (12.0) (12.7) 14.7 29.3
WOMEN 722803 91.2 8.2 19.9 26.1 21.8 15.2 8.8
Superior 91807 99.5 (1.9) 33.0 34.2 22.7 7.7 (0.5) Medium 351851 99.0 9.1 19.7 30.0 27.8 12.4 (1.0)
Post high-school of speciality or technical of foremen 21652 98.2 (0.9) 30.7 40.4 (15.9) (10.3) (1.8) High-school 216720 99.3 11.1 22.4 31.6 25.6 8.6 (0.7) Vocational, complementary or of apprentices 113478 98.5 6.8 12.5 25.2 34.1 19.9 (1.5)
Low 279145 78.6 9.3 15.7 18.4 13.9 21.3 21.4 Gymnasium 231882 84.9 9.8 17.0 21.0 15.2 21.9 15.1 Primary or no education 47263 47.6 (6.4) (9.2) (5.8) (7.6) 18.6 52.4
URBAN 608335 98.8 5.0 25.7 29.0 25.8 13.3 1.2
Superior 160841 99.6 (1.9) 31.2 35.0 22.0 9.5 (0.4) Medium 376695 99.6 4.7 23.5 28.3 29.0 14.1 (0.4)
Post high-school of speciality or technical of foremen 24140 99.3 (0.2) 27.4 38.5 (21.9) (11.3) (0.7) High-school 241297 99.9 6.5 27.8 29.2 26.4 10.0 (0.1) Vocational, complementary or of apprentices 111258 99.0 (1.6) 13.4 23.9 36.3 23.8 (1.0)
Low 70799 93.1 13.6 24.9 19.1 17.9 17.6 (6.9) Gymnasium 60756 93.8 14.9 25.0 20.1 16.3 17.5 (6.2) Primary or no education 10044 88.8 (5.9) (23.7) (13.1) (28.0) (18.1) (11.2)
RURAL 1001266 89.0 11.7 17.9 24.2 19.4 15.8 11.0
Superior 20432 96.9 (3.7) 35.6 (27.5) (18.6) (11.5) (3.1) Medium 472729 96.5 12.4 16.9 27.5 25.9 13.8 3.5
Post high-school of speciality or technical of foremen 8991 86.2 (1.6) (19.3) (31.7) (16.5) (17.1) (13.8) High-school 222060 98.7 17.1 22.7 28.9 22.6 7.4 (1.3) Vocational, complementary or of apprentices 241678 94.9 8.4 11.4 26.1 29.4 19.6 5.1
Low 508105 81.8 11.5 18.2 21.0 13.3 17.8 18.2 Gymnasium 426562 86.9 11.8 19.3 23.4 14.3 18.1 13.1 Primary or no education 81543 55.1 9.9 12.6 8.3 (7.8) 16.5 44.9

270 Labour force in Romania: Employment and unemployment - 2015
Table 2.85. Structure of employment by groups of age, macroregions, regions, gender, urban/rural area and level of education
(continued)
of which, in working age
Groups of age Employment
Total
Total 15-64 years
15-24 years
25-34 years
35-44 years
45-54 years
55-64 years
65 years and over
Macroregions Regions Gender Urban/rural area
Level of education - persons - - percentages -
2.2.SOUTH-EAST 980369 97.5 6.0 22.5 29.8 24.7 14.5 2.5 Superior 157996 99.3 (3.0) 32.8 34.8 19.8 8.9 (0.7) Medium 567795 99.3 5.8 20.3 29.8 30.1 13.3 (0.7)
Post high-school of speciality or technical of foremen 36803 100.0 (2.7) 19.5 37.4 24.8 (15.6) - High-school 336982 99.5 7.4 23.0 30.5 30.1 8.5 (0.5) Vocational, complementary or of apprentices 194010 98.7 3.7 15.8 27.1 31.1 21.0 (1.3)
Low 254579 92.3 8.2 20.9 26.9 15.7 20.6 7.7 Gymnasium 208742 94.4 8.5 20.7 28.2 16.1 20.9 5.6 Primary or no education 45837 82.4 (7.0) 21.7 20.9 (13.7) 19.1 17.6
MEN 590938 97.8 6.8 22.6 29.1 24.7 14.6 2.2
Superior 76838 99.0 (2.4) 32.5 34.2 19.6 10.3 (1.0) Medium 357007 99.1 6.6 20.4 28.2 30.1 13.8 (0.9)
Post high-school of speciality or technical of foremen 15639 100.0 (1.9) (17.6) (30.9) (30.2) (19.4) - High-school 192280 99.4 8.8 24.7 29.7 29.5 6.7 (0.6) Vocational, complementary or of apprentices 149088 98.5 (4.1) 15.2 26.0 30.8 22.4 (1.5)
Low 157092 94.5 9.8 22.5 28.7 15.2 18.3 5.5 Gymnasium 127967 94.9 9.7 21.7 29.4 15.4 18.7 5.1 Primary or no education 29125 92.4 (9.8) 26.3 25.8 (14.2) (16.3) (7.6)
WOMEN 389432 96.9 4.7 22.4 30.9 24.6 14.3 3.1
Superior 81158 99.6 (3.5) 33.1 35.5 20.0 (7.5) (0.4) Medium 210788 99.6 4.6 20.2 32.4 30.2 12.2 (0.4)
Post high-school of speciality or technical of foremen 21164 100.0 (3.3) (20.9) 42.3 (20.7) (12.8) - High-school 144702 99.6 5.5 20.7 31.5 31.0 10.9 (0.4) Vocational, complementary or of apprentices 44922 99.3 (2.4) 18.1 30.6 32.1 16.1 (0.7)
Low 97486 88.8 (5.7) 18.4 23.9 16.5 24.3 11.2 Gymnasium 80775 93.7 (6.4) 19.3 26.3 17.3 24.4 (6.3) Primary or no education 16711 65.0 (2.1) (13.8) (12.3) (12.9) (23.9) (35.0)
URBAN 530301 99.8 3.6 24.2 31.4 27.2 13.4 (0.2)
Superior 133221 99.6 (2.3) 32.4 36.3 20.1 8.5 (0.4) Medium 343357 100.0 3.8 21.0 29.9 31.5 13.8 (0.0)
Post high-school of speciality or technical of foremen 30328 100.0 (1.9) (17.9) 38.8 24.9 (16.5) - High-school 211248 99.9 5.1 24.3 30.1 30.7 9.7 (0.1) Vocational, complementary or of apprentices 101780 100.0 (1.7) 15.1 26.7 35.1 21.4 (0.0)
Low 53724 99.7 (5.5) 23.9 29.4 17.2 23.7 (0.3) Gymnasium 41362 99.8 (5.0) 22.9 26.9 16.8 28.2 (0.2) Primary or no education 12362 99.5 (7.1) (27.2) (37.8) (18.5) (8.9) (0.5)
RURAL 450068 94.6 8.8 20.5 27.9 21.8 15.6 5.4
Superior 24775 97.8 (6.6) 35.1 26.9 (18.3) (10.9) (2.2) Medium 224438 98.2 8.9 19.3 29.6 28.0 12.4 (1.8)
Post high-school of speciality or technical of foremen * (100.0) (6.3) (27.2) (31.2) (24.0) (11.3) - High-school 125734 98.7 11.3 20.8 31.0 29.0 6.6 (1.3) Vocational, complementary or of apprentices 92230 97.4 (5.9) 16.7 27.5 26.8 20.5 (2.6)
Low 200855 90.3 8.9 20.2 26.2 15.3 19.7 9.7 Gymnasium 167379 93.1 9.3 20.2 28.5 16.0 19.1 6.9 Primary or no education 33475 76.1 (6.9) 19.7 (14.6) (12.0) 22.9 23.9
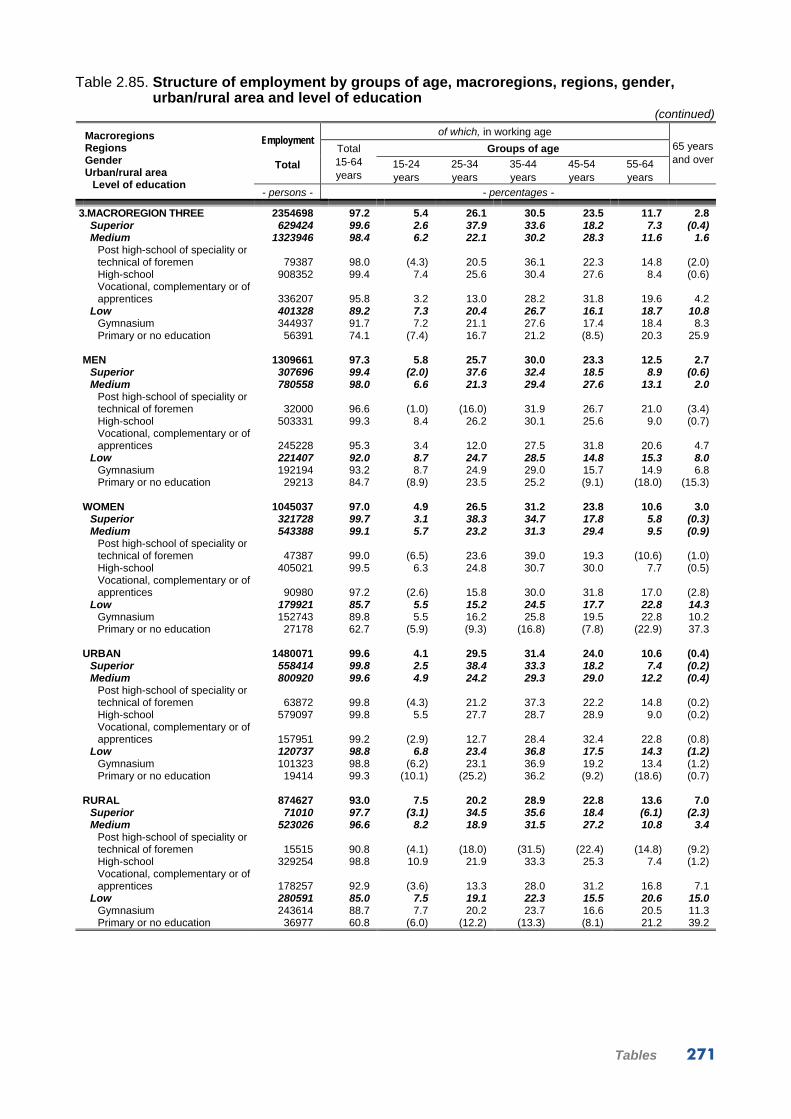
Tables 271
Table 2.85. Structure of employment by groups of age, macroregions, regions, gender, urban/rural area and level of education
(continued)
of which, in working age
Groups of age Employment
Total
Total 15-64 years
15-24 years
25-34 years
35-44 years
45-54 years
55-64 years
65 years and over
Macroregions Regions Gender Urban/rural area
Level of education - persons - - percentages -
3.MACROREGION THREE 2354698 97.2 5.4 26.1 30.5 23.5 11.7 2.8 Superior 629424 99.6 2.6 37.9 33.6 18.2 7.3 (0.4) Medium 1323946 98.4 6.2 22.1 30.2 28.3 11.6 1.6
Post high-school of speciality or technical of foremen 79387 98.0 (4.3) 20.5 36.1 22.3 14.8 (2.0) High-school 908352 99.4 7.4 25.6 30.4 27.6 8.4 (0.6) Vocational, complementary or of apprentices 336207 95.8 3.2 13.0 28.2 31.8 19.6 4.2
Low 401328 89.2 7.3 20.4 26.7 16.1 18.7 10.8 Gymnasium 344937 91.7 7.2 21.1 27.6 17.4 18.4 8.3 Primary or no education 56391 74.1 (7.4) 16.7 21.2 (8.5) 20.3 25.9
MEN 1309661 97.3 5.8 25.7 30.0 23.3 12.5 2.7
Superior 307696 99.4 (2.0) 37.6 32.4 18.5 8.9 (0.6) Medium 780558 98.0 6.6 21.3 29.4 27.6 13.1 2.0
Post high-school of speciality or technical of foremen 32000 96.6 (1.0) (16.0) 31.9 26.7 21.0 (3.4) High-school 503331 99.3 8.4 26.2 30.1 25.6 9.0 (0.7) Vocational, complementary or of apprentices 245228 95.3 3.4 12.0 27.5 31.8 20.6 4.7
Low 221407 92.0 8.7 24.7 28.5 14.8 15.3 8.0 Gymnasium 192194 93.2 8.7 24.9 29.0 15.7 14.9 6.8 Primary or no education 29213 84.7 (8.9) 23.5 25.2 (9.1) (18.0) (15.3)
WOMEN 1045037 97.0 4.9 26.5 31.2 23.8 10.6 3.0
Superior 321728 99.7 3.1 38.3 34.7 17.8 5.8 (0.3) Medium 543388 99.1 5.7 23.2 31.3 29.4 9.5 (0.9)
Post high-school of speciality or technical of foremen 47387 99.0 (6.5) 23.6 39.0 19.3 (10.6) (1.0) High-school 405021 99.5 6.3 24.8 30.7 30.0 7.7 (0.5) Vocational, complementary or of apprentices 90980 97.2 (2.6) 15.8 30.0 31.8 17.0 (2.8)
Low 179921 85.7 5.5 15.2 24.5 17.7 22.8 14.3 Gymnasium 152743 89.8 5.5 16.2 25.8 19.5 22.8 10.2 Primary or no education 27178 62.7 (5.9) (9.3) (16.8) (7.8) (22.9) 37.3
URBAN 1480071 99.6 4.1 29.5 31.4 24.0 10.6 (0.4)
Superior 558414 99.8 2.5 38.4 33.3 18.2 7.4 (0.2) Medium 800920 99.6 4.9 24.2 29.3 29.0 12.2 (0.4)
Post high-school of speciality or technical of foremen 63872 99.8 (4.3) 21.2 37.3 22.2 14.8 (0.2) High-school 579097 99.8 5.5 27.7 28.7 28.9 9.0 (0.2) Vocational, complementary or of apprentices 157951 99.2 (2.9) 12.7 28.4 32.4 22.8 (0.8)
Low 120737 98.8 6.8 23.4 36.8 17.5 14.3 (1.2) Gymnasium 101323 98.8 (6.2) 23.1 36.9 19.2 13.4 (1.2) Primary or no education 19414 99.3 (10.1) (25.2) 36.2 (9.2) (18.6) (0.7)
RURAL 874627 93.0 7.5 20.2 28.9 22.8 13.6 7.0
Superior 71010 97.7 (3.1) 34.5 35.6 18.4 (6.1) (2.3) Medium 523026 96.6 8.2 18.9 31.5 27.2 10.8 3.4
Post high-school of speciality or technical of foremen 15515 90.8 (4.1) (18.0) (31.5) (22.4) (14.8) (9.2) High-school 329254 98.8 10.9 21.9 33.3 25.3 7.4 (1.2) Vocational, complementary or of apprentices 178257 92.9 (3.6) 13.3 28.0 31.2 16.8 7.1
Low 280591 85.0 7.5 19.1 22.3 15.5 20.6 15.0 Gymnasium 243614 88.7 7.7 20.2 23.7 16.6 20.5 11.3 Primary or no education 36977 60.8 (6.0) (12.2) (13.3) (8.1) 21.2 39.2

272 Labour force in Romania: Employment and unemployment - 2015
Table 2.85. Structure of employment by groups of age, macroregions, regions, gender, urban/rural area and level of education
(continued)
of which, in working age
Groups of age Employment
Total
Total 15-64 years
15-24 years
25-34 years
35-44 years
45-54 years
55-64 years
65 years and over
Macroregions Regions Gender Urban/rural area
Level of education - persons - - percentages -
3.1.SOUTH MUNTENIA 1270247 95.1 6.4 21.3 29.3 24.8 13.3 4.9 Superior 192668 99.1 (3.0) 31.2 33.8 21.3 9.8 (0.9) Medium 781905 97.6 7.0 19.9 30.0 29.4 11.3 2.4
Post high-school of speciality or technical of foremen 43979 96.4 (1.7) 21.0 36.5 23.8 (13.4) (3.6) High-school 498403 99.2 9.2 23.3 30.2 28.7 7.8 (0.8) Vocational, complementary or of apprentices 239523 94.5 3.4 12.7 28.5 31.8 18.1 5.5
Low 295674 85.8 7.0 18.5 24.5 14.9 20.9 14.2 Gymnasium 252267 89.2 7.1 19.3 25.7 16.1 21.0 10.8 Primary or no education 43407 66.4 (6.9) (14.0) 17.6 (7.6) 20.3 33.6
MEN 735209 95.7 7.1 21.7 28.9 24.9 13.1 4.3
Superior 96861 99.0 (1.9) 32.3 31.4 20.7 12.7 (1.0) Medium 476737 97.0 7.5 19.1 29.0 29.2 12.2 3.0
Post high-school of speciality or technical of foremen 19927 94.5 (1.1) (11.6) 34.5 (30.2) (17.1) (5.5) High-school 277718 99.0 10.3 24.3 29.2 27.3 7.9 (1.0) Vocational, complementary or of apprentices 179092 94.1 3.9 11.7 28.1 32.1 18.3 5.9
Low 161611 89.9 9.1 23.2 27.0 14.5 16.1 10.1 Gymnasium 140010 91.5 8.9 23.5 27.6 15.4 16.1 8.5 Primary or no education 21600 79.3 (9.9) (21.3) (22.9) (8.6) (16.6) (20.7)
WOMEN 535038 94.2 5.4 20.7 29.9 24.7 13.5 5.8
Superior 95807 99.2 (4.1) 30.0 36.4 21.8 6.9 (0.8) Medium 305168 98.5 6.2 21.1 31.6 29.7 9.9 (1.5)
Post high-school of speciality or technical of foremen 24052 98.0 (2.2) 28.9 38.1 (18.5) (10.3) (2.0) High-school 220684 99.3 7.7 21.8 31.4 30.6 7.8 (0.7) Vocational, complementary or of apprentices 60432 95.8 (2.1) 15.7 29.5 31.0 17.5 (4.2)
Low 134062 81.0 (4.6) 12.9 21.5 15.4 26.6 19.0 Gymnasium 112256 86.3 (4.8) 14.1 23.2 17.0 27.2 13.7 Primary or no education 21806 53.7 (3.9) (6.9) (12.3) (6.7) (23.9) 46.3
URBAN 497449 99.5 4.2 24.0 31.5 28.1 11.7 (0.5)
Superior 145256 99.9 (2.6) 28.9 35.8 22.2 10.4 (0.1) Medium 308601 99.5 4.5 22.2 28.9 32.2 11.7 (0.5)
Post high-school of speciality or technical of foremen 28851 99.5 (0.4) 23.2 39.1 24.4 (12.4) (0.5) High-school 207201 99.8 5.7 25.5 27.4 32.8 8.4 (0.2) Vocational, complementary or of apprentices 72549 98.6 (2.8) 12.5 29.4 33.3 20.6 (1.4)
Low 43592 98.8 (7.4) 21.1 35.6 19.3 15.4 (1.2) Gymnasium 36253 98.8 (6.7) 20.9 35.3 20.9 (15.0) (1.2) Primary or no education 7340 98.8 (10.9) (21.8) (36.9) (11.7) (17.5) (1.2)
RURAL 772797 92.2 7.8 19.5 27.9 22.7 14.3 7.8
Superior 47412 96.6 (4.2) 38.1 27.8 18.6 (7.9) (3.4) Medium 473304 96.3 8.6 18.4 30.7 27.6 11.0 3.7
Post high-school of speciality or technical of foremen 15129 90.6 (4.2) (17.0) (31.5) (22.8) (15.1) (9.4) High-school 291202 98.7 11.6 21.7 32.2 25.8 7.4 (1.3) Vocational, complementary or of apprentices 166974 92.8 (3.7) 12.8 28.1 31.2 17.0 7.2
Low 252081 83.6 7.0 18.1 22.6 14.1 21.8 16.4 Gymnasium 216014 87.6 7.1 19.0 24.1 15.4 22.0 12.4 Primary or no education 36067 59.8 (6.1) (12.5) (13.6) (6.8) 20.8 40.2
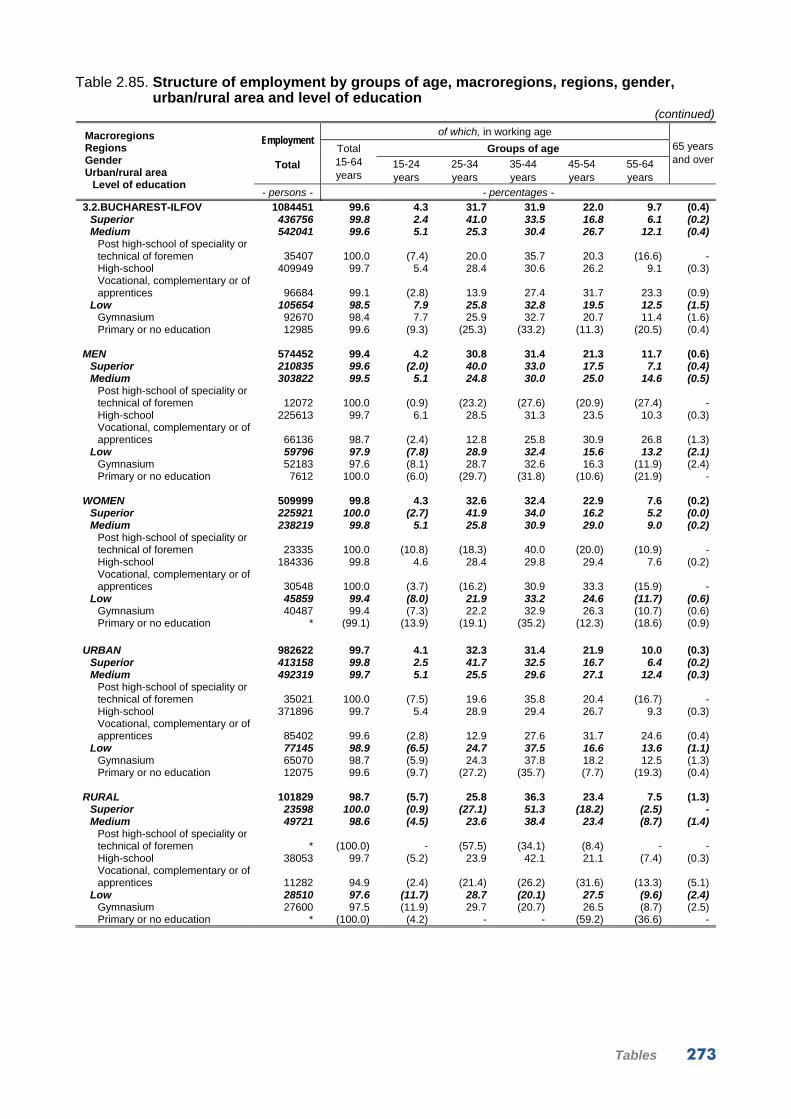
Tables 273
Table 2.85. Structure of employment by groups of age, macroregions, regions, gender, urban/rural area and level of education
(continued)
of which, in working age
Groups of age Employment
Total
Total 15-64 years
15-24 years
25-34 years
35-44 years
45-54 years
55-64 years
65 years and over
Macroregions Regions Gender Urban/rural area
Level of education - persons - - percentages -
3.2.BUCHAREST-ILFOV 1084451 99.6 4.3 31.7 31.9 22.0 9.7 (0.4) Superior 436756 99.8 2.4 41.0 33.5 16.8 6.1 (0.2) Medium 542041 99.6 5.1 25.3 30.4 26.7 12.1 (0.4)
Post high-school of speciality or technical of foremen 35407 100.0 (7.4) 20.0 35.7 20.3 (16.6) - High-school 409949 99.7 5.4 28.4 30.6 26.2 9.1 (0.3) Vocational, complementary or of apprentices 96684 99.1 (2.8) 13.9 27.4 31.7 23.3 (0.9)
Low 105654 98.5 7.9 25.8 32.8 19.5 12.5 (1.5) Gymnasium 92670 98.4 7.7 25.9 32.7 20.7 11.4 (1.6) Primary or no education 12985 99.6 (9.3) (25.3) (33.2) (11.3) (20.5) (0.4)
MEN 574452 99.4 4.2 30.8 31.4 21.3 11.7 (0.6)
Superior 210835 99.6 (2.0) 40.0 33.0 17.5 7.1 (0.4) Medium 303822 99.5 5.1 24.8 30.0 25.0 14.6 (0.5)
Post high-school of speciality or technical of foremen 12072 100.0 (0.9) (23.2) (27.6) (20.9) (27.4) - High-school 225613 99.7 6.1 28.5 31.3 23.5 10.3 (0.3) Vocational, complementary or of apprentices 66136 98.7 (2.4) 12.8 25.8 30.9 26.8 (1.3)
Low 59796 97.9 (7.8) 28.9 32.4 15.6 13.2 (2.1) Gymnasium 52183 97.6 (8.1) 28.7 32.6 16.3 (11.9) (2.4) Primary or no education 7612 100.0 (6.0) (29.7) (31.8) (10.6) (21.9) -
WOMEN 509999 99.8 4.3 32.6 32.4 22.9 7.6 (0.2)
Superior 225921 100.0 (2.7) 41.9 34.0 16.2 5.2 (0.0) Medium 238219 99.8 5.1 25.8 30.9 29.0 9.0 (0.2)
Post high-school of speciality or technical of foremen 23335 100.0 (10.8) (18.3) 40.0 (20.0) (10.9) - High-school 184336 99.8 4.6 28.4 29.8 29.4 7.6 (0.2) Vocational, complementary or of apprentices 30548 100.0 (3.7) (16.2) 30.9 33.3 (15.9) -
Low 45859 99.4 (8.0) 21.9 33.2 24.6 (11.7) (0.6) Gymnasium 40487 99.4 (7.3) 22.2 32.9 26.3 (10.7) (0.6) Primary or no education * (99.1) (13.9) (19.1) (35.2) (12.3) (18.6) (0.9)
URBAN 982622 99.7 4.1 32.3 31.4 21.9 10.0 (0.3) Superior 413158 99.8 2.5 41.7 32.5 16.7 6.4 (0.2) Medium 492319 99.7 5.1 25.5 29.6 27.1 12.4 (0.3)
Post high-school of speciality or technical of foremen 35021 100.0 (7.5) 19.6 35.8 20.4 (16.7) - High-school 371896 99.7 5.4 28.9 29.4 26.7 9.3 (0.3) Vocational, complementary or of apprentices 85402 99.6 (2.8) 12.9 27.6 31.7 24.6 (0.4)
Low 77145 98.9 (6.5) 24.7 37.5 16.6 13.6 (1.1) Gymnasium 65070 98.7 (5.9) 24.3 37.8 18.2 12.5 (1.3) Primary or no education 12075 99.6 (9.7) (27.2) (35.7) (7.7) (19.3) (0.4)
RURAL 101829 98.7 (5.7) 25.8 36.3 23.4 7.5 (1.3)
Superior 23598 100.0 (0.9) (27.1) 51.3 (18.2) (2.5) - Medium 49721 98.6 (4.5) 23.6 38.4 23.4 (8.7) (1.4)
Post high-school of speciality or technical of foremen * (100.0) - (57.5) (34.1) (8.4) - - High-school 38053 99.7 (5.2) 23.9 42.1 21.1 (7.4) (0.3) Vocational, complementary or of apprentices 11282 94.9 (2.4) (21.4) (26.2) (31.6) (13.3) (5.1)
Low 28510 97.6 (11.7) 28.7 (20.1) 27.5 (9.6) (2.4) Gymnasium 27600 97.5 (11.9) 29.7 (20.7) 26.5 (8.7) (2.5) Primary or no education * (100.0) (4.2) - - (59.2) (36.6) -

274 Labour force in Romania: Employment and unemployment - 2015
Table 2.85. Structure of employment by groups of age, macroregions, regions, gender, urban/rural area and level of education
(continued)
of which, in working age
Groups of age Employment
Total
Total 15-64 years
15-24 years
25-34 years
35-44 years
45-54 years
55-64 years
65 years and over
Macroregions Regions Gender Urban/rural area
Level of education - persons - - percentages -
4.MACROREGION FOUR 1538678 96.2 5.9 23.0 29.6 24.4 13.3 3.8 Superior 306089 99.6 3.1 30.5 34.5 21.2 10.3 (0.4) Medium 912229 99.0 6.0 22.3 30.7 28.1 11.9 1.0
Post high-school of speciality or technical of foremen 55658 98.7 (3.5) 21.4 38.1 24.9 (10.8) (1.3) High-school 647565 99.5 7.2 24.9 30.6 27.3 9.5 (0.5) Vocational, complementary or of apprentices 209006 97.6 (3.1) 14.6 29.0 31.4 19.5 (2.4)
Low 320360 84.9 8.2 18.0 21.7 16.8 20.2 15.1 Gymnasium 278182 88.2 8.6 18.6 23.3 17.6 20.1 11.8 Primary or no education 42178 63.3 (5.5) (14.0) (11.3) (11.7) 20.8 36.7
MEN 885339 97.0 6.2 23.8 29.4 24.2 13.4 3.0
Superior 154844 99.7 (3.2) 30.3 33.3 21.3 11.6 (0.3) Medium 562233 98.9 6.1 23.4 30.3 26.7 12.4 (1.1)
Post high-school of speciality or technical of foremen 24891 99.2 (2.7) (20.3) 35.3 27.9 (13.0) (0.8) High-school 389113 99.5 7.6 27.0 30.2 25.3 9.4 (0.5) Vocational, complementary or of apprentices 148229 97.3 (2.7) 14.5 29.9 30.0 20.2 (2.7)
Low 168261 88.2 9.6 19.5 22.7 18.4 18.0 11.8 Gymnasium 148694 89.8 9.4 19.7 23.4 18.9 18.4 10.2 Primary or no education 19568 76.7 (11.2) (18.1) (17.6) (14.1) (15.7) (23.3)
WOMEN 653339 95.1 5.5 22.0 29.8 24.6 13.2 4.9 Superior 151245 99.5 (3.0) 30.9 35.7 21.0 8.9 (0.5) Medium 349995 99.2 6.0 20.6 31.3 30.4 10.9 (0.8)
Post high-school of speciality or technical of foremen 30767 98.3 (4.1) 22.2 40.4 22.5 (9.1) (1.7) High-school 258451 99.5 6.7 21.8 31.3 30.2 9.5 (0.5) Vocational, complementary or of apprentices 60777 98.4 (4.0) 15.0 26.7 34.9 17.8 (1.6)
Low 152098 81.2 6.6 16.3 20.6 15.1 22.6 18.8 Gymnasium 129488 86.3 7.6 17.3 23.2 16.0 22.2 13.7 Primary or no education 22610 51.7 (0.6) (10.5) (5.8) (9.6) (25.2) 48.3
URBAN 828255 99.6 3.7 26.1 32.0 26.0 11.8 (0.4)
Superior 253778 99.9 2.7 31.4 33.4 22.1 10.3 (0.1) Medium 522088 99.6 4.0 23.7 31.6 28.4 11.9 (0.4)
Post high-school of speciality or technical of foremen 47175 100.0 (3.2) 22.7 36.2 26.8 (11.1) - High-school 378797 99.8 4.9 25.7 32.0 27.3 9.9 (0.2) Vocational, complementary or of apprentices 96117 98.6 (1.3) 16.3 28.0 33.3 19.7 (1.4)
Low 52389 98.0 (5.8) 23.4 28.5 21.1 19.2 (2.0) Gymnasium 48146 98.1 (5.7) 23.4 28.6 20.6 19.8 (1.9) Primary or no education * (96.7) (7.0) (23.2) (27.4) (26.9) (12.2) (3.3)
RURAL 710423 92.2 8.4 19.5 26.8 22.5 15.0 7.8
Superior 52311 98.3 (5.2) 26.3 39.9 16.6 (10.3) (1.7) Medium 390140 98.3 8.7 20.5 29.5 27.7 11.9 1.7
Post high-school of speciality or technical of foremen 8483 91.5 (5.1) (13.9) (48.8) (14.6) (9.1) (8.5) High-school 268768 99.1 10.6 23.7 28.7 27.3 8.8 (0.9) Vocational, complementary or of apprentices 112889 96.8 (4.6) 13.1 29.9 29.8 19.4 (3.2)
Low 267971 82.3 8.6 16.9 20.4 16.0 20.4 17.7 Gymnasium 230036 86.1 9.1 17.6 22.2 17.0 20.2 13.9 Primary or no education 37935 59.6 (5.4) (13.0) (9.5) (9.9) 21.8 40.4

Tables 275
Table 2.85. Structure of employment by groups of age, macroregions, regions, gender, urban/rural area and level of education
(continued)
of which, in working age
Groups of age Employment
Total
Total 15-64 years
15-24 years
25-34 years
35-44 years
45-54 years
55-64 years
65 years and over
Macroregions Regions Gender Urban/rural area
Level of education - persons - - percentages -
4.1.SOUTH-WEST OLTENIA 809403 93.4 6.1 19.8 28.1 25.0 14.4 6.6 Superior 154865 99.4 (2.4) 28.0 33.4 24.0 11.6 (0.6) Medium 433978 98.3 6.1 18.5 30.9 30.2 12.6 1.7
Post high-school of speciality or technical of foremen 43456 98.5 (3.3) 20.6 39.7 25.0 (9.9) (1.5) High-school 285632 99.1 7.5 20.3 31.0 30.8 9.5 (0.9) Vocational, complementary or of apprentices 104890 95.8 (3.4) 12.7 26.8 30.7 22.2 (4.2)
Low 220559 79.7 8.6 16.6 19.0 15.5 20.0 20.3 Gymnasium 186676 84.0 9.1 16.9 20.8 17.0 20.2 16.0 Primary or no education 33883 56.5 (5.9) (15.1) (9.1) (7.1) 19.3 43.5
MEN 456865 94.8 6.6 20.8 28.5 25.0 13.9 5.2
Superior 77967 99.5 (2.9) 28.9 32.0 22.9 12.8 (0.5) Medium 269153 98.1 6.1 19.1 31.3 28.4 13.2 (1.9)
Post high-school of speciality or technical of foremen 20029 99.4 (2.6) (18.9) 39.7 (27.1) (11.1) (0.6) High-school 172942 99.3 7.7 22.4 31.2 28.6 9.4 (0.7) Vocational, complementary or of apprentices 76181 95.2 (3.4) 11.8 29.3 28.4 22.3 (4.8)
Low 109745 83.5 10.4 19.1 19.5 17.9 16.6 16.5 Gymnasium 95790 85.8 10.0 18.8 20.4 19.5 17.1 14.2 Primary or no education 13955 67.4 (13.4) (21.2) (12.9) (6.6) (13.3) (32.6)
WOMEN 352538 91.6 5.4 18.6 27.6 25.0 15.0 8.4
Superior 76898 99.2 (2.0) 27.0 34.8 25.0 10.4 (0.8) Medium 164826 98.5 6.0 17.6 30.2 33.0 11.7 (1.5)
Post high-school of speciality or technical of foremen 23427 97.7 (4.0) (22.1) 39.7 (23.1) (8.8) (2.3) High-school 112689 98.9 7.1 17.3 30.8 34.1 9.6 (1.1) Vocational, complementary or of apprentices 28709 97.4 (3.4) (15.1) (20.2) 36.9 (21.8) (2.6)
Low 110814 76.1 6.9 14.1 18.6 13.1 23.4 23.9 Gymnasium 90886 82.0 8.2 14.8 21.3 14.3 23.4 18.0 Primary or no education 19928 48.9 (0.7) (10.9) (6.4) (7.4) (23.5) 51.1
URBAN 365554 99.2 2.7 22.9 32.0 29.3 12.3 (0.8)
Superior 127085 99.9 (1.9) 28.5 32.1 25.9 11.5 (0.1) Medium 220417 99.2 3.0 19.6 32.2 32.2 12.2 (0.8)
Post high-school of speciality or technical of foremen 36288 100.0 (2.8) 22.4 36.8 28.1 (9.9) - High-school 145690 99.5 (3.6) 19.7 33.3 32.5 10.4 (0.5) Vocational, complementary or of apprentices 38440 97.0 (1.0) (16.1) 23.8 35.1 21.0 (3.0)
Low 18051 95.5 (4.4) (25.2) (28.1) (17.1) (20.7) (4.5) Gymnasium 16290 95.9 (4.6) (22.6) (29.0) (17.6) (22.1) (4.1) Primary or no education * (92.2) (2.2) (50.2) (19.6) (12.3) (7.9) (7.8)
RURAL 443849 88.6 8.8 17.2 25.0 21.4 16.2 11.4
Superior 27780 97.0 (4.9) 25.4 39.1 (15.2) (12.4) (3.0) Medium 213561 97.3 9.2 17.5 29.5 28.1 13.0 (2.7)
Post high-school of speciality or technical of foremen 7169 91.0 (6.1) (11.5) (54.4) (9.4) (9.6) (9.0) High-school 139942 98.7 11.4 21.0 28.7 29.0 8.6 (1.3) Vocational, complementary or of apprentices 66450 95.2 (4.9) 10.7 28.6 28.1 22.9 (4.8)
Low 202508 78.3 9.0 15.8 18.2 15.3 20.0 21.7 Gymnasium 170386 82.8 9.5 16.3 20.1 16.9 20.0 17.2 Primary or no education 32121 54.6 (6.2) (13.2) (8.5) (6.8) (19.9) 45.4

276 Labour force in Romania: Employment and unemployment - 2015
Table 2.85. Structure of employment by groups of age, macroregions, regions, gender, urban/rural area and level of education
(continued)
of which, in working age
Groups of age Employment
Total
Total 15-64 years
15-24 years
25-34 years
35-44 years
45-54 years
55-64 years
65 years and over
Macroregions Regions Gender Urban/rural area
Level of education - persons - - percentages -
4.2.WEST 729275 99.3 5.7 26.7 31.2 23.7 12.0 (0.7) Superior 151224 99.8 (3.8) 33.2 35.6 18.3 8.9 (0.2) Medium 478250 99.7 6.0 25.8 30.5 26.2 11.2 (0.3)
Post high-school of speciality or technical of foremen 12201 99.4 (3.9) (24.0) (32.3) (24.8) (14.4) (0.6) High-school 361933 99.8 7.0 28.5 30.3 24.5 9.5 (0.2) Vocational, complementary or of apprentices 104116 99.4 (2.6) 16.6 31.2 32.1 16.9 (0.6)
Low 99801 96.2 7.0 21.1 27.7 19.8 20.6 (3.8) Gymnasium 91506 96.7 7.4 22.1 28.4 18.8 20.0 (3.3) Primary or no education 8295 91.0 (3.9) (9.5) (20.3) (30.3) (27.0) (9.0)
MEN 428474 99.4 5.9 27.1 30.3 23.3 12.8 (0.6)
Superior 76877 99.9 (3.6) 31.7 34.6 19.7 10.3 (0.1) Medium 293081 99.7 6.0 27.3 29.5 25.1 11.8 (0.3)
Post high-school of speciality or technical of foremen * (98.4) (3.1) (26.2) (17.3) (31.3) (20.5) (1.6) High-school 216171 99.7 7.4 30.7 29.4 22.7 9.5 (0.3) Vocational, complementary or of apprentices 72048 99.5 (1.8) 17.4 30.6 31.7 18.0 (0.5)
Low 58516 97.2 (8.0) 20.3 28.9 19.3 20.7 (2.8) Gymnasium 52904 96.9 (8.3) 21.3 28.9 17.8 20.6 (3.1) Primary or no education * (100.0) (5.8) (10.4) (29.2) (32.7) (21.9) -
WOMEN 300801 99.1 5.5 26.0 32.4 24.2 11.0 (0.9)
Superior 74347 99.8 (4.1) 34.8 36.7 16.8 (7.4) (0.2) Medium 185170 99.8 6.0 23.3 32.2 28.0 10.3 (0.2)
Post high-school of speciality or technical of foremen 7340 100.0 (4.4) (22.6) (42.2) (20.5) (10.3) - High-school 145762 99.9 6.4 25.2 31.7 27.2 9.4 (0.1) Vocational, complementary or of apprentices 32068 99.3 (4.5) (14.9) 32.5 33.1 (14.3) (0.7)
Low 41285 94.8 (5.7) 22.2 26.0 20.5 20.4 (5.2) Gymnasium 38602 96.4 (6.1) 23.2 27.7 20.2 19.2 (3.6) Primary or no education * (72.2) - (7.7) (1.6) (25.2) (37.7) (27.8)
URBAN 462701 99.9 4.6 28.5 32.0 23.4 11.4 (0.1)
Superior 126693 99.9 (3.5) 34.4 34.6 18.3 9.1 (0.1) Medium 301671 99.9 4.7 26.8 31.2 25.6 11.6 (0.1)
Post high-school of speciality or technical of foremen 10887 100.0 (4.4) (23.7) (34.0) (22.6) (15.3) - High-school 233107 100.0 5.6 29.5 31.2 24.1 9.6 - Vocational, complementary or of apprentices 57677 99.7 (1.5) 16.5 30.8 32.1 18.8 (0.3)
Low 34337 99.3 (6.6) 22.4 28.7 23.2 (18.4) (0.7) Gymnasium 31856 99.3 (6.3) 23.8 28.5 22.1 (18.6) (0.7) Primary or no education * (100.0) (10.4) (4.0) (32.8) (37.4) (15.4) -
RURAL 266574 98.2 7.7 23.4 29.9 24.2 13.0 (1.8) Superior 24531 99.7 (5.5) 27.2 40.8 (18.1) (8.1) (0.3) Medium 176579 99.4 8.1 24.1 29.4 27.3 10.5 (0.6)
Post high-school of speciality or technical of foremen * (94.2) - (27.0) (17.9) (42.9) (6.4) (5.8) High-school 128826 99.5 9.6 26.7 28.7 25.4 9.1 (0.5) Vocational, complementary or of apprentices 46439 99.1 (4.2) 16.7 31.7 32.1 14.4 (0.9)
Low 65463 94.6 (7.3) 20.4 27.1 18.0 21.8 (5.4) Gymnasium 59650 95.3 (7.9) 21.2 28.3 17.1 20.8 (4.7) Primary or no education * (87.2) (1.1) (11.9) (14.9) (27.2) (32.1) (12.8)

Tables 277
Table 2.86. Activity rate of working age population (15-64 years) by level of education, macroregions, regions, gender and urban/rural area
- % -
Level of education Macroregions Regions Gender Urban/rural area
Total Superior Medium Low
TOTAL 66.1 89.0 70.1 46.9 Men 75.3 91.6 78.9 59.3 Women 56.7 86.6 60.1 35.8 Urban 65.9 89.4 67.2 32.2 Rural 66.4 86.7 74.5 54.7
1. MACROREGION ONE 64.1 90.4 70.4 38.3 Men 73.1 92.7 77.9 53.2 Women 54.8 88.3 62.2 24.5 Urban 66.8 90.9 69.3 28.5 Rural 60.3 88.2 72.3 43.5
1.1. NORTH-WEST 66.6 90.9 71.5 44.1
Men 75.0 92.1 78.5 58.7 Women 58.1 89.8 64.1 30.4 Urban 68.2 91.1 70.4 28.6 Rural 64.6 90.1 73.3 51.2
1.2. CENTER 61.2 89.8 69.2 32.1
Men 71.1 93.3 77.3 47.3 Women 51.2 86.7 60.0 18.2 Urban 65.5 90.6 68.1 28.4 Rural 55.0 85.7 71.0 34.4
2. MACROREGION TWO 68.6 88.4 73.3 55.9 Men 77.7 90.1 81.7 67.4 Women 59.1 86.9 63.5 45.2 Urban 65.0 88.9 68.2 35.2 Rural 72.2 85.3 79.9 64.3
2.1. NORTH-EAST 72.8 88.8 76.5 63.1
Men 79.2 90.0 83.3 70.0 Women 66.0 87.6 68.8 56.4 Urban 66.8 88.9 68.9 38.2 Rural 77.6 87.8 84.5 70.7
2.2. SOUTH-EAST 63.3 88.0 69.2 46.1
Men 75.8 90.3 79.8 63.7 Women 50.4 86.1 56.5 30.8 Urban 63.2 89.0 67.4 32.5 Rural 63.4 83.4 72.1 53.9
3. MACROREGION THREE 68.2 90.2 70.8 45.2 Men 77.2 92.7 80.3 57.1 Women 59.3 88.0 60.5 35.0 Urban 68.9 90.3 68.3 36.4 Rural 67.0 89.5 75.2 51.8
3.1. SOUTH MUNTENIA 66.9 89.6 72.8 47.4
Men 76.7 92.2 81.6 60.1 Women 56.6 87.2 62.4 36.5 Urban 65.8 90.2 68.4 33.0 Rural 67.7 88.0 76.1 52.8

278 Labour force in Romania: Employment and unemployment - 2015
Table 2.86. Activity rate of working age population (15-64 years) by level of education, macroregions, regions, gender and urban/rural area
(continued) - % -
Level of education Macroregions Regions Gender Urban/rural area
Total Superior Mediu Scăzut
3.2. BUCHAREST-ILFOV 69.9 90.5 68.1 40.3
Men 77.9 92.9 78.3 50.6 Women 62.6 88.3 58.3 31.6 Urban 70.8 90.3 68.2 39.0 Rural 62.2 92.9 66.9 44.8
4. MACROREGION FOUR 62.0 85.5 64.3 43.6 Men 72.1 89.7 74.7 54.6 Women 51.6 81.5 52.3 34.6 Urban 60.9 86.1 61.6 25.5 Rural 63.4 82.5 68.4 53.5
4.1. SOUTH-WEST OLTENIA 62.9 83.5 63.9 50.1
Men 72.5 88.3 74.8 58.6 Women 52.9 79.0 51.0 42.8 Urban 60.7 84.6 60.6 23.2 Rural 65.1 78.8 67.7 59.9
4.2. WEST 61.0 87.7 64.8 35.3
Men 71.6 91.2 74.5 49.2 Women 50.3 84.4 53.7 24.8 Urban 61.0 87.7 62.4 27.2 Rural 61.0 87.4 69.2 42.4
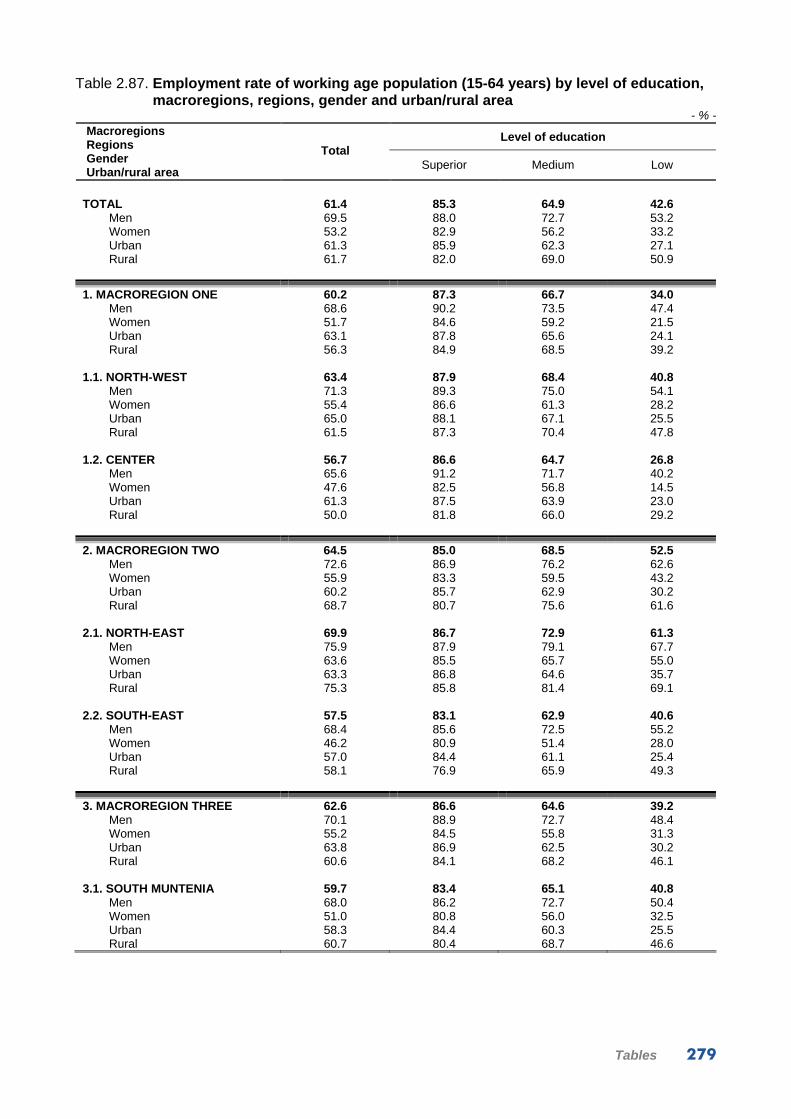
Tables 279
Table 2.87. Employment rate of working age population (15-64 years) by level of education, macroregions, regions, gender and urban/rural area
- % -
Level of education Macroregions Regions Gender Urban/rural area
Total Superior Medium Low
TOTAL 61.4 85.3 64.9 42.6 Men 69.5 88.0 72.7 53.2 Women 53.2 82.9 56.2 33.2 Urban 61.3 85.9 62.3 27.1 Rural 61.7 82.0 69.0 50.9
1. MACROREGION ONE 60.2 87.3 66.7 34.0 Men 68.6 90.2 73.5 47.4 Women 51.7 84.6 59.2 21.5 Urban 63.1 87.8 65.6 24.1 Rural 56.3 84.9 68.5 39.2
1.1. NORTH-WEST 63.4 87.9 68.4 40.8
Men 71.3 89.3 75.0 54.1 Women 55.4 86.6 61.3 28.2 Urban 65.0 88.1 67.1 25.5 Rural 61.5 87.3 70.4 47.8
1.2. CENTER 56.7 86.6 64.7 26.8
Men 65.6 91.2 71.7 40.2 Women 47.6 82.5 56.8 14.5 Urban 61.3 87.5 63.9 23.0 Rural 50.0 81.8 66.0 29.2
2. MACROREGION TWO 64.5 85.0 68.5 52.5 Men 72.6 86.9 76.2 62.6 Women 55.9 83.3 59.5 43.2 Urban 60.2 85.7 62.9 30.2 Rural 68.7 80.7 75.6 61.6
2.1. NORTH-EAST 69.9 86.7 72.9 61.3
Men 75.9 87.9 79.1 67.7 Women 63.6 85.5 65.7 55.0 Urban 63.3 86.8 64.6 35.7 Rural 75.3 85.8 81.4 69.1
2.2. SOUTH-EAST 57.5 83.1 62.9 40.6
Men 68.4 85.6 72.5 55.2 Women 46.2 80.9 51.4 28.0 Urban 57.0 84.4 61.1 25.4 Rural 58.1 76.9 65.9 49.3
3. MACROREGION THREE 62.6 86.6 64.6 39.2 Men 70.1 88.9 72.7 48.4 Women 55.2 84.5 55.8 31.3 Urban 63.8 86.9 62.5 30.2 Rural 60.6 84.1 68.2 46.1
3.1. SOUTH MUNTENIA 59.7 83.4 65.1 40.8
Men 68.0 86.2 72.7 50.4 Women 51.0 80.8 56.0 32.5 Urban 58.3 84.4 60.3 25.5 Rural 60.7 80.4 68.7 46.6

280 Labour force in Romania: Employment and unemployment - 2015
Table 2.87. Employment rate of working age population (15-64 years) by level of education, macroregions, regions, gender and urban/rural area
(continued) - % -
Level of education Macroregions Regions Gender Urban/rural area
Total Superior Medium Low
3.2. BUCHAREST-ILFOV 66.2 88.1 64.0 35.6
Men 73.0 90.2 72.8 43.9 Women 59.9 86.2 55.5 28.7 Urban 67.0 87.8 64.0 33.6 Rural 59.7 92.4 63.4 42.5
4. MACROREGION FOUR 56.9 80.6 58.6 39.9 Men 65.2 84.7 67.1 48.4 Women 48.4 76.8 48.8 32.9 Urban 56.2 81.4 56.9 21.3 Rural 57.8 76.9 61.2 50.1
4.1. SOUTH-WEST OLTENIA 56.2 77.1 55.7 46.1
Men 63.0 81.1 63.6 51.8 Women 49.0 73.4 46.4 41.2 Urban 54.0 78.6 53.6 17.0 Rural 58.3 70.9 58.2 56.7
4.2. WEST 57.7 84.5 61.5 32.0
Men 67.6 88.7 70.6 43.8 Women 47.7 80.6 51.1 22.9 Urban 58.1 84.5 59.6 24.4 Rural 57.1 84.7 65.1 38.6

Tables 281
Table 2.88. Unemployment rate by level of education, macroregions, regions, gender and urban/rural area
- % -
Level of education Macroregions Regions Gender Urban/rural area
Total Superior Medium Low
TOTAL 6.8 4.1 7.2 8.1 Men 7.5 3.9 7.8 9.6 Women 5.8 4.4 6.4 6.1 Urban 7.0 3.9 7.3 15.5 Rural 6.6 5.3 7.1 6.1
1. MACROREGION ONE 5.9 3.4 5.3 10.5 Men 6.1 2.6 5.7 10.4 Women 5.6 4.2 4.8 10.7 Urban 5.5 3.4 5.4 15.2 Rural 6.4 3.6 5.2 9.0
1.1. NORTH-WEST 4.6 3.3 4.4 6.8
Men 4.8 2.9 4.4 7.2 Women 4.5 3.6 4.3 6.2 Urban 4.7 3.4 4.7 10.8 Rural 4.6 3.0 3.8 5.9
1.2. CENTER 7.4 3.5 6.5 16.3
Men 7.7 2.2 7.1 14.9 Women 6.9 4.8 5.5 19.6 Urban 6.4 3.4 6.2 19.0 Rural 9.1 4.5 7.0 14.9
2. MACROREGION TWO 5.8 3.9 6.5 5.2 Men 6.3 3.6 6.7 6.5 Women 5.0 4.1 6.2 3.7 Urban 7.4 3.6 7.7 13.7 Rural 4.4 5.2 5.1 3.6
2.1. NORTH-EAST 3.6 2.3 4.7 2.4
Men 3.9 2.3 4.8 2.8 Women 3.3 2.4 4.5 2.0 Urban 5.2 2.3 6.2 6.2 Rural 2.6 2.2 3.5 1.9
2.2. SOUTH-EAST 9.0 5.5 9.0 11.1
Men 9.6 5.1 9.1 12.7 Women 8.2 5.9 8.9 8.3 Urban 9.8 5.2 9.4 21.9 Rural 8.1 7.6 8.5 7.7
3. MACROREGION THREE 8.0 4.0 8.6 12.0 Men 9.0 4.1 9.2 14.2 Women 6.9 3.9 7.8 9.1 Urban 7.5 3.7 8.4 17.1 Rural 8.9 5.9 9.0 9.6
3.1. SOUTH MUNTENIA 10.3 6.8 10.4 12.2
Men 11.0 6.5 10.6 14.7 Women 9.3 7.2 10.0 9.0 Urban 11.4 6.4 11.8 22.6 Rural 9.6 8.3 9.4 10.1

282 Labour force in Romania: Employment and unemployment - 2015
Table 2.88. Unemployment rate by level of education, macroregions, regions, gender and urban/rural area
(continued) - % -
Level of education Macroregions Regions Gender Urban/rural area
Total Superior Medium Low
3.2. BUCHAREST-ILFOV 5.3 2.7 6.0 11.4
Men 6.2 2.9 7.0 12.9 Women 4.2 2.4 4.8 9.3 Urban 5.4 2.8 6.1 13.5 Rural 4.0 0.6 5.1 4.9
4. MACROREGION FOUR 7.9 5.7 8.8 7.4 Men 9.3 5.5 10.0 10.2 Women 5.9 5.8 6.8 4.1 Urban 7.6 5.4 7.6 16.4 Rural 8.3 6.8 10.3 5.4
4.1. SOUTH-WEST OLTENIA 10.1 7.6 12.6 6.6
Men 12.5 8.2 14.7 10.0 Women 6.7 7.0 8.9 3.0 Urban 10.9 7.1 11.5 26.1 Rural 9.4 9.8 13.7 4.3
4.2. WEST 5.4 3.5 5.1 9.2
Men 5.6 2.7 5.2 10.8 Women 5.0 4.4 4.8 7.0 Urban 4.8 3.6 4.6 10.3 Rural 6.4 3.1 5.9 8.7