national healthcare economic evaluation guidelines: a
TRANSCRIPT

Vol.:(0123456789)
PharmacoEconomics - Open (2021) 5:349–364 https://doi.org/10.1007/s41669-020-00250-7
REVIEW ARTICLE
National Healthcare Economic Evaluation Guidelines: A Cross‑Country Comparison
Deepshikha Sharma1 · Arun Kumar Aggarwal1 · Laura E. Downey2 · Shankar Prinja1
Accepted: 15 December 2020 / Published online: 10 January 2021 © The Author(s) 2021
AbstractBackground and Objectives Globally, a number of countries have developed guidelines that describe the design and conduct of economic evaluations as part of health technology assessment (HTA) or pharmacoeconomic analysis for decision mak-ing. The current scoping review was undertaken with an objective to summarize the recommendations made on methods of economic evaluation by the national healthcare economic evaluation (HEE) guidelines.Methodology A comprehensive search was undertaken in the website repositories of the International Society for Phar-macoeconomic and Outcomes Research (ISPOR) and Guide to Economic Analysis and Research (GEAR), and websites of national HTA agencies and ministries of health of individual countries. All guidelines in the English language were included in this review. Data were extracted with respect to general and methodological characteristics, and a descriptive analysis of recommendations made across the countries was undertaken.Results Overall, our review included 31 national HEE guidelines, published between 1997 and August 2020. Nearly half (45%) of the guidelines targeted the evaluation of pharmaceuticals. The nature of the guidelines was either mandatory (31%), recommendatory (42%), or voluntary (16%). There was a substantial consensus among the guidelines on several key principles, including type of economic evaluation (cost-utility analysis), time horizon of the analysis (long enough), health outcome measure (quality-adjusted life-years) and use of sensitivity analyses. The recommendations on study perspective, comparator, discount rate and type of costs to be included (particularly the inclusion of indirect costs) varied widely.Conclusion Despite similarity in the overall processes, variation in several recommendations given by various national HEE guidelines was observed. This is perhaps unsurprising given the differences in the health systems and financing mechanisms, capacity of local researchers, and data availability. This review offers important lessons and a starting point for countries that are planning to develop their own HEE guidelines.
Supplementary Information The online version contains supplementary material available at https ://doi.org/10.1007/s4166 9-020-00250 -7.
* Shankar Prinja [email protected]
1 Department of Community Medicine and School of Public Health, Post Graduate Institute of Medical Education and Research, Chandigarh 160012, India
2 School of Public Health, Imperial College, London, UK
1 Introduction
Increased demand for healthcare services as a result of demographic and epidemiological transition, and an accel-erated introduction of new drugs and technologies has increased the pressure on healthcare budgets worldwide
[1]. Given the finite nature of healthcare resources, it is essential to inform resource allocation decisions through evidence-based mechanisms such as health technology assessment (HTA) [2].
The World Health Organization passed a resolution for HTA in 2014, recognizing the importance of HTA in sup-porting countries to make cost-effective resource alloca-tion decisions [3]. Many high-income countries, as well as an increasing number of middle-income countries, world-wide have established HTA systems to support priority-setting decisions [4–8]. In order for policy decisions based on HTA evidence to be applied fairly, it is important that a uniform and transparent process is in place to ensure that all HTA evaluations are carried out according to rigorous standards of best practices [9]. Since economic evaluation is one of the mainstays of HTA, several countries have developed guidelines that address the design and conduct

350 D. Sharma et al.
Key Points for Decision Makers
This review provides important implications for low- and middle-income countries and can act as a starting point for these countries to develop their own national guide-lines.
The recommendations on the study perspective and the costs to be included varied widely.
There is a lack of consensus on whether and how to account for indirect costs.
There is no consensus on how to calculate the rate for discounting.
to describe and compare national HEE guidelines have been made, however the majority of these reviews focused on guidelines developed in European countries [13, 21, 22]. Moreover, in light of methodological advancements occur-ring in the field of health economics in recent years, several of these guidelines have also been updated. With growing interest internationally in the use of HTA, new guidelines have been developed in Asian and African nations that have not been captured in earlier reviews [23, 24]. We undertook this review to provide a comparative review of the recom-mendations made by the national HEE guidelines. This would be a useful starting point for countries that are begin-ning to form their own national HEE for HTA.
2 Methodology
2.1 Literature Search
A comprehensive search was performed to identify national HEE guidelines published until 31 August 2020. All forms of guidelines or recommendations for under-taking HEE (for reimbursement and methodological pur-poses) were considered, e.g. HTA guidelines, pharma-coeconomic guidelines or economic evaluation guides. We first searched two website repositories that included international economic evaluation information: Inter-national Society for Pharmacoeconomic and Outcomes Research (ISPOR) and Guide to Economic Analysis and Research (GEAR) [10, 25]. These repositories were con-sidered as they are the most comprehensive databases on HEE guidelines, which identify guidelines by undertaking online searches of databases such as Medline and Google Scholar [26]. Furthermore, these repositories are updated at regular intervals (approximately 6 months) by experts in the field of health economics [10, 26]. In addition, the websites of national HTA agencies and ministries of health of individual countries were also searched. A list of coun-tries to be searched was compiled, referring to the mem-ber lists of international HTA organizations, including the International Network of Agencies for Health Technol-ogy Assessment (INAHTA; 33 countries), European Net-work for Health Technology Assessment (EUnetHTA; 29 countries) and Health Technology Assessment Agencies in Asia (HTAsialink; 15 countries) [27–29]. All guidelines in the English language were included in the review. For country guidelines that had multiple versions, the most recent version was retrieved and reviewed.
We excluded quality assurance and reporting guidelines such as the Consolidated Health Economic Evaluation Reporting Standards (CHEERS) checklist, Quality of Health Economic Studies (QHES) and Drummond’s checklist as
of economic evaluations. These guidelines assist research-ers on what methods to use while conducting economic evaluations as part of HTA [10].
In general, the national healthcare economic evaluation (HEE) guidelines have been developed as methodological guides for analysts for conducting and reporting economic evaluations [11, 12]. In addition, these HEE guidelines become important resources for users to evaluate the qual-ity of any HTA evaluation. In some cases, these guidelines are mandatory and are issued by the government authori-ties to define formats for listing new drugs for reimburse-ment purposes [10–13]. In other cases, these guidelines may not be mandatory, however their use is highly encour-aged to improve standardization and transparency in the economic evaluations undertaken [14]. Such guidelines may be either recommendatory or voluntary in nature [10, 13, 14].
In low- and middle-income countries (LMICs), the use of HTA in resource allocation planning and decision making is even more important considering the limited availability of healthcare resources. While an increase in the number of economic evaluations being undertaken in LMICs is witnessed, their quality remains questionable [15, 16]. Systematic reviews of economic evaluations highlight the lack of consistency in methodological and reporting standards in the absence of common guidelines [17, 18]. Researchers in LMICs often resort to interna-tional guidance documents such as the WHO Guide to Cost-Effectiveness Analysis and the International Deci-sion Support Initiative’s (iDSI) reference case [19, 20]. However, indigenously developed HEE guidelines that account for local contextual factors and priorities are the gold standard that each country must work towards.
The objective of this paper was to review and compare the recommendations made in the national HEE guidelines for HTA or pharmacoeconomic analysis. To date, some attempts

351Comparison of national economic evaluation guidelines
these primarily provide recommendations on the report-ing of HEEs rather than technical recommendations on the conduct of economic evaluations [30–32]. Guidelines that solely provided recommendations related to a subsection of economic evaluations, such as costing, modelling or budget impact analysis (BIA), were not considered in this review.
2.2 Data Extraction and Synthesis
Data were extracted using a template (electronic supplemen-tary sheet 1) that had two components; first, general guide-line characteristics (year of publication, type of guideline, purpose of the guideline, nature of the guideline, agency responsible for its creation, etc.); and second, methodologi-cal characteristics pertaining to the principles of economic evaluation (comparator, study perspective, target population, analytic technique, preferred costs to be included, measure for health outcome, study time horizon, discount rate, mod-elling, uncertainty analysis, equity analysis and BIA).
A descriptive analysis of recommendations across the national HEE guidelines was undertaken. Based on the nature of the national HEE guidelines, i.e. mandatory, rec-ommendatory (use highly recommended) or voluntary (no obligation), the countries were divided into three groups and the recommendations were compared.
3 Results
In total, 47 national HEE guidelines were identified [33–79]. While Iran and Switzerland reportedly have specific guide-lines, complete versions of these are not available online, hence they could not be included [70, 79]. Twelve guidelines were excluded as these were available in languages other than English [65–69, 71–77]. This resulted in a total of 33 guidelines for inclusion in the review. Another guideline (regions of Spain—Catalonia) was excluded because it was regional in nature and did not apply to the entire country [78]. Furthermore, guidelines for Bhutan did not provide any methodological details. These were general guidelines for the organizational set-up of the country’s HTA wing, thus Bhutan was also excluded [64]. Finally, a set of 31 national HEE guidelines, published between 1997 and August 2020 were included in the review (Fig. 1) [33–63].
3.1 General Characteristics
As per the World Bank classification of countries, 26 of 31 national HEE guidelines belonged to high-income countries [33–39, 41–45, 47–50, 52–57, 59, 60, 62, 63], while five were from middle-income countries [40, 46, 51, 58, 61]. Until August 2020, none of the low-income countries had developed an HEE guideline. Furthermore, more than half
(n = 18) of the national HEE guidelines were from European countries [34–36, 38, 39, 41–45, 47, 49, 53–56, 58, 62].
3.1.1 Year of Publication
The first ever national HEE guideline identified in this review was produced in Australia in 1992, followed by Can-ada in 1994 [80, 81]. These two countries have since pro-duced the fifth and fourth version of their guidelines, respec-tively [33, 37]. The majority of the national HEE guidelines included in this review (n = 23, 74%) were published after 2010 (Fig. 2) [33, 35, 37, 38, 40–47, 49–54, 56–58, 61–63]. Of these, five were new guidelines introduced for the first time, whereas the remainder were updated versions of pre-viously published guidelines [38, 40, 46, 57, 58]. In 2019 alone, five countries had released revised versions of their national HEE guidelines [42, 47, 50, 51, 56].
3.1.2 Nature of the Guidelines
While 14 (45%) of the national HEE guidelines targeted the evaluation of pharmaceuticals, the remaining (n = 17, 55%) catered to a broader mix of healthcare technologies [33, 35, 39, 40, 48, 49, 51–53, 55, 56, 58, 60]. Only 10 national HEE guidelines (32%) were mandatory in nature [33, 36, 42–44, 50, 53, 55, 61, 62], while others were either recom-mendatory (n = 13, 42%) [34, 37, 38, 40, 41, 45, 47, 49, 51, 52, 54, 56, 60] or voluntary (n = 5, 16%) [39, 57–59, 63]. Three national HEE guidelines (Baltic States, Indonesia and Israel) did not explicitly specify serving as either purpose [35, 46, 48].
3.2 Summary of Recommendations
A summary of findings from the review, according to the principles of economic evaluation, is presented in Table 1. All the national HEE guidelines recognized and provided recommendations on the basic principles of economic evalu-ation but differed in the extent to which details were pro-vided. There was also considerable variation in the methods to be followed.
(1) Type of Economic AnalysisWhile all mandatory and most of the recommendatory
(85%) guidelines clearly prescribed the analytical technique as either a cost-utility analysis (CUA) or cost-effectiveness analysis (CEA), nearly half of the voluntary guidelines (50%) were open-ended and stated that any method of eco-nomic evaluation may be chosen (Table 1). Cost-benefit analysis (CBA) was the least recommended method and was usually recommended only as an additional analysis in cases where monetary effects of the interventions being compared were considered to be important [33, 34, 37, 43]. The major-ity (68%) of the national HEE guidelines also acknowledged

352 D. Sharma et al.
the fact that in special scenarios where the effectiveness of the competing technologies did not differ, the use of cost-minimization analysis (CMA) will be considered acceptable [33–36, 40, 42, 43, 45–47, 50–60]; however, a few guide-lines (32%) did not explicitly mention CMA as an accept-able technique [37–39, 41, 44, 48, 49, 61–63]. Furthermore, guidelines for Thailand and Canada identified CMA as a costing exercise and not a full economic evaluation, with the latter specifically recommending against its use [37].
(2) PerspectiveFifteen (48%) national HEE guidelines recommended
using the payers’ perspective, with varying terms to describe this [33, 35, 37, 42–45, 48, 50–52, 54, 57, 58, 63], while four
national HEE guidelines specified it as healthcare system perspective [33, 35, 48, 57]. Other terms used to describe perspective included publicly funded healthcare payer [35, 48], statutory health insurance (SHI) [44], third-party payer [58], funder [52] and healthcare decision maker [63]. Eight national HEE guidelines (26%) recommended a societal per-spective for primary analysis [39, 46, 53, 55, 59–62], while 10 countries (26%) recommended a societal perspective for an additional analysis if required [33, 35, 37, 38, 44, 45, 47, 51, 54, 63]. Three countries (10%) stated that any perspec-tive relevant to the research question may be considered [34, 40, 49]. Twenty-six national HEE guidelines recommended using a common perspective for both costs and outcomes,
Fig. 1 PRISMA flowchart of included national healthcare economic evaluation guidelines

353Comparison of national economic evaluation guidelines
however the remaining five (16%) guidelines stated that a different perspective should be used for costs (payer perspec-tive) and outcomes (either societal or patients and individu-als whose health is affected) (Table 1) [36, 38, 41, 47, 56].
Nevertheless, even within the societal perspective, varia-tion in the recommendation on type of costs to be included was observed. Several guidelines recommend including all costs and outcomes within and outside the health system, including other sectors such as education, housing, judicial system, etc. [33, 35, 37–39, 43–45, 47, 62]. Other guide-lines recommended including all healthcare-related costs irrespective of the payer, including direct medical, direct non-medical and indirect costs [46, 51, 54, 59–61]. The guidelines for Portugal recommended that in addition to the direct medical, non-medical and indirect costs, intangible costs should also be included under societal perspective [55]. Furthermore, the Norwegian guidelines recommended using a societal perspective but with limitations, where the inclusion of indirect costs due to productivity losses was optional [53].
(3) Target PopulationA large number of national HEE guidelines recommend
that the target population is the one that is most likely to receive the proposed intervention in clinical practice (approved or potential users) and should be clearly described [33, 36–38, 41, 42, 44–57, 62]. The guidelines for France state that the target population consists of all individuals whose health is directly or indirectly affected by the inter-vention [43], while the Baltic guidelines recommend that the analysis should be performed on the entire population included in the clinical trial [35]. Other remaining guidelines
do not identify specific features of the target population but state that the target population should be clearly defined, with details on demographic and disease-specific character-istics [34, 46, 47, 58–61, 63].
(4) Choice of ComparatorThe majority of national HEE guidelines (17, 55%) across
the three groups recommended that the comparator chosen in the economic evaluation should be the one that is most commonly used, either as routine practice/current care or in accordance with the standard treatment guidelines [34, 35, 37, 38, 40, 41, 45–49, 55, 58, 59, 61–63]. The second most frequently recommended comparator (9, 29%) was the alternative that was most likely to be replaced with the intro-duction of the new alternative (Table 1) [33, 50–54, 56, 57, 60]. However, some countries such as France and Germany do not identify any specific alternative as the comparator but recommend that all alternatives that compete with the inter-vention should be used as comparators [43, 44]. Similarly, Canada, England, Norway and Thailand also recommend that all appropriate comparators should be identified [37, 41, 53, 61], while Belgium recommends identifying the relevant comparator from all available alternatives using an efficiency frontier [36]. In addition to the primary comparator, certain guidelines also recommend using additional comparators that include the cheapest, most efficacious, or current best practices [38, 54, 55, 61].
(5) Time HorizonIn general, most of the national HEE guidelines recom-
mended that the time horizon should be conceptually based on the natural course of the disease and the anticipated effects of the intervention. Several national HEE guidelines
Fig. 2 Timeline of the publication of national healthcare economic evaluation guidelines

354 D. Sharma et al.
Tabl
e 1
Rec
omm
enda
tions
mad
e by
nat
iona
l hea
lthca
re e
cono
mic
eva
luat
ion
guid
elin
es o
n pr
inci
ples
of e
cono
mic
eva
luat
ion
CEA
cos
t-effe
ctiv
enes
s an
alys
is, C
UA
cost-
utili
ty a
naly
sis,
Bal
tic s
tate
s La
tvia
, Lith
uani
a, E
stoni
a, D
ALY
disa
bilit
y-ad
juste
d lif
e-ye
ars,
DSA
det
erm
inist
ic s
ensi
tivity
ana
lysi
s, PS
A pr
obab
ilisti
c se
nsiti
vity
ana
lysi
s, Q
ALY
qual
ity-a
djus
ted
life-
year
, US
Uni
ted
Stat
esa Fr
ance
: col
lect
ive
pers
pect
ive
*CU
A is
pre
ferr
ed o
ver o
ther
type
s of e
cono
mic
ana
lysi
s
Cha
ract
erist
icRe
com
men
datio
nN
(%)
Man
dato
ry g
uide
lines
Reco
mm
enda
tory
gui
delin
esVo
lunt
ary
guid
elin
es
Ana
lytic
tech
niqu
ePr
imar
ily/p
refe
rabl
y C
UA
15
(49)
Aus
tralia
*, F
inla
nd*,
Japa
n, N
orw
ay, P
ortu
-ga
l*, T
haila
nd, T
he N
ethe
rland
sC
anad
a, C
roat
ia, E
ngla
nd a
nd W
ales
, Ir
elan
d, N
ew Z
eala
nd, S
cotla
ndIn
done
sia,
Isra
el
CU
A o
r CEA
10 (3
2)B
elgi
um, F
ranc
e, G
erm
any
Hun
gary
, Ita
ly, M
alay
sia,
Pol
and,
Tai
wan
Den
mar
k, U
SA
ny te
chni
que
(justi
fy)
6 (1
9)–
Aus
tria,
Egy
ptSo
uth
Afr
ica,
Spa
in, S
inga
pore
, Bal
ticPe
rspe
ctiv
ePa
yer
15 (4
8)A
ustra
lia, F
inla
nd, F
ranc
ea , Ger
man
y, Ja
pan
Can
ada,
Hun
gary
, Mal
aysi
a, N
ew Z
eala
nd,
Pola
ndB
altic
, Isr
ael,
Sing
apor
e, S
outh
Afr
ica,
US
Paye
r (co
sts),
Patie
nts/
Soci
etal
(out
com
es)
5 (1
6)B
elgi
umC
roat
ia, E
ngla
nd a
nd W
ales
, Ire
land
, Sc
otla
ndSo
ciet
al8
(26)
Nor
way
, Por
tuga
l, Th
aila
nd, T
he N
ethe
r-la
nds
Taiw
anD
enm
ark,
Indo
nesi
a, S
pain
Any
(jus
tified
)3
(10)
–A
ustri
a, E
gypt
, Ita
lyC
ompa
rato
rM
ost C
omm
only
use
d/St
anda
rd th
erap
y17
(55)
Portu
gal,
Thai
land
, The
Net
herla
nds
Can
ada,
Cro
atia
, Egy
pt, I
rela
nd, I
taly
, Aus
-tri
a, H
unga
ry, E
ngla
nd a
nd W
ales
Bal
tic, I
ndon
esia
Isra
el, S
outh
Afr
ica,
Spa
in,
US
Mos
t lik
ely
to b
e re
plac
ed9
(29)
Aus
tralia
, Jap
an, N
orw
ayM
alay
sia,
New
Zea
land
, Pol
and,
Sco
tland
, Ta
iwan
Sing
apor
e
All
rele
vant
alte
rnat
ives
3 (1
0)B
elgi
um, G
erm
any,
Fra
nce,
Nor
way
, Th
aila
ndC
anad
a, E
ngla
nd a
nd W
ales
–
Not
spec
ified
2 (6
)Fi
nlan
d (m
ost a
ppro
pria
te)
–D
enm
ark
Cos
tsD
irect
med
ical
cos
ts14
(45)
Aus
tralia
, Bel
gium
Can
ada,
Cro
atia
, Egy
pt, E
ngla
nd a
nd
Wal
es, I
rela
nd, M
alay
sia,
New
Zea
land
, Sc
otla
nd
Bal
tic, I
srae
l, So
uth
Afr
ica,
Sin
gapo
re
Dire
ct c
osts
(med
ical
and
non
med
ical
)6
(20)
Fran
ce, F
inla
nd, G
erm
any,
Japa
n, N
orw
ayH
unga
ry-
Dire
ct a
nd In
dire
ct c
osts
9 (2
9)Po
rtuga
l (al
so in
tang
ible
cos
ts),
Thai
land
, Th
e N
ethe
rland
sPo
land
, Ita
ly, T
aiw
anIn
done
sia,
Spa
in, D
enm
ark
(als
o in
tang
ible
co
sts)
All
rele
vant
cos
ts2
(6)
–A
ustri
aU
SO
utco
mes
Prim
arily
QA
LY12
(39)
Aus
tralia
, Fin
land
, jap
an, N
orw
ay, T
hai-
land
, The
Net
herla
nds
Can
ada,
Eng
land
and
Wal
es, I
rela
nd, N
ew
Zeal
and,
Sco
tland
Isra
el
QA
LY a
nd n
atur
al u
nits
13 (4
2)G
erm
any
Cro
atia
, Egy
pt, A
ustri
a, H
unga
ry, I
taly
, M
alay
sia
Bal
tic, D
enm
ark,
Sin
gapo
re, S
pain
, US
QA
LY, L
ife y
ears
6 (1
9)B
elgi
um, F
ranc
e, P
ortu
gal
Taiw
an, P
olan
dIn
done
sia
(als
o D
ALY
), So
uth
Afr
ica
Unc
erta
inty
ana
lysi
sB
oth
PSA
and
DSA
shou
ld b
e do
ne10
(33)
Bel
gium
, Ger
man
y, F
inla
nd, J
apan
, The
N
ethe
rland
sH
unga
ry, P
olan
d, N
ew Z
eala
ndIn
done
sia,
Sou
th A
fric
a, U
S
PSA
pre
ferr
ed8
(26)
Fran
ce, N
orw
ay T
haila
ndEn
glan
d an
d W
ales
, Can
ada,
Cro
atia
, Ir
elan
d, M
alay
sia
DSA
man
dato
ry, P
SA o
ptio
nal
7 (2
3)A
ustra
liaEg
ypt,
Italy
, Sco
tland
Sing
apor
e, S
pain
DSA
onl
y2
(6)
–A
ustri
a, T
aiw
anN
ot sp
ecifi
ed4
(12)
Portu
gal
–B
altic
, Den
mar
k, Is
rael

355Comparison of national economic evaluation guidelines
advocated for the use of lifetime horizon, especially when there is a long-term impact on a patient’s health, such as in the case of chronic diseases [33, 35, 37, 41, 43, 47, 52, 53, 57, 61, 62]. The guidelines for Germany stated that the time horizon should represent at least the duration of the rand-omized controlled trial evidence that informs the analysis, and should preferably be extended to a lifetime for chronic diseases [44].
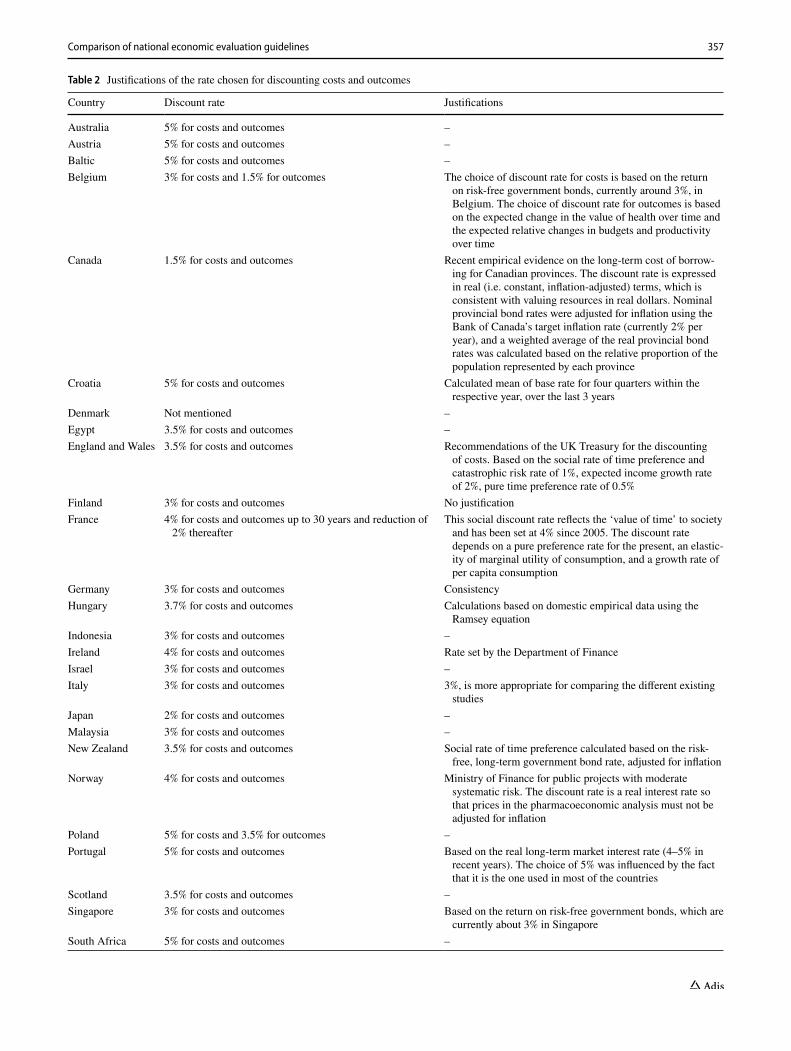
(6) Discount RateNational HEE guidelines of all countries except Belgium,
Poland and The Netherlands recommended that a common rate should be used for discounting both costs and outcomes [33–35, 37–53, 55–61, 63]. Figure 3 shows that the discount rate recommended varied across countries, with a discount rate of 3% (10 guidelines) being the most commonly sug-gested rate, followed by 5% (7 guidelines). In addition, most countries (28, 90%) also recommended sensitivity analyses around the discount rate, including no discounting [31, 32, 34–36, 38–45, 47–50, 52–61, 63]. Guidelines for Belgium, Poland and The Netherlands recommended using a lower discount rate for outcomes (1.5%, 1.5% and 3.5%, respec-tively) compared with costs (3%, 4% and 5%, respectively) [36, 54, 62]. Thailand initially recommended using a com-mon discount rate (3%), however if the time horizon was more than 30 years, discounting at a rate of 4% for costs and 2% for consequences was recommended [61]. Spain and Taiwan also recommended differential discounting for costs and outcomes, however this was recommended as part of sensitivity analyses and not for base-case analyses [59, 60]. Guidelines for France recommended using a lower discount rate for both costs and outcomes if the time horizon was longer than 30 years (2%) [43].
The basis for the selected discount rate was usually not justified; where reported, it was either cited as being based on long-term bond rates or merely for the purpose of consist-ency with the existing recommendation (Table 2).
(7) CostsThe majority (6, 60%) of the mandatory national HEE
guidelines recommended the inclusion of both direct medi-cal and non-medical costs, while the majority of the rec-ommendatory (9, 69%) and voluntary (4, 50%) national HEE guidelines suggested the inclusion of direct medical costs only (Table 1). The recommendations on the type of costs to be included were in line with the recommenda-tions on the study perspective. Guidelines recommending a healthcare system/healthcare payer/funder perspective recommended including only direct medical costs [33, 35–38, 40, 41, 45, 47, 48, 51, 52, 57, 58], while guide-lines recommending a ‘payer’ perspective recommended the inclusion of both direct medical and non-medical costs [42–45, 50]. The inclusion of indirect costs was suggested by those HEE guidelines that recommended using a soci-etal perspective for the primary analysis [34, 39, 46, 49,
55, 59–62], or as a secondary analysis with the results presented separately [33, 36–38, 40, 42–44, 47, 50, 51, 54, 57]. Other guidelines that strictly forbade the inclusion of indirect costs were in accordance with the recommen-dations on study perspective [41, 45, 52, 58]. Moreover, recommendations on the preferred methodology to esti-mate indirect costs also varied. While some national HEE guidelines recommended using a human capital approach (HCA) [34, 49, 50, 60, 61], others recommended the use of a friction cost approach (FCA) [37, 39, 44, 54, 62]. Additionally, Portugal and Denmark recommended the inclusion of intangible costs under the societal perspec-tive [39, 55].
Furthermore, in addition to the type of costs, recom-mendations also varied depending on who bore the cost. While Australia and Singapore recommended the inclusion of all direct medical costs borne by the patient as well as the payer (public or private), Germany on the other hand recom-mended that only those direct costs that will be reimbursed by SHI should be included [33, 44, 57].
Regarding the cost and price source, the national HEE guidelines usually provided a general recommendation stat-ing that national cost data and price lists should be used. The guidelines acknowledged that it is difficult to transfer cost data from other settings, hence emphasis should be given to the use of local cost data.
(8) Measuring Health OutcomesAll mandatory national HEE guidelines recommended
that quality-adjusted life-years (QALYs) should be used as health outcome measures. Recommendatory national HEE guidelines did not explicitly advocate for the use of any particular outcome measure and argued that the evalu-ator may choose either natural units (clinical endpoints) or QALYs, depending on the decision problem and the analytic technique being followed. This was also the case for the majority (5, 63%) of the voluntary national HEE guidelines (Table 1). Guidance was also provided on the methods to be used for the valuation of utilities. Quality-of-life valuation using generic health instruments was most widely recom-mended (24, 77%) [35–43, 45–47, 50–57, 59–62]. Of these, nearly three-quarters recommended using the EQ-5D tool [33, 35–38, 40, 41, 43, 45–47, 49–54, 56, 57, 60–63], while other suggested tools included the Short Form–6 dimensions (SF-6D), Health Utilities Index (HUI) and Quality of Well Being (QWB) questionnaires (Table 3). Furthermore, there was consensus among the national HEE guidelines that a nationally representative tariff value-set should be used as much as possible. Disability-adjusted life-years (DALYs) were recommended by the Indonesian guideline only as a health outcome measure [46].
(9) ModellingAll national HEE guidelines acknowledged that mod-
elling techniques may be applied, especially in scenarios

356 D. Sharma et al.
where data from clinical trials were required to be extrapo-lated to longer time frames [33–63]. The extent to which guidance was provided for undertaking model-based eco-nomic evaluations varied, however there was consistency between the broad recommendations. Many national HEE guidelines suggested following guidelines for good model-ling practices, such as those developed by the ISPOR task-force [33, 36–38, 40, 41, 44, 47, 51, 53, 57, 61–63]. The majority of the guidelines recommend that the model struc-ture should be consistent with the nature of the disease and the clinical pathway of the health condition. The guidelines suggest that any model type may be chosen, however the structure should be as simple as possible; a few guidelines preferred decision tree and Markov models [43, 46, 51–53, 55, 60]. Furthermore, the guidelines suggest that model assumptions should be duly justified and the data inputs should be clearly reported with sources. Additionally, many guidelines recommend that model validity (external, internal and cross-validity) should also be documented [33, 36, 37, 40, 41, 43, 44, 47, 51, 53, 54, 56–58, 60–63].
(10) Uncertainty AnalysisAll national HEE guidelines included in this review rec-
ommended undertaking some form of sensitivity analysis to explore the impact of uncertainty (Table 1). While a few guidelines (Baltic states, Denmark, Israel and Portu-gal) merely stated that uncertainties should be addressed appropriately, the majority of the remaining guidelines
recommended identifying the type of uncertainty (parame-ter, structural or methodological) and to specify the methods to address these. Deterministic sensitivity analyses (DSA), both univariate and multivariate, are recommended for addressing uncertainties (Table 1). In addition to DSA, the majority (n = 25, 81%) of the national HEE guidelines also recommended using probabilistic sensitivity analysis (PSA) [33, 36–38, 40–47, 49–54, 56–59, 61–63]. While some of these guidelines specifically preferred PSA [37, 38, 41, 43, 47, 51, 53, 61], others suggested that PSA should be under-taken, although they did not make it mandatory [33, 40, 49, 56, 57, 59].
In addition to PSA and DSA, scenario-based analyses, including best-case and worst-case scenarios, were also rec-ommended by many guidelines [37, 40, 41, 43, 44, 47, 50, 51, 53, 56, 58, 62, 63].
(11) Equity IssuesWhile some (10, 32%) of the national HEE guidelines
mentioned that equity implications of the technology are important and should be considered [33, 37, 38, 40, 41, 47, 56, 60, 61], the majority (21, 68%) of the national HEE guidelines did not explicitly discuss how equity should be addressed [34–36, 39, 42–46, 48–55, 57–59, 62, 63]. The national HEE guidelines that discussed equity recommended that equal weighting of QALYs, irrespective of age, sex and socioeconomic status, will be preferred in the base-case analysis [33, 37, 38, 40, 41, 47, 56, 60, 61].
Fig. 3 Discount rates recommended by national healthcare economic evaluation guidelines. SA South Africa
357Comparison of national economic evaluation guidelines
Table 2 Justifications of the rate chosen for discounting costs and outcomes
Country Discount rate Justifications
Australia 5% for costs and outcomes –Austria 5% for costs and outcomes –Baltic 5% for costs and outcomes –Belgium 3% for costs and 1.5% for outcomes The choice of discount rate for costs is based on the return
on risk-free government bonds, currently around 3%, in Belgium. The choice of discount rate for outcomes is based on the expected change in the value of health over time and the expected relative changes in budgets and productivity over time
Canada 1.5% for costs and outcomes Recent empirical evidence on the long-term cost of borrow-ing for Canadian provinces. The discount rate is expressed in real (i.e. constant, inflation-adjusted) terms, which is consistent with valuing resources in real dollars. Nominal provincial bond rates were adjusted for inflation using the Bank of Canada’s target inflation rate (currently 2% per year), and a weighted average of the real provincial bond rates was calculated based on the relative proportion of the population represented by each province
Croatia 5% for costs and outcomes Calculated mean of base rate for four quarters within the respective year, over the last 3 years
Denmark Not mentioned –Egypt 3.5% for costs and outcomes –England and Wales 3.5% for costs and outcomes Recommendations of the UK Treasury for the discounting
of costs. Based on the social rate of time preference and catastrophic risk rate of 1%, expected income growth rate of 2%, pure time preference rate of 0.5%
Finland 3% for costs and outcomes No justificationFrance 4% for costs and outcomes up to 30 years and reduction of
2% thereafterThis social discount rate reflects the ‘value of time’ to society
and has been set at 4% since 2005. The discount rate depends on a pure preference rate for the present, an elastic-ity of marginal utility of consumption, and a growth rate of per capita consumption
Germany 3% for costs and outcomes ConsistencyHungary 3.7% for costs and outcomes Calculations based on domestic empirical data using the
Ramsey equationIndonesia 3% for costs and outcomes –Ireland 4% for costs and outcomes Rate set by the Department of FinanceIsrael 3% for costs and outcomes –Italy 3% for costs and outcomes 3%, is more appropriate for comparing the different existing
studiesJapan 2% for costs and outcomes –Malaysia 3% for costs and outcomes –New Zealand 3.5% for costs and outcomes Social rate of time preference calculated based on the risk-
free, long-term government bond rate, adjusted for inflationNorway 4% for costs and outcomes Ministry of Finance for public projects with moderate
systematic risk. The discount rate is a real interest rate so that prices in the pharmacoeconomic analysis must not be adjusted for inflation
Poland 5% for costs and 3.5% for outcomes –Portugal 5% for costs and outcomes Based on the real long-term market interest rate (4–5% in
recent years). The choice of 5% was influenced by the fact that it is the one used in most of the countries
Scotland 3.5% for costs and outcomes –Singapore 3% for costs and outcomes Based on the return on risk-free government bonds, which are
currently about 3% in SingaporeSouth Africa 5% for costs and outcomes –

358 D. Sharma et al.
Table 2 (continued)
Country Discount rate Justifications
Spain 3% for costs and outcomes –Taiwan 5% for costs and outcomes Long-term market interest rate, which is approximately 4–5%
in TaiwanThailand 3% for costs and outcomes; time horizon >30 years 4% for
costs and 2% for outcomes–
The Netherlands 4% for costs and 1.5% for outcomes –United States 3% for costs and outcomes US Panel recommendations
Table 3 Recommended health-related quality-of-life instruments by national guidelines
AQoL Assessment of Quality of Life, CHU-9D Child Health Utility-9 dimensions, EQ-5D EuroQol 5-Dimensions, EQ-5D-3L EQ-5D 3-level, EQ-5D-5L EQ-5D 5-level, HUI Health Utilities Index, SF-6D Short Form-6 dimensions, SF-36 36-item Short Form, QWB Quality of Well Being, WHO-QoL World Health Organization Quality of Life, 15D 15-dimensional
Country Recommended health-related quality-of-life instruments Whether EQ-5D is preferred
Australia HUI2, HUI3, EQ-5D-3L, EQ-5D-5L, SF-6D, AQoL, and CHU-9D –Austria – –Baltic EQ-5D and HUIBelgium EQ-5D (for adults), EQ-5D-Y (for youngsters), or SF-6D YesCanada EQ-5D, HUI, SF-6D –Croatia EQ-5D YesDenmark – –Egypt EQ-5D, SF-6D or similar generic measures –England EQ-5D YesFinland – –France EQ-5D, HUI3 –Germany – –Hungary General (EQ-5D, SF-36) or disease-specific instruments –Indonesia EQ-5D, HUI, QWB, or WHO-QoL YesIreland EQ-5D or SF-6D –Israel – –Italy If possible, the use of both a specific and generic instrument (SF-36, HUI, EQ-5D) is suggested –Japan EQ-5D, SF-6D, HUI –Malaysia EQ-5D YesNew Zealand EQ-5D, other instruments may be used subject to justifications YesNorway EQ-5D, SF-6D, 15D –Poland Preference based instruments with validated questionnaires in Polish (EQ-5D) YesPortugal Generic (SF-36, Sickness Impact Profile or Nottingham Health Profile) and specific instruments at the
same time–
Scotland EQ-5D YesSingapore EQ-5D, SF-36, HUI3, AQoL YesSouth Africa – –Spain – –Taiwan SF-36, WHO-QoL, QWB, EQ-5D, HUI –Thailand EQ-5D, HUI, SF-6D, QWB YesNetherlands Generic instruments, preferably EQ-5D YesUnited States EQ-5D, HUI, SF-6D, or QWB –

359Comparison of national economic evaluation guidelines
(12) Budget Impact AnalysisSeveral national HEE guidelines propose BIA be under-
taken alongside CEA [33, 36, 44–46, 48, 49, 51–54, 56, 57, 60–63]. A subsection specifying technical requirements on how to undertake BIA is included as part of the main guideline of these countries. In general, the national HEE guidelines recommended using the perspective of the budget holder and the current mixed treatment scenario as the com-parator. The time horizon recommended was generally short term, ranging between 1 and 6 years, with 3 years being the most common time horizon. Most of the national HEE guidelines opined that discounting should not be done while undertaking BIA, however New Zealand recommended using a higher rate of 8% against the 3.5% recommended for CEA [52].
(13) Cost-Effectiveness ThresholdsThe majority (77%) of the national guidelines do not rec-
ommend any specific threshold value for deciding whether or not an intervention is cost effective [33–40, 42–44, 48–50, 52–60, 62], and state that multiple factors beyond cost effec-tiveness are important to guide reimbursement and invest-ment decisions [36–38, 43, 44, 52]. A few guidelines recom-mend that the incremental cost-effectiveness ratios may be compared with gross domestic product (GDP)-based thresh-olds, i.e. Hungary (three times the GDP per capita) [45], Indonesia (GDP per capita adjusted for purchasing power parity, Rp43,000,000) [46], Malaysia (GDP per capita, RM42,000) [51] and Ireland (£20,000–£45,000) [47]; how-ever, these may only be used to present the results of eco-nomic evaluations, not for decision making. Furthermore, countries such as England and Thailand suggest empirically calculated thresholds of £20,000–£30,000/QALY gained and ฿160,000/QALY gained, respectively [41, 61].
4 Discussion
This review was undertaken with the objective of review-ing national HEE guidelines developed by different coun-tries in order to compare and contrast the recommendations regarding methodological principles of practice. This review provides the first comprehensive account of national HEE guidelines globally, as well as the similarities and differ-ences in practice among these worldwide.
In the past two decades, we have witnessed a steady increase in the conduct of economic evaluations to inform health policy decisions [15]; however, fair policy decisions based on economic evidence require analysts to adhere to a uniform and transparent standard of practice [20]. National HEE guidelines provide clear set rules that govern practice in this respect and are useful, both for the analysts to gener-ate economic evidence and for decision makers to aid in rational decision making.
The development of national HEE guidelines originated in the early 1990s, when Australia developed guidelines for pharmacoeconomic submissions, with Canada and other European countries following shortly after [80, 81]. The development of guidelines is dependent on multiple con-textual factors, supplemented by the economic and political environment of a country. Furthermore, each country var-ies in its health system design and performance. With the mechanism of financing being largely insurance-based in the European region, the government provides for most drugs and technologies [82]. As a result, the guidelines in these countries were developed with the objective of assisting in the reimbursement decision-making process [21].
The use of economic evidence for decision making is slowly gaining impetus in the Asian and African regions [83]; however, these countries are at an uneven pace of developing guidelines. For instance, Thailand, which has been a forerunner in the use of economic evidence, has inte-grated HTA into policy making, including its use for the development of health benefit packages and determining pharmaceutical reimbursement lists [84]. It formulated its first version of the national guideline in 2008, which was updated in 2014 [85]. More recently, four Asian and two African nations have formulated national HEE guidelines, with the most recent developed by Singapore in 2018 [57]. A common phenomenon documented in the development of these guidelines in Asian and African countries was that they were formulated after a detailed review of existing guidelines worldwide [51, 85, 86]. In this context, our paper presents a useful resource for countries that are aiming to develop national guidelines in the future, and the methodo-logical principles for health economic evaluations.
We observed that the national HEE guidelines from Europe and other high-income countries were by far more comparable with each other because of the considerably similar healthcare systems. The reliance on out-of-pocket expenditure is low and the insurance cover is almost univer-sal [87]. Moreover, these countries have developed stand-ard treatment guidelines and drug reimbursement systems. The national HEE guidelines of these countries provided in-depth guidance on most of the principles. With methods for economic evaluation being widely developed, and with the availability of reliable data sources, these guidelines give clear recommendations. On the other hand, national HEE guidelines from middle-income countries were more flexible and allowed use of alternate approaches depending on the data availability and researcher capacity.
Nevertheless, it was observed that there is substantial consensus among the national HEE guidelines on several key areas, including type of analytic technique, study time horizon and sensitivity analysis. Although the national HEE guidelines provided straightforward recommendations on the aforementioned principles, there were certain issues

360 D. Sharma et al.
where there was a deficit of clear-cut guidance. The recom-mendations on study perspective and the type of costs to be included (particularly the inclusion of indirect costs) varied widely. Several countries did not specify which perspective should be followed and left it to the wisdom of the analyst to choose the perspective (subject to justifications) [34, 40, 41, 49]. Furthermore, even when recommending the same perspective, for instance the payers’ perspective, a variation was observed because different guidelines defined ‘payer’ differently. While some countries considered the healthcare system or the government as the payer [37, 38, 41, 44, 47, 48, 51, 52, 54, 56], others included both the government as well as the individual whose health is affected as the payer [33, 36, 42, 43, 50, 57]. This variance further reflected upon the cost categories to be included in a given perspective. The latter group of countries recommended the inclusion of out-of-pocket expenses, in addition to healthcare costs, from the payers’ perspective, while the former limit costs to direct medical costs borne by the healthcare system/insurer, to be included in the payers’ perspective.
Similarly, in relation to the recommendation to take the societal perspective, some countries recommended including only direct medical and non-medical costs, while others sug-gested indirect costs should also be included. Barring Den-mark and Portugal, there was agreement on the exclusion of intangible costs from a societal perspective, as it is consid-ered these costs have already been valued in outcomes such as quality of life [39, 55]; however, the inclusion of indirect costs from a societal perspective remain controversial.
Furthermore, the methodology to determine indirect costs was ambiguous and lacked consensus. While countries such as Austria, Japan, Taiwan and Thailand recommended the use of HCA [34, 50, 60, 61], other countries favoured the use of FCA [37, 39, 44, 54, 62]. The former argued that HCA was usually better in scenarios where there was short-term absenteeism, while the latter stated that HCA overestimates the cost of lost production, and thus FCA, which factors in the concept of unemployment and labour reserve, results in more realistic representation; However, the absence of reliable estimates for country-specific friction periods lim-ited the use of FCA. Nevertheless, some countries left it to the analyst to choose which method they wanted to use [43, 51, 59]. Overall, the inclusion of productivity loss and its methodology was contentious, with the majority of countries advocating to include it in additional analyses, and to present results with and without the inclusion of productivity losses.
Another area with significant variation in the national HEE guidelines was the concept of discounting. The major-ity of the national HEE guidelines did not justify the basis for opting a specific discount rate [33–35, 39, 40, 42, 44, 46, 48, 50, 51, 54, 56, 58, 62]. Often the discount rate chosen was more of an imitation effect chosen to maintain consist-ency across studies [36, 56, 59]. Furthermore, the plausible
assumptions on which the discount rate was calculated was usually not stated clearly. This is particularly important to guide countries in deriving specific discount rates.
This review provides useful insights for countries that have recently institutionalized HTA and are anticipating the development of national HEE guidelines in the near future. The lack of common methodological standards often results in poor quality of economic evaluations, thus limiting their use in decision making [17, 18, 20]. Devel-oping a common set of standards is urgently needed in these countries to increase the quality and comparability of evidence, and thereby increasing usability for policy formation. These countries have several options. First, they can replicate the methods and recommendations of the existing guidelines, which may promote standardiza-tion and transferability. However, the complex nature of the health systems and financing mechanisms limits this option of complete replication. The second option avail-able to these countries is to start de novo, which may not be an efficient methodology. We recommend that these countries could instead choose a middle path, which involves adapting the existing national HEE guidelines to cater to their local health system needs, current data avail-ability, local researcher capacity, health financing system, and the nature of predominant use for HTA and how it is communicated.
The results of this review should be interpreted in light of following limitations. First, we had to exclude 12 national HEE guidelines that were not available in the English lan-guage. Furthermore, we acknowledge that several coun-tries may have HTA systems in place, with the existence of internal guidelines and processes; however, guidelines were not available in the public domain and hence could not be included. Moreover, while systematic reviews are considered as the gold standard, we did not undertake a systematic search in scientific databases. However, we feel this would not bias our results since the national HEE guidelines are usually published as official documents by the national organizations rather than as research papers. Second, the ISPOR web repository is considered to be the best source of national guidelines, which we further sup-plemented by undertaking a search in the GEAR database and country-specific HTA agency websites. Additionally, searching HEE-specific databases such as the Tufts Cost-Effectiveness Analysis Registry would not affect the yield of the present review since this registry archives only original cost per QALY studies (CUA) and excludes all methodologi-cal articles, including guidelines [88, 89]. Thus, we believe the chances of missing any major national HEE guidelines are low. Lastly, a quality appraisal could not be undertaken because the national HEE guidelines have varied recom-mendations and no generalized tool is available to assess the quality of such guidelines.

361Comparison of national economic evaluation guidelines
5 Conclusion
There is substantial variation in several key recommenda-tions given by the national HEE guidelines that have been developed globally. This is perhaps unsurprising given the differences in the health systems and financing frameworks, capacity of local researchers, data availability, and the pur-pose of HTA among different countries. This review offers some lessons for countries that are planning to develop their own guidelines; however, in addition to the technical guide-lines, the countries need a system in place to review the evidence generated through HEE and to use this for decision making.
Declarations
Funding No separate funding was received to conduct this review. The review was undertaken by Deepshikha Sharma as part of her doc-toral research, which was supported by the Indian Council of Medical Research, New Delhi, India.
Conflict of interest Deepshikha Sharma, Arun Kumar Aggarwal, Laura E. Downey and Shankar Prinja declare they have no conflicts of interest.
Data availability All data generated and analysed in this review are available within the manuscript and its supplementary information file.
Ethical approval Not applicable.
Consent to participate Not applicable.
Consent for publication Not applicable.
Code availability Not applicable.
Author contributions DS: Literature search and data analysis, writing of the original draft and revising the final version of the manuscript. AKA: Study conception and design, interpretation of results, and origi-nal draft review and editing. LED: Interpretation of results, and original draft review and editing. SP: Study conception and design, interpreta-tion of results, and original draft review and editing. All authors read and approved the final version of the manuscript.
Open Access This article is licensed under a Creative Commons Attri-bution-NonCommercial 4.0 International License, which permits any non-commercial use, sharing, adaptation, distribution and reproduction in any medium or format, as long as you give appropriate credit to the original author(s) and the source, provide a link to the Creative Com-mons licence, and indicate if changes were made. The images or other third party material in this article are included in the article’s Creative Commons licence, unless indicated otherwise in a credit line to the material. If material is not included in the article’s Creative Commons licence and your intended use is not permitted by statutory regula-tion or exceeds the permitted use, you will need to obtain permission directly from the copyright holder. To view a copy of this licence, visit http://creat iveco mmons .org/licen ses/by-nc/4.0/.
References
1. Chernew ME, May D. Health care cost growth. In: Glied S, Smith PC, editors. The Oxford handbook of health economics. Oxford: Oxford University Press; 2011.
2. Mitton C, Seixas BV, Peacock S, Burgess M, Bryan S. Health technology assessment as part of a broader process for priority setting and resource allocation. Appl Health Econ Health Policy. 2019;17(5):573–6.
3. World Health Assembly. Health intervention and technology assessment in support of universal health coverage. WHA Reso-lution; Sixty seventh World Health Assembly, 2014. WHA67.23. 2014. http://apps.who.int/medic inedo cs/en/m/abstr act/Js214 63en/. Accessed 11 July 2020.
4. Oliver A, Mossialos E, Robinson R. Health technology assess-ment and its influence on health-care priority setting. Int J Technol Assess Health Care. 2004;20(1):1.
5. Chalkidou K, Glassman A, Marten R, Vega J, Teerawattananon Y, Tritasavit N, et al. Priority-setting for achieving universal health coverage. Bull World Health Organ. 2016;94(6):462.
6. Allen N, Liberti L, Walker SR, Salek S. A comparison of reimbursement recommendations by European HTA agencies: is there opportunity for further alignment? Front Pharmacol. 2017;8:384.
7. Oortwijn W, Mathijssen J, Banta D. The role of health technology assessment on pharmaceutical reimbursement in selected middle-income countries. Health Policy. 2010;95(2–3):174–84.
8. Oortwijn W, Broos P, Vondeling H, Banta D, Todorova L. Map-ping of health technology assessment in selected countries. Int J Technol Assess Health Care. 2013;29(4):424.
9. Drummond MF, Schwartz JS, Jönsson B, Luce BR, Neumann PJ, Siebert U, et al. Key principles for the improved conduct of health technology assessments for resource allocation decisions. Int J Technol Assess Health Care. 2008;24(3):244.
10. International Society for Pharmacoeconomics and Outcomes Research [ISPOR]. Pharmacoeconomic guidelines around the world. ISPOR. 2020. http://www.ispor .org/PEgui delin es/index .asp. Accessed 22 May 2020.
11. Drummond MF. Guidelines for pharmacoeconomic studies—the ways forward. Pharmacoeconomics. 1994;6:493–7.
12. Kobelt G. Health economics: an introduction to economic evalu-ation. 3rd ed. London: Office of Health Economics; 2013.
13. Action EJ, Heintz E, Gerber-Grote A, Ghabri S, Hamers FF, Rupel VP, et al. Is there a European view on health economic evaluations? Results from a synopsis of methodological guidelines used in the EUnetHTA partner countries. Pharmacoeconomics. 2016;34(1):59–76.
14. Drummond M, Brown R, Fendrick AM, Fullerton P, Neumann P, Taylor R, et al. Use of Pharmacoeconomics Information—Report of the ISPOR Task Force on Use of Pharmacoeconomic/Health Economic Information in Health-Care Decision Making. Value Health. 2003;6(4):407–16.
15. Pitt C, Goodman C, Hanson K. Economic evaluation in global perspective: a bibliometric analysis of the recent literature. Health Econ. 2016;25:9–28.
16. Griffiths UK, Legood R, Pitt C. Comparison of economic evalu-ation methods across low-income, middle-income and high-income countries: what are the differences and why? Health Econ. 2016;25:29–41.
17. Santatiwongchai B, Chantarastapornchit V, Wilkinson T, Thi-boonboon K, Rattanavipapong W, Walker DG, Chalkidou K, et al. Methodological variation in economic evaluations conducted in

362 D. Sharma et al.
low-and middle-income countries: information for reference case development. PLoS ONE. 2015;10(5):e0123853.
18. Prinja S, Chauhan AS, Angell B, Gupta I, Jan S. A systematic review of the state of economic evaluation for health care in India. Appl Health Econ Health Policy. 2015;13(6):595–613.
19. Finc J. Making choices in health: who guide to cost effectiveness analysis. Geneva: World Health Organization; 2003.
20. Wilkinson T, Sculpher MJ, Claxton K, Revill P, Briggs A, Cairns JA, et al. The international decision support initiative reference case for economic evaluation: an aid to thought. Value Health. 2016;19(8):921–8.
21. Bracco A, Krol M. Economic evaluations in European reimburse-ment submission guidelines: current status and comparisons. Expert Rev Pharmacoecon Outcomes Res. 2013;13(5):579–95.
22. Graf von der Schulenburg JM, Hoffmann C. Review of European guidelines for economic evaluation of medical technologies and pharmaceuticals. Eur J Health Econ. 2000;1:2–8.
23. Mathes T, Jacobs E, Morfeld JC, Pieper D. Methods of inter-national health technology assessment agencies for economic evaluations: a comparative analysis. BMC Health Serv Res. 2013;13(1):371.
24. Hjelmgren J, Berggren F, Andersson F. Health economic guide-lines—similarities, differences and some implications. Value Health. 2001;4(3):225–50.
25. GEAR. Guidelines comparison: what can I learn from the exist-ing health economic evaluation guidelines? 2019. http://www.gear4 healt h.com/gear/healt h-econo mic-evalu ation -guide lines . Accessed 11 July 2020.
26. Adeagbo CU, Rattanavipapong W, Guinness L, Teerawattana-non Y. The development of the guide to economic analysis and research (GEAR) online resource for low-and middle-income countries’ health economics practitioners: a commentary. Value Health. 2018;21(5):569–72.
27. International Network of Agencies for Health Technology Assessment. INAHTA members list. 2019. https ://www.inaht a.org/membe rs/membe rs_list/. Accessed 11 July 2020.
28. European Network for Health Technology Assessment. EUnetHTA Partner Organizations and Institutions. https ://eunet hta.eu/about -eunet hta/eunet htane twork /. Accessed 11 July 2020.
29. HTAsia Link. https ://htasi alink 2020.com/. Accessed 11 July 2020.
30. Husereau D, Drummond M, Petrou S, Carswell C, Moher D, Greenberg D, et al. Consolidated health economic evaluation reporting standards (CHEERS) statement. Int J Technol Assess Health Care. 2013;29(2):117–22.
31. Chiou CF, Hay JW, Wallace JF, Bloom BS, Neumann PJ, Sullivan SD, et al. Development and validation of a grading system for the quality of cost-effectiveness studies. Med Care. 2003;41(1):32–44.
32. Drummond MF, Sculpher MJ, Claxton K, Stoddart GL, Torrance GW. Methods for the economic evaluation of health care pro-grammes. Oxford: Oxford University Press; 2015.
33. Pharmaceutical Benefits Advisory Committee (PBAC). Guidelines for preparing submissions to the Pharmaceutical Benefits Advi-sory Committee: Version 5.0. Australian Government—Depart-ment of Health. 2016. Version 5.0. 2016. https ://pbac.pbs.gov.au/conte nt/infor matio n/files /pbac-guide lines -versi on-5.pdf. Accessed 9 July 2020.
34. Austria Walter E, Zehetmayr S. Guidelines on health economic evaluation, consensus paper. Vienna: Institute for Pharmacoeco-nomic Research; 2006.
35. Behmane D, Lambot K, Irs A, Steikunas N. Baltic guideline for economic evaluation of pharmaceuticals (pharmacoeconomic analysis). Baltics Baltic Health Auth.; 2002.
36. Cleemput I, Neyt M, Van de Sande S, Thiry N. Belgian guidelines for economic evaluations and budget impact analyses: second
edition. Brussels: Belgian Health Care Knowledge Centre (KCE); 2012. KCE Reports 183C.
37. Canadian Agency for Drugs and Technologies in Health. Guide-lines for the economic evaluation of health technologies: Canada. 4th ed. Ottawa: Canadian Agency for Drugs and Technologies in Health. 2017. https ://www.cadth .ca/dv/guide lines -econo mic-evalu ation -healt h-techn ologi es-canad a-4th-editi on. Accessed 30 Dec 2020.
38. Agency for Quality and Accreditation in Health Care, Department for Development, Research and Health Technology Assessment. The Croatian Guideline for Health Technology Assessment Pro-cess and Reporting, 1st ed. Zagreb: 2011.
39. Alban A, Gyldmark M, Pedersen AV, Søgaard J. The Danish approach to standards for economic evaluation methodologies. PharmacoEconomics. 1997;12(6):627–36.
40. Pharmacoeconomic Unit, Central Administration for Pharmaceu-tical Affairs. Guidelines for reporting pharmacoeconomic evalu-ations in Egypt. Version 01. Ministry of Health and Population. 2013. http://www.eda.mohp.gov.eg/Files /402_Egypt ian_Pharm acoec onomi c_guide lines .pdf. Accessed 30 Dec 2020.
41. National Institute for Health and Care Excellence [NICE]. Guide to the methods of technology appraisal 2013. London: NICE; 2013. https ://www.nice.org.uk/proce ss/pmg9/resou rces/guide -to-the-metho ds-of-techn ology -appra isal-2013-pdf-20079 75843 781. Accessed 9 July 2020.
42. Lääkkeiden Hintalautakunta (Finland): Preparing a health eco-nomic evaluation to be attached to the application for reimburse-ment status and wholesale price for a medicinal product. 2019. https ://www.hila.fi/c/docum ent_libra ry/get_file?folde rId=39078 19&name=DLFE-11113 .pdf. Accessed 11 Jul 2020.
43. Haute Autorité de Santé [HAS]. Choices in methods for economic evaluation. Saint-Denis La Plaine: Department of Economics and Public Health Assessment, HAS; 2012. https ://www.has-sante .fr/uploa d/docs/appli catio n/pdf/2012-10/choic es_in_metho ds_for_econo mic_evalu ation .pdf. Accessed 30 Dec 2020.
44. Institute for Quality and Efficiency in Health Care. General meth-ods for the assessment of the relation of benefits to costs. Ver-sion 5.0. 2017. https ://www.iqwig .de/downl oad/Gener al-Metho ds_Versi on-5-0.pdf. Accessed Apr 2020.
45. HU WO. Professional healthcare guideline on the methodology of health technology assessment. Hungary. 2017. https ://tools .ispor .org/PEgui delin es/sourc e/HTA_Guide line_HUN_eng.pdf. Accessed 11 July 2020.
46. Indonesian Health Technology Assessment Committee (InaHTAC), Ministry of Health Republic of Indonesia. Health Technology Assessment guideline. Jakarta. 2017. http://www.gear4 healt h.com/uploa ds/files /file-15-5a441 f38c8 992.pdf. Accessed 11 July 2020.
47. Ireland. Health Information and Quality Authority. Guidelines for the Economic Evaluation of Health Technologies in Ireland 2019. Health Information and Quality Authority. 2019. https ://www.hiqa.ie/sites /defau lt/files /2019-07/HTA-Econo mic-Guide lines -2019.pdf. Accessed 11 July 2020.
48. Ministry of Health (Israel)—Pharmaceutical Administration. Guidelines for the submission of a request to include a pharma-ceutical product in the national list of health services—Appendix D: instructions for performing an economic assessment. Ministry of Health, Israel. 2010. https ://tools .ispor .org/PEgui delin es/sourc e/Israe l-Guide lines -for-submi ssion _2010.pdf. Accessed 11 July 2020.
49. Capri S, Ceci A, Terranova L, et al. Guidelines for economic evaluations in Italy: recommendations from the Italian group of pharmacoeconomic studies. Drug Inf J. 2001;35:189–201.
50. Center for Outcomes Research and Economic Evaluation for Health, National Institute of Public Health (C2H) (Japan): Guide-line for preparing cost-effectiveness evaluation to the Central

363Comparison of national economic evaluation guidelines
Social Insurance Medical Council (Version 2.0). 2019. https ://c2h.niph.go.jp/tools /guide line/guide line_en.pdf. Accessed 11 July 2020.
51. Ministry of Health Malaysia—Pharmaceutical Services Division. Pharmacoeconomic Guideline for Malaysia. Second edition. https ://www.pharm acy.gov.my/v2/sites /defau lt/files /docum ent-uploa d/pharm acoec onomi c-guide lines -malay sia-malay sia-secon d-editi on-2019-final -page-adjus tment .pdf. Accessed 30 Dec 2020.
52. Pharmaceutical Management Agency (New Zealand). Prescription for pharmacoeconomic analysis. Methods for cost-utility analysis (version 2.2). 2015. https ://www.pharm ac.govt.nz/asset s/pfpa-2-2.pdf. Accessed 11 July 2020.
53. Norwegian Medicines Agency. Guidelines for the submission of documentation for single technology assessment of pharmaceuti-cals. 2018. https ://legem iddel verke t.no/Docum ents/Engli sh/Publi c%20fun ding%20and %20pri cing/Docum entat ion%20for %20STA /Guide lines %20151 018.pdf. Accessed 30 Dec 2020.
54. Agencja Oceny Technologii Medycznych (Poland): Health tech-nology assessment guidelines (version 3.0). 2016. https ://www2.aotm.gov.pl/wp-conte nt/uploa ds/wytyc zne_hta/2016/20161 104_HTA_Guide lines _AOTMi T.pdf. Accessed 30 Dec 2020.
55. Alves da Silva E, Gouveia Pinto C, Sampaio C, et al. Guidelines for economic drug evaluation studies Lisbon: National Authority of Medicines and Health Products [INFARMED]; 1998. https ://www.infar med.pt/docum ents/281/14320 55/PCAEC 04_verin g.pdf. Accessed 30 Dec 2020.
56. Scottish Medicines Consortium: Guidance to Submitting compa-nies for completion of new product assessment form. 2019. https ://www.scott ishme dicin es.org.uk/media /4527/20190 626-guida nce-on-npaf.pdf. Accessed 11 July 2020.
57. Agency for Care Effectiveness (Singapore): Drug evaluation methods and process guide. 2018. https ://www.ace-hta.gov.sg/publi c-data/our-proce ss-and-metho ds/ACE%20met hods%20and %20pro cess%20gui de%20for %20dru g%20eva luati on%20(5%20Feb %20201 8).pdf. Accessed 11 July 2020
58. National Department of Health. Guidelines for Pharmacoeco-nomic Submissions. December 2012. https ://www.ispor .org/PEgui delin es/sourc e/PEGaz ette_Febru ary20 13_South Afric a.pdf. Accessed 11 July 2020.
59. López-Bastida J, Oliva J, Antoñanzas F, et al. Spanish recom-mendations on economic evaluation of health technologies. Eur J Health Econ. 2010;11:513–20.
60. Taiwan Society for Pharmacoeconomic and Outcomes Research (TaSPOR). Guidelines of methodological standards for pharma-coeconomic evaluations in Taiwan. 2006. https ://www.ispor .org/PEgui delin es/sourc e/2006_PEG_EN_2009.pdf. Accessed 11 July 2020.
61. Health Intervention and Technology Assessment Program (Thai-land): Ministry of Public Health guidelines for health technology assessment in Thailand (2nd ed). 2014. https ://www.hitap .net/docum ents/16873 8. Accessed 11 July 2020.
62. Zorginstituut Nederland: Dutch national guideline for economic evaluations in healthcare. 2016. https ://engli sh.zorgi nstit uutne derla nd.nl/publi catio ns/repor ts/2016/06/16/guide line-for-econo mic-evalu ation s-in-healt hcare . Accessed 31 Dec 2020.
63. AMCP Format Executive Committee members. The AMCP for-mat for formulary submissions version 4.0. April 2016. http://www.amcp.org/Forma tV4/. Accessed 11 July 2020.
64. Essential Medicines and Technology Division, Department of Medical Services, Ministry of Health, Bhutan. Health Technol-ogy Assessment Process Guideline. 2018. http://www.moh.gov.bt/wp-conte nt/uploa ds/afd-files /2014/11/HTA-Proce ss-Guide line.pdf. Accessed 6 Aug 2020.
65. Ministry of Health Brazil: Methodological guideline: economic assessment guideline: 2nd edn. 2014. https ://bvsms .saude .gov.
br/bvs/publi cacoe s/diret rizes metod ologi cas_diret riz_avali acao_econo mica.pdf. Accessed 6 Aug 2020.
66. Peking University, Fudan University, China Pharmaceutical University et al. China guidelines for pharmacoeconomic evalu-ation. 2011. https ://tools .ispor .org/PEgui delin es/count rydet .asp?c=28&t=4. Accessed 6 Aug 2020.
67. Moreno Viscaya M, Mejía Mejía A, Castro Jaramillo HE. Manual para la elaboración de evaluaciones económicas en salud. Bogotá: Instituto de Evaluación Tecnológica en Salud. 2014. http://www.iets.org.co/Archi vos/64/Manua l_evalu acion _econo mica.pdf. Accessed 6 Aug 2020.
68. Gonzalez AG. Methodological guidelines for health economic evaluation. Cuba: Ministry of Public Health. 2003. https ://tools .ispor .org/PEgui delin es/sourc e/Metho dolog ical-Guide lines -for-Healt h-Econo mic-Evalu ation s-in-Cuba.pdf. Accessed 6 Aug 2020.
69. Léčiv SÚ. Postup proposuzování analýzy nákladové efektivity (SP-CAU-028-W). 2017. file:///C:/Users/Deepshikha%20Sharma/Downloads/03-A-SP-CAU-028-Postup_pro_posuzovani_ana-lyzy_nakladove_efektivity-17052017%20(2).pdf. Accessed 6 Aug 2020.
70. Iran Ministry of Health, Iran Food and Drug Administration, National Committee for Selecting and Registering Medicine. Regulation of submitting applications for medicine with regard to development of economic evaluation. 2014.
71. Consejo de Salubridad General (Mexico): Guia para la conducción de estudios de evaluación económica para la actualización del cuadro básico y catálogo de insumos del sector salud en México [Guide for conducting economic evaluation studies for updating the national formulary in Mexico]. 2015. https ://tools .ispor .org/PEgui delin es/sourc e/Mexic o_GCEEE _2015.pdf. Accessed 6 Aug 2020.
72. MERCOSUR—Guía Para Estudios De Evaluación Económica De Tecnologías Sanitarias/Guideline For Economic Evaluation of Health Technologies. https ://www.merco sur.int/. Accessed 6 Aug 2020.
73. Guidelines for conducting a comparative clinical and economic evaluation of a drug. FSBI Center for Expertise and Quality Con-trol of Medical Care. Moscow. 2016. https ://rosme dex.ru/wp-conte nt/uploa ds/2016/12/MR-KE%60I-23.12.2016.pdf. Accessed 6 Aug 2020.
74. Ministry of Health of the Slovak Republic. The announcement concerning pharmaco-economic analysis of drugs (Vyhláška Min-isterstva zdravotníctva Slovenskej republiky o podrobnostiach-farmako-ekonomického rozboru lieku č. 422/2011 Z. z.). Slovak Republic: Ministry of Health of the Slovak Republic. 2011. https ://www.zakon yprel udi.sk/zz/2011-422. Accessed 6 Aug 2020.
75. Health Insurance Institute of Slovenia. Rules on Classification of Medicines on the List, accepted by the Health Insurance Institute of Slovenia. Slovenia. 2010. https ://www.uradn i-list.si/glasi lo-uradn i-list-rs/vsebi na/11293 2. Accessed 6 Aug 2020.
76. Tandvårds - och läkemedelsförmånsverket. General Guidelines for Economic Evaluations from the Pharmaceutical Benefits Board. Stockholm, Sweden: Tandvårds-och läkemedelsförmånsverket, 2017. https ://www.tlv.se/om-oss/om-tlv/regel verk/allma nna-rad.html. Accessed 6 Aug 2020.
77. Health Insurance Review and Assessment Service. Guidelines for Economic Evaluation of Pharmaceuticals in Korea. Seoul: Health Insurance Review and Assessment Service. 2005. https ://tools .ispor .org/PEgui delin es/sourc e/Korea n_PE_Guide lines _Korea n_Versi on.pdf. Accessed 6 Aug 2020
78. Puig-Junoy J, Oliva-Moreno J, Trapero-Bertrán M, Abellán-Per-piñán M, Brosa-Riestra M, Servei Catalá de la Salut [CatSalut]. Guía y recomendaciones para la realización y presentación de evaluaciones económicas y análisis de impacto presupestario

364 D. Sharma et al.
demedicamientos en el ámbito del CatSalut. Barcelona: Gener-alitatde Catalunya, Departament de Salut, CatSalut; 2014. https ://tools .ispor .org/PEgui delin es/count rydet .asp?c=44&t=2. Accessed 6 Aug 2020
79. Bundesamt für Gesundheit. Operationalisierung der Begriffe Wirksamkeit,: Zweckmässigkeit und Wirtschaftlichkeit Arbeit-spapier, working paper, version 2.0. Switzerland; 2011.
80. Australian Commonwealth Department of Health Housing, Com-munity Services. Guidelines for the Pharmaceutical Industry on Preparation of Submissions to the Pharmaceutical Benefits Advi-sory Committee. Canberra, ACT: Government Publication; 1992.
81. Canadian Coordinating Office for Health Technology Assessment (CCOHTA). Guidelines for Economic Evaluation of Pharmaceu-ticals. Ottawa: CCOHTA; 1994.
82. Mossialos E, Le Grand J (eds). Health care and cost containment in the European Union. Routledge; 2019. Chapter 1, Cost contain-ment in the EU: an overview; p. 3–42.
83. Li R, Hernandez-Villafuerte K, Towse A, Vlad I, Chalkidou K. Mapping priority setting in health in 17 countries across Asia, Latin America, and sub-Saharan Africa. Health Syst Reform. 2016;2(1):71–83.
84. Leelahavarong P, Doungthipsirikul S, Kumluang S, Poonchai A, Kittiratchakool N, Chinnacom D, et al. Health Technology Assessment in Thailand: institutionalization and contribution to
healthcare decision making: review of literature. Int J Technol Assess Health Care. 2019;35(6):467–73. https ://doi.org/10.1017/S0266 46231 90003 21.
85. Chaikledkaew U, Kittrongsiri K. Guidelines for health technol-ogy assessment in Thailand (second edition)—the development process. J Med Assoc Thai. 2014;97(Suppl 5):S4–9.
86. Elsisi GH, Kaló Z, Eldessouki R, Elmahdawy MD, Saad A, Ragab S, et al. Recommendations for reporting pharmacoeconomic eval-uations in Egypt. Value Health Reg Issues. 2013;2(2):319–27. https ://doi.org/10.1016/j.vhri.2013.06.014.
87. Global Burden of Disease Health Financing Collaborator Net-work. Past, present, and future of global health financing: a review of development assistance, government, out-of-pocket, and other private spending on health for 195 countries, 1995–2050. Lan-cet. 2019;393(10187):2233–60. https ://doi.org/10.1016/S0140 -6736(19)30841 -4.
88. Center for the Evaluation of Value and Risk in Health (CEVR), Tufts Medical Center. The Cost-Effectiveness Analysis (CEA) Registry. Boston, MA: CEVR; 2020. https ://cevr.tufts medic alcen ter.org/datab ases/cea-regis try. Accessed 7 Aug 2020.
89. Thorat T, Cangelosi M, Neumann PJ. Skills of the trade: the Tufts cost-effectiveness analysis registry. J Benef Cost Anal. 2012;3(1):1–9.