national health statistics reports, number 84 (09/28/2015) · linked to medicare data and the...
TRANSCRIPT

Number 84 n September 28, 2015
Hospitalization, Readmission, and Death Experience of Noninstitutionalized Medicare Fee-for-service
Beneficiaries Aged 65 and Over by Yelena Gorina M.S., M.P.H.; Laura A. Pratt, Ph.D.; Ellen A. Kramarow, Ph.D.; and Nazik Elgaddal, M.S.
Abstract Objective—This report provides descriptive measures of hospitalization,
readmission, and death among the noninstitutionalized population aged 65 and over using data from a national survey of the noninstitutionalized population linked to Medicare data and the National Death Index. The estimates are presented by self-reported demographic, socioeconomic, heath status, and other characteristics gathered during the interview with the survey participants.
Methods—Data are from the 2000–2005 National Health Interview Survey (NHIS) linked to 2000–2006 Medicare data and the National Center for Health Statistics 2011 Linked Mortality Files. Findings are based on in-home interviews with 25,593 linkage-eligible noninstitutionalized respondents aged 65 and over who were enrolled in fee-for-service (FFS) Medicare during the year following the interview. Among them, 1,100 died during the year following the interview, 5,456 were hospitalized with 3,490 hospitalized once, 1,192 hospitalized twice, and 774 hospitalized three or more times. Among those hospitalized, 1,491 were readmitted to the hospital within 30 days since the discharge. Both population-based and discharge-based measures are used to present the estimates.
Results—This is the first report presenting national estimates on hospitalization, readmission, and death using NHIS data linked to the Medicare claims and death data. Among noninstitutionalized Medicare FFS beneficiaries aged 65 and over, 4.5% died in the year following the interview and 21.6% were hospitalized, with a discharge rate of 348.4 per 1,000 population. Among those who were hospitalized and discharged alive, 17.3% were readmitted within 30 days after discharge. About one-quarter of the deceased died in the hospital (including 7.1% who died during a readmission stay).
Keywords: Medicare claims • linked data • National Death Index • National Health Interview Survey
U.S. DEPARTMENT OF HEALTH AND HUMAN SCenters for Disease Control and Preve
National Center for Health Statistics
Introduction Older persons discharged from
acute care hospitals are at risk of 30-day hospital readmission and death. In 2012, nearly every fifth hospitalization among Medicare fee-for-service (FFS) beneficiaries who were discharged from the hospital alive resulted in a subsequent readmission within 30 days (1). Despite the fact that more than 80% of Medicare beneficiaries aged 65 and over would want to die at home (2), in 2013, one-third of 1,904,640 deaths among persons aged 65 and over in the United States occurred in the hospital (3), about the same proportion as in the previous 12 years (4). Among patients admitted to the hospital for pneumonia, 12.1% died within 30 days of admission. Of these, almost one-half died after discharge from the hospital (5).
Studies of hospitalization and readmission are usually undertaken using data from administrative databases or from hospital records (1,6–11). These sources of data are also used to calculate readmission and postadmission death rates that are included in the set of the measures of inpatient hospital quality of care (12,13). The most common hospitalization and readmission measures use the number of hospital discharges
ERVICES ntion

Page 2 National Health Statistics Reports n Number 84 n September 28, 2015
during a time period as a denominator. In addition, measures that are based on the number of persons discharged (which account for the fact that some patients are hospitalized more than once during this time) or on the population that the hospital serves (which account for the fact that some persons are not hospitalized at all) also can be useful. However, patients’ characteristics available from administrative databases or from hospital records are limited, and information about patients before the hospitalization is not available.
Recent research shows that patient-centered community worker interventions, such as establishing a measurable goal, encouraging patient confidence in achieving the goal, and developing and following a step-by-step plan for goal achievement, may reduce the 30-day readmission rate in a high-risk population and improve postdischarge outcomes (14). Better community health care services that address improving access to primary care are associated with lower Medicare expenditures (15). To provide such services, it is important to identify the population at risk for readmission and hospitalization. For example, readmission rates for beneficiaries with end-stage renal disease are considerably higher than average, which suggests that certain subgroups of beneficiaries are at greater risk of readmission (16). While using hospital discharge-based measures is particularly important for quality assessment of inpatient care, population-based measures of hospitalization, readmission, and death among the noninstitutionalized population may help to better identify the population at risk and may be of interest to policy makers, managed care organizations, insurers, and community health care organizations such as health centers (15).
Previous studies examining population-based readmission rates have usually been based on study-specific conditions (17) or have not used nationally representative data (18–21). Only a few studies consider a person’s characteristics such as socioeconomic status, marital status,
education, self-reported health status, or disability status as risk factors (18,19,22,23).
The objective of this report is to describe variation in hospitalization, readmission, and death rates across participant characteristics. Using data from a national survey of the noninstitutionalized population linked to Medicare data and the National Death Index (NDI) allows the presentation of both discharge-based and population-based measures by self-reported characteristics gathered during the National Health Interview Survey (NHIS) interview with the survey participants regardless of whether they were hospitalized during the year following the NHIS interview or not. This population-based information obtained before the hospitalization may be helpful in finding predictors and determinants of preventable hospitalization and readmission and disparities among Medicare beneficiaries and in facilitating broad patient-centered approaches to prevention strategies in the community and at the time of hospital admission (24).
Data
The 2000–2005 National Health Interview Survey
NHIS is a cross-sectional household interview survey that uses a multistage area probability design to collect data on demographic and health-related information about the civilian noninstitutionalized population residing in the United States at the time of the interview (http://www.cdc.gov/nchs/ nhis.htm). While NHIS provides nationally representative estimates yearly, the statistical reliability of the estimates presented in this report is improved by combining data from 6 years of the survey, 2000–2005.
Descriptive categories examined in this report include self-reported demographic characteristics, socioeconomic status, self-reported health and functional status, number of chronic conditions, health risk factors, health insurance information, and hospitalization in the year prior to the NHIS interview.
Age at the time of interview is categorized into three groups: 65–74, 75–84, and 85 and over. Race and Hispanic origin are collected separately in NHIS, first by asking if the participant is Hispanic or Latino, then by asking the participant’s race or races. For this report, race and ethnicity are combined into three categories: non-Hispanic white, non-Hispanic black, and Hispanic or Latino. Estimates for beneficiaries in other race/ethnicity groups, as well as those who reported two or more races are not presented due to the small number of participants in these groups; however, these persons are included in statistics based on other variables. Living arrangements are presented as living with a spouse or partner, living with someone other than spouse or a partner, and living alone.
In this report, socioeconomic status is characterized by education and family income level. Two education categories are used: less than a high school education [no high school diploma or General Educational Development (GED) high school equivalency certificate] and at least a high school education (including high school diploma, GED, some college, or more). Because income data are often missing, multiple imputed income files (25) were used to categorize annual family income into groups of below 200% of the poverty threshold or at or above 200% of the poverty threshold.
Self-reported health status is presented by three categories, fair or poor, good, and very good or excellent. Chronic conditions are self-reported, health professional-diagnosed conditions. The number of reported chronic conditions is dichotomized into two groups: no condition or one condition and two or more conditions. These conditions include hypertension, heart disease (including coronary heart disease, angina, myocardial infarction, and other heart disease), stroke, emphysema, asthma, chronic bronchitis, diabetes, kidney disease, liver disease, ulcer, and cancers.
Health risk factors analyzed are smoking and leisure-time physical activity participation. Smoking status is categorized as ever smoker (reported

National Health Statistics Reports n Number 84 n September 28, 2015 Page 3
smoking at least 100 cigarettes in a lifetime) and never smoker. Persons who reported they were unable to perform leisure-time physical activity were classified as unable, those who did not report any sessions of light or moderate or vigorous leisure-time physical activity of at least 10 minutes were classified as inactive, and others who answered the question were categorized as performing some or regular leisure-time physical activity.
Disability measures used in this report are basic actions difficulty, complex activity limitation (26), and needing help with activities of daily living (ADL). Basic actions difficulty captures limitations or difficulties in movement (walking, standing, bending or kneeling, reaching overhead, and using the hands and fingers) and in sensory (the ability of a person to see and hear what is going on around him or her), emotional [a score of 13 or more on the Kessler-6 serious psychological distress scale (27)], or cognitive functioning (difficulties with remembering or experiencing confusion) that are associated with some health problem. The complex activity limitation variable is constructed based on reported difficulties with any component of either ADL such as bathing; the instrumental activities of daily living (IADL) such as shopping; work limitations because of a physical, mental, or emotional problem; or social limitation such as participation in social activities or doing things to relax at home. The variable ‘‘needing help with ADL’’ is defined as needing the help of other persons with eating, bathing, dressing, or getting around inside the home because of a physical, mental, or emotional problem.
Two dichotomous (yes, no) variables are used to classify reported enrollment in private insurance and in Medicaid. Another dichotomous variable describes hospitalization in the past year. This variable is based on self-report of staying in a hospital overnight during the 12 months before the interview and is not included in the calculation of the hospitalization and discharge measures in this report.
Medicare data linked to 2000–2005 NHIS
The variables describing Medicare enrollment and inpatient hospital use for NHIS 2000–2005 participants during the year following the interview were constructed from the NHIS 2000–2005 Linked Medicare Files: http:// www.cdc.gov/nchs/data_access/ data_linkage/cms_medicare.htm (28). The Centers for Disease Control and Prevention’s National Center for Health Statistics (NCHS) record linkage program has linked various NCHS surveys to administrative records from the Centers for Medicare & Medicaid Services (CMS) and the Social Security Administration (SSA) under an interagency agreement among NCHS, CMS, SSA, and the Office of the Assistant Secretary for Planning and Evaluation (28).
The 2000–2005 NHIS have been linked to 1999–2007 Medicare claims. Those NHIS participants who had sufficient personal identifier information (PII), agreed to provide their Social Security number (SSN) and Health Insurance Claim number, and had an SSN verified by the SSA Enumeration Verification System were eligible for linkage to CMS and SSA records (linkage-eligible). Among the linkage-eligible, those with participant-supplied PII matching the CMS denominator file on SSN, date of birth (month, day, year), and sex, were considered to be a match (linked) to CMS records (28). Among 65,069 NHIS 2000–2005 participants aged 65 and over, 32,136 were linkage-eligible. Of these, 98% of the sample adults (n = 31,589) were linked to the Medicare data.
CMS denominator files were used to obtain information on Medicare plan coverage. Provider Analysis and Review (MEDPAR) files contain Medicare claims for inpatient hospitalizations and skilled nursing facilities stays and were used to determine the dates of admission and discharge for overnight inpatient stays in the hospital.
Mortality records linked to 2000–2005 NHIS
The mortality experience of all Medicare-linked NHIS 2000–2005 participants was identified from the NCHS 2011 Linked Mortality Files (29). Mortality status of NCHS survey participants was ascertained primarily through probabilistic record matching with NDI (30). NDI is an NCHS centralized database of all U.S. deaths beginning in 1979 (31). Additional sources of information to determine the mortality status of a survey participant include SSA, CMS, and death certificates. If a source of mortality other than an NDI record was available, the participant was considered deceased for the linked files (32). Among 31,589 NHIS 2000–2005 participants aged 65 and over who were linked to Medicare, 41% (12,862) were deceased by the end of 2011.
Methods
Study population
Among 31,589 NHIS 2000–2005 Medicare-linked participants aged 65 and over, 99% of participants (n = 31,355) were enrolled in Medicare during the year following the NHIS interview or until death if the date of death was 12 months or less after the date of the NHIS interview. For example, if a person was interviewed in October 2004 and hospitalized and discharged in January 2005, readmitted on February 1 and discharged on February 15, 2005, hospitalized again in July 2005, and died in August 2005, this person would account for three discharges, one readmission, and a death within the year following the NHIS interview.
CMS denominator files allow obtaining information on Medicare plan coverage by month of the year. During the year following the NHIS interview, 25,593 linked NHIS participants were enrolled only in Medicare FFS, and 5,762 were enrolled in a Medicare Advantage (including Medicare HMO) plan for at least 1 month. The analysis was weighted to obtain national

Page 4 National Health Statistics Reports n Number 84 n September 28, 2015
estimates for noninstitutionalized Medicare participants. To assess how Medicare FFS enrollees (n = 25,593) differ from those enrolled in Medicare Advantage (n = 4,542) and those who switched between Medicare FFS and Medicare Advantage plans at least once during the year (n = 1,220), the percentages of enrollees in these three groups of enrollment by beneficiary’s characteristic were estimated. Because Medicare claims generally are not submitted to CMS for health services provided to Medicare Advantage (including Medicare HMO) enrollees, those who were enrolled in Medicare Advantage plan for at least 1 month during the study follow-up period were excluded from further study analysis.
Study follow-up period
This report reviews inpatient hospitalization, hospital 30-day readmission, and 1-year mortality experience of NHIS 2000–2005 participants who were Medicare FFS beneficiaries during the year following the NHIS interview. Medicare Denominator files were used to identify months of enrollment or disenrollment to and from Medicare FFS and Medicare Advantage plans during the year. Using the data from the Linked Medicare Files and NCHS 2011 Linked Mortality Files, a timeline was created for each participant for the year following the NHIS interview. Medicare inpatient claims data were used to identify the dates of admission and discharge from the hospital. The NCHS 2011 Linked Mortality Files were used to identify the vital status and the date of death, if applicable. Linked participants with a date of death later than 12 months after the date of the interview or without a death record in the NCHS 2011 Linked Mortality Files were assumed alive at the end of the year following the NHIS interview (n = 30,058).
Statistical analysis
To account for the complex survey design, the statistical packages SAS version 9.3 (SAS Institute, Cary, N.C.)
and SUDAAN release 11.0.0 (RTI International, Research Triangle Park, N.C.) were used for data analysis. All analyses include sample adult weights for NHIS 2000–2005. To account for possible differences between adults who were eligible for linkage and those who were not, sample weights were further adjusted for linkage ineligibility by using the SUDAAN procedure PROC WTADJUST. With PROC WTADJUST, the model-based calibration approach was used to adjust the NHIS sample adult weights for race and sex (33).
The standard errors (SE), 95% confidence intervals (CI), and relative standard errors (RSE) were calculated using SUDAAN software. Estimates with RSE of 30% or more and those based on fewer than 30 unweighted records are considered unreliable and are not presented in this report. Estimates based on 30 or more but less than 59 unweighted records and with an RSE less than 30% are considered of low reliability and are shown with a preceding dagger in the tables. Differences between survey estimates were tested for statistical significance using two-tailed t tests with a level of significance of 0.05. Terms such as ‘‘higher than’’ and ‘‘lower than’’ indicate a statistically significant difference at the 0.05 level.
Unless stated otherwise, the rates and percentages among persons or discharges aged 65 and over are age-adjusted to the 2000 U.S. standard population using the age groups 65–74, 75–84, and 85 and over.
Hospitalization measures
For the purpose of this analysis, hospitalization is defined as a hospital stay in any short- or long-term hospital with more than 1 day between the admission and discharge dates on the hospital claims. Because more than one claim may be submitted for one inpatient stay, subsequent claims were reviewed to identify hospitalization admission and discharge dates. Two inpatient hospital stays with the discharge date on one claim that was the same as the admission date on another inpatient claim were defined as a
transfer and were counted as one hospitalization with admission date from the first claim and discharge date from the second claim.
In this report, the number of discharges is computed as a weighted sum of all discharges with an admission date within the year of the NHIS interview. Among 25,593 Medicare FFS study participants, 5,456 were hospitalized in the year following the NHIS interview (Figure 1) with 3,490 hospitalized once, 1,192 hospitalized twice, and 774 hospitalized 3–13 times. Among those hospitalized, less than 1% of beneficiaries (n = 71) were hospitalized 6–13 times (Figure 1). A live discharge is defined as a discharge with a recorded status ‘‘discharged alive’’ on an inpatient claim for a patient. During the year following the interview, 5,355 participants were discharged alive at least once (Figure 1). Among live discharges, 85% of participants were hospitalized and discharged alive once (n = 3,477) or twice (n = 1,157), and less than 1% (n = 66) were hospitalized and discharged 6–13 times (Figure 1).
The discharge rate per 1,000 population was calculated by dividing the weighted number of all discharges in the year following the NHIS interview by the weighted number of noninstitutionalized Medicare FFS beneficiaries (NHIS 2000–2005 participants) and multiplying the ratio by 1,000. The live discharge rate per 1,000 population was calculated by dividing the weighted number of all live discharges in the year following the interview by the weighted number of noninstitutionalized Medicare FFS beneficiaries and multiplying the ratio by 1,000. Because a person may be hospitalized and discharged multiple times during a year, the discharge rate is a measure of the number of discharges per population and does not represent the number of persons discharged during a year.
The percentage of noninstitutionalized Medicare FFS beneficiaries discharged at least once during the year following the NHIS interview was calculated by dividing the weighted number of beneficiaries with

National Health Statistics Reports n Number 84 n September 28, 2015 Page 5
Total hospitalized2 at least once (n = 5,456):
Discharged1 alive at least 3,490: 1 timeonce (n = 5,355): 1,192: 2 times3,477: 1 time 703: 3–5 times1,157: 2 times 71: 6–13 times 655: 3–5 times
Noninstitutionalized FFS Medicare beneficiaries3
(n = 25,593)
66: 6–13 times
Readmitted4 at least once (n = 1,033; total readmissions = 1,491)
1A hospital stay in any short- or long-term hospital with a “discharge alive” status on the hospital claim submitted for Medicare reimbursement. Excludes those who were hospitalized only once and died in the hospital. 2A hospital stay in any short- or long-term hospital with more than 1 day between the admission and discharge dates on the hospital claim(s) submitted for Medicare reimbursement. Includes those who died in the hospital. 3The 2000–2005 National Health Interview Survey linkage-eligible participants enrolled in Medicare FFS during the year after the interview or until death if died earlier. Refers to entire oval. 4A hospital stay in any short- or long-term hospital with a date of admission within 30 days of the day following a date of discharge from another hospital stay. NOTE: FFS is fee-for-service. SOURCE: CDC/NCHS, National Health Interview Survey, 2000–2005 linked to 2000–2006 Medicare data and NCHS 2011 Linked Mortality Files.
Figure 1. The 2000–2005 National Health Interview Survey linkage-eligible participants aged 65 and over enrolled in Medicare FFS during the year following the interview, by hospitalization and readmission status
at least one discharge record during the year following the NHIS interview by the weighted number of all beneficiaries and multiplying the ratio by 100. This represents the percentage of persons hospitalized during a year, including those with multiple discharges.
Mortality measures
Among study participants, 1,100 died during the year following the NHISinterview. The death rate per 100 population (percentage of persons died) was calculated by dividing the weighted number of deaths in the year by the weighted number of noninstitutionalized Medicare FFS beneficiaries and multiplying the ratio by 100. The death was determined to occur within 30 days of discharge if there were 30 days or fewer between the date of death and the date of discharge (n = 356). The percentage of persons who had died within 30 days after hospital discharge was calculated by dividing the weighted
number of deaths during 30 days after hospital discharge (but not at the date of discharge) by the weighted number of participants and multiplying the ratio by 100.
The death was determined to occur in the hospital if inpatient claim contains a status ‘‘discharged dead.’’ For the purpose of this report, those who died during the year following the NHIS interview were stratified by hospitalization status: deceased within 30 days of discharge (n = 356, including 275 who died outside of the hospital and 81 who died during readmission hospital stay); deceased who died in the hospital but not during a readmission stay (n = 195); those who were hospitalized and died after 30 days since the discharge date (n = 166); and deceased who were not hospitalized after the NHIS interview (n = 383) (Figure 2). The crude percentage of deaths by hospitalization status was calculated by dividing the weighted number of deaths in the hospitalization
status category by the weighted total number of deaths.
Readmission measures
In this report, a readmission inpatient stay is defined as a hospitalization with a date of admission within 30 days of the day following discharge from another hospitalization, as defined in this report (n = 1,491) (Figure 1). The readmission rate per 100 live discharges is calculated by dividing the weighted number of readmissions by the weighted number of live discharges and multiplying the ratio by 100. Because a person may be discharged and readmitted multiple times during a year, readmission rate is a measure of the number of readmissions per live discharges and does not represent the number of persons readmitted during a year.
The percentage of noninstitutionalized Medicare FFS beneficiaries with at least one readmission is calculated by dividing the weighted number of beneficiaries who were readmitted at least once by the weighted number of beneficiaries and multiplying the ratio by 100. This represents a percentage of persons who were hospitalized and readmitted during the year, including those with multiple discharges and readmissions.
Results
Medicare beneficiary by type of enrollment
Of noninstitutionalized Medicare beneficiaries aged 65 and over, 82.5% remained enrolled in Medicare FFS for an entire year (or until death), 13.9% were enrolled in a Medicare Advantage Plan (including Medicare HMO), and 3.7% switched between Medicare Advantage and Medicare FFS plans at least once (Table 1). The percentage of Medicare FFS enrollees among non-Hispanic white and non-Hispanic black beneficiaries was 1.2 times the percentage among Hispanic or Latino beneficiaries (84.1% and 81.1% among non-Hispanic white and non-Hispanic black beneficiaries, respectively

Page 6 National Health Statistics Reports n Number 84 n September 28, 2015
Died in hospital1, readmission2 stay at time of death (Less than or equal to 30 days since previous discharge, n = 81)
Died, no hospital stay during the year following NHIS interview (n = 383)
Died in hospital1, not a readmission2
stay at time of death (n = 195)
34.9%
7.1%
15.8%
17.5%
24.7%
Died more than 30 days after last discharge, not in hospital (n = 166)
Died less than or equal to 30 days after last discharge, not in hospital (n = 275)
1A hospital stay in any short- or long-term hospital with more than 1 day between the admission and discharge dates on the hospital claim(s) submitted for Medicare reimbursement. 2A hospital stay in any short- or long-term hospital with a date of admission within 30 days of the day following a date of discharge from another hospital stay. NOTES: NHIS is National Health Interview Survey. Percentages are age-adjusted to the 2000 standard population using three age groups: 65–74, 75–84, and 85 and over. SOURCE: CDC/NCHS, National Health Interview Survey, 2000–2005 linked to 2000–2006 Medicare data and NCHS 2011 Linked Mortality Files.
Figure 2. Age-adjusted percent distribution of noninstitutionalized Medicare FFS beneficiaries aged 65 and over who died during the year following the National Health Interview Survey interview, by hospitalization and readmission status: United States, 2000–2006
compared with 67.7% among Hispanic or Latino beneficiaries). The percentage of Medicare Advantage Plan enrollees was twice as high among Hispanic or Latino beneficiaries (25.1%) as among non-Hispanic black (12.8%) and non-Hispanic white (12.8%) beneficiaries (Table 1, Figure 3).
The percentage of Medicare FFS enrollment was higher among those who reported receiving Medicaid benefits (89.8%) or being enrolled in private insurance (87.1%) compared with those who did not report Medicaid (81.7%) or private insurance (74.4%) (Table 1).
Those enrolled in a Medicare Advantage plan and those who switched between Medicare Advantage and Medicare FFS during the follow-up period were excluded from further analysis.
Mortality among noninstitutionalized Medicare FFS beneficiaries aged 65 and over
Death rates
Among noninstitutionalized Medicare FFS beneficiaries aged 65 and over, 4.5% died in the year following the NHIS interview (Table 2). The death rate increased with age from 2.3% among those aged 65–74 to 12.7% among those aged 85 and over, and was 1.5 times (95% CI 1.3, 1.7) as high among men (5.6%) as among women (3.7%).
The death rate was higher among those with less than a high school education compared with those with at least a high school education, among those with family incomes below 200% compared with those at or above 200%
of the poverty threshold, and among those not living alone compared with those living alone. Persons with two or more chronic conditions died at a rate 2.5 times (95% CI 2.0, 3.1) the rate of those who reported none or one condition (6.1% compared with 2.4%). Among those who reported their health as fair or poor, 9.3% died within a year of the NHIS interview, a rate 4.9 times (95% CI 3.8, 6.0) as high as the rate of 1.9% among those who reported their health as excellent or very good (Table 2).
Among those who reported any difficulties with basic actions or complex activity limitations, 5.4% died in the year following the NHIS interview, compared with 1.8% of those who did not report such difficulties. Among those who needed help with ADL, 17.9% died within the year of the NHIS interview, a rate 5.3 times

National Health Statistics Reports n Number 84 n September 28, 2015 Page 7
0
20
40
60
80
100
Switched between FFS and Medicare Advantage
Enrolled in Medicare Advantage
Enrolled in Medicare FFS
Non-Hispanic white1Non-Hispanic black1Hispanic or LatinoAll persons
Per
cent
Confidence interval. 1Excludes those who reported two or more races. 295% confidence interval. NOTE: FFS is fee-for-service. SOURCE: CDC/NCHS, National Health Interview Survey, 2000–2005 linked to 2000–2006 Medicare data and NCHS 2011 Linked Mortality Files.
2
Figure 3. Medicare enrollment among noninstitutionalized Medicare beneficiaries aged 65 and over during the year following the National Health Interview Survey interview, by race and Hispanic origin: United States, 2000–2006
(95% CI 4.6, 6.0) as high as the rate of 3.4% among those who did not need such help. Current and former smokers died at a rate 1.7 times (95% CI 1.3, 2.0) as high as the rate for those who never smoked (5.3% compared with 3.2%). Among those who reported an overnight hospital stay during the year prior to the NHIS interview, 9.6% died during the year following the interview, compared with 3.1% of those who did not report an overnight hospital stay. Among Medicaid recipients, the death rate (6.1%) was 1.4 times (95% CI 1.2, 1.7) the rate for those who did not report receiving Medicaid (4.3%). Observed differences in death rates by race and Hispanic origin were not statistically significant (Table 2).
Distribution of deaths by hospitalization and readmission status
Among noninstitutionalized Medicare FFS beneficiaries deceased during the year following the NHIS interview, about one-third (31.8%) died within 30 days after an inpatient hospital discharge, including 7.1% who
died during their readmission hospital stay. Another 17.5% died in the hospital but not during a readmission stay, 15.8% were discharged alive but died more than 30 days after discharge, and 34.9% died but were not hospitalized (Table 2, Figure 2).
Those who reported hospitalization in the year prior to the NHIS interview and those who reported two or more chronic conditions were more likely to be hospitalized before death. Those who reported hospitalization in the year prior to the NHIS interview also were more likely to die in the hospital (Table 2). Other observed differences in percent distribution (where available) by hospitalization and readmission status were not statistically significant.
Percentage of persons who died within 30 days after discharge
Among noninstitutionalized FFS Medicare beneficiaries aged 65 and over, 1.5% were hospitalized, discharged alive, and died within 30 days after discharge (including those who died during a readmission hospital stay) (Table 3). This percentage increased
with age, from 0.8% among those aged 65–74 to 1.8% among those aged 75–84 and 3.9% among those aged 85 and over. Men were more likely (95% CI 1.3, 2.0) to die within 30 days after discharge (2.0%) than women (1.2%). Persons with any type of basic actions difficulties were 2.9 times (95% CI 1.9, 3.9) as likely to die within 30 days of discharge as persons without such difficulties (2.0% and 0.7%, respectively). The percentage of those hospitalized, discharged alive, and deceased within 30 days among persons with any type of complex activity limitations (2.9%) was 3.6 times (95% CI 2.5, 4.8) as high as among those without such limitations (0.8%). Those in fair or poor health (3.2%) were 2.9 times as likely (95% CI 2.3, 3.6) to die within 30 days after the discharge as those in good health (1.1%). The percentage of persons who were hospitalized and died within 30 days of discharge among those who needed help with ADL (6.0%) was 5.0 times (95% CI 3.6, 6.4) the percentage among those who did not need such help (1.2%). Among those who reported an overnight

Page 8 National Health Statistics Reports n Number 84 n September 28, 2015
hospital stay during the year prior to the NHIS interview, 3.4% died within 30 days of discharge, 3.4 times (95% CI 2.5, 4.3) the percentage of those who did not report an overnight stay (1.0%).
Hospitalizations among noninstitutionalized FFS Medicare beneficiaries aged 65 and over
Discharge rates
The discharge rate for hospitalizations among noninstitutionalized FFS Medicare beneficiaries during the year following the NHIS interview was 348.4 per 1,000
0 100
Yes
No
Hospitalized during theyear prior to interview1
Yes No
Needs help with ADL1,4
Two or more None or one
Chronic conditions1
Fair/poor Good
Excellent/very good
Self-reportedhealth status1
Non-Hispanic white3
Non-Hispanic black3
Hispanic or Latino
Race and Hispanicorigin1
85 and over 75–84 65–74
Age at interview
All persons1
Confidence interval. 1Age-adjusted to the 2000 U.S. standard population using three 295% confidence interval. 3Excludes those who reported two or more races. 4ADL, or activities of daily living, includes eating, bathing, dressinNOTE: FFS is fee-for-service. SOURCE: CDC/NCHS, National Health Interview Survey, 2000–
Figure 4. Hospital discharge rate among noninNational Health Interview Survey interview, by
population (Table 4, Figure 4). The rates increased with age from 264.0 per 1,000population among beneficiaries aged 65–74 to 580.1 per 1,000 among those aged 85 and over. The rates were about the same among male and female discharges (358.5 and 341.1 per 1,000 population, respectively). The discharge rate for non-Hispanic black beneficiaries(433.0 per 1,000) was about 1.3 times (95% CI 1.1, 1.4) the rate for non-Hispanic white beneficiaries (343.6 per 1,000).
The discharge rate was 1.4 times (95% CI 1.3, 1.5) as high among beneficiaries with less than a high school education (440.8 per 1,000) as among those with at least a high school
200 300 400 500 600
Rate per 1,000 population
age groups: 65–74, 75–84, and 85 and over.
g, or getting around inside the home.
2005 linked to 2000–2006 Medicare data and NCHS 2011 Linked M
2
stitutionalized Medicare FFS beneficiaries age selected characteristics: United States, 2000–2
education (307.3 per 1,000). Similarly, the discharge rate was 1.4 times (95% CI 1.3, 1.5) as high among those below 200% (425.5 per 1,000) as among those at or above 200% of the poverty threshold (307.0 per 1,000). Those who lived with persons other than a spouse or partner were more likely to be hospitalized (428.8 per 1,000 population) compared with those living alone or with spouse or partner (365.1 and 330.5 per 1,000 population, respectively).
The discharge rate among persons with any basic actions difficulties (439.2per 1,000) was 2.1 times (95% CI 1.9, 2.4) the rate of those without such difficulties (206.1 per 1,000). Those
700 800 900 1,000
ortality Files.
d 65 and over during the year following the 006

National Health Statistics Reports n Number 84 n September 28, 2015 Page 9
with complex activity limitation had a discharge rate (562.9 per 1,000) that was 2.4 times the rate of those without complex activity limitation (237.2 per 1,000). Those in fair or poor health were three times as likely (95% CI 2.7, 3.3) to be hospitalized as those in excellent or very good health (599.4 compared with 199.7 per 1,000 population). Among those who reported an overnight hospital stay during the year prior to the NHIS interview, the discharge rate was 677.8 per 1,000 population, 2.6 times (95% CI 2.4, 2.7) as high as the rate among those who did not report an overnight stay (264.4 per 1,000 population).
The discharge rate for those who needed help with ADL was 875.0 per 1,000, 2.8 times (95% CI 2.5, 3.1) the rate among those who did not need such help (314.1 per 1,000 population).
50
45
40
35
30
25 1
20
Per
cent
15 1917.5
13.710
5
0 All persons2 65–74 75–
Age at in
4.1 3.0 4.
Confidence interval. 195% confidence interval for total percentage hospitalized. 2Percentages are age-adjusted to the 2000 U.S. standard popuNOTE: FFS is fee-for-service. SOURCE: CDC/NCHS, National Health Interview Survey, 2000
Figure 5. Percentage ever hospitalized amonfollowing the National Health Interview Surve
Percentage of persons hospitalized
Among noninstitutionalized FFS Medicare beneficiaries, 21.6% were hospitalized at least once during the year following the NHIS interview (Table 3, Figures 5 and 6). A higher percentage of persons aged 85 and over were hospitalized (34.3%) compared with those aged 65–74 (16.7%), while the percentage of hospitalization among men and women was about the same, 22.1% and 21.2%, respectively. About one-quarter of those with less than a high school education (25.2%) or those with family incomes below 200% of the poverty threshold (24.7%) were hospitalized, compared with about one-fifth of those with at least a high school education (19.9%) or those at or above 200% of the poverty threshold
26.7
.9 17.6 17.5
84 85 and Men Women over
terview Sex2
4.5 3.75 7.6
lation using three age groups: 65–74, 75–84, and 85 and over.
–2005 linked to 2000–2006 Medicare data and NCHS 2011 Linked M
g noninstitutionalized Medicare FFS beneficiariey interview, by age, sex, education, and readmis
(19.9%). One-third of those who reported fair or poor health (33.3%) were hospitalized during the year following the NHIS interview, compared with 14.1% of those who reported excellent or very good health. Among those with two or more chronic conditions, 27.3% were hospitalized during the year following the NHIS interview, compared with 15.1% of those with none or one chronic condition. The percentage hospitalized during the year following the NHIS interview was 26.2% among those with basic actions difficulties, 31.3% among those with complex activity limitations, and 43.2% among those who needed help with ADL. Among those who reported an overnight hospital stay in the year prior to the NHIS interview, 36.6% were hospitalized, compared with 17.8% of those who did not report an overnight stay.
19.5 Hospitalized,
16.5 never readmitted
Hospitalized and readmitted at least once
No high High school school or more
Education2
5.7 3.4
ortality Files.
s aged 65 and over during the year sion status: United States, 2000–2006

4.5
Page 10 National Health Statistics Reports n Number 84 n September 28, 2015 P
erce
nt
50
45
40
35
30
25
1
12.2
1.9 3.5
17.0
7.7
25.6
12.9
2.2
21.2
6.1
16.6
3.5
30.3
12.9
2.9
14.9
27.7
8.9
Hospitalized, never
20 readmitted
15
10
Hospitalized and5 readmitted at
least once
0 Excellent/ Good Fair/Poor None Two or No Yes No Yes Very good or one more
Self-reported health status Chronic conditions Needs help with ADL2 Hospitalized during the year prior to interview
Confidence interval. 195% confidence interval for total percentage ever hospitalized. 2ADL, or activities of daily living, includes eating, bathing, dressing, or getting around the house. NOTE: FFS is fee-for-service. Percentages are age-adjusted to the 2000 standard population using three age groups: 65–74, 75–84, and 85 and over. SOURCE: CDC/NCHS, National Health Interview Survey, 2000–2005 linked to 2000–2006 Medicare data and NCHS 2011 Linked Mortality Files.
Figure 6. Percentage ever hospitalized among noninstitutionalized Medicare FFS beneficiaries aged 65 and over during the year following the National Health Interview Survey interview, by selected characteristics and readmission status: United States, 2000–2006
Readmission among noninstitutionalized FFS Medicare beneficiaries aged 65 and over
Readmission rates
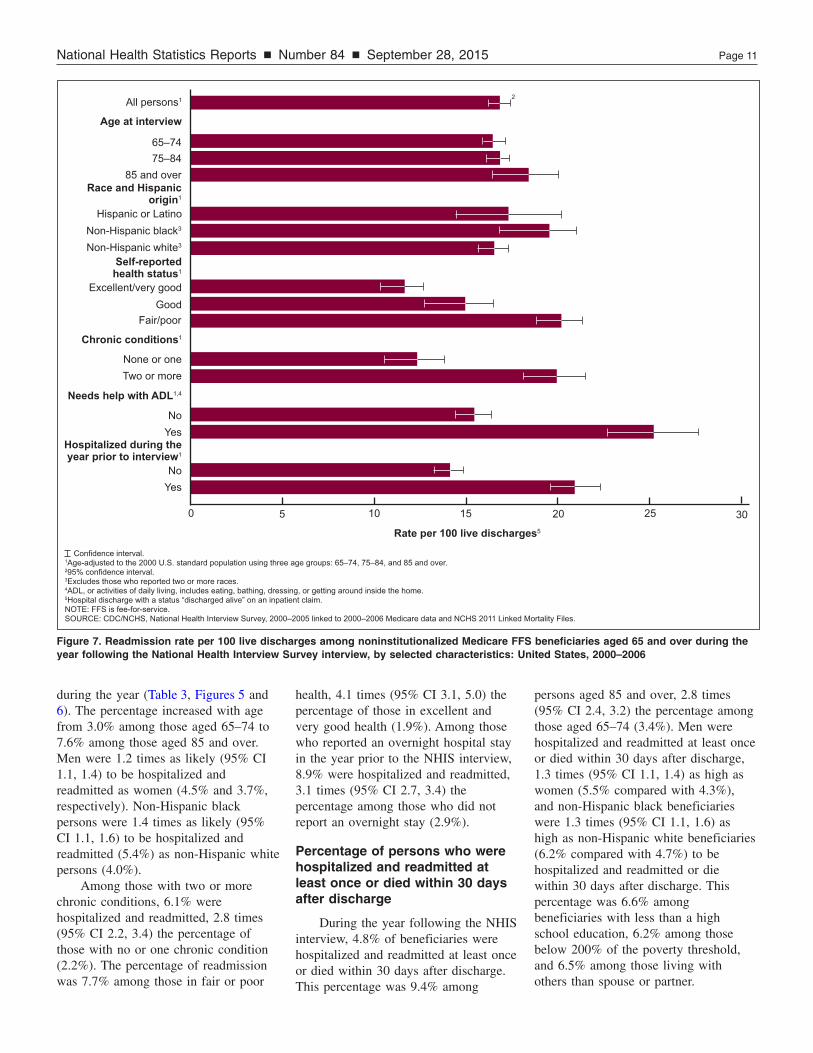
During 2000–2006, among noninstitutionalized FFS Medicare beneficiaries aged 65 and over, the readmission rate was 17.3 per 100 live discharges (Table 4, Figure 7).
The readmission rate was 20.6 per 100 live discharges among those with less than a high school education, 1.3 times (95% CI 1.2, 1.5) the rate among those with at least a high school education (15.4 per 100 live discharges). The readmission rate was 19.5 per 100 live discharges among those with family income of below 200% of the poverty threshold, 1.3 times (95% CI 1.1, 1.4) the readmission rate of those at or above 200% of the poverty threshold (15.5 per 100 live discharges). Those living with
another person who was not a spouse or partner were readmitted at the rate of 20.9 per 100 live discharges, 1.3 times (95% CI 1.1, 1.5) the rate among those living with a spouse or partner (15.9 per 100 live discharges). Among those with two or more chronic conditions, the readmission rate was 20.5 per 100 live discharges compared with the rate of 12.7 among those with no or one chronic condition. Those in fair or poor health had a readmission rate of 20.7 per 100 live discharges compared with the rate of 12.0 among those in excellent or very good health. The readmission rate for those with complex activity limitations was 20.8 per 100 live discharges compared with the rate of 15.0 per 100 live discharges among those without limitations. Among ever smokers, the readmission rate was 20.0 per 100 live discharges compared with the rate of 15.3 among those who never smoked. Persons who reported an overnight hospital stay in the year prior
to the NHIS interview had a readmission rate of 21.5 per 100 live discharges compared with 14.5 readmissions per 100 live discharges among those who did not. Those who needed help with ADL had a readmission rate of 25.4 per 100 live discharges, 1.6 times (95% CI 1.4, 1.8) the readmission rate of those who did not need help (15.9 per 100 live discharges).
Observed differences in the readmission rates by age, sex, race and Hispanic origin, basic action difficulty, Medicaid enrollment, or participation in private insurance were not statistically significant.
Percentage of persons hospitalized and readmitted at least once
Among noninstitutionalized Medicare FFS beneficiaries aged 65 and over, 4.1% were hospitalized and readmitted within 30 days at least once
National Health Statistics Reports n Number 84 n September 28, 2015 Page 11
0 5 10 15 20 25 30
Yes No
Hospitalized during theyear prior to interview1
Yes No
Needs help with ADL1,4
Two or more None or one
Chronic conditions1
Fair/poor Good
Excellent/very good
Self-reportedhealth status1
Non-Hispanic white3
Non-Hispanic black3
Hispanic or Latino
Race and Hispanicorigin1
85 and over 75–84 65–74
Age at interview
All persons1
Rate per 100 live discharges5
Confidence interval. 1Age-adjusted to the 2000 U.S. standard population using three age groups: 65–74, 75–84, and 85 and over. 295% confidence interval. 3Excludes those who reported two or more races. 4ADL, or activities of daily living, includes eating, bathing, dressing, or getting around inside the home. 5Hospital discharge with a status “discharged alive” on an inpatient claim. NOTE: FFS is fee-for-service. SOURCE: CDC/NCHS, National Health Interview Survey, 2000–2005 linked to 2000–2006 Medicare data and NCHS 2011 Linked Mortality Files.
2
Figure 7. Readmission rate per 100 live discharges among noninstitutionalized Medicare FFS beneficiaries aged 65 and over during the year following the National Health Interview Survey interview, by selected characteristics: United States, 2000–2006
during the year (Table 3, Figures 5 and 6). The percentage increased with age from 3.0% among those aged 65–74 to 7.6% among those aged 85 and over. Men were 1.2 times as likely (95% CI 1.1, 1.4) to be hospitalized and readmitted as women (4.5% and 3.7%, respectively). Non-Hispanic black persons were 1.4 times as likely (95% CI 1.1, 1.6) to be hospitalized and readmitted (5.4%) as non-Hispanic whitepersons (4.0%).
Among those with two or more chronic conditions, 6.1% were hospitalized and readmitted, 2.8 times (95% CI 2.2, 3.4) the percentage of those with no or one chronic condition (2.2%). The percentage of readmission was 7.7% among those in fair or poor
health, 4.1 times (95% CI 3.1, 5.0) the percentage of those in excellent and very good health (1.9%). Among those who reported an overnight hospital stay in the year prior to the NHIS interview, 8.9% were hospitalized and readmitted, 3.1 times (95% CI 2.7, 3.4) the percentage among those who did not report an overnight stay (2.9%).
Percentage of persons who were hospitalized and readmitted at least once or died within 30 days after discharge
During the year following the NHIS interview, 4.8% of beneficiaries were hospitalized and readmitted at least once or died within 30 days after discharge. This percentage was 9.4% among
persons aged 85 and over, 2.8 times (95% CI 2.4, 3.2) the percentage among those aged 65–74 (3.4%). Men were hospitalized and readmitted at least once or died within 30 days after discharge, 1.3 times (95% CI 1.1, 1.4) as high as women (5.5% compared with 4.3%), and non-Hispanic black beneficiaries were 1.3 times (95% CI 1.1, 1.6) as high as non-Hispanic white beneficiaries (6.2% compared with 4.7%) to be hospitalized and readmitted or die within 30 days after discharge. This percentage was 6.6% among beneficiaries with less than a high school education, 6.2% among those below 200% of the poverty threshold, and 6.5% among those living with others than spouse or partner.

Page 12 National Health Statistics Reports n Number 84 n September 28, 2015
The percentage of hospitalized and readmitted or deceased within 30 days after discharge was 2.2% among those who reported very good or excellent health, 4.1% among those in good health, and 9.1% among those in fair or poor health. Persons with two or more chronic conditions were 2.3 times as likely (95% CI 2.2, 3.3) to be hospitalized and readmitted or die within 30 days after discharge as those with no or one condition (7.2% compared with 2.6%). This percentage was 6.3% among persons with basic actions difficulties, 8.6% among those with complex activity limitations, and 15.6% among those who needed help with ADL. The latter percentage was 3.8 times (95% CI 3.3, 4.3) the percentage among those who did not need help with ADL (4.1%).
Those who reported an overnight hospital stay in the previous year were 3.1 times as likely (95% CI 2.7, 3.4) to be hospitalized and readmitted or die within 30 days after discharge as those who did not report an overnight stay (10.4% compared with 3.4%).
Discussion Among noninstitutionalized
Medicare FFS beneficiaries aged 65 and over, 21.6% were hospitalized in the year following the NHIS interview, with a discharge rate of 348.4 per 1,000 population. Among live discharges, 17.3% were readmitted within 30 days after discharge. Although it was not possible to obtain directly corresponding discharge and readmission rates published previously, the discharge rate of 348.4 per 1,000 noninstitutionalized population is comparable to the 2006 discharge rate of 3,507.9 discharges per 10,000 civilian population aged 65 and over reported by the National Hospital Discharge Survey (34). The readmission rate of 17.3% is comparable to the 2005 estimate of ‘‘almost 18 percent of admissions resulted in readmissions within 30 days of discharge’’ as reported to Congress by the Medicare Payment Advisory Commission (16) and to the 2007–2012 national average 30-day all-cause readmission rate of 19% (8).
During the year following the NHIS interview, 4.5% of the beneficiaries died. About one-third of the deceased died within 30 days after discharge from the hospital, including 7.1% who died during a readmission stay. The percentage of deceased who died within 30 days of discharge did not differ across demographic and socioeconomic status characteristics, health and functional status, health risk factors, or health insurance.
About one-quarter of the deceased died in the hospital (including those 7.1% who died during a readmission stay), which is consistent with other estimates (3). The observed differences in the percentage of deceased who died in the hospital were not significant by age, sex, race and Hispanic origin, and other categories with the exception of those who had an overnight hospital stay during the year before the NHIS interview. Those deceased who had reported an overnight stay in the year before the NHIS interview were twice as likely to die in the hospital as those who did not report an overnight stay.
This report presents rates of discharge per 1,000 population and readmission per 100 live discharges by patients’ characteristics that were self-reported before hospitalization. While there was a difference in discharge rates by most of patients’ characteristics except sex, readmission rates did not differ by age, sex, race and Hispanic origin, disability status (e.g., basic actions difficulties at the time of the NHIS interview), or type of the supplemental insurance (Medicaid or private).
This report presents national estimates of the percentage of noninstitutionalized beneficiaries aged 65 and over who were hospitalized at least once and readmitted in the year following the NHIS interview. The differences between percentages of those hospitalized by selected variables reflect the risk factors of being hospitalized and generally are consistent with the differences between discharge rates by these variables. The risk associated with readmission among beneficiaries reflects a combination of risk factors for hospitalization among persons not yet
hospitalized and for readmission among persons at the time of hospital discharge, which may differ from the factors associated with the risk of readmission among live discharges only. An understanding of these risk factors may help community and health management organizations in prevention efforts required for reducing unnecessary hospitalizations and readmissions.
Limitations Only Medicare FFS participants
were included in the analysis, as Medicare claims for HMO participants are not available. Data from NHIS and Medicare are from 2000 to 2006, and readmission patterns may have changed since that time. Although nonresponse adjustments have been made, exclusion of NHIS respondents who are linkage-ineligible may create some residual bias in final estimates.
The calculations of the hospitalization and readmissions measures in the report do not include inpatient hospital stays before the NHIS interview; therefore, a hospitalization in the first few weeks after the NHIS interview may itself be a readmission stay. Finally, the NHIS self-reported data on chronic conditions and disability measures may be subject to reporting bias.
References 1. Gerhardt G, Yemane A, Apostle K,
Oelschlaeger A, Rollins E, Brennan N. Evaluating whether changes in utilization of hospital outpatient services contributed to lower Medicare readmission rate. Medicare Medicaid Res Rev 4(1). 2014.
2. Barnato AE, Anthony DL, Skinner J, Gallagher PM, Fisher ES. Racial and ethnic differences in preferences for end-of-life treatment. J Gen Intern Med 24(6):695–701. 2009.
3. CDC. About multiple cause of death, 1999–2013. CDC WONDER. 2015. Available from: http:// wonder.cdc.gov/mcd-icd10.html.
4. Hall MJ, Levant S, DeFrances CJ. Trends in inpatient hospital deaths: National Hospital Discharge Survey, 2000–2010. NCHS data brief, no

National Health Statistics Reports n Number 84 n September 28, 2015 Page 13
118. Hyattsville, MD: National Center for Health Statistics. 2013.
5. Metersky ML, Waterer G, Nsa W, Bratzler DW. Predictors of in-hospital versus postdischarge mortality in pneumonia. Chest 142(2):476–81. 2012.
6. Morley M, Bogasky S, Gage B, Flood S, Ingber MJ. Medicare post-acute care episodes and payment bundling. Medicare Medicaid Res Rev 4(1). 2014.
7. Gerhardt G, Yemane A, Hickman P, Oelschlaeger A, Rollins E, Brennan N. Medicare readmission rates showed meaningful decline in 2012. Medicare Medicaid Res Rev 3(2). 2013.
8. Silverstein MD, Qin H, Mercer SQ, Fong J, Haydar Z. Risk factors for 30-day hospital readmission in patients ≥ 65 years of age. Proc (Bayl Univ Med Cent) 21(4):363–72. 2008.
9. Dharmarajan K, Hsieh AF, Lin Z, Bueno H, Ross JS, Horwitz LI, et al. Diagnoses and timing of 30-day readmissions after hospitalization for heart failure, acute myocardial infarction, or pneumonia. JAMA 309(4):355–63. 2013.
10. Jencks SF, Williams MV, Coleman EA. Rehospitalizations among patients in the Medicare fee-forservice program. N Engl J Med 360(14):1418–28. 2009.
11. Joynt KE, Orav EJ, Jha AK. Thirty-day readmission rates for Medicare beneficiaries by race and site of care. JAMA 305(7):675–81. 2011.
12. AHRQ. Inpatient quality indicators technical specifications—Version 4.5, May 2013. Available from: http://www.qualityindicators. ahrq.gov/Modules/IQI_TechSpec.aspx.
13. CMS. 30-day unplanned readmission and death measures. Available from: http://www.medicare.gov/ hospitalcompare/Data/30-daymeasures.html.
14. Kangovi S, Mitra N, Grande D, White ML, McCollum S, Sellman J, et al. Patient-centered community health worker intervention to improve posthospital outcomes: A randomized clinical trial. JAMA Intern Med 174(4):535–43. 2014.
15. Sharma R, Lebrun-Harris LA, Ngo-Metzger Q. Costs and clinical quality among Medicare beneficiaries: Associations with health center penetration of low-income residents. Medicare Medicaid Res Rev 4(3). 2014.
16. MedPAC. Report to the Congress: Promoting greater efficiency in Medicare. Washington, DC: MedPAC. 2007.
17. DePalma G, Xu H, Covinsky KE, Craig BA, Stallard E, Thomas J 3rd, Sands LP. Hospital readmission among older adults who return home with unmet need for ADL disability. Gerontologist 53(3):454–61. 2013.
18. Kansagara D, Englander H, Salanitro A, Kagen D, Theobald C, Freeman M, Kripalani S. Risk prediction models for hospital readmission: A systematic review. JAMA 306(15):1688–98. 2011.
19. Amarasingham R, Moore BJ, Tabak YP, Drazner MH, Clark CA, Zhang S, et al. An automated model to identify heart failure patients at risk for 30-day readmission or death using electronic medical record data. Med Care 48(11):981–8. 2010.
20. Sellers MM, Merkow RP, Halverson A, Hinami K, Kelz RR, Bentrem DJ, Bilimoria KY. Validation of new readmission data in the American College of Surgeons National Surgical Quality Improvement Program. J Am Coll Surg 216(3):420–7. 2013.
21. Brock J, Mitchell J, Irby K, Stevens B, Archibald T, Goroski A, Lynn J. Association between quality improvement for care transitions in communities and rehospitalizations among Medicare beneficiaries. JAMA 309(4):381–91. 2013.
22. Garrison GM, Mansukhani MP, Bohn B. Predictors of thirty-day readmission among hospitalized family medicine patients. J Am Board Fam Med 26(1):71–7. 2013.
23. Vaduganathan M, Bonow RO, Gheorghiade M. Thirty-day readmissions: The clock is ticking. JAMA 309(4):345–6. 2013.
24. Williams MV. A requirement to reduce readmissions: Take care of the patient, not just the disease. JAMA 309(4):394–6. 2013.
25. Schenker N, Raghunathan TE, Chiu P, Makuc DM, Zhang G, Cohen AJ. Multiple imputation of missing income data in the National Health Interview Survey. J Am Stat Assoc 101(475):924–33. 2006.
26. Altman B, Bernstein A. Disability and health in the United States, 2001–2005. Hyattsville, MD: National Center for Health Statistics. 2008.
27. Kessler RC, Andrews G, Colpe LJ, Hiripi E, Mroczek DK, Normand SLT, et al. Short screening scales to monitor population prevalences and trends in non-specific psychological distress. Psychol Med 32(6):959–76. 2002.
28. NCHS. Linkages between survey data from the National Center for Health Statistics and Medicare program data from the Centers for Medicare and Medicaid Services. 2012. Available from: http:// www.cdc.gov/nchs/data/datalinkage/ cms_medicare_methods_report_final.pdf.
29. NCHS. NCHS data linked to mortality files. Available from: http://www.cdc.gov/nchs/data_access/ data_linkage/mortality.htm.
30. NCHS. NCHS 2011 linked mortality files matching methodology. 2013. Available from: http://www.cdc.gov/ nchs/data/datalinkage/2011_linked_ mortality_file_matching_methodology.pdf.
31. NCHS. National Death Index user’s guide. Hyattsville, MD. 2013. Available from: http://www.cdc.gov/ nchs/data/ndi/NDI_Users_Guide.pdf.
32. NCHS. Analytic guidelines for NCHS 2011 linked mortality files. 2013. Available from: http://www. cdc.gov/nchs/data/datalinkage/2011_ linked_mortality_analytic_guidelines.pdf.
33. NCHS. Use of survey weights for linked data files—Preliminary guidance. 2013. Available from: http://www.cdc.gov/nchs/data/ datalinkage/use_of_survey_weights_ for_linked_data_files.pdf.
34. DeFrances CJ, Lucas CA, Buie VC, Golosinskiy A. 2006 National Hospital Discharge Survey. National health statistics reports; no 5. Hyattsville, MD: National Center for Health Statistics. 2008.

Page 14 National Health Statistics Reports n Number 84 n September 28, 2015
Table 1. Medicare enrollment among noninstitutionalized Medicare beneficiaries aged 65 during the year following the NHIS interview, by selected characteristics: United States, 2000–2006
Number of persons Percentage in Medicare FFS1
Percentage in Medicare Advantage plan1
Percentage switched between FFS and Medicare HMO1
Characteristic Sample
size Number (in thousands)
Standard error (in
thousands) Percent
95% confidence interval
Lower bound
Upper bound Percent
95% confidence interval
Lower bound
Upper bound Percent
95% confidence interval
Lower bound
Upper bound
65 and over2 . . . . . . . . . . . . . . . . 31,355 197,943 2,703 82.5 81.7 83.2 13.9 13.2 14.6 3.7 3.4 3.9
Age in years
65–74 . . . . . . . . . . . . . . . . . . . . 75–84 . . . . . . . . . . . . . . . . . . . . 85 and over. . . . . . . . . . . . . . . . .
17,076 11,219 3,060
105,542 72,649 19,752
1,523 1,256
525
82.2 82.1 85.1
81.3 81.2 83.6
83.1 83.1 86.5
13.8 14.5 12.0
13.0 13.6 10.7
14.7 15.4 13.4
4.0 3.4 2.9
3.7 3.0 2.3
4.3 3.8 3.5
Sex
Men . . . . . . . . . . . . . . . . . . . . . Women . . . . . . . . . . . . . . . . . . .
14,219 17,136
88,524 109,419
1,362 1,550
82.8 82.2
81.9 81.3
83.7 83.1
13.6 14.1
12.8 13.4
14.3 14.9
3.6 3.7
3.3 3.4
4.0 4.0
Race and ethnicity
White, non-Hispanic3 . . . . . . . . . . . Black, non-Hispanic3 . . . . . . . . . . . Hispanic or Latino . . . . . . . . . . . . .
24,247 3,147 3,177
161,943 16,527 13,498
2,432 625 547
84.1 81.1 67.7
83.3 79.0 64.8
85.0 83.1 70.6
12.8 12.8 25.1
12.1 11.1 22.4
13.5 14.5 27.7
3.1 6.2 7.2
2.8 5.2 6.0
3.3 7.1 8.4
Education
High school diploma, GED,4
or more . . . . . . . . . . . . . . . . . . No high school diploma or GED4 . . . .
20,993 9,974
137,396 58,201
2,221 1,015
82.6 82.0
81.7 81.0
83.6 83.0
14.1 13.5
13.2 12.6
14.9 14.3
3.3 4.5
3.0 4.0
3.6 5.0
Income level5
200% or higher . . . . . . . . . . . . . . Below 200% poverty level . . . . . . . .
19,079 12,276
124,515 73,429
2,090 1,304
83.2 81.2
82.3 80.1
84.1 82.2
13.6 14.3
12.8 13.4
14.4 15.2
3.2 4.5
2.8 4.1
3.5 4.9
Living arrangement
Living with a spouse or partner . . . . . Living alone. . . . . . . . . . . . . . . . . Living with others . . . . . . . . . . . . .
18,005 9,279 4,070
114,868 58,970 24,100
1,903 1,110
464
82.2 83.8 80.5
81.2 82.8 79.0
83.1 84.9 81.9
14.3 12.7 14.8
13.4 11.8 13.6
15.2 13.6 16.1
3.5 3.5 4.7
3.2 3.1 4.0
3.9 3.9 5.4
Chronic conditions
None or one . . . . . . . . . . . . . . . . Two or more . . . . . . . . . . . . . . . .
8,653 9,518
93,912 103,215
1,636 1,753
82.3 82.7
81.3 81.6
83.3 83.8
14.0 13.7
13.0 12.7
14.9 14.7
3.7 3.6
3.2 3.2
4.2 4.0
Self-reported health status
Excellent or very good . . . . . . . . . . Good . . . . . . . . . . . . . . . . . . . . . Fair or poor . . . . . . . . . . . . . . . . .
11,626 10,787 8,942
75,600 68,218 54,126
1,331 1,100 1,012
81.9 82.1 83.6
80.9 81.1 82.5
83.0 83.1 84.7
14.8 14.5 11.9
13.8 13.6 10.9
15.7 15.4 12.9
3.3 3.4 4.5
2.9 3.0 4.0
3.7 3.8 5.0
Any limitation
Yes . . . . . . . . . . . . . . . . . . . . . . No . . . . . . . . . . . . . . . . . . . . . .
11,875 6,365
127,400 70,498
2,106 1,371
83.4 81.0
82.4 79.7
84.3 82.3
12.9 15.5
12.1 14.3
13.8 16.7
3.7 3.5
3.3 3.0
4.1 4.1
Basic actions difficulty
Yes . . . . . . . . . . . . . . . . . . . . . . No . . . . . . . . . . . . . . . . . . . . . .
11,373 6,867
122,420 75,479
2,060 1,428
83.2 81.4
82.3 80.1
84.2 82.6
13.1 15.1
12.2 14.0
13.9 16.3
3.7 3.5
3.3 3.0
4.1 4.1
Movement difficulty
Yes . . . . . . . . . . . . . . . . . . . . . . No . . . . . . . . . . . . . . . . . . . . . .
Cognitive difficulty
9,731 8,440
104,218 92,919
1,869 1,634
83.4 81.5
82.4 80.3
84.4 82.6
12.8 15.0
11.9 14.0
13.7 16.1
3.8 3.5
3.4 3.0
4.2 4.0
Yes . . . . . . . . . . . . . . . . . . . . . . No . . . . . . . . . . . . . . . . . . . . . .
1,508 16,719
16,282 181,522
607 2,731
83.8 82.4
81.4 81.5
86.2 83.3
11.3 14.1
9.2 13.3
13.4 14.9
4.9 3.5
3.7 3.2
6.1 3.9
See footnotes at end of table.

National Health Statistics Reports n Number 84 n September 28, 2015 Page 15
Table 1. Medicare enrollment among noninstitutionalized Medicare beneficiaries aged 65 during the year following the NHIS interview, by selected characteristics: United States, 2000–2006—Con.
Number of persons Percentage in Medicare FFS1
Percentage in Medicare Advantage plan1
Percentage switched between FFS and Medicare HMO1
Characteristic Sample
size Number (in thousands)
Standard error (in
thousands) Percent
95% confidence interval
Lower bound
Upper bound Percent
95% confidence interval
Lower bound
Upper bound Percent
95% confidence interval
Lower bound
Upper bound
Emotional difficulty (K–6)
Yes . . . . . . . . . . . . . . . . . . . . . . No . . . . . . . . . . . . . . . . . . . . . .
546 17,469
5,519 189,761
285 2,867
82.5 82.5
78.8 81.6
86.2 83.4
9.6 14.0
6.7 13.2
12.6 14.8
†7.9 3.5
†5.3 3.1
†10.4 3.8
Seeing or hearing (sensory) difficulty
Yes . . . . . . . . . . . . . . . . . . . . . . No . . . . . . . . . . . . . . . . . . . . . .
4,943 13,295
54,070 143,809
1,147 2,281
83.4 82.2
82.1 81.2
84.7 83.1
13.1 14.1
11.9 13.3
14.3 15.0
3.5 3.7
3.0 3.3
4.1 4.1
Complex activity limitations
Yes . . . . . . . . . . . . . . . . . . . . . . No . . . . . . . . . . . . . . . . . . . . . .
6,584 11,656
68,069 129,829
1,394 2,070
84.9 81.3
83.7 80.2
86.1 82.3
11.0 15.3
10.0 14.4
12.1 16.3
4.1 3.4
3.6 3.0
4.6 3.8
Needs help with ADL6
Yes . . . . . . . . . . . . . . . . . . . . . . No . . . . . . . . . . . . . . . . . . . . . .
2,162 29,193
13,189 184,754
370 2,529
85.7 82.2
84.1 81.4
87.3 83.0
9.1 14.2
7.9 13.5
10.4 15.0
5.2 3.6
4.3 3.3
6.1 3.8
Leisure-time physical activity
Unable . . . . . . . . . . . . . . . . . . . . Inactive . . . . . . . . . . . . . . . . . . . Some or regular . . . . . . . . . . . . . .
1,086 8,281 8,818
11,470 85,939 99,824
501 1,721 1,834
83.9 82.2 82.7
81.0 81.0 81.6
86.9 83.3 83.8
11.5 13.8 14.1
8.8 12.7 13.2
14.1 14.8 15.1
†14.6 4.1 3.2
†3.2 3.6 2.7
†6.0 4.6 3.6
Smoking
Ever smoker . . . . . . . . . . . . . . . . Never smoked . . . . . . . . . . . . . . .
9,210 8,966
101,669 95,491
1,842 1,627
82.4 82.7
81.3 81.6
83.5 83.7
14.0 13.7
13.1 12.7
15.0 14.6
3.6 3.7
3.2 3.2
4.1 4.1
Hospitalized during the year prior to interview
Yes . . . . . . . . . . . . . . . . . . . . . . No . . . . . . . . . . . . . . . . . . . . . .
6,135 25,178
38,691 158,990
727 2,203
85.1 81.8
84.0 81.0
86.1 82.7
10.9 14.6
10.0 13.9
11.8 15.4
4.1 3.6
3.5 3.3
4.6 3.8
Medicaid (dual eligible)
Yes . . . . . . . . . . . . . . . . . . . . . . No . . . . . . . . . . . . . . . . . . . . . .
3,250 28,105
17,570 180,374
520 2,549
89.8 81.7
88.4 80.9
91.2 82.6
6.6 14.6
5.5 13.9
7.7 15.3
3.6 3.7
2.9 3.4
4.3 3.9
Private (supplemental) insurance
Yes . . . . . . . . . . . . . . . . . . . . . . No . . . . . . . . . . . . . . . . . . . . . .
19,004 12,351
125,128 72,815
2,004 1,322
87.1 74.4
86.3 73.1
88.0 75.7
10.3 20.0
9.6 18.8
11.1 21.1
2.5 5.6
2.2 5.1
2.8 6.1
† Estimate of low reliability (sample size between 30 and 59). 1During the year following the interview. 2Includes other racial and ethnic groups not shown separately and missing or unknown responses for poverty level, education, and marital status. 3Excludes those who reported two or more races. 4GED is General Educational Development high school equivalency diploma. 5Based on family income and family size. 6Activities of daily living include eating, bathing, dressing, or getting around inside the home.
SOURCE: CDC/NCHS, National Health Interview Survey, 2000–2005 linked to 2000–2006 Medicare data and NCHS 2011 Linked Mortality Files.

Table 2. Deaths during the year following the NHIS interview—Number, rates, and hospitalization and readmission status at the time of death among deceased noninstitutionalized Medicare FFS beneficiaries aged 65 and over, by selected characteristics: United States, 2000–2006
Percentage among deceased who died
Number of deaths in the year following the NHIS interview
Death rates per 100 persons
Within 30 days since discharge1
In the hospital, but not during a readmission stay
In more than 30 days after last discharge
Never being hospitalized after the NHIS interview
Characteristic Sample
size Number (in thousands)
Standard error
(in thousands) Rate
95% confidence interval
Lower bound
Upper bound Percent
95% confidence interval
Lower bound
Upper bound Percent
95% confidence interval
Lower bound
Upper bound Percent
95% confidence interval
Lower bound
Upper bound Percent
95% confidence interval
Lower bound
Upper bound
65 and over, age-adjusted2,3 . . . . . . 1,100 7,058 264 4.5 4.3 4.7 31.8 29.0 34.7 17.5 15.2 19.7 15.8 13.4 18.1 34.9 31.9 38.0
Age in years
65–74 . . . . . . . . . . . . . . . . . . . . 75–84 . . . . . . . . . . . . . . . . . . . . 85 and over. . . . . . . . . . . . . . . . .
330 448 322
2,013 2,912 2,132
119 157 135
2.3 4.9
12.7
2.1 4.5
11.3
2.5 5.3
14.1
32.0 33.9 28.9
27.1 28.9 23.9
36.9 38.8 33.9
†15.4 16.3 21.0
†11.2 12.9 16.7
†19.7 19.7 25.4
†15.2 15.1
†17.1
†10.5 11.4
†12.7
†19.9 18.8
†21.6
37.3 34.7 33.0
31.5 29.9 28.0
43.1 39.6 37.9
Sex2
Men . . . . . . . . . . . . . . . . . . . . . Women . . . . . . . . . . . . . . . . . . .
597 503
3,747 3,311
183 169
5.6 3.7
5.2 3.3
6.0 4.1
33.8 29.6
29.5 25.4
38.1 33.9
17.7 17.2
14.6 14.0
20.7 20.4
15.6 15.9
12.6 12.2
18.7 19.6
32.9 37.2
29.0 32.3
36.8 42.1
Race and ethnicity2
White, non-Hispanic4 . . . . . . . . . . . Black, non-Hispanic4 . . . . . . . . . . . Hispanic or Latino . . . . . . . . . . . . .
861 135 90
5,857 721 383
247 71 54
4.4 5.8 4.6
4.0 4.8 3.4
4.8 6.8 5.8
32.1 †29.5 †35.0
29.0 †21.4 †24.2
35.2 †37.6 †45.8
17.9 * *
15.4 * *
20.3 * *
15.8 * *
13.3 * *
18.4 * *
34.2 †35.5 †36.7
30.9 †26.5 †25.5
37.5 †44.6 †48.0
Education2
High school diploma, GED5 , or more . . . . . . . . . . . . . . . . . .
No high school diploma or GED5 . . . . 612 448
4,051 2,774
189 158
4.0 5.5
3.6 4.9
4.4 6.1
30.0 35.1
26.3 30.3
33.7 39.8
17.4 17.5
14.4 14.0
20.4 21.0
14.4 17.1
11.5 12.9
17.2 21.3
38.2 30.3
34.3 25.6
42.2 35.0
Income level2,6
200% or higher . . . . . . . . . . . . . . Below 200% poverty level . . . . . . . .
580 520
3,832 3,226
198 165
4.2 5.2
3.8 4.8
4.6 5.6
29.6 34.5
25.7 30.0
33.6 38.9
18.2 16.7
14.8 13.6
21.5 19.7
16.5 14.9
13.2 11.4
19.7 18.4
35.8 33.9
31.7 29.3
39.9 38.6
Living arrangement2
Living with a spouse or partner . . . . . Living alone. . . . . . . . . . . . . . . . . Living with others . . . . . . . . . . . . .
536 324 240
3,434 2,102 1,522
168 127 102
4.7 3.8 6.9
4.3 3.4 5.9
5.1 4.2 7.9
32.9 30.9 30.7
28.9 26.0 24.0
36.9 35.8 37.5
17.2 †17.4 †18.2
14.1 †13.1 †13.0
20.4 †21.6 †23.4
16.0 †14.0 †17.7
12.6 †9.6
†11.9
19.3 †18.4 †23.5
33.9 37.8 33.4
29.8 32.3 26.7
38.1 43.3 40.0
Chronic conditions2
None or one . . . . . . . . . . . . . . . . Two or more . . . . . . . . . . . . . . . .
159 439
1,652 5,147
145 324
2.4 6.1
2.0 5.3
2.8 6.9
29.1 34.9
21.0 30.0
37.2 39.9
* 20.3
* 15.7
* 24.9
* 15.1
* 10.6
* 19.6
44.4 29.7
35.0 24.7
53.7 34.6
Self-reported health status2
Excellent or very good . . . . . . . . . . Good . . . . . . . . . . . . . . . . . . . . . Fair or poor . . . . . . . . . . . . . . . . .
147 267 686
959 1,749 4,350
82 125 192
1.9 3.2 9.3
1.5 2.8 8.5
2.3 3.6
10.1
†31.3 29.4 32.9
†23.6 23.4 29.1
†39.1 35.4 36.7
* †16.9 18.1
* †12.1 15.1
* †21.7 21.1
* †14.1 17.3
* †9.7 14.2
* †18.5 20.4
41.5 39.6 31.6
32.9 33.7 28.1
50.0 45.6 35.2
See footnotes at end of table.
Page 16
National H
ealth Statistics R
eports n N
umber 84
n Septem
ber 28, 2015

Table 2. Deaths during the year following the NHIS interview—Number, rates, and hospitalization and readmission status at the time of death among deceased noninstitutionalized Medicare FFS beneficiaries aged 65 and over, by selected characteristics: United States, 2000–2006—Con.
Percentage among deceased who died
Number of deaths in the year following the NHIS interview
Death rates per 100 persons
Within 30 days since discharge1
In the hospital, but not during a readmission stay
In more than 30 days after last discharge
Never being hospitalized after the NHIS interview
Characteristic Sample
size Number (in thousands)
Standard error
(in thousands) Rate
95% confidence interval
Lower bound
Upper bound Percent
95% confidence interval
Lower bound
Upper bound Percent
95% confidence interval
Lower bound
Upper bound Percent
95% confidence interval
Lower bound
Upper bound Percent
95% confidence interval
Lower bound
Upper bound
Any limitation2
Yes . . . . . . . . . . . . . . . . . . . . . . No . . . . . . . . . . . . . . . . . . . . . .
528 70
6,009 789
344 115
5.4 1.8
4.8 1.5
6.0 2.3
33.9 *
29.3 *
38.4 *
19.0 *
14.8 *
23.1 *
15.1 *
11.1 *
19.1 *
32.1 †41.8
27.3 †28.3
36.9 †55.3
Basic actions difficulty2
Yes . . . . . . . . . . . . . . . . . . . . . . No . . . . . . . . . . . . . . . . . . . . . .
507 91
5,777 1,022
337 130
5.4 2.1
4.8 1.5
6.0 2.7
34.6 *
29.9 *
39.2 *
19.3 *
15.1 *
23.6 *
15.0 *
10.9 *
19.1 *
31.1 45.2
26.3 32.8
35.9 57.5
Movement difficulty2
Yes . . . . . . . . . . . . . . . . . . . . . . No . . . . . . . . . . . . . . . . . . . . . .
468 118
5,312 1,329
317 150
5.8 2.1
5.2 1.7
6.4 2.5
34.1 †31.3
29.0 †22.7
39.2 †39.9
19.5 *
15.1 *
23.8 *
15.6 *
11.2 *
19.9 *
30.9 †42.0
26.0 †32.0
35.8 †52.1
Cognitive difficulty2
Yes . . . . . . . . . . . . . . . . . . . . . . No . . . . . . . . . . . . . . . . . . . . . .
141 456
1,764 5,026
175 308
10.4 3.6
8.4 3.2
12.4 4.0
†32.9 33.8
†23.6 28.7
†42.1 38.9
* 18.3
* 13.9
* 22.7
* 16.7
* 11.9
* 21.5
38.7 31.2
29.6 25.9
47.7 36.5
Emotional difficulty (K–6)2
Yes . . . . . . . . . . . . . . . . . . . . . . No . . . . . . . . . . . . . . . . . . . . . .
47 523
†527 5,899
†90.1 337
†11.4 3.9
†8.1 3.5
†14.7 4.3
* 32.9
* 28.6
* 37.3
* 17.9
* 14.0
* 21.9
* 16.1
* 12.0
* 20.3
* 33.0
* 28.3
* 37.8
Seeing or hearing (sensory) difficulty2
Yes . . . . . . . . . . . . . . . . . . . . . . No . . . . . . . . . . . . . . . . . . . . . .
239 358
2,788 3,998
249 268
5.7 3.8
4.7 3.4
6.7 4.2
33.5 33.7
26.1 28.4
40.8 38.9
†22.0 †15.2
†15.1 †10.9
†28.8 †19.5
†15.6 †14.8
†8.3 †10.6
†23.0 †19.1
29.0 36.3
22.2 30.4
35.8 42.2
Complex activity limitations2
Yes . . . . . . . . . . . . . . . . . . . . . . No . . . . . . . . . . . . . . . . . . . . . .
420 178
4,920 1,879
310 173
7.9 2.1
6.9 1.7
8.9 2.5
33.6 33.4
28.4 26.0
38.7 40.8
19.2 *
14.6 *
23.8 *
15.9 *
11.4 *
20.4 *
31.4 38.2
26.2 30.2
36.5 46.1
Needs help with ADL2,7
Yes . . . . . . . . . . . . . . . . . . . . . . No . . . . . . . . . . . . . . . . . . . . . .
355 745
2,246 4,812
129 210
17.9 3.4
15.7 3.2
20.1 3.6
29.2 33.1
23.7 29.5
34.6 36.7
19.4 16.6
15.4 13.7
23.3 19.5
16.2 15.5
12.4 12.5
20.1 18.5
35.2 34.8
30.1 30.9
40.4 38.7
Leisure-time physical activity2
Unable . . . . . . . . . . . . . . . . . . . . Inactive . . . . . . . . . . . . . . . . . . . Some or regular . . . . . . . . . . . . . .
104 366 127
1,045 4,161 1,586
119 289 173
10.3 5.7 2.2
8.1 4.9 1.8
12.5 6.5 2.6
†39.2 33.0
†30.9
†29.0 27.5
†21.7
†49.4 38.5
†40.2
* 20.4
*
* 15.4
*
* 25.4
*
* †14.0
*
* †8.7
*
* †19.2
*
†27.9 32.7
†38.3
†17.8 26.7
†28.1
†38.1 38.7
†48.6
See footnotes at end of table.
National H
ealth Statistics R
eports n N
umber 84
n Septem
ber 28, 2015 P
age 17

Table 2. Deaths during the year following the NHIS interview—Number, rates, and hospitalization and readmission status at the time of death among deceased noninstitutionalized Medicare FFS beneficiaries aged 65 and over, by selected characteristics: United States, 2000–2006—Con.
Percentage among deceased who died
Number of deaths in the year Death rates per Within 30 days In the hospital, but not In more than 30 days Never being hospitalized following the NHIS interview 100 persons since discharge1 during a readmission stay after last discharge after the NHIS interview
95% confidence 95% confidence 95% confidence 95% confidence 95% confidence interval interval interval interval interval
Standard Sample Number (in error Lower Upper Lower Upper Lower Upper Lower Upper Lower Upper
Characteristic size thousands) (in thousands) Rate bound bound Percent bound bound Percent bound bound Percent bound bound Percent bound bound
Smoking2
Ever smoker . . . . . . . . . . . . . . . . 346 4,045 257 5.3 4.7 5.9 33.3 27.6 38.9 19.6 14.3 25.0 †15.0 †9.3 †20.6 32.2 27.0 37.4 Never smoked . . . . . . . . . . . . . . . 247 2,650 221 3.2 2.6 3.8 34.6 27.7 41.5 †16.1 †10.9 †21.3 †15.4 †10.1 †20.6 34.0 26.9 41.1
Hospitalized during the year prior to interview2
Yes . . . . . . . . . . . . . . . . . . . . . . 507 3,278 154 9.6 8.8 10.4 33.9 29.5 38.2 22.3 18.5 26.1 17.8 14.3 21.4 26.0 21.9 30.0 No . . . . . . . . . . . . . . . . . . . . . . 591 3,765 182 3.1 2.9 3.3 29.8 25.9 33.7 13.3 10.6 16.0 14.0 11.0 16.9 42.9 38.6 47.2
Medicaid (dual eligible)2
Yes . . . . . . . . . . . . . . . . . . . . . . 166 940 76 6.1 5.1 7.1 37.0 28.5 45.5 †18.0 †11.5 †24.4 * * * †35.8 †27.5 †43.0 No . . . . . . . . . . . . . . . . . . . . . . 934 6,119 255 4.3 3.9 4.7 31.0 28.1 34.0 17.4 14.9 19.9 16.7 14.1 19.3 34.9 31.6 38.2
Private (supplemental) insurance2
Yes . . . . . . . . . . . . . . . . . . . . . . 638 4,251 207 4.1 3.7 4.5 32.1 28.3 35.8 18.3 15.3 21.2 16.5 13.5 19.6 33.2 29.4 37.0 No . . . . . . . . . . . . . . . . . . . . . . 462 2,807 148 5.3 4.7 5.9 31.5 26.9 36.1 16.3 12.6 19.9 14.6 11.0 18.2 37.6 32.7 42.5
† Estimate of low reliability (sample size between 30 and 59). * Figure does not meet standards of reliability or precision. 1Includes those who died during readmission hospital stay. 2Rates and percentages are age-adjusted to the 2000 standard population using age groups 65–74, 75–84, and 85 and over. 3Includes other racial and ethnic groups not shown separately and missing or unknown responses for poverty level, education, and marital status. 4Excludes those who reported two or more races. 5GED is General Educational Development high school equivalency diploma. 6Based on family income and family size. 7Activities of daily living include eating, bathing, dressing, or getting around inside the home.
NOTE: FFS is fee-for-service.
SOURCE: CDC/NCHS, National Health Interview Survey, 2000–2005 linked to 2000–2006 Medicare data and NCHS 2011 Linked Mortality Files.
Page 18
National H
ealth Statistics R
eports n N
umber 84
n Septem
ber 28, 2015

National Health Statistics Reports n Number 84 n September 28, 2015 Page 19
Table 3. Percentage of noninstitutionalized Medicare FFS beneficiaries aged 65 and over who were hospitalized, readmitted, or died within 30 days after discharge during the year following the NHIS interview, by selected characteristics: United States, 2000–2006
Percentage hospitalized at least once during the year
following the NHIS interview Percentage died within
30 days after discharge1
Percentage readmitted within 30 days after discharge at least once
Percentage readmitted at least once or died
within 30 days after discharge1
95% confidence interval
95% confidence interval
95% confidence interval
95% confidence interval
Characteristic Percent Lower bound
Upper bound Percent
Lower bound
Upper bound Percent
Lower bound
Upper bound Percent
Lower bound
Upper bound
65 and over, age-adjusted2,3 . . . . . . 21.6 21.0 22.2 1.5 1.3 1.7 4.1 3.9 4.3 4.8 4.6 5.0
Age in years
65–74 . . . . . . . . . . . . . . . . . . . . 75–84 . . . . . . . . . . . . . . . . . . . . 85 and over. . . . . . . . . . . . . . . . .
16.7 24.4 34.3
16.0 23.5 32.2
17.4 25.3 36.3
0.8 1.8 3.9
0.6 1.5 3.2
1.0 2.1 4.6
3.0 4.5 7.6
2.8 4.0 6.4
3.2 4.9 8.7
3.4 5.4 9.4
3.0 4.9 8.1
3.7 5.9
10.6
Sex2
Men . . . . . . . . . . . . . . . . . . . . . Women . . . . . . . . . . . . . . . . . . .
22.1 21.2
21.1 20.4
23.1 22.0
2.0 1.2
1.8 1.0
2.2 1.4
4.5 3.7
4.1 3.3
4.9 4.1
5.5 4.3
5.1 3.9
5.9 4.7
Race and ethnicity2
White, non-Hispanic4 . . . . . . . . . . . Black, non-Hispanic4 . . . . . . . . . . . Hispanic or Latino . . . . . . . . . . . . .
21.5 24.7 22.3
20.9 22.5 20.1
22.1 26.9 24.5
1.5 †1.9 †1.8
1.3 †1.3 †1.0
1.7 †2.5 †2.6
4.0 5.4 4.3
3.8 4.4 3.3
4.2 6.4 5.3
4.7 6.2 5.2
4.3 5.2 4.2
5.1 7.2 6.2
Education2
High school diploma, GED5 , or more . . . . . . . . . . . . . . . . . .
No high school diploma or GED5 . . . . 19.9 25.2
19.3 24.0
20.5 26.4
1.3 2.0
1.1 1.6
1.5 2.4
3.4 5.7
3.2 5.1
3.6 6.3
4.0 6.6
3.6 6.0
4.4 7.2
Income level2,6
200% or higher . . . . . . . . . . . . . . Below 200% poverty level . . . . . . . .
19.9 24.7
19.1 23.7
20.7 25.7
1.3 1.9
1.1 1.5
1.5 2.3
3.4 5.4
3.0 4.8
3.8 6.0
4.1 6.2
3.7 5.6
4.5 6.8
Living arrangement2
Living with a spouse or partner . . . . . Living alone. . . . . . . . . . . . . . . . . Living with others . . . . . . . . . . . . .
21.1 21.9 24.5
20.3 20.9 22.9
21.9 22.9 26.1
1.6 1.4 2.2
1.4 1.2 1.6
1.8 1.6 2.8
3.7 4.5 5.4
3.3 3.9 4.6
4.1 5.1 6.2
4.4 5.1 6.5
4.0 4.5 5.5
4.8 5.7 7.5
Chronic conditions2
None or one . . . . . . . . . . . . . . . . Two or more . . . . . . . . . . . . . . . .
15.1 27.3
14.1 26.1
16.1 28.5
†0.7 2.3
†0.5 1.9
†0.9 2.7
2.2 6.1
1.8 5.5
2.6 6.7
2.6 7.2
2.2 6.4
3.0 8.0
Self-reported health status2
Excellent or very good . . . . . . . . . . Good . . . . . . . . . . . . . . . . . . . . . Fair or poor . . . . . . . . . . . . . . . . .
14.1 20.5 33.3
13.3 19.5 32.1
14.9 21.5 34.5
†0.7 1.1 3.2
†0.5 0.9 2.8
†0.9 1.3 3.6
1.9 3.5 7.7
1.5 3.1 6.9
2.3 3.9 8.5
2.2 4.1 9.1
1.8 3.7 8.3
2.6 4.5 9.9
Any limitation2
Yes . . . . . . . . . . . . . . . . . . . . . . No . . . . . . . . . . . . . . . . . . . . . .
25.9 13.4
24.9 12.2
26.9 14.6
2.0 0.7
1.6 0.3
2.4 1.1
5.2 2.5
4.6 1.9
5.8 3.1
6.3 2.8
5.7 2.2
6.9 3.4
Basic actions difficulty2
Yes . . . . . . . . . . . . . . . . . . . . . . No . . . . . . . . . . . . . . . . . . . . . .
26.2 13.6
25.2 12.4
27.2 14.8
2.0 0.7
1.6 0.5
2.4 0.9
5.3 2.7
4.7 2.1
5.9 3.3
6.3 2.9
5.7 2.3
6.9 3.5
Movement difficulty2
Yes . . . . . . . . . . . . . . . . . . . . . . No . . . . . . . . . . . . . . . . . . . . . .
27.9 13.8
26.7 12.8
29.1 14.8
2.2 0.8
1.8 0.6
2.6 1.0
5.6 2.5
5.0 2.1
6.2 2.9
6.7 2.9
6.1 2.5
7.3 3.3
See footnotes at end of table.

Page 20 National Health Statistics Reports n Number 84 n September 28, 2015
Table 3. Percentage of noninstitutionalized Medicare FFS beneficiaries aged 65 and over who were hospitalized, readmitted, or died within 30 days after discharge during the year following the NHIS interview, by selected characteristics: United States, 2000–2006—Con.
Percentage hospitalized at least once during the year
following the NHIS interview Percentage died within
30 days after discharge1
Percentage readmitted within 30 days after discharge at least once
Percentage readmitted at least once or died
within 30 days after discharge1
95% confidence interval
95% confidence interval
95% confidence interval
95% confidence interval
Characteristic Percent Lower bound
Upper bound Percent
Lower bound
Upper bound Percent
Lower bound
Upper bound Percent
Lower bound
Upper bound
Cognitive difficulty2
Yes . . . . . . . . . . . . . . . . . . . . . . No . . . . . . . . . . . . . . . . . . . . . .
29.6 20.7
26.5 19.9
32.7 21.5
3.7 1.3
2.3 1.1
5.1 1.5
6.6 4.0
4.6 3.6
8.6 4.4
8.4 4.7
6.4 4.3
10.4 5.1
Emotional difficulty (K–6)2
Yes . . . . . . . . . . . . . . . . . . . . . . No . . . . . . . . . . . . . . . . . . . . . .
32.8 20.8
27.3 20.0
38.3 21.6
* 1.4
* 1.2
* 1.6
†9.3 4.0
†6.4 3.6
†12.2 4.4
†12.2 4.7
†8.5 4.3
†15.9 5.1
Seeing or hearing (sensory) difficulty2
Yes . . . . . . . . . . . . . . . . . . . . . . No . . . . . . . . . . . . . . . . . . . . . .
26.2 19.9
24.6 19.1
27.8 20.7
2.1 1.3
1.5 1.1
2.7 1.5
5.7 3.8
4.7 3.4
6.7 4.2
6.7 4.4
5.7 4.0
7.7 4.8
Complex activity limitations2
Yes . . . . . . . . . . . . . . . . . . . . . . No . . . . . . . . . . . . . . . . . . . . . .
31.3 16.1
29.7 15.3
32.9 16.9
2.9 0.8
2.3 0.6
3.5 1.0
7.2 2.7
6.4 2.3
8.0 3.1
8.6 3.1
7.6 2.7
9.6 3.5
Needs help with ADL2,7
Yes . . . . . . . . . . . . . . . . . . . . . . No . . . . . . . . . . . . . . . . . . . . . .
43.2 20.1
40.5 19.5
45.9 20.7
6.0 1.2
4.6 1.0
7.4 1.4
12.9 3.5
11.1 3.3
14.7 3.7
15.6 4.1
13.6 3.9
17.6 4.3
Leisure-time physical activity2
Unable . . . . . . . . . . . . . . . . . . . . Inactive . . . . . . . . . . . . . . . . . . . Some or regular . . . . . . . . . . . . . .
38.6 24.5 16.6
34.3 23.3 15.6
42.9 25.7 17.6
†4.6 2.0
†0.7
†3.2 1.6
†0.5
†6.0 2.4
†0.9
9.8 5.1 2.8
7.4 4.5 2.4
12.2 5.7 3.2
11.6 6.0 3.2
9.2 5.2 2.6
14.0 6.8 3.8
Smoking2
Ever smoker . . . . . . . . . . . . . . . . Never smoked . . . . . . . . . . . . . . .
23.5 19.2
22.3 18.2
24.7 20.2
1.9 1.2
1.5 0.8
2.3 1.6
5.1 3.4
4.5 2.8
5.7 4.0
6.0 4.0
5.4 3.4
6.6 4.6
Hospitalized during the year prior to interview2
Yes . . . . . . . . . . . . . . . . . . . . . . No . . . . . . . . . . . . . . . . . . . . . .
36.6 17.8
35.0 17.2
38.2 18.4
3.4 1.0
2.8 0.8
4.0 1.2
8.9 2.9
8.1 2.7
9.7 3.1
10.4 3.4
9.4 3.2
11.4 3.6
Medicaid (dual eligible)2
Yes . . . . . . . . . . . . . . . . . . . . . . No . . . . . . . . . . . . . . . . . . . . . .
27.5 21.0
25.7 20.4
29.3 21.6
2.4 1.5
1.8 1.3
3.0 1.7
6.4 3.8
5.4 3.6
7.4 4.0
7.6 4.5
6.4 4.3
8.8 4.7
Private (supplemental) insurance2
Yes . . . . . . . . . . . . . . . . . . . . . . No . . . . . . . . . . . . . . . . . . . . . .
21.2 22.4
20.6 21.4
21.8 23.4
1.4 1.8
1.2 1.4
1.6 2.2
3.8 4.6
3.4 4.2
4.2 5.0
4.5 5.4
4.1 4.8
4.9 6.0
† Estimate of low reliability (sample size between 30 and 59). * Figure does not meet standards of reliability or precision. 1Includes those who died during readmission hospital stay. 2Percentages are age-adjusted to the 2000 standard population using age groups 65–74, 75–84, and 85 and over. 3Includes other racial and ethnic groups not shown separately and missing or unknown responses for poverty level, education, and marital status. 4Excludes those who reported two or more races. 5GED is General Educational Development high school equivalency diploma. 6Based on family income and family size. 7Activities of daily living include eating, bathing, dressing, or getting around inside the home.
SOURCE: CDC/NCHS, National Health Interview Survey, 2000–2005 linked to 2000–2006 Medicare data and NCHS 2011 Linked Mortality Files.

Table 4. Hospital discharge and readmission rates among noninstitutionalized Medicare FFS beneficiaries aged 65 and over during the year after the NHIS interview, by selected characteristics: United States 2000–2006
Number of discharges during the year following the NHIS interview Discharge rates per 1,000 persons
Live discharge1 rates per 1,000 persons Number of readmissions
Readmission rate per 100 live discharges1
95% confidence interval
95% confidence interval
95% confidence interval
Standard Standard Sample Number (in error (in Lower Upper Lower Upper Sample Number (in error (in Lower Upper
Characteristic size thousands) thousands) Rate bound bound Rate bound bound size thousands) thousands) Rate bound bound
65 and over, age-adjusted2,3. . . . . . 8,828 56,069 1,270 348.4 337.2 359.6 336.9 326.0 347.8 1,491 9,447 379 17.3 16.4 18.2
Age in years
65–74 . . . . . . . . . . . . . . . . . . . . 3,737 22,905 689 264.0 251.0 277.1 258.8 246.0 271.6 626 3,800 216 16.9 15.6 18.3 75–84 . . . . . . . . . . . . . . . . . . . . 3,610 23,416 700 392.5 374.9 410.1 380.5 363.3 397.7 603 3,919 247 17.3 15.8 18.8 85 and over. . . . . . . . . . . . . . . . . 1,481 9,748 471 580.1 536.0 624.1 543.2 500.3 586.1 262 1,729 155 18.9 16.5 21.3
Sex2
Men . . . . . . . . . . . . . . . . . . . . . 4,020 25,324 817 358.5 340.3 376.6 343.6 326.1 361.0 698 4,390 253 17.9 16.6 19.2 Women . . . . . . . . . . . . . . . . . . . 4,808 30,744 839 341.1 326.1 356.1 332.0 317.2 346.7 793 5,058 290 16.8 15.4 18.2
Race and ethnicity2
White, non-Hispanic4 . . . . . . . . . . 6,863 46,504 1,156 343.6 331.7 355.6 332.2 320.5 343.9 1,124 7,709 344 17.0 15.9 18.0 Black, non-Hispanic4 . . . . . . . . . . 1,092 5,622 347 433.0 390.0 476.0 416.7 375.1 458.3 216 1,084 112 20.1 17.1 23.0 Hispanic or Latino . . . . . . . . . . . . . 771 3,199 266 383.3 335.9 430.7 374.3 328.1 420.5 138 565 88 17.8 13.9 21.7
Education2
High school diploma, GED5 , or more . . . . . . . . . . . . . . . . . . 5,101 33,579 925 307.3 295.2 319.5 296.8 285.0 308.7 773 5,046 252 15.4 14.4 16.5
No high school diploma or GED5 . . . . 3,582 21,574 775 440.8 416.0 465.6 427.1 402.7 451.4 702 4,305 288 20.6 18.8 22.4
Income level2,6
200% or higher . . . . . . . . . . . . . . 4,619 30,333 891 307.0 294.0 320.1 296.6 283.9 309.2 712 4,619 256 15.5 14.3 16.7 Below 200% poverty level . . . . . . . . 4,209 25,736 838 425.5 403.1 447.8 411.8 390.1 433.6 779 4,829 303 19.5 17.8 21.1
Living arrangement2
Living with a spouse or partner . . . . . 4,417 28,321 821 330.5 314.9 346.1 317.6 302.6 332.5 691 4,356 234 15.9 14.7 17.1 Living alone. . . . . . . . . . . . . . . . . 2,939 18,899 716 365.1 342.2 387.9 356.4 333.9 378.9 520 3,380 256 18.4 16.4 20.4 Living with others . . . . . . . . . . . . . 1,472 8,848 408 428.8 391.0 466.5 410.9 374.2 447.5 280 1,712 164 20.9 17.6 24.2
Chronic conditions2
None or one . . . . . . . . . . . . . . . . 1,528 15,961 693 217.0 200.7 233.3 212.8 196.7 229.0 202 2,071 213 12.7 10.6 14.8 Two or more . . . . . . . . . . . . . . . . 3,703 40,367 1,331 472.8 446.7 498.9 455.4 429.9 480.9 699 7,989 537 20.5 18.6 22.4
Self-reported health status2
Excellent or very good . . . . . . . . . . 1,734 11,396 460 199.7 185.8 213.5 194.3 180.7 207.9 210 1,362 126 12.0 10.4 13.6 Good . . . . . . . . . . . . . . . . . . . . . 2,668 17,252 578 310.2 293.3 327.1 303.0 286.1 319.9 405 2,615 177 15.4 13.8 16.9 Fair or poor . . . . . . . . . . . . . . . . . 4,426 27,421 858 599.4 570.5 628.3 575.1 547.0 603.1 876 5,471 325 20.7 19.2 22.3
See footnotes at end of table.
National H
ealth Statistics R
eports n N
umber 84
n Septem
ber 28, 2015 P
age 21

Table 4. Hospital discharge and readmission rates among noninstitutionalized Medicare FFS beneficiaries aged 65 and over during the year after the NHIS interview, by selected characteristics: United States 2000–2006—Con.
Number of discharges during the year following the NHIS interview Discharge rates per 1,000 persons
Live discharge1 rates per 1,000 persons Number of readmissions
Readmission rate per 100 live discharges1
95% confidence interval
95% confidence interval
95% confidence interval
Characteristic Sample
size Number (in thousands)
Standard error (in
thousands) Rate Lower bound
Upper bound Rate
Lower bound
Upper bound
Sample size
Number (in thousands)
Standard error (in
thousands) Rate Lower bound
Upper bound
Any limitation2
Yes . . . . . . . . . . . . . . . . . . . . . . No . . . . . . . . . . . . . . . . . . . . . .
6,834 1,994
46,555 9,870
1,471 559
432.9 203.6
410.6 180.5
455.2 226.7
418.2 200.0
396.6 177.2
439.8 222.7
1,201 290
8,541 1,541
548 194
18.9 15.8
17.2 13.0
20.6 18.6
Basic actions difficulty2
Yes . . . . . . . . . . . . . . . . . . . . . . No . . . . . . . . . . . . . . . . . . . . . .
5,801 3,027
45,362 11,063
1,469 583
439.2 206.1
415.8 184.9
462.5 227.3
424.3 201.8
401.7 180.9
446.9 222.7
1,024 467
8,297 1,785
545 198
18.8 16.4
17.1 13.8
20.5 19.0
Movement difficulty2
Yes . . . . . . . . . . . . . . . . . . . . . . No . . . . . . . . . . . . . . . . . . . . . .
5,078 3,685
41,781 14,004
1,431 604
473.5 202.1
446.7 185.5
500.2 218.7
457.3 198.0
431.4 181.7
483.3 214.2
894 577
7,730 2,096
539 188
19.0 15.3
17.2 13.1
20.8 17.4
Cognitive difficulty2
Yes . . . . . . . . . . . . . . . . . . . . . . No . . . . . . . . . . . . . . . . . . . . . .
1,344 7,477
7,827 48,551
549 1,434
540.6 333.4
467.2 317.0
613.9 349.8
512.8 323.9
442.5 307.9
583.1 340.0
265 1,225
1,449 8,621
207 526
19.2 18.2
14.9 16.7
23.4 19.7
Emotional difficulty (K–6)2
Yes . . . . . . . . . . . . . . . . . . . . . . No . . . . . . . . . . . . . . . . . . . . . .
309 4,777
3,124 51,420
357 1,521
692.2 334.0
554.4 318.1
830.0 350.0
660.0 323.9
524.3 308.2
795.8 339.6
56 810
†612 8,957
†122 531
†20.5 17.8
†15.2 16.4
†25.8 19.2
Seeing or hearing (sensory) difficulty2
Yes . . . . . . . . . . . . . . . . . . . . . . No . . . . . . . . . . . . . . . . . . . . . .
1,922 3,315
20,943 35,457
967 1,188
454.8 316.2
416.8 297.8
492.9 334.6
437.0 307.7
400.3 289.7
473.8 325.7
352 550
4,125 5,957
402 416
20.7 17.1
17.9 15.5
23.6 18.7
Complex activity limitations2
Yes . . . . . . . . . . . . . . . . . . . . . . No . . . . . . . . . . . . . . . . . . . . . .
4,969 3,859
32,992 23,433
1,246 842
562.9 237.2
526.1 222.6
599.8 251.7
540.2 233.2
504.4 218.8
575.9 247.5
920 571
6,590 3,492
514 294
20.8 15.0
18.6 13.1
23.0 16.8
Needs help with ADL2,7
Yes . . . . . . . . . . . . . . . . . . . . . . No . . . . . . . . . . . . . . . . . . . . . .
1,616 7,212
9,666 46,403
454 1,157
875.0 314.1
797.5 303.0
952.4 325.2
828.3 305.6
752.1 294.7
904.4 316.4
377 1,114
2,227 7,221
178 330
25.4 15.9
22.9 14.9
27.9 16.8
Leisure-time physical activity2
Unable . . . . . . . . . . . . . . . . . . . . Inactive . . . . . . . . . . . . . . . . . . . Some or regular . . . . . . . . . . . . . .
676 2,813 1,738
7,592 29,571 19,136
659 1,124
835
781.2 411.7 243.1
670.1 385.0 225.3
892.3 438.4 260.8
749.2 396.1 238.8
645.0 370.0 221.6
853.3 422.2 256.0
140 501 258
1,735 5,384 2,935
303 394 287
22.7 19.0 15.5
18.1 17.0 13.4
27.2 21.1 17.7
See footnotes at end of table.
Page 22
National H
ealth Statistics R
eports n N
umber 84
n Septem
ber 28, 2015

Table 4. Hospital discharge and readmission rates among noninstitutionalized Medicare FFS beneficiaries aged 65 and over during the year after the NHIS interview, by selected characteristics: United States 2000–2006—Con.
Number of discharges during the year following the NHIS interview Discharge rates per 1,000 persons
Live discharge1 rates per 1,000 persons Number of readmissions
Readmission rate per 100 live discharges1
95% confidence interval
95% confidence interval
95% confidence interval
Characteristic Sample
size Number (in thousands)
Standard error (in
thousands) Rate Lower bound
Upper bound Rate
Lower bound
Upper bound
Sample size
Number (in thousands)
Standard error (in
thousands) Rate Lower bound
Upper bound
Smoking2
Ever smoker . . . . . . . . . . . . . . . . Never smoked . . . . . . . . . . . . . . .
2,937 2,267
32,338 23,730
1,152 1,041
402.5 294.0
377.6 272.5
427.4 315.6
387.1 286.2
362.6 265.1
411.6 307.4
551 346
6,232 3,808
447 378
20.0 15.3
18.1 13.2
21.9 17.4
Hospitalized during the year prior to interview2
Yes . . . . . . . . . . . . . . . . . . . . . . No . . . . . . . . . . . . . . . . . . . . . .
3,598 5,218
22,603 33,395
727 822
677.8 264.4
641.7 254.8
713.8 273.9
648.5 257.8
613.5 248.5
683.4 267.1
740 748
4,654 4,774
275 227
21.5 14.5
19.8 13.5
23.2 15.5
Medicaid (dual eligible)2
Yes . . . . . . . . . . . . . . . . . . . . . . No . . . . . . . . . . . . . . . . . . . . . .
1,442 7,386
7,936 48,133
421 1,159
509.4 331.1
465.1 320.0
553.6 342.3
494.4 320.0
450.7 309.2
538.2 330.8
273 1,218
1,498 7,949
173 336
19.2 17.0
16.1 16.0
22.2 17.9
Private (supplemental) insurance2
Yes . . . . . . . . . . . . . . . . . . . . . . No . . . . . . . . . . . . . . . . . . . . . .
5,401 3,427
35,668 20,401
976 707
331.9 381.0
319.2 360.1
344.7 402.0
320.9 368.5
308.4 348.1
333.5 388.8
869 622
5,696 3,752
288 251
16.3 18.9
15.2 17.1
17.5 20.6
† Estimate of low reliability (sample size between 30 and 59). 1Hospital discharge with a status ‘‘discharged alive’’ on an inpatient claim. 2Rates are age-adjusted to the 2000 standard population using age groups 65–74, 75–84, and 85 and over. 3Includes other racial and ethnic groups not shown separately and missing or unknown responses for poverty level, education, and marital status. 4Excludes those who reported two or more races. 5GED is General Educational Development high school equivalency diploma. 6Based on family income and family size. 7Activities of daily living include eating, bathing, dressing, or getting around inside the home.
NOTE: FFS is fee-for-service.
SOURCE: CDC/NCHS, National Health Interview Survey, 2000–2005 linked to 2000–2006 Medicare data and NCHS 2011 Linked Mortality Files.
National H
ealth Statistics R
eports n N
umber 84
n Septem
ber 28, 2015 P
age 23

U.S. DEPARTMENT OF HEALTH & HUMAN SERVICES
Centers for Disease Control and Prevention National Center for Health Statistics 3311 Toledo Road, Room 5419 Hyattsville, MD 20782–2064
FIRST CLASS MAIL POSTAGE & FEES PAID
CDC/NCHS PERMIT NO. G-284
OFFICIAL BUSINESS PENALTY FOR PRIVATE USE, $300
For more NCHS NHSRs, visit: http://www.cdc.gov/nchs/products/nhsr.htm.
National Health Statistics Reports n Number 84 n September 28, 2015
Acknowledgments The authors would like to acknowledge NCHS staff Maria Owings (retired), Alan Simon, and Anita Bercovitz for their contributions to this report.
Suggested citation
Gorina Y, Pratt LA, Kramarow EA, Elgaddal N. Hospitalization, readmission, and death experience of noninstitutionalized Medicare fee-for-service beneficiaries aged 65 and over. National health statistics reports; no 84. Hyattsville, MD: National Center for Health Statistics. 2015.
Copyright information
All material appearing in this report is in the public domain and may be reproduced or copied without permission; citation as to source, however, is appreciated.
National Center for Health Statistics
Charles J. Rothwell, M.S., M.B.A., Director Nathaniel Schenker, Ph.D., Deputy Director
Jennifer H. Madans, Ph.D., Associate Director for Science
Office of Analysis and Epidemiology Irma E. Arispe, Ph.D., Director
Makram Talih, Ph.D., Associate Director for Science
For e-mail updates on NCHS publication releases, subscribe online at: http://www.cdc.gov/nchs/govdelivery.htm. For questions or general information about NCHS: Tel: 1–800–CDC–INFO (1–800–232–4636) • TTY: 1–888–232–6348
Internet: http://www.cdc.gov/nchs • Online request form: http://www.cdc.gov/info
DHHS Publication No. 2015–1250 • CS259078