national health statistics reports - centers for disease control … · 2017-08-10 · 2011–2015...
TRANSCRIPT

National Health Statistics ReportsNumber 105 August 10, 2017
Condom Use During Sexual Intercourse Among Women and Men Aged 15–44 in the United States:
2011–2015 National Survey of Family Growthby Casey E. Copen, M.P.H., Ph.D.
AbstractObjective—This report examines the demographic and behavioral characteristics
of condom use during sexual intercourse in a nationally representative sample of women and men aged 15–44 in the United States using the 2011–2015 National Survey of Family Growth (NSFG). Where data were available, patterns of condom use during sexual intercourse from the 2011–2015 NSFG were compared with the 2002 and 2006–2010 NSFG.
Methods—Data were collected through in-person interviews with nationally representative, independent samples of women and men aged 15–44 in the household population of the United States. Interviews were conducted between September 2011 and September 2015 with 11,300 women and 9,321 men. The response rates for the 2011–2015 NSFG were 72.3% for women and 69.6% for men aged 15–44.
Results—During 2011–2015, 23.8% of women and 33.7% of men aged 15–44 used a condom at last sexual intercourse in the past 12 months, an increase for men since 2002 (29.5%). Among condom users, 59.9% of women and 56.4% of men aged 15–44 used only a condom and no other method during last intercourse in the past 12 months; another 25.0% of women and 33.2% of men used condoms plus hormonal methods; and 15.1% of women and 10.5% of men used condoms plus nonhormonal methods. During any intercourse in the past 4 weeks, 18.2% of women and 23.9% of men aged 15–44 used a condom “100%” of the time. The prevalence of condom use during any intercourse in the past 4 weeks varied by age, education, Hispanic origin and race, relationship at last sexual intercourse, and number of opposite-sex sexual partners in the past 12 months. Almost 7% of women aged 15–44 who used a condom in the past 4 weeks said the condom broke or completely fell off during intercourse or withdrawal, and 25.8% said the condom was used for only part of the time during intercourse.
Keywords: contraception • sexual behavior • sexually transmitted infections
U.S. DEPARTMENT OF HEALTH AND HUMAN SCenters for Disease Control and Prevent
National Center for Health Statistics
IntroductionThe male condom is the only
currently available contraceptive method that provides protection against pregnancy and most sexually transmitted infections (STIs), including the human immunodeficiency virus (HIV) (1–4). Condom use has been shown to vary by demographic factors such as age, race and ethnicity, education, and relationship status (5). Similarly, various contextual and situational factors are associated with condom use, including attitudes toward condoms, levels of perceived HIV/STI risk, beliefs about one’s ability to conceive or to get someone pregnant, and self-efficacy regarding the negotiation of condom use between partners (6–9).
Previous studies have indicated increasing rates of condom use for both pregnancy and HIV/STI prevention among both adolescents (10, 11) and adults (12) in the United States, although condom usage has recently declined among sexually active U.S. youth (13). Even when condoms are used during sexual intercourse, they are often used incorrectly or inconsistently, which can reduce condom effectiveness (14–15). Continued surveillance of condom use behaviors in the general population can inform family planning
ERVICESion

Page 2 National Health Statistics Reports Number 105 August 10, 2017
needs and guide sexual health interventions in the United States.
This report examines demographic and behavioral characteristics of condom use during sexual intercourse among women and men aged 15–44 using the 2011–2015 National Survey of Family Growth (NSFG). Earlier NSFG surveys presented here include the 2002 periodic survey and the 2006–2010 continuous survey. Condom use measures in this report include whether a condom was used, alone or in combination with another contraceptive method, at last sexual intercourse in the past 12 months and how often a condom was used during any sexual intercourse, both within the past 12 months and past 4 weeks. This report also includes data from two questions on problems with condom use asked of women aged 15–44 who used a condom in the past 4 weeks.
Methods
Data source
This report is based on NSFG data from 2011–2013 and 2013–2015 combined, resulting in a data file of 4 years of interviews spanning 2011–2015. These two data sets together contain a total of 20,621 interviews—11,300 with women and 9,321 with men aged 15–44. NSFG is a nationally representative survey of the U.S. household population, with face-to-face interviews conducted with independent samples of women and men aged 15–44. NSFG is jointly planned and funded by the Centers for Disease Control and Prevention’s (CDC) National Center for Health Statistics and several other programs of the U.S. Department of Health and Human Services. Further details on the sample design, variance estimation, and fieldwork procedures were published previously (16). For 2011–2015, the response rate was 71.0% overall—72.3% for women and 69.6% for men aged 15–44.
Measures on condom use in NSFG
This report focuses on condom use during sexual intercourse, as collected in the Computer Assisted Personal Interview
(CAPI) portion of the NSFG in which the questionnaire was administered by an interviewer. In CAPI, respondents who had sexual intercourse in the past 12 months were asked to recall the contraceptive method(s) used at the last intercourse during this time period. Respondents could provide up to four methods in response to this question, which allows for the estimation of condom use in combination with any other contraceptive methods. The Technical Notes contain information about all questions used in this report. When condom use is shown for women, it is referring to their male sexual partner’s condom use during vaginal (sexual) intercourse. Condom use questions in CAPI were distinct from questions on condom use asked about in the Audio Computer Assisted Self-Interview (ACASI) part of the NSFG interview where the respondent listened to the questions through headphones, read them on the screen, or both, and entered his or her responses directly into the computer.
In addition to condom use prevalence, this report describes consistency of condom use during any sexual intercourse in both the past 12 months and past 4 weeks. Consistency of condom use in the past 12 months was measured on an ordinal scale (e.g., “every time” to “none of the time”) without taking into account the frequency of sexual intercourse in the past 12 months. Consistency of condom use in the past 4 weeks was measured as a ratio, which divides the number of times a condom was used during sexual intercourse in the past 4 weeks by the total number of times the respondent had intercourse in that same time period. For example, a person reporting condom use on 5 of 10 occasions of intercourse would receive a value of 50% on a percentage scale. Both of these questions were applicable only for respondents who had sexual intercourse during the specified time frame.
Questions on condom use used in this report were available for all time periods except for the question on frequency of condom use in the past 12 months, which was asked of men starting in 2011; and two new questions on problems with condom use in the past 4
weeks, which were added to the female questionnaire in 2013. Starting in 2013, women who had used a condom during any sexual intercourse in the past 4 weeks were asked whether the condom broke or completely fell off during intercourse or withdrawal and whether the condom was used for only part of the time during intercourse. If the respondent had sex more than once in the past 4 weeks, she was asked how many times these problems occurred.
The measurement of self-reported condom use is subject to social desirability and recall biases. However, typical assessments of contraceptive use behaviors generally rely on respondent recall of a specific time period or a particular sexual event and both have shown to be good predictors of condom use (17). This report is limited to condom use during vaginal intercourse. Data on condom use behaviors for other types of opposite-sex sexual contact (e.g., oral sex and anal sex) and for same-sex sexual contact among men were not included in this report, but are available for public use based on items asked within the ACASI part of the NSFG interview.
Other variables
The data presented in this report are shown with respect to several key background or demographic characteristics including age, educational attainment, and Hispanic origin and race. Age of respondent and educational attainment reflect status at time of interview. Educational attainment is shown based only on respondents aged 22–44 because large percentages of those aged 15–21 are still attending school. The definitions of Hispanic origin and race used in this report take into account the reporting of more than one race, in accordance with 1997 guidelines from the Office of Management and Budget (18); however, sample sizes in NSFG of multirace individuals or single-race groups other than black or white were too small to be shown separately. The male recode LSEXLRTN was used to describe the type of relationship he had with his last sexual partner at last intercourse, and a similar variable was defined for women (Technical Notes). For both women and men, the recode PARTS1YR was used to

National Health Statistics Reports Number 105 August 10, 2017 Page 3
95% confidence interval.†Test of trend significantly different at the p < 0.05 level across the three survey time periods.SOURCE: NCHS, National Survey of Family Growth, 2002, 2006–2010, and 2011–2015.
Perc
ent
0
10
20
30
40
50 2011–20152006–20102002
MenWomen
23.4 25.3 23.829.5
33.1 33.7†
Figure 1. Trends in condom use at last sexual intercourse in the past 12 months among women and men aged 15–44: United States, 2002, 2006–2010, 2011–2015
define the number of opposite-sex sexual partners in the past 12 months.
Statistical analysis
All of the estimates and percentages in this report are based on sampling weights that were designed to produce unbiased national estimates representing women and men aged 15–44 at the time of each respective survey. Statistics for this report, including sampling errors, were produced using the survey analysis procedures in SAS software version 9.4. Overall associations between independent variables and variables on condom use were evaluated using survey-adjusted Wald chi-square tests. Standard two-tailed t tests were used to test statistical significance among subgroups. A probability (p) level of less than 0.05 was considered statistically significant. No adjustments were made for multiple comparisons. A weighted least-squares regression method was used to test the significance of trends that involved more than two time points. Terms such as “greater than” and “less than” indicate that a statistically significant difference was found. Terms such as “similar” or “no difference” indicate that the statistics being compared were not significantly different. All analyses were stratified by sex. Given that the respondent may be reporting on their partner’s contraceptive use, trends and subgroup differences in condom use were discussed within sex.
Results
Prevalence of condom use
Figure 1 presents the prevalence of condom use at last sexual intercourse among women and men aged 15–44 who had sexual intercourse in the past 12 months. The percentages for women aged 15–44 were similar in 2002 (23.4%), 2006–2010 (25.3%), and 2011–2015 (23.8%), although for men aged 15–44, the percentages increased from 29.5% in 2002 to 33.1% in 2006–2010 and remained stable in 2011–2015 at 33.7%. Demographic and behavioral variation in the prevalence of condom use at last sexual intercourse in the past 12 months among women and men aged 15–44 is
presented in the Appendix Table.
Consistency of condom use
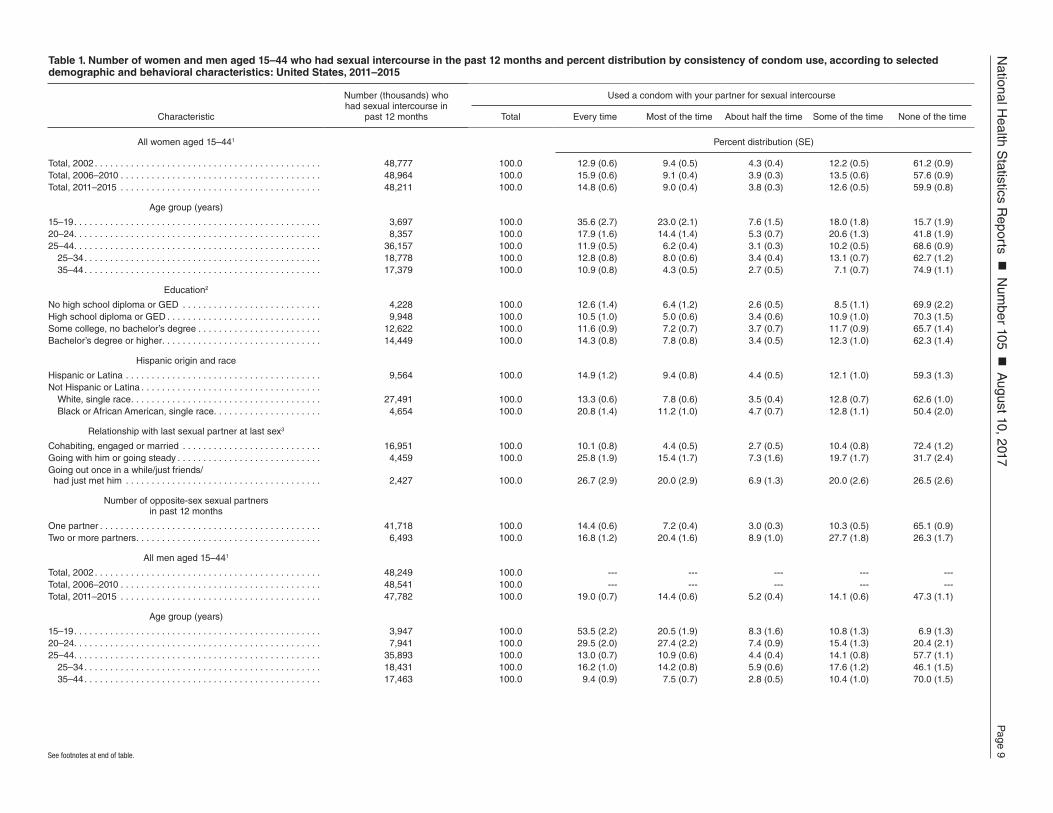
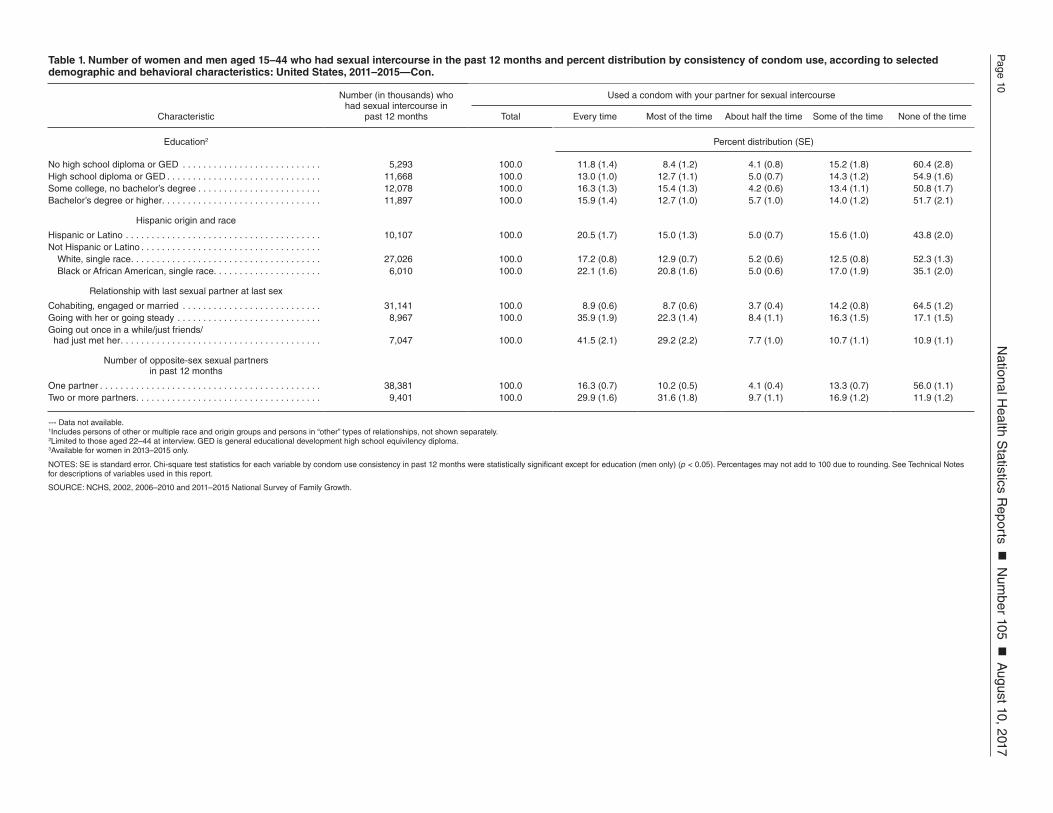
Table 1 shows consistency of condom use during any sexual intercourse in the past 12 months among women and men aged 15–44 years who had intercourse in the past 12 months, regardless of the frequency of intercourse in that time frame.
Condom use “every time” during sexual intercourse in past 12 months
● During 2011–2015, 14.8% of women and 19.0% of men aged 15–44 used a condom “every time” they had intercourse in the past 12 months. For women, this percentage was similar to those shown in 2002 and 2006–2010 (data not available for men).
● The percentage of women and men aged 15–44 who used a condom “every time” they had intercourse in the past 12 months decreased with older age. The percentages were 35.6% and 53.5% among 15– to
19-year-olds and 10.9% and 9.4% among 35– to 44-year-olds for women and men, respectively.
● The percentage of men aged 22–44 who used a condom “every time” they had intercourse in the past 12 months increased with greater educational attainment, from 11.8% for those with less than a high school diploma or general educational development high school equivalency diploma (GED) to 15.9% among those with a bachelor’s degree or higher. This pattern was not seen for women aged 22–44.
● Among all Hispanic origin and race groups, non-Hispanic black women aged 15–44 were more likely to have used a condom “every time” they had intercourse in the past 12 months. In contrast, Hispanic men and non-Hispanic black men aged 15–44 had similar percentages who used a condom “every time” they had intercourse in the past 12 months, both of which were higher than that for non-Hispanic white men aged 15–44.

Page 4 National Health Statistics Reports Number 105 August 10, 2017
●
●
Cc
dapamhn
●
●
● Men aged 15–44 whose last sexual partner was someone with whom they were going out “once in a while/were just friends/had just met” were more likely to have used a condom “every time” they had intercourse in the past 12 months compared with someone they were “going with or going steady.” This pattern was not seen for women aged 15–44.
● Men aged 15–44 with two or more opposite-sex sexual partners in the past 12 months were more likely to have used a condom “every time” they had intercourse compared with those with one opposite-sex sexual partner in the past 12 months. This pattern was not seen for women aged 15–44.
Condom use “none of the time” during sexual intercourse in past 12 months
● Looking at the last column (Table 1), 59.9% of women and 47.3% of men aged 15–44 during 2011–2015 did not use a condom during any intercourse in the past 12 months. For women, this percentage was similar to those shown in 2002 and 2006–2010 (data not available for men).
● The percentage of women and men aged 15–44 who did not use a condom during any intercourse in the past 12 months increased with older age. The percentages were 15.7% and 6.9% among 15– to19-year-olds and 74.9% and 70.0% among 35– to 44-year-olds for women and men, respectively.
● The percentages of women and men aged 22–44 who did not use a condom during any intercourse in the past 12 months decreased with greater educational attainment. The percentages were 69.9% for women and 60.4% men with less than a high school diploma or GED and 62.3% of women and 51.7% of men with a bachelor’s degree or higher.
● Non-Hispanic white women and men aged 15–44 were more likely to have not used a condom during any intercourse in the past 12 months compared with Hispanic women and men aged 15–44 and non-Hispanic black women and men aged 15–44.
● Men aged 15–44 whose last sexual
partner was someone with whom they were “going with or going steady” were more likely to have not used a condom during any intercourse in the past 12 months compared with someone with whom they were going out “once in a while/were just friends/had just met.” This pattern was not seen for women aged 15–44.
● Women and men aged 15–44 with one opposite-sex sexual partner in the past 12 months were more likely to have not used a condom during any intercourse compared with those with two or more opposite-sex sexual partners in the past 12 months.
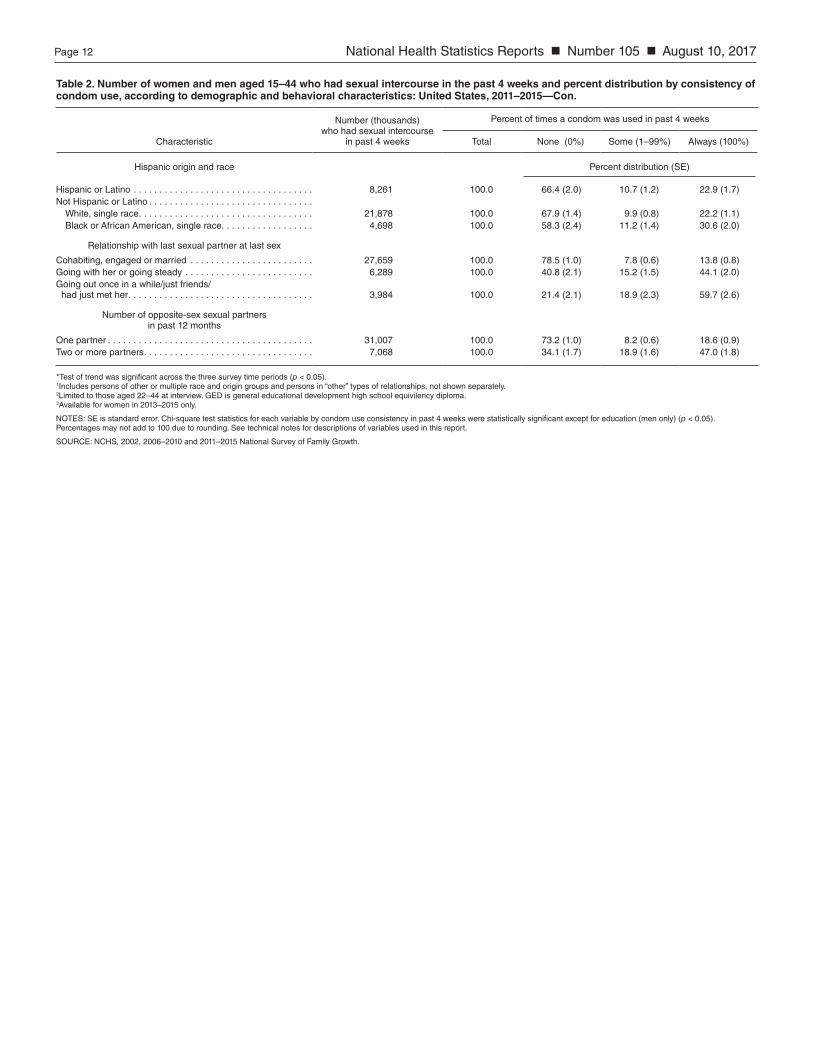
Table 2 presents consistency of condom use during any sexual intercourse in the past 4 weeks among women and men aged 15–44. This consistency measure divides the number of times they used a condom during any sexual intercourse in the past 4 weeks by the frequency of intercourse in that time frame to obtain the percentage of condom use during sexual intercourse. These percentages were grouped as 0% (“none”), 1–99% (“some”) and 100% (“always”).
● Percentages of women aged 15–44 who did not use a condom during any intercourse in the past 4 weeks were similar over time, but for men aged 15–44, these percentages decreased from 71.5% in 2002 to 68.4% for 2006–2010 and remained steady at 65.9% for 2011–2015.
● Percentages of women aged 15–44 who said they had “some” condom use during any intercourse in the past 4 weeks were similar in 2002 (6.8%) and 2006–2010 (6.7%) and then decreased to 5.5% for 2011–2015, although for men, these percentages increased from 6.1% in 2002 to 6.9% in 2006–2010 and 10.2% in 2011–2015
● Patterns of condom use by age and education among women and men who used a condom “100%” of the time during any intercourse in the past 4 weeks were similar to those shown for condom use “every time” in the past 12 months (Table 1).
● Non-Hispanic black women and men
aged 15–44 were more likely to have used a condom “100%” of the time during any intercourse in the past 4 weeks compared with Hispanic women and men aged 15–44 and non-Hispanic white women and men aged 15–44.
Women and men aged 15–44 whose last sexual partner was someone with whom they were going out “once in a while/were just friends/had just met” were more likely to have used a condom “100%” of the time during any intercourse in the past 4 weeks compared with someone with whom they were “going with or going steady,” or someone they were “cohabiting with, engaged or married to.”
Women and men aged 15–44 with two or more opposite-sex sexual partners in the past 12 months were more likely to have used a condom “100%” of the time during any intercourse in the past 4 weeks compared with those with one opposite-sex sexual partner in the past 12 months.
ondom use with any other ontraceptive methods
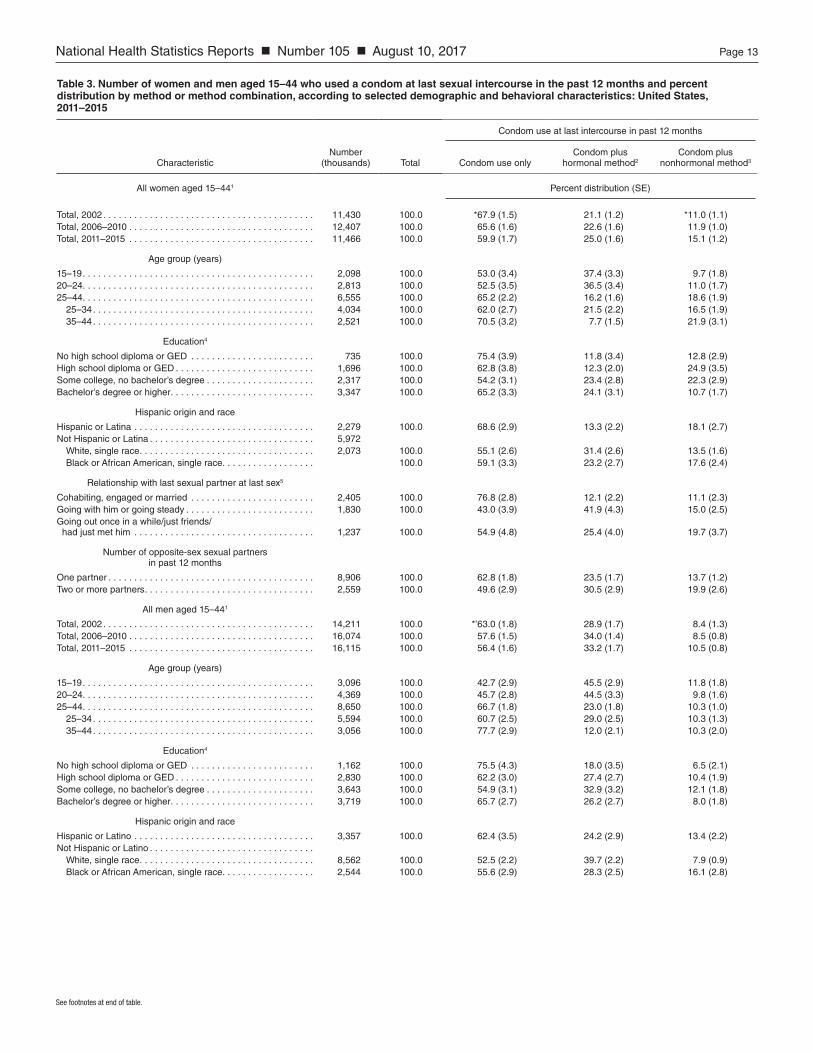
Table 3 presents the percent istribution among those 15–44 who used condom at last sexual intercourse in the ast 12 months (i.e., condom users) with nd without the use of other contraceptive ethods (condoms only, condoms plus
ormonal methods, and condoms plus onhormonal methods).
Percentages of female and male condom users aged 15–44 who used condoms only at last intercourse in the past 12 months decreased from 67.9% of women and 63.0% of men in 2002 to 65.6% and 57.6% for 2006–2010 and 59.9% and 56.4% for 2011–2015. Alongside this decline, percentages of female condom users aged 15–44 who used condoms plus nonhormonal methods at last intercourse increased from 11.9% in 2006–2010 to 15.1% for 2011–2015.
In 2011–2015, over half of female (59.9%) and male (56.4%) condom users aged 15–44 used condoms only, 25.0% and 33.2% used condoms plus hormonal methods,

National Health Statistics Reports Number 105 August 10, 2017 Page 5
and 15.1% and 10.5% used condoms plus nonhormonal methods at last intercourse in the past 12 months.
● Compared with female condom users aged 25–44, those aged 15–24 were more likely to use condoms plus hormonal methods and were less likely to use condoms only or condoms plus nonhormonal methods at last intercourse in the past 12 months. A similar pattern was seen for male condom users aged 15–44; however, the percentages of those using condoms plus nonhormonal methods at last intercourse did not vary significantly by age.
● For all education groups (limited to those ages 22–44), female and male condom users were most likely to use condoms only at last intercourse in the past 12 months compared with any other method combination shown. In addition, the percentages of female condom users who used condoms plus hormonal methods at last intercourse increased significantly with greater educational attainment. This pattern was not seen for male condom users aged 22–44.
● For non-Hispanic white and non-Hispanic black groups, female condom users aged 15–44 were most likely to use condoms only at last intercourse in the past 12 months and were least likely to use condoms plus nonhormonal methods. Hispanic female condom users aged 15–44 were most likely to use condoms only and least likely to use condoms plus hormonal methods at last intercourse. This pattern was not seen for male condom users aged 15–44.
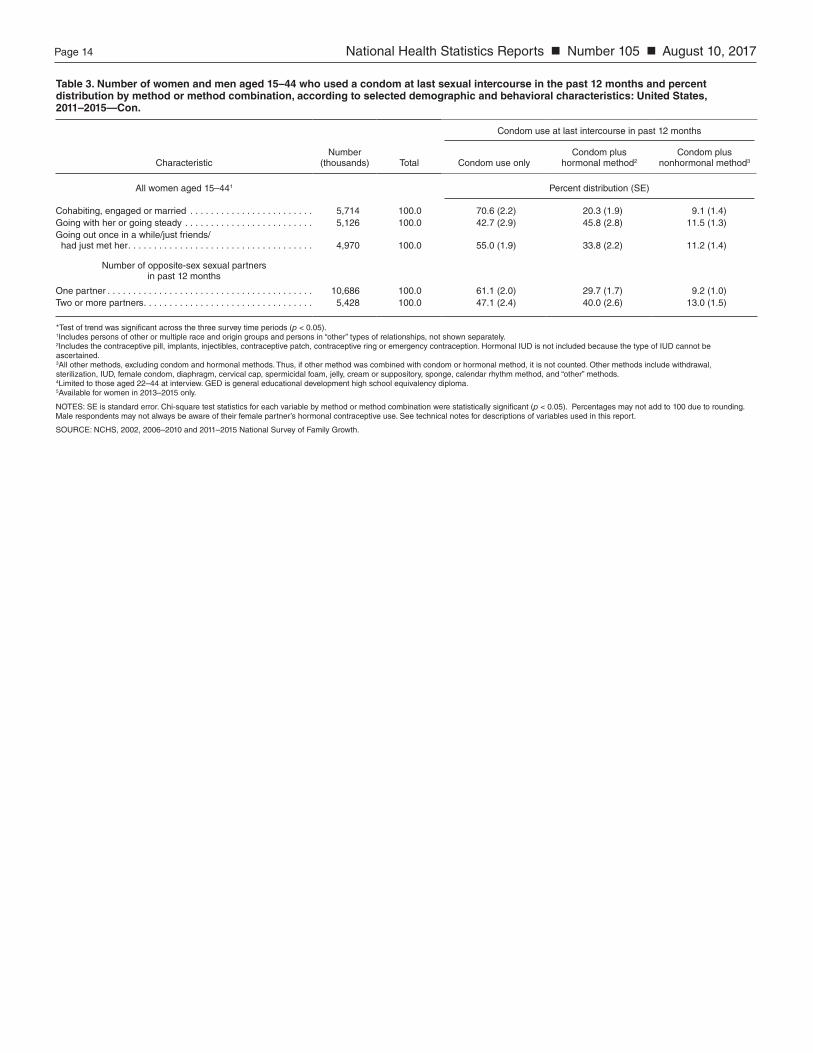
● Regardless of the type of relationship with their last sexual partner, use of condoms only at last intercourse in the past 12 months was most common among female and male condom users aged 15–44 compared with any other method combination shown. A higher percentage of female condom users aged 15–44 whose last sexual partner was someone with whom they were “going with or going steady” used condoms plus hormonal methods at last intercourse compared with those whose last sexual partner was
someone with whom they were going out “once in a while/were just friends/had just met.” For male condom users aged 15–44, a similar pattern was seen.
● Regardless of the number of opposite-sex sexual partners in the past 12 months, condom use only at last intercourse in the past 12 months was most common among female and male condom users aged 15–44 compared with any other method combination shown. Higher percentages of female and male condom users aged 15–44 who had two or more opposite-sex sexual partners in the past 12 months used condoms plus hormonal methods at last intercourse compared with those with one opposite-sex sexual partner in the past 12 months.
Problems with condom use
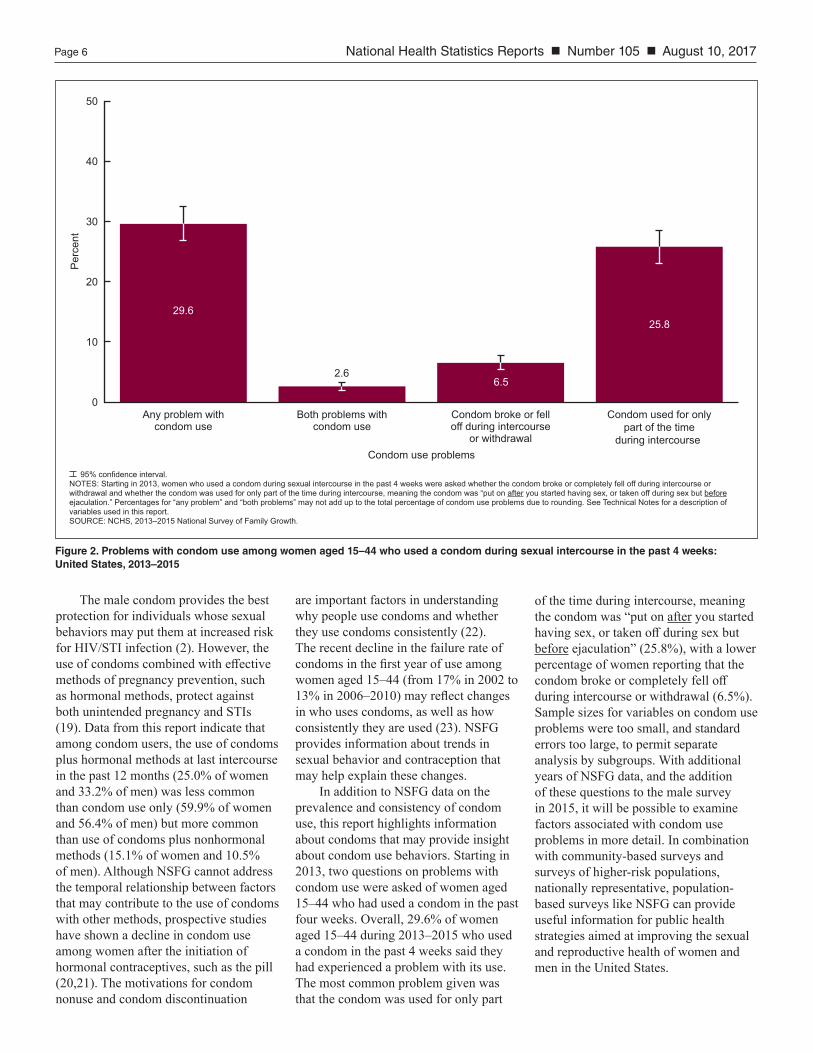
Figures 2 and 3 show data from new questions (added in 2013) on the prevalence and frequency of condom use problems among women aged 15–44 who used a condom during sexual intercourse in the past 4 weeks. Condom use problems asked about in NSFG include a question about whether the condom “broke or completely fell off during intercourse or withdrawal” and a question about whether the condom was “used only part of the time during intercourse,” meaning the condom was “put on after you started having sex, or taken off during sex but before ejaculation.”
● Overall, 29.6% of women aged 15–44 who used a condom in the past 4 weeks said they had any problems with condom use during that time frame (Figure 2). Among women, 6.5% said the condom “broke or completely fell off during intercourse or withdrawal” and 25.8% said the condom was “only used part of the time during intercourse.” About 3% of women said they had both types of condom use problems during intercourse in the past 4 weeks, that is, the condom broke or completely fell off and the condom was used for only part of the time during intercourse.
● Figure 3 shows the frequency of
condom use problems in the past four weeks among women aged 15–44. Fifteen percent of women aged 15–44 said the condom was used only for part of the time during intercourse every time they had intercourse in the past 4 weeks, 10.7% said the problem occurred some of the time, and 74.2% said the problem did not occur at all. By comparison, 1.1% of women aged 15–44 said the condom broke or completely fell off during intercourse or withdrawal every time they had intercourse in the past 4 weeks, 5.4% said the problem occurred some of the time, and 93.5% said the problem did not occur at all.
DiscussionThis report presents demographic
and behavioral characteristics of condom use among women and men aged 15–44 in the United States. During 2011–2015, 23.8% of women and 33.7% of men aged 15–44 used a condom at last sexual intercourse in the past 12 months, an increase for men since 2002 (29.5%). Consistent condom use during any intercourse in the past 4 weeks (e.g., “100%”) was most common among younger persons, those who were “going with or going steady” or were going out “once in a while, were just friends with, or had just met” their last sexual partner, non-Hispanic black persons and those who had two or more opposite-sex sexual partners in the past 12 months. Although the percentages of men who did not use a condom during intercourse in the past 4 weeks decreased over time (from 71.5% in 2002 to 65.9% in 2011–2015), condom nonuse remained common, with the majority of women and men in each survey period not using a condom at last intercourse. This report focuses on the overall prevalence of condom use; thus, the results presented here cannot address the myriad factors associated with condom nonuse, including being in a monogamous relationship, using hormonal or other methods to prevent pregnancy, trying to get pregnant, and other topics related to contraceptive consistency.
Page 6 National Health Statistics Reports Number 105 August 10, 2017
95% confidence interval.NOTES: Starting in 2013, women who used a condom during sexual intercourse in the past 4 weeks were asked whether the condom broke or completely fell off during intercourse or withdrawal and whether the condom was used for only part of the time during intercourse, meaning the condom was “put on after you started having sex, or taken off during sex but before ejaculation.” Percentages for “any problem” and “both problems” may not add up to the total percentage of condom use problems due to rounding. See Technical Notes for a description of variables used in this report. SOURCE: NCHS, 2013–2015 National Survey of Family Growth.
Perc
ent
0
10
20
30
40
50
Condom used for onlypart of the time
during intercourse
Condom broke or felloff during intercourse
or withdrawal
Both problems withcondom use
Any problem withcondom use
Condom use problems
29.6
2.66.5
25.8
Figure 2. Problems with condom use among women aged 15–44 who used a condom during sexual intercourse in the past 4 weeks: United States, 2013–2015
The male condom provides the best protection for individuals whose sexual behaviors may put them at increased risk for HIV/STI infection (2). However, the use of condoms combined with effective methods of pregnancy prevention, such as hormonal methods, protect against both unintended pregnancy and STIs (19). Data from this report indicate that among condom users, the use of condoms plus hormonal methods at last intercourse in the past 12 months (25.0% of women and 33.2% of men) was less common than condom use only (59.9% of women and 56.4% of men) but more common than use of condoms plus nonhormonal methods (15.1% of women and 10.5% of men). Although NSFG cannot address the temporal relationship between factors that may contribute to the use of condoms with other methods, prospective studies have shown a decline in condom use among women after the initiation of hormonal contraceptives, such as the pill (20,21). The motivations for condom nonuse and condom discontinuation
are important factors in understanding why people use condoms and whether they use condoms consistently (22). The recent decline in the failure rate of condoms in the first year of use among women aged 15–44 (from 17% in 2002 to 13% in 2006–2010) may reflect changes in who uses condoms, as well as how consistently they are used (23). NSFG provides information about trends in sexual behavior and contraception that may help explain these changes.
In addition to NSFG data on the prevalence and consistency of condom use, this report highlights information about condoms that may provide insight about condom use behaviors. Starting in 2013, two questions on problems with condom use were asked of women aged 15–44 who had used a condom in the past four weeks. Overall, 29.6% of women aged 15–44 during 2013–2015 who used a condom in the past 4 weeks said they had experienced a problem with its use. The most common problem given was that the condom was used for only part
of the time during intercourse, meaning the condom was “put on after you started having sex, or taken off during sex but before ejaculation” (25.8%), with a lower percentage of women reporting that the condom broke or completely fell off during intercourse or withdrawal (6.5%). Sample sizes for variables on condom use problems were too small, and standard errors too large, to permit separate analysis by subgroups. With additional years of NSFG data, and the addition of these questions to the male survey in 2015, it will be possible to examine factors associated with condom use problems in more detail. In combination with community-based surveys and surveys of higher-risk populations, nationally representative, population-based surveys like NSFG can provide useful information for public health strategies aimed at improving the sexual and reproductive health of women and men in the United States.

National Health Statistics Reports Number 105 August 10, 2017 Page 7
r
NOTES: Starting in 2013, women who used a condom during sexual intercourse in the past 4 weeks were asked whether the condom broke or completely fell off during intercourse or withdrawal and whether the condom was used for only part of the time during intercourse, meaning the condom was “put on after you started having sex, or taken off during sex but before ejaculation.” If the respondent had sex more than once in the past 4 weeks, she was asked how many times these problems occurred. To convert the frequency of condom use problems into a percentage, the number of condom use problems was divided by the number of condom uses in the past 4 weeks, multiplied by 100 and then categorized as “0%,” “1–99%” or “100%.” See Technical Notes for a description of variables used in this report. SOURCE: NCHS, 2013–2015 National Survey of Family Growth.
Perc
ent
Condom use problems
0
20
40
60
80
100
0%(None of the time)
1–99%(Some of the time)
100% (Every time)
Condom used for only part ofthe time during intercourse
Condom broke or fell off duringintercourse or withdrawal
93.5
74.2
10.7
15.15.4 1.1
Figure 3. Frequency of condom use problems among women aged 15–44 who used a condom during sexual intercourse in the past 4 weeks: United States, 2013–2015
References1. Pinkerton SD, Abramson PR.
Effectiveness of condoms in preventing HIV transmission. Soc Sci Med 44(9): 1303–12. 1997.
2. Weller S, Davis K. Condom effectiveness in reducing heterosexual HIV transmission. Cochrane Database Syst Rev (1): CD003255. 2002.
3. Warner L, Stone KM, Macaluso M, Buehler JW, Austin HD. Condom use and risk of gonorrhea and Chlamydia: A systematic review of design and measurement factors assessed in epidemiologic studies. Sex Transm Dis 33(1):36–51. 2006.
4. Trussell J. Contraceptive failure in the United States. Contraception (83): 397–404. 2011.
5. Reece M, Herbenick D, Schick V, Sanders SA, Dodge B, Fortenberry JD. Condom use rates in a national probability sample of males and females ages 14 to 94 in the United States. J Sex Med 7(5): 266–76. 2010.
6. Shih SL, Kebodeaux CA, Secura GM, Allsworth JE, Madden T, Peipert JF. Baseline correlates of inconsistent and incorrect condom use among sexually active women in the contraceptive CHOICE Project. Sex Transm Dis 38(11):1012–9. 2011.
7. Pollack LM, Boyer CB, Weinstein ND. Perceived risk for sexually transmitted infections aligns with sexual risk behaviowith the exception of condom nonuse: Data from a nonclinical sample of sexually active young adult women. Sex Trans Dis 40(5):388–94. 2013.
8. Grady WR, Klepinger DH, Billy JO, Cubbins LA. The role of relationship power in couple decisions about contraception in the U.S. J Biosoc Sci 42(3):307–23. 2010.
9. England P, Caudillo ML, Littlejohn K, Bass BC, Reed J. Why do young, unmarried women who do not want to get pregnant contracept inconsistently? Mixed-method evidence for the role of efficacy. Socius: (2):1–15. 2016.
10. CDC. Trends in HIV-related risk behavior among high school students — United States, 1991–2011. MMWR 61(29):556-60. 2012. Available from: https://www.cdc.gov/mmwr/preview/mmwrhtml/mm6129a4.htm.
11. Abma JC, Martinez GM. Sexual activity and contraceptive use among teens in the United States, 2011–2015. National health statistics reports; no 104. Hyattsville, MD: National Center for Health Statistics. 2017. Available from: http://wcms-wp.cdc.gov/nchs/data/nhsr/nhsr104.pdf.
12. Piccinino LJ, Mosher WD. Trends in contraceptive use in the United States: 1982–1995. Fam Plann Perspect 30(1): 4–10, 46. 1998.
13. National Center for HIV/AIDS, Viral Hepatitis, STD, and TB Prevention. Trends in the prevalence of sexual behavior and HIV testing National YRBS: 1991–2015. Available from: http://www.cdc.gov/healthyyouth/data/yrbs/pdf/trends/2015_us_sexual_trend_yrbs.pdf.
14. Paz-Bailey G, Koumans EH, Sternberg M, Pierce A, Papp J, Unger ER, et al. The effect of correct and consistent condom use on chlamydial and gonococcal infections among urban adolescents. Arch Pediatr Adolesc Med 159(6):536–42. 2005.
15. Crosby R, Salazar LF, DiClemente RJ, Yarber WL, Caliendo AM, Staples-Horne M. Accounting for failures may improve precision: Evidence supporting improved validity of self-reported condom use. Sex Transm Dis 32(8):513–5. 2005.
16. National Center for Health Statistics. 2011–2013 National Survey of Family Growth (NSFG): Summary of design and data collection methods. Available from: https://www.cdc.gov/nchs/data/nsfg/nsfg_2011_2013_designanddatacollectionmethods.pdf.
17. Fonner VA, Kennedy CE, O’Reilly KR, Sweat MD. Systematic assessment of condom use measurement in evaluation of HIV prevention interventions: Need for standardization of measures. AIDS Behav 18(12):2374–86. 2014.
18. Office of Management and Budget. Revisions to the standards for the classification of federal data on race and ethnicity. Fed Regist 62(210):58782–90. 1997. Available from: https://www.whitehouse.gov/omb/fedreg_1997standards.
19. Cates W Jr., Steiner MJ. Dual protection against unintended pregnancy and sexually transmitted infections: What is the best contraceptive approach? Sex Transm Dis 29(3):168–74. 2002.
Page 8 National Health Statistics Reports Number 105 August 10, 2017
20. Goldstein RL, Upadhyay UD, Raine TR. With pills, patches, rings and shots: Who still uses condoms? A longitudinal cohort study. J Adolesc Health 52(1):77–82. 2013
21. Morroni C, Heartwell S, Edwards S, Zieman M, Westhoff C. The impact of oral contraceptive initiation on young women’s condom use in 3 American cities: Missed opportunities for intervention. PloS One 9(7):e101804. 2014. Available at: https://doi.org/10.1371/journal.pone.0101804.
22. Mullinax M, Sanders S, Dennis B, Higgins J, Fortenberry JD, Reece M. How condom discontinuation occurs: Interviews with emerging adult women. J Sex Res 54(4–5):642–50. 2017.
23. Sundaram A, Vaughan B, Kost K, Bankole A. Finer L, Singh S, Trussell J. Contraceptive failure in the United States: Estimates from the 2006–2010 National Survey of Family Growth. Perspect Sex Reprod Health 49(1):7–16. 2017.
National H
ealth Statistics R
eports N
umber 105
August 10, 2017
Page 9
Table 1. Number of women and men aged 15–44 who had sexual intercourse in the past 12 months and percent distribution by consistency of condom use, according to selected demographic and behavioral characteristics: United States, 2011–2015
Characteristic
Number (thousands) who had sexual intercourse in
past 12 months
Used a condom with your partner for sexual intercourse
Total Every time Most of the time About half the time Some of the time None of the time
All women aged 15–441 Percent distribution (SE)
Total, 2002 . . . . . . . . . . . . . . . . . . . . . . . . . . . . . . . . . . . . . . . . . . . . 48,777 100.0 12.9 (0.6) 9.4 (0.5) 4.3 (0.4) 12.2 (0.5) 61.2 (0.9)Total, 2006–2010 . . . . . . . . . . . . . . . . . . . . . . . . . . . . . . . . . . . . . . . 48,964 100.0 15.9 (0.6) 9.1 (0.4) 3.9 (0.3) 13.5 (0.6) 57.6 (0.9)Total, 2011–2015 . . . . . . . . . . . . . . . . . . . . . . . . . . . . . . . . . . . . . . . 48,211 100.0 14.8 (0.6) 9.0 (0.4) 3.8 (0.3) 12.6 (0.5) 59.9 (0.8)
Age group (years)
15–19 . . . . . . . . . . . . . . . . . . . . . . . . . . . . . . . . . . . . . . . . . . . . . . . . 3,697 100.0 35.6 (2.7) 23.0 (2.1) 7.6 (1.5) 18.0 (1.8) 15.7 (1.9)20–24. . . . . . . . . . . . . . . . . . . . . . . . . . . . . . . . . . . . . . . . . . . . . . . . 8,357 100.0 17.9 (1.6) 14.4 (1.4) 5.3 (0.7) 20.6 (1.3) 41.8 (1.9)25–44. . . . . . . . . . . . . . . . . . . . . . . . . . . . . . . . . . . . . . . . . . . . . . . . 36,157 100.0 11.9 (0.5) 6.2 (0.4) 3.1 (0.3) 10.2 (0.5) 68.6 (0.9)
25–34 . . . . . . . . . . . . . . . . . . . . . . . . . . . . . . . . . . . . . . . . . . . . . . 18,778 100.0 12.8 (0.8) 8.0 (0.6) 3.4 (0.4) 13.1 (0.7) 62.7 (1.2)35–44 . . . . . . . . . . . . . . . . . . . . . . . . . . . . . . . . . . . . . . . . . . . . . . 17,379 100.0 10.9 (0.8) 4.3 (0.5) 2.7 (0.5) 7.1 (0.7) 74.9 (1.1)
Education2
No high school diploma or GED . . . . . . . . . . . . . . . . . . . . . . . . . . . 4,228 100.0 12.6 (1.4) 6.4 (1.2) 2.6 (0.5) 8.5 (1.1) 69.9 (2.2)High school diploma or GED . . . . . . . . . . . . . . . . . . . . . . . . . . . . . . 9,948 100.0 10.5 (1.0) 5.0 (0.6) 3.4 (0.6) 10.9 (1.0) 70.3 (1.5)Some college, no bachelor’s degree . . . . . . . . . . . . . . . . . . . . . . . . 12,622 100.0 11.6 (0.9) 7.2 (0.7) 3.7 (0.7) 11.7 (0.9) 65.7 (1.4)Bachelor’s degree or higher . . . . . . . . . . . . . . . . . . . . . . . . . . . . . . . 14,449 100.0 14.3 (0.8) 7.8 (0.8) 3.4 (0.5) 12.3 (1.0) 62.3 (1.4)
Hispanic origin and race
Hispanic or Latina . . . . . . . . . . . . . . . . . . . . . . . . . . . . . . . . . . . . . . 9,564 100.0 14.9 (1.2) 9.4 (0.8) 4.4 (0.5) 12.1 (1.0) 59.3 (1.3)Not Hispanic or Latina . . . . . . . . . . . . . . . . . . . . . . . . . . . . . . . . . . .
White, single race . . . . . . . . . . . . . . . . . . . . . . . . . . . . . . . . . . . . . 27,491 100.0 13.3 (0.6) 7.8 (0.6) 3.5 (0.4) 12.8 (0.7) 62.6 (1.0)Black or African American, single race. . . . . . . . . . . . . . . . . . . . . 4,654 100.0 20.8 (1.4) 11.2 (1.0) 4.7 (0.7) 12.8 (1.1) 50.4 (2.0)
Relationship with last sexual partner at last sex3
Cohabiting, engaged or married . . . . . . . . . . . . . . . . . . . . . . . . . . . 16,951 100.0 10.1 (0.8) 4.4 (0.5) 2.7 (0.5) 10.4 (0.8) 72.4 (1.2)Going with him or going steady . . . . . . . . . . . . . . . . . . . . . . . . . . . . 4,459 100.0 25.8 (1.9) 15.4 (1.7) 7.3 (1.6) 19.7 (1.7) 31.7 (2.4)Going out once in a while/just friends/
had just met him . . . . . . . . . . . . . . . . . . . . . . . . . . . . . . . . . . . . . . 2,427 100.0 26.7 (2.9) 20.0 (2.9) 6.9 (1.3) 20.0 (2.6) 26.5 (2.6)
Number of opposite-sex sexual partners in past 12 months
One partner . . . . . . . . . . . . . . . . . . . . . . . . . . . . . . . . . . . . . . . . . . . 41,718 100.0 14.4 (0.6) 7.2 (0.4) 3.0 (0.3) 10.3 (0.5) 65.1 (0.9)Two or more partners . . . . . . . . . . . . . . . . . . . . . . . . . . . . . . . . . . . . 6,493 100.0 16.8 (1.2) 20.4 (1.6) 8.9 (1.0) 27.7 (1.8) 26.3 (1.7)
All men aged 15–441
Total, 2002 . . . . . . . . . . . . . . . . . . . . . . . . . . . . . . . . . . . . . . . . . . . . 48,249 100.0 --- --- --- --- ---Total, 2006–2010 . . . . . . . . . . . . . . . . . . . . . . . . . . . . . . . . . . . . . . . 48,541 100.0 --- --- --- --- ---Total, 2011–2015 . . . . . . . . . . . . . . . . . . . . . . . . . . . . . . . . . . . . . . . 47,782 100.0 19.0 (0.7) 14.4 (0.6) 5.2 (0.4) 14.1 (0.6) 47.3 (1.1)
Age group (years)
15–19 . . . . . . . . . . . . . . . . . . . . . . . . . . . . . . . . . . . . . . . . . . . . . . . . 3,947 100.0 53.5 (2.2) 20.5 (1.9) 8.3 (1.6) 10.8 (1.3) 6.9 (1.3)20–24. . . . . . . . . . . . . . . . . . . . . . . . . . . . . . . . . . . . . . . . . . . . . . . . 7,941 100.0 29.5 (2.0) 27.4 (2.2) 7.4 (0.9) 15.4 (1.3) 20.4 (2.1)25–44. . . . . . . . . . . . . . . . . . . . . . . . . . . . . . . . . . . . . . . . . . . . . . . . 35,893 100.0 13.0 (0.7) 10.9 (0.6) 4.4 (0.4) 14.1 (0.8) 57.7 (1.1)
25–34 . . . . . . . . . . . . . . . . . . . . . . . . . . . . . . . . . . . . . . . . . . . . . . 18,431 100.0 16.2 (1.0) 14.2 (0.8) 5.9 (0.6) 17.6 (1.2) 46.1 (1.5)35–44 . . . . . . . . . . . . . . . . . . . . . . . . . . . . . . . . . . . . . . . . . . . . . . 17,463 100.0 9.4 (0.9) 7.5 (0.7) 2.8 (0.5) 10.4 (1.0) 70.0 (1.5)
See footnotes at end of table.
Page 10
National H
ealth Statistics R
eports N
umber 105
August 10, 2017
Table 1. Number of women and men aged 15–44 who had sexual intercourse in the past 12 months and percent distribution by consistency of condom use, according to selected demographic and behavioral characteristics: United States, 2011–2015—Con.
Characteristic
Number (in thousands) who had sexual intercourse in
past 12 months
Used a condom with your partner for sexual intercourse
Total Every time Most of the time About half the time Some of the time None of the time
Education2 Percent distribution (SE)
No high school diploma or GED . . . . . . . . . . . . . . . . . . . . . . . . . . . 5,293 100.0 11.8 (1.4) 8.4 (1.2) 4.1 (0.8) 15.2 (1.8) 60.4 (2.8)High school diploma or GED . . . . . . . . . . . . . . . . . . . . . . . . . . . . . . 11,668 100.0 13.0 (1.0) 12.7 (1.1) 5.0 (0.7) 14.3 (1.2) 54.9 (1.6)Some college, no bachelor’s degree . . . . . . . . . . . . . . . . . . . . . . . . 12,078 100.0 16.3 (1.3) 15.4 (1.3) 4.2 (0.6) 13.4 (1.1) 50.8 (1.7)Bachelor’s degree or higher . . . . . . . . . . . . . . . . . . . . . . . . . . . . . . . 11,897 100.0 15.9 (1.4) 12.7 (1.0) 5.7 (1.0) 14.0 (1.2) 51.7 (2.1)
Hispanic origin and race
Hispanic or Latino . . . . . . . . . . . . . . . . . . . . . . . . . . . . . . . . . . . . . . 10,107 100.0 20.5 (1.7) 15.0 (1.3) 5.0 (0.7) 15.6 (1.0) 43.8 (2.0)Not Hispanic or Latino . . . . . . . . . . . . . . . . . . . . . . . . . . . . . . . . . . .
White, single race . . . . . . . . . . . . . . . . . . . . . . . . . . . . . . . . . . . . . 27,026 100.0 17.2 (0.8) 12.9 (0.7) 5.2 (0.6) 12.5 (0.8) 52.3 (1.3)Black or African American, single race. . . . . . . . . . . . . . . . . . . . . 6,010 100.0 22.1 (1.6) 20.8 (1.6) 5.0 (0.6) 17.0 (1.9) 35.1 (2.0)
Relationship with last sexual partner at last sex
Cohabiting, engaged or married . . . . . . . . . . . . . . . . . . . . . . . . . . . 31,141 100.0 8.9 (0.6) 8.7 (0.6) 3.7 (0.4) 14.2 (0.8) 64.5 (1.2)Going with her or going steady . . . . . . . . . . . . . . . . . . . . . . . . . . . . 8,967 100.0 35.9 (1.9) 22.3 (1.4) 8.4 (1.1) 16.3 (1.5) 17.1 (1.5)Going out once in a while/just friends/
had just met her . . . . . . . . . . . . . . . . . . . . . . . . . . . . . . . . . . . . . . . 7,047 100.0 41.5 (2.1) 29.2 (2.2) 7.7 (1.0) 10.7 (1.1) 10.9 (1.1)
Number of opposite-sex sexual partners in past 12 months
One partner . . . . . . . . . . . . . . . . . . . . . . . . . . . . . . . . . . . . . . . . . . . 38,381 100.0 16.3 (0.7) 10.2 (0.5) 4.1 (0.4) 13.3 (0.7) 56.0 (1.1)Two or more partners . . . . . . . . . . . . . . . . . . . . . . . . . . . . . . . . . . . . 9,401 100.0 29.9 (1.6) 31.6 (1.8) 9.7 (1.1) 16.9 (1.2) 11.9 (1.2)
--- Data not available.1Includes persons of other or multiple race and origin groups and persons in “other” types of relationships, not shown separately.2Limited to those aged 22–44 at interview. GED is general educational development high school equivilency diploma.3Available for women in 2013–2015 only.
NOTES: SE is standard error. Chi-square test statistics for each variable by condom use consistency in past 12 months were statistically significant except for education (men only) (p < 0.05). Percentages may not add to 100 due to rounding. See Technical Notes for descriptions of variables used in this report.
SOURCE: NCHS, 2002, 2006–2010 and 2011–2015 National Survey of Family Growth.

National Health Statistics Reports Number 105 August 10, 2017 Page 11
Table 2. Number of women and men aged 15–44 who had sexual intercourse in the past 4 weeks and percent distribution by consistency of condom use, according to demographic and behavioral characteristics: United States, 2011–2015
Characteristic
Number (thousands) who had sexual intercourse
in past 4 weeks
Percent of times a condom was used in past 4 weeks
Total None (0%) Some (1–99%) Always (100%)
All women aged 15–441 Percent distribution (SE)
Total, 2002 . . . . . . . . . . . . . . . . . . . . . . . . . . . . . . . . . . . . . . . . . 41,095 100.0 75.3 (0.9) *6.8 (0.6) 17.8 (0.6)Total, 2006–2010 . . . . . . . . . . . . . . . . . . . . . . . . . . . . . . . . . . . . 40,223 100.0 73.5 (0.9) 6.7 (0.4) 19.8 (0.8)Total, 2011–2015 . . . . . . . . . . . . . . . . . . . . . . . . . . . . . . . . . . . . 39,472 100.0 76.3 (0.7) 5.5 (0.4) 18.2 (0.6)
Age group (years)
15–19 . . . . . . . . . . . . . . . . . . . . . . . . . . . . . . . . . . . . . . . . . . . . . 2,341 100.0 38.2 (2.9) 16.9 (2.6) 44.9 (2.9)20–24. . . . . . . . . . . . . . . . . . . . . . . . . . . . . . . . . . . . . . . . . . . . . 6,797 100.0 65.1 (2.0) 8.4 (1.0) 26.5 (1.9)25–44. . . . . . . . . . . . . . . . . . . . . . . . . . . . . . . . . . . . . . . . . . . . . 15,857 100.0 81.8 (0.8) 4.0 (0.4) 14.2 (0.7)
25–34 . . . . . . . . . . . . . . . . . . . . . . . . . . . . . . . . . . . . . . . . . . . 14,476 100.0 77.7 (1.1) 5.2 (0.6) 17.1 (1.0)35–44 . . . . . . . . . . . . . . . . . . . . . . . . . . . . . . . . . . . . . . . . . . . 100.0 86.2 (1.0) 2.6 (0.4) 11.1 (0.9)
Education2
No high school diploma or GED . . . . . . . . . . . . . . . . . . . . . . . . 3,468 100.0 82.1 (1.9) 2.4 (0.7) 15.5 (1.8)High school diploma or GED . . . . . . . . . . . . . . . . . . . . . . . . . . . 8,111 100.0 83.9 (1.3) 5.2 (0.9) 10.9 (1.0)Some college, no bachelor’s degree . . . . . . . . . . . . . . . . . . . . . 10,681 100.0 81.8 (1.1) 3.9 (0.5) 14.3 (1.1)Bachelor’s degree or higher . . . . . . . . . . . . . . . . . . . . . . . . . . . . 12,335 100.0 76.1 (1.3) 5.0 (0.7) 18.9 (1.2)
Hispanic origin and race
Hispanic or Latina . . . . . . . . . . . . . . . . . . . . . . . . . . . . . . . . . . . 7,611 100.0 76.4 (1.4) 5.6 (0.6) 18.0 (1.3)Not Hispanic or Latina . . . . . . . . . . . . . . . . . . . . . . . . . . . . . . . . 23,489
White, single race . . . . . . . . . . . . . . . . . . . . . . . . . . . . . . . . . . 4,662 100.0 78.4 (0.9) 5.0 (0.5) 16.7 (0.8)Black or African American, single race. . . . . . . . . . . . . . . . . . 3,710 100.0 67.6 (1.9) 6.7 (1.1) 25.7 (1.7)
Relationship with last sexual partner at last sex3
Cohabiting, engaged or married . . . . . . . . . . . . . . . . . . . . . . . . 15,212 100.0 84.0 (1.1) 3.7 (0.6) 12.4 (0.9)Going with him or going steady . . . . . . . . . . . . . . . . . . . . . . . . . 3,409 100.0 56.4 (2.8) 10.5 (2.2) 33.1 (2.2)Going out once in a while/just friends/
had just met him . . . . . . . . . . . . . . . . . . . . . . . . . . . . . . . . . . . 1,167 100.0 47.2 (4.4) 10.1 (2.2) 42.8 (4.4)
Number of opposite-sex sexual partnersin past 12 months
One partner . . . . . . . . . . . . . . . . . . . . . . . . . . . . . . . . . . . . . . . . 34,061 100.0 78.9 (0.7) 4.3 (0.4) 16.7 (0.7)Two or more partners . . . . . . . . . . . . . . . . . . . . . . . . . . . . . . . . . 4,868 100.0 57.9 (2.2) 13.7 (1.7) 28.3 (1.7)
All men aged 15–441
Total, 2002 . . . . . . . . . . . . . . . . . . . . . . . . . . . . . . . . . . . . . . . . . 38,606 100.0 *71.5 (1.0) *6.1 (0.5) 22.5 (0.9)Total, 2006–2010 . . . . . . . . . . . . . . . . . . . . . . . . . . . . . . . . . . . . 39,117 100.0 68.4 (1.0) 6.9 (0.5) 24.7 (0.9)Total, 2011–2015 . . . . . . . . . . . . . . . . . . . . . . . . . . . . . . . . . . . . 38,279 100.0 65.9 (1.1) 10.2 (0.5) 23.9 (0.9)
Age group (years)
15–19 . . . . . . . . . . . . . . . . . . . . . . . . . . . . . . . . . . . . . . . . . . . . . 2,304 100.0 23.3 (2.4) 12.0 (2.0) 64.7 (3.0)20–24. . . . . . . . . . . . . . . . . . . . . . . . . . . . . . . . . . . . . . . . . . . . . 5,847 100.0 40.4 (2.9) 17.9 (1.7) 41.8 (2.5)25–44. . . . . . . . . . . . . . . . . . . . . . . . . . . . . . . . . . . . . . . . . . . . . 100.0 74.2 (1.1) 8.6 (0.6) 17.3 (0.8)
25–34 . . . . . . . . . . . . . . . . . . . . . . . . . . . . . . . . . . . . . . . . . . . 15,401 100.0 66.7 (1.5) 11.3 (0.9) 22.0 (1.2)35–44 . . . . . . . . . . . . . . . . . . . . . . . . . . . . . . . . . . . . . . . . . . . 14,727 100.0 82.1 (1.4) 5.7 (0.8) 12.2 (1.1)
Education2
No high school diploma or GED . . . . . . . . . . . . . . . . . . . . . . . . 4,485 100.0 75.6 (2.2) 9.6 (1.5) 14.8 (1.8)High school diploma or GED . . . . . . . . . . . . . . . . . . . . . . . . . . . 10,099 100.0 71.8 (1.7) 10.0 (1.3) 18.2 (1.2)Some college, no bachelor’s degree . . . . . . . . . . . . . . . . . . . . . 9,850 100.0 68.7 (1.9) 9.6 (1.1) 20.7 (1.7)Bachelor’s degree or higher . . . . . . . . . . . . . . . . . . . . . . . . . . . . 9,446 100.0 68.9 (1.9) 8.5 (1.1) 22.6 (1.7)
See footnotes at end of table.
Page 12 National Health Statistics Reports Number 105 August 10, 2017
Table 2. Number of women and men aged 15–44 who had sexual intercourse in the past 4 weeks and percent distribution by consistency of condom use, according to demographic and behavioral characteristics: United States, 2011–2015—Con.
Characteristic
Number (thousands) who had sexual intercourse
in past 4 weeks
Percent of times a condom was used in past 4 weeks
Total None (0%) Some (1–99%) Always (100%)
Hispanic origin and race Percent distribution (SE)
Hispanic or Latino . . . . . . . . . . . . . . . . . . . . . . . . . . . . . . . . . . . 8,261 100.0 66.4 (2.0) 10.7 (1.2) 22.9 (1.7)Not Hispanic or Latino . . . . . . . . . . . . . . . . . . . . . . . . . . . . . . . .
White, single race . . . . . . . . . . . . . . . . . . . . . . . . . . . . . . . . . . 21,878 100.0 67.9 (1.4) 9.9 (0.8) 22.2 (1.1)Black or African American, single race. . . . . . . . . . . . . . . . . . 4,698 100.0 58.3 (2.4) 11.2 (1.4) 30.6 (2.0)
Relationship with last sexual partner at last sex
Cohabiting, engaged or married . . . . . . . . . . . . . . . . . . . . . . . . 27,659 100.0 78.5 (1.0) 7.8 (0.6) 13.8 (0.8)Going with her or going steady . . . . . . . . . . . . . . . . . . . . . . . . . 6,289 100.0 40.8 (2.1) 15.2 (1.5) 44.1 (2.0)Going out once in a while/just friends/
had just met her . . . . . . . . . . . . . . . . . . . . . . . . . . . . . . . . . . . . 3,984 100.0 21.4 (2.1) 18.9 (2.3) 59.7 (2.6)
Number of opposite-sex sexual partners in past 12 months
One partner . . . . . . . . . . . . . . . . . . . . . . . . . . . . . . . . . . . . . . . . 31,007 100.0 73.2 (1.0) 8.2 (0.6) 18.6 (0.9)Two or more partners . . . . . . . . . . . . . . . . . . . . . . . . . . . . . . . . . 7,068 100.0 34.1 (1.7) 18.9 (1.6) 47.0 (1.8)
*Test of trend was significant across the three survey time periods (p < 0.05).1Includes persons of other or multiple race and origin groups and persons in “other” types of relationships, not shown separately.2Limited to those aged 22–44 at interview. GED is general educational development high school equivilency diploma.3Available for women in 2013–2015 only.
NOTES: SE is standard error. Chi-square test statistics for each variable by condom use consistency in past 4 weeks were statistically significant except for education (men only) (p < 0.05). Percentages may not add to 100 due to rounding. See technical notes for descriptions of variables used in this report.
SOURCE: NCHS, 2002, 2006–2010 and 2011–2015 National Survey of Family Growth.
National Health Statistics Reports Number 105 August 10, 2017 Page 13
Table 3. Number of women and men aged 15–44 who used a condom at last sexual intercourse in the past 12 months and percent distribution by method or method combination, according to selected demographic and behavioral characteristics: United States, 2011–2015
CharacteristicNumber
(thousands) Total
Condom use at last intercourse in past 12 months
Condom use onlyCondom plus
hormonal method2Condom plus
nonhormonal method3
All women aged 15–441 Percent distribution (SE)
Total, 2002 . . . . . . . . . . . . . . . . . . . . . . . . . . . . . . . . . . . . . . . . . 11,430 100.0 *67.9 (1.5) 21.1 (1.2) *11.0 (1.1)Total, 2006–2010 . . . . . . . . . . . . . . . . . . . . . . . . . . . . . . . . . . . . 12,407 100.0 65.6 (1.6) 22.6 (1.6) 11.9 (1.0)Total, 2011–2015 . . . . . . . . . . . . . . . . . . . . . . . . . . . . . . . . . . . . 11,466 100.0 59.9 (1.7) 25.0 (1.6) 15.1 (1.2)
Age group (years)
15–19 . . . . . . . . . . . . . . . . . . . . . . . . . . . . . . . . . . . . . . . . . . . . . 2,098 100.0 53.0 (3.4) 37.4 (3.3) 9.7 (1.8)20–24. . . . . . . . . . . . . . . . . . . . . . . . . . . . . . . . . . . . . . . . . . . . . 2,813 100.0 52.5 (3.5) 36.5 (3.4) 11.0 (1.7)25–44. . . . . . . . . . . . . . . . . . . . . . . . . . . . . . . . . . . . . . . . . . . . . 6,555 100.0 65.2 (2.2) 16.2 (1.6) 18.6 (1.9)
25–34 . . . . . . . . . . . . . . . . . . . . . . . . . . . . . . . . . . . . . . . . . . . 4,034 100.0 62.0 (2.7) 21.5 (2.2) 16.5 (1.9)35–44 . . . . . . . . . . . . . . . . . . . . . . . . . . . . . . . . . . . . . . . . . . . 2,521 100.0 70.5 (3.2) 7.7 (1.5) 21.9 (3.1)
Education4
No high school diploma or GED . . . . . . . . . . . . . . . . . . . . . . . . 735 100.0 75.4 (3.9) 11.8 (3.4) 12.8 (2.9)High school diploma or GED . . . . . . . . . . . . . . . . . . . . . . . . . . . 1,696 100.0 62.8 (3.8) 12.3 (2.0) 24.9 (3.5)Some college, no bachelor’s degree . . . . . . . . . . . . . . . . . . . . . 2,317 100.0 54.2 (3.1) 23.4 (2.8) 22.3 (2.9)Bachelor’s degree or higher . . . . . . . . . . . . . . . . . . . . . . . . . . . . 3,347 100.0 65.2 (3.3) 24.1 (3.1) 10.7 (1.7)
Hispanic origin and race
Hispanic or Latina . . . . . . . . . . . . . . . . . . . . . . . . . . . . . . . . . . . 2,279 100.0 68.6 (2.9) 13.3 (2.2) 18.1 (2.7)Not Hispanic or Latina . . . . . . . . . . . . . . . . . . . . . . . . . . . . . . . . 5,972
White, single race . . . . . . . . . . . . . . . . . . . . . . . . . . . . . . . . . . 2,073 100.0 55.1 (2.6) 31.4 (2.6) 13.5 (1.6)Black or African American, single race. . . . . . . . . . . . . . . . . . 100.0 59.1 (3.3) 23.2 (2.7) 17.6 (2.4)
Relationship with last sexual partner at last sex5
Cohabiting, engaged or married . . . . . . . . . . . . . . . . . . . . . . . . 2,405 100.0 76.8 (2.8) 12.1 (2.2) 11.1 (2.3)Going with him or going steady . . . . . . . . . . . . . . . . . . . . . . . . . 1,830 100.0 43.0 (3.9) 41.9 (4.3) 15.0 (2.5)Going out once in a while/just friends/
had just met him . . . . . . . . . . . . . . . . . . . . . . . . . . . . . . . . . . . 1,237 100.0 54.9 (4.8) 25.4 (4.0) 19.7 (3.7)
Number of opposite-sex sexual partners in past 12 months
One partner . . . . . . . . . . . . . . . . . . . . . . . . . . . . . . . . . . . . . . . . 8,906 100.0 62.8 (1.8) 23.5 (1.7) 13.7 (1.2)Two or more partners . . . . . . . . . . . . . . . . . . . . . . . . . . . . . . . . . 2,559 100.0 49.6 (2.9) 30.5 (2.9) 19.9 (2.6)
All men aged 15–441
Total, 2002 . . . . . . . . . . . . . . . . . . . . . . . . . . . . . . . . . . . . . . . . . 14,211 100.0 *’63.0 (1.8) 28.9 (1.7) 8.4 (1.3)Total, 2006–2010 . . . . . . . . . . . . . . . . . . . . . . . . . . . . . . . . . . . . 16,074 100.0 57.6 (1.5) 34.0 (1.4) 8.5 (0.8)Total, 2011–2015 . . . . . . . . . . . . . . . . . . . . . . . . . . . . . . . . . . . . 16,115 100.0 56.4 (1.6) 33.2 (1.7) 10.5 (0.8)
Age group (years)
15–19 . . . . . . . . . . . . . . . . . . . . . . . . . . . . . . . . . . . . . . . . . . . . . 3,096 100.0 42.7 (2.9) 45.5 (2.9) 11.8 (1.8)20–24. . . . . . . . . . . . . . . . . . . . . . . . . . . . . . . . . . . . . . . . . . . . . 4,369 100.0 45.7 (2.8) 44.5 (3.3) 9.8 (1.6)25–44. . . . . . . . . . . . . . . . . . . . . . . . . . . . . . . . . . . . . . . . . . . . . 8,650 100.0 66.7 (1.8) 23.0 (1.8) 10.3 (1.0)
25–34 . . . . . . . . . . . . . . . . . . . . . . . . . . . . . . . . . . . . . . . . . . . 5,594 100.0 60.7 (2.5) 29.0 (2.5) 10.3 (1.3)35–44 . . . . . . . . . . . . . . . . . . . . . . . . . . . . . . . . . . . . . . . . . . . 3,056 100.0 77.7 (2.9) 12.0 (2.1) 10.3 (2.0)
Education4
No high school diploma or GED . . . . . . . . . . . . . . . . . . . . . . . . 1,162 100.0 75.5 (4.3) 18.0 (3.5) 6.5 (2.1)High school diploma or GED . . . . . . . . . . . . . . . . . . . . . . . . . . . 2,830 100.0 62.2 (3.0) 27.4 (2.7) 10.4 (1.9)Some college, no bachelor’s degree . . . . . . . . . . . . . . . . . . . . . 3,643 100.0 54.9 (3.1) 32.9 (3.2) 12.1 (1.8)Bachelor’s degree or higher . . . . . . . . . . . . . . . . . . . . . . . . . . . . 3,719 100.0 65.7 (2.7) 26.2 (2.7) 8.0 (1.8)
Hispanic origin and race
Hispanic or Latino . . . . . . . . . . . . . . . . . . . . . . . . . . . . . . . . . . . 3,357 100.0 62.4 (3.5) 24.2 (2.9) 13.4 (2.2)Not Hispanic or Latino . . . . . . . . . . . . . . . . . . . . . . . . . . . . . . . .
White, single race . . . . . . . . . . . . . . . . . . . . . . . . . . . . . . . . . . 8,562 100.0 52.5 (2.2) 39.7 (2.2) 7.9 (0.9)Black or African American, single race. . . . . . . . . . . . . . . . . . 2,544 100.0 55.6 (2.9) 28.3 (2.5) 16.1 (2.8)
See footnotes at end of table.
Page 14 National Health Statistics Reports Number 105 August 10, 2017
Table 3. Number of women and men aged 15–44 who used a condom at last sexual intercourse in the past 12 months and percent distribution by method or method combination, according to selected demographic and behavioral characteristics: United States, 2011–2015—Con.
CharacteristicNumber
(thousands) Total
Condom use at last intercourse in past 12 months
Condom use onlyCondom plus
hormonal method2Condom plus
nonhormonal method3
All women aged 15–441 Percent distribution (SE)
Cohabiting, engaged or married � � � � � � � � � � � � � � � � � � � � � � � � 5,714 100�0 70�6 (2�2) 20�3 (1�9) 9�1 (1�4)Going with her or going steady � � � � � � � � � � � � � � � � � � � � � � � � � 5,126 100�0 42�7 (2�9) 45�8 (2�8) 11�5 (1�3)Going out once in a while/just friends/
had just met her � � � � � � � � � � � � � � � � � � � � � � � � � � � � � � � � � � � � 4,970 100�0 55�0 (1�9) 33�8 (2�2) 11�2 (1�4)
Number of opposite-sex sexual partners in past 12 months
One partner � � � � � � � � � � � � � � � � � � � � � � � � � � � � � � � � � � � � � � � � 10,686 100�0 61�1 (2�0) 29�7 (1�7) 9�2 (1�0)Two or more partners � � � � � � � � � � � � � � � � � � � � � � � � � � � � � � � � � 5,428 100�0 47�1 (2�4) 40�0 (2�6) 13�0 (1�5)
*Test of trend was significant across the three survey time periods (p < 0�05)�1Includes persons of other or multiple race and origin groups and persons in “other” types of relationships, not shown separately�2Includes the contraceptive pill, implants, injectibles, contraceptive patch, contraceptive ring or emergency contraception� Hormonal IUD is not included because the type of IUD cannot be ascertained�3All other methods, excluding condom and hormonal methods� Thus, if other method was combined with condom or hormonal method, it is not counted� Other methods include withdrawal, sterilization, IUD, female condom, diaphragm, cervical cap, spermicidal foam, jelly, cream or suppository, sponge, calendar rhythm method, and “other” methods�4Limited to those aged 22–44 at interview� GED is general educational development high school equivalency diploma�5Available for women in 2013–2015 only�
NOTES: SE is standard error� Chi-square test statistics for each variable by method or method combination were statistically significant (p < 0�05)� Percentages may not add to 100 due to rounding� Male respondents may not always be aware of their female partner’s hormonal contraceptive use� See technical notes for descriptions of variables used in this report�
SOURCE: NCHS, 2002, 2006–2010 and 2011–2015 National Survey of Family Growth�
National Health Statistics Reports Number 105 August 10, 2017 Page 15
Technical NotesConsistency of condom use in past 4
weeks—Women (EL-2 PSWKCOND1/EL-3 PSWKCOND2) and men (BC-10 CONFREQ) aged 15–44 who had sexual intercourse in the past 4 weeks were asked how many of those times they used a condom. The number of times condoms were used was divided by coital frequency in the past 4 weeks (female EL-1 PST4WKSX/male BC-9 SEXFREQ) to obtain the percentage of condom use during sexual intercourse, grouped as 0% (“none”), 1–99% (“some”) and 100% (“always”).
Consistency of condom use in past 12 months—Women (EL–4 P12MOCON) and men (BC–8a P12MOCONO/BC-8b P12MOCON, added in 2011) aged 15–44 who had sexual intercourse in the past 12 months were asked whether they used a condom during sex with their partner(s) “every time,” most of the time,” “about half of the time,” “some of the time” or “none of the time” in the past 12 months.
Contraceptive method use at last intercourse in past 12 months—For women and men aged 15–44 who had sexual intercourse in the past 12 months, the recodes METH12M1 – METH12M4 indicate up to four contraceptive methods used during last sex. If a condom was mentioned on any one of the four methods, the respondent was coded as having used a condom during sexual intercourse in the past 12 months. Respondents who were coded as using condoms plus hormonal methods includes the female partners’ use of the contraceptive pill, implants, injectables, contraceptive patch, contraceptive ring or emergency contraception. Respondents who were coded as using condoms plus nonhormonal methods include all methods other than hormonal methods that may be used by the female or male partner: withdrawal, sterilization, IUD, female condom, diaphragm, cervical cap, spermicidal foam, jelly, cream or suppository, sponge, calendar rhythm method and “other” methods. There are two types of intrauterine devices available in the United States—the copper IUD (available since 1988) and hormonal IUD (available since 2001). Until 2015, questions on method use at last intercourse in the NSFG did not ask
women to specify which type of IUD was used. Men are never asked the type of (partner’s) IUD. For these reasons, women and men who used a condom and the IUD were grouped along with use of “condom plus nonhormonal method” in this report.
Problems with condom use in past four weeks—Starting in 2013, women aged 15–44 who used a condom during sexual intercourse in the past 4 weeks were asked two separate questions about problems with condom use. Women who had sex only once and used a condom in the past 4 weeks (EL-1 PSWKCOND1) were asked whether the condom “broke or completely fell off during intercourse or withdrawal” (EL-3a COND1BRK) and whether the “condom was used for only part of the time during intercourse. That is, was the condom put on after you started having sex, or taken off during sex but before ejaculation?” (EL-3b COND1OFF). Women who had sex more than once during past 4 weeks and had used a condom at least once (EL-2 PSWKCOND2) were asked how many times these problems had occurred in the past four weeks (EL-3c CONDBRFL/ EL-3d CONDOFF). To convert the frequency of condom use problems into a percentage, the number of condom use problems was divided by the number of condom uses in the past 4 weeks, multiplied by 100 and then categorized as “0%,” “1–99%” or “100%.” These questions were not available for men until 2015, thus were not available for analysis in this report.
Relationship with last sexual partner at last sex—The categories are: “married,” “engaged,” “living together in a sexual relationship,” “going with (him)/(her) or going steady,” “going out with (him)/(her) once in a while,” “just friends,” “had just met,” or “something else.” Due to small sample sizes, some categories were collapsed. Sample sizes for “something else” were too small to be shown separately. For women aged 15–44, information about the type of relationship with her male sexual partners is obtained for the first sexual partner and for up to three recent partners in the past 12 months, or last partner ever. These relationship variables include:
● Relationship at first sex with first sexual partner (CG-5 KNOWFP).
● Current relationship with first sexual partner (CG-7f FPRN).
● Relationship at first sex with up to three sexual partners in the past 12 months or last partner ever (CI-11 P1YRFx).
● Current relationship with up to three sexual partners in the past 12 months or last partner ever (CI-17 P1YRNx).
The relationship at last sex variable used in this report was defined by using a combination of existing questions about first and current sexual partners in the past 12 months and two new questions, added in 2013, that ask about the relationship with sexual partners who were not current (CG-7a FPOTHREL and CI-8 P1YOTHRELx). Where there was more than one partner mentioned in the past 12 months, the relationship type for the most recent partner was used. Given that the construction of the variable required the use of the two new questions, data on condom use by relationship type are shown for women during 2013–2015 only. For women, the constructed variable for the relationship with last sexual partner at last sex is defined similarly, but is not exactly comparable, to the male recode LSEXRLTN.
Page 16
National H
ealth Statistics R
eports N
umber 105
August 10, 2017
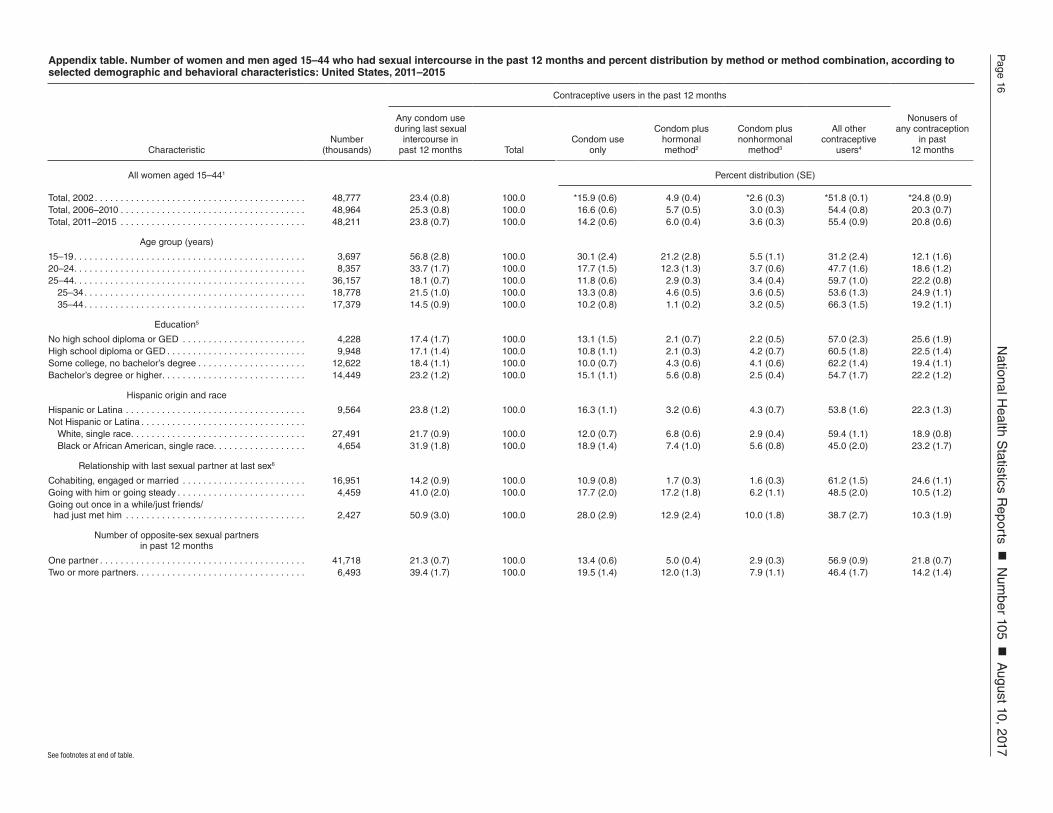
Appendix table. Number of women and men aged 15–44 who had sexual intercourse in the past 12 months and percent distribution by method or method combination, according to selected demographic and behavioral characteristics: United States, 2011–2015
CharacteristicNumber
(thousands)
Contraceptive users in the past 12 months
Any condom use during last sexual
intercourse in past 12 months Total
Condom use only
Condom plus hormonalmethod2
Condom plus nonhormonal
method3
All other contraceptive
users4
Nonusers of any contraception
in past 12 months
All women aged 15–441 Percent distribution (SE)
Total, 2002 . . . . . . . . . . . . . . . . . . . . . . . . . . . . . . . . . . . . . . . . . 48,777 23.4 (0.8) 100.0 *15.9 (0.6) 4.9 (0.4) *2.6 (0.3) *51.8 (0.1) *24.8 (0.9)Total, 2006–2010 . . . . . . . . . . . . . . . . . . . . . . . . . . . . . . . . . . . . 48,964 25.3 (0.8) 100.0 16.6 (0.6) 5.7 (0.5) 3.0 (0.3) 54.4 (0.8) 20.3 (0.7)Total, 2011–2015 . . . . . . . . . . . . . . . . . . . . . . . . . . . . . . . . . . . . 48,211 23.8 (0.7) 100.0 14.2 (0.6) 6.0 (0.4) 3.6 (0.3) 55.4 (0.9) 20.8 (0.6)
Age group (years)
15–19 . . . . . . . . . . . . . . . . . . . . . . . . . . . . . . . . . . . . . . . . . . . . . 3,697 56.8 (2.8) 100.0 30.1 (2.4) 21.2 (2.8) 5.5 (1.1) 31.2 (2.4) 12.1 (1.6)20–24. . . . . . . . . . . . . . . . . . . . . . . . . . . . . . . . . . . . . . . . . . . . . 8,357 33.7 (1.7) 100.0 17.7 (1.5) 12.3 (1.3) 3.7 (0.6) 47.7 (1.6) 18.6 (1.2)25–44. . . . . . . . . . . . . . . . . . . . . . . . . . . . . . . . . . . . . . . . . . . . . 36,157 18.1 (0.7) 100.0 11.8 (0.6) 2.9 (0.3) 3.4 (0.4) 59.7 (1.0) 22.2 (0.8)
25–34 . . . . . . . . . . . . . . . . . . . . . . . . . . . . . . . . . . . . . . . . . . . 18,778 21.5 (1.0) 100.0 13.3 (0.8) 4.6 (0.5) 3.6 (0.5) 53.6 (1.3) 24.9 (1.1)35–44 . . . . . . . . . . . . . . . . . . . . . . . . . . . . . . . . . . . . . . . . . . . 17,379 14.5 (0.9) 100.0 10.2 (0.8) 1.1 (0.2) 3.2 (0.5) 66.3 (1.5) 19.2 (1.1)
Education5
No high school diploma or GED . . . . . . . . . . . . . . . . . . . . . . . . 4,228 17.4 (1.7) 100.0 13.1 (1.5) 2.1 (0.7) 2.2 (0.5) 57.0 (2.3) 25.6 (1.9)High school diploma or GED . . . . . . . . . . . . . . . . . . . . . . . . . . . 9,948 17.1 (1.4) 100.0 10.8 (1.1) 2.1 (0.3) 4.2 (0.7) 60.5 (1.8) 22.5 (1.4)Some college, no bachelor’s degree . . . . . . . . . . . . . . . . . . . . . 12,622 18.4 (1.1) 100.0 10.0 (0.7) 4.3 (0.6) 4.1 (0.6) 62.2 (1.4) 19.4 (1.1)Bachelor’s degree or higher . . . . . . . . . . . . . . . . . . . . . . . . . . . . 14,449 23.2 (1.2) 100.0 15.1 (1.1) 5.6 (0.8) 2.5 (0.4) 54.7 (1.7) 22.2 (1.2)
Hispanic origin and race
Hispanic or Latina . . . . . . . . . . . . . . . . . . . . . . . . . . . . . . . . . . . 9,564 23.8 (1.2) 100.0 16.3 (1.1) 3.2 (0.6) 4.3 (0.7) 53.8 (1.6) 22.3 (1.3)Not Hispanic or Latina . . . . . . . . . . . . . . . . . . . . . . . . . . . . . . . .
White, single race . . . . . . . . . . . . . . . . . . . . . . . . . . . . . . . . . . 27,491 21.7 (0.9) 100.0 12.0 (0.7) 6.8 (0.6) 2.9 (0.4) 59.4 (1.1) 18.9 (0.8)Black or African American, single race. . . . . . . . . . . . . . . . . . 4,654 31.9 (1.8) 100.0 18.9 (1.4) 7.4 (1.0) 5.6 (0.8) 45.0 (2.0) 23.2 (1.7)
Relationship with last sexual partner at last sex6
Cohabiting, engaged or married . . . . . . . . . . . . . . . . . . . . . . . . 16,951 14.2 (0.9) 100.0 10.9 (0.8) 1.7 (0.3) 1.6 (0.3) 61.2 (1.5) 24.6 (1.1)Going with him or going steady . . . . . . . . . . . . . . . . . . . . . . . . . 4,459 41.0 (2.0) 100.0 17.7 (2.0) 17.2 (1.8) 6.2 (1.1) 48.5 (2.0) 10.5 (1.2)Going out once in a while/just friends/
had just met him . . . . . . . . . . . . . . . . . . . . . . . . . . . . . . . . . . . 2,427 50.9 (3.0) 100.0 28.0 (2.9) 12.9 (2.4) 10.0 (1.8) 38.7 (2.7) 10.3 (1.9)
Number of opposite-sex sexual partners in past 12 months
One partner . . . . . . . . . . . . . . . . . . . . . . . . . . . . . . . . . . . . . . . . 41,718 21.3 (0.7) 100.0 13.4 (0.6) 5.0 (0.4) 2.9 (0.3) 56.9 (0.9) 21.8 (0.7)Two or more partners . . . . . . . . . . . . . . . . . . . . . . . . . . . . . . . . . 6,493 39.4 (1.7) 100.0 19.5 (1.4) 12.0 (1.3) 7.9 (1.1) 46.4 (1.7) 14.2 (1.4)
See footnotes at end of table.
National H
ealth Statistics R
eports N
umber 105
August 10, 2017
Page 17
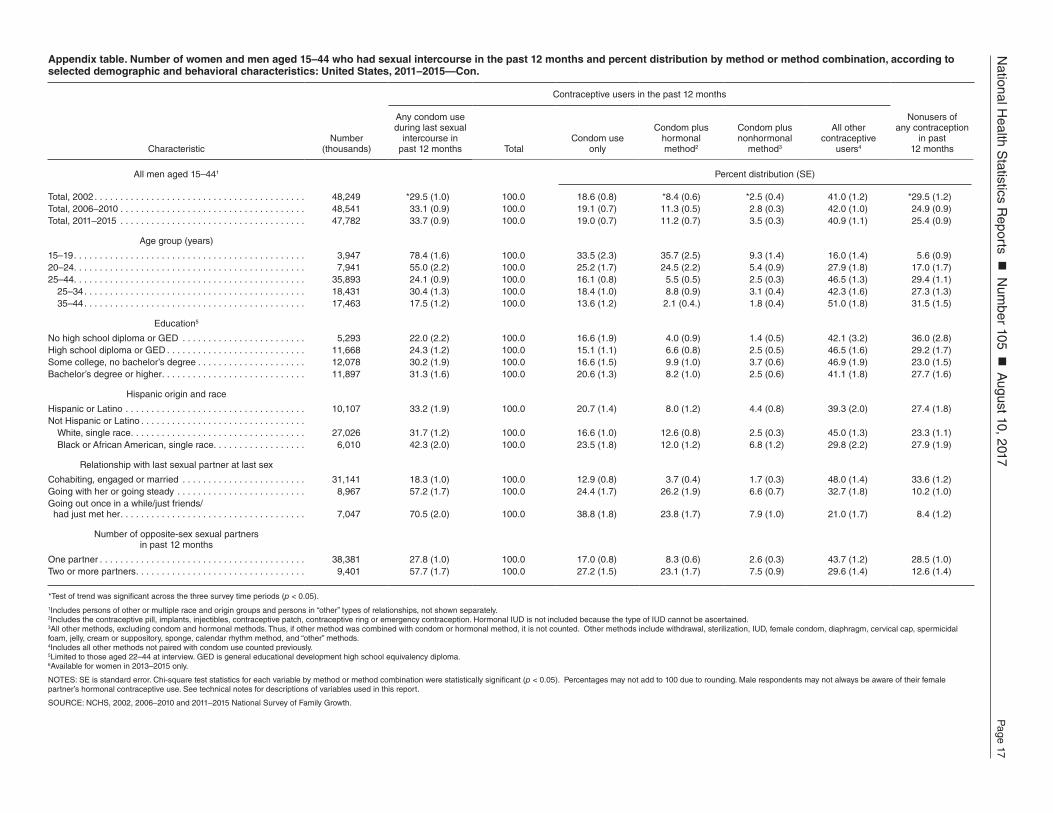
Appendix table. Number of women and men aged 15–44 who had sexual intercourse in the past 12 months and percent distribution by method or method combination, according to selected demographic and behavioral characteristics: United States, 2011–2015—Con.
CharacteristicNumber
(thousands)
Contraceptive users in the past 12 months
Any condom use during last sexual
intercourse in past 12 months Total
Condom use only
Condom plus hormonalmethod2
Condom plus nonhormonal
method3
All other contraceptive
users4
Nonusers of any contraception
in past 12 months
All men aged 15–441 Percent distribution (SE)
Total, 2002 . . . . . . . . . . . . . . . . . . . . . . . . . . . . . . . . . . . . . . . . . 48,249 *29.5 (1.0) 100.0 18.6 (0.8) *8.4 (0.6) *2.5 (0.4) 41.0 (1.2) *29.5 (1.2)Total, 2006–2010 . . . . . . . . . . . . . . . . . . . . . . . . . . . . . . . . . . . . 48,541 33.1 (0.9) 100.0 19.1 (0.7) 11.3 (0.5) 2.8 (0.3) 42.0 (1.0) 24.9 (0.9)Total, 2011–2015 . . . . . . . . . . . . . . . . . . . . . . . . . . . . . . . . . . . . 47,782 33.7 (0.9) 100.0 19.0 (0.7) 11.2 (0.7) 3.5 (0.3) 40.9 (1.1) 25.4 (0.9)
Age group (years)
15–19 . . . . . . . . . . . . . . . . . . . . . . . . . . . . . . . . . . . . . . . . . . . . . 3,947 78.4 (1.6) 100.0 33.5 (2.3) 35.7 (2.5) 9.3 (1.4) 16.0 (1.4) 5.6 (0.9)20–24. . . . . . . . . . . . . . . . . . . . . . . . . . . . . . . . . . . . . . . . . . . . . 7,941 55.0 (2.2) 100.0 25.2 (1.7) 24.5 (2.2) 5.4 (0.9) 27.9 (1.8) 17.0 (1.7)25–44. . . . . . . . . . . . . . . . . . . . . . . . . . . . . . . . . . . . . . . . . . . . . 35,893 24.1 (0.9) 100.0 16.1 (0.8) 5.5 (0.5) 2.5 (0.3) 46.5 (1.3) 29.4 (1.1)
25–34 . . . . . . . . . . . . . . . . . . . . . . . . . . . . . . . . . . . . . . . . . . . 18,431 30.4 (1.3) 100.0 18.4 (1.0) 8.8 (0.9) 3.1 (0.4) 42.3 (1.6) 27.3 (1.3)35–44 . . . . . . . . . . . . . . . . . . . . . . . . . . . . . . . . . . . . . . . . . . . 17,463 17.5 (1.2) 100.0 13.6 (1.2) 2.1 (0.4.) 1.8 (0.4) 51.0 (1.8) 31.5 (1.5)
Education5
No high school diploma or GED . . . . . . . . . . . . . . . . . . . . . . . . 5,293 22.0 (2.2) 100.0 16.6 (1.9) 4.0 (0.9) 1.4 (0.5) 42.1 (3.2) 36.0 (2.8)High school diploma or GED . . . . . . . . . . . . . . . . . . . . . . . . . . . 11,668 24.3 (1.2) 100.0 15.1 (1.1) 6.6 (0.8) 2.5 (0.5) 46.5 (1.6) 29.2 (1.7)Some college, no bachelor’s degree . . . . . . . . . . . . . . . . . . . . . 12,078 30.2 (1.9) 100.0 16.6 (1.5) 9.9 (1.0) 3.7 (0.6) 46.9 (1.9) 23.0 (1.5)Bachelor’s degree or higher . . . . . . . . . . . . . . . . . . . . . . . . . . . . 11,897 31.3 (1.6) 100.0 20.6 (1.3) 8.2 (1.0) 2.5 (0.6) 41.1 (1.8) 27.7 (1.6)
Hispanic origin and race
Hispanic or Latino . . . . . . . . . . . . . . . . . . . . . . . . . . . . . . . . . . . 10,107 33.2 (1.9) 100.0 20.7 (1.4) 8.0 (1.2) 4.4 (0.8) 39.3 (2.0) 27.4 (1.8)Not Hispanic or Latino . . . . . . . . . . . . . . . . . . . . . . . . . . . . . . . .
White, single race . . . . . . . . . . . . . . . . . . . . . . . . . . . . . . . . . . 27,026 31.7 (1.2) 100.0 16.6 (1.0) 12.6 (0.8) 2.5 (0.3) 45.0 (1.3) 23.3 (1.1)Black or African American, single race. . . . . . . . . . . . . . . . . . 6,010 42.3 (2.0) 100.0 23.5 (1.8) 12.0 (1.2) 6.8 (1.2) 29.8 (2.2) 27.9 (1.9)
Relationship with last sexual partner at last sex
Cohabiting, engaged or married . . . . . . . . . . . . . . . . . . . . . . . . 31,141 18.3 (1.0) 100.0 12.9 (0.8) 3.7 (0.4) 1.7 (0.3) 48.0 (1.4) 33.6 (1.2)Going with her or going steady . . . . . . . . . . . . . . . . . . . . . . . . . 8,967 57.2 (1.7) 100.0 24.4 (1.7) 26.2 (1.9) 6.6 (0.7) 32.7 (1.8) 10.2 (1.0)Going out once in a while/just friends/
had just met her . . . . . . . . . . . . . . . . . . . . . . . . . . . . . . . . . . . . 7,047 70.5 (2.0) 100.0 38.8 (1.8) 23.8 (1.7) 7.9 (1.0) 21.0 (1.7) 8.4 (1.2)
Number of opposite-sex sexual partners in past 12 months
One partner . . . . . . . . . . . . . . . . . . . . . . . . . . . . . . . . . . . . . . . . 38,381 27.8 (1.0) 100.0 17.0 (0.8) 8.3 (0.6) 2.6 (0.3) 43.7 (1.2) 28.5 (1.0)Two or more partners . . . . . . . . . . . . . . . . . . . . . . . . . . . . . . . . . 9,401 57.7 (1.7) 100.0 27.2 (1.5) 23.1 (1.7) 7.5 (0.9) 29.6 (1.4) 12.6 (1.4)
*Test of trend was significant across the three survey time periods (p < 0.05).1Includes persons of other or multiple race and origin groups and persons in “other” types of relationships, not shown separately.2Includes the contraceptive pill, implants, injectibles, contraceptive patch, contraceptive ring or emergency contraception. Hormonal IUD is not included because the type of IUD cannot be ascertained.3All other methods, excluding condom and hormonal methods. Thus, if other method was combined with condom or hormonal method, it is not counted. Other methods include withdrawal, sterilization, IUD, female condom, diaphragm, cervical cap, spermicidal foam, jelly, cream or suppository, sponge, calendar rhythm method, and “other” methods.4Includes all other methods not paired with condom use counted previously.5Limited to those aged 22–44 at interview. GED is general educational development high school equivalency diploma.6Available for women in 2013–2015 only.
NOTES: SE is standard error. Chi-square test statistics for each variable by method or method combination were statistically significant (p < 0.05). Percentages may not add to 100 due to rounding. Male respondents may not always be aware of their female partner’s hormonal contraceptive use. See technical notes for descriptions of variables used in this report.
SOURCE: NCHS, 2002, 2006–2010 and 2011–2015 National Survey of Family Growth.

National Health Statistics Reports Number 105 August 10, 2017
For more NCHS NHSRs, visit: https://www.cdc.gov/nchs/products/nhsr.htm.
For e-mail updates on NCHS publication releases, subscribe online at: https://www.cdc.gov/nchs/govdelivery.htm. For questions or general information about NCHS: Tel: 1–800–CDC–INFO (1–800–232–4636) • TTY: 1–888–232–6348
Internet: https://www.cdc.gov/nchs • Online request form: https://www.cdc.gov/info DHHS Publication No. 2017–1250 • CS280236
FIRST CLASS MAILPOSTAGE & FEES PAID
CDC/NCHS PERMIT NO. G-284
U.S. DEPARTMENT OF HEALTH & HUMAN SERVICES
Centers for Disease Control and Prevention National Center for Health Statistics 3311 Toledo Road, Room 4551, MS P08 Hyattsville, MD 20782–2064
OFFICIAL BUSINESS PENALTY FOR PRIVATE USE, $300
Suggested citation
Copen, CE. Condom use during sexual intercourse among women and men aged 15–44 in the United States: 2011–2015 National Survey of Family Growth. National health statistics reports; no. 105. Hyattsville, MD: National Center for Health Statistics. 2017.
Copyright information
All material appearing in this report is in the public domain and may be reproduced or copied without permission; citation as to source, however, is appreciated.
National Center for Health Statistics
Charles J. Rothwell, M.S., M.B.A., DirectorJennifer H. Madans, Ph.D., Associate Director
for Science
Division of Vital Statistics
Delton Atkinson, M.P.H., M.P.H., P.M.P., Director
Hanyu Ni, Ph.D., Associate Director for Science
Acknowledgments
The 2011–2015 National Survey of Family Growth (NSFG) was conducted by the National Center for Health Statistics (NCHS) with the support and assistance of a number of other organizations and individuals. Interviewing and other tasks were carried out by the University of Michigan’s Survey Research Center, Institute for Social Research, under a contract with NCHS. The 2011–2015 NSFG was jointly planned and funded by the following programs and agencies of the U.S. Departments of Health and Human Services: National Institute for Child Health and Human Development/Population Dynamics Branch, Office of Population Affairs, National Center for Health Statistics (CDC), Division of HIV/AIDS Prevention (CDC), Division of Sexually Transmitted Disease Prevention (CDC), Division of Reproductive Health (CDC), Division of Cancer Prevention & Control (CDC), Division of Birth Defects & Developmental Disabilities (CDC), Office of Planning, Research, and Evaluation, and Children’s Bureau of the Administration for Children and Families.
NCHS gratefully acknowledges the contributions of these programs and agencies, and all others who assisted in designing and carrying out the 2011–2015 NSFG.
This report was prepared under the general direction of Delton Atkinson, Director of NCHS’s Division of Vital Statistics (DVS). The authors are also grateful for the valuable comments provided by Hanyu Ni, DVS Associate Director for Science, and Jennifer Madans, NCHS Associate Director for Science.