national forests: history - environmental science & … forests: history 2 wwii to earth day...
TRANSCRIPT

National Forests: History 1
1800-1891: Disposition EraOpen access to forests
1891-1911 Pinchot Era: Establishing the Forests1891 Forest Reserve Act: President can create reserves 1897 Organic Act: Est. Forest Service1905 Transfer of Forests from Interior to Agriculture1911 Weeks Act: Acquisition of Eastern forestland
1911-1945 Post-Pinchot: Custodial EraForest Service develops expertise mystiqueTimber is dominant use but demand lowIron triangle: Forest service, timber industry/communities, Western Congressional delegation

Harrison-R
Cleveland-D
T. Roosevelt-R


National Forests: History 2
WWII to Earth Day 1970: Getting out the CutIncrease in timber demand for war supplies; post-war housing boomRecreational visitors increaseLots of clear cutting
1970 to 1993: Pluralist Forest Policy RegimeNational Forest Management Act of 1976Judicial scrutiny
1993-Now: Post-Spotted OwlConflicts over ESAReduced timber harvest in NWReforms of Forest Service Planning


Public forests account for 29% of US Timberland, but 2% of harvest—this has been declining over time

Growing stock harvest by major owner, region and year
Click here for additional historic data on U.S. Timber Production, Trade, Consumption, and Price Statistics 1965-2002.
Return to FIA HomeSource: National Report on Forest Resources
As public policy has shifted, removals have moved dramatically from public land in the West to private land in the East in the last 15 years.
0
2
4
6
8
10
12
14
1952
1962
1976
1986
1996
2001
1952
1962
1976
1986
1996
2001
EAST WEST
Bill
ion
cubi
c fe
et
Public
Private
Return
NEXT


Gifford Pinchot: “The Grand Master”
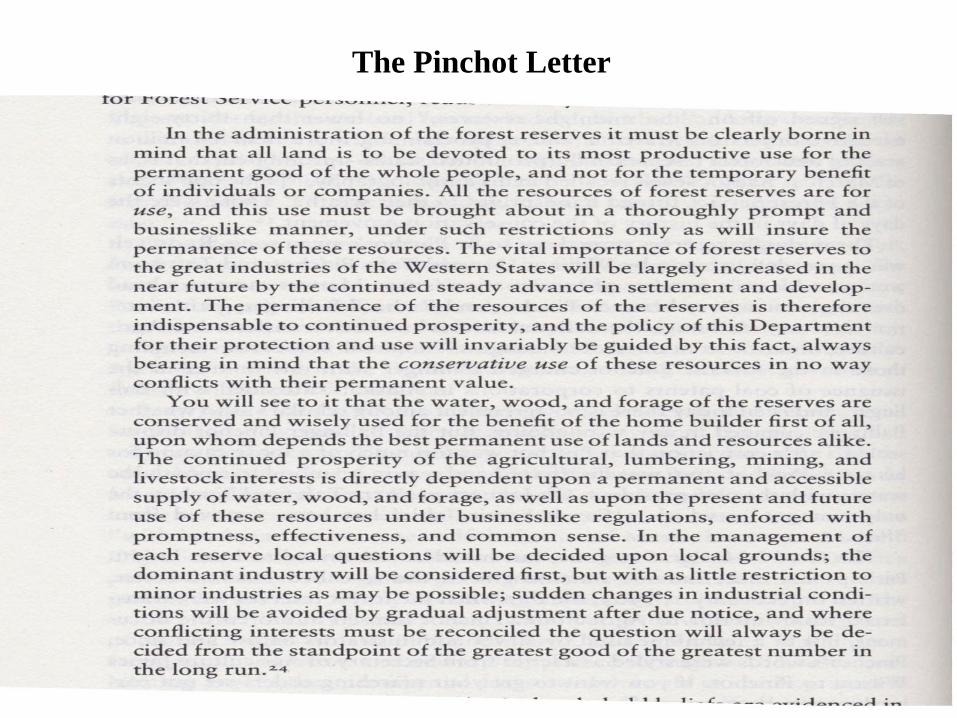
The Pinchot Letter


Early Governing Statutes1897 Organic Act
Somewhat a backlash to “preservation” idea of Forest ReservesGoal: “To improve and protect the forest within the reservation, or for the purpose of securing favorable conditions of water flows, and to furnish a continuous supply of timber…”Forestry Division authorized to “regulate use and occupancy”Authorized sale of “dead, matured, or large growth tress” that had been “marked and designated before sale”
1960 Multiple-Use and Sustained Yield ActDirects Forest Service to administer the forests for “outdoor recreation, range, timber, watershed, and wildlife and fish purposes”Statutory recognition of “multiple-use” concept; legal basis for ongoing recreation/wilderness managementPreserved agency discretion; seen by many as method of maintaining timber dominance

National Forest Management Act 1976
ImpetusMonongahela case, 1975: Clearcutting violates Organic Act; harvest of unmarked, live treesBolle and Church reports; Senate commissions in response to clearcutting, esp. in Bitterroot; suggested conditions for clearcutting
Three Basic FunctionsEstablishes a forest planning process that requires forest plans for every forest, updated every 15 yearsSubstantive guidelines for resource management:
1. “Suitability” requirements limits harvesting to environmentally and economically suitable lands; clearcutting allowed only where optimum
2. “Non-declining even flow” management3. “Viability” regulation for protecting biodiversity—key for
preventative ecosystem managementExpansion of public participation

Forest Planning
Nuts and BoltsDrafted by every forest, approved by Regional ForesterAdheres to NEPA, with discussion of multiple alternativesPlans must adhere to MUSYA principlesPlans must include a Resource Planning Act alternative, that relates to national resource production goalsInterdisciplinary planning teamsResource inventories and identification of physically suitable landsProgrammatic guidelines, including plan for timber sale program and allowable cutForest plans are primary guidance for on-the-ground decisions, including timber sales

Forest Planning Steps
Basic steps from 1982 regulations (Loomis)1. Identification of issues, concerns, opportunities: Public
comments2. Development of planning criteria: How decisions are made3. Data collection: Resource inventory data needs4. Analysis of management requirements: Land classification,
models, management actions (including FORPLAN, linear programming)
5. Formulate alternatives: NEPA, No-action, RPA6. Estimate costs/benefits (and 7)8. Selection of preferred alternative9. Implementation10. Monitoring/EvaluationPlanning regulations just revised; reflect more ecosystem management and collaborative principlesSome forests have finished, others in progress

Getting Out the Cut
How a Timber Sale WorksEach Nat. Forest has an allowable sale quantity (aggregated into National cut)Forest plans also describe a timber sale programIndividual sales can be found on “Schedule of Proposed Actions”Once a sale is advertised, must go through NEPA process and then awarded to highest bidderFederal forests account for 29% of US timberland base, and 11% of harvesting. Nat. Forest: 19% of land, 5% of harvest (1997 figures)About 26% of all Nat Forest land is deemed suitable for timber harvest

Bureaucratic Incentives for Timber Dominance
Incentives for Timber DominanceSince 1908, Law requires 25% of timber sale receipts be returned to states for use in county roads and schoolsKnutson-Vandenberg Act 1930: A portion of timber receipts goes directly back to forest, supposedly for reforestation (1994: $911m in timber sales, $215m goes to K-V funds=24%; some sales quite higher; 2/3 of reforestation dollars come from KV fundsMajor question: Has Forest Service broken the iron triangle, or is it still timber dominant, captured by timber industry?


Klamath National Forest Timber Harvest Plan

Table 1. Use of Knutson-Vandenberg Funds Since FY1980 (in millions of dollars)
Fiscal year Total Expenditures Reforestation Stand
Improvement Other Uses
1980 75.00 55.10 19.90 0.00
1981 92.78 67.13 19.32 6.33
1982 84.01 62.89 14.90 6.22
1983 116.85 66.30 20.35 30.20
1984 118.00 68.90 21.90 27.20
1985 120.70 70.76 19.33 30.64
1986 156.09 67.11 18.74 70.24
1987 196.69 91.49 28.09 77.11
1988 238.00 114.12 31.13 92.75
1989 237.06 113.79 30.82 92.45
1990 217.31 115.61 30.32 71.38
1991 196.54 103.31 35.28 57.95
1992 247.07 122.07 43.50 81.50
1993 252.62 124.81 44.48 83.33
1994 222.02 125.00 35.28 61.74

Recent Trends in Harvest(source: Timber Sale Program Information System Annual Report)

Recent Trends in Methods

Recent Trends in Forest Stewardship Harvesting

Below-Cost Timber Sales
Revenues gained from timber sales are below cost of administering the sale (1998: Forest Service lost $125m)Below-cost sales concentrated in forests with low timber values and/or high operating costsConcentrated in certain areas: Alaska, Rockies, Southeast, Lake States, New EnglandBetween 1989-1993: 77 of the 120 forests lost money; 43 with net profits Six reported losses over $10 million: Klamath (OR); Flathead (MT); North Carolina Forests; Tongass (AK), Bitterroot (MT)Profitable ones in Northwest; 5 forests with profits over $100 millionProblem appears to be worsening due to increased costs, decreased revenues

Graph of Revenue/Costs

Current Events
Northwest Forest PlanNorthern Spotted Owl and other endangered speciesInjunctions on timber sales; viability regulationClinton’s forest summit Regional plan amends individual forest plans; slows down logging in PacNW
Sierra Nevada FrameworkCalifornia Spotted OwlProtected Activity CentersConflict between Quincy Library Group New revisions under Bush administration increase amount of logging and size of trees
Healthy Forests Restoration ActStreamlining salvage sales and thinning projectsFire controlRemoval of NEPA and other requirements (categorical exclusions)Greenwashing?

The “Appeals Logjam”
• Forest Service and extractive industries have been claiming that environmental appeals and lawsuit are preventing forest projects
• GAO analysis • 7/05 lawsuit: FS must allow appeals on all significant
projects, even if categorically excluded under NEPA • Bush administration rule extended categorical exclusions
to timber acres less than 1000 acres and salvage up to 4200• Enviros sued, judge agreed, then FS then stopped all
categorical exclusions, including things like cutting XMAS trees

GAO Report on Appeals and Litigation
• 762 fuel reduction decisions in FY 01/02; 457 categorical excluded, 305 appealable
• 180 were appealed; 59% of appealable, 24% of all; 83% of those appealed went forward
• Appeal rates were higher in roadless areas, lower in urban-wildland interface
• 23 were litigated (3%, 100,000 acres); 3 reversed, 5 settled, 1 upheld (means plaintiffs tend to do better in court)
• 79% of appeals were processed within prescribed 90 days; 21% were not processed within 90 days with median processing time 119 days
• 84 interest groups and 29 private individuals represented in appeals

Viability Debate 1982 Version

New Planning Regulations: 2007
• Excludes forest plans from NEPA analysis; NEPA analysis now at the project level
• Eliminates many prescriptive standards from forest plans; project no longer required to comply with plans
• Eliminates the “viability” standard, replaces it with vague language regarding ecosystem diversity without requirements to survey and manage “indicator species”
• Replaces requirement to follow best available science with requirement to “consider” best available science
• Originally promulgated in 2005 without EIR or ESA analysis; courts throw out for procedural grounds
• New rules will be litigated for compliance with NFMA