national evidence based guideline for the primary...
TRANSCRIPT

National Evidence Based Guideline
for the
Primary Prevention of Type 2 Diabetes
prepared by:
The Diabetes Unit
Menzies Centre for Health Policy
The University of Sydney
for the:
Diabetes Australia Guideline Development Consortium
Approved by NHMRC on 10 December 2009

© Commonwealth of Australia 2009 ISBN: 978-0-9806997-8-4 (online) 978-0-9806997-9-1 (published) Copyright This work is copyright. You may download, display, print and reproduce this material in unaltered form only (retaining this notice) for your personal, non-commercial use or use within your organisation. Apart from any use as permitted under the Copyright Act 1968, all other rights are reserved. Requests and inquiries concerning reproduction and rights should be addressed to Commonwealth Copyright Administration, Attorney-General's Department, Robert Garran Offices, National Circuit, Barton ACT 2600 or posted at http://www.ag.gov.au/cca. Diabetes Australia Guideline Development Consortium The Diabetes Australia Guideline Development Consortium comprises Diabetes Australia; Australian Diabetes Society; the Australian Diabetes Educators’ Association; the Royal Australian College of General Practitioners; and The Diabetes Unit, Menzies Centre for Health Policy, The University of Sydney. A link to the guideline can be found on the Diabetes Australia website: www.diabetesaustralia.com.au/For-Health-Professionals/Diabetes-National-Guidelines/ The National Health and Medical Research Council The National Health and Medical Research Council (NHMRC) is Australia’s leading funding body for health and medical research. The NHMRC also provides the government, health professionals and the community with expert and independent advice on a range of issues that directly affect the health and well being of all Australians. The NHMRC provided support to this project through the Guidelines Assessment Register (GAR) process. The GAR consultant on this project was Professor Karen Grimmer-Somers. The guideline was approved by the Chief Executive Officer of the NHMRC on 10 December 2009 under section 14A of the National Health and Medical Research Council Act 1992. Approval for the guideline by NHMRC is granted for a period not exceeding five years, at which date the approval expires. The NHMRC expects that all guidelines will be reviewed no less than once every five years. A link to the guideline can be found on the National Health and Medical Research Council website: www.nhmrc.gov.au/publications. Disclaimer This document is a general guide to appropriate practice, to be followed subject to the clinician’s judgement and the patient’s preference in each individual case. The guidelines are designed to provide information to assist decision-making and are based on the beset evidence available at the time of development. Suggested Citation
Colagiuri R, Girgis S, Gomez M, Walker K, Colagiuri S, O'Dea K. National Evidence Based Guideline for the Primary Prevention of Type 2 Diabetes. Diabetes Australia and the NHMRC, Canberra 2009.

Table of Contents
Glossary of Acronyms ............................................................................................................ 1
Primary Prevention Expert Advisory Group .......................................................................... 2
Introduction ............................................................................................................................ 4
Questions for Primary Prevention .......................................................................................... 5
Summary of Recommendations and Practice Points.............................................................. 6
Section 1: Can type 2 diabetes be prevented? ....................................................................... 8
Background .......................................................................................................................... 10
Evidence ............................................................................................................................... 12
Evidence Tables ................................................................................................................... 28
Section 2: Identifying individuals at high risk ..................................................................... 32
Background .......................................................................................................................... 33
Evidence ............................................................................................................................... 36
Evidence Tables ................................................................................................................... 42
Section 3: Population strategies to reduce lifestyle risk factors ......................................... 44
Background .......................................................................................................................... 46
Evidence ............................................................................................................................... 50
Evidence Tables ................................................................................................................... 81
Section 4: Cost effectiveness and socio-economic implications ......................................... 87
Background .......................................................................................................................... 89
Evidence ............................................................................................................................... 90
Evidence Tables ................................................................................................................... 98
References ............................................................................................................................. 100
Appendices ............................................................................................................................ 115
Appendix 1: The Australian Type 2 Diabetes Risk Assessment Tool ............................... 116
Appendix 2: Guideline Search Strategy and Yield ............................................................ 118
Appendix 3: Generic Inclusion Criteria ............................................................................. 120
Appendix 4: Search Strategies and Terms ......................................................................... 121
Appendix 5: NHMRC Evidence Statement Grading Forms .............................................. 133
Appendix 6: Overview of Guideline Development Process and Methods ......................... 166

List of Tables:
Table 1: Recent prospective randomised trials in individuals with IGT ................................ 13
Table 2: Studies of lifestyle modification to prevent type 2 diabetes .................................... 19
Table 3: Studies of Pharmacotherapy in the prevention of type 2 diabetes ........................... 23
Table 4: Risk Scores Models without laboratory testing to predict diabetes in high risk
individuals ................................................................................................................................ 38
Table 5: Summary of study characteristics for social marketing/mass media and physical
activity ...................................................................................................................................... 55
Table 6: Summary of study characteristics for social marketing / mass media and nutrition . 62

Type 2 Diabetes Guideline 1 Primary Prevention, December 2009
Glossary of Acronyms
AusDiab Australian Diabetes Lifestyle and Obesity Study
AUSDRISK
HDL
NCEP
Australian Diabetes Risk Assessment Tool
High Density Lipid
National Cholesterol Education Program
BMES
NWAHS
NSMS
WC
QALD
ICERs
UKPDS
LSM
NGT
LYG
FINDRISK
CI
HR
RR
OR
ROC AUC
NNT
Blue Mountains Eye Study
North West Adelaide Health Study
National Social Marketing Strategy
WellingTonne Challenge
Quality-adjusted life-year
Incremental Cost Effectiveness Ratios
United Kingdom Prospective Diabetes Study
Lifestyle Modification
Normal Glucose Tolerance
Life Year Gained
Finnish Diabetes Risk Assessment Tool
Confidence Interval
Hazard Ratio
Relative Risk
Odds Ratio
Receiver-Operating Characteristics Area Under the Curve
Number Needed to Treat
BMI Body Mass Index
CALD Culturally And Linguistically Diverse
CHIP Coronary Health Improvement Project
CVD Cardiovascular Disease
DPP Diabetes Prevention Program
DPS Finnish Diabetes Prevention Programme
EAG Expert Advisory Group
EBMM Eat Better Move More Program
FFFF Fighting Fat, Fighting Fit campaign
GDM Gestational Diabetes Mellitus
HbA1c Glycosylated/ glycated haemoglobin
IDF International Diabetes Federation
IDPP Indian Diabetes Prevention Programme
IDRS Indian Diabetes Risk Score
IFG Impaired Fasting Glucose
IGT Impaired Glucose Tolerance
LAGB Laparoscopic Gastric Banding
LASGB Laparoscopic Adjustable Silicon Gastric Banding
NGO Non-Government Organisation
OGTT Oral Glucose Tolerance Test
PCOS Polycystic Ovary Syndrome
RCT Randomised Controlled Trial
WHO World Health Organisation

Type 2 Diabetes Guideline 2 Primary Prevention, December 2009
Primary Prevention Expert Advisory Group
Co-Chairs Associate Professor Ruth Colagiuri
Director, The Diabetes Unit
Menzies Centre for Health Policy
The University of Sydney
SYDNEY NSW 2006
Professor Kerin O'Dea
St Vincent‟s Hospital
The University of Melbourne
MELBOURNE VIC
Australian Diabetes Society Associate Professor Maarten Kamp
Australian Diabetes Society
SYDNEY NSW 2000
ADEA Ms Victoria Stevenson
Diabetes Education Service
Austin Health
HEIDELBERG VIC 3084
Dietitians Association of Australia Dr Alan Barclay
The University of Sydney
SYDNEY NSW 2006
RACGP Professor Mark Harris
School of Public Health & Community Medicine
The University of New South Wales
SYDNEY NSW 2052
Content Expert Dr Tim Gill
International Obesity Task Force
The University of Sydney
SYNDEY NSW 2006
Consumer Mr Robert Guthrie
MOSMAN NSW 2088
GAR Consultant Professor Karen Grimmer-Somers
Division of Health Sciences
The University of South Australia
ADELAIDE SA 5001
Medical Advisor Professor Stephen Colagiuri
The Boden Institute of Obesity, Nutrition and Exercise
Faculty of Medicine
The University of Sydney
NSW 2006

Type 2 Diabetes Guideline 3 Primary Prevention, December 2009
Project & Research Manager Dr Seham Girgis
The Diabetes Unit
Menzies Centre for Health Policy
The University of Sydney
SYDNEY NSW 2006
Research Officers Ms Maria Gomez
The Diabetes Unit
Menzies Centre for Health Policy
The University of Sydney
SYDNEY NSW 2006
Dr Karen Walker
Baker IDI Heart and Diabetes Institute
MELBOURNE VIC 3004
Nutrition & Dietetics Unit
Monash University
Melbourne VIC 3168
Dr Alexandra Buckley
The Diabetes Unit
Menzies Centre for Health Policy
The University of Sydney
SYDNEY NSW 2006

Type 2 Diabetes Guideline 4 Primary Prevention, December 2009
Primary Prevention of Type 2 Diabetes
Introduction
Aim of the guideline
This guideline covers issues relating to the primary prevention of type 2 diabetes in non-
pregnant adults. Its aim is to inform and guide health promotion and preventative activities
for type 2 diabetes with evidence based information on what works and what does not. The
guideline targets health promotion and public health practitioners, planners and policy
makers, and clinicians.
Methods
In addition to the methods used to identify and critically appraise the evidence to formulate
the guideline recommendations which are described in detail in the Overview of Methods and
Processes (Appendix 6), the Research Team reviewed and checked each step of the methods
process and:
- repeated a selection of the searches
- double culled the yield from all the database searches
- double reviewed the majority of the articles used as evidence references
- checked all recommendations, evidence statements, evidence tables and search strategy
and yield tables
Guideline Format
Questions identified by the Expert Advisory Group (EAG) and from the literature as critical
to the primary prevention of type 2 diabetes are shown in point 2.2 (next page).
Each of these questions is addressed in a separate section in a format presenting:
Recommendation(s)
Practice points - including experts‟ consensus in absence of gradable evidence
Evidence Statements - supporting the recommendations
Background - to issues for the guideline
Evidence - detailing and interpreting the key findings
Evidence tables - summarising the evidence ratings for the articles reviewed
For all issues combined, supporting material appears at the end of the guideline topic and
includes:
References
Search Strategy and Yield Tables documenting the identification of the evidence sources
Type 2 Diabetes Guideline 5 Primary Prevention, December 2009
Questions for Primary Prevention
1a. Can type 2 diabetes be prevented? If Yes
1b. How can type 2 diabetes be prevented in high risk individuals?
2 How can individuals at high risk of type 2 diabetes be identified?
3. What population strategies have been shown to be effective in reducing risk factors (such
as physical inactivity, unhealthy eating) for type 2 diabetes?
i. Increase community awareness
ii. Increase community skills to change behaviour and adopt a healthy
lifestyle
iii. Develop policies and create environments that support a healthy
lifestyle
4a. Is prevention cost-effective?
4b. What are the socio-economic implications?
Type 2 Diabetes Guideline 6 Primary Prevention, December 2009
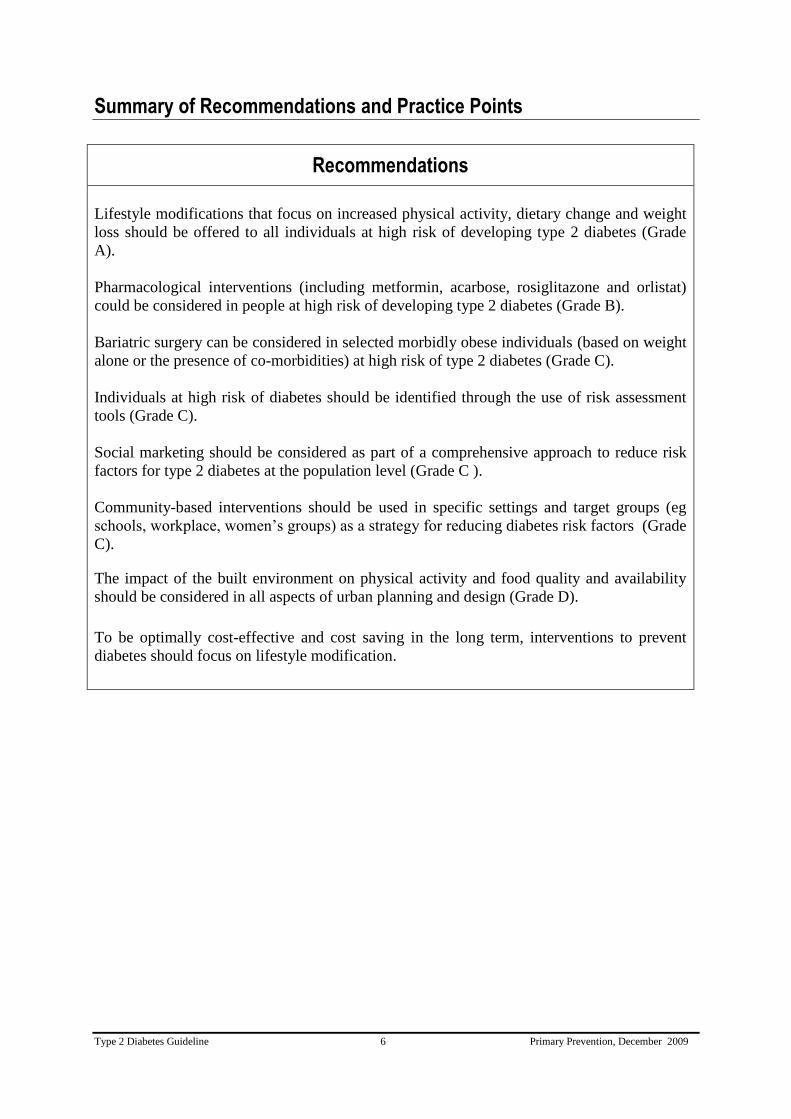
Summary of Recommendations and Practice Points
Recommendations
Lifestyle modifications that focus on increased physical activity, dietary change and weight
loss should be offered to all individuals at high risk of developing type 2 diabetes (Grade
A).
Pharmacological interventions (including metformin, acarbose, rosiglitazone and orlistat)
could be considered in people at high risk of developing type 2 diabetes (Grade B).
Bariatric surgery can be considered in selected morbidly obese individuals (based on weight
alone or the presence of co-morbidities) at high risk of type 2 diabetes (Grade C).
Individuals at high risk of diabetes should be identified through the use of risk assessment
tools (Grade C).
Social marketing should be considered as part of a comprehensive approach to reduce risk
factors for type 2 diabetes at the population level (Grade C ).
Community-based interventions should be used in specific settings and target groups (eg
schools, workplace, women‟s groups) as a strategy for reducing diabetes risk factors (Grade
C).
The impact of the built environment on physical activity and food quality and availability
should be considered in all aspects of urban planning and design (Grade D).
To be optimally cost-effective and cost saving in the long term, interventions to prevent
diabetes should focus on lifestyle modification.

Type 2 Diabetes Guideline 7 Primary Prevention, December 2009
Practice Points
Life style modifications such as physical activity, dietary change and weight loss
should be trialled before considering the use of pharmacological interventions for the
prevention of type 2 diabetes in high risk individuals.
As many of the medications which have been used in diabetes prevention studies
have established side effects, potential benefits and harms should be taken into
account before considering pharmacotherapy for diabetes prevention.
The Australian Risk Assessment Tool (AUSDRISK) should be used to identify
people at high risk of developing diabetes.
A risk score of 15 should be used to categorise high risk.
Risk assessment should begin at age 40 and from age 18 in Aboriginal and Torres
Strait Islanders*.
Risk assessment should be repeated every 3 years.
* It should be noted that the AUSDRISK may overestimate risk in those under 25 years of
age and underestimate risk in Aboriginal and Torres Strait Islanders.
To be effective, a community-based intervention should:
− have a strong theoretical base
− be designed to send a few clear messages
− use multiple strategies to communicate these messages
− encourage family involvement
− be intensive and sustained over a long period of time.
Lifestyle modification interventions for high risk individuals should be implemented
at the level of routine clinical practice.
In absence of specific strategies targeting low socio economic people, strategies
aimed at the general population are recommended.
Culturally appropriate lifestyle interventions should be provided in accessible
settings.

Type 2 Diabetes Guideline 8 Primary Prevention, December 2009
Section 1: Can type 2 diabetes be prevented?
Questions
a) Can type 2 diabetes be prevented?
b) If yes, how can type 2 diabetes be prevented in high risk individuals?
Recommendations
Lifestyle modifications that focus on increased physical activity, dietary change and weight
loss should be offered to all individuals at high risk of developing type 2 diabetes (Grade
A).
Pharmacological interventions (including metformin, acarbose, rosiglitazone and orlistat)
could be considered in people at high risk of developing type 2 diabetes (Grade B).
Bariatric surgery can be considered in selected morbidly obese individuals (based on weight
alone or the presence of co-morbidities) at high risk of type 2 diabetes (Grade C).
Practice Points
Life style modifications such as physical activity, dietary change and weight loss
should be trialled before considering the use of pharmacological interventions for the
prevention of type 2 diabetes in high risk individuals.
As many of the medications which have been used in diabetes prevention studies have
established side effects, potential benefits and harms should be taken into account
before considering pharmacotherapy for diabetes prevention.

Type 2 Diabetes Guideline 9 Primary Prevention, December 2009
Evidence Statements
Progression to type 2 diabetes in high risk individuals can be prevented or delayed.
Evidence Level I
Lifestyle modification including increasing physical activity, improving diet, and weight
loss are effective in preventing/delaying the onset of type 2 diabetes in high risk
individuals.
Evidence Level I
Lifestyle interventions in people with impaired glucose tolerance (IGT) reduce
progression to type 2 diabetes beyond the intervention period.
Evidence Level II
Pharmacological interventions (including metformin, acarbose, rosiglitazone and orlistat)
are effective in preventing/delaying the onset of type 2 diabetes in high risk individuals.
Evidence Level I
Bariatric surgery can prevent/delay progression to type 2 diabetes in people who are
morbidly obese. Evidence Level III

Type 2 Diabetes Guideline 10 Primary Prevention, December 2009
Background – Can type 2 diabetes be prevented?
Diabetes is a global public health epidemic. The International Diabetes Federation estimates
that there were 189 million people with diabetes in 2003 and predicts an increase to 324
million in 2025 (IDF, 2006). The Australian Diabetes, Obesity and Lifestyle (AusDiab) Study
has provided data on type 2 diabetes in Australia. In a nationally representative sample, it
found a diabetes prevalence of 7.4% (Dunstan et al, 2002). Moreover, the five-year AusDiab
follow-up study indicates that the population with diabetes is steadily increasing and that, by
2006, at least 275 Australian adults were presenting as new diabetes cases every day (Barry et
al, 2006). An even more disturbing development is the appearance of type 2 diabetes in
overweight and obese individuals at an increasingly younger age, including adolescents and
children (Craig et al, 2007). This population is at considerably increased risk of diabetes
complications including coronary heart disease, kidney disease and eye disease. Through
these complications, diabetes may be a contributing cause in as many as 1 in 11 Australian
deaths (Australian Institute of Health and Welfare, 2008).
Type 2 diabetes is responsible for approximately 90% of all diabetes worldwide and accounts
for most of the public health and cost burden attributable to diabetes. Type 2 diabetes is
costly. For example, in 2004-5, diabetes related complications added nearly $1 billion to total
health expenditure in Australia (Australian Institute of Health and Welfare, 2008). Not only
rising health care costs but the substantially reduced quality of life associated with diabetes
related morbidity indicates the importance of determining whether primary prevention of
type 2 diabetes is an achievable goal (Tuomilehto, 2006).
Type 2 diabetes is a complex metabolic disorder triggered by lifestyle factors superimposed
on a genetic predisposition. The principle lifestyle risk factors for type 2 diabetes include
obesity, energy-dense diets, and low level of physical activity. The AusDiab Study reported
that 80% of people with diabetes were overweight or obese compared with 59% of people
without diabetes (Dunstan et al, 2002).
Type 2 diabetes is an insidious disease that develops over a long time period. The initial
stages have been called „pre-diabetes‟ or „intermediate hyperglycaemia‟, terms that include
both impaired fasting glucose (IFG) and impaired glucose tolerance (IGT) (WHO, 2006)
These abnormalities occur early in the disease process but may reflect somewhat different
pathologies (Rosenstock, 2007). IFG is defined by a fasting plasma glucose between 6.1 and
6.9 mmol/L and a 2-hour glucose less than 7.8 mmol/L. IGT is defined by a fasting plasma
glucose below 7.0 mmol/L and a 2-hour glucose between 7.8 and 11.0 mmol/L (WHO, 2006).
The five-year follow-up to AusDiab found that Australians with IGT and IFG were between
10 and 20 times more likely to develop type 2 diabetes than Australians who retained normal
glucose tolerance (Magliano et al, 2008). One approach to preventing type 2 diabetes is to
target these individuals known to be at particularly high risk.
Some populations have also been identified as having a particularly high risk of developing
type 2 diabetes. Aboriginal and Torres Strait Islanders are at least three times more likely to
have type 2 diabetes than non-indigenous Australians and their overall rates of death and
hospitalization from diabetes complications are also much greater (Australian Institute of
Health and Welfare, 2008). Moreover, in Aboriginal and Torres Strait Islander people, type 2
diabetes appears earlier in life. Rates of diabetes in the 20-50 year old age group may be up
to 10 times higher than found in the overall Australian population (O'Dea et al, 1993). Other

Type 2 Diabetes Guideline 11 Primary Prevention, December 2009
high risk groups are people at socio-economic disadvantage, people living in rural and remote
areas, and Australians born in South-Eastern Europe, North Africa and the Middle East
(Australian Institute of Health and Welfare, 2008).
Over the last decade, and most particularly since 2000, compelling evidence has accumulated
about preventing type 2 diabetes in people with impaired glucose tolerance (Abuissa et al,
2005; Gillies et al, 2007; Li et al, 2008). The strategies that have been trialled to prevent
diabetes in high risk groups can be grouped broadly into interventions that aim to change
lifestyle through physical activity and diet, interventions based on administration of a drug
(pharmacotherapy) and thirdly, various surgical approaches aimed at preventing diabetes by
reducing obesity.
There is accumulating evidence that sedentary behaviour is an independent risk factor for
obesity and type 2 diabetes (Bassuk & Manson, 2005). Similarly, several longitudinal studies
have provided evidence of the relationship between the development of type 2 diabetes and
high intake of dietary fat particularly saturated fat (Marshall et al, 1991; Moses et al, 1997).
Consequently, many lifestyle interventions to prevent diabetes have examined the effect of
increased physical activity. Reduced energy (hypocaloric) diets aimed at reducing obesity
have also been trialled for diabetes prevention either alone or in combination with physical
activity.
Several drug therapies have been trialled for prevention of type 2 diabetes in high risk
individuals including oral anti-diabetic agents and the anti-obesity agent, Orlistat (Gillies et
al, 2007). While the effectiveness of these agents has been demonstrated by meta-analysis,
adverse responses have also been recorded particularly gastrointestinal side effects and/or
hypoglycaemic symptoms (Gillies et al 2007)
Bariatric surgery can achieve substantial and sustainable weight reduction. The two most
common procedures are Roux-en-Y gastric bypass which both restricts stomach volume and
creates a bypass from stomach to jejunum that reduces intestinal absorption, and laparoscopic
adjustable silicon gastric banding (LASGB). Here the upper part of the stomach is encircled
with a saline-filled tube that can be percutaneously inflated or deflated to adjust stomach
capacity. There is no accompanying intestinal diversion (Ferchak & Meneghini, 2004).
The following Evidence Section addresses two key questions:
a) can type 2 diabetes be prevented?
b) how can type 2 diabetes be prevented?

Type 2 Diabetes Guideline 12 Primary Prevention, December 2009
Evidence – Prevention of type 2 Diabetes
a) Can type 2 diabetes be prevented?
Progression to type 2 diabetes in high risk individuals can be prevented or
delayed. (Evidence Level I)
Since 2000 prevention of type 2 diabetes in people with impaired glucose tolerance has been
demonstrated in a number of well designed prospective randomised controlled trials. Hence, a
considerable body of high level evidence (systematic reviews of randomized controlled trials)
now indicates that type 2 diabetes can be prevented. This evidence comes from trials
employing a number of different intervention strategies (Abuissa et al, 2005; Curtis &
Wilson, 2005; Gillies et al, 2007).
This section presents the highest level of available evidence, ie systematic reviews and meta-
analysis of RCTs, demonstrating that type 2 diabetes can be prevented. It also presents details
directly from the four major primary RCTs contributing to this evidence (Table 1). They are
the:
Da Qing Diabetes Prevention Study (Pan et al, 1997; Li et al, 2008)
Finnish Diabetes Prevention Study (DPS) (Tuomilehto et al, 2001; Lindstrom et al,
2006)
Diabetes Prevention Program (DPP), US (Knowler et al, 2002)
Indian Diabetes Prevention Programme (Ramachandran et al, 2006)
Type 2 Diabetes Guideline 13 Primary Prevention, December 2009
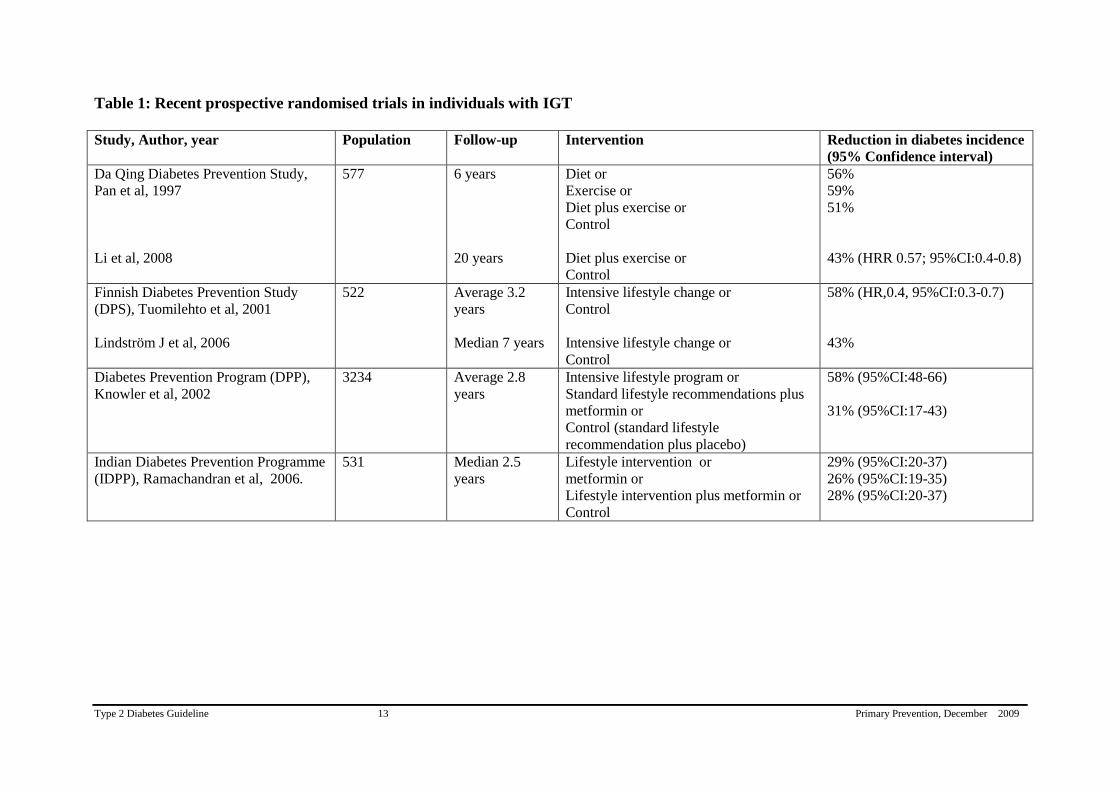
Table 1: Recent prospective randomised trials in individuals with IGT
Study, Author, year Population Follow-up Intervention Reduction in diabetes incidence
(95% Confidence interval)
Da Qing Diabetes Prevention Study,
Pan et al, 1997
Li et al, 2008
577 6 years
20 years
Diet or
Exercise or
Diet plus exercise or
Control
Diet plus exercise or
Control
56%
59%
51%
43% (HRR 0.57; 95%CI:0.4-0.8)
Finnish Diabetes Prevention Study
(DPS), Tuomilehto et al, 2001
Lindström J et al, 2006
522 Average 3.2
years
Median 7 years
Intensive lifestyle change or
Control
Intensive lifestyle change or
Control
58% (HR,0.4, 95%CI:0.3-0.7)
43%
Diabetes Prevention Program (DPP),
Knowler et al, 2002
3234 Average 2.8
years
Intensive lifestyle program or
Standard lifestyle recommendations plus
metformin or
Control (standard lifestyle
recommendation plus placebo)
58% (95%CI:48-66)
31% (95%CI:17-43)
Indian Diabetes Prevention Programme
(IDPP), Ramachandran et al, 2006.
531 Median 2.5
years
Lifestyle intervention or
metformin or
Lifestyle intervention plus metformin or
Control
29% (95%CI:20-37)
26% (95%CI:19-35)
28% (95%CI:20-37)
Type 2 Diabetes Guideline 14 Primary Prevention, December 2009
The first significant randomised controlled trial was carried out in the city of Da Qing, China
and showed that a lifestyle intervention program can reduce the rate of conversion from IGT
to type 2 diabetes (Pan et al, 1997). In this study, 577 men and women with IGT were
randomised either to a control group or intervention groups (exercise, or diet, or exercise plus
diet). After 6 years, the incidence of diabetes was 68% (95% CI 60-75%) in the control group
but only 41% (95% CI 33-49%) in the exercise group (p<0.05) and 44% (95% CI 35-52%) in
the diet group (Pan et al, 1997). Recently published data from 20-years follow-up of the Da
Qing Study indicated that the benefits of the lifestyle interventions continued with a 43%
lower incidence of type 2 diabetes in subjects who had participated in the combined lifestyle
intervention (diet and exercise) than the control group over the 20 year period (HR 0.57;
95%CI: 0.41-0.81)(Li et al, 2008). This group had a 51% lower incidence of diabetes (HR
0.49; 95%CI 0.33-0.37) during the intervention period. Less positive was their finding that
80% of the intervention group eventually developed diabetes, while 93% of those in the
control group went on to develop the disease. However, subjects in the intervention group
spent an average 3.6 fewer years with diabetes than those in the control group.
The Finnish Diabetes Prevention Study (DPS) (Tuomilehto et al, 2001) included 522 middle-
aged, overweight men and women with IGT who were randomly assigned to either an
intensive lifestyle intervention group or a control group. The control group received general
dietary and exercise advice at baseline and had an annual physician‟s examination. The
subjects in the intervention group received additional individualised dietary counselling from
a nutritionist. They were also offered circuit-type resistance training sessions
and advised to
increase overall physical activity. The intervention was the most intensive during the first
year, followed by a maintenance period. The intervention goals were to reduce body
weight,
reduce dietary and saturated fat, and increase physical activity and dietary fibre.
After an
average 3.2 years of active intervention, the cumulative incidence of diabetes was 11% in the
intervention group and 23% in the control group, thus, the risk of diabetes was
reduced by
58% (P<0.001) in the intervention group. The effect of the intervention on the incidence of
diabetes was most pronounced among subjects who made comprehensive changes in lifestyle
(Tuomilehto et al, 2001). The extended follow-up of the Finnish Diabetes Prevention Study
assessed the extent to which the originally-achieved lifestyle changes and risk reduction
remain after discontinuation of active counselling. After a median of 4 years of active
intervention, participants who were still free of diabetes were further followed up for a
median of 3 years, with a median total follow-up of 7 years. Diabetes incidence, body weight,
physical activity, and dietary intakes of fat, saturated fat, and fibre were measured. During the
total follow-up, the incidence of type 2 diabetes was 4.3 and 7.4 per 100 person-years in the
intervention and control group, respectively (p=0.0001), indicating 43% reduction in relative
risk (Lindstrom et al, 2006). The risk reduction was related to the success in achieving the
intervention goals of weight loss, reduced intake of total and saturated fat and increased intake
of dietary fibre, and increased physical activity. Beneficial lifestyle changes achieved by
participants in the intervention group were maintained after the discontinuation of the
intervention, and the corresponding incidence rates during the post-intervention follow-up
were 4.6 and 7.2 (p=0.0401), indicating 36% reduction in relative risk.
The Diabetes Prevention Program (DPP) (Knowler et al, 2002) conducted in the US
randomised 3,234 people with IGT to standard lifestyle recommendations plus metformin,
standard lifestyle recommendations plus placebo, or an intensive program of lifestyle
modification. The standard lifestyle recommendations were provided as written information
and in an annual 20-to-30-minute individual session that emphasized the importance of a
healthy lifestyle. Participants were encouraged to follow the Food Guide Pyramid. The goals

Type 2 Diabetes Guideline 15 Primary Prevention, December 2009
for the participants assigned to the intensive lifestyle intervention aimed to achieve and
maintain a weight reduction of at least 7% of initial body weight through a healthy low
calorie, low-fat diet and to engage in physical activity of moderate intensity, such as brisk
walking, for at least 150 minutes per week. A 16-lesson curriculum covering diet, exercise,
and behaviour modification was designed to help the participants achieve these goals. The
mean age of the participants was 51 years, mean BMI 34.0, 68 % were women, 45 % were
members of minority groups and the average follow-up was 2.8 years. The incidence of
diabetes was 11.0, 7.8, and 4.8 cases per 100 person-years in the placebo, metformin, and
intensive lifestyle modification groups, respectively. Intensive lifestyle-modification reduced
the incidence of type 2 diabetes by 58% (95% CI:48-66%) and metformin reduced diabetes by
31% (95 % CI: 17-43%) (Knowler et al, 2002). This study also demonstrated the applicability
of these findings in an ethnically and socio-economically diverse population.
In the Indian Diabetes Prevention Programme (IDPP) (Ramachandran et al, 2006) 531
subjects with IGT (421 men, 110 women, mean age 45.9±5.7 years, mean BMI
25.8±3.5 kg/m2) were randomised into four groups. Group 1 was the control, Group 2 was
given advice on lifestyle modification, Group 3 was treated with metformin and Group 4 was
given advice on lifestyle modification plus metformin. After a 30 months median follow-up
period, the 3-year cumulative incidences of diabetes were 55.0%, 39.3%, 40.5% and 39.5%
in Groups 1–4, respectively. The relative risk reduction was 28.5% with lifestyle modification
(95% CI 20.5–37.3, p=0.018), 26.4% with metformin (95% CI 19.1–35.1, p=0.029) and
28.2% with lifestyle modification plus metformin (95% CI 20.3–37.0, p=0.022), compared
with the control group. The number needed to treat to prevent one incident case of diabetes
was 6.4 for lifestyle modification, 6.9 for metformin, and 6.5 for lifestyle modification plus
metformin. The authors concluded that both lifestyle modification and metformin
significantly reduced the incidence of diabetes in Indians with IGT but there was no added
benefit from combining them.
Abuissa and colleagues (2005) carried out a systematic review of the literature published
between January 1990 and December 2004, using MEDLINE, EMBASE and the Cochrane
Library to select randomised trials of at least one year duration. Six trials were identified
including a total of 9,303 people with IGT at baseline. New onset diabetes was shown to be
reduced by 31-58% through lifestyle change (exercise and/or diet), by 25-75% through the
use of anti-diabetic agents and by 37% through the use of the anti-obesity medication, orlistat.
A further 16 trials were identified in a total of 158,608 subjects who were treated with a
number of different anti-hypertensive agents. In 11 of these 16 studies, over 20% decrease in
the incidence of type 2 diabetes was observed (range 2%-87%).
Similarly, Curtis and colleagues (2005) systematically searched MEDLINE for articles
relating to diabetes prevention published between January 1965 and January 2004. From a
review of 18 relevant studies, they concluded that a lifestyle intervention aimed at inducing a
5-7% weight loss can prevent type 2 diabetes in people with IGT (strength A). This review
highlighted that the preventive strategy with the best supporting evidence was intensive
lifestyle intervention with interdisciplinary, individualised programs designed to produce
modest weight loss. Metformin, acarbose and orlistat can also help prevent type 2 diabetes in
people with IGT (strength B).
The results of a recent systematic review of RCTs and meta-analyses Gillies et al (2007) have
strengthened recommendations from earlier reviews. Gillies et al (2007) conducted their
review to quantify the effectiveness of pharmacological and lifestyle interventions to prevent

Type 2 Diabetes Guideline 16 Primary Prevention, December 2009
or delay type 2 diabetes in people with IGT. They identified 21 relevant studies through
searching MEDLINE (1966 until July 2006) and EMBASE (1980 until July 2006)
supplemented by searches in the Cochrane Library and by consultation with expert opinion.
The analyses were strengthened by the inclusion of studies published in languages other than
English, translated by interpreters familiar with medical literature. Seventeen randomised
controlled trials comprising 8,084 participants with IGT were included in the meta-analyses
which provided overwhelming evidence that diabetes is preventable. From the meta-analyses
the pooled hazard ratios were 0.51(95% CI 0.44-0.60) for lifestyle interventions compared with standard advice, 0.70 (95% CI 0.62-0.79) for oral diabetes medications compared with
control, 0.44 (95% CI 0.28-0.69) for orlistat compared with control, and 0.32 (95% CI 0.03 -
3.07) for the herbal remedy jiangtang bushen recipe compared with standard advice.
The evidence that type 2 diabetes can be prevented was also found in other populations. In a
Japanese trial of 458 males with IGT were randomised to a lifestyle intervention or control
group. The cumulative 4 year incidence of diabetes in the lifestyle group was 3% compared
with 9.3% in the control group (Kosaka et al, 2005). The development of diabetes in the
lifestyle intervention group was reduced by 67.4%.
b) How can type 2 diabetes be prevented in high risk individuals?
1. Lifestyle modification
Lifestyle modification including increasing physical activity, improving diet,
and weight loss are effective in preventing/delaying the onset of type 2
diabetes in high risk individuals. (Evidence Level I)
The literature for evidence of the role lifestyle modifications play in prevention of type 2
diabetes have examined changes in physical activity; weight loss; and dietary changes. As
described above, Gillies et al (2007) recent meta-analysis of 12 randomised control trials of
lifestyle interventions in people with IGT clearly demonstrated that lifestyle interventions (ie
diet alone, exercise alone or diet and exercise combined compared with routine advice) can
prevent or delay diabetes in half the subjects (HR 0.51; 95% CI 0.44-0.60, P <0.001). Diet
alone, exercise alone or diet and exercise combined all produced similar reductions in risk of
diabetes. Lifestyle interventions effectiveness increased in severely overweight participants.
Thus each one unit increase in mean BMI at baseline led to a decrease in the HR of 7.3%
(95% CI:13.6%-0.9%). The calculated number of people needed to treat to prevent or delay
one case of diabetes through lifestyle intervention was (NNT) 6.4 (95% CI 5.0-8.4).
This result confirmed earlier findings of a meta-analysis of five RCTs (Yamaoka & Tango,
2005) which included studies of six months duration that compared interventions of diet alone
or diet and exercise combined against „conventional education‟ (advice to exercise without
diet advice). The random effects model show that a lifestyle intervention, approximately halve
the incidence of type 2 diabetes (RR 0.55; 95%CI 0.44-0.69).
A systematic review by Curtis (2005) also reported that a 5-7% weight loss can prevent type 2
diabetes in people with IGT. Another systematic review which analysed three studies

Type 2 Diabetes Guideline 17 Primary Prevention, December 2009
describing diet and exercise interventions in a total of 4,333 people with IGT also concluded
that diabetes can be prevented or delayed by lifestyle change (Abuissa et al, 2005).
The systematic review by Norris et al (2005) examined long-term non-pharmacological
weight loss strategies using dietary, physical activity, or behavioural weight loss interventions
for adults with IGT or IFG and demonstrated that a weight loss of 2.6 kg (95% CI 1.9-3.3) at
two years. This was associated with a significant decrease in the cumulative incidence of
diabetes in participants assigned to interventions compared with those assigned to usual care
(RR reduction from 43-58%) at 3 to 6 years follow-up (Norris et al, 2005). This evidence was
further confirmed in another systematic review of lifestyle interventions (Burnet et al, 2006)
which identified the same diabetes prevention trials. These studies set modest goals for
weight loss and physical activity but the reduction in diabetes incidence was quite significant.
A larger review, although one not strictly confined to randomized control trials (Liberopoulos
et al, 2006) examined 10 lifestyle intervention studies for prevention of type 2 diabetes,
mainly in people with IGT. They identified relevant articles (review articles, RCTs, large
cohort and case control studies) through a Medline search (up to March 2005) This review
found that in two studies of 5-6 years duration, where no weight reduction was achieved,
there was no observed reduction in the progression to diabetes. In other studies, however
where weight loss was achieved, the risk of type 2 diabetes was reduced up to 67%.
Further analysis of the lifestyle arm of the US DPP by Hamman et al (2006) explored the
contribution of changes in weight, diet, and physical activity on the risk of developing
diabetes among intensive lifestyle intervention participants (1,079 participants, aged 25–84
years, mean 50.6 years and mean BMI 33.9 kg/m2). The researchers found that weight loss
was the dominant predictor of reduced diabetes incidence (HR per 5-kg weight loss 0.42 ;
95% CI 0.35–0.51; P < 0.0001). For every kilogram of weight loss, there was a 16% reduction
in risk, adjusted for changes in diet and activity. Weight loss was predicted by lower percent
of calories from fat and increased physical activity. Increased physical activity was important
to sustain weight loss. Among 495 participants not meeting the weight loss goal at year 1,
those who achieved the physical activity goal had 44% lower diabetes incidence.
A post hoc analysis has examined the role of leisure-time physical activity in preventing type
2 diabetes in 487 men and women with IGT in the Finnish DPS (Laaksonen et al, 2002).
Individuals who increased moderate-to-vigorous leisure time physical activity or undertook
strenuous, structured leisure time physical activity were 63-65% less likely to develop
diabetes. An increase in walking for exercise during follow-up also decreased the risk of
diabetes. The researchers concluded that at least 2.5 hours/week of walking for exercise
during follow-up decreased the risk of type 2 diabetes by 63-69%, largely independent of
dietary factors and BMI.
The 7-year follow-up of the Finnish DPS showed a 43% reduction in relative risk (Lindstrom
et al, 2006) in developing diabetes and that the risk reduction was related to the success in
achieving the intervention goals of weight loss, reduced intake of total and saturated fat and
increased intake of dietary fibre, and increased physical activity.
Lifestyle interventions in people with impaired glucose tolerance (IGT) reduce
progression to type 2 diabetes beyond the intervention period. (Evidence Level
II)

Type 2 Diabetes Guideline 18 Primary Prevention, December 2009
The 20-years follow-up analysis of the Da Qing Study reported the benefits of the lifestyle
interventions continued with a 43% lower incidence of type 2 diabetes in subjects who had
participated in the combined lifestyle intervention (diet and exercise) than the control group
over the 20 year period (HR 0.57; 95%CI: 0.41-0.81)(Li et al, 2008). This group had a 51%
lower incidence of diabetes (HR 0.49; 95%CI 0.33-0.37) during the intervention period.
The follow-up of the Finnish Diabetes Prevention Study assessed the extent to which the
originally-achieved lifestyle changes and risk reduction remain after discontinuation of active
counselling. After a median of 4 years of active intervention, participants who were still free
of diabetes were further followed up for a median of 3 years, with a median total follow-up of
7 years. During the total follow-up, the incidence of type 2 diabetes was 4.3 and 7.4 per 100
person-years in the intervention and control group, respectively (p=0.0001), indicating 43%
reduction in relative risk (Lindstrom et al, 2006). Beneficial lifestyle changes achieved by
participants in the intervention group were maintained after the discontinuation of the
intervention, and the corresponding incidence rates during the post-intervention follow-up
were 4.6 and 7.2 (p=0.0401), indicating 36% reduction in relative risk.
Type 2 Diabetes Guideline 19 Primary Prevention, December 2009
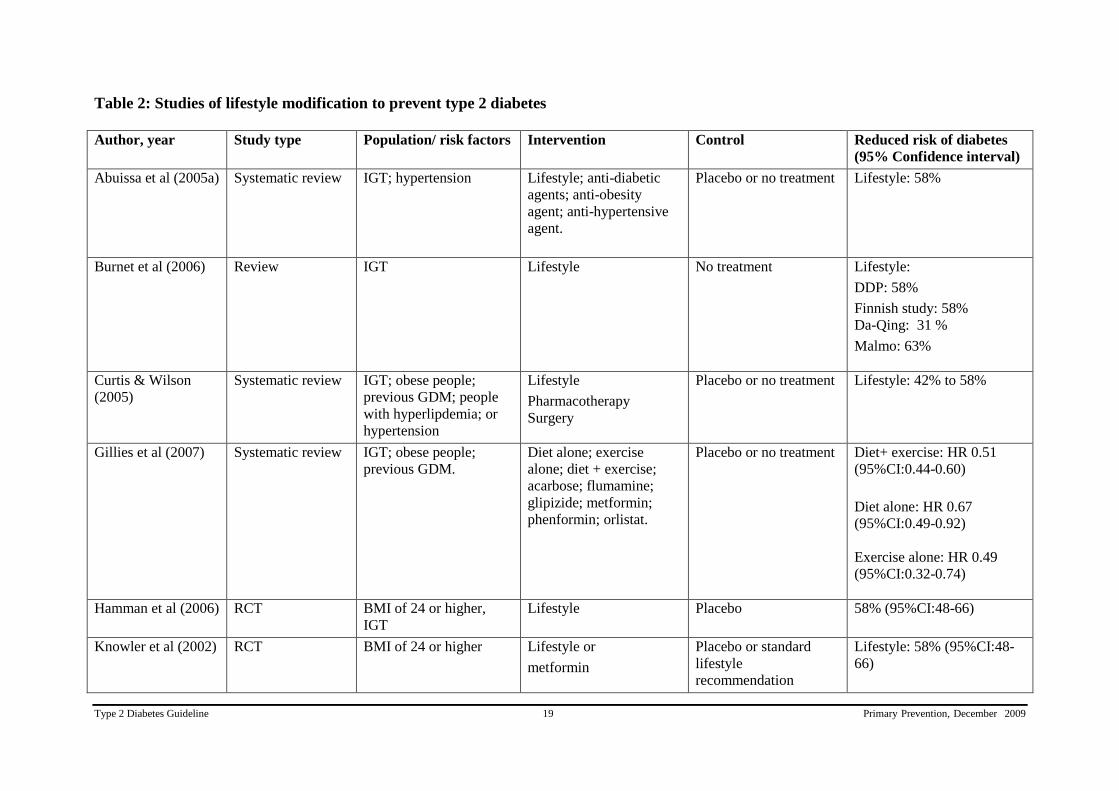
Table 2: Studies of lifestyle modification to prevent type 2 diabetes
Author, year Study type Population/ risk factors Intervention Control Reduced risk of diabetes
(95% Confidence interval)
Abuissa et al (2005a) Systematic review IGT; hypertension Lifestyle; anti-diabetic
agents; anti-obesity
agent; anti-hypertensive
agent.
Placebo or no treatment Lifestyle: 58%
Burnet et al (2006) Review IGT Lifestyle No treatment Lifestyle:
DDP: 58%
Finnish study: 58%
Da-Qing: 31 %
Malmo: 63%
Curtis & Wilson
(2005)
Systematic review IGT; obese people;
previous GDM; people
with hyperlipdemia; or
hypertension
Lifestyle
Pharmacotherapy
Surgery
Placebo or no treatment Lifestyle: 42% to 58%
Gillies et al (2007) Systematic review IGT; obese people;
previous GDM.
Diet alone; exercise
alone; diet + exercise;
acarbose; flumamine;
glipizide; metformin;
phenformin; orlistat.
Placebo or no treatment Diet+ exercise: HR 0.51
(95%CI:0.44-0.60)
Diet alone: HR 0.67
(95%CI:0.49-0.92)
Exercise alone: HR 0.49
(95%CI:0.32-0.74)
Hamman et al (2006) RCT BMI of 24 or higher,
IGT
Lifestyle Placebo 58% (95%CI:48-66)
Knowler et al (2002) RCT BMI of 24 or higher Lifestyle or
metformin
Placebo or standard
lifestyle
recommendation
Lifestyle: 58% (95%CI:48-
66)

Type 2 Diabetes Guideline 20 Primary Prevention, December 2009
Author, year Study type Population/ risk factors Intervention Control Reduced risk of diabetes
(95% Confidence interval)
Kosaka et al (2005) RCT BMI of 22 or higher Lifestyle Standard lifestyle
recommendation
67%
Laaksonen et al
(2005)
RCT Lifestyle – specifically
leisure time physical
activity
63-65%
Li et al (2008) RCT IGT Lifestyle No treatment 43% (HRR 0.57; 95%CI:0.4-
0.8)
Lindstrom et al
(2006)
RCT Lifestyle No treatment 43%
Norris et al (2005) Systematic review
Prediabetes Lifestyle No treatment 43% to 58%
Liberopoulos et al
(2006)
Systematic review IGT Lifestyle
Anti-obesity drugs
Anti-diabetic drugs
Placebo or no treatment Lifestyle: 67%
Pan et al (1997) RCT IGT Lifestyle No treatment Diet: 56%
Exercise: 59%
Diet + Exercise: 51%
Ramchandran et al
(2006)
RCT IGT Lifestyle
metformin
Lifestyle + metformin
Standard healthcare
advice
29% (95%CI:20-37)
Tuomilehto et al
(2001)
RCT BMI of 25 or higher,
IGT
Lifestyle General information
about diet & exercise
58% (HR,0.4, 95%CI:0.3-
0.7)
Yamaoka , Tango
(2005)
Meta-analysis IGT, IFG Lifestyle No treatment 50% (RR 0.55; 95%CI:0.44-
0.69)
Life style interventions refers to increased physical activity / or dietary changes/ or weight loss.

Type 2 Diabetes Guideline 21 Primary Prevention, December 2009
2. Pharmacotherapy
Pharmacological interventions (including metformin, acarbose,
rosiglitazone and orlistat) are effective in preventing/delaying the onset of
type 2 diabetes in high risk individuals. (Evidence Level I)
Anti-diabetic agents
There is evidence that a number of anti-diabetic agents can prevent the development of type 2
diabetes (Abuissa et al, 2005; Padwal et al, 2005; Salpeter et al, 2008). A recent systematic
review by Gillies et al (2007) show that oral diabetes medications (including acarbose;
flumamine; glipizide; metformin; phenformin; orlistat) prevent or delay the development of
type 2 diabetes in people with IGT (HR 0.70 95% CI 0.62-0.79, P <0.001) (Gillies et al,
2007). The calculated number of people needed to treat to prevent or delay one case of
diabetes through the use of these agents was 10.8 (95% credible interval 8.1-15.0) . Similar
findings were reported also by a number of other reviews
The Diabetes Reduction Assessment with Ramipril and Rosiglitazone Medication (DREAM)
study demonstrated the effectiveness of rosiglitazone in preventing the incidence of type 2
diabetes in high risk individuals. In this study, 5269 adults aged 30 years or more with
impaired fasting glucose or impaired glucose tolerance, or both, and no previous
cardiovascular disease were recruited from 191 sites in 21 countries and randomly assigned to
receive rosiglitazone (8 mg daily; n=2365) or placebo (n=2634) and followed for a median of
3 years. The primary outcome was a composite of incident diabetes or death. At the end of
study, 306 (11·6%) individuals of those given rosiglitazone and 26·0% of those given placebo
developed the composite primary outcome (hazard ratio 0·40, 95% CI 0·35–0·46; p<0·0001);
1330 (50·5%) individuals in the rosiglitazone group and 798 (30·3%) in the placebo group
became normoglycaemic (1·71, 1·57–1·87; p<0·0001). The authors concluded that
rosiglitazone at 8 mg daily for 3 years substantially reduces incident type 2 diabetes and
increases the likelihood of regression to normoglycaemia in adults with impaired fasting
glucose or impaired glucose tolerance, or both (DREAM, 2006).
Salpeter and colleagues performed a meta-analysis of randomized controlled trials to assess
the effect of metformin on metabolic parameters and the incidence of new-onset diabetes in
persons at risk of diabetes. They performed comprehensive English- and non-English-
language searches of EMBASE, MEDLINE, and CINAHL databases from 1966 to November
of 2006 and scanned selected references and included randomised trials of at least 8 weeks
duration that compared metformin with placebo or no treatment in persons without diabetes
and evaluated body mass index, fasting glucose, fasting insulin, calculated insulin resistance,
high-density lipoprotein cholesterol, low-density lipoprotein cholesterol, triglycerides, and the
incidence of new-onset diabetes. Four trials in children and adolescents were included. Pooled
results of 31 trials with 4,570 participants followed for 8,267 patient-years showed that
metformin reduced body mass index (-5.3%, 95% CI -6.7--4.0), fasting glucose (-4.5%, 95%
CI -6.0--3.0), fasting insulin (-14.4%, 95% CI -19.9--8.9), and calculated insulin resistance (-
22.6%, 95% CI -27.3--18.0) compared with placebo or no treatment. The incidence of new-
onset diabetes was reduced by 40% (OR 0.6; 95% CI 0.5-0.8), with an absolute risk reduction
of 6% (95% CI 4-8) during a mean trial duration of 1.8 years. Most trials in the meta-analysis
provided recommendations for exercise and diet in both the treatment and control groups, so
the effect seen was a result of treatment in addition to lifestyle modification. Two trials

Type 2 Diabetes Guideline 22 Primary Prevention, December 2009
evaluated the effect of intensive lifestyle modification alone compared with metformin on
diabetes incidence, and pooled data showed that lifestyle modification was significantly more
effective than metformin. One trial evaluated the combination of intensive lifestyle measures
and metformin on weight, and found that the combination produced the most significant
reductions compared with either treatment alone.
Van de Laar and colleagues (2006) conducted a systematic review on the effects of acarbose
on diabetes based on a search of the Cochrane Library, PUBMED, EMBASE, Web of Science
and LILACS up until February 2006. This search was supplemented by reference to databases
of ongoing trials and by consulting expert opinion. Evidence from three studies indicated that
acarbose reduces the incidence of diabetes. Evidence from one of these three studies, the
STOP-NIDDM which had the lowest risk of bias, suggested that treating 10 people for three
years with acarbose would prevent one case of type 2 diabetes.
Padwal et al (2005) systematically reviewed the evidence for the prevention of type 2 diabetes
by pharmacological therapies. Randomised controlled trials and cohort studies examining the
effect of oral anti-diabetic agents, anti-obesity agents, anti-hypertensive agents, statins,
fibrates, and oestrogen on the incidence of type 2 diabetes were identified from MEDLINE,
EMBASE, the Cochrane Controlled Trials Registry, and searches of reference lists. Ten
studies of anti-diabetic agents and 15 studies of non-oral anti-diabetic agents were found.
Anti-diabetic agents and orlistat are the only drugs that have been studied in randomised
controlled trials with diabetes incidence as the primary end point. In the largest studies of 2.5–
4.0 years‟ duration, metformin (RR 0.69, 95% CI 0.57–0.83),
acarbose (RR 0.75, 95% CI
0.63–0.90), troglitazone (RR 0.45, 95% CI 0.25–0.83), and orlistat (HR 0.63, 95% CI 0.46–
0.86) all decreased diabetes incidence compared
with placebo. The authors concluded that
evidence for statins, fibrates, antihypertensive agents, and estrogen was inconclusive.
Anti-obesity agents
One anti-obesity agent has also been successful in preventing diabetes. Analysis of two trials
has shown that orlistat can prevent or delay diabetes in people with IGT (HR 0.44; 95% CI
0.28-0.69) (Gillies et al, 2007). The calculated number of people needed to treat to prevent or
delay one case of diabetes with orlistat was 5.4 (95% credible interval 4.1-7.6). This analysis
again confirmed earlier findings (Curtis et al, 2005).
Padwal et al (2005) systematic review, as described above, also reported that orlistat (HR
0.63, 95% CI 0.46–0.86) decreases diabetes incidence compared
with placebo.

Type 2 Diabetes Guideline 23 Primary Prevention, December 2009
Table 3: Studies of Pharmacotherapy in the prevention of type 2 diabetes
Author, year Study type Population/ risk factors Intervention Control Reduced risk of
diabetes
Salpeter SR, 2008 Meta-analysis of 31
RCTs, including 4579
patient
obesity, abdominal obesity,
metabolic syndrome, polycystic
ovary syndrome, impaired
glucose tolerance or insulin
resistance, family history of
diabetes, hypertension,
dyslipidemia, and peripheral
vascular disease
Metformin Placebo or no treatment 40%
Abuissa et al (2005a) Systematic review IGT; hypertension Lifestyle
Anti-diabetic agents:
(metformin;
Acarbose;
Troglitazone)
Anti-obesity drug:
orlistat
Placebo or no treatment Anti-diabetic agents:
31%
orlistat: 37%
Curtis & Wilson (2005) Systematic review IGT, obese people, previous
GDM, people with
hyperlipdemia or hypertension
Lifestyle
Pharmacotherapy
(metformin;
Troglitazone;
Acarbose; orlistat)
Surgery
Placebo or no treatment Pharmacotherapy: 25%
to 56%
metformin: 31%
Troglitazone: 56%
Acarbose: 25-36%
orlistat: 33.7%
DREAM Trial (2006) RCT IFG or IGT Rosiglitazone Placebo 60%
Gillies et al (2007) Systematic review IGT, obese, previous GDM. Diet alone; exercise
alone; diet +
exercise; acarbose;
flumamine;
glipizide; metformin;
Placebo Hazard ratio:
Oral diabetes drug:
0.70

Type 2 Diabetes Guideline 24 Primary Prevention, December 2009
Author, year Study type Population/ risk factors Intervention Control Reduced risk of
diabetes
phenformin; orlistat
Anti-obesity drug: 0.44
Knowler et al (2002) RCT BMI of 24 or higher Lifestyle
or
metformin
Placebo + standard
lifestyle
recommendation
metformin: 31%
Liberopoulos et al
(2006)
Systematic review Non-diabetic obese patients
(BMI >30)
IGT
Lifestyle
Anti-obesity drugs
(orlistat)
Anti-diabetic drugs
(nateglinide;
troglitazone;
ramipril; acarbose;
metformin)
Placebo or no treatment Anti-obesity drugs:
37.3%
Anti-diabetic drugs:
25% - 87.8%
Padwal et al (2005) Systematic review IGT; gestational diabetes Metformin
Acarbose
Troglitazone
Orlistat
Placebo metformin: RR 0.69
Acarbose: RR 0.75
Troglitazone RR 0.45
Orlistat: Hazard Ratio
0.63
Ramchandran et al
(2006)
RCT IGT Lifetsyle
Metformin
Lifestyle &
metformin
Standard health care
advice
metformin: RR
reduction: 26.4%
Lifestyle & metformin:
RR reduction: 28.2%
Van de Laar et al (2006) Meta-analysis IGT or IFG Acarbose Placebo RR: 0.78

Type 2 Diabetes Guideline 25 Primary Prevention, December 2009
3. Surgery
Bariatric surgery can prevent/delay progression to type 2 diabetes in
people who are morbidly obese. (Evidence Level III)
Another approach to diabetes prevention is through bariatric surgery. Ferchak and Meneghini
(2004) searched MEDLINE for relevant studies published between 1990 and 2003 and
evaluated the impact of bariatric surgery and lifestyle interventions on the prevention and
management of type 2 diabetes. Two pre- and post studies in people with IGT undergoing
gastric by-pass (Roux-en-Y procedure) were identified. In the first of these, 98.7 % of
subjects (n=165) remained euglycaemic after an average of 7.6 years of follow-up. The
second study was a non-randomised controlled study which followed 136 subjects with IGT
and morbid obesity (109 underwent gastric by-pass and 27 elected not to have surgery and
served as controls). In the later study, only one subject (0.9%) in the surgical group developed
diabetes after an average 5.8 years follow-up compared with 6 subjects (22%) in the control
group.
There have also been a number of case-control studies that have demonstrated that surgery
prevented the development of type 2 diabetes in morbidly obese subjects. The Swedish Obese
Subjects (SOS) Study (Sjostrom et al, 2004) was a prospective case-control study involving
1,879 obese patient pairs in which one underwent gastric surgery and the other received non-
surgical obesity treatment. The 2-year mean weight loss was 28 kg among obese participants
who had undergone surgery compared with 0.5 kg among obese participants who had not. In
this study the incidence of diabetes was markedly lower in the surgically treated group than in
the control group after 2 years (OR = 0.14, 95% CI: 0.08-0.24, p<0.001) and 10 years (OR =
0.25, 95% CI: 0.17-0.38, p<0.001).
Another case-controlled study compared laparoscopic gastric banding (LAGB) and
conventional diet in the prevention of type 2 diabetes (Pontiroli et al, 2005). Of the 122
subjects in this study, 73 had the LAGB (intervention group) and the control group (No-
LAGB) consisted of the 49 subjects who refused surgery but agreed to be followed up. Six of
the control group dropped out of the study. At the end of 4-year follow up, five of the control
subjects (17.2%) and none of the LAGB subjects (0.0%; p = 0.0001) progressed to type 2
diabetes.
A prospective case-control study has investigated the efficacy of minimal invasive gastric
banding surgery for reducing caloric intake in morbid obesity, also analysing the effects of
weight loss on body composition and metabolic and psychosocial outcomes (Dittmar et al,
2003). This study included 35 morbidly obese adults, of whom 26 underwent laproscopic
gastric banding. The nine patients who rejected surgery were treated with metformin and
were included as a small control group. The control group failed to exhibit any decrease in
body weight, BMI or fat mass, and their metabolic parameters did not improve.
Preoperatively, many of the surgical group (14 or 54%) had high fasting blood glucose
indicating the presence of type 2 diabetes, while 11 (42%) had IGT. Postoperatively, over
mean follow-up time of 17 ± 2.2 months, the surgical group showed a decline in fasting blood
glucose values.

Type 2 Diabetes Guideline 26 Primary Prevention, December 2009
A cohort study has assessed the efficacy of the Swedish adjustable gastric band in the
treatment of type 2 diabetes, IGT and the metabolic syndrome in 905 morbidly obese patients
who had undergone gastric band surgery (Brancatisano et al, 2008). A total of 682 had > 6
months of follow-up, with a median follow-up of 12.5 months. Of these, 78 patients had type
2 diabetes, 64 had IGT, and 100 had the metabolic syndrome. No patient with IGT
developed diabetes or progressed to require medication after surgery. Moreover remission
and/or improvement in the metabolic syndrome occurred in 88% of patients. Adjustable
gastric band surgery was therefore considered to potentially prevent progression to diabetes
by morbidly obese patients with IGT.

Type 2 Diabetes Guideline 27 Primary Prevention, December 2009
Summary – Can type 2 diabetes be prevented? how it can be prevented in
high risk individuals?
A large body of evidence demonstrates that type 2 diabetes can be prevented in
individuals at high risk of developing diabetes.
In people with IGT, the evidence clearly demonstrated that lifestyle interventions (ie
diet alone, physical activity alone or diet and physical activity combined compared
with routine advice) could prevent or delay diabetes in half the subjects.
5-7% weight loss can prevent type 2 diabetes in people with IGT, For every kilogram
of weight loss, there is a 16% reduction in risk, adjusted for changes in diet and
activity.
Lower percent of calories from fat and increased physical activity predicted weight
loss. Increased physical activity was important to help sustain weight loss.
Moderate-to-vigorous leisure time physical activity or strenuous, structured leisure
time physical activity is recommended to reduce the risk of type 2 diabetes.
Weight loss correlated with decreased progression of IGT to type 2 diabetes, all
studies were relatively short term, average follow-up 3 years. It is not known for how
many years the weight loss and the effort to sustain it can be maintained.
Lifestyle modification prevention trials have been conducted among people with IGT
because it is the best predictor of future diabetes.
Pharmacotherapy including metformin and orlistat reduce type 2 diabetes incidence in
people with IGT and overweight respectively.
The studies presented in this section involved individual interventions. The challenge
is for policymakers, population health practitioners, researchers, clinicians to
implement those proven interventions. Small gains in prevention are likely to have
significant population benefits.
The critical question of whether lifestyle modification and drugs are preventing, or
simply delaying, onset of type 2 diabetes remains unresolved.
Future studies should be designed with diabetes incidence as the primary outcome and
should be of sufficient duration to differentiate between genuine diabetes prevention as
opposed to simple delay or masking of this condition.
Further work is needed on the long-term effects of these interventions in diverse
community settings.
Type 2 Diabetes Guideline 28 Primary Prevention, December 2009
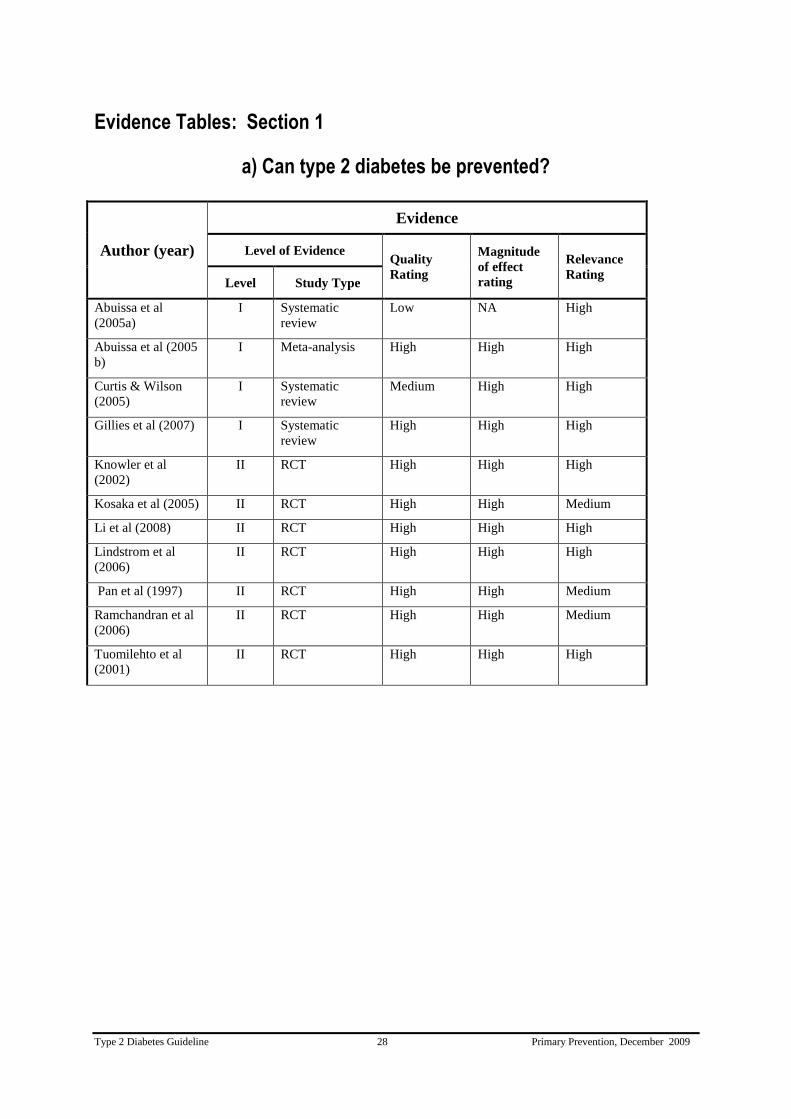
Evidence Tables: Section 1
a) Can type 2 diabetes be prevented?
Author (year)
Evidence
Level of Evidence Quality
Rating
Magnitude
of effect
rating
Relevance
Rating Level Study Type
Abuissa et al
(2005a)
I Systematic
review
Low NA High
Abuissa et al (2005
b)
I Meta-analysis High High High
Curtis & Wilson
(2005)
I Systematic
review
Medium High High
Gillies et al (2007) I Systematic
review
High High High
Knowler et al
(2002)
II RCT High High High
Kosaka et al (2005) II RCT High High Medium
Li et al (2008) II RCT High High High
Lindstrom et al
(2006)
II RCT High High High
Pan et al (1997) II RCT High High Medium
Ramchandran et al
(2006)
II RCT High High Medium
Tuomilehto et al
(2001)
II RCT High High High

Type 2 Diabetes Guideline 29 Primary Prevention, December 2009
b) How can type 2 diabetes be prevented in high risk individuals?
1. Lifestyle change
Author (year)
Evidence
Level of Evidence Quality
Rating
Magnitude
of effect
rating
Relevance
Rating Level Study Type
Abuissa et al
(2005a)
I Systematic
review
Low NA High
Burnet et al (2006) I Systematic
review
Low High High
Curtis & Wilson
(2005)
I Systematic
review
Medium High High
de Munter JSL
(2007)
I Systematic
review
Medium High High
Gillies et al (2007) I Systematic
review
High High High
Hamman et al
(2006)
II RCT High High High
Knowler et al
(2002)
II RCT High High High
Kosaka et al (2005) II RCT High High Medium
Laaksonen et al
(2005)
II RCT High High High
Li et al (2008) II RCT High High High
Lindstrom et al
(2006)
II RCT High High High
Norris et al (2005) I Systematic
review
High High High
Liberopoulos et al
(2006)
I Systematic
review
Low N/A High
Pan et al (1997) II RCT High High Medium
Ramchandran et al
(2006)
II RCT High High Medium
Tuomilehto et al
(2001)
II RCT High High High
Yamaoka , Tango
(2005)
I Meta-analysis Medium High High

Type 2 Diabetes Guideline 30 Primary Prevention, December 2009
2. Pharmacotherapy
Author (year)
Evidence
Level of Evidence Quality
Rating
Magnitude
of effect
rating
Relevance
Rating Level Study Type
Abuissa et al (2005a) I Systematic
review
Low N/A High
Curtis & Wilson
(2005)
I Systematic
review
Medium High High
DREAM Trial (2006) II RCT High High High
Gillies et al (2007) I Systematic
review
High High High
Knowler et al (2002) II RCT High High High
Liberopoulos et al
(2006)
I Systematic
review
Low N/A High
Padwal et al (2005) I Systematic
review
Medium Medium High
Ramchandran et al
(2006)
II RCT High High Medium
Salpeter et al (2008) I Meta-analysis High High High
Van der Laar et al
(2006)
I Meta-analysis High High High

Type 2 Diabetes Guideline 31 Primary Prevention, December 2009
3. Surgery
Author (year)
Evidence
Level of Evidence Quality
Rating
Magnitude
of effect
rating
Relevance
Rating Level Study Type
Brancatisano et al
(2008)
III-3 Cohort
(Prognosis study)
Low High High
Dittmar et at
(2003)
III-2 Case-Control
(Prognosis study)
Medium Medium High
Ferchak &
Meneghini (2004)
I Systematic
review
Low High High
Pontiroli (2005) III-2 Case-Control
(Prognosis study)
Medium High Medium
Sjostrom et al
(2004)
III-2 Case-Control
(Prognosis study)
Medium High Medium
Type 2 Diabetes Guideline 32 Primary Prevention, December 2009
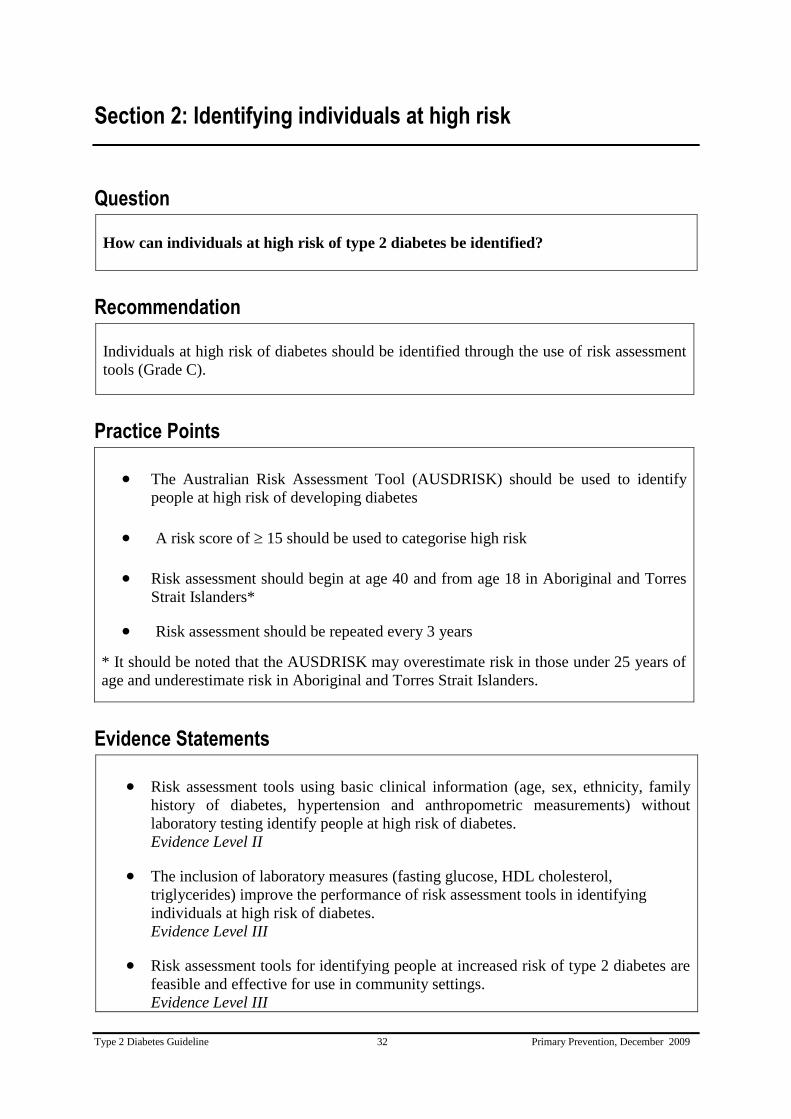
Section 2: Identifying individuals at high risk
Question
How can individuals at high risk of type 2 diabetes be identified?
Recommendation
Individuals at high risk of diabetes should be identified through the use of risk assessment
tools (Grade C).
Practice Points
The Australian Risk Assessment Tool (AUSDRISK) should be used to identify
people at high risk of developing diabetes
A risk score of 15 should be used to categorise high risk
Risk assessment should begin at age 40 and from age 18 in Aboriginal and Torres
Strait Islanders*
Risk assessment should be repeated every 3 years
* It should be noted that the AUSDRISK may overestimate risk in those under 25 years of
age and underestimate risk in Aboriginal and Torres Strait Islanders.
Evidence Statements
Risk assessment tools using basic clinical information (age, sex, ethnicity, family
history of diabetes, hypertension and anthropometric measurements) without
laboratory testing identify people at high risk of diabetes.
Evidence Level II
The inclusion of laboratory measures (fasting glucose, HDL cholesterol,
triglycerides) improve the performance of risk assessment tools in identifying
individuals at high risk of diabetes.
Evidence Level III
Risk assessment tools for identifying people at increased risk of type 2 diabetes are
feasible and effective for use in community settings.
Evidence Level III

Type 2 Diabetes Guideline 33 Primary Prevention, December 2009
Background – Identifying individuals at high risk
Interventions in people at high risk of developing diabetes can prevent or delay progression to
diabetes. Most intervention studies to prevent diabetes have focussed on people with IGT,
while some have also included people with IFG. These conditions are prevalent in Australia
with the AusDiab Study reporting a prevalence of IGT of 10.6% while the prevalence of IFG
was 5.8% (Dunstan , 2002).
The identification of people with IGT requires performing an oral glucose tolerance test
(OGTT) which is not practical for community-based diabetes prevention programs. Detecting
IFG is easier, but still requires measurement of fasting plasma glucose, which also presents
logistic difficulties for community programs.
In recent years attention has focussed on alternate and practical methods which could be
applied in a community setting for identifying people at high risk of type 2 diabetes who
could be offered preventative interventions (Engelgau et al, 2004).
The most commonly used method has become risk assessment using a risk assessment tool.
These are based on the fact there are well documented risk factors which characterise
individuals at high risk of the future development of type 2 diabetes.
This section begins with a brief review of these factors and then examines the evidence about
risk assessment tools.
Risk factors for developing type 2 diabetes
There are many known risk factors for type 2 diabetes, the difficulty is to determine the ones
with the greatest applicability for clinical use (Waugh et al, 2007).
1. Non-modifiable risk factors for developing type 2 diabetes
i. Age / genetic / family history / gender
Prevalence and risk of diabetes increase markedly with increasing age except in those over
the age of 75 years. Type 2 diabetes also has a strong genetic component and risk is higher
in those with a family history of diabetes (Frayling, 2007). Prevalence rates are higher in
men than in women (Dunstan et al, 2001). Risks associated with these non-modifiable
factors however, are often only unmasked by the presence of obesity and physical inactivity,
indicating the importance of interactions between genetic and lifestyle factors in the
development of diabetes (Franks et al, 2007).
ii. Ethnic groups
Diabetes prevalence is high in some of Australia‟s culturally and linguistically diverse
(CALD) communities including people born in Southern Europe, in North Africa and the
Middle East or in the Pacific Islands and South Asia (Colagiuri et al, ; Australian Institute of
Health and Welfare, 2008). High prevalence of being overweight, physical inactivity and
unhealthy diet together with genetic susceptibility and other psychosocial factors related to
immigration contribute to the higher incidence and prevalence of diabetes among CALD
communities.
Type 2 Diabetes Guideline 34 Primary Prevention, December 2009
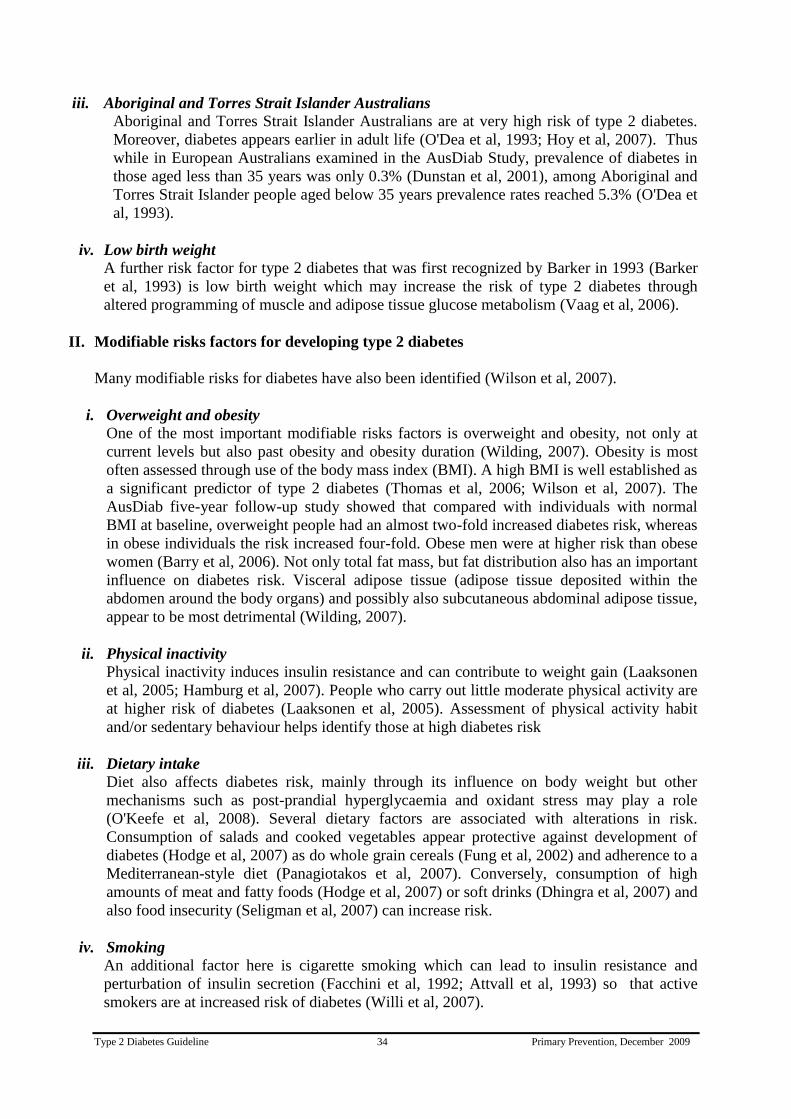
iii. Aboriginal and Torres Strait Islander Australians
Aboriginal and Torres Strait Islander Australians are at very high risk of type 2 diabetes.
Moreover, diabetes appears earlier in adult life (O'Dea et al, 1993; Hoy et al, 2007). Thus
while in European Australians examined in the AusDiab Study, prevalence of diabetes in
those aged less than 35 years was only 0.3% (Dunstan et al, 2001), among Aboriginal and
Torres Strait Islander people aged below 35 years prevalence rates reached 5.3% (O'Dea et
al, 1993).
iv. Low birth weight
A further risk factor for type 2 diabetes that was first recognized by Barker in 1993 (Barker
et al, 1993) is low birth weight which may increase the risk of type 2 diabetes through
altered programming of muscle and adipose tissue glucose metabolism (Vaag et al, 2006).
II. Modifiable risks factors for developing type 2 diabetes
Many modifiable risks for diabetes have also been identified (Wilson et al, 2007).
i. Overweight and obesity
One of the most important modifiable risks factors is overweight and obesity, not only at
current levels but also past obesity and obesity duration (Wilding, 2007). Obesity is most
often assessed through use of the body mass index (BMI). A high BMI is well established as
a significant predictor of type 2 diabetes (Thomas et al, 2006; Wilson et al, 2007). The
AusDiab five-year follow-up study showed that compared with individuals with normal
BMI at baseline, overweight people had an almost two-fold increased diabetes risk, whereas
in obese individuals the risk increased four-fold. Obese men were at higher risk than obese
women (Barry et al, 2006). Not only total fat mass, but fat distribution also has an important
influence on diabetes risk. Visceral adipose tissue (adipose tissue deposited within the
abdomen around the body organs) and possibly also subcutaneous abdominal adipose tissue,
appear to be most detrimental (Wilding, 2007).
ii. Physical inactivity
Physical inactivity induces insulin resistance and can contribute to weight gain (Laaksonen
et al, 2005; Hamburg et al, 2007). People who carry out little moderate physical activity are
at higher risk of diabetes (Laaksonen et al, 2005). Assessment of physical activity habit
and/or sedentary behaviour helps identify those at high diabetes risk
iii. Dietary intake
Diet also affects diabetes risk, mainly through its influence on body weight but other
mechanisms such as post-prandial hyperglycaemia and oxidant stress may play a role
(O'Keefe et al, 2008). Several dietary factors are associated with alterations in risk.
Consumption of salads and cooked vegetables appear protective against development of
diabetes (Hodge et al, 2007) as do whole grain cereals (Fung et al, 2002) and adherence to a
Mediterranean-style diet (Panagiotakos et al, 2007). Conversely, consumption of high
amounts of meat and fatty foods (Hodge et al, 2007) or soft drinks (Dhingra et al, 2007) and
also food insecurity (Seligman et al, 2007) can increase risk.
iv. Smoking
An additional factor here is cigarette smoking which can lead to insulin resistance and
perturbation of insulin secretion (Facchini et al, 1992; Attvall et al, 1993) so that active
smokers are at increased risk of diabetes (Willi et al, 2007).

Type 2 Diabetes Guideline 35 Primary Prevention, December 2009
v. Psychological stress
Stressful events in the family, at work or related to the physical or social environment also
appear to contribute to diabetes risk (Golden, 2007). In addition, depression is a risk factor
for type 2 diabetes (Knol et al, 2006).
III. Other risk factors
i. Gestational diabetes mellitus (GDM)
GDM is associated with an increased risk of the future development of type 2 diabetes in the
mother (Kitzmiller et al, 2007). GDM is common in Australia with prevalence varying with
ethnicity, ranging from 3% in women of European background to as high as 17% in women
of Indian background (Hunt & Schuller, 2007).
ii. Polycystic ovary syndrome
PCOS is characterized by androgen excess, menstrual irregularity and the appearance of
large follicles in one or both ovaries and is linked to insulin resistance, hyperinsulinaemia
and frequently to central obesity (Bako et al, 2005). Women with PCOS have an increased
risk of abnormalities of glucose intolerance.
iii. The Metabolic Syndrome
The metabolic syndrome describes a cluster of risk factors including central obesity,
dyslipidaemia, high blood pressure and hyperglycaemia (Eckel et al, 2005). In Australia
approximately 20-30% of people have the syndrome, depending on the definition used
(Cameron et al, 2008). The risk of the future development of diabetes in people with the
syndrome is increased about 2-4-fold (Eckel et al, 2005).
Using various combinations of the above mentioned risk factors has led to the development of
models which have the potential to identify adults at high risk of developing diabetes. As was
discussed in the previous section, diabetes can be prevented through lifestyle,
pharmacological and surgical interventions. However, as universal population screening is
costly and is not recommended, accurate and quick identification of people at high risk of
developing diabetes is required to ensure that those who will most benefit from primary
prevention interventions are targeted so that these interventions are implemented effectively
and efficiently. As detailed further in the report, cohort studies have been conducted and
simple identification techniques which are widely and easily applicable to daily clinical
practice have been developed.

Type 2 Diabetes Guideline 36 Primary Prevention, December 2009
Evidence- Identifying individuals at high risk
Risk assessment tools using basic clinical information (age, sex, ethnicity, family
history of diabetes, hypertension and anthropometric measurements) without
laboratory testing identify people at high risk of diabetes. (Evidence Level II)
The inclusion of laboratory measures (fasting glucose, HDL cholesterol, triglycerides)
improve the performance of risk assessment tools in identifying individuals at high
risk of diabetes. (Evidence Level III)
Risk assessment tools for identifying people at increased risk of type 2 diabetes are
feasible and effective for use in community settings. (Evidence Level III)
The traditional way of identifying people at high risk of developing diabetes has used an
OGTT. The landmark diabetes prevention studies (eg Finnish and US prevention studies)
used one or even two OGTTs to identify people with IGT. While this method is effective
because of the high risk of people with IGT developing diabetes, this is not practical for
routine clinical practice and community settings.
Risk factor based models
Risk factor based models are an alternate approach and a number of models have been
developed for identifying adults at high risk for diabetes. These can use either risk factors
alone or in combination with laboratory measurements. Models without laboratory testing are
summarised in Table 4. The simplicity of these approaches makes them readily available for
use in daily practice.
1. Risk scores without laboratory testing
The most widely used risk tool for characterising individuals according to their future risk of
type 2 diabetes is FINDRISK, which was developed in Finland (Lindstrom & Tuomilehto,
2003). A random population sample of 4,746 35-64 year old men and women who were not
taking anti-diabetic medications was chosen from the Finnish National Population Register in
1987 and followed for 10 years. A simple diabetes risk scoring system involving only
parameters which are considered easy to assess without the need for any laboratory tests or
other clinical measurements requiring specialised skills (age, BMI, waist circumference,
blood pressure medication, history of high blood glucose levels, diet and physical activity)
was produced. Each parameter was assigned an individual score with the Diabetes Risk Score
calculated as the sum of these scores varying from 0 (very low risk) to 20 (very high risk).
Diabetes Risk Scores were calculated for each participant and a score of 9 was selected as the
point defining increased risk of developing diabetes requiring medication treatment, with a
sensitivity of 0.78 and specificity of 0.81. The participants were classified into four Diabetes
Risk Score categories (0-3; 4-8; 9-12 and 13-20). During the 10 year follow-up, the incidence
of medication requiring diabetes was significantly (p = 0.001) elevated in the two highest
categories for both men (0-3: 0.3%; 4-8: 2.4%; 9-12: 10.5% and 13-20: 32.7%) and women
(0-3: 0.6%; 4-8: 1.3%; 9-12: 6.6% and 13-20: 28.2%). This Diabetes Risk Score model was
further validated using another random sample of 4,615 from a 1992 survey followed for 5
years. Diabetes Risk Scores were calculated for each participant and they were again
classified into the four Diabetes Risk Score categories as above. Similar to the 1987 cohort,
the incidence of medication requiring diabetes was significantly (p = 0.001) elevated in the

Type 2 Diabetes Guideline 37 Primary Prevention, December 2009
two highest categories for both men (0-3: 0.3%; 4-8: 0.8%; 9-12: 2.6% and 13-20: 23.1%) and
women (0-3: 0.1%; 4-8: 0.4%; 9-12: 2.2% and 13-20: 14.1%) in the 1992 cohort. In the 1987
and 1992 cohorts, 25% of both men and women, and 26% of men and 24% of women,
respectively were classified in the two highest risk categories.
A similar diabetes risk score has been developed by Pearson and colleagues (2003). Using a
large prospective cohort study in the upper Midwestern United States Pearson and colleagues
conducted a health risk assessment questionnaire which included specific questions associated
with diabetes risk factors (overweight, physical inactivity, age, ethnicity, family history of
diabetes and/or hypertension, hypertension, hypercholesterolaemia, gestational diabetes,
delivery of a baby > 4.1 kg). Based on available evidence and consensus statements from
experts in the field, these 10 risk factors were each assigned a weighted score and the diabetes
risk score for each individual was computed as the sum of all risk factor scores. Two
thresholds, specifically scores > 5 and scores > 6, were defined as high diabetes risk. The
study sample had a mean age of 42.5 years (range 19-91 years), 62.2% of participants were
female, 91.5% were white, 71.9% had received some college education, and only 2.7% were
older than 65 years. When the high risk score was defined as > 5, 28.2% of the surveyed
population were identified at high risk and after an average 2.5 year follow-up, the incidence
of diabetes was 3.5% in this high risk group compared with 0.7% in the low risk group whose
risk score was < 5 (p < 0.001). When the high risk score was defined as > 6, 17.9% of the
surveyed population were identified at high risk with the incidence of diabetes at follow-up
being 4.6% compared with 0.9% in the low risk group whose risk score was < 6 (p < 0.001).
The German Diabetes Risk Score developed by Schulze and colleagues (2007) was based
only on anthropometric, dietary and lifestyle factors and estimated the probability of
developing diabetes within 5 years. A prospective cohort (EPIC-Potsdam) of 9,729 men and
15,438 women aged 35-65 years was used to derive the risk score for predicting the
development of type 2 diabetes. Points were allocated to anthropometry, diet and lifestyle
factors and the total German Diabetes Risk Score was calculated to determine the probability
of each participant developing diabetes during the follow-up period. Data from a second
cohort (EPIC Heidelberg) of 23,398 participants with a similar age range to the EPIC-
Potsdam cohort was then used to validate this score. During an average 7 year follow-up, 849
incident cases of type 2 diabetes were observed amongst the EPIC-Potsdam cohort and 658 of
the EPIC Heidelberg cohort developed diabetes during the first 5 years of follow-up. These
actual incidences of diabetes were comparable to probability estimate of diabetes incidence
derived from the risk scores of each of the cohorts [Receiver-Operating Characteristics Area
Under the Curve (ROC AUC) 0.84 for the EPIC-Potsdam cohort and 0.82 for the EPIC-
Heidelberg cohort] and the observed incidence in both cohorts increased with increasing risk
scores.
Risk tools have been developed in other populations. A simple diabetes risk scoring system
developed in Thailand based on age, sex, BMI, waist circumference, history of hypertension
and family history of diabetes was found to be almost as good as models that included
additional laboratory measures such as IFG, IGT, HDL cholesterol and triglycerides
(Aekplakorn et al, 2006), with the predictive ability of the model without laboratory tests
being only slightly lower than the latter (ROC AUC 0.75 vs 0.79). The diabetes risk scoring
system was developed in a cohort of 2,677 non-diabetic Thai individuals aged 35-55 years
with a 12 year follow up period and was then validated using a second different cohort of
2,420 Thai individuals with a 5 year follow up.
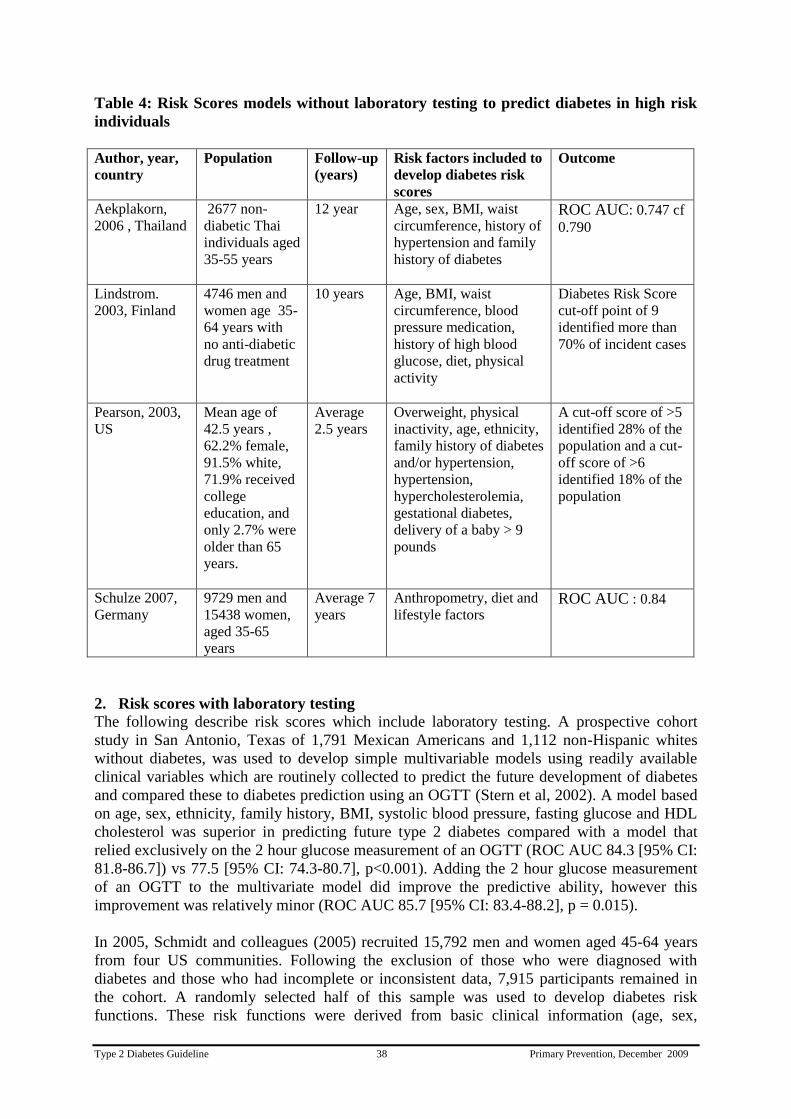
Type 2 Diabetes Guideline 38 Primary Prevention, December 2009
Table 4: Risk Scores models without laboratory testing to predict diabetes in high risk
individuals
Author, year,
country
Population Follow-up
(years)
Risk factors included to
develop diabetes risk
scores
Outcome
Aekplakorn,
2006 , Thailand
2677 non-
diabetic Thai
individuals aged
35-55 years
12 year Age, sex, BMI, waist
circumference, history of
hypertension and family
history of diabetes
ROC AUC: 0.747 cf
0.790
Lindstrom.
2003, Finland
4746 men and
women age 35-
64 years with
no anti-diabetic
drug treatment
10 years Age, BMI, waist
circumference, blood
pressure medication,
history of high blood
glucose, diet, physical
activity
Diabetes Risk Score
cut-off point of 9
identified more than
70% of incident cases
Pearson, 2003,
US
Mean age of
42.5 years ,
62.2% female,
91.5% white,
71.9% received
college
education, and
only 2.7% were
older than 65
years.
Average
2.5 years
Overweight, physical
inactivity, age, ethnicity,
family history of diabetes
and/or hypertension,
hypertension,
hypercholesterolemia,
gestational diabetes,
delivery of a baby > 9
pounds
A cut-off score of >5
identified 28% of the
population and a cut-
off score of >6
identified 18% of the
population
Schulze 2007,
Germany
9729 men and
15438 women,
aged 35-65
years
Average 7
years
Anthropometry, diet and
lifestyle factors ROC AUC : 0.84
2. Risk scores with laboratory testing
The following describe risk scores which include laboratory testing. A prospective cohort
study in San Antonio, Texas of 1,791 Mexican Americans and 1,112 non-Hispanic whites
without diabetes, was used to develop simple multivariable models using readily available
clinical variables which are routinely collected to predict the future development of diabetes
and compared these to diabetes prediction using an OGTT (Stern et al, 2002). A model based
on age, sex, ethnicity, family history, BMI, systolic blood pressure, fasting glucose and HDL
cholesterol was superior in predicting future type 2 diabetes compared with a model that
relied exclusively on the 2 hour glucose measurement of an OGTT (ROC AUC 84.3 [95% CI:
81.8-86.7]) vs 77.5 [95% CI: 74.3-80.7], p<0.001). Adding the 2 hour glucose measurement
of an OGTT to the multivariate model did improve the predictive ability, however this
improvement was relatively minor (ROC AUC 85.7 [95% CI: 83.4-88.2], p = 0.015).
In 2005, Schmidt and colleagues (2005) recruited 15,792 men and women aged 45-64 years
from four US communities. Following the exclusion of those who were diagnosed with
diabetes and those who had incomplete or inconsistent data, 7,915 participants remained in
the cohort. A randomly selected half of this sample was used to develop diabetes risk
functions. These risk functions were derived from basic clinical information (age, sex,

Type 2 Diabetes Guideline 39 Primary Prevention, December 2009
ethnicity, family history of diabetes, hypertension and anthropometric measurements) alone or
combined with simple laboratory measures (fasting glucose, HDL cholesterol, triglycerides).
These risk functions were tested on the other random half of the cohort for predicting incident
diabetes over a 9 year follow-up period. The predictive ability of a risk function using clinical
information only was not significantly different to the predictive ability of fasting glucose
levels alone (ROC AUC 0.71 vs 0.74, p=0.2). Predictive ability of the clinical information
was improved significantly when it was combined with the fasting glucose levels (ROC AUC
0.78, p<0.001) and slightly further improved when lipid measurements were also included
(ROC AUC 0.80, p<0.001).
A screening model reported by Norberg and colleagues (2006) combining HbA1c, BMI and
fasting plasma glucose accurately identified individuals at risk of developing diabetes. This
study was an incident case-referent study nested within a population-based survey conducted
from 1989-2001 in a county in Northern Sweden. Cases were free from diabetes at the
beginning of the health survey but were diagnosed with type 2 diabetes during the study
period. Two non-diabetic referents were randomly chosen for each diabetes case and after
exclusion due to inadequate blood sample, 164 cases and 304 referents were available to
assess the predictive ability of the screening model. The model involved using a HbA1c of
4.7%, fasting plasma glucose 6.1-6.9mmol/l and a BMI ≥ 27kg/m2 for men and ≥ 30kg/m
2 for
women. The sensitivity and specificity of this model was 0.66 and 0.93 respectively for men,
and 0.52 and 0.97 respectively for women, with positive predictive values for men and
women being 32% and 46% respectively. Substituting data from OGTTs for the fasting
plasma glucose levels did not add value to the ability of the model to predict development of
diabetes, neither did lowering the fasting glucose criterion to 5.6mmol/l.
The metabolic syndrome has been used to identify people at risk of diabetes. The San Antonio
Heart Study (Lorenzo et al, 2003) evaluated the performance of two different definitions of
the metabolic syndrome, National Cholesterol Education Program (NCEP) definition and a
modified version of the 1999 WHO definition excluding the 2 hour requirement, in predicting
incident type 2 diabetes, and compared these to the presence of IGT for predicting diabetes
development over a 7-8 year period. Subjects meeting the requirements of the NCEP
definition had a six-fold higher risk of developing diabetes compared with those without the
syndrome (OR = 6.30, 95% CI: 4.60-8.63). This risk was still 3-fold following adjustment for
age, sex, ethnicity, family history of diabetes, IGT and fasting insulin levels (OR = 3.30, 95%
CI: 2.27-4.80). IGT and the NCEP definition had comparable sensitivity for predicting
diabetes, 51.9 and 52.8 respectively, and were higher than the modified WHO definition
(sensitivity = 42.8). IGT however had higher positive predictive value than both the NCEP
definition and the modified WHO definition (43.0 vs 30.8 and 30.4 respectively). However
this finding is not universal. Cameron et al (2008) did not find that the metabolic syndrome
performed well when applied to the AusDiab population.
Australian Diabetes Risk Assessment Tool for Diabetes Prediction (AUSDRISK)
An Australian Diabetes Risk Assessment Tool (AUSDRISK) for the prediction of diabetes
has been developed during the course of this guideline development and was introduced on
the 1st of July, 2008
(http://www.health.gov.au/internet/main/publishing.nsf/Content/C73A9D4A2E9C684ACA25
74730002A31B/$File/Risk_Assessment_Tool.pdf). It attracts a Medicare rebate when applied
to people aged 40-49. Individuals in this age range who are at high risk of diabetes are eligible
for a subsided lifestyle modification program.
Type 2 Diabetes Guideline 40 Primary Prevention, December 2009
AUSDRISK has been developed from the two AusDiab surveys and predicts the risk of
developing diabetes over a 5-year period (Chen et al, 2009). In the original 1999-2000
AusDiab survey, 11,247 individuals participated. In the 2004-5 AusDiab survey, 6,537 of the
original cohort presented for re-examination, of whom there were 6,060 participants aged ≥25
years without diagnosed diabetes at baseline. These 6,060 participants, of whom 362
developed diabetes between the two assessments five years apart, were used to derive
AUSDRISK. AUSDRISK contains a number of well established risk factors for type 2
diabetes namely: age, gender, ethnicity, family history of diabetes, hypertension, smoking,
fruit and vegetable consumption, physical activity, and obesity (Appendix 1).
Using an AUSDRISK score of 15 has a sensitivity of 54.3% , specificity of 83.1% and PPV
of 16.9% respectively for predicting the development of diabetes over the next five years. An
AUSDRISK score of 12 has a sensitivity of 74.0%, specificity of 67.7% and PPV of 12.7%
respectively for predicting future diabetes (Chen et al, 2009). An AUSDRISK score of 15
identifies ~15% of the total population at high risk of developing diabetes within the next five
years.
The performance of AUSDRISK has been assessed when applied to other Australian cohorts.
In terms of discriminative ability, AUSDRISK performed only moderately in the Blue
Mountains Eye Study (BMES) population (Cugati et al, 2007) but discrimination was very
good in the North West Adelaide Health Study (NWAHS) population (Grant et al, 2006). This
may be due in part to the limited age range in the BMES which only recruited people older
than 49 years. The weighting of age categories is likely to be smaller when a score derived
from a wider age group is applied to a population with a limited age range. AUSDRISK
calibrated well in the BMES cohort but only reasonably in the NWAHS. The less satisfactory
calibration might be related to the lower incidence of diabetes in the NWAHS.

Type 2 Diabetes Guideline 41 Primary Prevention, December 2009
Summary: Identifying individuals at high risk
Models using basic clinical information (age, sex, ethnicity, family history of diabetes,
hypertension and anthropometric measurements) alone or combined with simple
laboratory measures (fasting glucose, HDL cholesterol, triglycerides) predict the future
development of diabetes.
Models without the involvement of any laboratory testing have additionally been shown
to be useful in identifying people at high risk of diabetes. These are of particular
importance as the simplicity of these approaches makes them readily available for use in
daily practice.
In Australia and overseas, diabetes Risk Score tools were developed using a simple,
practical and informative scoring system to characterise individuals according to their
future risk of type 2 diabetes.

Type 2 Diabetes Guideline 42 Primary Prevention, December 2009
Evidence Tables: Section 2
How can individuals at high risk of diabetes be identified?
1. Risk scores without laboratory testing
Author (year),
population
Evidence Level of Evidence
Quality Rating Magnitude of
effect rating
Relevance
Rating Level Study
Type*
Aekplakorn et al (2006),
Thailand
II Cohort High High Medium
Lindström & Tuomilehto
(2003), Finland
II Cohort High High High
Pearson et al (2003), US III-1 Cohort Medium Medium High
Schulze et al (2007),
Germany
II Cohort High High High
*Prognosis Studies

Type 2 Diabetes Guideline 43 Primary Prevention, December 2009
2. Risk scores with laboratory testing
Author (year),
population
Evidence
Level of Evidence
Quality Rating Magnitude of
effect rating
Relevance
Rating Level Study
Type*
Diabetes Prevention
Program Research Group
(2005), US
III-2 Cohort
Medium High High
Stern et al (2002),
Mexican American, US
III-2 Cohort Medium Medium Medium
Lorenzo et al (2003), US
III-2 Cohort Low Medium Low
Norberg et al (2006),
Sweden
III-2 Cohort Medium Medium High
Schmidt et al(2005), US
III-2 Cohort Medium Medium High
*Prognosis Studies

Type 2 Diabetes Guideline 44 Primary Prevention, December 2009
Section 3: Population strategies to reduce lifestyle risk factors
Question
What population strategies have been shown to be effective in reducing lifestyle risk
factors for type 2 diabetes?
Recommendations
Social marketing should be considered as part of a comprehensive approach to reduce risk
factors for type 2 diabetes at the population level (Grade C ).
Community-based interventions should be used in specific settings and target groups (eg
schools, workplace, women‟s groups) as a strategy for reducing diabetes risk factors
(Grade C).
The impact of the built environment on physical activity and food quality and availability
should be considered in all aspects of urban planning and design (Grade D).
Practice Point
To be effective, a community-based intervention should:
- have a strong theoretical base
- be designed to send a few clear messages
- use multiple strategies to communicate these messages
- encourage family involvement
- be intensive and sustained over a long period of time.

Type 2 Diabetes Guideline 45 Primary Prevention, December 2009
Evidence Statements
Sustained, well-executed social marketing can be effective in increasing physical
activity, improving nutrition knowledge, attitudes and eating behaviour in a range of
target groups, in different settings.
Evidence Level III
Mass media campaigns increase awareness, and improve knowledge and attitudes
around physical activity and healthy eating and may have a short term effect on
physical activity behaviour in some individuals.
Evidence Level III
Media-only approaches may be sufficient to encourage a significant proportion of
people to alter their dietary habits and contribute to weight control at the population
level.
Evidence Level III
Mass media campaigns enhance the success of community-based interventions.
Evidence Level III
Well-designed community-based intervention programs can improve lifestyle
choices and health habits such as increase physical activity and healthy eating.
Evidence Level III
Worksite interventions which involve family members can improve dietary habits.
Evidence Level III
Worksite health promotion programs that include environmental modifications can
influence dietary intake.
Evidence Level III
Environmental and policy interventions are effective in reducing chronic disease
risk factors including smoking, physical inactivity, and unhealthy eating.
Evidence Level III
Policy regulation such as nutrition information on processed foods has the potential
to improve food choices and promote healthy eating at a population level.
Evidence Level III

Type 2 Diabetes Guideline 46 Primary Prevention, December 2009
Background - Population strategies to reduce lifestyle risk factors A large body of evidence supports the prevention of type 2 diabetes by lifestyle modification.
Changes in lifestyle are in general twice as effective as pharmacotherapy in preventing type 2
diabetes. Hence investment of resources in preventing type 2 diabetes is essential to address
the current epidemiology and combat the burden of this condition. Colagiuri R et al (2006)
suggested that combining a high-risk approach with a population approach is likely to bring
health gain across the continuum from preventing the development of risk factors in the
general population to reducing or reversing established modifiable risks and preventing the
development of diabetes (Figure 1). The complex nature of diabetes means that many
organisations and agencies need to be engaged for its effect control.
Figure 1: Population health protection and health promotion strategies bring benefit across the diabetes
disease continuum (adapted from Colagiuri R, 2006)
A program for the prevention of type 2 diabetes in Finland 2003-2010 (Saaristo et al, 2007)
includes three concurrent strategies ie:
A population strategy aimed at promoting means of nutritional interventions and increased
physical activity, so that risk factors of diabetes such as obesity and metabolic syndrome
are reduced. This strategy comprises both society-oriented measures and measures
targeting individuals. The society-oriented measures include measures relating to sports
policy, food policy, educational policy, social development and environmental policy
A high risk strategy - individual oriented strategy targeting individuals at high risk of
developing type 2 diabetes
A strategy of early diagnosis and management.
Framework of health promotion strategy to address diabetes risk factors
The WHO provided a guide on important elements of successful policies and plans for a
population based approach to physical activity (WHO, 2007). The suggested elements
included high level political commitment, integration in national policies, identification of
national goals and objectives, funding, cultural sensitivity, multiple interventions and
implementation at different levels.
Adapting the WHO framework, the objectives of health promotion strategies to address
diabetes risk factors such as physical inactivity and unhealthy eating would be:
1. Increase community awareness of healthy lifestyle behaviours including benefits, health
risks associated with unhealthy behaviours, and how to adopt a healthy lifestyle.
Health
protection
and health
promotion
strategies
General population
People at risk
of diabetes People with
diabetes
Type 2 Diabetes Guideline 47 Primary Prevention, December 2009
Intervention that increase awareness includes but is not limited to social marketing
campaigns and mass media campaigns.
2. Increase community skills to change behaviours and adopt a healthy lifestyle through
community-based interventions in a variety of settings such as schools, worksites,
churches, community centres.
3. Develop policies and create environments that support healthy lifestyle by ensuring
that public and social policy, and the built environment are designed to encourage health
promoting behaviour on a population scale.
1. Increase community awareness
Social marketing
In recent years there has been growing interest in social marketing interventions to promote
healthy behaviour such as quitting smoking, improving diet, increasing physical activity, and
tackling the misuse of substances like alcohol and illicit drugs and sexual health (Brown,
2002; Farrelly et al, 2003; Gordon et al, 2006). Moreover, there is emerging evidence to
support the effectiveness of social marketing interventions in changing behaviour in a range
of target groups in different settings (Grier & Bryant, 2005; Gordon et al, 2006).
Social marketing provides a promising framework for improving health both at the individual
level and at wider environmental and policy-levels. Since late 1980, health promotion
campaigns in Australia and overseas began applying social marketing practice. For example,
the Victoria Cancer Council developed its anti-tobacco campaign „Quit‟ (1988), and
„SunSmart‟ (1988) against skin cancer which had the slogan Slip! Slap! Slop! (Dixon et al,
2008) (VIChealth website) and the „VERBtm‟
campaign in the US (Wong et al, 2004).
What is social marketing?
Several definitions of social marketing exist. For the purpose of this guideline the following
definition which is most commonly used by researchers (Wong et al, 2004; Grier & Bryant,
2005; Gordon et al, 2006) has been adopted as follows:
„Social marketing is the application of commercial marketing technologies to the analysis,
planning, implementation and evaluation of programs designed to influence voluntary
behaviour‟ (Andreasen, 1995), cited by (Grier & Bryant, 2005; Gordon et al, 2006).
Theories and models of social marketing
Social marketing frameworks and the method used to derive them have considerable potential
application in health promotion and can also guide aspects of evaluation of initiatives (Grier
& Bryant, 2005). Anderson‟s six key principles for benchmarking of social marketing are:
behaviour change, consumer research, segmentation and targeting, marketing mix, exchange,
competition (Grier & Bryant, 2005).
Social marketing interventions
Gordon et al (2006) have argued that social marketing interventions can work upstream by
changing the behaviour of organisations, professionals, retailers, or policy makers as well as
with individuals. However, due to difficulties in measuring policy and environmental change,
meaningful measurable outcome data was not reported (Gordon et al, 2006).
Type 2 Diabetes Guideline 48 Primary Prevention, December 2009
Mass media campaigns
Mass media campaigns to promote healthy behaviours and discourage unhealthy ones have
become major tools to improve the public health (Randolph & Viswanath, 2004). There is
evidence that comprehensive tobacco control programs which include mass media campaigns
can be effective in changing behaviour in adults (Bala et al, 2008). Similarly, campaigns to
promote physical activity and healthy eating show evidence in increasing awareness and
changing attitude and beliefs (Bauman et al, 2001; Bauman et al, 2003). The evidence of
mass media effectiveness in sustainable behaviour change is not conclusive (Bauman et al,
2001; Bauman et al, 2003).
Many types of media are used for social marketing purposes including broadcast, print,
electronic media and the internet (Marcus et al, 1998).
Public education
Earlier public education programs demonstrated change in behaviour. For example change in
smoking rates, use of seat belts and child safety seats, cancer screening rates, and incidence of
sudden infant death syndrome. However, public education tends to work slowly and may take
decades to achieve change in behaviour.
2. Increase community skills to change behaviour and adopt a healthy lifestyle.
Community-based interventions
Community context has been identified as an important determinant of health outcomes.
Community has been defined as a group of people with diverse characteristics who are linked
by social ties, share common perspectives, and engage in joint action in geographical
locations or settings (MacQueen et al, 2001).
Worksites have been a popular and useful setting for a wide range of chronic disease
prevention programs. Their appeal includes reaching a large number of people at a relatively
low cost, the social structure of workplaces can be used to provide support and positive
reinforcement for appropriate change such as eating and physical activity behaviour,
environmental changes can be achieved at worksites eg food services, workplace layout,
building design and physical activity facilities, and health promotion activities may have
economic appeal to employers who also stand to benefit from increased productivity through
improved employer health, less illness and absenteeism and reduced disability cost (Gill et al,
2005).
3. Develop policies and create environments that support healthy lifestyle
Growing attention is focussing on how environmental and policy interventions can affect
chronic disease burden (Engbers et al, 2005; Gebel et al, 2005; Brownson et al, 2006).
Although, due to the dynamics of every day life, the diffuse nature and multiplicity of
variables involved, this is a difficult area in which to attribute cause and effect, there has been
an acceleration of interest and experimentation in this area in recent years. As a result there is
an emerging body of promising models for mitigating the negative effect of the food and
physical activity environment on health and, notably on diabetes and other chronic diseases
risks such inappropriate and over nutrition, and physical inactivity.
Creating supportive environments that help people to make healthy choices is an important
underlying principle of health promotion. Effective strategies strengthen the skills and

Type 2 Diabetes Guideline 49 Primary Prevention, December 2009
capabilities of people to take action to improve their health. The provision of nutritional
information at point-of-purchase (for example, with on pack nutrition labelling) can raise the
awareness of consumers about the composition of foods they habitually consume and aid
them in making a healthy choice. The content and format of nutrition labelling on foods has
primarily been the result of a legislative requirement to provide information per se, and it is
not specifically designed to promote healthier food choices. Several studies demonstrate the
difficulty consumers face in understanding and using nutrition labelling in its current standard
format. Consumers and public health groups and some governments have called for labelling
that is comprehensive, clearer and easier to use. (Cowburn, 2003).

Type 2 Diabetes Guideline 50 Primary Prevention, December 2009
Evidence- Population strategies to change behaviours
1. Social marketing, and mass media interventions
Sustained, well-executed social marketing can be effective in increasing
physical activity, improving nutrition knowledge, attitudes and eating
behaviour in a range of target groups, in different settings. (Evidence Level
III)
Mass media campaigns increase awareness, and improve knowledge and
attitudes around physical activity and healthy eating and may have a short
term effect on physical activity behaviour in some individuals. (Evidence
Level III)
Media-only approaches may be sufficient to encourage a significant
proportion of people to alter their dietary habits and contribute to weight
control at the population level. (Evidence Level III)
Mass media campaigns enhance the success of community-based
interventions. (Evidence Level III)
Social marketing, including mass media interventions, to promote physical activity
Mass media campaigns can raise awareness for community change. Two systematic reviews
have examined the impact of national media campaigns in promoting physical activity
(Cavill, 1998; Cavill & Bauman, 2004). The first discusses included three studies which
helped to change attitudes and levels of knowledge towards physical activity, but had limited
short-term impact on participation in physical activity (Cavill, 1998). The second, more
comprehensive review (Cavill & Bauman, 2004) searched Medline, Current Contents,
CINAHL, PsychLit, Eric and Sports Discus for studies written in English since 1970. Fifteen
campaigns were identified targeting whole populations or defined sub-groups. These were
based on diverse mass media strategies, including paid TV commercials, public service
announcements, radio and newspaper advertising plus many unpaid media publicity
techniques. As these campaigns were each linked to other community activities it proved
difficult to separate out the effect of the media component. Nevertheless these campaigns
appeared to achieve a high level of recall, with a median of 70% of the target group aware of
the campaign. Increased knowledge or attitudes to physical activity were found among half
the campaigns reporting this measure. Few campaigns however, reported other related
variables, such as saliency, beliefs, self-efficacy or behavioural intention. Although increased
physical activity was reported among motivated sub-groups, few campaigns reported
increased physical activity across a population. It was concluded that while campaigns
increase awareness of the issue of physical activity, they may not have a population-level
effect on behaviour. It was suggested that campaigns should focus more on social norms, to
bring about long-term behaviour change as part of a broader strategy that included policy and
environmental change (Cavill & Bauman, 2004).
As part of a National Social Marketing Strategy (NSMS) for health improvement in the UK,
a series of literature reviews investigated the effectiveness of social marketing (Gordon et al,

Type 2 Diabetes Guideline 51 Primary Prevention, December 2009
2006). Three reviews were evaluated. All used pre-defined search and inclusion criteria and
defined social marketing interventions by six key principles. This evaluation indicated that
social marketing interventions can be effective in improving diet, increasing physical activity,
and tackling substance abuse. Moreover, it can work with a range of target groups, in different
settings.
Social marketing may improve physical activity behaviour (Gordon et al, 2006). This review
identified 22 social marketing studies focussing on improving physical activity (14
community-based, 6 school based, one using the media, and one implemented in a workplace
setting). Eight of the 21 that sought to change behavioural outcomes, had positive effects
overall. Seven studies reported mixed results and six had no effect. Of the effective studies,
one workplace intervention reported that participants became significantly more likely to
participate in moderate physical activity and less likely to undertake mild physical activity.
The Wheeling Walks intervention, a community-based campaign to promote walking
amongst sedentary 50-65 year olds reported an improvement in physical activity levels.
Fourteen studies were identified that reported physiological outcomes including BMI, CVD
rates, cholesterol levels and blood pressure. One of these, an American study directed
towards low income earners, reported lower CVD rates in the intervention group than the
control group.
Kahn et al (2002) used the Guide to Community Preventive Service's methods to evaluate the
effectiveness of various approaches to increasing physical activity. Approaches included
mass media campaigns addressing messages about physical activity to large audiences via
newspapers, radio, television and/or billboards. Effectiveness measures were: change in the
percentage of people doing a specified physical activity; change in energy expenditure; or
change in the percentage of the population categorized as sedentary. Three relevant studies
were identified and these reported only a modest trend toward increasing physical activity,
although two reported significant and substantial improvements in knowledge and beliefs. It
was concluded that insufficient evidence was available to assess the effectiveness of mass
media campaigns to increase physical activity (Kahn et al, 2002).
Marcus et al. (1998) also conducted a systematic review of physical activity interventions
using mass media, print media, and information technology. Studies were located by
searching Medline, Psychlit, and Eric databases for the years 1983-1987. Twenty-eight
studies were identified (7 national mass media campaigns and 21 campaigns delivered
through health care, the workplace, or in the local community). These were based on a variety
of print, graphic, audiovisual and broadcast media. In the seven mass media studies, recall of
messages generally was high (around 70%), but the campaigns had very little impact on
behaviour. Community interventions using print and/or telephone changed behaviour in the
short term. Interventions that were well-tailored to the target audience and that provided
multiple contacts were the most effective.
Finlay and Faulkner (2005) conducted another systematic search of the literature which was
assessed from two perspectives. Studies since 1998 were reviewed for their success in
impacting message recall and behaviour change and then were assessed for a more
sophisticated understanding of the media processes of inception, transmission and reception.
This review found that mass media interventions influenced short-term recall of the physical
activity message and to a lesser extent its associated knowledge. However, most studies gave
little in-depth consideration to the design of media messages.

Type 2 Diabetes Guideline 52 Primary Prevention, December 2009
Mass media campaigns targeting physical inactivity
A number of media campaigns have been conducted in Australia. A state-based mass-media
campaign to promote regular moderate-intensity activity was undertaken in NSW in February
1998 (Bauman et al, 2001) targeting adults aged 25 to 60 years who were motivated but
insufficiently active. States other than NSW comprised the unexposed control group. The
campaign included paid and unpaid television and print-media advertising, physician mail-
outs and community-level support programs and strategies. The campaign was evaluated by
examining pre- and post campaign differences in physical activity campaign message recall,
knowledge, motivational readiness, and reported behaviour, employing both within and
between-state comparisons. Unprompted recall of the activity messages increased
substantially in NSW (2.1% to 20.9%, P<0.01), with only small changes observed elsewhere
(1.2% to 2.6%). Prompted awareness also rose significantly in NSW (12.9% to 50.7%,
P<0.0001) with only a trend elsewhere (14.1% to 16%, P=0.06). Knowledge of appropriate
moderate-intensity activity and physical activity self-efficacy also increased significantly in
the campaign state. Compared with all others, those in the target group who recalled the
media message were 2.08 times more likely to increase their activity by at least an hour per
week (95% CI:1.51-2.86).
Merom and co-workers (2005) conducted a population-based cohort study to determine
whether Australia's „Walk to Work Day‟ media campaign resulted in behavioural change.
This annual short campaign which aims to encourage walking, among working adults in
Australian cities, comprised newspaper advertisements and community service
announcements relayed nationally through radio and free-to-air television. A cohort of people
(18 to 65 years, n = 1,100, 55% response rate) were randomly sampled from metropolitan
areas before and after the campaign. A significant decrease in "car only" use and an increase
in walking with use of public transport was noted among participants. Moreover, employed
people spent significantly more time walking (+ 16 min/wk; P< 0.05) and in other moderate
physical activity (+120 min/wk; P< 0.005). There was correspondingly a significant decrease
in the proportion of workers who were "inactive" (P <0.05).
Mass media campaigns have also been conducted overseas. Increased awareness and intention
to change were reported by Bauman et al (2003) from a mass media and community wide
intervention (the „Push-Play‟ Campaign) aimed at increasing physical activity in New
Zealand. This campaign recommended 30 minutes of moderate-intensity physical activity
daily. Activities were promoted as fun, part of community life and easy to achieve for New
Zealand adults and were supported by community and primary care programs and events.
Annual cross-sectional population surveys (1999-2002) monitored the impact of the
campaign. Substantial increases were found in awareness of the „Push Play‟ message (30% in
1999 to 57% in 2002, P<0.001), and of the „Push Play‟ logo (14% to 52%, P<0.001).
Although the numbers of adults who intended to be more active increased (1.8% in 1999 to
9.4% in 2002), no sustained change in physical activity was evident, 38.6% of the 1999
sample reporting 5+ days activity per week, increasing to 44.5% in 2000, but declining to
38.0% in 2002. The only significant difference in physical activity levels occurred from 1999
to 2000 (difference 5.8%, 95% CI 0.1%-11.6%).
Beaudoin et al (2007) conducted a mass media campaign in New Orleans to promote walking
and fruit and vegetable consumption in a low-income, predominantly African-American
urban population. The campaign included high-frequency paid television and radio
advertising, as well as bus and streetcar signage tailored for African-Americans. The impact

Type 2 Diabetes Guideline 53 Primary Prevention, December 2009
was evaluated by random-digit-dial telephone surveys conducted at baseline in 2004 and
following the onset of the campaign in 2005. Survey items included campaign message recall,
and attitudes and behaviours associated with walking, snack foods and fruit and vegetable
consumption. After 5 months, there were significant increases in message recall measures,
positive attitudes toward fruit and vegetable consumption, and positive attitudes toward
walking. Behaviours however did not change significantly.
Hillsdon et al (2001) assessed „England's ACTIVE for LIFE campaign‟ by conducting a 3-
year prospective longitudinal survey. A multi-stage, cluster random probability design was
used to select a nationally representative sample of 3,189 adults aged 16-74 years. Six to eight
months after the campaign began, 38% of those sampled were aware of the main advertising
images used by „ACTIVE for LIFE‟. The proportion knowledgeable about moderate physical
activity recommendations increased by 3.7% (95% CI 2.1%, 5.3%) between years 1 and 3.
The change in proportion of active people however between baseline and years 1 and 2 was -
0.02 (95% CI -2.0 to +1.7) and between years 1 and 3 was -9.8 (-7.9 to -11.7). There was no
evidence that ACTIVE for LIFE improved physical activity, overall or in any subgroup.
Miles et al. (2001) evaluated a large UK health education mass media campaign 'Fighting
Fat, Fighting Fit' (FFFF) targeted at groups with high prevalence of obesity. A postal
questionnaire survey was sent to a random sample of 6,000 adults registered with FFFF at the
start of the campaign and again 5 months later. Sixty-one percent of those sampled completed
the baseline questionnaire while 58% completed the follow-up 5 months later. Overall, 74%
of respondents reported that their activity levels had increased. An additional 94
min per week
was now spent being active (P < 0.001). The proportion classified as sedentary declined from
34 to 25%, (P < 0.001) while the proportion engaged in regular moderate
exercise increased
from 29 to 45%, (P < 0.001) and those doing vigorous exercise increased from 3 to 6% (P <
0.001). Overall 19% shifted from inactive to active with similar changes seen in men and
women. Mean body weight was also 2.3 kg lower than before the campaign (P < 0.001) with
44% reporting that they had lost weight. The proportion of `obese' people declined by 6%
(P
< 0.001), although 52% overall remained within this category. At the same time, satisfaction
with body weight also improved ( P < 0.001) and a significant reduction was reported in fat
and snack consumption, together with an increased fruit, vegetable and starch intake.
Promotion of walking as a form of physical activity holds considerable potential, both in
terms of health benefits and its wide appeal to inactive groups. Wimbush et al. (1998)
evaluated a national Scottish mass media walking campaign targeted at people aged 30-55
who did not regularly exercise. They were reached through a television advertisement and a
telephone helpline. Campaign impact was assessed by population surveys and surveys of the
helpline callers at baseline and follow-up. These evaluated change in awareness, change in
knowledge and beliefs about walking, motivational change and change in intentions regarding
walking/exercise as well as in actual walking/exercise behaviour. Awareness of the television
advertisement peaked at 70% during the first 4-week burst, falling to 54% during the non-
broadcast period. At a population level, the campaign had a notable positive impact on
knowledge about walking as a form of exercise but no impact on actual walking behaviour.
The proportion of adults aware of the telephone helpline rose from 5% at the start of the
campaign to 16% four months later, although only 5% of respondents then used the helpline
service. Of those who called the helpline, however, 48% claimed to be more physically active
when contacted one year later (Wimbush et al, 1998).
Sogaard and Fonnebo (1992) evaluated a short fund-raising campaign, launched in 1987 by a
charity organisation in cooperation with the sole Norwegian national TV-channel. The

Type 2 Diabetes Guideline 54 Primary Prevention, December 2009
campaign which involved a large proportion of the Norwegian population, concluded with a
six hour TV-show. Twenty-two per cent of the population reported changes in one or more
health-related habits (one third took more exercise, while one quarter reduced/quit smoking).
New knowledge about health issues and health concern created by the campaign, were the
factors most clearly associated with self-reported behaviour change.
An interesting community based campaign targeting physical inactivity in the US was
assessed by Renger et al (2002). The goal of this study was to develop, implement, and
evaluate a community-based effort using Prochaska's Transtheoretical Model as a guide.
Community members developed television and worksite media messages focusing on the
benefits and barriers of physical activity and on increased self-efficacy. The campaign proved
effective not only in changing perceptions on the barriers and benefits of exercise and in
raising self-efficacy but also in changing behaviour. The success of the campaign was
considered to relate to its unique local nature. Seeing local community members participate in
physical activity may motivate people to comply with the media messages.

Type 2 Diabetes Guideline 55 Primary Prevention, December 2009
Table 5: Summary of study characteristics for social marketing/mass media and physical activity
Author, year, country,
Campaign name
Study Type Mass media
approach
Evaluation Outcome measure/s Results
Bauman, (2001), NSW,
Australia
Quasi
experimenta
l design &
Cohort
study
Paid and unpaid
television and print-
media advertising
Cross-sectional
representative
population surveys,
before and after the
campaign
Physical activity; media
message awareness;
physical activity
knowledge; self-efficacy &
intention
Message recall increased;
Knowledge and physical
activity self-efficacy
increased.
Bauman et al (2003), New
Zealand, „Push-Play‟
Before-and-
after study
Television
commercials
Cross-sectional
surveys
Increase physical activity at
a population level
Substantial increases were
found in awareness of the
message; Although the
number of adults who
intended to be more
physically active increased, no
sustained increase in physical
activity was evident.
Beaudoin et al. (2007), New
Orleans, US
Before-and-
after study
High frequency paid
television & radio
advertising, as well as
bus and streetcar
signage
Random-digit-dial
telephone surveys
Message recall; attitudes
and behaviours associated
with walking
Significant increase in
message recall; positive
attitudes towards walking.
Cavill, (2004) Systematic
review
Paid TV commercials;
public service
announcements; radio
& newspaper
advertising; plus many
unpaid media publicity
15 campaigns Campaign awareness;
knowledge and attitude to
physical activity; increased
physical activity
Increased knowledge to
physical activity; It was
therefore concluded that while
campaigns increase awareness
of the issue of physical
activity, they may not have a
population-level effect on
behaviour.
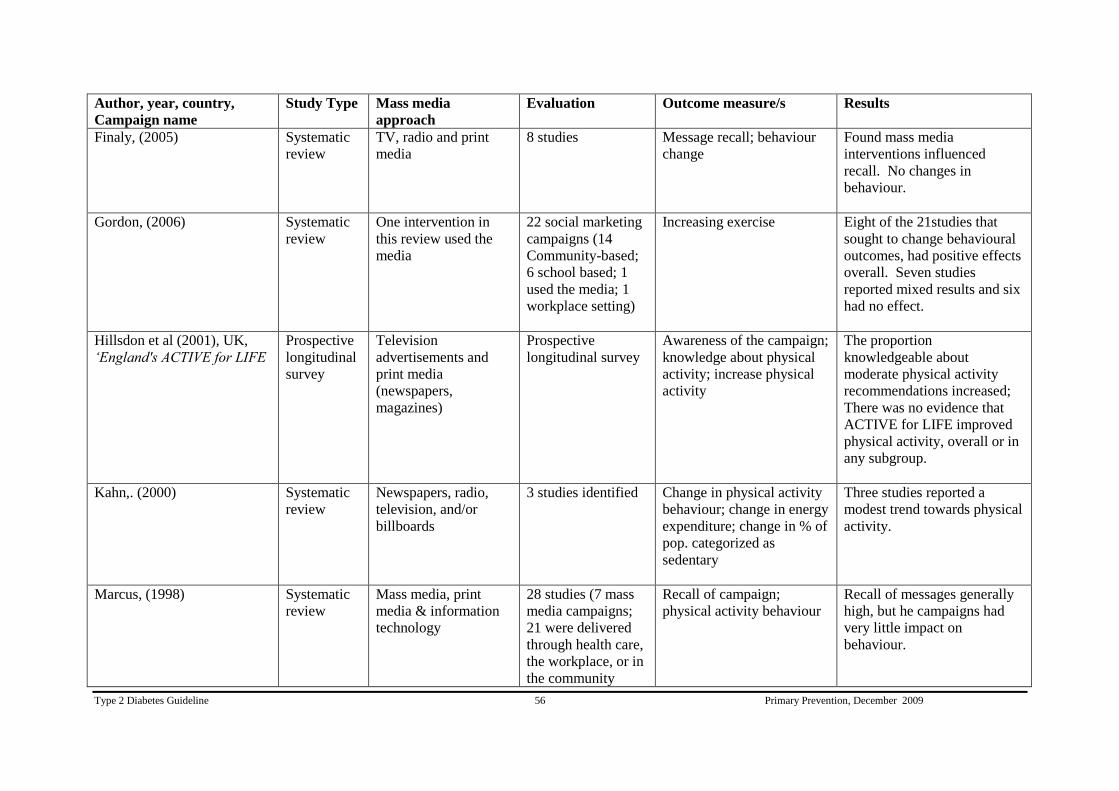
Type 2 Diabetes Guideline 56 Primary Prevention, December 2009
Author, year, country,
Campaign name
Study Type Mass media
approach
Evaluation Outcome measure/s Results
Finaly, (2005)
Systematic
review
TV, radio and print
media
8 studies Message recall; behaviour
change
Found mass media
interventions influenced
recall. No changes in
behaviour.
Gordon, (2006) Systematic
review
One intervention in
this review used the
media
22 social marketing
campaigns (14
Community-based;
6 school based; 1
used the media; 1
workplace setting)
Increasing exercise Eight of the 21studies that
sought to change behavioural
outcomes, had positive effects
overall. Seven studies
reported mixed results and six
had no effect.
Hillsdon et al (2001), UK,
„England's ACTIVE for LIFE
Prospective
longitudinal
survey
Television
advertisements and
print media
(newspapers,
magazines)
Prospective
longitudinal survey
Awareness of the campaign;
knowledge about physical
activity; increase physical
activity
The proportion
knowledgeable about
moderate physical activity
recommendations increased;
There was no evidence that
ACTIVE for LIFE improved
physical activity, overall or in
any subgroup.
Kahn,. (2000)
Systematic
review
Newspapers, radio,
television, and/or
billboards
3 studies identified Change in physical activity
behaviour; change in energy
expenditure; change in % of
pop. categorized as
sedentary
Three studies reported a
modest trend towards physical
activity.
Marcus, (1998) Systematic
review
Mass media, print
media & information
technology
28 studies (7 mass
media campaigns;
21 were delivered
through health care,
the workplace, or in
the community
Recall of campaign;
physical activity behaviour
Recall of messages generally
high, but he campaigns had
very little impact on
behaviour.

Type 2 Diabetes Guideline 57 Primary Prevention, December 2009
Author, year, country,
Campaign name
Study Type Mass media
approach
Evaluation Outcome measure/s Results
Merom, (2005), Australia,
„Walk to Work Day‟
Cohort
study
Newspaper
advertisements &
community service
announcements
relayed nationally
through radio and TV
cohort study to
evaluate mass media
campaign
Behaviour change A significant decrease in “car
only” use and an increase in
walking with use of public
transport was noted among
participants.
Miles et al. (2001), UK,
„Fighting Fat Fighting Fit‟
(FFFF)
Before-and-
after study
Television and radio
campaign
Postal questionnaire
survey
Increase activity levels The proportion classified as
sedentary declined from 34 to
25%; while the proportion
engaged in regular moderate
exercise increased from 29 to
45%.
Overall 19% shifted from
inactive to active with similar
changes seen in men and
women.
Renger et al (2002), US Before-and-
after study
Community members
developed television &
worksite media
messages
Random Telephone
interview and
written survey
Changes in knowledge,
beliefs, and attitudes about
physical activity and
lifestyle changes
The campaign proved to be
effective not only changing
perceptions of the barriers of
physical activity and on
increased self-efficacy.
Sogaard and Fonnebo (1992),
Norway
Before-and-
after study
National
television/radio
campaign
Random sample
questionnaire
Changes in health related
behaviours
Twenty-two percent of the
population reported changes
in one or more health-related
behaviours (one third took
more exercise).

Type 2 Diabetes Guideline 58 Primary Prevention, December 2009
Author, year, country,
Campaign name
Study Type Mass media
approach
Evaluation Outcome measure/s Results
Wimbush et al. (1998),
Scotland
Pre-
test/post-test
Television
advertisement
Population surveys Changes in awareness,
change in knowledge about
walking , motivational
change and change in
intentions regarding
walking/exercise as well as
in actual walking/exercise
behaviour
At a population level, the
campaign had a notable
positive impact on knowledge
about walking as a form of
exercise but no impact on
actual walking behaviour.
Of those who called the
helpline, 48% claimed to be
more physically active when
contacted one year later.

Type 2 Diabetes Guideline 59 Primary Prevention, December 2009
Social marketing, including mass media interventions, to promote healthy eating and nutrition
Mass media campaigns in Australia and elsewhere have been conducted to promote healthy
eating and nutrition. Many of these campaigns have focused on promoting the consumption of
more fruits and vegetables (Foerster et al, 1995; Dixon et al, 1998; Ashfield-Watt, 2006; Pollard
et al, 2008). One multi-strategy fruit and vegetable social marketing campaign was conducted
from 2002 to 2005 in Western Australia (Pollard et al, 2008). This included mass media
advertising (television, radio, press and point-of-sale), public relations events, publications, and a
website (www.gofor2and5), plus school and community activities. The aim was to increase
awareness among adults of the need to eat more fruit and vegetables and over a five-year period
to increase consumption by one serving per day. The impact was evaluated through two
independent telephone surveys. One conducted with 5,032 adults monitored attitudes towards
fruit and vegetables, and beliefs and consumption prior to, during and 12 months after the
campaign. The second surveyed 17,993 adults between 2001 and 2006 to continuously monitor
consumption. Over three years, the mean number of servings of fruit and vegetables consumed
per day rose by 0.8 (+0.2 serves per day for fruit and +0.6 serves per day for vegetables, P<0.05).
A similar campaign has been evaluated in Victoria (Dixon et al, 1998). The 2 Fruit „n‟ 5 Veg
Every Day campaign ran from 1992-1995 based around television advertising. It was evaluated
by annual surveys examining public awareness, beliefs about desirable eating habits for fruit and
vegetables, and reported consumption. Over the years, patterns of public awareness, reported
consumption, and beliefs about appropriate levels of consumption tended to parallel changes in
the level of mass media advertising. During the most intense period of promotion, significant
increases in all these variables occurred. These findings are consistent with those of (Pollard et
al, 2008) who concluded that mass media campaigns are effective but need to be sustained to
achieve the desired behaviour changes
The 5+ a day, a social marketing campaign in New Zealand aimed at increasing fruit and
vegetable intake has been evaluated based on responses to two questionnaires (Ashfield-Watt,
2006). One focused on awareness and understanding of the 5+ a day campaign while the other
focused on attitudes to health and on consumption of fruit and vegetables. It was found that 71%
of respondents identified the „5 servings a day‟ message with the 5+ a day logo regardless of
whether they had seen the logo before. It was also found that the association of positive
relationships between fruit and vegetables and health as well as daily fruit and vegetable intake
were significantly influenced by gender, ethnicity, education and occupation (all P≤0.05).
A similar campaign has been conducted in California (Foerster et al, 1995). The 5 a Day – for
Better Health! campaign promoted a message to eat five servings of fruit and vegetables every
day as part of a low-fat diet. Outcome evaluation included measured change in reported daily
fruit and vegetable consumption and in awareness, knowledge, and belief variables among the
target population. Fruit and vegetable consumption was increased by this campaign.
The Stanford Five-City Study was a six-year mass media and community cardiovascular risk
reduction intervention evaluated by comparing two treatment cities (n = 122,800) with two
control cities (n = 197,500). Measures included change in knowledge of cardiovascular risk
factors and change in mean blood pressure, plasma cholesterol, smoking rate, BMI and resting
pulse rate after 5.3 years (Taylor et al). People in the treatment communities were found to have

Type 2 Diabetes Guideline 60 Primary Prevention, December 2009
gained significantly less weight than subjects in the control communities over 6 years (0.57 kg
versus 1.25kg, P< 0.05).
Mass-media campaigns have also been used in the US to reduce the intake of foods high in
saturated fat, including campaigns aimed at getting consumers to switch from whole milk to low-
fat milk. A mass media campaign run in West Virginia and known as 1% or Less has been
evaluated (Reger et al, 1999). This campaign used paid advertising and public relations to
encourage people in a given city to switch from whole milk or 2% fat milk (high-fat milk) to 1%
fat or fat-free milk (low-fat milk). Effectiveness was assessed by change in supermarket milk
sales and pre- and post- telephone surveys conducted in the intervention and a comparison city.
In the targeted city, sale of low-fat milk increased from an initial 29% of total milk sales to 46%
of milk sales in the month following the campaign, an increase maintained after 6-months. As
reported from telephone surveys, 34% of high-fat-milk drinkers exposed to the campaign
switched to low-fat milk compared with 3.6% in the comparison city (P < 0.0001). A subsequent
survey (Reger et al, 2000) examined the effectiveness of the educational approaches used in this
campaign. After community-based educational programs and public relations activities the 20%
of high-fat milk drinkers reported switching to low-fat milk compared with 7% for the
comparison city (P<0.0001). This approach was therefore more effective than the advertising-
only campaign, which resulted in 13% of high-fat milk drinkers switching to drinking low-fat
milk (P<0.01).
The 1% or Less campaign was also trialled in the multi-ethnic population of the state of Hawaii
as a 6-week intervention (Maddock et al, 2007). Campaign effectiveness was measured with sales
data and cross-sectional telephone surveys. The proportion of people drinking low-fat milk rose
after the campaign from 30% to 41% (P<.001), the response remaining although diminished at 3-
months. This translates to approximately 65,000 people switching to low-fat milk during the
campaign with approximately 32,000 people still making this choice three months later.
Mass-media campaigns have also been used to combat obesity, for example the British Fighting
Fat, Fighting Fit (FFFF)” campaign. This campaign created high awareness in all socio-
economic groups, although memory for the healthy lifestyle message was poor in those with little
education and/or from ethnic minority groups (Wardle et al, 2001). Awareness was also no
higher in overweight than normal weight respondents (Wardle et al, 2001). The campaign was
evaluated by a before and after study of 6,000 adults registered with FFFF (Miles et al, 2001).
The majority of these were „overweight‟ or obese‟ women. These respondents reported
significant weight reduction, decreased fat and snack intake, and significant increase in physical
activity, and in fruit, vegetable and starch intake during the six months of the campaign.
A 3-year media campaign aimed at preventing weight gain among Dutch adults was evaluated
with 11 population-based surveys (Wammes et al, 2007). Campaign awareness increased from
61% after the first campaign wave to 88% after the final messages were given. Message recall
ranged from 42% to 68% and small positive differences was found in attitudes, perceived social
support, and intention to prevent weight gain.
The New Zealand Health Sponsorship Council has recently prepared a systematic review on
nutrition-related social marketing. This focuses on factors identified by the World Health
Organization (WHO) as causally related to obesity including a high intake of energy-dense,

Type 2 Diabetes Guideline 61 Primary Prevention, December 2009
micronutrient-poor foods, a high intake of sugar-sweetened soft drinks and fruit juices and high
levels of television viewing. In selecting interventions for inclusion, three of the six categories
given in Andreasen‟s criteria of social marketing were required to be present. In total, 83 social
marketing papers were selected from 238 initially identified. Studies aimed at children were
included. Evidence for the effectiveness of nutrition-related social marketing appeared moderate
for energy-dense, micronutrient-poor foods while evidence was limited or weak for sugar-
sweetened beverages and television viewing although very few papers addressed these last two
issues. It was found that effective nutrition-related social marketing can occur with nearly any
target group (whole population, ethnic groups, children, low income) and in nearly any setting
(schools, home, workplaces, churches, and the wider community) (Thornley et al, 2007).
A number of process factors were identified as important for effective social marketing of
nutrition messages. Simple messages are required, well-tailored to the target group, culturally
appropriate, and widely acceptable to stakeholders and service providers. Communication needs a
comprehensive approach with multiple intervention strategies and communication channels.
Interventions must be of sustained duration. They should be supported by strong partnerships
between government, industry, non-government organisations (NGOs), and communities.
Moreover, local programs need to be coordinated with, and supported by national approaches
although they also need to be culturally specific and to promote community control, participation
and leadership. Successful programs require continual monitoring and evaluation. They should
focus on foods rather than nutrients. Environmental barriers also need to be identified such as
the patterns of marketing unhealthy foods (Thornley et al, 2007).

Type 2 Diabetes Guideline 62 Primary Prevention, December 2009
Table 6: Summary of study characteristics for social marketing / mass media and nutrition
Author, year,
Country
Study Type Risk factors Intervention Control Duration Outcome measure Results
Ashfield-Watt et
al (2006), New
Zealand
Before-and-after
study
Reduce chronic
diseases
Media
campaign
None 5 yrs Media message
awareness; intake of
fruit & vegetables
Increased awareness of
5+day message;
increased consumption
of fruit & vegetables.
Dixon et al
(1998), Victoria,
Australia
Time-series
analysis,
longitudinal
study
Reduce chronic
disease such as
cardiovascular
disease, type 2
diabetes, and certain
forms of cancer.
Mass media
campaign
None 3 yrs Awareness of the
campaign; beliefs
about desirable eating
habits (Fruit &
vegetables); and
consumption of these
foods
Significant increases in
public awareness;
reported consumption; &
beliefs about appropriate
levels of consumption.
Foerster et al
(1995),
Californian
Population
Before and
After study
Chronic diseases such
as cardiovascular
disease & some
cancers due to high-
fat low-fibre diet. As
well as hypertension,
obesity & diabetes.
Mass media
campaign
None 3 yrs Changes in reported
daily fruit & vegetable
consumption; changes
in awareness,
knowledge and belief
variables among the
population
Maddok et al
(2007),
Hawaii , US
Before and
After study
High saturated fat
diets linked to high
blood cholesterol,
obesity, heart disease.
Multi
component
campaign –
paid radio &
TV
advertising, a
press
conference,
taste tests, web
site etc
None 6 weeks Reduction in saturated
fat intake through
increased consumption
of low-fat milk
Significant increase in
low-fat milk
consumption from
30.2% to 40.8% of milk
drinkers. Sales data
shows an increase in low
fat milk sales from
32.7% to 39.9%.

Type 2 Diabetes Guideline 63 Primary Prevention, December 2009
Author, year,
Country
Study Type Risk factors Intervention Control Duration Outcome measure Results
Miles et al (2001),
UK
Before and
After study
Obesity Mass-media
campaign
None 7 weeks
Weight, eating
behaviour and activity
patterns were assessed.
Participants reported
significant reductions in
weight, and in fat and
snack intake, and
significant increases in
exercise levels, and in
fruit & vegetable intake
during the 6mth of the
campaign.
Pollard et al
(2008), Western
Australia
Before and
After study
Reduce chronic
diseases –
cardiovascular
disease, some cancers
Multi-strategy
social
marketing
campaign
None 3 yrs Awareness of the
recommended servings
of fruit & vegetables;
increase in the servings
of fruit & vegetables
per day
Increased awareness of
the recommended
servings of fruit &
vegetables; Population
net increase in the mean
number of servings of
fruit & vegetables per
day over the 3 yrs.
Reger et al (1999),
West Virgina, US
Quasi-
experimental
research design
– one
intervention city
& one
comparison city
High saturated fat
diets linked to high
blood cholesterol,
obesity, heart disease.
Mass media
campaign –
paid
advertising
and public
relations
Yes,
Comparison
city
6 weeks Reduction in saturated
fat intake through
increased consumption
of low-fat milk
In the intervention city,
low fat milk sales
increased from 29% of
overall milk sales before
the campaign to 46% of
sales in the month
following the campaign.
The increase was
maintained at the 6mth
follow up. 34.1% of
high-fat-milk drinkers
reported switching to
low-fat milk in the
intervention community

Type 2 Diabetes Guideline 64 Primary Prevention, December 2009
Author, year,
Country
Study Type Risk factors Intervention Control Duration Outcome measure Results
compared with 3.6% in
the comparison
community.
Reger et al (2000),
West Virginia ,
US
Comparative
study
High saturated fat
diets linked to high
blood cholesterol,
obesity, heart disease
One
intervention
used public
relations and
community-
based
educational
activities &
the other used
paid
advertising
A
comparison
city
6-8 weeks Reduction in saturated
fat intake through
increased consumption
of low-fat milk
After the community
based education
intervention the
proportion of high-fat
milk drinkers who
reported drinking low-fat
milk was 19.6%
compared with 6.8% for
the comparison city
(p<0.0001). After the
advertising-only
campaign, 12.8% of
high-fat milk drinkers
reported drinking low-fat
milk (p<0.01).
Taylor et al
(1991), Stanford,
US
Quasi-
experimental
design. Both
cohort and
cross-sectional
(independent)
samples were
used in the
study
Reduction of
cardiovascular risk
factors – including
overweight
Mass media
campaign &
community
health
education
Two control
cities
6 years Reduction in weight Subjects in treatment
communities gained
significantly less weight
than subjects in control
communities (0.57kg
compared with 1.25kg)
over 6 yrs.
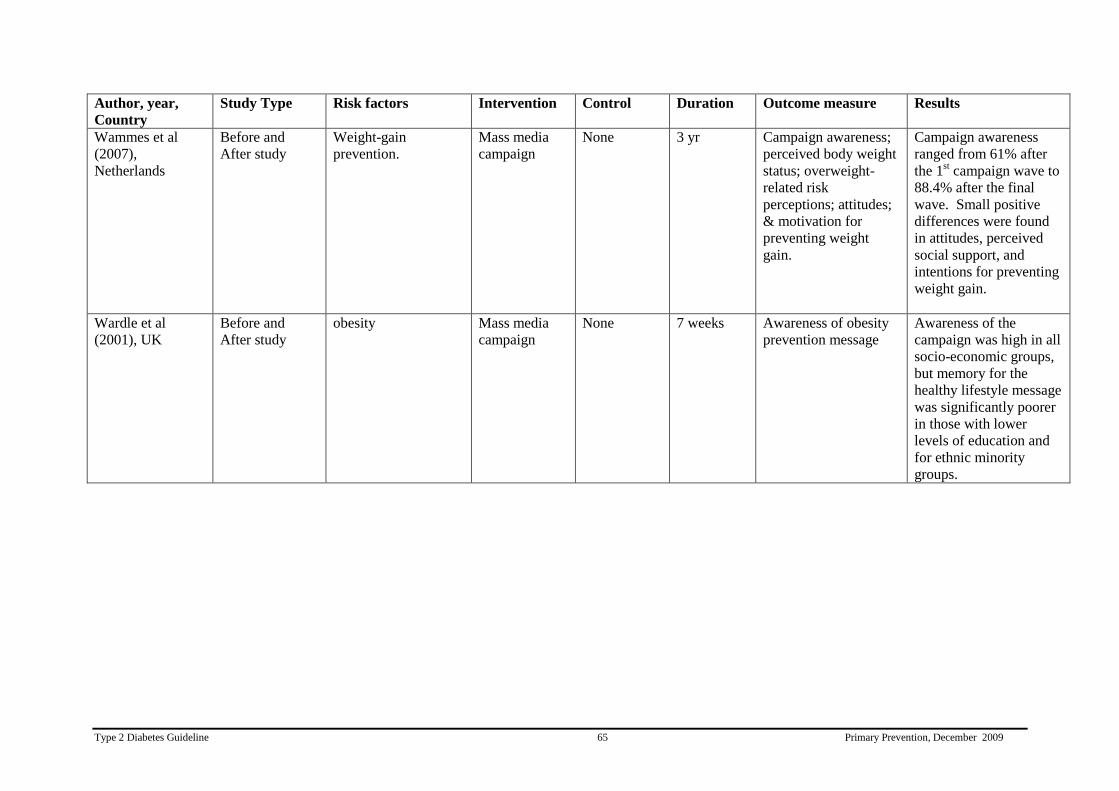
Type 2 Diabetes Guideline 65 Primary Prevention, December 2009
Author, year,
Country
Study Type Risk factors Intervention Control Duration Outcome measure Results
Wammes et al
(2007),
Netherlands
Before and
After study
Weight-gain
prevention.
Mass media
campaign
None 3 yr Campaign awareness;
perceived body weight
status; overweight-
related risk
perceptions; attitudes;
& motivation for
preventing weight
gain.
Campaign awareness
ranged from 61% after
the 1st campaign wave to
88.4% after the final
wave. Small positive
differences were found
in attitudes, perceived
social support, and
intentions for preventing
weight gain.
Wardle et al
(2001), UK
Before and
After study
obesity Mass media
campaign
None 7 weeks Awareness of obesity
prevention message
Awareness of the
campaign was high in all
socio-economic groups,
but memory for the
healthy lifestyle message
was significantly poorer
in those with lower
levels of education and
for ethnic minority
groups.

Type 2 Diabetes Guideline 66 Primary Prevention, December 2009
2. Community-based interventions for behaviour change
Well-designed community-based intervention programs can improve lifestyle
choices and health habits such as increase physical activity and healthy
eating. (Evidence Level. III)
Worksite interventions which involve family members can improve dietary
habits Worksite interventions which involve family members can improve
dietary habits. (Evidence Level III)
Worksite health promotion programs that include environmental
modifications can influence dietary intake . (Evidence Level III)
Community-based intervention to reduce physical inactivity
Satterfield et al undertook a literature review (1990-2001) of community-based interventions
intended to prevent or delay type 2 diabetes (Satterfield et al, 2003). The search revealed 16
published interventions, eight conducted in the US. Among studies in adults, most reported
improvements in knowledge or adoption of regular physical activity. Several investigators
offered reflections about the process of engaging communities and the effectiveness of
participatory research, while others gave insights about the expectations and limitations of
community-based diabetes prevention research. Many studies reported limitations in design,
including lack of control or comparison groups, low response rates or poor information on
non-responders and use of quite brief intervention periods. More research was called for.
Ogilvie et al (2007) conducted a comprehensive systematic review to assess the effects of
interventions promoting walking among individuals and populations. Relevant reports in any
language were identified by searching 25 electronic databases, as well as
websites, reference
lists, existing systematic reviews, and by contacting experts. Papers selected included all
controlled before/after studies intending
to change how much people walk, papers comparing
effects between social groups and/or effects on physical activity, fitness, risk factors for
disease, and on health and wellbeing.
Forty-eight studies
(19 randomised controlled trials and
29 other studies) were included, of which 27 were concerned with walking in general and 21
studies were concerned with walking as a mode of transport. It was concluded that
interventions tailored to people's needs, and targeted at the most sedentary or at those most
motivated to change, can encourage people to walk more. It was found that successful
interventions can be delivered at an individual level through brief advice, pedometer use, or
telephone support or at households (individualised marketing) or via groups although the
sustainability, generalisability, and clinical benefit of many of these approaches
remained
ill-
defined. Evidence for the effectiveness of interventions applied to workplaces, schools,
communities, or local government areas often depended on isolated studies or subgroup
analyses. Five non-randomised studies
of interventions were found that measured
effects in
whole populations. All of these involved combined approaches eg: mass media campaigns
augmented by community events and other local supportive measures (modest
environmental
improvements, formation of walking groups, and written materials or brief advice given to
individuals). An intervention with a substantial
mass media component proved most effective
(Ogilvie et al, 2007). Walking in a successful intervention was seen to increase by up to 30-60
minutes a week on average, at least in the short term. Although much of the research

Type 2 Diabetes Guideline 67 Primary Prevention, December 2009
provided evidence of efficacy rather than effectiveness, this survey concluded that
interventions to promote walking could contribute substantially
towards increasing the
activity levels for the most sedentary people.
Fogelholm et al (2002) reviewed community interventions for prevention of cardiovascular
disease. A Medline search and reference lists of two comprehensive systematic reviews was
used to identify studies published during or after 1990. Only five interventions were
identified, each with a duration of 4-7 years. All promoted dietary change, increased physical
activity and measured obesity prevalence. Two of four studies found no significant
intervention effects on physical activity. The residents of the intervention communities of the
Minnesota Heart Health Study became somewhat more physically active while the Stanford
Five-City Study also had a positive effect on physical activity. Most studies found
interventions had no effect on BMI although in the Stanford Five-City Study, BMI increased
less in the treatment than in control communities.
Hillsdon et al (1996). carried out a systematic review of 11 randomised controlled trials
promoting physical activity in apparently healthy American adults. Studies were identified by
searches of Medline, Excerpta Medica, Sport, and SCI Search from 1966-1996. Interventions
ranged from 5 weeks to two years and included walking, jogging or swimming for at least 30
minutes three times per week. Those that resulted in increased activity involved exercise that
was home based, of moderate intensity, involved walking, and had regular follow up.
Walking from home was more successful than exercise which relied on attendance at
structured exercise sessions. Only two facility-based trials compared with six home-based
trials reported increased exercise by participants. All trials prescribing walking reported
increased activity. Moderate intensity activity was also associated with higher compliance
rates. Regular follow-up was found to increase the proportion of people able to maintain an
initial improvement. The reviewers concluded that brisk walking has the greatest potential for
increasing overall activity levels in a sedentary population. They also point out that walking is
an exercise most likely to be adopted by people of any age, any socioeconomic background or
ethnicity and is accepted by both sexes.
Ogilvie et al. (2004) conducted a systematic review identifying interventions that promoted
replacement of car travel by walking and cycling. A search of electronic databases,
bibliographies, websites, and reference lists identified 22 studies. Evidence suggested that
targeted behaviour change programs can change the behaviour of motivated subgroups,
resulting (in the largest study) in a shift of around 5% of all trips at a population level. Single
studies of commuter subsidies and a new railway station also showed positive effects.
A number of Australian community-based interventions have been evaluated. An impact
evaluation of the WellingTonne Challenge (WC) was recently undertaken (Lyle et al, 2008).
WC was a whole-of-community project designed to help a small rural community in NSW
lose weight. The program included: a community-wide effort to lose 1000kg, the promotion
of healthy lifestyle behaviours such as increased consumption of fruit and vegetables,
increasing participation in physical and incidental activity, and stronger community
participation. For each objective, a range of strategies was developed and incorporated into a
12-week schedule of activities. Local media and public support from several well-known
community members were used to engage and motivate the community. Local supportive
partnerships were established with other health groups and health staff, service clubs, local
food businesses, sporting bodies, local media and other community groups. Before-after data
analysis revealed that the project successfully engaged the community with around 10% of the

Type 2 Diabetes Guideline 68 Primary Prevention, December 2009
target group formally participating. Participants achieved a weight reduction of around 3 kg as
well as positive changes in diet and physical activity.
Another community-based multi-strategic health promotion intervention, 'Concord, A Great
Place to be Active', was a social marketing campaign implemented from 1997 to 1999 among
women aged 20-50 years living in the Concord, an inner-western region of Sydney (Wen et al,
2002). A key feature of this campaign was the partnership between Concord Council (the
local government) and the Central Sydney Health Promotion Unit (CSHPU). Increased
opportunities were created to participate in physical activity through community walking
events, walking groups and community physical activity classes, all of which were heavily
promoted through the media. The intervention was evaluated by qualitative and quantitative
methods and by using key informant interviews, focus groups and pre- and post-intervention
telephone surveys. The proportion of sedentary women fell significantly from 21.6% (95%
CI 19.2-23.1) to 15.2% (95% CI 13.8-17.6) while the number of women who intended to walk
more increased from 65.8% to 71.8% (P<0.05).
A recent study (Cochrane & Davey, 2008) evaluated strategies to increase physical activity in
an urban community. Two deprived inner-city electoral ward areas of Sheffield, UK, with
similar socio-demographic and health profiles were selected. A study was carried out over a
21 month period that consisted of five phases: preparation/piloting, initial survey estimates, a
community awareness campaign and physical activity intervention (given to the intervention
area only) and lastly, evaluation. The awareness campaign included focus group meetings,
household leaflets, poster displays, events and competitions. The physical activity
intervention included walking, exercise referral, sports and water sports activities. Impact was
evaluated by recording uptake and attendance at all sessions, and with a post-intervention
postal survey. At follow-up, questionnaires were sent to 2,500 randomly selected addresses in
both areas. At baseline similar proportions in control and intervention areas were undertaking
physical activity (intervention 36%, control 33%). At follow-up, 38 different activity groups
were in place in the intervention area and 1,275 individuals had attended at least one activity.
Responses were received from 55% of people in the intervention area and 45% in the control
area. After one year, compared with controls, the intervention sample demonstrated trends
towards being more physically active with greater readiness to take up physical activity, better
general health and improved health (P<0.001). Further, 30.6% (intervention) versus 18.3%
(control) reported an increase in physical activity, while 13.7% (intervention) versus 24.5%
(control) reported no intention to exercise. These differences in proportions translate to an
overall effect size estimate of 0.23. Residents in the intervention area were more likely to
report being active (OR= 1.79; 95% CI 1.38-2.32; P<0.001).
Another study in Belgium assessed the effectiveness of the "10,000 Steps Ghent" campaign
(De Cocker et al, 2007) one year after intervention. This multi-strategy community-based
intervention promoted physical activity to adults via local media campaign, environmental
approaches, the sale and loan of pedometers and several physical activity projects. In 2005,
baseline data were collected from 872 randomly selected subjects aged 25 to 75, from Ghent
(the intervention community) plus 810 from a similar comparison community. Of these, 76%
and 78%, respectively completed the follow-up in 2006. During this one year interval there
was an increase of 8% in the number of people reaching the "10,000 steps" per day target in
Ghent, while no increase occurred in the comparison community. In Ghent, mean steps
increased by 896 per day (95% CI: 599-1192) with no increase evident in the comparison
community (mean change -135 [95% CI: -432 to 162; F time x community=22.8, P<0.001].

Type 2 Diabetes Guideline 69 Primary Prevention, December 2009
Wray et al (2005) have evaluated a community-wide Walk Missouri media campaign to
promote walking undertaken in a small American town. This campaign promoted walking and
local community-sponsored wellness initiatives through four types of media (billboard,
newspaper, radio, and poster advertisements) over a five-month period in the summer of
2003. The campaign was conducted in four phases: formative research; program design and
pre-testing; implementation; and impact assessment. A telephone survey (n = 297) conducted
after and not before the campaign, assessed the campaign impact. One in three respondents
reported seeing or hearing campaign messages on one or more types of media. Reported
exposure to the campaign was then found to be significantly associated with two of four pro-
walking belief scales (social and pleasure benefits) and with one of three community-
sponsored activities (participation in a community-sponsored walk).
Community-based intervention to promote healthy eating
A systematic review was conducted to assess the effectiveness of community-based
interventions in increasing fruit and vegetable consumption (Ciliska et al, 2000). A search was
conducted through electronic databases, hand-searching, and retrieval from reference lists.
Sixty articles from the one hundred and eighty-nine that were retrieved were rated as relevant.
The researchers found that the most effective interventions gave clear messages about
increasing fruit and vegetable consumption, incorporated multiple strategies that reinforced
the messages, involved the family, were more intensive, were provided over a longer period
of time, rather than one or two contacts, and were based on a theoretical framework.
Engbers et al (2005) conducted a systematic review to assess the effectiveness of worksite
health promotion programs with environmental modifications on physical activity, dietary
intake, and health risk indicators. Environmental modifications are thought to be an important
addition to health promotion programs if significant behavioural changes among the target
population are to be achieved. The researchers conducted online searches for articles
published up to January 2004 using the following inclusion criteria: randomized controlled
trial, intervention which included environmental modifications, main outcome included
physical activity, dietary intake, and health risk indicators, and healthy working population.
Thirteen relevant, mostly multi-centre, trials were included. All studies aimed to stimulate
healthy dietary intake, and three trials focused on physical activity. Follow-up measurements
of most studies took place after an average 1-year period. The authors concluded that it was
difficult to draw general conclusions based on the small number of studies included in the
review. However, evidence exists that worksite health promotion programs that include
environmental modifications can influence dietary intake.
A report by Gill et al (2005) found extensive evidence that community nutrition interventions
can be effective in changing attitudes, knowledge and eating practices (Contento et al, 1995).
They also reported that a major systematic review of behavioural dietary interventions
(AHRQ, 2000) found considerable evidence regarding the effectiveness of interventions to
help people modify their dietary intake of fats and fruit and vegetables.
The Coronary Health Improvement Project (CHIP) was a community-based lifestyle
intervention program that aimed to reduce coronary risk, especially in high risk groups
(Englert et al, 2007). The project involved a 40 hour education curriculum delivered over a
30-day period with clinical and nutritional assessments before and after. The participants were
instructed to optimize their diet, quit smoking and exercise daily (walking 30 min/day). Of
1,569 subjects enrolled between 2000 and 2002 in 5 CHIP community projects, 1,517

Type 2 Diabetes Guideline 70 Primary Prevention, December 2009
participants graduated and delivered complete clinical data sets for evaluation. At the end of
the 30-day intervention period, stratified analyses of total cholesterol, LDL, triglycerides,
bloods glucose, blood pressure and weight showed highly significant reductions with the
greatest improvement among those at highest risk. Englert et al concluded that well-designed
community-based intervention programs can improve lifestyle choices and health habits. They
can also markedly reduce the level of coronary risk factors in a non-randomised population.
Eat Better & Move More (EBMM) was a community-based program designed to improve the
diets and increase physical activity among the elderly in the US (Wellman et al, 2007). A 10-
site intervention study was conducted. Sites included dining centres, neighbourhood
recreation centres, and housing complexes in urban inner-city, suburban and rural locations.
Pre-intervention and post-intervention assessments focused on nutrition and physical activity
stages of change, self-reported health status, dietary intakes, physical activity, and program
satisfaction. Of 999 participants enrolled, 620 completed the program. The EBMM
Guidebook included 12 weekly sessions incorporating mini-talks and activities for group
nutrition and physical activity sessions. “Tips & Task” sheets encouraged individuals to attain
personal goals. Check boxes served as visual reminders of daily goals. Short lists of healthful
options within a featured food message enabled participants to personalize choices to improve
their diets. Weekly mini-sessions included interactive activities based on actual food items,
food labels, and program meals. Sessions were led by registered dietitians at 8 of the 10 sites.
Results showed that 73% and 75% of participants, respectively, made a significant advance of
1 or more nutrition and physical activity stages of change; 24% reported improved health
status. Daily intake of fruit increased 1 or more servings among 31% of participants,
vegetables, 37%, and fibre, 33%. Daily steps increased 35%, blocks walked, 45%, and stairs
climbed, 24%. The authors‟ concluded that this easy-to-implement program improves diet
and activity levels.
As discussed earlier, worksites have been a popular and useful setting for a wide range of
chronic disease prevention programs. The Treatwell 5-a-Day study was a worksite
intervention aimed at increasing consumption of fruits and vegetables (Sorensen et al, 1999).
Twenty-two worksites were randomly assigned to 3 groups: a minimal intervention control
group, a worksite intervention, and a worksite-plus-family intervention. The interventions
used community organising strategies and were structured to target multiple levels of
influence. Data were collected by self-administered employee surveys before and after the
intervention. The response rate was 87% (n=1,359) at baseline and 76% (n=1,306) at follow-
up. Results showed that total fruit and vegetable intake increased by 19% in the worksite-
plus-family group, 7% in the worksite intervention group and 0% in the control group (P=.05)
(Sorensen et al, 1999). The worksite-plus-family intervention was more successful in
increasing fruit and vegetable consumption than was the worksite intervention. The authors‟
concluded that worksite interventions involving family members appear to be a promising
strategy for influencing dietary habits.
A study by Verall et al (2000) examined the impact of the Working Well Trial, a worksite
health promotion intervention, on the worksite smoking and nutrition environment. The study
was a randomised, un-blinded, controlled trial with 3 years of follow-up in 114 worksites
(n=20,801 employees) in the US. Fifty seven worksites (n=10,071) participants were allocated
to the nutrition and smoking intervention group and 57 (n=10,730) were allocated to the
control group. Interventions aimed to achieve changes in both social norms and the physical
environment. Employees at intervention worksites formed employee advisory boards, which
collaborated with an interventionist from the study (eg, proposed ways of increasing
Type 2 Diabetes Guideline 71 Primary Prevention, December 2009
accessibility to healthy foods, and developed and implemented company policies to support
healthy eating and smoking cessation). Employees at control worksites received baseline
survey data and used optional distribution of printed materials and self help programs.
Changes in worksite physical environment and social norms related to nutrition and smoking
were assessed by surveys of employees and key organisational informants. Compared with
employees at control worksites, those at intervention worksites perceived a change in both the
physical environment (access to health food and nutrition information, P<0.001) and social
environment (co-worker support for low fat dietary choices and management concern about
employees nutrition, P<0.001). The researchers found that a worksite health promotion
intervention improved the physical and social environment related to health behaviours.
Another low-intensity worksite-based nutrition intervention was conducted in Belgium and
focussed on promoting low-fat dietary habits (Braeckman et al, 1999). Employees from four
local worksites were recruited to participate in the intervention. The sites were randomised to
control conditions or to the intervention programme that consisted of an individualized health
risk appraisal, group sessions, mass media activities and environmental changes. Participants
were seen before and three months after intervention to measure blood lipids, nutrition
knowledge and dietary changes. Eighty-three per cent of all eligible subjects were screened
(n=770) and follow-up measures were obtained for 82%. The score for nutrition knowledge
improved significantly in the intervention group. There was also a net reduction in the intake
of total calories and in the percentage of energy from total fat (P<0.05). For all employees
assessed, there were no changes in mean total cholesterol level or fatty acid composition. The
intervention programme achieved dietary changes and was successful in obtaining a more
short-term beneficial cholesterol level in employees at higher cardiovascular risk.
The Dutch Heart Health community intervention (Ronda et al, 2004) was a cardiovascular
disease prevention program with a community component that aimed to reduce fat intake as
well as increase physical activity. In order to implement the intervention, nine local health
committees were set up, each organising activities that facilitated and encouraged people to
adopt healthier lifestyles. A pre-test-post-test control group design with two post-tests was
used to evaluate the intervention. At baseline, representative random cohort research samples
were selected in the study region and in a control region. Data on fat intake and physical
activity, and on the psychosocial determinants of these behaviours, were gathered by mail
surveys. The community intervention involved 293 activities. One hundred and sixty-six of
these activities concerned nutrition, 84 physical activity and 15 smoking, and 28 activities
were more general and targeted more than one risk behaviour. Examples of such activities
include computer-tailored nutrition education, nutrition tours in supermarkets, a regional daily
television program “Heartbeat on the Move” to promote physical activity, and walking and
cycling months. In addition, there were ongoing activities trying to draw attention to the
project and its specific activities, such as commercials on local television and radio,
newspaper articles, and posters and pamphlets. The authors found that the intervention had a
significant effect on fat reduction, especially among respondents aged 48 years (P=0.003).
Respondents who were familiar with a health project in their community reported more social
support towards decreasing their fat intake than those who were not familiar with such a
health project [odds ratio (OR) = 1.463; P = 0.037).
In 2001 the UK Department of Health funded pilot community-based interventions to
improve fruit and vegetable intakes in five economically deprived areas of England. The
interventions involved building community networks to achieve and sustain increased fruit
and vegetable intakes through collaboration between retailers, educators, primary care teams,

Type 2 Diabetes Guideline 72 Primary Prevention, December 2009
employers and local media. Ashfield-Watt et al (2007) evaluated the interventions. Data on
intakes of and beliefs about fruit and vegetables were collected by a short postal questionnaire
from 810 individuals living in the pilot communities and 270 individuals who were
participating in an unrelated observational study (controls). Data was collected before and
after a 12-month intervention period. The results showed that compared with controls, the
intervention group significantly increased knowledge of the 5-a-day optimum (P=0.01) and
reported increased access to fruits and vegetables (P=0.001). Smoking habit strongly
predicted change in fruit and vegetable intakes (P=0.01) in the intervention group. Ashfield-
Watt et al. concluded that community-based interventions can produce important changes in
knowledge of and access to fruit and vegetables. However, in this study change in fruit and
vegetable intake was strongly influenced by smoking habit.
Maddock et al (2006) evaluated the Healthy Hawaii Initiative which was a state-wide
program designed to reduce chronic disease risk factors. The program commenced in the year
2000 and implemented interventions in schools and communities and through public and
professional education to improve physical activity and nutrition. Evaluation of these
programs included long-term objectives focusing on health outcomes and shorter-term
objectives focusing on health behaviours. Results showed positive trends in adults for
increased fruit and vegetable consumption and a reduction in no leisure time physical activity.
No leisure time physical activity in adults decreased by 7.2% from 25.5% in 1999 to 18.3% in
2003. Over the same time period, the percentage of adults eating five or more servings a day
also increased by 5.2% from 22.4% to 27.6%. The researchers concluded that the Healthy
Hawaii Initiative appears to have some impact on short-term indicators but more years of data
collection will be necessary before true trends can be detected to assess the overall impact of
the initiative.
Type 2 Diabetes Guideline 73 Primary Prevention, December 2009
3. Develop policies and create environments that support healthy lifestyle
Environmental and policy interventions are effective in reducing chronic
disease risk factors including smoking, physical inactivity, and unhealthy
eating. (Evidence Level III)
Policy regulation such as nutrition information on processed foods has the
potential to improve food choices and promote healthy eating at a population
level. (Evidence Level III)
The physical environments
An emerging body of evidence suggests that polices and environmental interventions that
support the adoption of healthy behaviours are promising in reducing the burden of chronic
diseases such as diabetes and cardiovascular disease. In this section, we present selected
reviews to highlight the potential of policy and environmental interventions to mitigate
unhealthy behaviour. A comprehensive review by Brownsen et al (2006) described effective
and promising environmental and policy interventions to address tobacco use, physical
activity, and healthy eating. A total of 17 interventions were reviewed, organized across 3
domains affecting the physical environment/access, economic environment, and
communication environment. Many of these interventions are effective. There are several
important lessons to consider such as the need to start with environmental and policy
approaches, intervene comprehensively and across multiple levels; make use of economic
evaluations; make better use of existing analytic tools; understand the politics and local
context; address health disparities, and conduct sound policy research (Brownson et al, 2006).
A systematic review was conducted by Hider (2001) to assess the effectiveness of
environmental changes in reducing calorie intake or calorie density (Hider, 2001). One
thousand one hundred and sixty five articles were identified by the search, 439 studies were
considered against the inclusion criteria and 13 studies were located that had examined the
effectiveness of environmental interventions to change calorie intake or calorie density. The
most common environmental interventions were changes in the recipes, menus or prices of
items available at food service areas. Point-of-choice information was also frequently used.
Environmental interventions were often combined with other types of interventions in
workplace, educational or community settings. However, the review concluded that
conclusions about the effectiveness of environmental interventions is limited by the
deficiencies in the research, their frequent use in conjunction with a variety of other
interventions, and the heterogeneous nature of the outcome variables that have been used.
Gebel and co-workers (2005) reviewed evidence on the links between physical environments
and physical activity, nutrition and obesity and reported that their findings are consistent with
reports from earlier published reviews (Gebel et al, 2005). This review also highlighted that
while there is an accumulating body of evidence on how physical environments affect
physical activity, there is very little published or available research on influences of the
environment on nutrition and obesity. This report discussed that there are several urban form
characteristics (natural and built environment) that tend to be associated with physical
activity, and possibly nutrition-related obesity behaviours. These include mixed land use and
density, footpaths and cycle ways and facilities for physical activity, street connectivity and
design, transport infrastructure and systems, and linking residential, commercial and business
areas. However, the authors‟ acknowledge a key limitation in interpreting the available

Type 2 Diabetes Guideline 74 Primary Prevention, December 2009
research is that even where there are reasonably consistent associations between
environmental variables and health behaviours, the evidence cannot be interpreted as
definitively „causal‟. Drawing on theory, a social ecological model has been used to
acknowledge the complexity of the links, and point to the necessity of more comprehensive
approaches to research that integrate psychological, organisational, cultural, community
planning, and regulatory perspectives.
Auchincloss et al (2008) used linear regression to estimate associations between area features
and insulin resistance in data from 3 sites of The Multi-Ethnic Study of Atherosclerosis, a
study of adults aged 45-84 years who did not have diabetes. This study showed greater
neighbourhood physical activity resources were consistently associated with lower insulin
resistance. Adjusted for age, sex, family history of diabetes, race/ethnicity, income and
education, insulin resistance was reduced by 17% (95% CI -31% to -1%) for an increase from
the 10th to 90th percentiles of resources. Greater healthy food resources were also inversely
related to insulin resistance, although the association was not robust to adjustment for
race/ethnicity. Analyses including diet, physical activity, and body mass index suggested that
these variables partly mediated observed associations. Results were similar when impaired
fasting glucose/diabetes was considered as the outcome variable. The authors conclude that
diabetes prevention efforts may need to consider features of residential environment.
Policy action and regulation
The evidential basis of environmental approaches to reducing population obesity has recently
been examined in a narrative review (Faith et al, 2007). Applying National Heart, Lung, and
Blood Institute criteria, the effects of: (a) taxing or subsidising foods, (b) manipulating the
ease of food access, and (c) restricting access to certain foods were examined. It was
concluded that although food price manipulations may alter point-of-purchase food
acquisition, there is little evidence to show that this changes dietary intake or impacts on long-
term energy balance and weight control. Ease of food access however, can influence food
purchases, and may affect food intake and body weight. In an ecological observational study
(Cutler et al, 2003), international comparisons were made on economic effects of legal
strategies to alter food consumption and obesity prevalence. It was predicted that countries
with more restrictive policies (limiting access to certain foods) would have lower obesity
prevalence. In a regression analysis of 10 countries (Australia, Belgium, Canada, Denmark,
France, Germany, Italy, Poland, the UK and the United States), each additional food statute
was found to be associated with a 4.5% reduction in the percentage of the adult population
that was obese. As this study was ecological in nature; it can not be assumed that a single
type of legislation will have the same effect in all countries. Moreover, limiting access to
certain foods may not completely restrict access to other energy-dense foods that could,
potentially, compensate for the restricted items.
Another review (Sacks et al, 2008) has set out a structure for systematically identifying areas
for obesity prevention policy action. Such areas can be systematically identified by
considering policy opportunities for each level of governance (local, state, national,
international and organisational); for each sector of the food system (primary production,
food processing, distribution, marketing, retail, catering and food service) and in each sector
that influences physical activity environments (infrastructure and planning, education,
employment, transport, sport and recreation). Potential regulatory policy intervention areas
are widespread throughout the food system, e.g., land-use zoning (primary production within

Type 2 Diabetes Guideline 75 Primary Prevention, December 2009
local government), food safety (food processing within state government), food labelling
(retail within national government). Policy areas for influencing physical activity fall
predominantly within local and state government responsibility for example, walking and
cycling environments (infrastructure and planning sector) and physical activity education in
schools (education sector).
In the Australian context, fruitful areas for policy change include area where existing laws and
regulations:
are obesogenic e.g. land-use laws that allow large concentration of fast-food outlets
selling energy-dense foods.
serve as barriers to efforts to prevent obesity e.g. public liability laws as a barrier to
opening school grounds after hours.
serve as facilitators to obesity prevention e.g., mandatory physical education in schools,
car-free areas of cities.
Policy areas likely to impact on obesity prevalence may also include those where there are
regulatory gaps or weaknesses which, if addressed, would enhance obesity prevention efforts,
for example, restricting food marketing to children, implementing front of pack nutrition
signposting systems (Sacks et al, 2008). The reviewers concluded that a coordinated approach
to policy development and implementation across all levels of government is necessary to
deliver complementary policy action. Similarly, a collaborative „whole of government‟
approach, spanning multiple sectors, is required to avoid fragmented, overlapping or
contradictory policies. The process requires an initial consultation with stakeholders to
prioritise policy areas for potential intervention. This would be followed by full analysis of
selected policy areas, including an examination of constraints and historical influences.
Specific interventions should then be defined and modelled for health and environmental
impact, using best available evidence to assess effectiveness and cost-effectiveness (Sacks et
al, 2008).
A systematic review (Magnusson, 2008) has examined legal strategies that could help
prevent population weight gain. Review of the evidence suggested that considerable work
remains to be done in identifying the institutional features that could best deliver policy
improvements for obesity and chronic diseases across sectors and levels of government. This
review indicated that the Law can serve obesity prevention by altering the information
environment by generating information resources for use by governments and individuals.
Nutrition surveillance data are important for galvanising political commitment for public
health policies, evaluating interventions taken at a population level, and mandating the
provision of information to consumers to facilitate healthier choices. Reform in this area
could make a substantial contribution to public health nutrition by protecting against
deceptive and misleading claims and assisting consumers to choose foods that will contribute
to a healthier diet and restricting advertising to consumers. Food marketing, including
television advertising can shape food preferences and purchase. Many public health advocates
therefore support regulatory constraints on the advertising of foods high in sugar, salt and fat
as part of a broader policy response to obesity prevention.
Magnusson‟s review (2008) states that obesity is an economic issue as well as a health issue.
Economic policies aim to improve patterns of diet and physical activity not by dictating
behaviour, but by changing costs of behaviour. Key roles for economic policy could include
the use of taxes and subsidies to promote the production and distribution of healthier foods;
greater use government oversight to improve standards of catering in schools, hospitals and

Type 2 Diabetes Guideline 76 Primary Prevention, December 2009
all government departments; and the creation of local area targets for obesity reduction and
improved nutrition. The review also suggested that in Australia, both private and public
sector employers need to become “health policy entrepreneurs”, taking greater responsibility
for health in the workplace. Although improved productivity, reduced absenteeism, and better
profile as an “employer of choice” provide return on such investment, tax incentives might
also encourage introduction of “health and wellbeing” programs in the workplace.
Magnusson (2008) argues that the clinical health care system can also be an important setting
for assessing obesity and making “lifestyle prescriptions”. The Lifescripts program is a recent
Australian initiative in this area. Funded by the Commonwealth government, and
implemented through local divisions of general practice, Lifescripts encourages doctors to
assess their patients for lifestyle risk factors and make written lifestyle prescriptions.
Incentives are required to support this program. A new Medicare Benefits Schedule item
thus encourages general practitioners to undertake a comprehensive health check on middle-
aged patients presenting with identifiable risk factors for chronic disease. Recent legislative
changes also make it easier for private health insurers to cover similar services. In this review,
Magnusson argues that a regulatory approach can make a substantial contribution to
addressing the economic, social and environmental determinants of modern “obesogenic
environments”. This will require governments to adopt a clear theoretical approach to the
problem, to exhibit a degree of bravery and demonstrate a commitment to outcomes that
extend beyond the usual timeframes that operate in politics. Magnusson concludes that the
challenge remains to act cooperatively across sectors and levels of government and to realise
the potential of law as a policy tool, together with other strategies, to wind back the impact of
overweight and obesity on chronic disease in Australia.
While there are numerous examples of policy actions that could be highlighted, the current
literature around food labelling has been selected as an example given the recent interest in
reform in this area as outlined below.
Several systematic reviews have explored consumers understanding and use of nutrition
labelling. Cowburn and coworkers (2005) identified 103 relevant papers most from North
America or Northern Europe and only a minority (9%) judged of medium to high quality.
Although reported use of nutrition labels was high, more objective measures suggested
consumers may not actually use nutrition labelling during food purchase. Consumers who do
examine labels appear to understand some of the terms used but are confused by others. Most
consumers can retrieve simple information and make simple calculations and comparisons
between products, but their ability to accurately interpret the nutrition label reduces as the
complexity of the task increases. The addition of interpretational aids such as verbal
descriptors and Nutritional Reference Values (NRV) helps consumers compare products and
assess the nutrient contribution made by specific foods to their overall diet. The reviewers
concluded that improved nutrition labelling could make a small but important contribution at
point-of-purchase to promote selection of healthy food choices.
Grunert and co-workers(Grunert, 2006) have reviewed research conducted between 2003–
2006 in 15 countries of the European Union on how consumers perceive, and use nutrition
information on food labels. In a total of 58 studies, widespread consumer interest in nutrition
information on food packaging was identified. Consumers liked simplified front-of-pack
information but responded differently to different formats. The review did not provide insight
into how labelling information was used in real-world situations, or how it might affect
consumers‟ dietary patterns.

Type 2 Diabetes Guideline 77 Primary Prevention, December 2009
Drichoutis and co-workers (2006), however, have examined the determinants of label use
more thoroughly. They found that the label with the most positive dietary benefits displayed
percentage nutrient content relative to the Recommended Daily Intake (RDI). Consumers
performed poorly when required to manipulate quantitative nutrient information displayed on
a pack. Most preferred bold text and coloured nutrition panels. Consumers mainly sought to
avoid negative nutrients in food products and were more successful in achieving this when
supported by an information campaign. The reviewers found that most empirical research
surveyed, indicated that provision and use of information can significantly change dietary
patterns, leading to a better dietary intake or to reduced consumption of „unhealthy‟ foods.
The European Heart Network (2003) has carried out a systematic review on nutrition
labelling. The search identified 307 papers of which 130 studies were reviewed. From these,
it appeared that although consumers reported a high use of nutrition labels, actual use during
food purchase may be much lower. This may be due to lack of time, problems with the way
information is presented, lack of understanding of terms or concerns about the accuracy of the
information given. Consumers do not understand all of the terms used on labels. They make
simple comparisons between similar products but their ability to accurately interpret the
nutrition label reduces as the complexity of the task increases.
Apart from nutrition information food packets often display health claims. An Australian
review (Williams, 2005) has examined consumer understanding of such claims. This search
(conducted from 1984 to 2004) found that consumers find health claims useful, considering a
product with a health claim as healthier than others and one that they were more likely to
purchase. Consumers however, thought health claims should be approved by government
and were more skeptical of health claims from food companies. They were unable to make
clear distinctions between nutrition content claims, structure-function claims, and health
claims; and disliked long and complex, scientifically worded claims. Most preferred split
claims with a succinct statement of the claim displayed on the front of the package.
Present requirements for mandatory nutrition labelling have been in force in Australia since
late 2002. A study (Fabiansson, 2006) was conducted to ascertain whether consumers are
provided with sufficient information to make an informed choice. The NSW Food Authority
bought quintuplicate samples of 70 different food products from supermarkets in NSW during
October 2004 to May 2005. „Low-claim‟ as well as conventional products were sampled to
check if extra attention was given to low claim labelling. Low claim products are foods that
carry claims that they are “low” in a particular undesirable nutrient such as sodium or fat. All
nutrients declared on the nutrition information panel (ie protein, total fat, total sugar, sodium,
energy and total carbohydrate) were analysed for 350 samples. A significant discrepancy was
noted between actual and declared values. Precision varied from -13% to +61% for individual
nutrients. Australian food legislation does not stipulate tolerance limits. In some countries a
±20% discrepancy is allowed while others specify upper and lower limits and allow a
maximum discrepancy of -20% for beneficial nutritional compounds and +20% for
unfavourable compounds. In the Australian study, food labelling was shown to be somewhat
inaccurate. Only 16% of the 70 products fully complied when a leeway of ±20% for any
nutritional compound on the label was set. With separate upper and lower limits, only 51% of
products fully complied. Compliance improved to 27% and 70% of products, respectively, by
excluding variations in minor nutrients of less relevance to consumers.
A survey (Williams, 2005) of 1,200 Australian adults has sought to identify the factors of
greatest concern to consumers in relation to the safety and quality of food. Confirming earlier

Type 2 Diabetes Guideline 78 Primary Prevention, December 2009
findings made by an ANZFA consumer survey made in 1996, respondents indicated that they
were most concerned to check labels for food additives, and more consumers were concerned
about these than about added salt or sugar (p<0.001). Consumer concerns about food
additives thus contrast strongly with the views of health professionals such as dietitians and
GPs, who regard nutritional information and allergy warnings as the most useful information
on food labels.
A study has specifically examined (Reid & Hendricks, 1994) consumer understanding and use
of label information about dietary fat and cholesterol. Mall intercept interviews of 149 food
shoppers (80% female), revealed that most (60%) believed it is very important to reduce
dietary fat intake. However, the claims "low in saturated fat" and "no cholesterol" and the
term "non-hydrogenated" were often misunderstood. Many respondents (50-66%) correctly
interpreted "% B.F./M.F.", "low fat" versus "reduced in fat" claims, and the fat content of
margarines. Only 18% used % B.F. information to choose cheese and yoghurt. Depending on
the claim, only 34-56% of respondents reported consulting other label information; with the
lowest rate of "additional consultation", (34%) reported for the "no cholesterol" claim.
A more recent study (Higginson et al, 2002) aimed to identify the nutrition label information
accessed by a small number of consumers (n=14) while shopping for food. Information on fat
content was predominantly accessed followed by energy information. The type of product
influenced label examination. Fat information was looked at more in foods likely to be high
in fat (biscuits, butter/margarine, crisps and sandwich filling). Consumers particularly claimed
to read nutrition labels for complete (ready made) meals and dairy products.
Wansink and co-workers (2004) interviewed 118 shoppers at a grocery store in Illinois, USA.
As assessed by one-tail t test, short claims generated more favourable ratings as to how
beneficial for health (p<.05), how appealing (p<.05), and how low in saturated fat (p<0.05)
the product was perceived. It was concluded that short claims on the front-label generated
stronger, more favourable beliefs than longer claims.
Feunekes et al. (2008) reviewed two studies that looked at the impact of eight front-of-pack
nutrition labelling formats on consumers from four European countries. In total 1,630 people
(18-55 yrs) were recruited from Internet panels in the UK, Germany, Italy and the
Netherlands for study 1 while a further 776 were recruited in Italy and the UK for study 2.
Participants evaluated several products (including healthier and less healthy variants of the
same product category) with a front-of-pack nutrition labelling format. Study 1 evaluated
different labelling formats on consumer friendliness (comprehension, liking and credibility)
while study 2 measured the effect of the different labelling formats on decision-making (usage
intention and process time). The results indicated minor differences in consumer friendliness
and usage intention between simpler (such as Healthier Choice Tick, Smileys and Stars) and
more complex front-of-pack nutrition labelling formats (such as Multiple Traffic Light,
Wheel of Health and GDA scores). Endorsement by national and international health
organisations strongly increased credibility. Participants also needed significantly less time to
evaluate simpler front-of-pack labelling compared to more complex labelling formats.
Rayner et al (2001) conducted a small cross-sectional study examining how consumers use
health-related food endorsements on food labels. Three endorsement programs were assessed
via protocol analysis: those of the two major UK retailers, Tesco and Sainsbury's, plus the
"Pick the Tick" program of the National Heart Foundation of Australia. Protocol analysis
involves the subject "thinking aloud" while performing a task either (a) shopping normally or

Type 2 Diabetes Guideline 79 Primary Prevention, December 2009
(b) shopping "healthily" for foods on a predetermined list to generate a protocol. Each subject
was also interviewed to investigate reported use of endorsements. Subjects were a quota
sample (N = 44) of shoppers representative of the UK and Australian populations.
Information about the subjects, the protocols, and interview data were analysed quantitatively;
the protocols were also analysed qualitatively. Sainsbury's and Australian shoppers never used
the endorsements when shopping. Although Tesco shoppers claimed to use endorsements and
the explicit nature of the symbol used appeared helpful, protocol analysis revealed no actual
use. The reviewers suggest that health-related food endorsements, in particular the Australian
“Pick the Tick” program, are less frequently used by shoppers than the advocates of such
programs suggest. They called for more research to establish the impact of health-related
food endorsement programs on food purchasing behaviour.
A report by Kelly et al (2008) has recently reported the results of consumer research study to
determine which front-of-pack labelling system would be most appropriate for use in
Australia. Four different front-of-pack labelling systems were tested, based on variations of
the two major systems, traffic light labelling (where total fat, saturated fat, sugar and sodium
are ranked and colour coded as either high (red), medium (amber) or low (green) based on
nutrient cut-points; and the Percentage Daily Intake (%DI) system (which shows the
contribution of energy, protein, total fat, saturated fat, total carbohydrate, sugar, fibre and
sodium provided by a serve of a food as a percentage of daily requirements for each nutrient).
In June 2008, 790 consumers living in NSW were surveyed. All participants were the main
grocery buyer or shared the responsibility for grocery purchases in their households.
Participants were recruited from shopping centres across Sydney and Newcastle, with
representation from high, medium and low socio-economic areas, and from metropolitan and
regional areas. Around 200 consumers were asked about each of the four systems. Each
person was shown two products, each labelled in two different ways. Questions examined
consumers‟ label preference and also objectively tested how well each system allowed
consumers to identify healthier food products (Kelly et al, 2008).
The study by Kelly et al (2008) found that consumers largely supported the introduction of
front-of-pack food labelling, preferring a single system to be used across all food packages.
This would then require mandatory labelling regulations. While consumers preferred the
colour-coded %DI food labelling system, consumers using the traffic light system were five
times more likely to correctly identify healthier food products compared to the monochrome
%DI system, and three times more likely to correctly identify the healthier products compared
to the colour-coded %DI system. While consumer preferences are important, the critical issue
when considering the introduction of front-of-pack food labelling into the Australian grocery
market, is whether consumers can use the information on the label to make healthier food
choices The monochrome %DI system proved less useful for consumers from lower socio-
economic groups, with people from lowest socio-economic group six times less likely to
correctly identify the healthier food products using the monochrome %DI labelling than
people from the highest socio-economic group. This difference between socioeconomic
groups was statistically significant (p<0.05). Across all socio-economic groups, consumers
displayed a similar ability to use the Traffic Light systems to identify healthier foods. The
researchers concluded that to maximise the ease and accuracy with which consumers make
healthy food choices, regulations should be introduced to mandate the display of Traffic Light
front-of-pack labelling on all Australian food products.

Type 2 Diabetes Guideline 80 Primary Prevention, December 2009
Summary – Population strategies
Social marketing is effective in increasing physical activity, improving nutrition
knowledge, attitudes and eating behaviour in a range of target groups in different settings.
Mass media campaigns help change attitudes and levels of knowledge towards physical
activity, but have limited short-term impact on participation in physical activity.
Mass media campaigns enhance the success of community-based educational programs
and public relations activities.
Effective community-based interventions gave clear messages, incorporated multiple
strategies, involved the family, were more intensive, were provided over a longer period
of time, and were based on a theoretical framework.
Worksites are an effective setting for community-based interventions aimed at promoting
healthy eating, especially worksite programs that include environmental modifications
and involve family members.
Well-designed community-based intervention programs can improve lifestyle choices and
healthy habits.
Environmental interventions show promise but evidence about their effectiveness is
limited by the deficiencies in research.
Policy action, including regulation and legislation, has a distinct role shaping a health
promoting environment. Effective policy action requires coordination across all levels of
government and all sectors. The mechanisms and impact of policy actions are still not
fully understood and so efforts to observe and measure changes should be prioritised.

Type 2 Diabetes Guideline 81 Primary Prevention, December 2009
Evidence Tables: Section 3
Population strategies effective in reducing risk factors for type 2 diabetes
Social marketing and mass media – physical inactivity
Author
(year)
Evidence
Level of Evidence
Quality Rating
Magnitude
of effect
Rating
Relevance
Rating Level Study Type
Bauman et ala
(2001)
III-2 Comparative Before
and After study Medium High High
Bauman et ala
(2003)
III-3
Time series analysis,
longitudinal study
Medium High High
Beaudoin et ala
(2007)
III-3 Cross-sectional Before
and After study Medium High High
Cavill et ala
(2004)
III-3
Systematic review of
comparative studies
(Before & After)
Medium High High
Finlay et ala
(2005)
III-3
Systematic review of
comparative studies
(Before & After)
Medium N/A High
Gordon et al
(2006)
III-3
Systematic review of
comparative studies
(Before & After)
Medium N/A High
Hillsdon et alb
(2001)
III-3 Prospective longitudinal
study Low High High
Kahn et al
(2000)
III-3
Systematic review of
comparative studies
(Before & After)
Medium N/A High
Marcus et ala
(1998)
III-3
Systematic review of
comparative studies
(Before & After)
Medium N/A High
Merom et al
(2005)
III-3 Non-experimental
cohort study Medium High High
Miles et al
(2001)
III-3 Before and After study Medium High High
Sogaard et al
(1992)
III-3 Before and After study Medium N/A High
Wimbush et ala
(1998)
III-3 Before and After study Medium N/A High
a increase in awareness and intention to be more active/healthy diet but little or no effect on changing behaviour.
b Significant increase in number knowledgeable about physical activity recommendations but no evidence of
improved physical activity.

Type 2 Diabetes Guideline 82 Primary Prevention, December 2009
Social marketing and mass media – healthy eating
Author
(year)
Evidence
Level of Evidence
Quality Rating
Magnitude
of effect
Rating
Relevance
Rating Level Study Type
Ashfield-Watt
(2006)
III-3 Before and After
study Medium High High
Dixon et al (1998)
III-3
Time series
analysis,
longitudinal study
Medium High High
Foerster et al
(1995)
III-3 Before and After
study Low N/A High
Maddock et al
(2007)
III-3 Before and After
study Low High High
Miles et al (2001)
III-3 Before and After
study Low High High
Pollard et al (2008)
III-3 Before and After
study Low High High
Reger et al (1999)
III-2 Non-randomised
experimental trial Medium High High
Reger et al (2000)
III-2 Non-randomised
experimental trial Medium High High
Taylor et al (1991)
III-2 Non-randomised
experimental trial Medium High High
Wammes et al
(2007)
III-3 Before and After
study Low N/A High
Wardle et al (2001)
III-3 Before and After
study Low N/A High

Type 2 Diabetes Guideline 83 Primary Prevention, December 2009
Community-based interventions – physical inactivity
Author
(year)
Evidence
Level of Evidence
Quality Rating
Magnitude
of effect
Rating
Relevance
Rating Level Study Type
Cochrane et al
(2008)
III-2 Non-randomised
experimental trial Medium High High
De Cocker et al
(2007)
III-2
Comparative
Before and After
study
Medium High High
Fogelhom et al
(2002)
III-2
Systematic review
of comparative
studies with
concurrent control
Low N/A High
Hillsdon et al
(1996)
I Systematic review
of RCTs Medium N/A High
Lyle et al
(2008)
III-3 Before & After
study Low N/A High
Ogilvie et al
(2004)
III-3
Systematic review
prospective &
retrospective
studies
Low N/A High
Ogilvie et al
(2007)
III-3
Systematic review
of Before & After
studies
Medium N/A High
Satterfield et al
(2003)
III-3
Systematic review
of comparative
studies (Before &
After studies)
Low N/A High
Wen et al
(2002)
III-3 Before & After
study Low High High
Wray et al
(2005)
III-3 Cross-sectional
study Low N/A High
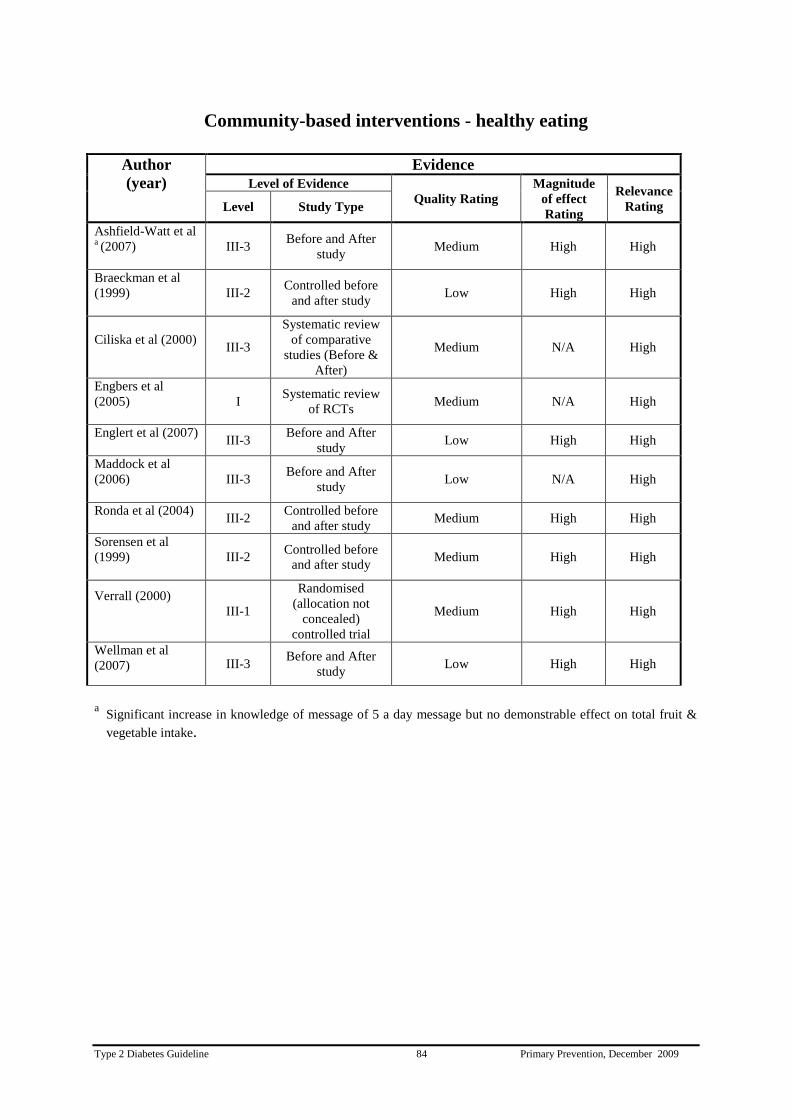
Type 2 Diabetes Guideline 84 Primary Prevention, December 2009
Community-based interventions - healthy eating
Author
(year)
Evidence
Level of Evidence
Quality Rating
Magnitude
of effect
Rating
Relevance
Rating Level Study Type
Ashfield-Watt et al a (2007)
III-3 Before and After
study Medium High High
Braeckman et al
(1999)
III-2 Controlled before
and after study Low High High
Ciliska et al (2000)
III-3
Systematic review
of comparative
studies (Before &
After)
Medium N/A High
Engbers et al
(2005)
I Systematic review
of RCTs Medium N/A High
Englert et al (2007)
III-3
Before and After
study Low High High
Maddock et al
(2006)
III-3 Before and After
study Low N/A High
Ronda et al (2004)
III-2
Controlled before
and after study Medium High High
Sorensen et al
(1999)
III-2 Controlled before
and after study Medium High High
Verrall (2000)
III-1
Randomised
(allocation not
concealed)
controlled trial
Medium High High
Wellman et al
(2007)
III-3 Before and After
study Low High High
a
Significant increase in knowledge of message of 5 a day message but no demonstrable effect on total fruit &
vegetable intake.

Type 2 Diabetes Guideline 85 Primary Prevention, December 2009
Policy action and regulation
a) Policies to reduce population obesity
Author
(year)
Evidence
Level of Evidence
Quality Rating
Magnitude
of effect
Rating
Relevance
Rating Level Study Type
Faith et al (2007)
III-3
Systematic Review
of Observational &
Quasi-experimental
studies
Medium N/A N/A
Cutler et al (2003) III-3
Ecological
observational study
N/A N/A N/A
Sacks et al (2008) III-3
Systematic Review
of policy
interventions
Medium N/A N/A
Magnusson (2008) III-3 Review Low N/A
N/A

Type 2 Diabetes Guideline 86 Primary Prevention, December 2009
b) Food labelling
Author
(year)
Evidence
Level of Evidence
Quality Rating
Magnitude
of effect
Rating
Relevance
Rating Level Study Type
Cowburn et al (2005) III-3
Systematic Review
of cross-sectional
studies
Medium N/A Low
Grunert et al (2006)
III-3 Systematic Review
of cross-sectional
studies
Medium N/A Medium
Drichoutis et al (2006)
III-3 Systematic Review
of cross –sectional
studies
Low N/A Medium
European Heart
Network (2003)
III-3 Systematic Review
of cross-sectional
studies
Medium N/A Low
Williams (2005)
III-3 Systematic Review
of cross-sectional
studies
Medium N/A Medium
Fabiansson (2006) III-2 Diagnostic test N/A N/A
Williams (2004) III-3 Cross-sectional
study
Medium Medium Low
Reid & Hendricks
(1994)
III-3 Cross-sectional
study
Low Low Low
Higginson et al (2002) III-3 Cross-sectional
study
Low Low Low
Wansink et al (2004)
III-2 Comparative Study
with concurrent
controls
Medium High Low
Feunekes et al (2008) III-3 Cross-sectional
study
Medium Medium Medium
Rayner et al (2001) III-3 Cross-sectional
study
Medium Low Low
Kelly et al (2008) III-3 Cross-sectional
study
Medium High Low

Type 2 Diabetes Guideline 87 Primary Prevention, December 2009
Section 4: Cost effectiveness and socio-economic implications
Questions
a) Is prevention of type 2 diabetes cost-effective?
b) What are the socio-economic implications of prevention of type 2 diabetes?
Recommendation
To be optimally cost-effective and cost saving in the long term, interventions to prevent
diabetes should focus on lifestyle modification.
Practice Points
Lifestyle modification interventions for high risk individuals should be implemented at
the level of routine clinical practice.
In absence of specific strategies targeting low socio economic people, strategies aimed
at the general population are recommended.
Culturally appropriate lifestyle interventions should be provided in accessible settings.
Evidence Statements
Lifestyle modification can prevent or delay the development of diabetes at costs
acceptable to society.
Lifestyle modification interventions are cost-effective and cost saving in people at high
risk of developing diabetes.
Metformin and acarbose are cost-effective pharmacological interventions in people at
high risk of developing diabetes.
Lifestyle modification interventions are often more cost-effective than
pharmacological interventions.

Type 2 Diabetes Guideline 88 Primary Prevention, December 2009
Cost-effectiveness of life style modification interventions and metformin improves
when the interventions are implemented in routine clinical practice
Interventions for preventing diabetes are equally effective in culturally specific and
low socio economic high-risk groups
Evidence Level II

Type 2 Diabetes Guideline 89 Primary Prevention, December 2009
Background – Cost effectiveness and socio-economic implications
The prevalence of type 2 diabetes has become epidemic in Australia and worldwide. The direct
and indirect costs of caring for people with type 2 diabetes and its complications are considerable
and will continue to rise. In 2004-05 the direct health care expenditure on diabetes was $907
million (of which type 2 diabetes accounted for 81% at $733 million), accounting for 1.7% of the
total allocatable recurrent health expenditure for that year (Australian Institute of Health and
Welfare, 2008). These figures almost certainly underestimate the true cost of diabetes. The
DiabCo$t study reported that the average total (direct plus indirect) health costs for an individual
with type 2 diabetes was $5360 per year (Colagiuri et al, 2003). The costs per year for individuals
with both macrovascular and microvascular complications was on average 2.4 times higher than
for those with no complications ($9625 vs. $4020). Based on a diabetes prevalence of 7.4%, the
total annual cost for people with type 2 diabetes in Australia was estimated to be $2.2 billion, and
if the cost of carers is included this figure rises to $3.1 billion. In addition, people with type 2
diabetes receive $5540 per year on average in Commonwealth benefits, increasing the total
annual cost of diabetes to $6 billion .
There is compelling evidence from well designed randomised trials, as discussed in the previous
sections, demonstrating that preventive measures such as lifestyle changes and pharmacotherapy
have the potential to reduce the risk of type 2 diabetes and hence reduce the costs associated with
the disease. Progression to diabetes was reduced in the Da Qing study by 40%, in the Finnish and
US Diabetes Prevention Programs by 58%.
Cost effective models are widely used to help policy makers to guide decisions about
interventions (Hutubessy et al, 2003). However, cost effectiveness models do not address issues
of implementation such as feasibility and acceptability (Briggs et al, 1994). To determine the
cost-effectiveness of interventions, this section includes evidence from studies that reported
economic analysis of interventions that investigated diabetes prevention as a primary outcome.
Socio economic implications
The prevalence of diabetes varies with socio-economic position and increases with increasing
disadvantage (Carter et al, 1996; Fisher et al, 2002; Candib, 2007). In 2001, the prevalence of
self-reported diabetes was almost twice as high in the most disadvantaged areas than in the least
disadvantaged in Australia (Australian Institute of Health and Welfare, 2008). Across Australia,
Aboriginal people have a significantly higher prevalence of diabetes than the general population
(O'Dea et al, 1993; Hoy et al, 2007) and certain overseas-born Australians have a higher
prevalence of diabetes than people born in Australia (Colagiuri et al, 2007; Australian Institute of
Health and Welfare, 2008).

Type 2 Diabetes Guideline 90 Primary Prevention, December 2009
Evidence – Cost effectiveness and socio economic implications
Cost of prevention of type 2 diabetes
Lifestyle modification can prevent or delay the development of diabetes at costs
acceptable to society.
The DPP demonstrated that intensive lifestyle and metformin interventions reduced the incidence
of type 2 diabetes compared with a placebo intervention. Herman et al. (2005) described the
direct medical costs, direct non-medical costs, and indirect costs of the placebo, metformin, and
intensive lifestyle interventions over the 3-year study period of the DPP interventions to prevent
or delay type 2 diabetes. Research costs were excluded. The direct medical cost of laboratory
tests to identify one subject with IGT was US$139. Over 3 years, the direct medical costs of the
interventions were US$79 per participant in the placebo group, US$2,542 in the metformin
group, and US$2,780 in the lifestyle group. The direct medical costs of care outside the DPP
were US$272 less per participant in the metformin group and US$432 less in the lifestyle group
compared with the placebo group. Direct non-medical costs were US$9 less per participant in the
metformin group and US$1,445 greater in the lifestyle group compared with the placebo group.
Indirect costs were US$230 greater per participant in the metformin group and US$174 less in
the lifestyle group compared with the placebo group. From the perspective of a health system, the
cost of the metformin intervention relative to the placebo intervention was US$2,191 per
participant and the cost of the lifestyle intervention was $2,269 per participant over 3 years. From
the perspective of society, the cost of the metformin intervention relative to the placebo
intervention was US$2,412 per participant and the cost of the lifestyle intervention was
US$3,540 per participant over 3 years. This study demonstrated that the metformin and lifestyle
interventions are associated with modest incremental costs compared with the placebo
intervention.
Cost effectiveness of prevention of type 2 diabetes
Lifestyle modification interventions are cost-effective and cost saving in people at
high risk of developing diabetes.
Metformin and acarbose are cost-effective pharmacological interventions in people
at high risk of developing diabetes
Lifestyle modification interventions are often more cost-effective than
pharmacological interventions
Cost-effectiveness of life style modification interventions and metformin improves
when the interventions are implemented in routine clinical practice
Several studies have assessed the cost-effectiveness of the interventions used in the US DPP on
health and economic outcomes (DPP Research Group, 2003; Palmer et al, 2004; Eddy et al, 2005;
Type 2 Diabetes Guideline 91 Primary Prevention, December 2009
Herman et al, 2005; Ackermann et al, 2006). The DPP group (2003) performed cost utility
analyses with the interventions as implemented in the DPP and as they might be implemented in
clinical practice from a health system perspective that considered direct medical costs only and a
societal perspective that considered direct medical costs, direct non-medical costs, and indirect
costs. This study demonstrated that the lifestyle and metformin interventions required more
resources than the placebo intervention from a health system perspective, and over 3 years they
cost approximately US $2,250 more per participant. As implemented in the DPP and from a
societal perspective, the lifestyle and metformin interventions cost US $ 24,400 and US $ 34,500,
respectively, per case of diabetes delayed or prevented and US $51,600 and US $ 99,200 per
quality-adjusted life-year (QALY) gained. As the interventions might be implemented in routine
clinical practice and from a societal perspective, the lifestyle and metformin interventions cost
US $ 13,200 and US $14,300, respectively, per case of diabetes delayed or prevented and US
$27,100 and US $ 35,000 per QALY gained. From a health system perspective, costs per case of
diabetes delayed or prevented and costs per QALY gained tended to be lower. These findings
suggest that over 3 years, the lifestyle and metformin interventions were effective and were cost-
effective from the perspective of a health system and society. Both interventions are likely to be
affordable in routine clinical practice, especially if implemented in a group format and with
generic medication pricing.
More recently, Herman et al (2005) estimated the lifetime cost-utility of the US DPP
interventions using a Markov simulation model to estimate progression of disease, costs, and
quality of life. The target population were DPP participants 25 years of age. Outcome measures
were cumulative incidence of diabetes, microvascular and neuropathic complications,
cardiovascular complications, survival, direct medical and direct non-medical costs, QALYs, and
cost per QALY. The base-case analysis show that compared with the placebo intervention, the
lifestyle and metformin interventions were estimated to delay the development of type 2 diabetes
by 11 and 3 years, respectively, and to reduce the absolute incidence of diabetes by 20% and 8%,
respectively. The cumulative incidence of microvascular, neuropathic, and cardiovascular
complications were reduced and survival was improved by 0.5 and 0.2 years. Compared with the
placebo intervention, the cost per QALY was approximately US$1,100 for the lifestyle
intervention and US$31,300 for the metformin intervention. From a societal perspective, the
interventions cost approximately US$8,800 and US$29,900 per QALY, respectively. From both
perspectives, the lifestyle intervention dominated the metformin intervention. The sensitivity
analysis demonstrated that the cost-effectiveness improved when the interventions were
implemented as they might be in routine clinical practice, the lifestyle intervention was cost-
effective in all age groups, and the metformin intervention did not represent good use of
resources for persons older than 65 years of age. However the authors acknowledged the
limitation of analysis including simulation results depend on the accuracy of the underlying
assumptions, including participant adherence.
Ackermann and co-workers (2006) explored whether the US DPP lifestyle intervention could be
offered in a way that allows return on investment for private health insurers while remaining
attractive for consumers, employers, and US Medicare (Ackermann et al, 2006). They used the
DPP and other published reports to build a Markov simulation model to estimate the lifetime
progression of disease, costs, and quality of life for adults with impaired glucose tolerance. The
model assumed a health-payer perspective and compared DPP lifestyle and placebo interventions.
Primary outcomes included cumulative incidence of diabetes, direct medical costs, quality-
Type 2 Diabetes Guideline 92 Primary Prevention, December 2009
adjusted life-years (QALYs), and cost per QALY gained. This study shows that compared with
placebo, providing the lifestyle intervention at age 50 years could prevent 37% of new cases of
diabetes before age 65, at a cost of $1,288 per QALY gained. A private payer could reimburse
US$655 (24%) of the US$2,715 in total discounted intervention costs during the first 3
intervention years and still recover all of these costs in the form of medical costs avoided. If
Medicare paid up to US$2,136 in intervention costs over the 15-year period before participants
reached age 65, it could recover those costs in the form of future medical costs avoided beginning
at age 65. The authors concluded that cost-sharing strategies to offer the DPP lifestyle
intervention for eligible people between ages 50 and 64 could provide financial return on
investment for private payers and long-term benefits for Medicare.
Another cost-effectiveness analysis using the Archimedes model was conducted by Eddy et al
(2005) and compared no prevention, the DPP lifestyle modification program, lifestyle
modification begun after a person develops diabetes, and metformin and reached a different
conclusion. They used data from published basic and epidemiologic studies, clinical trials, and
Kaiser Permanente administrative data. They included adults at high risk for diabetes,
specifically, BMI >24 kg/m2, fasting plasma glucose level of 5.3 to 6.9 mmol/L and 2-hour
glucose tolerance test result of 7.8 to 11.0 mmol/L. Compared with no prevention program, the
DPP lifestyle program would reduce a high-risk person's 30-year chances of developing diabetes
from about 72% to 61%, the chances of a serious complication from about 38% to 30%, and the
chances of dying of a complication of diabetes from about 13.5% to 11.2%. Metformin would
deliver about one third the long-term health benefits achievable by immediate lifestyle
modification. Compared with not implementing any prevention program, the expected 30-year
cost/QALY of the DPP lifestyle intervention from the health plan's perspective would be about
US$143,000. From a societal perspective, the cost/QALY of the lifestyle intervention compared
with doing nothing would be about US$62,600. Either using metformin or delaying the lifestyle
intervention until after a person develops diabetes would be more cost-effective, costing about
US$35,400 or US$24,500 per QALY gained, respectively, compared with no program.
Compared with delaying the lifestyle program until after diabetes is diagnosed, the marginal cost-
effectiveness of beginning the DPP lifestyle program immediately would be about US$201,800.
Compared with no program, lifestyle modification for high-risk people can be made cost-saving
over 30 years if the annual cost of the intervention can be reduced to about US$100. However,
the authors suggested that the program used in the DPP study may be too expensive for health
plans or a national program to implement and recommended less expensive methods are needed
to achieve the degree of weight loss seen in the DPP.
To establish whether implementing the active treatments used in the US DPP would be cost-
effective in Australia, France, Germany, Switzerland, and the UK, Palmer et al. (2004) used a
Markov model and simulated 3 states - IGT, type 2 diabetes, and deceased. They used
probabilities from the DPP and published data. Country-specific direct costs were used
throughout. Assuming only within-trial effects and costs of interventions, both metformin and
intensive lifestyle changes improved life expectancy versus control. Mean improvements in non-
discounted life expectancy were 0.11 and 0.22 years for metformin and intensive lifestyle
changes, respectively. Both interventions were associated with cost savings versus control in all
countries except the UK, where a small increase in costs was observed in both intervention arms.
When a lifetime effect of interventions was assumed, incremental improvements in life
expectancy were 0.35 and 0.90 years for metformin and intensive lifestyle changes, respectively.
Type 2 Diabetes Guideline 93 Primary Prevention, December 2009
Results were sensitive to probabilities of developing type 2 diabetes, the projected long-term
duration of effect of interventions after the 3-year trial period, the relative risk of mortality for
type 2 diabetes compared with IGT, and the costs of implementing the interventions. The authors
concluded that incorporation of the DPP interventions into clinical practice in 5 developed
countries was projected to lead to an increase in diabetes free years of life, improvements in life
expectancy, and either cost savings or minor increases in costs compared with standard lifestyle
advice in a population with IGT (Palmer et al, 2004). However this study did not include the
costs of screening to detect people with IGT.
The health benefits and costs of a national diabetes screening and prevention scenario were
estimated among Australians ages 45-74 (Colagiuri & Walker, 2008). The Australian Diabetes
Cost-Benefit Model was used to compare baseline and scenario outcomes from 2000 to 2010.
People at high risk of developing diabetes (IGT or IFG) were offered lifestyle intervention,
reducing the numbers developing diabetes. Among those at high risk, 53,000 avoided developing
diabetes by 2010. Average yearly intervention and incremental treatment cost was AU$179
million, with a cost per disability-adjusted life-year of AU$50,000.
Icks et al (2007) assessed the cost-effectiveness of the primary prevention of type 2 diabetes
using population-based data (KORA Survey in Augsburg, Germany, total population
approximately 600,000). The researchers used a decision analytic model, time horizon 3 years to
compare staff education, targeted screening and lifestyle modification or metformin in people
aged 60-74 years with a BMI ≥ 24 kg/m2 and pre-diabetic status (fasting glucose 5.3-6.9 mmol/l
and 2-h post load glucose 7.8-11.0 mmol/l) according to the US DPP trial. The main outcome
measures were cases of type 2 diabetes prevented, cost (Euro), and incremental cost-effectiveness
ratios (ICERs). Under model assumptions, 14,908 people in the target population would develop
diabetes if there was no intervention, 184 cases would be avoided with lifestyle intervention and
42 cases with metformin intervention. From the perspective of statutory health insurance and
society, costs for lifestyle modification were 856,507 euro and 4,961,340 euro, respectively, and
for metformin 797,539 euro and 1,335,204 euro. Up to 5% of the costs were due to staff
education and up to 36% to screening. Lifestyle was more cost effective than metformin. ICERs
for lifestyle vs. 'no intervention' were 4664 euro and 27,015 euro per case prevented from the
statutory health insurance and societal perspective. This study suggests that the total cost and cost
per case of diabetes avoided is high.
Jacobs-van der Bruggen et al (2007) explored the long-term health benefits and cost-effectiveness
of both a community-based lifestyle program for the general population (community
intervention) and an intensive lifestyle intervention for obese adults, implemented in a health care
setting (health care intervention). Researchers estimated short-term intervention effects on BMI
and physical activity from the international literature. The National Institute for Public Health
and the Environment Chronic Diseases Model was used to project lifetime health effects and
effects on health care costs for minimum and maximum estimates of short-term intervention
effects. Cost-effectiveness was evaluated from a health care perspective and included
intervention costs and related and unrelated medical costs. Effects and costs were discounted at
1.5 and 4.0% annually. The analysis highlighted that one new case of diabetes per 20 years was
prevented for every 7-30 participants in the health care intervention and for every 300-1,500
adults in the community intervention. Intervention costs needed to prevent one new case of
diabetes (per 20 years) were lower for the community intervention (euro 2,000-9,000) than for

Type 2 Diabetes Guideline 94 Primary Prevention, December 2009
the health care intervention (euro 5,000-21,000). The cost-effectiveness ratios were euro 3,100-
3,900 per QALY for the community intervention and euro 3,900-5,500 per QALY for the health
care intervention. The authors concluded that health care interventions for high-risk groups and
community-based lifestyle interventions targeted to the general population (low risk) are both
cost-effective ways of curbing the growing burden of diabetes.
Lindgren et al (2007) developed a simulation model to assess the economic consequences of an
intervention like the one studied in the Finnish Diabetes Prevention Study (DPS) in a Swedish
setting. The model used data from the trial itself to assess the effect of intervention on the risk of
diabetes and on risk factors for cardiovascular disease. Results from the UKPDS were used to
estimate the risk of cardiovascular disease and stroke. Cost data were derived from Swedish
studies. The intervention was assumed to be applied to eligible people from a population-based
screening program of 60-year-olds in the County of Stockholm from which the baseline
characteristics of the subjects were used. The model predicted that implementing the program
would be cost-saving from the healthcare payers' perspective. Furthermore, it was associated with
an increase in estimated survival of 18 years. Taking into consideration the increased health
resource utilisation by subjects due to their longer survival, the predicted cost-effectiveness ratio
was 2,363 euro per QALY gained.
Cost-effectiveness of the interventions in the Indian Diabetes Prevention Programme (IDPP) was
reported by Ramachandran et al (2007). Relative effectiveness and costs of interventions (Life
Style Modification [LSM], metformin, and LSM and metformin) in the IDPP were estimated
from the health care system perspective. Costs of intervention considered were only the direct
medical costs. Direct non-medical, indirect, and research costs were excluded. The cost-
effectiveness of interventions was measured as the amount spent to prevent one case of diabetes
within the 3-year trial period. The results of this study show that the direct medical cost to
identify one subject with IGT was US$117. Direct medical costs of interventions over the 3-year
trial period were US$61 per subject in the control group, US$225 with LSM, US$220 with
metformin, and US$270 with LSM and metformin. The number of individuals needed to treat to
prevent a case of diabetes was 6.4 with LSM, 6.9 with metformin, and 6.5 with LSM and
metformin. Cost-effectiveness to prevent one case of diabetes with LSM was US$1,052, with
metformin US$1,095, and with LSM and metformin US$1,359. Similar to other cost-
effectiveness studies in Western societies, LSM and metformin were cost-effective interventions
for preventing diabetes among high risk-individuals in India.
To compare the health and economic outcomes of using acarbose, an intensive lifestyle
modification programme, metformin or no intervention to prevent progression to diabetes in
Canadian individuals with IGT, Caro et al (2004) developed a model to simulate the course of
individuals with IGT under each treatment strategy. Subjects remain in the IGT state or transition
from IGT to diabetes, to normal glucose tolerance (NGT) or to death. Effectiveness and resource
use data were derived from published intervention trials. A comprehensive health-care payer
perspective incorporating all major direct costs, reported in 2000 Canadian dollars, was adopted.
Caro et al estimated that over a decade, 70 of the 1000 untreated subjects are expected to die and
542 develop diabetes. Intensive lifestyle modification is estimated to prevent 117 cases of
diabetes, while metformin would prevent 52 and acarbose 74 cases. The proportion of those who
return to NGT also increases with any treatment. They also suggested that though lifestyle
modification is more effective, it can increase overall costs depending on how it is implemented,

Type 2 Diabetes Guideline 95 Primary Prevention, December 2009
whereas acarbose and metformin reduce costs by nearly Ca$1000 per subject. Lifestyle
modification was cost effective, varying from $749/life year gained (LYG) vs. no treatment to
about Ca$10,000/LYG vs. acarbose. Acarbose costs somewhat more than metformin, but is more
effective: Ca$1798/LYG. The results of this model suggest that the treatment of IGT in Canada is
a cost-effective way to prevent diabetes and may generate savings. Moreover, intensive lifestyle
modification, though more costly than pharmacological treatments, led to the greatest health
benefits at reasonable incremental costs.
The economic evidence for acarbose in the prevention of diabetes and cardiovascular events in
individuals with IGT have been reviewed by Josse et al (2006) and Quilici et al (Quilici et al,
2005). The economic analyses have been conducted for Spain, Germany, Sweden and Canada. In
Spain, acarbose was more effective and less costly (dominant) compared with placebo. In
Germany, the cost per subject free of diabetes was under 800 pounds; acarbose was dominant for
those at high risk for type 2 diabetes, CVD or both, and a similar outcome in the Swedish study
(Quilici et al, 2005). In Canada, acarbose was dominant compared with no intervention and very
cost-effective compared with metformin (C Dollars 1798/ LYG). The particularly cost-effective
outcomes or cost savings delivered by acarbose for IGT subjects at high risk for type 2 diabetes
and/or CVD suggest that acarbose is an economically attractive strategy for high-risk
individuals.

Type 2 Diabetes Guideline 96 Primary Prevention, December 2009
Socio economic implications
Interventions for preventing diabetes are equally effective in culturally specific
and low socio economic high-risk groups (Evidence Level II).
In the major diabetes prevention studies, the effectiveness of interventions has been shown to
apply across a wide range of cultural groups including China (Pan et al, 1997; Li et al, 2008) ,
India (Ramachandran et al, 2006) and Japan (Kosaka et al, 2005). Also in the US DPP, the largest
trial of primary prevention of diabetes, approximately half of the participants were African
American, Hispanic American, Asian American, or Native American. Over the 3 year study
period, the magnitude of risk reduction for developing diabetes in the lifestyle intervention group
was similar across all ethnic groups (Knowler et al, 2002).
Results from a recent systematic review of community based nutrition and physical activity
interventions targeting low income populations illustrated that interventions aimed at low income
groups tend to be delivered in an interactive visual format, to be culturally appropriate, to be
administered in accessible primary care settings and to provide incentives (Chaudhary & Kreiger,
2007).
McArthur et al (2001) conducted an exploratory study in the US on the socio-economic
implications of food labelling. Participants in federal food assistance programs (n=130) and low-
income non-participants (n=51) were interviewed about nutrition labels. Regarding label use,
35.4 % of participants and 45.1% of non-participants reported that they seldom/never read labels
while 33.1 % of participants and 35.3% of non-participants always/frequently read labels in the
grocery store. There were no significant differences between mean scores of participants and
non-participants on how to use the nutrition label. Nutritionists working with low-income
individuals need to provide more learning opportunities that teach how to use nutrition labels.
Sullivan (2003) conducted a similar but smaller qualitative study in Canada. The study used a
facilitated group approach and involved semi-structured open-ended questions which provided
flexibility and insight into how participants regarded the food label. The author found that low-
income consumers need assistance in understanding the total label and in overcoming distrust and
a suspicion that labels are deceptive. The author states that the food-buying challenge is greater
for low-income consumers due to a restricted food budget compounded by knowledge gaps and
food-label misunderstanding.

Type 2 Diabetes Guideline 97 Primary Prevention, December 2009
Summary - Cost effectiveness and socio-economic implications
Lifestyle interventions, metformin and acarbose are cost-effective in people at high risk of
developing diabetes.
RCTs have shown that lifestyle changes can prevent or delay the development of diabetes at
costs acceptable to society.
These models are based on assumptions regarding long term health outcomes.
Future lifestyle modification programs for low socio economic people at high risk of diabetes
are needed to generate evidence of its effectiveness and to inform implementation of such
interventions.
In absence of specific strategies targeting low socio economic people, strategies aimed at
general populations are recommended.

Type 2 Diabetes Guideline 98 Primary Prevention, December 2009
Evidence Tables: Section 4
Cost-effectiveness of prevention of type 2 diabetes
Author
(year)
Evidence
Level of Evidence
Quality Rating
Magnitude
of effect
Rating
Relevance
Rating Level Study Type
Ackermann et al
(2006)
N/A Modelling
(Markov Model) N/A N/A N/A
Caro et al (2004) N/A Modelling
(simulation model) N/A N/A N/A
Colagiuri &
Walker (2008)
N/A Modelling
(Cost-Benefit
Model)
N/A N/A N/A
DPP Research
Group (2003) II RCT High High High
Eddy et al (2005)
N/A Modelling
(Archimedes
Model)
N/A N/A N/A
Herman et al
(2005)
N/A Modelling
(Markov Model) N/A N/A N/A
Icks et al (2007)
N/A Modelling
(Decision Analytic
Model)
N/A N/A N/A
Jacobs-van der
Bruggen et al *
(2007)
N/A Modelling N/A N/A N/A
Josse et al (2006) N/A Review Low Medium Medium
Lindgren et al
(2007)
N/A Modelling
(simulation model) N/A N/A N/A
Palmer et al (2004) N/A Modelling
(Markov Model) N/A N/A N/A
Quilici et al (2005) II RCT High High High
Ramachandran et
al (2007) II RCT High High Medium
* The National Institute for Public Health and the Environment Chronic Diseases
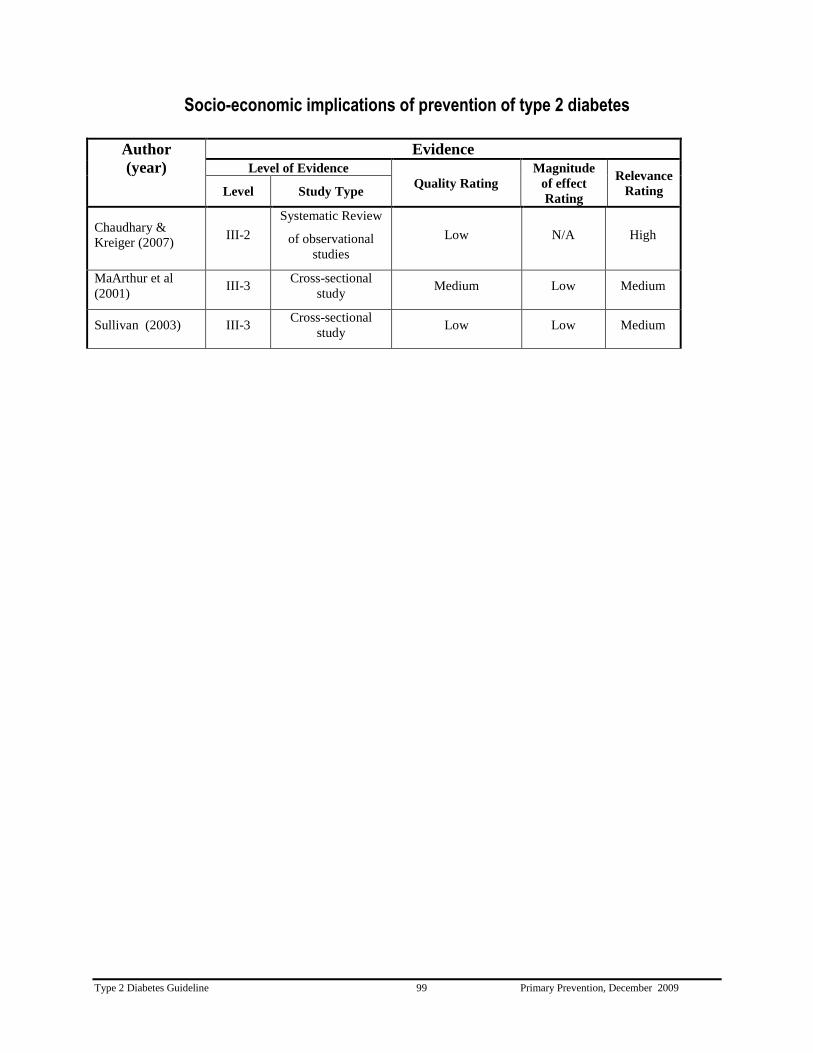
Type 2 Diabetes Guideline 99 Primary Prevention, December 2009
Socio-economic implications of prevention of type 2 diabetes
Author
(year)
Evidence
Level of Evidence
Quality Rating
Magnitude
of effect
Rating
Relevance
Rating Level Study Type
Chaudhary &
Kreiger (2007) III-2
Systematic Review
of observational
studies
Low N/A High
MaArthur et al
(2001) III-3
Cross-sectional
study Medium Low Medium
Sullivan (2003) III-3 Cross-sectional
study Low Low Medium

Type 2 Diabetes Guideline 100 Primary Prevention, December 2009
References
Abuissa H, Bell D, O'Keefe J (2005). Strategies to prevent type 2 diabetes. Curr Med Res Opin
21:1107-1114.
Ackermann R, Marrero D, Hicks K, Hoerger T, Sorensen S, Zhang P, Engelgau M, Ratner R,
Herman W (2006). An evaluation of cost sharing to finance a diet and physical activity
intervention to prevent diabetes. Diabetes Care 29(6):1237-1241.
Aekplakorn W, Bunnag P, Woodward M, Sritara P, Cheepudomwit S, Yamwong S, Yipintsoi T,
Rajatanavin R (2006). A risk score for predicting incident diabetes in the Thai population.
Diabetes Care 29(8):1872-1877.
AHRQ (2000). Efficacy of interventions to modify dietary behaviour related to cancer risk.
Agency for Healthcare Research and Quality, Rockville, MD: INo.25. AHRQ Publication No.
01-E028.
Andreasen A (1995). Marketing Social Change: Changing Behavior to Promote Health, Social
Development, and the Environment. San Francisco, CA: Jossey-Bass.
Ashfield-Watt P (2006). Fruits and vegetables, 5+ a day: are we getting the message across? Asia
Pacific Journal of Clinical Nutrition 15(2):245-252.
Ashfield-Watt P, Welch A, Godward S, Bingham S (2007). Effect of a pilot community
intervention on fruit and vegetable intakes: Use of FACET (Five-a-day Community Evaluation
Tool). Public Health Nutrition 10(7):671-680.
Attvall S, Fowelin J, Lager I, Von Schenck H, Smith U (1993). Smoking induces insulin
resistance--a potential link with the insulin resistancesyndrome. J Intern Med. 233:327-332.
Auchincloss A, Diez Roux A, Brown D, Erdmann C, Bertoni A (2008). Neighborhood resources
for physical activity and healthy foods and their association with insulin resistance.
Epidemiology 19(1):146-157.
Australian Institute of Health and Welfare A (2008). Diabetes. Australian Facts 2008. Australian
Institute of Health and Welfare, Canberra: IDiabetes Series No. 8.
Bako A, Morad S, Atiomo W (2005). Polycystic ovary syndrome: an overview. Rev in Gynaecol
Pract 5:115-122.
Bala M, Strzeszynski L, Cahill K (2008). Mass media interventions for smoking cessation in
adults. Cochrane Database of Systematic Reviews (1):CD004704.

Type 2 Diabetes Guideline 101 Primary Prevention, December 2009
Barker D, Hales C, Fall C, Osmond C, Phipps K, Clark P (1993). Type 2 (non-insulin-dependent)
diabetes mellitus, hypertension and hyperlipidaemia (syndrome X): relation to reduced fetal
growth. Diabetologia 36:62-67.
Barry E, Magliano D, Zimmet P, Polkinghorne K, Atkins R, Dunstan D, Maurray S, Shaw J
(2006). AusDiab 2005. The Australian Diabetes, Obesity and Lifestyle Study. International
Diabetes Institute, Melbourne, Australia.
Bassuk S & Manson J (2005). Epidemiological evidence for the role of physical activity in
reducing risk of type 2 diabetes and cardiovascular disease. J Appl Physiol 99:1193-1204.
Bauman A, Bellew B, Owen N, Vita P (2001). Impact of an Australian mass media campaign
targeting physical activity in 1998. American Journal of Preventive Medicine 21(1):41-47.
Bauman A, McLean G, Hurdle D, Walker S, Boyd J, van Aalst I, Carr H (2003). Evaluation of
the national 'Push Play' campaign in New Zealand--creating population awareness of physical
activity. New Zealand Medical Journal 116(1179):U535.
Beaudoin C, Fernandez C, Wall J, Farley T (2007). Promoting healthy eating and physical
activity short-term effects of a mass media campaign. American Journal of Preventive Medicine
32(3):217-223.
Braeckman L, De Bacquer D, Maes L, De Backer G (1999). Effects of a low-intensity worksite-
based nutrition intervention. Occupational medicine 49(8):549-555.
Brancatisano A, Wahlroos S, Matthews S, Brancatisano R (2008). Gastric banding for the
treatment of type 2 diabetes mellitus in morbidly obese. Surgery for Obesity & Related Diseases
4(3):423-429.
Briggs A, Sculpher M, Buxton M (1994). Uncertainty in the economic evaluation of health care
technologies: The role of sensitivity analysis. Health Economics 3(2):95-104.
Brown J (2002). Mass media influences on sexuality. Journal of Sex Research 39(1):42-45.
Brownson R, Haire-Joshu D, Luke D (2006). Shaping the Context of Health: A review of
environmental and policy approaches in the prevention of chronic diseases. Annual Review of
Public Health 27: 341-370.
Burnet D, Elliott L, Quinn M, Plaut A, Schwartz M, Chin M (2006). Preventing diabetes in the
clinical setting. Journal of General Internal Medicine 21(1):84-93.
Cameron A, Magliano D, Zimmet P, Welborn T, Colagiuri S, Tonkin A, Shaw J (2008). The
metabolic syndrome as a tool for predicting future diabetes: the AusDiab study. J Intern Med
264(2):177-86.
Candib L (2007). Obesity and diabetes in vulnerable populations: reflection on proximal and
distal causes. Annals of Family Medicine 5(6):547-556.
Type 2 Diabetes Guideline 102 Primary Prevention, December 2009
Caro J, Getsios D, Caro I, Klittich W, O'Brien J (2004). Economic evaluation of therapeutic
interventions to prevent type 2 diabetes in Canada. Diabetic Medicine 21(11): 1229-1236.
Carter J, Pugh J, Monterrosa A (1996). Non-insulin-dependent diabetes mellitus in minorities in
the United States. Annals of Internal Medicine 125(3):221-232.
Cavill N (1998). National campaigns to promote physical activity: can they make a difference?
International Journal of Obesity & Related Metabolic Disorders: Journal of the International
Association for the Study of Obesity 22 Suppl 2:S48-51.
Cavill N & Bauman A (2004). Changing the way people think about health-enhancing physical
activity: do mass media campaigns have a role?. Journal of Sports Sciences 22(8):771-790.
Chen L, Magliano DJ, Balkau B, Colagiuri S, Zimmet PZ, Tonkin AM, Mitchell P, Phillips PJ,
Shaw JE (2009). An Australian type 2 diabetes risk assessment tool based on demographic,
lifestyle and simple anthropometric measures. Med J Aust (in press).
Chaudhary N & Kreiger N (2007). Nutrition and physical activity interventions for low-income
populations. Canadian Journal of Dietetic Practice and Research 68(4):201-206.
Ciliska D, Miles E, O'Brien M, Turl C, Tomasik H, Donovan U, Beyers J (2000). Effectiveness
of community-based interventions to increase fruit and vegetable consumption. Journal of
Nutrition Education 32(6):341-352.
Cochrane T & Davey R (2008). Increasing uptake of physical activity: a social ecological
approach. Journal of the Royal Society for the Promotion of Health 128(1):31-40.
Colagiuri R, Colagiuri S, Yach D, Pramming S (2006). The answer to diabetes prevention:
science, surgery, service delivery, or social policy? American Journal of Public Health
96(9):1562-1569.
Colagiuri R, Thomas M, Buckley A (2007). Preventing Type 2 Diabetes in Culturally and
Linguistically Diverse Communities in NSW. NSW Department of Health, Sydney, Australia.
Colagiuri S, Colagiuri R, Conway B, Grainger D, Davy P (2003). DiabCo$ Australia: Assessing
the burden of type 2 diabetes in Australia. Diabetes Australia, Canberra.
Colagiuri S & Walker A (2008). Using an economic model of diabetes to evaluate prevention and
care strategies in Australia. Health Affairs 27(1):256-268.
Contento I, Balch G, Bronner Y, Lytle L, Maloney S, Olson C, Swadener S (1995). Effectiveness
of nutrition education and implications for nutrition education policy, programs and research: a
review of research. Journal of Nutrition Education 27(6):191.
Cowburn G & Stockley L (2005). Consumer understanding and use of nutrition labelling: a
systematic review. Public Health Nutrition 8(1):21-28.

Type 2 Diabetes Guideline 103 Primary Prevention, December 2009
Cowburn G & Stockley L (2003). A systematic review on the research on consumer
understanding of nutrition labelling. European Heart Network, Brussels, Belgium.
Craig M, Femia G, Broyda V, Lloyd M, Howard N (2007). Type 2 diabetes in Indigenous and
non-Indigenous children and adolescents in New South Wales. Med J Aust 186:497-499.
Cugati S, Wang JJ, Rochtchina E, Mitchell P (2007). Ten-year incidence of diabetes in older
Australians: the Blue Mountains Eye Study. Med J Aust 186: 131-135.
Curtis J & Wilson C (2005). Preventing type 2 diabetes. J Am Board Fam Pract 18:37-43.
Cutler DM, Glaeser EL, Shapiro JM (2003). Why Have Americans Become More Obese? The
Journal of Economic Perspectives 17(3):93-118.
De Cocker KA, De Bourdeaudhuij IM, Brown WJ, Cardon GM (2007). Effects of "10,000 Steps
Ghent". A Whole-Community Intervention. American Journal of Preventive Medicine 33(6):455-
463.
Dhingra R, Sullivan L, Jacques P, Wang T, Fox CS, Meigs J, D'Agostino R, Gaziano J, Vasan R
(2007). Soft drink consumption and risk of developing cardiometabolic risk factors and the
metabolic syndrome in middle-aged adults in the community. Circulation. 116::480-488.
Dittmar M, Heintz A, Hardt J, Egle UT, Kahaly GJ (2003). Metabolic and psychosocial effects of
minimal invasive gastric banding for morbid obesity. Metabolism: Clinical & Experimental
52(12):1551-1557.
Dixon H, Borland R, Segan C, Stafford H, Sindall C (1998). Public reaction to Victoria's "2 Fruit
'n' 5 Veg Every Day" campaign and reported consumption of fruit and vegetables. Preventive
Medicine 27(4):572-582.
Dixon HG, Lagerlund M, Spittal MJ, Hill DJ, Dobbinson SJ, Wakefield MA (2008). Use of sun-
protective clothing at outdoor leisure settings from 1992 to 2002: serial cross-sectional
observation survey. Cancer Epidemiology, Biomarkers & Preve 17:428-434
DPP (Diabetes Prevention Program) Research Group (2003). Within-trial cost-effectiveness of
lifestyle intervention or metformin for the primary prevention of type 2 diabetes. Diabetes Care
26(9):2518-2523.
DREAM (Diabetes Reduction Assessment with Ramipril and Rosiglitazone Medication) Trial
Investigators. Gerstein HC. Yusuf S. Bosch J. Pogue J. Sheridan P. Dinccag N. Hanefeld M.
Hoogwerf B. Laakso M. Mohan V. Shaw J. Zinman B. Holman RR (2006). Effect of
rosiglitazone on the frequency of diabetes in patients with impaired glucose tolerance or impaired
fasting glucose: a randomised controlled trial. Lancet 368(9541): 1096-105.
Drichoutis A, Lazaridis P, Nayga R (2006). Consumers' Use of Nutritional Labels: A Review of
Research Studies and Issues. Academy of Marketing Science 2006:1-26.
Type 2 Diabetes Guideline 104 Primary Prevention, December 2009
Dunstan D, Zimmet P, Welborn T, Sicree R, Armstrong T, Atkins R, Cameron A, Shaw J,
Chadban S, AusDiab Steering Committee (2001). Diabesity & associated disorders in Australia
2000. The accelerating epidemic. Australian Diabetes, Obesity & Lifestyle Report. International
Diabetes Institute, Melbourne, Australia.
Dunstan D, Zimmet P, Welborn T, De Courten M, Cameron A, Sicree R, Dwyer T, Colagiuri S,
Jolley D, Knuiman M, Atkins R, Shaw J (2002). The rising prevalence of diabetes and impaired
glucose tolerance: the Australian Diabetes, Obesity and Lifestyle Study. Diabetes Care
25(5):829-834.
Eckel R, Grundy S, Zimmet P (2005). The metabolic syndrome. Lancet 365(9468):1415-1428.
Eddy D, Schlessinger L, Kahn R (2005). Clinical outcomes and cost-effectiveness of strategies
for managing people at high risk for diabetes. Annals of Internal Medicine 143(4):251-264.
Engbers L, van Poppel M, Chin A, Paw M, van Mechelen W (2005). Worksite health promotion
programs with environmental changes: a systematic review. American Journal of Preventive
Medicine 29(1):61-70.
Engelgau M, Colagiuri S, Ramachandran A, Borch-Johnsen K, Narayan V (2004). Prevention of
Type 2 Diabetes: Issues and Strategies for Identifying Persons for Interventions Diabetes
Technology and Therapeutics 6:874-882.
Englert H, Diehl H, Greenlaw R, Willich S, Aldana S (2007). The effect of a community-based
coronary risk reduction: the Rockford CHIP. Preventive Medicine 44(6):513-519.
Fabiansson SU (2006). Precision in nutritional information declarations on food labels in
Australia. Asia Pacific Journal of Clinical Nutrition 15(4):451-458.
Facchini F, Hollenbeck C, Jeppesen J, Chen Y, Reaven G (1992). Insulin resistance and cigarette
smoking. Lancet 339 (8802):1128-1130.
Faith MS, Fontaine KR, Baskin ML, Allison DB (2007). Toward the reduction of population
obesity: macrolevel environmental approaches to the problems of food, eating, and obesity.
Psychological Bulletin 133(2):205-226.
Farrelly M, Niederdeppe J, Yarsevich J (2003). Youth tobacco prevention mass media
campaigns: past, present, and future directions. Tobacco Control 12 (Suppl 1):i35-47.
Ferchak C & Meneghini L (2004). Obesity, bariatric surgery and type 2 diabetes-a systematic
review. Diab Metab Res Rev 20:438-445.
Feunekes GIJ, Gortemaker IA, Willems AA, Lion R, van den Kommer M (2008). Front-of-pack
nutrition labelling: testing effectiveness of different nutrition labelling formats front-of-pack in
four European countries. Appetite 50(1):57-70.

Type 2 Diabetes Guideline 105 Primary Prevention, December 2009
Finlay S & Faulkner G (2005). Physical activity promotion through the mass media: inception,
production, transmission and consumption (Structured abstract). Preventive Medicine 40(2):121-
130.
Fisher E, Walker E, Bostrom A, Fischhoff B, Haire-Joshu D, Johnson S (2002). Behavioral
science research in the prevention of diabetes : status and opportunities. Diabetes Care 25(3):599-
606.
Foerster S, Kizer K, DiSogra L, Bal D (1995). California's "5 a Day --for Better Health"
Campaign: An innovative population-based effort to effect large-scale dietary change. American
Journal of Preventive Medicine 11(2) 124-131.
Fogelholm M & Lahti Koski M (2002). Community health-promotion interventions with physical
activity: does this approach prevent obesity? Scandinavian Journal of Nutrition 46(4):173-177.
Franks P, Mesa J, Harding A, Wareham N (2007). Gene-lifestyle interaction on risk of type 2
diabetes. Nutrition, Metab Cardiovasc Diseases 17:104-124.
Frayling T (2007). Genome-wide association studies provide new insights into type 2 diabetes
aetiology. Nat Rev Genet 8:657-662.
Fung T, Hu F, Pereira M, Liu S, Stampfer M, Colditz G, Willett W (2002). Whole-grain intake
and the risk of type 2 diabetes: a prospective study in men. Am J Clin Nutr 76:535-540.
Gebel K, King L, Bauman A, Vita P, Gill T, Rigby A, Capon A (2005). Creating healthy
environments: A review of links between the physical environment, physical activity and obesity.
Sydney: NSW Health Department and NSW Centre for Overweight and Obesity.
Gill T, King L, Webb K (2005). Best options for promoting healthy weight and preventing
weight gain in NSW. NSW Centre for Public Health Nutrition and the NSW Department of
Health.
Gillies CL, Abrams KR, Lambert PC, Cooper NJ, Sutton AJ, Hsu RT, Khunti K (2007).
Pharmocological and lifestyle interventions to prevent or delay type 2 diabetes in people with
impaired glucose tolerance: systematic review and meta-analysis. BMJ 334(7588):299.
Golden S (2007). A review of the evidence for a neuroendocrine link between stress, depression
and diabetes mellitus. Curr Diabetes Rev 3:252-259.
Gordon R, McDermott L, Stead M, Angus K (2006). The effectiveness of social marketing
interventions for health improvement: what's the evidence? Public Health 120(12):1133-1139.
Grant JF, Chittleborough CR, Taylor AW, Grande ED, Wilson DH, Phillips PJ, Adams RJ,
Cheek J, Price K, Gill T, Ruffin RE (2006). The North West Adelaide Health Study: detailed
methods and baseline segmentation of a cohort for selected chronic diseases. Epidemiol Perspect
Innov 3: 4.

Type 2 Diabetes Guideline 106 Primary Prevention, December 2009
Grier S & Bryant C (2005). Social marketing in public health. Annual Review of Public Health
26:319-339.
Grunert K (2006). A review of research on consumer response to nutrition information on food
labels. European Heart Network Brussels, Belgium.
Hamburg N, McMackin C, Huang A, Shenouda S, Widlansky M, Schulz E, Gokce N, Ruderman
N, Keaney J, Vita J (2007). Physical inactivity rapidly induces insulin resistance and
microvascular dysfunction in healthy volunteers. Arterioscler Thromb Vasc Biol. 27:2650-2656.
Hamman R, Wing R, Edelstein S, Lachin J, Bray G, Delahanty L, Hoskin M, Kriska A, Mayer-
Davis E, Pi-Sunyer X, Regensteiner J, Venditti B, Wylie-Rosett J, Group DPPR (2006). Effect of
weight loss with lifestyle intervention on risk of diabetes. Diabetes Care 29:2102-2107.
Herman W, Hoerger T, Brandle M, Hicks K, Sorensen S, Zhang P, Hamman R, Ackermann R,
Engelgau M, Ratner R (2005). The cost-effectiveness of lifestyle modification or metformin in
preventing type 2 diabetes in adults with impaired glucose tolerance. Annals of Internal Medicine
142(5):323-332.
Hider P (2001). Environmental interventions to reduce energy intake or density: A critical
appraisal of the literature. NZHTA Report 2001; 4(2).
Higginson CS, Rayner MJ, Draper S, Kirk TR (2002). The nutrition label--which information is
looked at? Nutrition and Food Science 32(2/3):92.
Hillsdon M & Thorogood M (1996). A systematic review of physical activity promotion
strategies. British Journal of Sports Medicine 30(2):84-89.
Hillsdon M, Cavill N, Nanchahal K, Diamond A, White IR (2001). National level promotion of
physical activity: results from England's ACTIVE for LIFE campaign. Journal of Epidemiology
and Community Health 55(10):755-761.
Hodge A, English D, O'Dea K, Giles G (2007). Dietary patterns and diabetes incidence in the
Melbourne Collaborative CohortStudy. Am J Epidemiol 165:603-610.
Hoy W, Kondalsamy-Chennakesavan S, Wang Z, Briganti E, Shaw J, Polkinghorne K, Chaban S,
group TAS (2007). Quantifying the excess risk for proteinuria, hypertension and diabetes in
Australian Aborigines: comparison of profiles in three remote communities in the Northern
Territory with those in the AusDiab study. Aust NZ J Public Health 31:177-183.
Hunt K & Schuller K (2007). The increasing prevalence of diabetes in pregnancy. Obstet
Gynecol Clin North Am 34:173-199.
Hutubessy R, Chisholm D, Edejer T (2003). Generalized cost-effectiveness analysis for national-
level priority-setting in the health sector. bioMed Cintral Cost Effectiveness and Resource
Allocation: http://www.resource-allocation.com/content/1/1/8.

Type 2 Diabetes Guideline 107 Primary Prevention, December 2009
Icks A, Rathmann W, Haastert B, Gandjour A, Holle R, John J, Giani G, Group KS (2007).
Clinical and cost-effectiveness of primary prevention of Type 2 diabetes in a 'real world' routine
healthcare setting: model based on the KORA Survey 2000. Diabetic Medicine 24(5):473-480.
International Diabetes Federation (IDF) (2006). Diabetes Atlas. 3rd
edition, International Diabetes
Federation, Brussels, Belgium.
Jacobs-van der Bruggen MAM, Bos G, Bemelmans WJ, Hoogenveen RT, Vijgen SM, Baan CA
(2007). Lifestyle interventions are cost-effective in people with different levels of diabetes risk:
results from a modeling study. Diabetes Care 30(1):128-134.
Josse R, McGuire A, Saal G (2006). A review of the economic evidence for acarbose in the
prevention of diabetes and cardiovascular events in individuals with impaired glucose tolerance.
International Journal of Clinical Practice 60(7):847-855.
Kahn E, Ramsey L, Brownson R, Heath G, Howze E, Powell K, Stone E, Rajab M, Corso P
(2002). The effectiveness of interventions to increase physical activity. A systematic review.
American Journal of Preventive Medicine 22(4 Suppl):73-107.
Kelly B, Hughes C, Chapman K, Louie J, Dixon H, King L (2008). Front-of-Packl Food
Labelling: Traffic Light Labelling Gets the Green Light. Cancer Council (on behalf of a
collaboration of Public Health and Consumer Research Groups), Sydney.
Kitzmiller J, Dang-Kilduff L, Taslimi M (2007). Gestational diabetes after delivery. Short-term
management and long-term risks. Diabetes Care 30 (Suppl 2):S225-235.
Knol M, Twist J, Beekman A, Heine R, Snoek F, Pouwer F (2006). Depression as a risk factor
for the onset of type 2 diabetes mellitus. A meta-analysis. Diabetologia 49:837-845.
Knowler W, Barrett-Connor E, Fowler S, Hamman R, Lachin J, Walker E, Nathan D, Diabetes
Prevention Program Research G (2002). Reduction in the incidence of type 2 diabetes with
lifestyle intervention or metformin. New England Journal of Medicine 346(6):393-403.
Kosaka K, Noda M, Kuzuya T (2005). Prevention of type 2 diabetes by lifestyle intervention: a
Japanese trial in IGT males. Diabetes Research & Clinical Practice 67(2):152-162.
Laaksonen D, Lakka H, Salonen J, Niskanen L, Rauramaa R, Lakka T (2002). Low levels of
leisure-time physical activity and cardiorespiratory fitness predict development of the metabolic
syndrome. Diabetes Care 25:612-618.
Laaksonen D, Lindstrom J, Lakka T, Eriksson J, Niskanen L, Wikstrom K, Aunola S, Keinanen-
Kiukaanniemi S, Laakso M, Valle T, Ilanne-Parikka P, Louheranta A, Hamalainen H, Rastas M,
Salminen V, Cepaitis Z, Hakumaki M, Kaikkonen H, Harkonen P, Sundvall J, Tuomilehto J,
Uusitupa M, Finnish diabetes prevention study (2005). Physical activity in the prevention of type
2 diabetes: the Finnish diabetes prevention study. Diabetes 54(1):158-165.

Type 2 Diabetes Guideline 108 Primary Prevention, December 2009
Li G, Zhang P, Wang J, Gregg E, Yang W, Gong Q, Li H, Li H, Jiang Y, An Y, Shuai Y, Zhang
B, Zhang J, Thompson T, Gerzoff R, Roglic G, Hu Y, Bennett P (2008). The long-term effect of
lifestyle interventions to prevent diabetes in the China Da Qing Diabetes Prevention Study: a 20-
year follow-up study. Lancet 371(9626):1783-1789.
Liberopoulos E, Tsouli S, Mikailidis D, Elisat M (2006). Preventing type 2 diabetes in high risk
patients: an overview of lifestyle and pharmacological measures. Curr Drug Targets 7:211-228.
Lindgren P, Lindstrom J, Tuomilehto J, Uusitupa M, Peltonen M, Jonsson B, de Faire U,
Hellenius ML, Group DPSS (2007). Lifestyle intervention to prevent diabetes in men and women
with impaired glucose tolerance is cost-effective. International Journal of Technology
Assessment in Health Care 23(2):177-183.
Lindstrom J & Tuomilehto J (2003). The diabetes risk score: a practical tool to predict type 2
diabetes risk. Diabetes Care 26(3):725-731.
Lindstrom J, Ilanne-Parikka P, Peltonen M, Aunola S, Eriksson J, Hemio K, Hamalainen H,
Harkonen P, Keinanen-Kiukaanniemi S, Laakso M, Louheranta A, Mannelin M, Paturi M,
Sundvall J, Valle TT, Uusitupa M, Tuomilehto J, Finnish Diabetes Prevention Study G (2006).
Sustained reduction in the incidence of type 2 diabetes by lifestyle intervention: follow-up of the
Finnish Diabetes Prevention Study. Lancet 368(9548):1673-1679.
Lorenzo C, Okoloise M, Williams K, Stern M, Haffner S (2003). The metabolic syndrome as
predictor of type 2 diabetes: the San Antonio Heart Study. Diabetes Care 26(11):3153-3159.
Lyle D, Hobba J, Lloyd K, Bennett D, George T, Giddings N, Griffin N, Chew P, Harris M,
Heading G (2008). Mobilising a rural community to lose weight: impact evaluation of the
WellingTonne Challenge. Australian Journal of Rural Health 16(2):80-85.
MacQueen KM, McLellan E, Metzger DS, Kegeles S, Strauss RP, Scotti R, Blanchard L, Trotter
RT, 2nd (2001). What is community? An evidence-based definition for participatory public
health. American Journal of Public Health 91(12):1929-1938.
Maddock J, Takeuchi L, Nett B, Tanaka C, Irvin L, Matsuoka C, Wood B (2006). Evaluation of a
statewide program to reduce chronic disease: The Healthy Hawaii Initiative, 2000-2004.
Evaluation and Program Planning 29(3):293-300.
Maddock J, Maglione C, Barnett J, Cabot C, Jackson S, Reger-Nash B (2007). State-wide
implementation of the 1% or less campaign. Health Education & Behavior 34(6) : 953-963.
Magliano D, Barr E, Zimmet P, Cameron A, Dunstan D, Colagiuri S, Jolley D, Owen N, Phillips
P, Tapp R, Welborn T, Shaw J (2008). Glucose indices, health behaviors, and incidence of
diabetes in Australia: the Australian Diabetes, Obesity and Lifestyle Study. Diabetes Care
31(2):267-272.
Magnusson R (2008). What's law got to do with it? Part 2: Legal strategies for healthier nutrition
and obesity prevention. Australia and New Zealand Health Policy 5(1):11.

Type 2 Diabetes Guideline 109 Primary Prevention, December 2009
Marcus B, Owen N, Forsyth L, Cavill N, Fridinger F (1998). Physical activity interventions using
mass media, print media, and information technology. American Journal of Preventive Medicine
15(4):362-378.
Marshall J, Hamman R, Baxter J (1991). High-fat, low-carbohydrate diet and the etiology of non-
insulin-dependent diabetes mellitus: the San Luis Valley Diabetes Study. American Journal of
Epidemiology 134(6):590-603.
McArthur L, Chamberlain V, Howard AB (2001). Behaviors, attitudes, and knowledge of low-
income consumers regarding nutrition labels. Journal of Health Care for the Poor & Underserved
12(4):415-428.
Merom D, Miller Y, Lymer S, Bauman A (2005). Effect of Australia's Walk to Work Day
campaign on adults' active commuting and physical activity behavior. American Journal of
Health Promotion 19(3):159-162.
Miles A, Rapoport L, Wardle J, Afuape T, Duman M (2001). Using the mass-media to target
obesity: an analysis of the characteristics and reported behaviour change of participants in the
BBC's 'Fighting Fat, Fighting Fit' campaign. Health Education Research 16(3):357-372.
Moses R, Shand J, Tapsell L (1997). The recurrence of gestational diabetes: could dietary
differences in fat intake be an explanation?. Diabetes Care 20(11):1647-1650.
Norberg M, Eriksson J, Lindahl B, Andersson C, Rolandsson O, Stenlund H, Weinehall L (2006).
A combination of HbA1c, fasting glucose and BMI is effective in screening for individuals at risk
of future type 2 diabetes: OGTT is not needed. Journal of Internal Medicine 260(3):263-271.
Norris S, Zhang X, Avenell A, Gregg E, Schmid C, Lau J (2005). Long-term non-
pharmacological weight loss interventions for adults with prediabetes. Cochrane Database of
Systematic Reviews (2):CD005270.
O'Dea K, Patel M, Kubisch D, Hopper J, Traianedes K (1993). Obesity, diabetes, and
hyperlipidemia in a central Australian aboriginal community with a long history of acculturation.
Diabetes Care 16: 1004-1010.
O'Keefe J, Gheewala N, O'Keefe J (2008). Dietary strategies for improving post-prandial glucose,
lipids, inflammation and cardiovascular health. J Am Coll Cardiol 51:249-255.
Ogilvie D, Egan M, Hamilton V, Petticrew M (2004). Promoting walking and cycling as an
alternative to using cars: systematic review. BMJ 329(7469):763-766.
Ogilvie D, Foster C, Rothnie H, Cavill N, Hamilton V, Fitzsimons C, Mutrie N (2007).
Interventions to promote walking: systematic review. BMJ 334(7605):1204-1207.
Padwal R, Varney J, Majumdar S, McAlister F, Johnson J (2005). A systematic review of drug
therapy to delay or prevent type 2 diabetes. Diabetes Care 28:736-744.

Type 2 Diabetes Guideline 110 Primary Prevention, December 2009
Palmer A, Roze S, Valentine W, Spinas G, Shaw J, Zimmet P (2004). Intensive lifestyle changes
or metformin in patients with impaired glucose tolerance: modeling the long-term health
economic implications of the diabetes prevention program in Australia, France, Germany,
Switzerland, and the United Kingdom. Clinical Therapeutics 26(2):304-321.
Pan XR, Li GW, Hu YH, Wang JX, Yang WY, An ZX, Hu ZX, Lin J, Xiao JZ, Cao HB, Liu PA,
Jiang XG, Jiang YY, Wang JP, Zhang H, Bennett PH, Howard BV (1997). Effects of diet and
exercise in preventing NIDDM in people with impaired glucose tolerance. The Da Qing IGT and
Diabetes Study.[see comment]. Diabetes Care 20(4):537-544.
Panagiotakos D, Pitsavos C, Arvaniti F, Stefanadis C (2007). Adherence to the Mediterranean
food pattern predicts the prevalence ofhypertension, hypercholesterolemia, diabetes and obesity,
among healthy adults; the accuracy of the MedDietScore. Prev Med 44:335-340.
Pearson T, Pronk N, Tan A, Halstenson C (2003). Identifying individuals at risk for the
development of type 2 diabetes mellitus. American Journal of Managed Care 9(1):57-66.
Pollard C, Miller M, Daly A, Crouchley K, O'Donoghue K, Lang A, Binns C (2008). Increasing
fruit and vegetable consumption: success of the Western Australian Go for 2&5 campaign. Public
Health Nutrition 11(3):314-320.
Pontiroli A, Folli F, Paganelli M, Micheletto G, Pizzocri P, Vedani P, Luisi F, Perego L,
Morabito A, Bressani Doldi S (2005). Laparoscopic gastric banding prevents type 2 diabetes and
arterial hypertension and induces their remission in morbid obesity: a 4-year case-controlled
study. Diabetes Care 28(11):2703-2709.
Quilici S, Chancellor J, Maclaine G, McGuire A, Andersson D, Chiasson JL (2005). Cost-
effectiveness of acarbose for the management of impaired glucose tolerance in Sweden.
International Journal of Clinical Practice 59(10):1143-1152.
Ramachandran A, Snehalatha C, Mary S, Mukesh B, Bhaskar AD, Vijay V, Indian Diabetes
Prevention P (2006). The Indian Diabetes Prevention Programme shows that lifestyle
modification and metformin prevent type 2 diabetes in Asian Indian subjects with impaired
glucose tolerance (IDPP-1). Diabetologia 49(2):289-297.
Ramachandran A, Snehalatha C, Yamuna A, Mary S, Ping Z (2007). Cost-effectiveness of the
interventions in the primary prevention of diabetes among Asian Indians: within-trial results of
the Indian Diabetes Prevention Programme (IDPP). Diabetes Care 30(10):2548-2552.
Randolph W & Viswanath K (2004). Lessons Learned from Public Health Mass Media
Campaigns: Marketing Health in a Crowded Media World. Annual Review of Public Health
25 (1) 419-437.
Rayner M, Boaz A, Higginson C (2001). Consumer use of health-related endorsements on food
labels in the United Kingdom and Australia. Journal of Nutrition Education 33(1):24-30.

Type 2 Diabetes Guideline 111 Primary Prevention, December 2009
Reger B, Wootan MG, Booth-Butterfield S (1999). Using mass media to promote healthy eating:
A community-based demonstration project. Preventive Medicine 29(5):414-421.
Reger B, Wootan MG, Booth-Butterfield S (2000). A comparison of different approaches to
promote community-wide dietary change. American Journal of Preventive Medicine 18(4):271-
275.
Reid DJ & Hendricks SM (1994). Consumer understanding and use of fat and cholesterol
information on food labels. Canadian Journal of Public Health Revue Canadienne de Sante
Publique. 85(5):334-337.
Renger R, Steinfelt V, Lazarus S (2002). Assessing the effectiveness of a community-based
media campaign targeting physical inactivity. Family & Community Health 25(3):18-30.
Ronda G, Van Assema P, Candel M, Ruland E, Steenbakkers M, Van Ree J, Brug J (2004). The
Dutch Heart Health community intervention 'Hartslag Limburg': Results of an effect study at
individual level. Health Promotion International 19(1):21-31.
Rosenstock J (2007). Reflecting on type 2 diabetes prevention: more questions than answers!
Diabetes, Obesity Metab 9 (Suppl 1):3-11.
Saaristo T, Peltonen M, Keinanen-Kiukaanniemi S, Vanhala M, Saltevo J, Niskanen L, Oksa H,
Korpi-Hyovalti E, Tuomilehto J, Group F-DDS (2007). National type 2 diabetes prevention
programme in Finland: FIN-D2D. International Journal of Circumpolar Health 66(2):101-112.
Sacks G, Swinburn B, Lawrence M (2008). A systematic policy approach to changing the food
system and physical activity environments to prevent obesity. Australia and New Zealand Health
Policy 5(1):13.
Salpeter S, Buckley N, Kahn J, Salpeter E (2008). Meta-analysis: metformin treatment in persons
at risk for diabetes mellitus. American Journal of Medicine 121(2):149-157.
Satterfield D, Volansky M, Caspersen C, Engelgau M, Bowman B, Gregg E, Geiss L, Hosey G,
May J, Vinicor F (2003). Community-based lifestyle interventions to prevent type 2 diabetes.
Diabetes Care 26(9):2643-2652.
Schmidt M, Duncan B, Bang H, Pankow J, Ballantyne C, Golden S, Folsom A, Chambless L
(2005). Identifying individuals at high risk for diabetes: The Atherosclerosis Risk in
Communities study. Diabetes Care 28(8):2013-2018.
Schulze MB, Hoffmann K, Boeing H, Linseisen J, Rohrmann S, Mohlig M, Pfeiffer AFH,
Spranger J, Thamer C, Haring H, Fritsche A, Joost HG (2007). An accurate risk score based on
anthropometric, dietary, and lifestyle factors to predict the development of type 2 diabetes.
Diabetes Care 30(3):510-515.

Type 2 Diabetes Guideline 112 Primary Prevention, December 2009
Seligman H, Bindman A, Vittinghoff E, Kanaya A, Kushel M (2007). Food insecurity is
associated with diabetes mellitus: results from the National Health Examination and Nutrition
Examination Survey (NHANES) 1999-2002. J Gen Intern Med. 22: 1018-1023.
Sjostrom L, Lindroos A-K, Peltonen M, Torgerson J, Bouchard C, Carlsson B, Dahlgren S,
Larsson B, Narbro K, Sjostrom CD, Sullivan M, Wedel H, Swedish Obese Subjects Study
Scientific Group (2004). Lifestyle, diabetes, and cardiovascular risk factors 10 years after
bariatric surgery. New England Journal of Medicine 351(26):2683-2693.
Sogaard AJ & Fonnebo V (1992). Self-reported change in health behaviour after a mass media-
based health education campaign. Scandinavian Journal of Psychology 33(2):125-134.
Sorensen G, Stoddard A, Peterson K, Cohen N, Hunt MK, Stein E, Palombo R, Lederman R
(1999). Increasing fruit and vegetable consumption through worksites and families in the
Treatwell 5-a-Day study. American Journal of Public Health 89(1):54-60.
Stern M, Williams K, Haffner S (2002). Identification of persons at high risk for type 2 diabetes
mellitus: do we need the oral glucose tolerance test?. Annals of Internal Medicine 136(8):575-
581.
Sullivan AD (2003). Determining how low-income food shoppers perceive, understand, and use
food labels. Canadian Journal of Dietetic Practice & Research 64(1):25-30.
Taylor CB, Fortmann SP, Flora J, Kayman S, Barrett DC, Jatulis D, Farquhar JW (1991). Effect
of long-term community health education on body mass index. The Stanford Five-City Project.
American Journal of Epidemiology 134(3):235-49.
Thomas C, Hypponen E, Power C (2006). Type 2 Diabetes Mellitus in midlife estimated from the
Cambridge risk score and body mass index. Arch Int Med 166:682-688.
Thornley L, Quigley R, Watts C, Conland C, Meikle R, Ball J (2007). Healthy Eating: Rapid
Evidence Review of Nutrition Social Marketing Interventions to Prevent Obesity. Prepared for
the Health Sponsorship Council. Quigley and Watts Ltd, Wellington, New Zealand.
Tuomilehto J, Lindstrom J, Eriksson J, Valle T, Hamalainen H, Ilanne-Parikka P, Keinanen-
Kiukaanniemi S, Laakso M, Louheranta A, Rastas M, Salminen V, Uusitupa M, Finnish Diabetes
Prevention Study Group (2001). Prevention of type 2 diabetes mellitus by changes in lifestyle
among subjects with impaired glucose tolerance. New England Journal of Medicine
344(18):1343-1350.
Tuomilehto J (2006). Modelling of primary prevention of the development of type 2 diabetes.
Przeglad Lekarski 63 (Suppl 4):3-6.
Vaag A, Bjorn Jensen C, Poulsen P, Brons C, Pilgaard K, Grunnet L, Vielwerth S, Alibegovic A
(2006). Size at birth, postnatal growth and the metabolic syndrome. Hormone Res 65 (suppl
3):137-143.

Type 2 Diabetes Guideline 113 Primary Prevention, December 2009
Verrall B (2000). A worksite health promotion intervention improved employees' nutrition.
Evidence-Based Nursing 3(1):19.
Wammes B, Oenema A, Brug J (2007). The evaluation of a mass media campaign aimed at
weight gain prevention among young Dutch adults. Obesity 15(11):2780-2789.
Wansink B, Sonka ST, Hasler CM (2004). Front-label health claims: when less is more. Food
Policy 29(6):659-667.
Wardle J, Rapoport L, Miles A, Afuape T, Duman M (2001). Mass education for obesity
prevention: the penetration of the BBC's 'Fighting Fat, Fighting Fit' campaign. Health Education
Research 16(3):343-355.
Waugh N, Scotland G, McNamee P, Gillett M, Brennan A, Goyder E, Williams R, John A
(2007). Screening for type 2 diabetes: literature review and economic modelling. Health Technol
Assessment 11(17):1-144.
Wellman NS, Kamp B, Kirk-Sanchez NJ, Johnson PM (2007). Eat Better & Move More: a
community-based program designed to improve diets and increase physical activity among older
Americans. American Journal of Public Health 97(4):710-717.
Wen L, Thomas M, Jones H, Orr N, Moreton R, King L, Hawe P, Bindon J, Humphries J,
Schicht K, Corne S, Bauman A (2002). Promoting physical activity in women: evaluation of a 2-
year community-based intervention in Sydney, Australia. Health Promotion International
17(2):127-137.
WHO (2006). Definition and Diagnosis of Diabetes Mellitus and Intermediate Hyperglycaemia.
World Health Organisation, Geneva.
WHO (2007). A guide for population-based approaches to increasing levels of physical activity :
implementation of the WHO global strategy on diet, physical activity and health. World Health
Organisation, Geneva.
Wilding J (2007). The importance of free fatty acids in the development of type 2 diabetes.
Diabet Med 24:934-945.
Willi C, Bodenmann P, Ghali W, Faris P, Cornuz J (2007). Active smoking and the risk of type 2
diabetes: a systematic review and meta-analysis. JAMA 298:2654-2664.
Williams P (2005). Consumer understanding and use of health claims for foods. Nutrition
Reviews 63(7):256-264.
Wilson P, Meigs J, Sullivan L, Fox C, Nathan D, D'Agostino R (2007). Prediction of incident
diabetes mellitus in middle-aged adults. The Framingham Offspring Study. Arch Int Med
167:1068-1074.

Type 2 Diabetes Guideline 114 Primary Prevention, December 2009
Wimbush E, Macgregor A, Fraser E (1998). Impacts of a national mass media campaign on
walking in Scotland. Health Promotion International 13(1):45-53.
Wong F, Huhman M, Heitzler C, Asbury L, Bretthauer-Mueller R, McCarthy S, Londe P (2004).
VERB - a social marketing campaign to increase physical activity among youth. Preventing
Chronic Disease 1(3):A10.
Wray RJ, Jupka K, Ludwig-Bell C (2005). A community-wide media campaign to promote
walking in a Missouri town. Preventing Chronic Disease 2(4):A04.
Yamaoka K & Tango T (2005). Efficacy of lifestyle education to prevent type 2 diabetes. A
meta-analysis of randomized controlled trials. Diabetes Care 28:2780-2786.

Type 2 Diabetes Guideline 115 Primary Prevention, December 2009
Appendices

Type 2 Diabetes Guideline 116 Primary Prevention, December 2009
Appendix 1: The Australian Type 2 Diabetes Risk Assessment Tool

Type 2 Diabetes Guideline 117 Primary Prevention, December 2009

Type 2 Diabetes Guideline 118 Primary Prevention, December 2009
Appendix 2 Guideline Search Strategy and Yield
Electronic databases searched:
Medline
EMBASE
Cochrane Library
CINAHL
NHS Economic Evaluation Database 3rd Quarter 2008, for question 4 (cost effectiveness)
Other:
Report/publications that did not appear in the search but were suggested by members of
the Expert Advisory Group
Terms used to search the databases:
Detailed in search strategy tables (Appendix 4). The tables include search terms used for
Medline search. These search terms have been modified as appropriate for other databases.
Search inclusion criteria:
See general and specific inclusion and exclusion criteria (Appendix 3). This guideline was an
update of the Evidence Based Guideline for the Primary Prevention of Type 2 Diabetes that was
published in 2001 (searches were ceased in 1999). Searches for the current guideline were
limited by the publication years as follows:
Question 1: 1st January 1999 to 20 March 2008
Question 2: 1st January 1999 to 14 April 2008
Question 3: when the database started to 2nd
September 2008
Question 4: when the database started to 21st of July 2008
Abbreviations and explanation of table headings
Identified = number of articles which matched the mesh terms listed or contained the text terms
in each particular database
Relevant = those articles considered relevant to the questions being asked after viewing titles or
abstracts
Articles identified by other strategies = including articles or reports suggested by the Expert
Advisory Group or other experts or public submissions
Total for Review = those articles considered relevant to the question after viewing titles and
abstracts, contained original data or were systematic reviews of original articles and met the
inclusion/exclusion criteria
Total no. reviewed and graded = articles used to generate the evidence for the identified
question . These articles have been summarised and graded

Type 2 Diabetes Guideline 119 Primary Prevention, December 2009
* Reports/publications that did not appear in the search but were suggested by members of the Expert Advisory Group.
Questions No. articles
identified
(all
databases
combined)
No.
relevant
articles
Articles
identified
by other
strategies
Total
for
review
Total no.
reviewed
and
graded
Level I Level II Level
III
Level IV Highest
level of
evidence
1a Can type 2 diabetes be
prevented?
3,637 309 123 11 4 7 I
1b How can type 2 diabetes
be prevented in high risk
individuals?
242 72 2* 63 26 12 10 4 I
2 How can individuals at
high risk of type 2
diabetes be identified?
1,748 209 38 11 4 7 II
3 What population
strategies have been
shown to be effective in
reducing risk factors for
type 2 diabetes?
Social marketing
(healthy eating)
603 356 14 11 11 III
Social marketing
(physical inactivity)
1,736 748 33 13 13 III
Community
interventions (healthy
eating)
6,680 1,780 13 10 1 9 I
Community
interventions
(physical inactivity)
6,928 2,430 16 10 1 9 I
Policy and regulation 10* 10 4 4 III
Food labelling 627 30 4* 28 13 13 III
4 Is prevention cost-
effective?
What are the socio-
economic implications?
49
13
31
7
13
7
13
7
N/A

Type 2 Diabetes Guideline 120 Primary Prevention, December 2009
Appendix 3: Generic Inclusion Criteria used to determine the suitability of articles for review
Inclusion criteria
The following are the criteria of articles to be included in the literature review:
Present original data or reviews of original data
Focus on type 2 diabetes or include a cohort with type 2 diabetes
Address one or more of the specified research question
Applicable to diabetes care or prevention in Australia
Conducted in humans
Conducted in appropriate population for the question being addressed
Other specific inclusion criteria for each guideline
Exclusion criteria
Studies of inappropriate patient population
Articles and reviews which present the author‟s opinion rather than evidence
Small review articles where the material is covered more adequately by more recent/or
more comprehensive reviews
In vitro and animal studies
Genetic studies that are not clinically applicable
Specific criteria used to determine the suitability of articles for review (Primary
Prevention guideline)
Interventions that focus on primary prevention of type 2 diabetes
Where two or more articles appear to report data from the same group of subjects,
only the most complete article should be used to generate data for the analyses
The sample size should be 100 or more
The duration of the study – 12 months or more (intervention or follow-up)
Exclude studies of inappropriate populations (small studies in populations not relevant
to the Australian population)
Post hoc analyses unless they provide significant additional information not already
covered in the original study report
For question 3 (population strategies), due to limited number of studies and that issue
have not been addressed in previous guideline, the following criteria were applied:
- search years: when the database started until July 2008
- all study types were included – whether systematic reviews, pre-post
studies, cohort studies, population studies, etc.
- intervention – social marketing; mass media campaign, community-wide
intervention or policy change.
- outcome – enhanced/ improved health risk behaviours, specifically,
physical activity/ and or nutrition
- interventions that were individually based (not community based) or those
targeting children (school based) were excluded.

Type 2 Diabetes Guideline 121 Primary Prevention, December 2009
Appendix 4: Search Strategies and Terms
Question 1:
Can type 2 diabetes be prevented? If yes,
How can type 2 diabetes be prevented in high risk individuals?
Searches Result
1 diabetes mellitus/ or diabetes mellitus, type 2/ 120874
2 Primary Prevention/ 10282
3 and/1-2 390
4 prevent$.tw. 621678
5 1 and (2 or 4) 8413
6 randomized controlled trial.pt. 263468
7 5 and 6 459
8 animals/ not (animals/ and humans/) 3247594
9 7 not 8 459
10 limit 9 to yr=1999-2007 329
Searches Result
1 diabetes mellitus/ or diabetes mellitus, type 2/ 120874
2 Primary Prevention/ 10282
3 and/1-2 390
4 prevent$.tw. 621678
5 1 and (2 or 4) 8413
6 meta-analysis.pt. 19286
7 meta-anal$.tw. 21932
8 metaanal$.tw. 783
9 quantitativ$ review$.mp. or quantitative$ overview$.tw.
[mp=title, original title, abstract, name of substance word,
subject heading word]
406
10 systematic$ review$.mp. or systmatic$ overview$.tw. [mp=title,
original title, abstract, name of substance word, subject heading
word]
15902
11 methodologic$ review$.mp. or methodologic$ overview$.tw.
[mp=title, original title, abstract, name of substance word,
subject heading word]
196
12 review.pt. and medline.tw. 19685
13 6 or 7 or 8 or 9 or 10 or 11 or 12 53738
14 5 and 13 211
15 limit 14 to yr=1999-2007 180
16 limit 15 to english language 164

Type 2 Diabetes Guideline 122 Primary Prevention, December 2009
Prevention – lifestyle interventions
Searches Result
1 diabetes mellitus/ or diabetes mellitus, type 2/ 120874
2 Primary Prevention/ 10282
3 and/1-2 390
4 prevent$.tw. 621678
5 1 and (2 or 4) 8413
6 meta-analysis.pt. 19286
7 meta-anal$.tw. 21932
8 metaanal$.tw. 783
9 quantitativ$ review$.mp. or quantitative$ overview$.tw.
[mp=title, original title, abstract, name of substance word,
subject heading word]
406
10 systematic$ review$.mp. or systmatic$ overview$.tw. [mp=title,
original title, abstract, name of substance word, subject heading
word]
15902
11 methodologic$ review$.mp. or methodologic$ overview$.tw.
[mp=title, original title, abstract, name of substance word,
subject heading word]
196
12 review.pt. and medline.tw. 19685
13 6 or 7 or 8 or 9 or 10 or 11 or 12 53738
14 5 and 13 211
15 limit 14 to yr=1999-2007 180
16 limit 15 to english language 164
17 exp Obesity/dh [diet therapy] 4281
18 limit 17 to yr="1999 - 2008" 1783
19 exp Diet, fat-restricted/ 1971
20 limit 19 to yr="1999 - 2008" 1356
21 exp diet, reducing/ 7882
22 limit 21 to yr="1999 - 2008" 2412
23 exp diet therapy/ 32692
24 limit 23 to yr="1999 - 2008" 9956
25 exp fasting/ 23795
26 limit 25 to yr="1999 - 2008" 6620
27 (diet or diets or dieting).mp. [mp=title, original title, abstract,
name of substance word, subject heading word]
234583
28 limit 27 to yr="1999 - 2008" 85191
29 (diet$ adj (modif$ or therapy or intervention$ or strateg$)).mp.
[mp=title, original title, abstract, name of substance word,
subject heading word]
15343
30 limit 29 to yr="1999 - 2008" 3863
31 (low calorie or calorie control$ or healthy eating).mp. [mp=title,
original title, abstract, name of substance word, subject heading
word]
2603
32 limit 31 to yr="1999 - 2008" 1456
33 exp dietary fats/ 57096
34 limit 33 to yr="1999 - 2008" 20038
35 (fruit$ or vegtable$).mp. [mp=title, original title, abstract, name 37794

Type 2 Diabetes Guideline 123 Primary Prevention, December 2009
of substance word, subject heading word]
36 limit 35 to yr="1999 - 2008" 23408
37 (high fat$ or low fat$ or fatty food$).mp. [mp=title, original title,
abstract, name of substance word, subject heading word]
13851
38 limit 37 to yr="1999 - 2008" 7537
39 food, formulated/ or formula diet.mp. 4999
40 limit 39 to yr="1999 - 2008" 1308
41 exp exercise/ 61673
42 limit 41 to yr="1999 - 2008" 34469
43 exp exercise therapy/ 18536
44 limit 43 to yr="1999 - 2008" 7520
45 (aerobics or physical therapy or physical activity or physical
inactivity).mp. [mp=title, original title, abstract, name of
substance word, subject heading word]
53555
46 limit 45 to yr="1999 - 2008" 28091
47 (fitness adj (class$ or regime$ or program$)).mp. [mp=title,
original title, abstract, name of substance word, subject heading
word]
497
48 limit 47 to yr="1999 - 2008" 163
49 (aerobics or physical therapy or physical training or physical
education).mp. [mp=title, original title, abstract, name of
substance word, subject heading word]
38547
50 limit 49 to yr="1999 - 2008" 13077
51 sedentary behavio$r reduction.mp. 1
52 limit 51 to yr="1999 - 2008" 1
53 sedentary behavio$r.mp. 234
54 limit 53 to yr="1999 - 2008" 213
55 or/17-54 420412
56 16 and 55 37

Type 2 Diabetes Guideline 124 Primary Prevention, December 2009
Prevention – pharmacological interventions
Searches Result
1 diabetes mellitus/ or diabetes mellitus, type 2/ 121035
2 Primary Prevention/ 10289
3 and/1-2 390
4 prevent$.tw. 622504
5 1 and (2 or 4) 8425
6 meta-analysis.pt. 19327
7 meta-anal$.tw. 21993
8 metaanal$.tw. 784
9 quantitativ$ review$.mp. or quantitative$ overview$.tw.
[mp=title, original title, abstract, name of substance word,
subject heading word]
406
10 systematic$ review$.mp. or systmatic$ overview$.tw. [mp=title,
original title, abstract, name of substance word, subject heading
word]
15963
11 methodologic$ review$.mp. or methodologic$ overview$.tw.
[mp=title, original title, abstract, name of substance word,
subject heading word]
196
12 review.pt. and medline.tw. 19733
13 6 or 7 or 8 or 9 or 10 or 11 or 12 53880
14 5 and 13 212
15 limit 14 to yr=1999-2007 180
16 limit 15 to english language 164
17 exp Drug Therapy/ 418999
18 pharmacotherapy.tw. 11442
19 pharmaco$.tw. 273186
20 ((drug$ or medication) adj5 (therap$ or treatment$ or
administration)).tw. 153282
21 17 or 18 or 19 or 20 783140
22 5 and 16 and 21 36

Type 2 Diabetes Guideline 125 Primary Prevention, December 2009
Prevention – Surgical interventions
Searches Result
1 diabetes mellitus/ or diabetes mellitus, type 2/ 121035
2 Primary Prevention/ 10289
3 and/1-2 390
4 prevent$.tw. 622504
5 1 and (2 or 4) 8425
6 randomized controlled trial.pt. 263783
7 5 and 6 461
8 animals/ not (animals/ and humans/) 3250104
9 7 not 8 461
10 limit 9 to yr=1999-2007 329
11 exp Gastroplasty/ 2787
12 limit 11 to yr="1999 - 2008" 2198
13 gastrectomy/ or gastric surgery.mp. 22766
14 limit 13 to yr="1999 - 2008" 4181
15 exp Gastric Bypass/ or gastric band$.mp. 4532
16 limit 15 to yr="1999 - 2008" 4069
17 lap-band.mp. 272
18 limit 17 to yr="1999 - 2008" 252
19 roux-en-y.mp. or exp Anastomosis, Roux-en-Y/ 4418
20 limit 19 to yr="1999 - 2008" 2700
21 exp Biliopancreatic Diversion/ 656
22 limit 21 to yr="1999 - 2008" 503
23 biliopancreatic bypass.mp. 47
24 limit 23 to yr="1999 - 2008" 10
25 gastro$gastrostomy.mp. 22
26 limit 25 to yr="1999 - 2008" 3
27 restrictive surgery.mp. 88
28 limit 27 to yr="1999 - 2008" 70
29 malabsorptive surgery.mp. 8
30 limit 29 to yr="1999 - 2008" 8
31 bariatric surgery.mp. 2877
32 limit 31 to yr="1999 - 2008" 2719
33 (jejuonoileal bypass or jejuno-ileal bypass).mp. [mp=title,
original title, abstract, name of substance word, subject heading
word]
201
34 limit 33 to yr="1999 - 2008" 19
35 or/11-34 32007
36 10 and 35 0
37 5 and 35 32

Type 2 Diabetes Guideline 126 Primary Prevention, December 2009
Question 2:
How can individuals at high risk of type 2 diabetes be identified?
Searches Result
1 diabetes mellitus/ or diabetes mellitus, type 2/ 120874
2 Mass Screening/ 61921
3 screen$.tw. 282678
4 Risk Assessment/ 94571
5 risk score$.tw. 2620
6 high risk.tw. 99690
7 or/2-6 476944
8 1 and 6 and 7 2358
9 limit 8 to (yr="1999 - 2008" and "all adult (19 plus years)") 1175

Type 2 Diabetes Guideline 127 Primary Prevention, December 2009
Question 3:
What population strategies have been shown to be effective in reducing risk
factors for type 2 diabetes?
Social Marketing – Nutrition and Diet
Searches Result
1 exp Obesity/ 89386
2 exp Diet, Fat-Restricted/ 1968
3 exp Diet, Reducing/ 7877
4 (diet or diets or dieting).mp. [mp=title, original title, abstract,
name of substance word, subject heading word]
234395
5 (diet$ adj (modif$ or therapy or intervention$ or strateg$)).mp.
[mp=title, original title, abstract, name of substance word,
subject heading word]
15341
6 (low calorie or calorie control$ or healthy eating).mp. [mp=title,
original title, abstract, name of substance word, subject heading
word]
2597
7 exp Dietary Fats/ 57050
8 (fruit$ or vegetable$).mp. [mp=title, original title, abstract, name
of substance word, subject heading word]
53457
9 (high fat$ or low fat$ or fatty food$).mp. [mp=title, original title,
abstract, name of substance word, subject heading word]
13831
10 1 or 2 or 3 or 4 or 5 or 6 or 7 or 8 or 9 378385
11 exp Social Marketing/ 827
12 exp "Marketing of Health Services"/ 13286
13 Mass Media/ 6701
14 campaign$.tw. 15927
15 11 or 12 or 13 or 14 34410
16 10 and 15 733
17 limit 16 to "all adult (19 plus years)" 319

Type 2 Diabetes Guideline 128 Primary Prevention, December 2009
Social Marketing Physical activity
Searches Result
1 exp exercise/ 61590
2 exp leisure activities/ 103704
3 Physical Fitness/ 16308
4 exp motor activity/ 78430
5 physical activit$.tw. 28548
6 exercis$.tw. 137514
7 1 or 2 or 3 or 4 or 5 or 6 305695
8 exp health promotion/ 34689
9 exp "marketing of health services"/ 13286
10 Community Health Services/ 22935
11 Consumer Participation/ 11219
12 Health Education/ 44766
13 Mass Media/ 6701
14 Health Behavior/ 19181
15 campaign$.tw. 15927
16 consumer health education.mp. 43
17 8 or 9 or 10 or 11 or 12 or 13 or 14 or 15 or 16 148283
18 7 and 17 10584
19 limit 18 to "all adult (19 plus years)" 5804
20 9 or 13 or 15 34410
21 7 and 20 850

Type 2 Diabetes Guideline 129 Primary Prevention, December 2009
Community intervention – Nutrition & Diet
Searches Result
1 exp diet therapy/ 32669
2 (diet or diets or dieting).tw. 168072
3 (low calorie or calorie control$ or healthy eating).tw. 2597
4 fat intake.tw. 3974
5 exp dietary fats/ 57050
6 (fruit$ or vegetable$).tw. 40530
7 (high fat$ or low fat$ or fatty food$).tw. 13831
8 exp health promotion/ 34689
9 ((community or consumer) and (education or program$ or
campaign$ or promotion)).tw.
44494
10 Community Health Services/ 22935
11 (consumer participation or consumer education).mp. [mp=title,
original title, abstract, name of substance word, subject heading
word]
11432
12 (health education or education).mp. [mp=title, original title,
abstract, name of substance word, subject heading word]
409024
13 1 or 2 or 3 or 4 or 5 or 6 or 7 254406
14 8 or 9 or 10 or 11 or 12 480105
15 13 and 14 10171
16 limit 15 to "all adult (19 plus years)" 5178

Type 2 Diabetes Guideline 130 Primary Prevention, December 2009
Community intervention – Physical activity
Searches Result
1 exp exercise/ 61590
2 exp leisure activities/ 103704
3 Physical Fitness/ 16308
4 exp motor activity/ 78430
5 physical activit$.tw. 28548
6 exercis$.tw. 137514
7 1 or 2 or 3 or 4 or 5 or 6 305695
8 exp health promotion/ 34689
9 Community Health Services/ 22935
10 Consumer Participation/ 11219
11 Health Education/ 44766
12 consumer health education.mp. 43
13 8 or 9 or 10 or 11 or 12 105019
14 7 and 13 6556
15 limit 14 to "all adult (19 plus years)" 3143

Type 2 Diabetes Guideline 131 Primary Prevention, December 2009
Food Labelling
Searches Result
1 Food/ or Food Labelling/ 20114
2 Limit 1 to English language 16757
3 Nutrient.mp. or Food/ 52300
4 Limit 3 to English language 46223
5 Nutrition.mp. 109899
6 Limit 5 to English language 86047
7 Ingrident.mp. 6049
8 Limit 7 to English language 5555
9 Label.mp. 47456
10 Limit 9 to English language 45807
11 Panel.mp. 51102
12 Limit 11 to English language 49131
13 Information.mp. 518302
14 Limit 13 to English language 470149
15 Pack.mp. 5463
16 Limit 15 to English language 5061
17 Consumer.mp. 46744
18 Limit 17 to English language 43726
19 Purchaser.mp. 472
20 Limit 19 to English language 459
21 Point-of-purchase.mp. 92
22 Limit 23 to English language 92
23 Point of choice.mp. 30
24 Limit 23 to English language 30
25 Choice.mp. 154102
26 Limit 25 to English language 126341
27 8 or 6 or 4 or 2 132224
28 16 or 10 or 12 or 14 564286
29 22 or 18 or 24 or 26 or 20 168606
30 27 and 28 and 29 627

Type 2 Diabetes Guideline 132 Primary Prevention, December 2009
Question 4:
Is prevention cost-effective? (NHS Economic Evaluation Database 3rd Quarter 2008)
# Searches Results
1 exp "Costs and Cost Analysis"/ 19762
2 primary prevention/ 99
3 prevent$.tw. 2933
4 exp diabetes mellitus , type 2/ 341
5 2 or 3 2933
6 1 and 4 and 5 59
7 limit 6 to English language 49
8 from 7 keep 15, 23, 25-27, 30, 32-33, 36-37... 12

Type 2 Diabetes Guideline 133 Primary Prevention, December 2009
Appendix 5: NHMRC Evidence Statement Grading Forms

Type 2 Diabetes Guideline 134 Primary Prevention, December 2009
NHMRC Evidence Statement (If rating is not completely clear, use the space next to each criteria to note how the group came to a judgment.)
Key question(s): Q 1a. Can type 2 diabetes be prevented? If Yes,
1b. How can type 2 diabetes be prevented in high risk individuals?
1b. How can type 2 diabetes be prevented in high risk individuals?
Evidence table ref:
Section 1
1. Evidence base (number of studies, level of evidence and risk of bias in the included studies)
Progression to type 2 diabetes in high risk individuals can be prevented or
delayed. (4 systematic reviews, 7 RCTs) (Level A).
Lifestyle modification including increasing physical activity, improving diet,
and weight loss are effective in preventing/delaying the onset of type 2 diabetes
in high risk individuals. (8 systematic reviews, 5 RCTs) (Level A)
Weight loss, physical activity and dietary modification contribute to reducing
the risk of developing type 2 diabetes. (8 systematic reviews, 5 RCTs) (Level
A).
Lifestyle interventions in people with impaired glucose tolerance (IGT) reduce
progression to type 2 diabetes beyond the intervention period. (2 RCTs) (Level
B)
A Several Level I or II studies with low risk of bias
B one or two Level II studies with low risk of bias or SR/multiple Level III studies with low risk of bias
C Level III studies with low risk of bias or Level I or II studies with moderate risk of bias
D Level IV studies or Level I to III studies with high risk of bias
2. Consistency (if only one study was available, rank this component as ‘not applicable’)
A All studies consistent
B Most studies consistent and inconsistency can be explained
C Some inconsistency, reflecting genuine uncertainty around question
D Evidence is inconsistent
NA Not applicable (one study only)
3. Clinical impact (Indicate in the space below if the study results varied according to some
unknown factor (not simply study quality or sample size) and thus the clinical impact of the intervention could not be determined)
A Very large
B Moderate
C Slight

Type 2 Diabetes Guideline 135 Primary Prevention, December 2009
D Restricted
4. Generalisability
A Evidence directly generalisable to target population
B Evidence directly generalisable to target population with some caveats
C Evidence not directly generalisable to the target population but could be sensibly applied
D Evidence not directly generalisable to target population and hard to judge whether it is sensible to apply
5. Applicability
A Evidence directly applicable to Australian healthcare context
B Evidence applicable to Australian healthcare context with few caveats
C Evidence probably applicable to Australian healthcare context with some caveats
D Evidence not applicable to Australian healthcare context

Type 2 Diabetes Guideline 136 Primary Prevention, December 2009
Other factors (Indicate here any other factors that you took into account when assessing the evidence base (for example, issues that might cause the group to downgrade or upgrade the recommendation)
EVIDENCE STATEMENT MATRIX Please summarise the development group’s synthesis of the evidence relating to the key question, taking all the above factors into account.
Component Rating Description
1. Evidence base A
2. Consistency A
3. Clinical impact A
4. Generalisability A
5. Applicability A
Indicate any dissenting opinions
RECOMMENDATION What recommendation(s) does the guideline development group draw from this evidence? Use action statements where possible.
GRADE OF RECOMMENDATION
Grade A
Lifestyle modification that focus on increased physical activity, dietary change and weight loss should be offered to all individuals at high risk of
developing type 2 diabetes.

Type 2 Diabetes Guideline 137 Primary Prevention, December 2009
IMPLEMENTATION OF RECOMMENDATION Please indicate yes or no to the following questions. Where the answer is yes please provide explanatory information about this. This information will be used to develop the implementation plan for the guidelines.
Will this recommendation result in changes in usual care? YES
Are there any resource implications associated with implementing this recommendation? YES
Will the implementation of this recommendation require changes in the way care is currently organised? YES
Are the guideline development group aware of any barriers to the implementation of this recommendation?
NO

Type 2 Diabetes Guideline 138 Primary Prevention, December 2009
NHMRC Evidence Statement (If rating is not completely clear, use the space next to each criteria to note how the group came to a judgment.)
Key question(s): Q 1a. Can type 2 diabetes be prevented? If Yes,
1b. How can type 2 diabetes be prevented in high risk individuals?
1b. How can type 2 diabetes be prevented in high risk individuals?
Evidence table ref:
Section 1
1. Evidence base (number of studies, level of evidence and risk of bias in the included studies)
Pharmacological interventions (including metformin, acarbose, rosiglitazone
and orlistat) are effective in preventing/delaying the onset of type 2 diabetes in
high risk individuals. (7 Systematic reviews, 3 RCTs) (Level A)
A Several Level I or II studies with low risk of bias
B one or two Level II studies with low risk of bias or SR/multiple Level III studies with low risk of bias
C Level III studies with low risk of bias or Level I or II studies with moderate risk of bias
D Level IV studies or Level I to III studies with high risk of bias
2. Consistency (if only one study was available, rank this component as ‘not applicable’)
A All studies consistent
B Most studies consistent and inconsistency can be explained
C Some inconsistency, reflecting genuine uncertainty around question
D Evidence is inconsistent
NA Not applicable (one study only)
3. Clinical impact (Indicate in the space below if the study results varied according to some
unknown factor (not simply study quality or sample size) and thus the clinical impact of the intervention could not be determined)
A Very large
B Moderate
C Slight

Type 2 Diabetes Guideline 139 Primary Prevention, December 2009
D Restricted
4. Generalisability
A Evidence directly generalisable to target population
B Evidence directly generalisable to target population with some caveats
C Evidence not directly generalisable to the target population but could be sensibly applied
D Evidence not directly generalisable to target population and hard to judge whether it is sensible to apply
5. Applicability
A Evidence directly applicable to Australian healthcare context
B Evidence applicable to Australian healthcare context with few caveats
C Evidence probably applicable to Australian healthcare context with some caveats
D Evidence not applicable to Australian healthcare context

Type 2 Diabetes Guideline 140 Primary Prevention, December 2009
Other factors (Indicate here any other factors that you took into account when assessing the evidence base (for example, issues that might cause the group to downgrade or upgrade the recommendation)
EVIDENCE STATEMENT MATRIX Please summarise the development group’s synthesis of the evidence relating to the key question, taking all the above factors into account.
Component Rating Description
1. Evidence base A
2. Consistency B
3. Clinical impact B
4. Generalisability B
5. Applicability C
Indicate any dissenting opinions
RECOMMENDATION What recommendation(s) does the guideline development group draw from this evidence? Use action statements where possible.
GRADE OF RECOMMENDATION
Grade B
Pharmacological interventions (including metformin, acarbose, rosiglitazone and orlistat) could be considered in people at high risk of developing type 2
diabetes

Type 2 Diabetes Guideline 141 Primary Prevention, December 2009
IMPLEMENTATION OF RECOMMENDATION Please indicate yes or no to the following questions. Where the answer is yes please provide explanatory information about this. This information will be used to develop the implementation plan for the guidelines.
Will this recommendation result in changes in usual care? YES
Are there any resource implications associated with implementing this recommendation? YES
Will the implementation of this recommendation require changes in the way care is currently organised?
NO
Are the guideline development group aware of any barriers to the implementation of this recommendation?
YES

Type 2 Diabetes Guideline 142 Primary Prevention, December 2009
NHMRC Evidence Statement (If rating is not completely clear, use the space next to each criteria to note how the group came to a judgment.)
Key question(s): Q 1a. Can type 2 diabetes be prevented? If Yes,
1b. How can type 2 diabetes be prevented in high risk individuals?
1b. How can type 2 diabetes be prevented in high risk individuals?
Evidence table ref:
Section 1
1. Evidence base (number of studies, level of evidence and risk of bias in the included studies)
Bariatric surgery can prevent/delay progression to type 2 diabetes in people who
are morbidly obese. (1 Systematic review, 4 case-control / cohort prognosis
studies ) (Level III)
A Several Level I or II studies with low risk of bias
B one or two Level II studies with low risk of bias or SR/multiple Level III studies with low risk of bias
C Level III studies with low risk of bias or Level I or II studies with moderate risk of bias
D Level IV studies or Level I to III studies with high risk of bias
2. Consistency (if only one study was available, rank this component as ‘not applicable’)
A All studies consistent
B Most studies consistent and inconsistency can be explained
C Some inconsistency, reflecting genuine uncertainty around question
D Evidence is inconsistent
NA Not applicable (one study only)
3. Clinical impact (Indicate in the space below if the study results varied according to some
unknown factor (not simply study quality or sample size) and thus the clinical impact of the intervention could not be determined)
A Very large
B Moderate
C Slight

Type 2 Diabetes Guideline 143 Primary Prevention, December 2009
D Restricted
4. Generalisability
A Evidence directly generalisable to target population
B Evidence directly generalisable to target population with some caveats
C Evidence not directly generalisable to the target population but could be sensibly applied
D Evidence not directly generalisable to target population and hard to judge whether it is sensible to apply
5. Applicability
A Evidence directly applicable to Australian healthcare context
B Evidence applicable to Australian healthcare context with few caveats
C Evidence probably applicable to Australian healthcare context with some caveats
D Evidence not applicable to Australian healthcare context

Type 2 Diabetes Guideline 144 Primary Prevention, December 2009
Other factors (Indicate here any other factors that you took into account when assessing the evidence base (for example, issues that might cause the group to downgrade or upgrade the recommendation)
EVIDENCE STATEMENT MATRIX Please summarise the development group’s synthesis of the evidence relating to the key question, taking all the above factors into account.
Component Rating Description
1. Evidence base C
2. Consistency A
3. Clinical impact A
4. Generalisability C
5. Applicability C
Indicate any dissenting opinions
RECOMMENDATION What recommendation(s) does the guideline development group draw from this evidence? Use action statements where possible.
GRADE OF RECOMMENDATION
Grade C
Bariatric surgery can be considered in selected morbidly obese individuals (based on weight alone or the presence of co-morbidities) at high risk of
type 2 diabetes.

Type 2 Diabetes Guideline 145 Primary Prevention, December 2009
IMPLEMENTATION OF RECOMMENDATION Please indicate yes or no to the following questions. Where the answer is yes please provide explanatory information about this. This information will be used to develop the implementation plan for the guidelines.
Will this recommendation result in changes in usual care? YES
Are there any resource implications associated with implementing this recommendation? YES
Will the implementation of this recommendation require changes in the way care is currently organised? YES
Are the guideline development group aware of any barriers to the implementation of this recommendation?
YES

Type 2 Diabetes Guideline 146 Primary Prevention, December 2009
NHMRC Evidence Statement (If rating is not completely clear, use the space next to each criteria to note how the group came to a judgment.)
Key question(s): Q2. How can individuals at high risk of type 2 diabetes be identified?
Evidence table ref:
Section 2
1. Evidence base (number of studies, level of evidence and risk of bias in the included studies)
Risk assessment tools using basic clinical information (age, sex, ethnicity,
family history of diabetes, hypertension and anthropometric measurements)
without laboratory testing identify people at high risk of diabetes. (4 Cohort
Prognostic studies level II)
The inclusion of laboratory measures (fasting glucose, HDL cholesterol,
triglycerides) improve the performance of risk assessment tools in identifying
individuals at high risk of diabetes. (5 Cohort Prognostic studies level III)
Risk assessment tools for identifying people at increased risk of type 2
diabetes are feasible and effective for use in community settings. ( Cohort
Prognostic studies level III)
A Several Level I or II studies with low risk of bias
B one or two Level II studies with low risk of bias or SR/multiple Level III studies with low risk of bias
C Level III studies with low risk of bias or Level I or II studies with moderate risk of bias
D Level IV studies or Level I to III studies with high risk of bias
2. Consistency (if only one study was available, rank this component as ‘not applicable’)
A All studies consistent
B Most studies consistent and inconsistency can be explained
C Some inconsistency, reflecting genuine uncertainty around question
D Evidence is inconsistent
NA Not applicable (one study only)
3. Clinical impact (Indicate in the space below if the study results varied according to some
unknown factor (not simply study quality or sample size) and thus the clinical impact of the intervention could not be determined)
A Very large
B Moderate
C Slight

Type 2 Diabetes Guideline 147 Primary Prevention, December 2009
D Restricted
4. Generalisability
A Evidence directly generalisable to target population
B Evidence directly generalisable to target population with some caveats
C Evidence not directly generalisable to the target population but could be sensibly applied
D Evidence not directly generalisable to target population and hard to judge whether it is sensible to apply
5. Applicability
A Evidence directly applicable to Australian healthcare context
B Evidence applicable to Australian healthcare context with few caveats
C Evidence probably applicable to Australian healthcare context with some caveats
D Evidence not applicable to Australian healthcare context

Type 2 Diabetes Guideline 148 Primary Prevention, December 2009
Other factors (Indicate here any other factors that you took into account when assessing the evidence base (for example, issues that might cause the group to downgrade or upgrade the recommendation)
EVIDENCE STATEMENT MATRIX Please summarise the development group’s synthesis of the evidence relating to the key question, taking all the above factors into account.
Component Rating Description
1. Evidence base C
2. Consistency A
3. Clinical impact A
4. Generalisability A
5. Applicability A
Indicate any dissenting opinions
RECOMMENDATION What recommendation(s) does the guideline development group draw from this evidence? Use action statements where possible.
GRADE OF RECOMMENDATION
Grade C
Individuals at high risk of diabetes should be identified through the use of risk assessment tools.

Type 2 Diabetes Guideline 149 Primary Prevention, December 2009
IMPLEMENTATION OF RECOMMENDATION Please indicate yes or no to the following questions. Where the answer is yes please provide explanatory information about this. This information will be used to develop the implementation plan for the guidelines.
Will this recommendation result in changes in usual care? YES
Are there any resource implications associated with implementing this recommendation? YES
Will the implementation of this recommendation require changes in the way care is currently organised?
NO
Are the guideline development group aware of any barriers to the implementation of this recommendation?
NO

Type 2 Diabetes Guideline 150 Primary Prevention, December 2009
NHMRC Evidence Statement (If rating is not completely clear, use the space next to each criteria to note how the group came to a judgment.)
Key question(s): Q3. What population strategies have been shown to be effective in reducing lifestyle risk factors for type 2
diabetes?
Evidence table ref:
Section 3
1. Evidence base (number of studies, level of evidence and risk of bias in the included studies)
Sustained, well-executed social marketing can be effective in increasing
physical activity, improving nutrition knowledge, attitudes and eating
behaviour in a range of target groups, in different settings. (Level III)
Mass media campaigns increase awareness, and improve knowledge and
attitudes around physical activity and healthy eating and may have a short term
effect on physical activity behaviour in some individuals. (Level III)
Media-only approaches may be sufficient to encourage a significant proportion
of people to alter their dietary habits and contribute to weight control at the
population level. (Level III)
Mass media campaigns enhance the success of community-based
interventions. (Level III)
A Several Level I or II studies with low risk of bias
B one or two Level II studies with low risk of bias or SR/multiple Level III studies with low risk of bias
C Level III studies with low risk of bias or Level I or II studies with moderate risk of bias
D Level IV studies or Level I to III studies with high risk of bias
2. Consistency (if only one study was available, rank this component as ‘not applicable’)
A All studies consistent
B Most studies consistent and inconsistency can be explained
C Some inconsistency, reflecting genuine uncertainty around question
D Evidence is inconsistent
NA Not applicable (one study only)
3. Clinical impact (Indicate in the space below if the study results varied according to some
unknown factor (not simply study quality or sample size) and thus the clinical impact of the intervention could not be determined)
A Very large
B Moderate

Type 2 Diabetes Guideline 151 Primary Prevention, December 2009
C Slight
D Restricted
4. Generalisability
A Evidence directly generalisable to target population
B Evidence directly generalisable to target population with some caveats
C Evidence not directly generalisable to the target population but could be sensibly applied
D Evidence not directly generalisable to target population and hard to judge whether it is sensible to apply
5. Applicability
A Evidence directly applicable to Australian healthcare context
B Evidence applicable to Australian healthcare context with few caveats
C Evidence probably applicable to Australian healthcare context with some caveats
D Evidence not applicable to Australian healthcare context

Type 2 Diabetes Guideline 152 Primary Prevention, December 2009
Other factors (Indicate here any other factors that you took into account when assessing the evidence base (for example, issues that might cause the group to downgrade or upgrade the recommendation)
EVIDENCE STATEMENT MATRIX Please summarise the development group’s synthesis of the evidence relating to the key question, taking all the above factors into account.
Component Rating Description
1. Evidence base C
2. Consistency D
3. Clinical impact D
4. Generalisability B
5. Applicability A
Indicate any dissenting opinions
RECOMMENDATION What recommendation(s) does the guideline development group draw from this evidence? Use action statements where possible.
GRADE OF RECOMMENDATION
Grade C
Social marketing should be considered as part of a comprehensive approach to reduce risk factors for type 2 diabetes at the population level.

Type 2 Diabetes Guideline 153 Primary Prevention, December 2009
IMPLEMENTATION OF RECOMMENDATION Please indicate yes or no to the following questions. Where the answer is yes please provide explanatory information about this. This information will be used to develop the implementation plan for the guidelines.
Will this recommendation result in changes in usual care?
NO
Are there any resource implications associated with implementing this recommendation? YES
Will the implementation of this recommendation require changes in the way care is currently organised?
NO
Are the guideline development group aware of any barriers to the implementation of this recommendation?
YES

Type 2 Diabetes Guideline 154 Primary Prevention, December 2009
NHMRC Evidence Statement (If rating is not completely clear, use the space next to each criteria to note how the group came to a judgment.)
Key question(s): Q3. What population strategies have been shown to be effective in reducing lifestyle risk factors for type 2
diabetes?
Evidence table ref:
Section 3
1. Evidence base (number of studies, level of evidence and risk of bias in the included studies)
Well-designed community-based intervention programs can improve lifestyle
choices and health habits such as increase physical activity and healthy eating.
(Level III)
Worksite interventions which involve family members can improve
dietary habits. (Level III)
Worksite health promotion programs that include environmental modifications
can influence dietary intake. (Level III)
A Several Level I or II studies with low risk of bias
B one or two Level II studies with low risk of bias or SR/multiple Level III studies with low risk of bias
C Level III studies with low risk of bias or Level I or II studies with moderate risk of bias
D Level IV studies or Level I to III studies with high risk of bias
2. Consistency (if only one study was available, rank this component as ‘not applicable’)
A All studies consistent
B Most studies consistent and inconsistency can be explained
C Some inconsistency, reflecting genuine uncertainty around question
D Evidence is inconsistent
NA Not applicable (one study only)
3. Clinical impact (Indicate in the space below if the study results varied according to some
unknown factor (not simply study quality or sample size) and thus the clinical impact of the intervention could not be determined)
A Very large
B Moderate
C Slight

Type 2 Diabetes Guideline 155 Primary Prevention, December 2009
D Restricted
4. Generalisability
A Evidence directly generalisable to target population
B Evidence directly generalisable to target population with some caveats
C Evidence not directly generalisable to the target population but could be sensibly applied
D Evidence not directly generalisable to target population and hard to judge whether it is sensible to apply
5. Applicability
A Evidence directly applicable to Australian healthcare context
B Evidence applicable to Australian healthcare context with few caveats
C Evidence probably applicable to Australian healthcare context with some caveats
D Evidence not applicable to Australian healthcare context

Type 2 Diabetes Guideline 156 Primary Prevention, December 2009
Other factors (Indicate here any other factors that you took into account when assessing the evidence base (for example, issues that might cause the group to downgrade or upgrade the recommendation)
EVIDENCE STATEMENT MATRIX Please summarise the development group’s synthesis of the evidence relating to the key question, taking all the above factors into account.
Component Rating Description
1. Evidence base C
2. Consistency C
3. Clinical impact C
4. Generalisability C
5. Applicability A
Indicate any dissenting opinions
RECOMMENDATION What recommendation(s) does the guideline development group draw from this evidence? Use action statements where possible.
GRADE OF RECOMMENDATION
Grade C
Community-based interventions should be used in specific settings and target groups (eg schools, workplace, women‟s groups) as a strategy for
reducing diabetes risk factors.

Type 2 Diabetes Guideline 157 Primary Prevention, December 2009
IMPLEMENTATION OF RECOMMENDATION Please indicate yes or no to the following questions. Where the answer is yes please provide explanatory information about this. This information will be used to develop the implementation plan for the guidelines.
Will this recommendation result in changes in usual care?
NO
Are there any resource implications associated with implementing this recommendation? YES
Will the implementation of this recommendation require changes in the way care is currently organised?
NO
Are the guideline development group aware of any barriers to the implementation of this recommendation?
YES

Type 2 Diabetes Guideline 158 Primary Prevention, December 2009
NHMRC Evidence Statement (If rating is not completely clear, use the space next to each criteria to note how the group came to a judgment.)
Key question(s): Q3. What population strategies have been shown to be effective in reducing lifestyle risk factors for type 2
diabetes?
Evidence table ref:
Section 3
1. Evidence base (number of studies, level of evidence and risk of bias in the included studies)
Environmental and policy interventions are effective in reducing chronic
disease risk factors including smoking, physical inactivity, and unhealthy
eating. (Level III)
Policy regulation such as nutrition information on processed foods has the
potential to improve food choices and promote healthy eating at a population
level. (Level III)
A Several Level I or II studies with low risk of bias
B one or two Level II studies with low risk of bias or SR/multiple Level III studies with low risk of bias
C Level III studies with low risk of bias or Level I or II studies with moderate risk of bias
D Level IV studies or Level I to III studies with high risk of bias
2. Consistency (if only one study was available, rank this component as ‘not applicable’)
A All studies consistent
B Most studies consistent and inconsistency can be explained
C Some inconsistency, reflecting genuine uncertainty around question
D Evidence is inconsistent
NA Not applicable (one study only)
3. Clinical impact (Indicate in the space below if the study results varied according to some
unknown factor (not simply study quality or sample size) and thus the clinical impact of the intervention could not be determined)
N/A A Very large
B Moderate
C Slight
D Restricted
4. Generalisability
A Evidence directly generalisable to target population
B Evidence directly generalisable to target population with some caveats

Type 2 Diabetes Guideline 159 Primary Prevention, December 2009
C Evidence not directly generalisable to the target population but could be sensibly applied
D Evidence not directly generalisable to target population and hard to judge whether it is sensible to apply
5. Applicability
A Evidence directly applicable to Australian healthcare context
B Evidence applicable to Australian healthcare context with few caveats
C Evidence probably applicable to Australian healthcare context with some caveats
D Evidence not applicable to Australian healthcare context

Type 2 Diabetes Guideline 160 Primary Prevention, December 2009
Other factors (Indicate here any other factors that you took into account when assessing the evidence base (for example, issues that might cause the group to downgrade or upgrade the recommendation)
EVIDENCE STATEMENT MATRIX Please summarise the development group’s synthesis of the evidence relating to the key question, taking all the above factors into account.
Component Rating Description
1. Evidence base D
2. Consistency C
3. Clinical impact N/A
4. Generalisability C
5. Applicability A
Indicate any dissenting opinions
RECOMMENDATION What recommendation(s) does the guideline development group draw from this evidence? Use action statements where possible.
GRADE OF RECOMMENDATION
Grade D
The impact of the built environment on physical activity and food quality and availability should be considered in all aspects of urban planning and
design.

Type 2 Diabetes Guideline 161 Primary Prevention, December 2009
IMPLEMENTATION OF RECOMMENDATION Please indicate yes or no to the following questions. Where the answer is yes please provide explanatory information about this. This information will be used to develop the implementation plan for the guidelines.
Will this recommendation result in changes in usual care?
NO
Are there any resource implications associated with implementing this recommendation? YES
Will the implementation of this recommendation require changes in the way care is currently organised?
NO
Are the guideline development group aware of any barriers to the implementation of this recommendation?
YES

Type 2 Diabetes Guideline 162 Primary Prevention, December 2009
NHMRC Evidence Statement (If rating is not completely clear, use the space next to each criteria to note how the group came to a judgment.)
Key question(s): a) Is prevention of type 2 diabetes cost-effective? b) What are the socio-economic implications of prevention of type 2 diabetes?
Evidence table ref:
Section 4
1. Evidence base (number of studies, level of evidence and risk of bias in the included studies)
(Based on 10 modelling studies and 3 RCTs)
Lifestyle modification can prevent or delay the development of diabetes at
costs acceptable to society.
Lifestyle modification interventions are cost-effective and cost saving in
people at high risk of developing diabetes.
Metformin and acarbose are cost-effective pharmacological interventions in
people at high risk of developing diabetes.
Lifestyle modification interventions are often more cost-effective than
pharmacological interventions.
Cost-effectiveness of lifestyle modification interventions and mefformin
improves when the interventions are implemented in routine clinical practice.
A Several Level I or II studies with low risk of bias
B one or two Level II studies with low risk of bias or SR/multiple Level III studies with low risk of bias
C Level III studies with low risk of bias or Level I or II studies with moderate risk of bias
D Level IV studies or Level I to III studies with high risk of bias
2. Consistency (if only one study was available, rank this component as ‘not applicable’)
A All studies consistent
B Most studies consistent and inconsistency can be explained
C Some inconsistency, reflecting genuine uncertainty around question
D Evidence is inconsistent
NA Not applicable (one study only)
3. Clinical impact (Indicate in the space below if the study results varied according to some
unknown factor (not simply study quality or sample size) and thus the clinical impact of the intervention could not be determined)
N/A A Very large
B Moderate
C Slight

Type 2 Diabetes Guideline 163 Primary Prevention, December 2009
D Restricted
4. Generalisability
No Australian economic evaluation.
A Evidence directly generalisable to target population
B Evidence directly generalisable to target population with some caveats
C Evidence not directly generalisable to the target population but could be sensibly applied
D Evidence not directly generalisable to target population and hard to judge whether it is sensible to apply
5. Applicability
A Evidence directly applicable to Australian healthcare context
B Evidence applicable to Australian healthcare context with few caveats
C Evidence probably applicable to Australian healthcare context with some caveats
D Evidence not applicable to Australian healthcare context

Type 2 Diabetes Guideline 164 Primary Prevention, December 2009
Other factors (Indicate here any other factors that you took into account when assessing the evidence base (for example, issues that might cause the group to downgrade or upgrade the recommendation)
EVIDENCE STATEMENT MATRIX Please summarise the development group’s synthesis of the evidence relating to the key question, taking all the above factors into account.
Component Rating Description
1. Evidence base B
2. Consistency B
3. Clinical impact N/A
4. Generalisability D
5. Applicability C
Indicate any dissenting opinions
RECOMMENDATION What recommendation(s) does the guideline development group draw from this evidence? Use action statements where possible.
GRADE OF RECOMMENDATION
To be optimally cost-effective and cost saving in the long term, interventions to prevent diabetes should focus on lifestyle modification.*
* NHMRC Evidence Hierarchy does not assign a level of evidence to economic evaluation studies that are based on modelling. Grading could not be
determined using the NHMRC matrix.

Type 2 Diabetes Guideline 165 Primary Prevention, December 2009
IMPLEMENTATION OF RECOMMENDATION Please indicate yes or no to the following questions. Where the answer is yes please provide explanatory information about this. This information will be used to develop the implementation plan for the guidelines.
Will this recommendation result in changes in usual care?
NO
Are there any resource implications associated with implementing this recommendation?
NO
Will the implementation of this recommendation require changes in the way care is currently organised?
NO
Are the guideline development group aware of any barriers to the implementation of this recommendation?
NO

Type 2 Diabetes Guidelines 166 Primary Prevention, December 2009
Appendix 6: Overview of Guideline Development Process and Methods

National Evidence Based Guidelines for the Prevention and Management of
Type 2 Diabetes
Overview of Guideline Development Process
and
Methods
Prepared by The Diabetes Unit
Menzies Centre for Health Policy The University of Sydney
for the
Diabetes Australia Guideline Development Consortium
Last updated 5 May 2009


Table of Contents
Purpose and structure of the document……………………………………………………..1
1.0 Introduction and Overview ........................................................................................ 3
1.1 Diabetes as a health burden ........................................................................................... 3
1.2 Key components and principles of diabetes care .......................................................... 4
1.3 Rationale for the Guidelines .......................................................................................... 5
1.4 Funding source .............................................................................................................. 6
1.5 The Guideline Development Project Consortium ......................................................... 6
1.6 The scope of the Guidelines .......................................................................................... 6
1.7 Use of the Guidelines .................................................................................................... 6
1.8 Review date ................................................................................................................... 7
1.9 Economic analysis ........................................................................................................ 7
1.10 Socio-economic impact ................................................................................................ 7
2.0 Organisational structure and staffing ....................................................................... 8
3.0 Methods ...................................................................................................................... 10
3.1 Development of protocols. .......................................................................................... 10
3.2 Guideline Development Process.................................................................................. 10
4.0 Consultation Process ................................................................................................. 23
References ............................................................................................................................. 27
Appendices: ........................................................................................................................... 27
Appendix i: Terms of Reference of the Steering Committee ….………………………30
Appendix ii: Terms of Reference of the Expert Advisory Groups …………………… ..32
Appendix iii: The NHMRC „interim‟ level of evidence …………………… …………..33
Appendix iv: Study Assessment Criteria …………………… ………………………….34
Appendix v: NHMRC Evidence Statement Form …………………… ………………..34
Appendix vi: Key stakeholder organisations notified of public consultation ……………40
List of Tables:
Table 1: Example of an Overall Assessment Report ............................................................. 15
Table 2: Example of an evidence table with overall study assessment ................................. 15
Table 3: NHMRC Body of Evidence Matrix ......................................................................... 18
Table 4: Definition of NHMRC grades of recommendation ................................................. 19

Type 2 Diabetes Guidelines 1 Overview, May 2009
Purpose and Structure of the Document
Purpose
This 2008-9 series of guidelines for type 2 diabetes updates and builds on the original suite of
evidence based diabetes guidelines which were initiated in 1999 under funding from the
Department of Health and Ageing (DoHA) to the Diabetes Australia (DA) Guideline
Development Consortium. Under the initial diabetes guideline project, six evidence based
guidelines for type 2 diabetes were endorsed by the NHMRC. The purpose of the initial
guidelines and the current guidelines is to provide systematically derived, objective guidance
to:
1. Improve quality and consistency of care and reduce inappropriate variations in practice by
assisting clinicians‟ and consumers‟ understanding of and decisions about treatment and
management options
2. Inform fund holders and health service planners about the effectiveness and feasibility of
the various options
3. Assist researchers and research authorities to highlight i) areas of diabetes prevention and
care for which there is inconclusive evidence and ii) areas of deficiency in the evidence
which require further or definitive research.
The specific purpose of this current project which commenced in early 2008 was to update
two of the previous guidelines - Primary Prevention, and Case Detection and Diagnosis – and
to develop three new guidelines, one for Blood Glucose Control, one for Chronic Kidney
Disease and one for Patient Education.
Structure
This Overview of the Guideline Development Process and Methods outlines the rationale for
the guidelines and the organisational structure, methods and processes adopted for the Type 2
Diabetes Guideline project, including the Blood Glucose Control Guideline. The guidelines
are structured to present the recommendations, practice points, evidence statements,
documentation of search strategies and search yield and a textual account of the evidence
underpinning each recommendation.
Final format and implementation
The contract between the DoHA and the DA Guideline Development Consortium makes
provision for locating and synthesising the available evidence on the five index areas into
guideline recommendations and describing the objective justification for the
recommendations. Thus, the contract covers the development of the guidelines up to and
including endorsement by the NHMRC but does not include implementation of the guidelines.
However, following endorsement by the NHMRC there will need to be an independent
process of consultation with potential guideline users to determine the final format of the
guidelines for wide dissemination to clinicians and consumers. Once this format has been
agreed, an implementation strategy to encourage and facilitate the widespread uptake of the
guidelines in everyday practice will need to be developed and actioned at national and state

Type 2 Diabetes Guidelines 2 Overview, May 2009
and territory level. It is our understanding that the DoHA has developed an implementation
plan and strategies and is currently obtaining internal sign-off on these before enacting them.

Type 2 Diabetes Guidelines 3 Overview, May 2009
1.0 Introduction and Overview
1.1 Diabetes as a health burden
Results of the national diabetes prevalence survey, AusDiab (Dunstan et al, 2002), which was
conducted on representative sample of some 11,000 people across Australia, found a
prevalence of diabetes of 7.4% in people aged 25 years or older. Another 16.4% of the study
population had either impaired glucose tolerance or impaired fasting glucose. AusDiab also
confirmed that there is one person with undiagnosed diabetes for every person with diagnosed
diabetes. Findings from the second phase of AusDiab, a 5-year follow-up survey of people
who participated in the baseline study, have indicated that every year eight out of every 1,000
people in Australia developed diabetes (Barry et al, 2006). This, together with the increasing
number of new cases of pre-diabetes, obesity, the metabolic syndrome, and kidney disease,
has demonstrated that abnormal glucose metabolism is exerting a major impact on the health
of Australians (Magliano et al, 2008).
Diabetes has a demonstrably high health and cost burden (Colagiuri et al, 2003; AIHW, 2008)
resulting from its long term complications which include:
- heart disease and stroke
- foot ulceration, gangrene and lower limb amputation
- kidney failure
- visual impairment up to and including blindness
- erectile dysfunction
The health burden of diabetes is described in more detail throughout the guideline series but
to put these complications in perspective, it is worth noting here that, in Australia, diabetes is
the most common cause of:
- blindness in people under the age of 60 years
- end stage kidney disease
- non-traumatic amputation
Diabetes is heavily implicated in deaths from cardiovascular disease (CVD) but, due to death
certificate documentation deficiencies; this link is believed to be substantially under reported.
At a global level, diabetes is predicted to increase dramatically in the next decade or two
(IDF, 2006). With an ageing and increasingly overweight and physically inactive population,
and a cultural mix comprising numerous groups known to be at high risk of type 2 diabetes,
Australia is a prime candidate for realising the projected increases.
Due to sheer numbers, the major proportion of the total diabetes burden is attributable to type
2 diabetes which is the most common form of diabetes and accounts for approximately 85%
of all diabetes in Australia. Type 2 diabetes occurs predominantly in mature adults with the
prevalence increasing in older age groups. However, in high risk populations such as
Aboriginal and Torres Strait Islander people it may become manifest much earlier.
These guidelines focus exclusively on type 2 diabetes in non-pregnant adults. Like type 1
diabetes, type 2 diabetes is characterised by high blood glucose levels. However, unlike type 1
diabetes, the key feature of type 2 diabetes is insulin resistance rather than insulin deficiency.
Consequently, its treatment does not necessarily require insulin and in many people,
particularly in the initial years following diagnosis, type 2 diabetes can be successfully

Type 2 Diabetes Guidelines 4 Overview, May 2009
managed with dietary and general lifestyle modification alone or in combination with oral
anti-diabetic medications. Insulin therapy may be required if and when oral medication
becomes ineffective in lowering and maintaining the blood glucose within an acceptable
range. Assiduous attention to the management of elevated blood pressure, lipid problems and
overweight is also required as these common features of type 2 diabetes markedly increase the
risk of long term complications.
1.2 Key components and principles of diabetes care
Key components of care In 1995, the NSW Health Department identified three key components of diabetes care, stating that …. „there is consensus supported by published literature that diabetes care and outcomes can be improved by providing access for all people with diabetes to:
- information about their condition and self care education - ongoing clinical care to provide optimal metabolic control - screening for and appropriate treatment of complications‟ (Colagiuri R et al, 1995).
These and the principles of care below were included in the initial suite of guidelines for type 2 diabetes and remain as valid now as they were then. Principles of care The particular expression of the universally accepted diabetes care principles set out below was abbreviated from those developed by the UK Clinical Advisory Group (CSAG, 1994) and later summarised by the NSW Health Expert Panel on Diabetes (New South Wales (NSW) Department of Health, 1996) and was further adapted for this project:
People with diabetes should have access to timely and ongoing care from a diabetes team. This should ideally include a doctor, nurse and dietitian with specific training and experience in the management of diabetes. Additional expertise, for example in podiatry, social work, behavioural psychology and counselling, should be available as required as should referral access to specialist services for the management of identified complications
People with diabetes are entitled to access to opportunities for information, education and skills acquisition to enable them to participate optimally in their diabetes management
People with diabetes are entitled to access high quality health services regardless of their financial status, cultural background, or place of residence
For people with diabetes from community groups who may have special needs eg people from Aboriginal, Torres Strait Islander or culturally and linguistically diverse backgrounds and the elderly, diabetes care should be specifically tailored to overcoming access barriers and providing opportunities for optimising diabetes care and outcomes
Diabetes teams should routinely evaluate the effectiveness of the care they provide

Type 2 Diabetes Guidelines 5 Overview, May 2009
1.3 Rationale for the Guidelines
The magnitude of the impact of diabetes on individuals and society in Australia is manifest in
its status as a National Health Priority Area since 1996 and the current attention directed to it
by the Council of Australian Governments‟ National Reform Agenda which seeks to address
and avert a greater impact on productivity than already exists as a result of diabetes.
For tangible and lasting benefits, evidence based information is required which synthesises
new and existing evidence to guide primary prevention efforts and assist clinicians to identify
and treat modifiable primary risk factors, accurately diagnose type 2 diabetes, assess
metabolic control, provide effective routine care, and make appropriate and timely referrals.
Since the initial suite of NHMRC diabetes guidelines was released there has been a vast
improvement in both the volume and quality of the evidence about preventing type 2 diabetes
which is detailed in the Primary Prevention Guideline. Nonetheless, there remain grave
concerns that the rapidly increasing prevalence of obesity combined with decreasing levels of
physical activity will continue to impact negatively on the incidence and prevalence of
diabetes unless addressed as a matter of urgency. Consequently, the Primary Prevention
Guideline also cites some of the emerging evidence about environmental influences on food
consumption and physical activity.
Type 2 diabetes represents a complex interaction of patho-physiological factors and its
prevention and successful management requires clinicians and public health practitioners to
maintain a thorough understanding of these interactions especially since there is now
irrefutable evidence that both the onset of diabetes and the onset of its complications can be
prevented or significantly delayed. Given the typically long pre-clinical phase of type 2
diabetes and that half of all people with diabetes are undiagnosed, the Case Detection and
Diagnosis Guideline is an important component of this suite of guidelines.
Integral to the successful management of diabetes is self care knowledge and skills, and the
capacity of the person with diabetes to adapt their lifestyle to optimise their physical and
psychological well being. The Patient Education Guideline presents evidence addressing these
issues.
The care of type 2 diabetes is predominantly carried out by general practitioners, often under
„shared care‟ arrangements with local Diabetes Centres and/or private endocrinologists. In
remote Australia, and even in more densely settled rural regions, the population base is
insufficient to support specialist diabetes teams and the general practitioner may not have
local access to specialist referral and support. Regardless of geographical factors, standards of
diabetes clinical care in Australia are known to be variable. The Chronic Kidney Disease
Guideline sets out diagnostic criteria and therapies for achieving the treatment targets to guide
the identification, prevention and management of kidney disease in people with diabetes.
Microvascular complications (retinopathy, nephropathy and neuropathy) and the increased
risk of macrovascular complications (ischemic heart disease, stroke and peripheral vascular
disease) are associated with reduced life expectancy and significant morbidity in type 2
diabetes. Using therapeutic interventions to lower blood glucose and achieve optimal HbA1c
levels is critical in preventing diabetes complications and improving the quality of life. The
Blood Glucose Control Guideline examines the evidence and the relationships among these
issues.
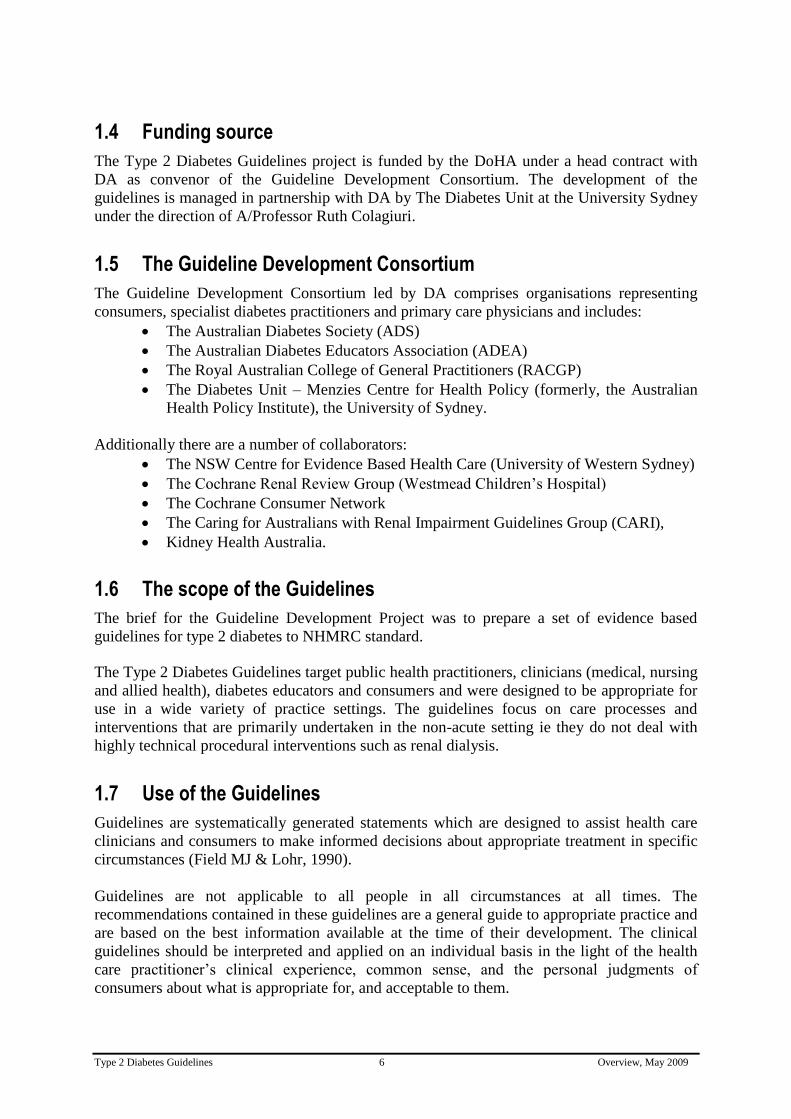
Type 2 Diabetes Guidelines 6 Overview, May 2009
1.4 Funding source
The Type 2 Diabetes Guidelines project is funded by the DoHA under a head contract with
DA as convenor of the Guideline Development Consortium. The development of the
guidelines is managed in partnership with DA by The Diabetes Unit at the University Sydney
under the direction of A/Professor Ruth Colagiuri.
1.5 The Guideline Development Consortium
The Guideline Development Consortium led by DA comprises organisations representing
consumers, specialist diabetes practitioners and primary care physicians and includes:
The Australian Diabetes Society (ADS)
The Australian Diabetes Educators Association (ADEA)
The Royal Australian College of General Practitioners (RACGP)
The Diabetes Unit – Menzies Centre for Health Policy (formerly, the Australian
Health Policy Institute), the University of Sydney.
Additionally there are a number of collaborators:
The NSW Centre for Evidence Based Health Care (University of Western Sydney)
The Cochrane Renal Review Group (Westmead Children‟s Hospital)
The Cochrane Consumer Network
The Caring for Australians with Renal Impairment Guidelines Group (CARI),
Kidney Health Australia.
1.6 The scope of the Guidelines
The brief for the Guideline Development Project was to prepare a set of evidence based
guidelines for type 2 diabetes to NHMRC standard. The Type 2 Diabetes Guidelines target public health practitioners, clinicians (medical, nursing
and allied health), diabetes educators and consumers and were designed to be appropriate for
use in a wide variety of practice settings. The guidelines focus on care processes and
interventions that are primarily undertaken in the non-acute setting ie they do not deal with
highly technical procedural interventions such as renal dialysis.
1.7 Use of the Guidelines
Guidelines are systematically generated statements which are designed to assist health care
clinicians and consumers to make informed decisions about appropriate treatment in specific
circumstances (Field MJ & Lohr, 1990).
Guidelines are not applicable to all people in all circumstances at all times. The
recommendations contained in these guidelines are a general guide to appropriate practice and
are based on the best information available at the time of their development. The clinical
guidelines should be interpreted and applied on an individual basis in the light of the health
care practitioner‟s clinical experience, common sense, and the personal judgments of
consumers about what is appropriate for, and acceptable to them.

Type 2 Diabetes Guidelines 7 Overview, May 2009
1.8 Review date
New information on type 2 diabetes is continually and rapidly becoming available. The
Project Management Team and Steering Committee recommend that these guidelines are
reviewed and revised at least every three years after publication. We anticipate this will be
June 2012.
1.9 Economic analysis
Assessment of economic impact i.e., analysing the cost implications of recommendations has
become a mandatory component of guideline development.
1.10 Socio-economic impact
The Expert Advisory Groups for each guideline were encouraged to adopt a framework that is
recommended by the NHMRC to identify, appraise and collate evidence of the impact of
socioeconomic position and other markers of interest eg income, education, occupation,
employment, ethnicity, housing, area of residence, lifestyle, gender.

Type 2 Diabetes Guidelines 8 Overview, May 2009
2.0 Organisational structure and staffing
The organisational structure of the Guideline Development Project (Figure 1) comprises:
A Steering Committee
Project Management Team
Expert Advisory Groups
Guidelines Assessment Register Consultant
Research Officers
Research team
The Steering Committee consists of a representation from each of the Consortium members,
the Guideline Project Medical Advisor, and the DoHA. Refer to Appendix i for Terms of
Reference. The Project Steering Committee provides guidance and directions to the project
and to the DoHA via DA. The main role was to oversee the project progress and timeline.
Expert Advisory Groups (EAGs) were established for each of the five guideline areas. They
have a core composition of a consumer, a general practitioner, content experts nominated by
the Australian Diabetes Society and the Australian Diabetes Educators Association, and other
representation as appropriate. Consumers on the expert advisory groups were provided by
Diabetes Australia as being representative of people with type 2 diabetes who are experienced
in acting as consumer representatives and who had a detailed understanding of issues
affecting people with diabetes. Terms of Reference of the EAGs is provided in Appendix ii.
Lists of the individual members of each of the EAGs are provided in each guideline.
The Project Management Team. The Diabetes Unit, at Menzies Centre for Health Policy
(formerly, the Australian Health Policy Institute), University of Sydney was subcontracted by
DA to manage the project on behalf of the Consortium. The Diabetes Unit provides guidance
on methods, technical support, data management, co-ordinates the input of the EAGs and
supervises the project staff on a daily basis. The Project Management Team consists of the
Director of the Diabetes Unit, the CEO of Diabetes Australia and the project‟s Medical
Advisor.
Guidelines Assessment Register (GAR) consultans. The NHMRC nominated a GAR
consultant for each guideline (except the Blood Glucose Control guideline) to provide
guideline developers with support in relation to utilising evidence-based findings and
applying the NHMRC criteria. Specifically, the GAR consultants provided advice on
evaluating and documenting the scientific evidence and developing evidence-based
recommendations based on the scientific literature and NHMRC procedures.
Research Officers were recruited or seconded from a variety of research and health care
disciplines and given additional training to conduct the literature searches, and review, grade
and synthesise the evidence under the supervision of the Senior Research and Project
Manager, Dr Seham Girgis, the Chairs of the EAGs and the Project Management Team.
Research Team refers to the Project Director, Senior Project Manager, Research Officers, and
the project‟s Medical Advisor.
.

Type 2 Diabetes Guidelines 9 Overview, May 2009
Figure 1: Organisational Structure
Steering Committee
Project Management Team Expert Advisory Groups
Research Team
Research Team
Research Officers
lines of communication
lines of responsibility
responsibility
GAR
Consultants

Type 2 Diabetes Guidelines 10 Overview, May 2009
3.0 Methods
3.1 Development of Protocols
At the beginning of the project, a Methods Manual was developed for the EAGs and project staff.
The Manual was based on the NHMRC Standards and procedures for externally developed
guidelines (NHMRC, 2007) and the series of handbooks on the development, implementation and
evaluation of clinical practice guidelines published by the NHMRC from 2000–03. The NHMRC
Standards and procedures document (NHMRC, 2007) introduced an extended set of levels of
evidence and an approach to assessing a body of evidence and grading of recommendations.
These standards and handbooks have superseded A guide to the development, implementation and
evaluation of clinical practice guidelines (NHMRC, 1999), which formed the basis of the initial
suite of NHMRC guidelines for type 2 diabetes.
The NHMRC has introduced a requirement for guidelines to consider issues related to cost-
effectiveness and socioeconomic impact. Two publications in the NHMRC toolkit for developing
clinical practice guidelines have been used to address these issues - how to compare the costs and
benefits: evaluation of the economic evidence (NHMRC, 2001) and using socioeconomic
evidence in clinical practice guidelines (NHMRC, 2003).
The Methods Manual developed for the project contains definitions, procedures and protocols,
descriptions of study type classifications, checklists and examples of steps and methods for
critical appraisal of the literature. It also includes the revised level of evidence and the minimum
requirements for formulating NHMRC evidence based guidelines.
3.2 Guideline Development Process
From the literature and expert opinion the following steps were identified as central to the process
of identifying sources of rigorously objective, peer reviewed information and reviewing, grading,
and synthesising the literature to generate guideline recommendations:
1. Define specific issues and generate clinically relevant questions to guide the literature
searches for each guideline topic.
2. Search the literature systematically using a range of databases and search strategies.
3. Sort the search yield on the basis of relevance to the topic area and scientific rigour.
4. Document the search strategy and the search yield.
5. Critically review, grade and summarise the evidence.
6. Assess the body of evidence according to the published NHMRC standard and formulate
guideline statements and recommendation/s in accordance with the evidence.
7. Formulate the evidence statements and recommendations.
8. Conduct quality assurance throughout all these steps.

Type 2 Diabetes Guidelines 11 Overview, May 2009
12BStep 1: Defining issues and questions to direct the literature searches
Each EAG was asked to define key issues for the guideline and to generate a set of questions
focusing on clinically relevant issues to guide the literature searches. These critical clinical issues
also formed the focus of the guideline recommendations and accompanying evidence statements.
A generic framework was developed and centred on issues such as:
What are the key treatment/management issues for this area?
What anthropometric, clinical or behavioural parameters need to be assessed?
Should everyone be assessed or are there particular risk factors which warrant selective
testing or preventative treatment?
What assessment techniques should be used?
How often should the assessment be done?
How should the results be interpreted?
What action should follow from the results (if abnormal) e.g., management, further
investigation, referral?
What are the overall costs of using the intervention? (particularly in relation to changes in
costs if changes to management are recommended)
What is the impact of socioeconomic position and other markers of interest e.g., income,
education, occupation, employment, ethnicity, housing, area of residence, lifestyle,
gender.
EAGs were also advised to frame each question using the ‘PICO’ elements as follows:
Population or Problem; Intervention (for a treatment intervention question), or Indicator or
exposure (for a prognosis or aetiology or question), or Index test (for a diagnostic accuracy
question); Comparator; and Outcome.
The resulting questions developed by each EAG are presented at the beginning of each guideline
and again in the Search Strategy and Yield Table.

Type 2 Diabetes Guidelines 12 Overview, May 2009
Step 2: Searching the literature
NHMRC clinical practice guidelines are required to be based on systematic identification and
synthesis of the best available scientific evidence (NHMRC, 2007). A number of systematic
strategies were used in this project to identify and assess scientific information from the
published literature. The search strategies were designed to reduce bias and ensure that most of
the relevant data available on type 2 diabetes were included in the present review and were
similar to those detailed in the Cochrane Collaboration Reviewers Handbook (Higgins JPT et al). Several strategies were used to identify potentially relevant studies and reviews from the
literature such as:
Electronic Databases Searches were carried out using the following databases:
Medline
Cochrane Library: Databases of Systematic Reviews, DARE, Controlled Trials Register,
Central, HTA.
Additional databases searched where indicated included:
Embase
Cinahl
Psycho Info
Eric
Other (where appropriate) such as Internet, Expert sources, Hand searching of reference
lists at the end of relevant articles.
Key words
The key words (MeSH terms and some free text terms) used when searching these electronic
databases are presented in detail in the Search Strategy and Yield Table at the end of each
guideline topic. The EAGs limited their searches through a number of methods including:
- specification of temporal constraints (e.g. 1999-2008 for the updated guideline)
- language constraints (English only)
- where there were overwhelming amounts of literature or if there was a large volume of poor
quality research, some groups imposed limits by experimental design to exclude the less
rigorous forms of research.
Details of specific inclusion criteria for the EAG are also presented, together with the key words,
at the end of each individual guideline.
Consultation with colleagues
The EAGs were encouraged to gather relevant information/articles from other experts and
colleagues. The Project Management Team collated the questions developed by each EAG to
direct the literature searches and highlight overlapping questions and requested EAGs and
Research Officers to send any articles identified as applicable to other guideline topics to the
EAG.

Type 2 Diabetes Guidelines 13 Overview, May 2009
Step 3: Sorting the search yield
Two or more members of each EAG were responsible for sorting through the search results by
scanning the lists of titles and abstracts generated by the electronic database searches,
highlighting potentially relevant articles and requesting printed full articles. Full articles were
retrieved and those which were relevant were assessed for quality. Articles were considered
relevant if they provided direct or indirect information addressing one or more of the specified
„clinical issues‟ questions and were applicable to diabetes care or prevention in Australia.
Sorting according to study design Articles with original data were sorted according to study design. Articles with the most rigorous experimental designs were reviewed in the first instance. Articles conducted to other study designs were included if they added new information not found in the papers of highest levels of evidence. Relevant papers were sorted as follows:
Meta-analysis, systematic review of randomised controlled trials (interventions)
Randomised controlled trials (RCT)
Cohort studies
Case control studies
Case series, pre-post or post studies Exclusion criteria Articles were not included for review if it was apparent that their relevance to formulating a
guideline recommendation was non-existent or negligible. Examples of reasons for non review
included criteria such as:
Studies of inappropriate patient population(s) for the question being addressed
(epidemiology, specific diet)
Hypothesis/mechanism/in vitro study/animal studies
Genetic studies that are clinically inapplicable
Non-systematic reviews which presented the author‟s opinion rather than evidence
15B

Type 2 Diabetes Guidelines 14 Overview, May 2009
Step 4: Documenting the search strategy and its yield
The search strategy (terms and limits) and yield were documented and are available for viewing
in a table at the end of each guideline. In brief, the Search Strategy and Yield Table recorded
details about the:
1. Questions being investigated
2. Electronic databases searched
3. MeSH terms and key words used to search the database
4. Methods for limiting the searches
5. Number of articles identified by each search
6. Number of articles relevant from that search
7. Number of relevant articles identified through other search processes
8. Number of articles obtained for review
9. Number of relevant articles which were systematic reviews, RCTs or well designed
population based studies, quasi-experimental and other (these were documented in the tables
according to the updated NHMRC Evidence Levels I –IV).
10. Number of articles reviewed
11. Highest level of evidence found for each question 16B

Type 2 Diabetes Guidelines 15 Overview, May 2009
Step 5. Critically reviewing, grading and summarising the evidence All relevant articles were reviewed and critically assessed using checklists recommended by the
NHMRC (2000) (NHMRC, 2000a; NHMRC, 2000b).The NHMRC checklist sets out an explicit
standardised approach to reviewing and incorporating scientific evidence into clinical practice
guidelines.
In addition, Research Officers were asked to construct tables to summarise extraction of data and
to provide a brief summary of the key results for each article.
Overall assessment of individual studies
At the conclusion of reviewing each article, the reviewers rated the evidence in a summary form
as shown in (Table 1) using the following criteria:
Levels of evidence The „interim‟ NHMRC levels of evidence (NHMRC, 2007) was used in this project to assess levels of evidence for a range of study designs (Appendix iv).
Quality rating
Magnitude of effect
Relevance rating
Criteria for quality of evidence, magnitude of effect, and relevance of evidence were based on
those provided by the NHMRC (2000a &b). These criteria are presented in Appendix iv.
Table 7: Example of an Overall Assessment Report
Assessment Category Rating
Value Low Medium High
Level of evidence
Quality rating
Magnitude of effect
Relevance rating
These assessments were then used in the evidence tables which summarises basic information
about Each Study reviewed, including an overall assessment of the evidence (Table 2).
Table 8: Example of an evidence table with overall study assessment
Author,
Year
Evidence
Level of Evidence Quality
Rating
Magnitude of
Effect Rating
Relevance
Rating Level Study Type
Author X
(1999)
III-2 Cohort High Low High

Type 2 Diabetes Guidelines 16 Overview, May 2009
Step 6. Assessing the body of evidence and formulating guideline evidence statements and recommendations
5BIn addition to considerations of the rigour of the research providing the evidence (Tables 1 and
2), principles for formulating guideline evidence statements and recommendations were derived
consistent with the NHMRC recommended standard „The NHMRC Standards for External
Developers of Guidelines (NHMRC, 2007).
For each identified clinical question, evidence statements are based on an assessment of all
included studies for that question (the Body of Evidence). The NHMRC considers the following
five components in judging the overall body of evidence (NHMRC, 2007) as specified in the
„NHMRC Body of Evidence Matrix‟ (Table 3):
The evidence base, in terms of the number of studies, level of evidence and quality of
studies (risk of bias).
The consistency of the study results.
The potential clinical impact of the proposed recommendation.
The generalisability of the body of evidence to the target population for the
guideline.
The applicability of the body of evidence to the Australian healthcare context.
Based on the body of evidence, recommendation/s was formulated to address each of the
identified clinical questions for the area. Recommendation/s was written as an action statement.
6BPrinciples for formulating the guideline recommendation/s
7BIn the course of the face-to-face meetings of the EAGs, and from published sources, principles
were identified re-affirming the need for guideline recommendations to:
Be developed systematically and objectively by synthesising the best available evidence.
8BHave potential to improve health and related outcomes whilst minimising possible
harms.
Be clinically relevant and feasible.
Take account of ethical considerations, and acceptability to patients.
Centre on interventions which are accessible to those who need them.
Propose activities within the scope of the role of those expected to use the guidelines e.g., interventions which could be expected to be conducted in routine general practice.

Type 2 Diabetes Guidelines 17 Overview, May 2009
Grading of recommendation/s
The grading of each recommendation reflects the strength of the recommendation (Table 4) and
is based on „The NHMRC Standards for External Developers of Guidelines (NHMRC, 2007).
In face-to-face meetings, the EAG, initially graded each of the five components of the NHMRC
Body of Evidence Matrix (Table 3) for each recommendation and then determined the overall
grade for the body of evidence by summing the individual component grades (Appendix v).
Cost effectiveness analyses that were based on modelling, could not be evaluated using the
NHMRC „Body of Evidence Matrix‟. Hence, cost-effectiveness recommendations were not
graded.
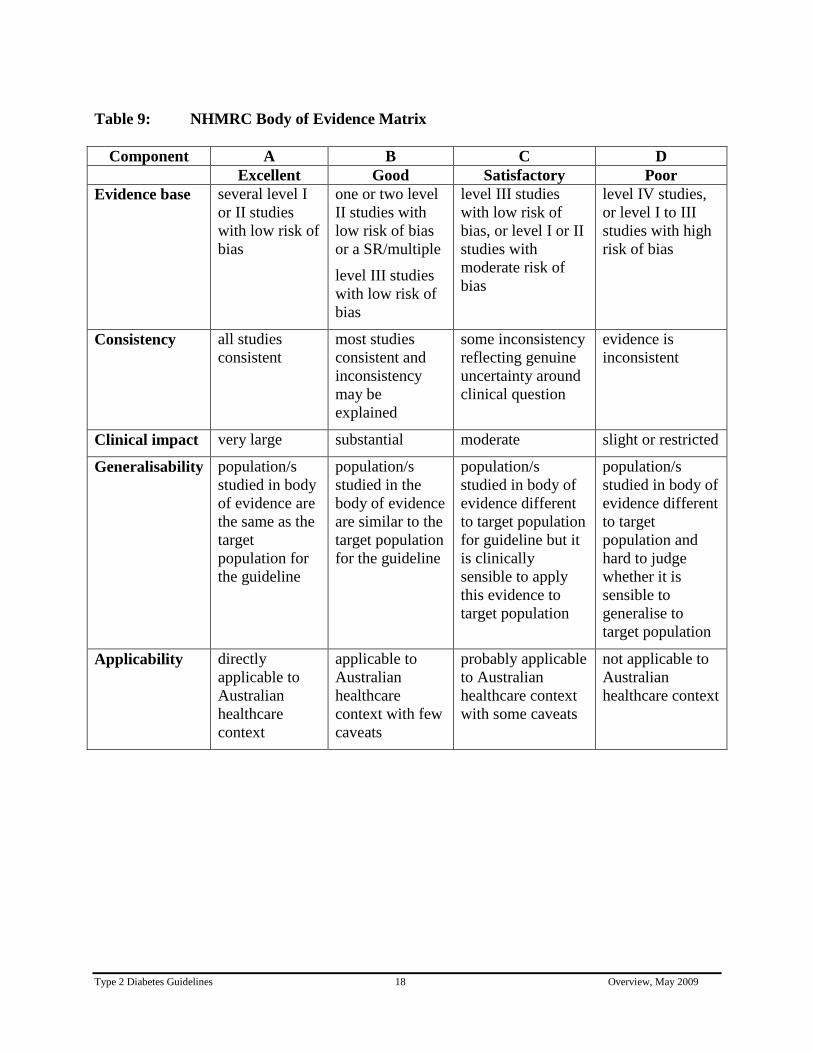
Type 2 Diabetes Guidelines 18 Overview, May 2009
Table 9: NHMRC Body of Evidence Matrix
Component A B C D
Excellent Good Satisfactory Poor
Evidence base several level I
or II studies
with low risk of
bias
one or two level
II studies with
low risk of bias
or a SR/multiple
level III studies
with low risk of
bias
level III studies
with low risk of
bias, or level I or II
studies with
moderate risk of
bias
level IV studies,
or level I to III
studies with high
risk of bias
Consistency all studies
consistent
most studies
consistent and
inconsistency
may be
explained
some inconsistency
reflecting genuine
uncertainty around
clinical question
evidence is
inconsistent
Clinical impact very large substantial moderate slight or restricted
Generalisability population/s
studied in body
of evidence are
the same as the
target
population for
the guideline
population/s
studied in the
body of evidence
are similar to the
target population
for the guideline
population/s
studied in body of
evidence different
to target population
for guideline but it
is clinically
sensible to apply
this evidence to
target population
population/s
studied in body of
evidence different
to target
population and
hard to judge
whether it is
sensible to
generalise to
target population
Applicability directly
applicable to
Australian
healthcare
context
applicable to
Australian
healthcare
context with few
caveats
probably applicable
to Australian
healthcare context
with some caveats
not applicable to
Australian
healthcare context

Type 2 Diabetes Guidelines 19 Overview, May 2009
Table 10: Definition of NHMRC grades of recommendation
Grade of
recommendation
Description
A Body of evidence can be trusted to guide practice
B Body of evidence can be trusted to guide practice in most
situations
C Body of evidence provides some support for recommendation(s)
but care should be taken in its application
D Body of evidence is weak and recommendation must be applied
with caution

Type 2 Diabetes Guidelines 20 Overview, May 2009
Step 7. Articulate the guidelines
For each guideline, clinical questions identified by EAGs are addressed in separate sections
in a format presenting:
Recommendation(s) - including grading.
Practice Point (s) – including expert consensus in absence of gradable evidence.
Evidence Statements - supporting the recommendations.
Background - to issues for the guideline.
Evidence - detailing and interpreting the key findings.
Evidence tables - summarising the evidence ratings for the articles reviewed.
At the end of the guideline, references and Search Strategy and Yield Tables documenting
the identification of the evidence sources were provided.
To ensure consistency between the guidelines, a template was designed for writers to use when drafting the guidelines.

Type 2 Diabetes Guidelines 21 Overview, May 2009
Step 8. Methods for Quality Assurance across the project
To ensure optimal accuracy and consistency within and between guideline areas, the Project Management Team conducted a range of quality assurance activities throughout the project:
Quality Assurance, Procedures and Protocols
The provision of a Methods Manual which provides written instructions to the Chairs of the
EAGs and research staff identifying the steps and processes to be followed.
The provision to the EAGs of a selection of key published resource material relevant to the
development of the guidelines (NHMRC tool kit 2000-2003; NHMRC, 2007).
Specification and training of research staff on the search process.
Quality Assurance, Methods
The appointment of a Senior Research Officer to the Project Management Team to advise on
research methods, and provide a resource and support service to the research staff.
The establishment of a Methods Advisory Group.
The development of questions based on key clinical issues for each guideline topic to focus
and guide the literature searches and the formulation of the guideline recommendations. As
previously indicated, these are listed at the beginning of each guideline and the Search
Strategy and Yield Table at the end of the guideline.
The Project Management Team collated and reviewed the questions and undertook a Delphi -
like process with the Chairs of EAGs to refine these questions. In addition, all EAGs and the
Project Management Team reviewed the combined questions during one of the three face-to-
face meetings.
The design and provision to Chairs of EAGs and Research Officers of standardised forms
documenting aspects of the search strategy used, the search yield, and the inclusion and
exclusion of articles for review. A completed Search Strategy and Yield Table follows each
guideline topic.
The Senior Research Officer reviewed:
− all search terms used to ensure that the searches were comprehensive and that the
approach was similar across groups.
− the documentation of the search process.

Type 2 Diabetes Guidelines 22 Overview, May 2009
The GAR Consultants worked closely with the Senior Research Officer and EAGs. The
GAR Consultants provided advice on evaluating and documenting the scientific evidence,
developing evidence-based recommendations based on the scientific literature, and NHMRC
procedures.
Double culling of the search yield for each guideline topic by project staff and members of
the EAG.
Double reviewing of a sample of completed reviews for each guideline topic by the Senior
Research Officer or an experienced Research Officer, or by a member of the relevant EAG.
Review of the completed recommendations and written description of the literature review for
each guideline area was undertaken to check for:
− appropriate use of references
− accurate application of evidence ratings
− congruence between the recommendations and evidence statements
− consistency between recommendations
− clarity of the literature review findings

Type 2 Diabetes Guidelines 23 Overview, May 2009
4.0 Consultation Process
The organisational structure for the Type 2 Diabetes Guidelines Development Project was
designed to involve and ensure consultation between the Guideline Development Consortium
(DA, ADS, ADEA, RACGP) and the Diabetes Unit. A number of other strategies were employed
to ensure wide consultation with a range of stakeholders and interested groups and individuals.
Initial Consultation
Prior to commencement of the project, initial consultation included contacting relevant
professional organisations to discuss the guideline development and to seek nomination of
content experts.
Internal Consultation
The internal communication and interaction between the Project Management Team and the
research officers included fortnightly meetings, email communications, and regular telephone
contact. In addition, for each guideline, there was individual informal meetings between the
research officers and their project managers.
The Project Steering Committee
The Project Steering Committee comprised representatives from various organisations (who
should be consulting with their colleagues in that organisation) include:
Diabetes Australia (Mr Matt O‟Brien)
Medical Advisor (Professor Stephen Colagiuri)
Australian Diabetes Society (Dr Maarten Kamp)
Australian Diabetes Educators Association (Ms Jane Giles)
Royal Australian Collage of General Practice (Professor Mark Harris)
Department of Health and Ageing (Ms Suzanne Prosser)
The Diabetes Unit, Menzies Centre for Health Policy (Associate Professor Ruth
Colagiuri)
During the course of the project, DA convened two face-to-face meetings and three
teleconferences of the Project Steering Committee members to provide guidance and direction to
the project.
Expert Advisory Groups
The EAGs consulted formally through the inclusion of specific interest groups on the individual
EAG. Examples include dietitians, clinicians, educators, researches, and consumers.
Communication strategies with EAG members included:
Face-to-face meetings
− an initial meeting to scope the coverage of the guideline and view the processes
required to develop it, identify and agree on the roles of the EAG.
− a final meeting to review and grade the recommendations and body of evidence form.

Type 2 Diabetes Guidelines 24 Overview, May 2009
Email communication seeking advice on research questions and search terms and
requesting review of material developed.
Chairs and individual members of EAGs, consulted with additional content experts
regarding approaches and clinical/content issues as required.
Consultation with Guidelines Assessment Register (GAR) Consultants.
The GAR consultant for each guideline provided guideline developers with support in relation to
utilising evidence-based findings and applying the NHMRC criteria. GAR consultants attended
face-to-face meetings with EAGs. They provided advice on evaluating and documenting the
scientific evidence and developing evidence-based recommendations based on the scientific
literature and NHMRC procedures.
Consultation with Consumers
Consumer representatives were selected and appointed by Diabetes Australia for each EAG to
ensure the consideration of people with type 2 diabetes with respect to their acceptability of the
proposed guideline recommendations.
Public Consultation
All guidelines went through a formal public consultation process. This process was as follows:
The guidelines were released for public consultation by Diabetes Australia through the
NHMRC designated public consultation process between August and October 2008.
The call for submissions was advertised in the national public press and a front page
website advertisement was placed on the Diabetes Australia website, which linked to a
full website advertisement.
The NHMRC also advertised the draft guidelines in their „bulletin‟.
Key stakeholder organisations (Appendix vi) were notified directly by email of the
availability of the guidelines for public review and requested to comment. The emailed
notice provided a link to the advertisement on the Diabetes Australia website.
As a result of public consultation, submissions were received and referred to the
Project Management Team:
– six submissions relating to the Primary Prevention Guideline
– four submissions relating to Case Detection and Diagnosis Guideline
– two submissions relating to Patient Education
– two submissions relating to Chronic Kidney Disease
– five submissions relating to Blood Glucose Control
– one submission did not relate to any of the guidelines but made comments on the
overall process of the guideline development which was subsequently referred to
the Diabetes Australia Guideline Consortium Steering Committee.

Type 2 Diabetes Guidelines 25 Overview, May 2009
The issues raised in these submissions were considered and consulted about internally and
externally by the guideline developers and were reviewed by the Project Management and
Research Teams, the Medical Advisor, the relevant EAG, and the GAR Consultant.
Key issues from the submissions for each guideline were summarised into table form and
corresponding responses addressing each issue were presented in separate documents
entitled “Response to Public Consultation on … ” and accompanied the guideline drafts
presented to independent review by the NHMRC.
Changes to the guidelines as a result of public consultation and as a result of independent
review by the NHMRC were incorporated into the revised final guidelines.
Informal Consultation
Further consultation occurred throughout the project with a wide variety of groups and
individuals in response to particular issues and needs. For example, the Chronic Kidney Disease
Guideline has been reviewed by the CARI peer reviewers and presented at the Dialysis,
Nephrology Transplant 2009 Workshop, Lorne Victoria. Comments from the peer reviewers and
from the workshop have been incorporated into the subsequent revision of the draft guideline.

Type 2 Diabetes Guidelines 26 Overview, May 2009
References
Australian Institute of Health and Welfare (AIHW) (2008). Diabetes: Australian Facts 2008.
Diabetes Series No. 8. Cat. no. CVD 40. AIHW, Canberra, Australia.
Barry E, Magliano D, Zimmet P, Polkinghorne K, Atkins R, Dunstan D, Maurray S, Shaw J
(2006). AusDiab 2005. The Australian Diabetes, Obesity and Lifestyle Study. International
Diabetes Institute, Melbourne, Australia.
Colagiuri R, Williamson M, Frommer M (1995). Investing to improve the outcomes of diabetes
care. NSW Department of Health Public Health Bulletin 6:99-102.
Colagiuri S, Colagiuri R, Conway B, Grainger D, Davy P (2003). DiabCo$ Australia: Assessing
the burden of type 2 diabetes in Australia, Diabetes Australia, Canberra, Australia.
CSAG (1994). Standards of clinical care for people with Diabetes: Report of the Clinical
Standards Advisory Group. HMSO, London, UK.
Dunstan D, Zimmet P, Welborn T, De Courten M, Cameron A, Sicree R, Dwyer T, Colagiuri S,
Jolley D, Knuiman M, Atkins R, Shaw J (2002). The rising prevalence of diabetes and impaired
glucose tolerance: the Australian Diabetes, Obesity and Lifestyle Study. Diabetes Care
25(5):829-834.
Field MJ & Lohr K, eds (1990). Clinical practice guidelines: directions for a new program.
Institute of Medicine, National Academy Press, Washington DC, US.
Higgins JPT, Green S, eds. Cochrane Handbook for Systematic Reviews of Interventions 4.2.6.
(updated September 2006). Available at:
http://www.cochrane.org/resources/handbook/hbook.htm. Accessed: December 2007.
International Diabetes Federation (IDF), 2006. Diabetes Atlas, third edition,
1H http://www.eatals.idf.org (accessed 10 August 2008).
Magliano D, Barr E, Zimmet P, Cameron A, Dunstan D, Colagiuri S, Jolley D, Owen N, Phillips
P, Tapp R, Welborn T, Shaw J (2008). Glucose indices, health behaviors, and incidence of
diabetes in Australia: the Australian Diabetes, Obesity and Lifestyle Study. Diabetes Care
31(2):267-272.
National Health and Medical Research Council (NHMRC) (1999). A guide to the development,
implementation and evaluation of clinical practice guidelines. National Health and Medical
Research Council, Canberra, Australia.
National Health and Medical Research Council (NHMRC) (2001). How to compare the costs and
benefits: evaluation of the economic evidence. NHMRC, Canberra, Australia.

Type 2 Diabetes Guidelines 27 Overview, May 2009
National Health and Medical Research Council (NHMRC) (2000a). How to review the evidence:
systematic identification and review of the scientific literature. NHMRC, Canberra, Australia.
National Health and Medical Research Council NHMRC (2000b). How to use the evidence:
assessment and application of scientific evidence. . NHMRC, Canberra, Australia.
National Health and Medical Research Council (NHMRC) (2003). Using socioeconomic
evidence in clinical practice guidelines. NHMRC, Canberra, Australia.
National Health and Medical Research Council (NHMRC) (2007). NHMRC additional levels of
evidence and grades for recommendations for developers of guidelines. NHMRC, Canberra,
Australia.
National Health and Medical Research Council (NHMRC) (2007). NHMRC standards and
procedures for externally developed guidelines. NHMRC, Canberra, Australia.
New South Wales (NSW) Department of Health (1996). Improving diabetes care and outcomes:
Principles of care and guidelines for the clinical management of diabetes mellitus. New South
Wales Department of Health, Sydney, Australia.

Type 2 Diabetes Guidelines 28 Overview, May 2009
APPENDICES

Type 2 Diabetes Guidelines 29 Overview, May 2009
Appendix i: Terms of Reference of Steering Committee
Type 2 Diabetes Guidelines Project
1. Scope The Steering Committee is a composite body which provides guidance and direction to the
project and advice in relation to the project to the Department of Health and Ageing via
Diabetes Australia.
2. Function The role of the Steering Committee is to oversight and monitors the project progress and
timelines.
3. Membership The Steering Committee will comprise representatives from the following organisations:
Diabetes Australia
The Diabetes Unit, Australian Health Policy Institute
Australian Diabetes Society
Australian Diabetes Educators Association
Royal Australian College of General Practitioners
Medical Advisor
Consumer – person with type 2 diabetes nominated by Diabetes Australia.
The Department of Health and Ageing (the Department) will be represented in an advisory role.
The final composition of the Steering Committee, the operating procedures and the Chair of the
Committee will be agreed by the Department.
If a representative is unable to attend a meeting/teleconference they may nominate a proxy
representative from their own organisation.
4. Quorum and Voting The quorum for Steering Committee meetings is to be 50% of membership plus one additional
member.
The Steering Committee shall always attempt to achieve consensus. In the event of decisions
requiring a vote, each member of the Committee shall exercise a single vote. Decisions will be by
a majority and the Chair shall have a casting vote.
5. Communication The Steering Committee will communicate directly with Diabetes Australia who in turn will
liaise with the Department. Communication between the Steering Group and other teams and
groups is essential and will be facilitated by the Chair of the Committee.

Type 2 Diabetes Guidelines 30 Overview, May 2009
Frequency of Meetings The Steering Committee will meet on at least five occasions throughout the contract period.
These meetings will comprise two face-to-face meetings and three teleconferences,
throughout the contract period.
6. Executive and Operational Support The Steering Group Secretariat will be provided by Diabetes Australia. The Secretariat will
provide support in writing minutes and co-ordinating meetings
7. Funding The costs of travel, accommodation, meeting location (or teleconference) expenses and other
activities proposed by the Steering Committee will be agreed and borne by Diabetes
Australia.

Type 2 Diabetes Guidelines 31 Overview, May 2009
Appendix ii: Terms of Reference for Expert Advisory Groups
Type 2 Diabetes Guidelines Project
Purpose
The Expert Advisory Groups (EAGs) for the National Evidence Based Guidelines for Type 2
Diabetes are convened by The Diabetes Unit, Menzies Centre for Health Policy (formerly
Australian Health Policy Institute), The University of Sydney under the head agreement between
Diabetes Australia and the Department of Health and Ageing to support the development of the
guidelines by providing:
1. Overall technical and content advice and critical comment
2. Input into the development or revision of research questions to guide the literature reviews
3. Guidance on search terms and for the literature review
4. Review of drafts of the guidelines and recommendations at critical points along the
continuum of their development
5. Perspectives on the feasibility and applicability of the guidelines from the perspective of their
own disciplines and their peers and colleagues
Duration
The EAGs are convened for the duration of the project. It is anticipated this will cover
approximately 18 months up to end 2008.
Frequency of Meetings
It is anticipated that there will be three meetings of the EAGs mainly by teleconference with
one face-to-face meeting at commencement.
The EAG members may also be asked to comment on emailed information from time to time.
Expenses
Reasonable expenses for travel to meeting will be reimbursed on presentation of original receipts
Conflict of Interests
EAG members are asked to declare any/all perceived conflict/s of interest

Type 2 Diabetes Guidelines 32 Overview, May 2009
Appendix iii: NHMRC Evidence Hierarchy, designations of ‘levels of evidence’ according to type of research question
Level Intervention Diagnostic accuracy Prognosis Aetiology Screening Intervention
I A systematic review of level II
Studies
A systematic review of
level
II studies
A systematic review of
level II studies
A systematic review of
level II studies
A systematic review of
level II studies
II A randomised controlled trial A study of test accuracy with: an independent, blinded comparison with a valid reference standard, among consecutive persons with a defined clinical presentation
A prospective cohort study
A prospective cohort
study
A randomised controlled
trial
III-1 A pseudorandomised controlled trial (i.e. alternate allocation or some other method)
A study of test accuracy with: an independent, blinded comparison with a valid reference standard, among non-consecutive persons with a defined clinical presentation
All or none All or none A
pseudorandomised
controlled trial (i.e. alternate allocation or some other method)
III-2 A comparative study
with concurrent controls: ▪ Non-randomised,
experimental trial ▪ Cohort study ▪ Case-control study ▪ Interrupted time series with
a control group
A comparison with
reference standard that
does not meet the
criteria required for
Level II and III-1
evidence
Analysis of prognostic
factors amongst
persons in a single
arm of a randomised
controlled trial
A retrospective cohort
study
A comparative study
with concurrent
controls: ▪ Non-randomised,
experimental trial ▪ Cohort study ▪ Case-control study
III-3 A comparative study
without concurrent
controls:
Diagnostic case-control study
A retrospective cohort
study
A case-control study A comparative study
without concurrent
controls:

Type 2 Diabetes Guidelines 33 Overview, May 2009
▪ Historical control study ▪ Two or more single
arm study ▪ Interrupted time series
without a parallel control group
▪ Historical control study ▪ Two or more single
arm study
IV Case series with either
post-test or pre-test/post-
test outcomes
Study of diagnostic yield (no reference standard)
Case series, or cohort
study of persons at
different stages of
disease
A cross-sectional study
or case series
Case series
(Source: NHMRC 2007)

Type 2 Diabetes Guidelines 34 Overview, May 2009
Appendix iv: Study Assessment Criteria
I. Study quality criteria
Systematic reviews
1. Were the questions and methods clearly stated?
2. Is the search procedure sufficiently rigorous to identify all relevant studies?
3. Does the review include all the potential benefits and harms of the intervention?
4. Does the review only include randomised controlled trials?
5. Was the methodological quality of primary studies assessed?
6. Are the data summarised to give a point estimate of effect and confidence intervals?
7. Were differences in individual study results adequately explained?
8. Is there an examination of which study population characteristics (disease subtypes,
age/sex groups) determine the magnitude of effect of the intervention?
9. Were the reviewers' conclusions supported by data cited?
10. Were sources of heterogeneity explored?
Randomised controlled trials
1. Were the setting and study subjects clearly described?
2. Is the method of allocation to intervention and control groups/sites independent of
the decision to enter the individual or group in the study ?
3. Was allocation to study groups adequately concealed from subjects, investigators
and recruiters including blind assessment of outcome?
4. Are outcomes measured in a standard, valid and reliable way?
5. Are outcomes measured in the same way for both intervention and control groups?
6. Were all clinically relevant outcomes reported?
7. Are factors other than the intervention e.g. confounding factors, comparable between
intervention and control groups and if not comparable, are they adjusted for in the
analysis?
8. Were >80% of subjects who entered the study accounted for at its conclusion?%
9. Is the analysis by intention to intervene (treat)?
10. Were both statistical and clinical significance considered?
11. Are results homogeneous between sites? (Multi-centre/multi-site studies only).
Cohort studies
1. Are study participants well-defined in terms of time, place and person?
2. What percentage (%) of individuals or clusters refused to participate?
3. Are outcomes measured in a standard, valid and reliable way?
4. Are outcomes measured in the same way for both intervention and control groups?
5. Was outcome assessment blind to exposure status?
6. Are confounding factors, comparable between the groups and if not comparable, are
they adjusted for in the analysis?
7. Were >80% of subjects entered accounted for in results and clinical status
described?
8. Was follow-up long enough for the outcome to occur
9. Was follow-up complete and were there exclusions from the analysis?
10. Are results homogeneous between sites? (Multicentre/multisite studies only).
Case-control studies
1. Was the definition of cases adequate?

Type 2 Diabetes Guidelines 35 Overview, May 2009
2. Were the controls randomly selected from the source of population of the cases?
3. Were the non-response rates and reasons for non-response the same in both groups?
4. Is possible that over-matching has occurred in that cases and controls were matched
on factors related to exposure?
5. Was ascertainment of exposure to the factor of interest blinded to case/control
status?
6. Is exposure to the factor of interest measured in the same way for both case and
control groups in a standard, valid and reliable way (avoidance of recall bias)?
7. Are outcomes measured in a standard, valid and reliable way for both case and
control groups?
8. Are the two groups comparable on demographic characteristics and important
potential confounders? and if not comparable, are they adjusted for in the analysis?
9. Were all selected subjects included in the analysis?
10. Was the appropriate statistical analysis used (matched or unmatched)?
11. Are results homogeneous between sites? (Multicentre/multisite studies only).
Diagnostic accuracy studies
1. Has selection bias been minimised
2. Were patients selected consecutively?
3. Was follow-up for final outcomes adequate?
4. Is the decision to perform the reference standard independent of the test results (ie
avoidance of verification bias)?
5. If not, what per cent were not verified?
6. Has measurement bias been minimised?
7. Was there a valid reference standard?
8. Are the test and reference standards measured independently (ie blind to each other)
9.
10. If tests are being compared, have they been assessed independently (blind to each
other) in the same patients or done in randomly allocated patients?
11. Has confounding been avoided?
12. If the reference standard is a later event that the test aims to predict, is any
intervention decision blind to the test result?
(Sources: adapted from NHMRC1999, NHMRC 2000a, NHMRC 2000b, Liddle et al 96;
Khan et 2001)
Study quality – Rating
The following was used to rate the quality of each study against the study type criteria listed
above.
High: all or all but one of the criteria were met
Medium: 2 or 3 of the criteria were not met
Low: 4 or more of the criteria were not met

Type 2 Diabetes Guidelines 36 Overview, May 2009
II. Classifying magnitude of the effect
Ranking Statistical significance Clinical importance of
benefit
High Difference is statistically
significant
AND There is a clinically
important benefit for the full
range of estimates defined by
the confidence interval.
Medium Difference is statistically
significant
AND The point estimate of effect
is clinically important
BUT the confidence interval
includes some clinically
unimportant effects
Low Difference is statistically
significant|
OR
Difference is not statistically
significant (no effect) or shows
a harmful effect
AND
AND
The confidence interval does
not include any clinically
important effects
The range of estimates
defined by the confidence
interval includes clinically
important effects. (Source: adapted from the NHMRC classification (NHMRC 2000b)
III. Classifying the relevance of the evidence
Ranking Relevance of the evidence
High Evidence of an effect on patient-relevant clinical outcomes, including
benefits and harms, and quality of life and survival
Or
Evidence of an effect on a surrogate outcome that has been shown to be
predictive of patient-relevant outcomes for the same intervention
Medium
Evidence of an effect on proven surrogate outcomes but for a different
intervention
Or
Evidence of an effect on proven surrogate outcomes but for a different
intervention and population
Low
Evidence confined to unproven surrogate outcomes.
(Source: adapted from the NHMRC classification (NHMRC 2000b)

Type 2 Diabetes Guidelines 37 Overview, May 2009
Appendix v: NHMRC Evidence Statement Form
Key question(s): Evidence table ref:
1. Evidence base (number of studies, level of evidence and risk of bias in the included studies)
A Several Level I or II studies with low risk of bias
B one or two Level II studies with low risk of bias or SR/multiple Level III studies with low risk of bias
C Level III studies with low risk of bias or Level I or II studies with moderate risk of bias
D Level IV studies or Level I to III studies with high risk of bias
2. Consistency (if only one study was available, rank this component as ‘not applicable’)
A All studies consistent
B Most studies consistent and inconsistency can be explained
C Some inconsistency, reflecting genuine uncertainty around question
D Evidence is inconsistent
NA Not applicable (one study only)
3. Clinical impact (Indicate in the space below if the study results varied according to some
unknown factor (not simply study quality or sample size) and thus the clinical impact of the intervention could not be determined)
A Very large
B Moderate
C Slight
D Restricted
4. Generalisability
A Evidence directly generalisable to target population
B Evidence directly generalisable to target population with some caveats
C Evidence not directly generalisable to the target population but could be sensibly applied
D Evidence not directly generalisable to target population and hard to judge whether it is sensible to apply
5. Applicability
A Evidence directly applicable to Australian healthcare context
B Evidence applicable to Australian healthcare context with few caveats
C Evidence probably applicable to Australian healthcare context with some caveats
D Evidence not applicable to Australian healthcare context

Type 2 Diabetes Guidelines 38 Overview, May 2009
Other factors (Indicate here any other factors that you took into account when assessing the evidence base (for example, issues that might cause the group to downgrade or upgrade the recommendation)
EVIDENCE STATEMENT MATRIX
Please summarise the development group’s synthesis of the evidence relating to the key question, taking all the above factors into account.
Component Rating Description
Evidence base
Consistency
Clinical impact
Generalisability
Applicability
Indicate any dissenting opinions
RECOMMENDATION
What recommendation(s) does the guideline development group draw from this evidence? Use action statements where possible.
GRADE OF RECOMMENDATION

Type 2 Diabetes Guidelines 39 Overview, May 2009
IMPLEMENTATION OF RECOMMENDATION Please indicate yes or no to the following questions. Where the answer is yes please provide explanatory information about this. This information will be used to develop the implementation plan for the guidelines.
Will this recommendation result in changes in usual care? YES
NO
Are there any resource implications associated with implementing this recommendation? YES
NO
Will the implementation of this recommendation require changes in the way care is currently organised? YES
NO
Are the guideline development group aware of any barriers to the implementation of this recommendation?
YES
NO

Type 2 Diabetes Guideline 40 Overview, May 2009
Appendix vi: Key stakeholder organisations notified of public consultation
Diabetes Australia State and Territory member organisations including:
− Australian Diabetes Society
− Australian Diabetes Educators Association
University Schools of Nursing, Medicine, Podiatry, Nutriton/ Dietetics
Australian Podiatry Association
Australian Podiatry Council
Eyes on Diabetes
Cooperative Centre for Aboriginal Health
Australian Centre for Diabetes Strategies
Public and private Diabetes Centres throughout Australia (for which we were able to
obtain email addresses)
State and Federal health departments