national equity fund
TRANSCRIPT

NATIONAL EQUITY FUND
Interim Report
For the six months ended 30th September 2019
National Asset Management Limited 07, Glen Aber Place, Colombo 3.
Phone: 0112445911 Fax: 0112445903 Email: [email protected]

Table of Contents
Report of the Investment Manager 1
Statement of Comprehensive Income 2
Statement of Financial Position 3
Statement of Movement in Unit Holders Fund 4
Notes To the Financial Statements 5-10
Corporate Information 11
NATIONAL EQUITY FUNDInterim Report 2019

NATIONAL EQUITY FUND INTERIM REPORT
1HFY20
67%3%
28%
2% Equity
Cash and CashEquivalents (Net ofPayables)CommericalPapers
Debentures
19.3%
10.8%
10.4%
9.9%
8.9%
Banks, Finance & Insurance
Manufacturing
Telecommunications
Diversified Holdings
Healthcare
Dear Investor,
We take pleasure in presenting the interim report of the National Equity Fund (NEF) for the 6 months ended 30th September 2019.
Performance Review The NEF saw an increase of 6.81% for the six month period ended September 2019. While the All
Share Price Index (ASPI) and the S&P Sri Lanka 20 Index (S&P SL20) increased by 3.26% and 0.76%
respectively.
During 1HFY20, the fund reported a total investment income of LKR 130.48 Mn compared to a loss
of LKR 323.42 Mn last year. The significant increase in total investment income was due to the net
change in unrealized gains on financial assets held for trading, which accounted for LKR 185.99 Mn
during 1HFY20 compared to an unrealized loss of 288.16M Mn last year. The fund reported a net
profit of LKR 109.43 Mn during the 6 month period compared to a loss of LKR 349.19 Mn last year.
Market Review The ASPI gained 3.26% and the S&P SL 20 gained 0.76% during the period under review. Foreigners
became net purchasers during the period. The low interest rate regime that prevailed in many
foreign markets had led investors to focus on foreign markets. For the 6 month period, CSE
recorded a net inflow of LKR 3,534 Mn. Participation from foreigners stood at 38.1%, while average
daily turnover for the period was LKR 665.7 Mn.
(Source: CSE, JB Portal)
The benchmark 12 month Treasury Yields declined during the 1H FY19 and stood at 8.41%. The
decrease was led by CBSL reducing Standing Lending Facility Rate by 100bps to 8% at the end of the
period under review. Private sector credit growth followed a downward trend during the period
mainly due to the political uncertainty that was hanging over the market. (Source: CBSL)
The Sri Lankan economy reported a GDP growth of 2.6% for 1H CY19. Growth was mainly led by the
strong performance of the agricultural sector which grew by 3.2% YoY. Industries sector saw a
modest growth of 2.3% while the services sector grew by 2.8%. Within the industries sector, the
construction subsector recorded a healthy growth rate of 4.7%. Within the services sector,
telecommunications, IT and financial services all saw significant growth for the period under review
(10.9%, 11.9% and 8.8% respectively). On the external sector, as of August 2019, the trade deficit
declined by 36.5% YoY and stood at USD 540 Mn. Significant growth in textile and garments exports
as well as reduction personal vehicle imports helped to narrow the trade deficit. Tourism earnings
declined by 28.3% to USD 270 Mn, while worker remittances declined by 3% to USD 518 Mn. The
overall BoP position to August 2019 posted a surplus of USD 1,451 Mn. (Source: Department of
Census and Statistics, CBSL and External Sector Performance August 2019)
Portfolio Composition The Fund has a 67% allocation to equity and a 28% allocation to commercial papers and the remainder in debentures and money market.
NEF’s highest equity concentrations are in Banks, Manufacturing and Telecommunications sectors.
Sincerely, The Fund Management Team 18th November 2019
Performance Comparison
(Non-annualised returns)
6M* (%)
12M (%)
60M (%)
120M (%)
ASPI 3.26 -2.11 -20.88 95.27
S&P SL 20 0.76 -8.07 -31.66 60.05
NEF 6.81 -1.81 -15.92 123.67
* Six month period ending 30th September 2019
Asset Allocation
Top 5 Sector Allocations
1

For the Six month period ended 30 September 2019
2019 2018Notes Rs. Rs.
INVESTMENT INCOMEDividend income 10.1 34,233,179 24,783,669 Interest income 10.2 33,349,654 29,613,079 Realised (losses)/gains on financial assets held at fair value through profit or loss 6.4 (123,086,844) (89,657,353) Unrealised (losses) /gains on financial assets held at fair value through profit or loss 6.5 185,985,255 (288,155,443) Total investment income 130,481,245 (323,416,048)
EXPENSESManagement and Registrar fees (14,426,016) (17,651,113) Trustee fees (1,858,071) (2,273,463) Audit fee and expenses (270,331) (384,794) Bank charges (27,214) (25,279) Professional charges (185,615) (136,278) Other expenses (22,051) (385,270) Brokerage Expense (3,988,702) (4,880,487) Consultancy fees (274,500) - Total operating expenses (21,052,501) (25,736,685)
Net operating profit/(loss) 109,428,744 (349,152,733)
FINANCE COSTInterest expense - (36,323)
PROFIT/(LOSS) AFTER DEDUCTIONS AND BEFORE TAX 109,428,744 (349,189,056)
Income tax expense -
PROFIT/(LOSS) AFTER DISTRIBUTIONS AND TAX 109,428,744 (349,189,056)
INCREASE/(DECREASE) IN NET ASSETS ATTRIBUTABLE TO UNIT HOLDERS 109,428,744 (349,189,056)
NATIONAL EQUITY FUND
STATEMENT OF COMPREHENSIVE INCOME
Interim Report 2019
2


STATEMENT OF CHANGES IN UNITHOLDERS' FUNDSFor the Six month period ended 30 September 2019
2019 2018Rs. Rs.
UNIT HOLDERS' FUNDS AT THE BEGINNING OF THE PERIOD 1,613,293,613 2,207,772,334
Increase/ (decrease) in net assets attributable to Unit Holders 109,428,744 (349,189,056)
Received on unit creations 25,374,408 20,955,061
Payments on unit redemptions (42,939,733) (120,455,393)
Income distribution to unit holders (31,557,874) -
UNIT HOLDERS' FUNDS AT THE END OF THE PERIOD 1,673,599,157 1,759,082,945
Interim Report 2019NATIONAL EQUITY FUND
4

Notes To the AccountsFor the period ended 30th September 2019
NOTES TO THE ACCOUNTS
1
2 Income is recognised on accrual basis.
3
4
2019 2018
5 Net Assets Value per Unit 26.02 26.99 No. of units as at 30th September 63,205,200.7 63,543,531.4
NATIONAL EQUITY FUND
There are no material Contingent Liabilities or contingent Assets which require disclosure in the financial statements.
No circumstances have arisen since the Balance Sheet date, which would require adjustments or disclosure in the Financial Statements.
All figures are unaudited. Where necessary comparative figures have been adjusted to confirm with the changes in presentation in the current period.
Interim Report 2019
5

NOTES TO THE FINANCIAL STATEMENTS
For the Six month period ended 30 September 2019
6 FINANCIAL ASSETS - FAIR VALUE THROUGH PROFIT OR LOSS 2019 2018Rs. Rs.
Quoted equity securities (6.1) 1,079,375,374 916,060,629 Unquoted equity securities (Note 6.2) 25,731,930 27,122,382 Debt securities - quoted debentures (6.3) 36,456,963 40,048,626
1,141,564,267 983,231,637 6.1 Quoted equity securities
Cost as at 30 September 1,211,144,311 1,100,598,104 Appreciation/(depreciation) of market value quoted equity securities (131,768,937) (184,537,475) Market Value as at 30 September 1,079,375,374 916,060,629
2019 20186.1.1 Company Number of Market Holdings Number of Market Holdings
Shares Value as a % of Shares Value as a % of Net Asset Net Asset
Rs. Value Rs. ValueBanks, Finance and InsuranceNational Development Bank PLC 331,000 32,371,800.00 2% - - -
Hatton National Bank PLC - Voting 715,725 110,150,078 7% 705,217 148,095,570 8%
Sampath Bank PLC 722,441 110,533,473 7% 75,445 18,099,256 1%
Union Bank of Colombo PLC 4,726,849 63,812,462 4% - - -Seylan Bank PLC - Non Voting - - - 1,349,768 53,315,836 3%
316,867,812 19% 219,510,662 12%
Beverages, Food and TobaccoSunshine Holdings PLC 1,210,016 54,450,720 3% 1,210,016 62,920,832 4%
54,450,720 3% 62,920,832 4%
Diversified HoldingsHemas Holdings PLC 1,470,022 108,046,617 6% - - -
108,046,617 -
Health Care Asiri Hospital Holdings PLC 6,208,342 134,721,021 8% - -
300,000 12,270,000 1% 300,000 12,030,000 1%146,991,021 9% 12,030,000 1%
NATIONAL EQUITY FUND Interim Report 2019
6

ManufacturingTokyo Cement Company (Lanka) PLC - Voting - - - 3,600,000 98,640,000 6%Tokyo Cement Company (Lanka) PLC - Non Vo - - - 3,720,000 88,536,000 5%Teejay Lanka PLC 4,995,979 177,357,255 11% 4,033,022 116,151,034 7%Alumex PLC - - - 525,845 6,835,985 0%
177,357,255 11% 310,163,019 18%
Power and EnergyLaugfs Gas PLC - Non Voting - - - 663,000 10,143,900 1%Laugfs Gas PLC - Voting - - - 1,318,182 23,331,821 1%Lanka IOC PLC - - - 3,975,000 111,300,000 6%
- - 171,898,103 10%
TelecommunicationDialog Axiata PLC 16,071,882 170,361,949 10% 7,171,882 85,345,396 5%
170,361,949 10% 85,345,396 5%
Construction & EngineeringAccess Engineering PLC 5,850,000 105,300,000 6% 5,850,000.00 81,315,000 5%
105,300,000 6% 81,315,000 5%Total value of quoted equity securities in (At Market Value) 1,079,375,374 64% 943,183,011 54%
7

NOTES TO THE FINANCIAL STATEMENTSFor the Six month period ended 30 September 2019
6 FINANCIAL ASSETS - FAIR VALUE THROUGH PROFIT OR LOSS (Contd...)
6.2 Unquoted equity securities 2019 2018Rs. Rs.
- Cost as at 30 th September 27,122,381 27,122,382 Depreciation of market value unquoted equity securities (1,390,451) - Market Value as at 30 th September 25,731,930 27,122,382
2019 20186.2.1 Company Number of Market Holdings Number of Market Holdings
Shares Value as a % of Shares Value as a % of Net Asset Net Asset
Rs. Value Rs. Value
Laugfs Power Limited 1,318,182 8,238,434 0.5% 1,318,182 6,406,365 0%Laughs Power Limited - NV 663,000 3,534,532 0.2% 663,000 3,222,180 0%
1,450,000 0.1% 1,318,182 10,215,911 1%Laughs Leisure Limited - NV 663,000 623,220 0.0% 663,000 5,138,250 0%Laughs Eco Limited 1,318,182 8,317,353 0.5% 1,318,182 1,423,637 0%Laugfs Eco Limited - NV 663,000 3,568,390 0.2% 663,000 716,040 0%
25,731,930 1.5% 27,122,382 2%
6.3 Quoted debentures
Cost Market Holding as a Cost Market Holding as aValue % of Net Value % of Net
Rs. Rs. Asset Value Rs. Rs. Asset Value
Seylan Bank Plc 5,000,000 5,400,964 0% 5,000,000 4,965,207 0%Access Engneering PLC 25,000,000 25,993,539 2% 25,000,000 25,375,605 1%Sampath Bank Plc 5,000,000 5,062,461 0% 5,000,000 5,227,328 0%Hemas Holdings Plc - - - 4,260,000 4,480,486 0%
35,000,000 36,456,963.07 2% 39,260,000 40,048,626 2%
6.4 Net realised (losses)/gains on financial assets held for trading 2019 2018Rs. Rs.
Equity securitiesProceeds on sale of equity shares 269,007,770 416,211,529 Average cost of equity shares sold (380,786,757) (505,868,882) Loss Mandatory Offer -Union Bank of Colombo Plc (11,307,857) -
(123,086,844) (89,657,353)
6.5 Net change in unrealised gains/(losses) on financial assets held for trading
Equity securities 184,981,230 (288,068,013) Debt securities 1,004,026 (87,430)
185,985,255 (288,155,443)
7
Carrying Holding as a Carrying Holding as aValue % of Net Value % of Net Rs. Asset Value Rs. Asset Value
7.1 Investments in commercial papers
Dunamis Capital PLC 31,090,465 2% 11,294,188 1%Dunamis Capital PLC 81,742,459 5% 160,920,329 9%First Capital Holdings PLC 59,410,230 4% 173,408,328 9%Lanka Orix Leasing Company PLC 102,813,432 6% 41,102,860 2%Lanka Orix Leasing Company PLC 34,169,555 2% 32,172,237 2%Softlogic Holdings PLC 38,314,963 2% 103,013,649 6%Softlogic Finance PLC 52,866,648 3% 22,081,882 1%Softlogic Finance PLC 30,841,149 2% - - Softlogic Finance PLC 25,410,162 2% - -
456,659,063 27% 543,993,473 22%7.2 Repurchase agreements
Wealth Trust Securities Limited 192,798,175 11%- - 192,798,175 11%
456,659,063 27% 736,791,648 33%
2019 2018
NATIONAL EQUITY FUND Interim Report 2019
2019 2018
FINANCIAL ASSETS - DEBT INSTRUMENTS AT AMORTISED COST
8
For the Six month period ended 30 September 2019
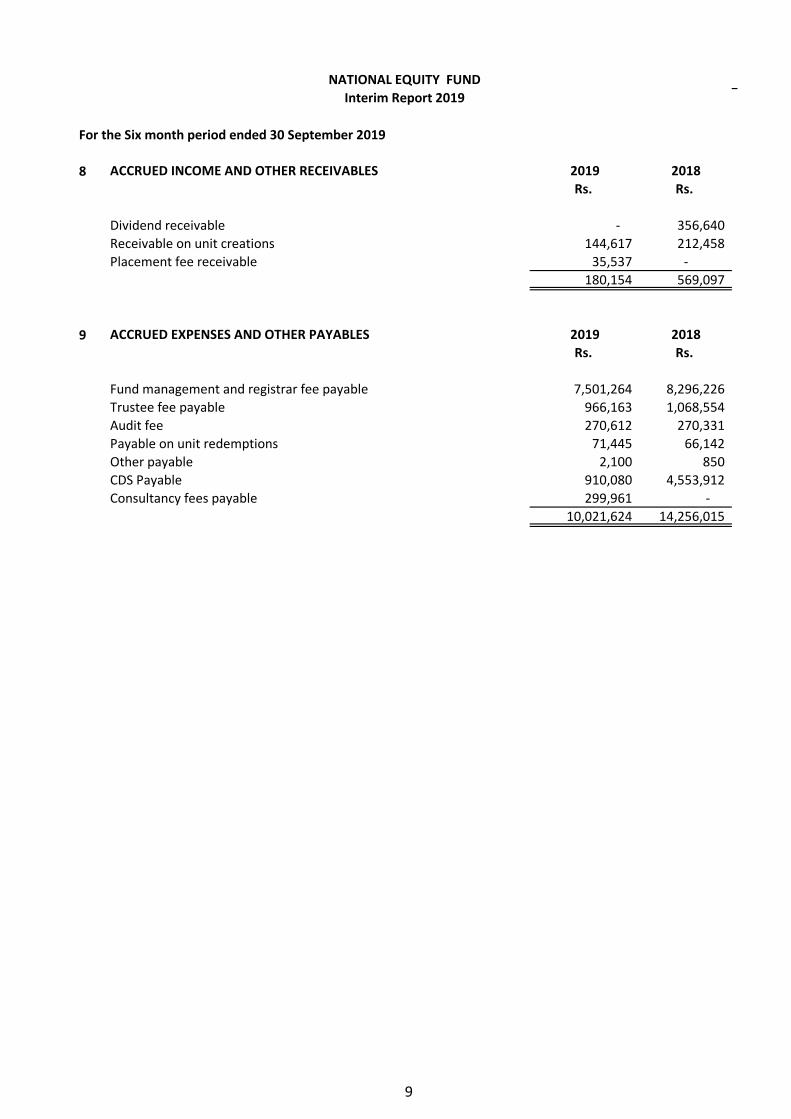
8 ACCRUED INCOME AND OTHER RECEIVABLES 2019 2018Rs. Rs.
Dividend receivable - 356,640 Receivable on unit creations 144,617 212,458 Placement fee receivable 35,537 -
180,154 569,097
9 ACCRUED EXPENSES AND OTHER PAYABLES 2019 2018Rs. Rs.
Fund management and registrar fee payable 7,501,264 8,296,226 Trustee fee payable 966,163 1,068,554 Audit fee 270,612 270,331 Payable on unit redemptions 71,445 66,142 Other payable 2,100 850 CDS Payable 910,080 4,553,912 Consultancy fees payable 299,961 -
10,021,624 14,256,015
Interim Report 2019NATIONAL EQUITY FUND
9
NOTES TO THE FINANCIAL STATEMENTSFor the Six month period ended 30 September 2019
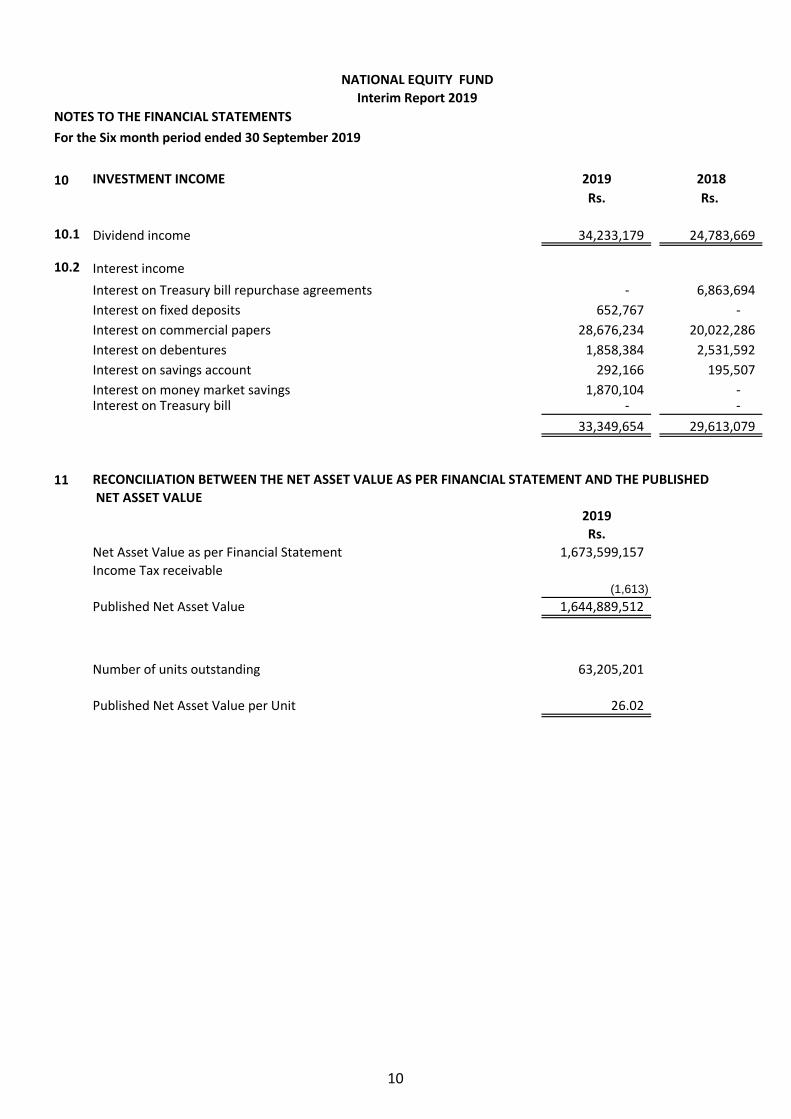
10 INVESTMENT INCOME 2019 2018Rs. Rs.
10.1 Dividend income 34,233,179 24,783,669
10.2 Interest incomeInterest on Treasury bill repurchase agreements - 6,863,694 Interest on fixed deposits 652,767 - Interest on commercial papers 28,676,234 20,022,286 Interest on debentures 1,858,384 2,531,592 Interest on savings account 292,166 195,507 Interest on money market savings 1,870,104 - Interest on Treasury bill - -
33,349,654 29,613,079
11 RECONCILIATION BETWEEN THE NET ASSET VALUE AS PER FINANCIAL STATEMENT AND THE PUBLISHED NET ASSET VALUE
2019Rs.
Net Asset Value as per Financial Statement 1,673,599,157 Income Tax receivable
(1,613) Published Net Asset Value 1,644,889,512
Number of units outstanding 63,205,201
Published Net Asset Value per Unit 26.02
Interim Report 2019NATIONAL EQUITY FUND
10

CORPORATE INFORMATION
Trustee & Custodian Deutsche Bank AG86 ,Galle RoadColombo 03
Auditors Ernst & YoungChartered Accountants201, De Saram PlaceColombo 10
Bankers Deutsche Bank AG86, Galle RoadColombo 03
Lawyers F J & G De SaramAttorneys-at-Law & Notries Public216, De Saram PlaceColombo 10
Managers & Registrars National Asset Management Limited (NAMAL)No. 07 ,Glen Aber Place,Colombo 03
National Asset Management LimitedBoard of Directors (As of 30th September 2019)
Mr. Alexis Lovell ChairmanMr. Indrajit Wickramasinghe DirectorMr. Tyronne de Silva DirectorMr. Malinda Samaratunga DirectorMr. Wijenanada Dambawinne DirectorMr. Suren Madhanayake DirectorMs. Khoo Siew Bee DirectorMr.Kapila Nanayakkara DirectorMr. Rusiru Abeyasinghe Director
NATIONAL EQUITY FUNDInterim Report 2019
11