national climate and water briefing - bom.gov.au · •3rd warmest year, after 2013 and 2005 ......
TRANSCRIPT

25 January 2018
National Climate and
Water Briefing

Australian and global
climate in 2017
Blair TrewinSenior Climatologist, Bureau of Meteorology
Lead author, WMO annual global climate statement
Australian climate in 2017
• Australian climate in 2017
• Global climate in 2017

Australian temperatures: 2017
• 3rd warmest year, after 2013 and 2005
• 2017 mean annual temperature was 0.95 °C
above 1961–1990 average
• Past five years (2013 to 2017) have all
ranked in the seven warmest on record
-1.5
-1
-0.5
0
0.5
1
1.5
1910 1920 1930 1940 1950 1960 1970 1980 1990 2000 2010
Mean t
em
pera
ture
anom
aly
(°C
)
Year
Annual mean temperature anomaly Australia (1910–2017)
Based on 1961–1990 average)

Australian temperatures: 2017
• Warmest year on record for:
– New South Wales
– Queensland
• All other States and Territories ranked in
top 12
• Parts of southwestern Queensland more
than 2 °C above average
• Parts of eastern Kimberley (WA) only area
with below-average mean temperatures
2017 annual mean temperature

Australian rainfall: 2017
• Wet in the west, dry in the east
• National rainfall 8% above average
• 9th wettest year for Western Australia
(42% above average)
• Driest year since 2006 for New South
Wales (18% below average)
• Very dry in Gippsland, until December rain
• Locally very dry in parts of inland
Queensland
2017 annual rainfall

Australian rainfall: 2017
Seasonal changes
• Wet start and finish to the year, dry in the
middle
• January: 4th wettest on record nationally
• June: 2nd driest nationally; driest in
Victoria
• September: driest on record for New
South Wales and Murray–Darling Basin
• October: 2nd wettest on record for
Queensland
January to April
May to September
October to December

Rainfall deficiencies: 2017
• Long-term drought continues in parts of
Queensland
– Very dry from April 2012 to May 2016
• Heavy out-of-season rains from June to
September 2016
• Dry conditions resumed in late 2016
• Five successive below-average wet
seasons in western Queensland: longest
sequence since 1960s
• Also consistently dry in Townsville area
Rainfall deficiencies
April 2012 – December 2017
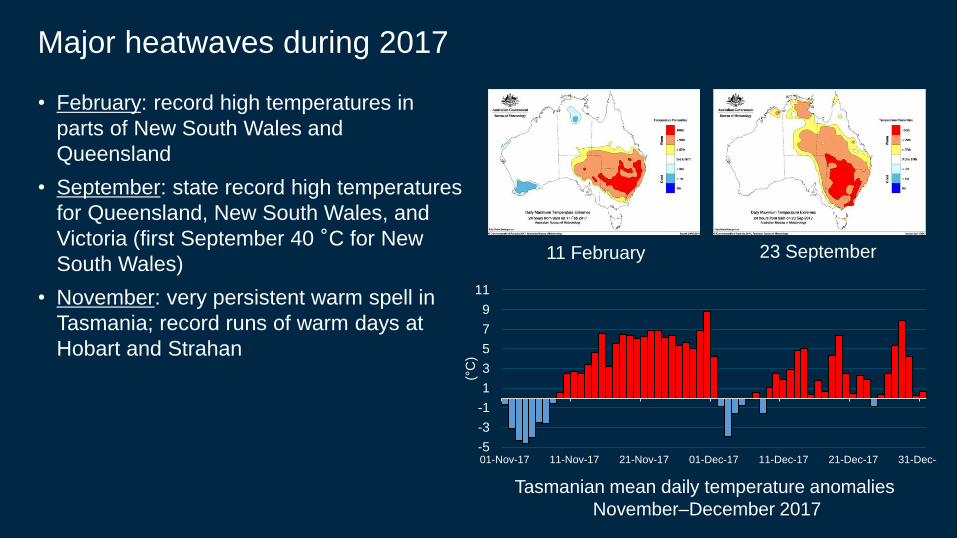
Major heatwaves during 2017
• February: record high temperatures in
parts of New South Wales and
Queensland
• September: state record high temperatures
for Queensland, New South Wales, and
Victoria (first September 40 °C for New
South Wales)
• November: very persistent warm spell in
Tasmania; record runs of warm days at
Hobart and Strahan
11 February 23 September
Tasmanian mean daily temperature anomalies
November–December 2017
-5
-3
-1
1
3
5
7
9
11
01-Nov-17 11-Nov-17 21-Nov-17 01-Dec-17 11-Dec-17 21-Dec-17 31-Dec-17(°
C)

Tropical cyclone Debbie, 24–29 March 2017
• Major impact on Queensland and NSW
– Peaked at category 4 (category 3 at
landfall)
– Wind damage and major flooding in
southeastern Queensland and
northeastern New South Wales
– Daily rainfall totals above 600 mm near
Mackay and in Gold Coast hinterland
– Insured loss $1.61B (second-largest for
an Australian cyclone, after Tracy)
• Total of 9 cyclones for season (slightly
below average)
400 mm
300 mm
200 mm
150 mm
100 mm
50 mm
25 mm
15 mm
10 mm
5 mm
1 mm
0 mm
Rainfall totals
27–31 March 2017

Cold winter and late-season frosts
• Lowest average winter minimum
temperatures since 1982 in some places
• Some record low temperatures in early
July in the Riverina and Gippsland
(e.g. Deniliquin, Sale)
• Damaging late-season frosts in early
November in parts of western Victoria
Daily minimum temperature extremes 24 hours to
9am on 1 July 2017

Recent increases in frosts: a case study from Mildura
Average winter minimum temperature
Coldest night of year
After 1997:
• averages stable
• extremes have fallen

Global climate in 2017
• Australian climate in 2017
• Global climate in 2017

• One of the world's three warmest years
on record
• Approx. 0.46 °C above 1981–2010
average
• 1.1 °C above pre-industrial average
• Not as warm as 2016, but close to 2015
• Warmer than any year prior to 2015
• 2013–2017: warmest five-year period
on record
Global average temperatures: 2017
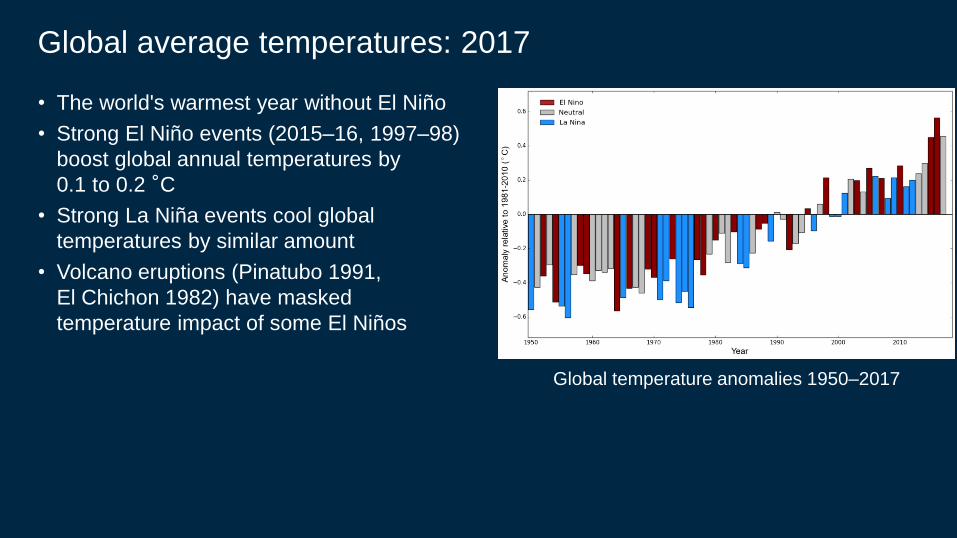
Global average temperatures: 2017
• The world's warmest year without El Niño
• Strong El Niño events (2015–16, 1997–98)
boost global annual temperatures by
0.1 to 0.2 °C
• Strong La Niña events cool global
temperatures by similar amount
• Volcano eruptions (Pinatubo 1991,
El Chichon 1982) have masked
temperature impact of some El Niños
Global temperature anomalies 1950–2017

Strongest warming in high northern latitudes

Greenhouse gas concentrations: 2017
• CO2 concentrations continue to reach new records
– Seasonal peak (May–June) was the highest
on record
– Annual growth in 2016 was largest on record;
global records for 2017 not yet available
• 2017: one of the smallest Antarctic
ozone holes of the last 30 years Carbon dioxide
Ozone hole size

Arctic and Antarctic sea ice both well below average

Tropical cyclones: 2017
• Very active North Atlantic hurricane
season
– Three destructive hurricanes (Harvey,
Irma, Maria) affected United States and
Caribbean
– Total losses estimated at over
US$300B
• Overall global tropical cyclone activity near
average: northwestern Pacific and
Southern Hemisphere below average
• Major tropical cyclone flooding in
Philippines, southern India and Vietnam
late in 2017
Hurricane Irma (centre), Jose (right) and Katia (left)

Drought continues in east Africa, but some recovery in late 2017

Critical water supply situation in Cape Town
Annual rainfall in main Cape Town catchments
(Source: Piotr Wolski, University of Cape Town)

Indian monsoon: 2017
• Indian monsoon near average, but still
destructive floods
• Major flooding in August in far eastern
India, and downstream areas of
Bangladesh (1000+ deaths)
• Other major floods in 2017 include
Sri Lanka (May), Bangladesh (June),
southern China (July), Vietnam (October–
November)
• Flood-related landslides also prominent:
Sierra Leone (August)

Major heatwaves: 2017
• Southern South America in January:
45 °C in Chile; national record by more
than 3 °C
• Southwestern Asia in May: 54 °C in
Turbut, Pakistan – equal Asian record (if
confirmed)
• Southern Europe in July–August:
numerous records in Spain, Italy and
Croatia
• Other major centres with record high
temperatures included Shanghai, Hong
Kong and San Francisco

Major wildfires: 2017
• Northern California fires in October:
largest losses ever for a wildfire
(> US$5B)
• Two major wildfire disasters in Portugal
(June and October), and major fires
elsewhere in Mediterranean
• 2016–17 was worst fire season on record
for Chile
Wildfires in Portugal, October 2017

2017 summary
• Third-warmest year on record for Australia
• Wet in the west, generally dry in the east
• One of the three warmest years globally
• East African drought continues
• Very active North Atlantic hurricane season

Thank you
Questions?Blair Trewin

Climate and water
conditions and outlook
Gary AllanAgriculture Services, Bureau of Meteorology

Recent conditions
• Recent Conditions
• Evolution of climate drivers
• Seasonal outlook

Summer temperatures
December January to-date Summer to-date
Max
Min
As at 24 January 2018
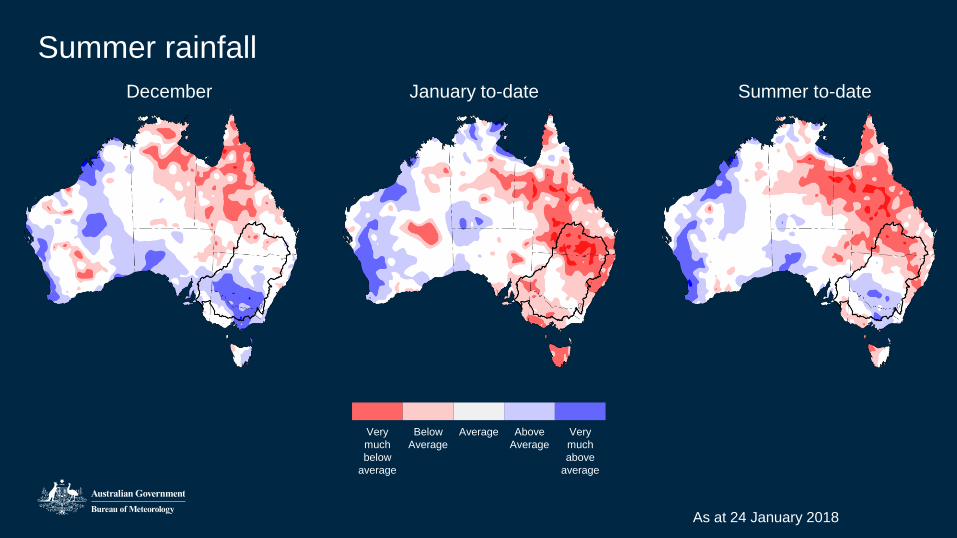
Summer rainfall
December January to-date Summer to-date
Very
much
below
average
Below
Average
Average Above
Average
Very
much
above
average
As at 24 January 2018

TROPICAL CYCLONE HILDA, WA
(26–29 DEC 2017)
Category 2 system, crossed the coast
south of Broome
SEVERE THUNDERSTORMS, VIC (19 DEC 2017)
Severe thunderstorms with large hail, flash flooding and
damaging winds
HEAVY RAIN AND FLOODING, SE AUS (1–3 DEC 2017)
Record-breaking rainfall led to major flooding, mostly in
NE Vic
SEVERE TO EXTREME HEATWAVE, EASTERN AUS
(DEC 2017)
Prolonged heatwave affected large areas including Sydney,
Melbourne and Canberra.
SEVERE THUNDERSTORMS, SE QLD (25–26 DEC 2017)
Giant hail and destructive winds
Major severe weather events: December 2017

TROPICAL CYCLONE Joyce, WA
(6–14 JAN 2018)
Category one system crossed the
Pilbara coast
SEVERE TO EXTREME HEATWAVE, EASTERN AUS
(JAN 2018)
Prolonged heatwave affected large areas including Sydney,
Melbourne and Canberra.
FIRES, NSW (19–24 JAN 2018)
4 major fires active in week of 21 January
Major severe weather events: January 2018
SEVERE TO EXTREME HEATWAVE, AUS
(7–8 JAN 2018)
Heatwave affected large areas of southern and
eastern Australia

Rainfall: December 2017
Effective rainfallRainfall deciles

Lower-layer soil moisture (10–100cm)
January : 1-month change January to date: deciles

Observed streamflow: December 2017
Australia-wide
South West Coast
Tasmania
Murray–Darling
Basin
South East
Coast - Vic
South East
Coast - NSW
North East Coast

Water storage levels
As at 22 January 2018

Some implications for agriculture
• Severe heatwaves and dry conditions through January affecting livestock,
summer broadacre and horticultural crops in many affected areas
• Moisture stress observed in (e.g.) grain sorghum in areas such as southern Queensland;
reduced yields likely unless conditions improve
• Worsening soil moisture deficiencies and continued high temperatures will also impact
pastures; may necessitate supplementary feeding for livestock (or selling off stock)
• Native pasture growth in northern Australia particularly affected
• On-farm water storages increasingly being drawn down
• Demand increasing for irrigation water for crops and pastures

Northern rainfall onset for 2017–2018*
Northern Australia: percentage of mean rainfall from 1 September
* first 50 mm of
rain for season

Delayed monsoon onset
• Monsoon onset: 21 January 2018
• Average onset: 27 December
• Latest onset: 25 January 1972
• Most of January, monsoon trough
just off shore

Evolution of
climate drivers
• Recent Conditions
• Evolution of climate drivers
• Seasonal outlook

La Niña declared: early December
Latest NINO3.4: –0.7°C
Sea surface temperature anomalies

-2
-1.6
-1.2
-0.8
-0.4
0
0.4
0.8
1.2
1.6
2
observed
BOM
Canada
ECMWF
Japan
Meteofrance
NASA
NOAA
UKMO
El Niño–Southern Oscillation outlook: January 2018
OISSTv2 (1981-2010)
NINO3.4 outlook
NIN
O3
.4 (
°C)
La Niña
El NiñoNow

Outlooks
• Evolution of climate drivers
• Comparison of 2010 to recent conditions
• Seasonal outlook

February–April 2018 rainfall outlook
Chance of exceeding median rainfall
March
FebruaryPast accuracy
Past accuracy Past accuracy

February–April 2018 maximum temperature outlook
Chance of exceeding median maximum
temperature
Past accuracy
Past accuracy
Past accuracy
February
March

February–April 2018 minimum temperature outlook
Chance of exceeding median minimum
temperature
FebruaryPast accuracy
Past accuracy Past accuracy
March

Seasonal streamflow outlookJanuary–March 2018
South West Coast
South East Coast
(NSW)
Murray–Darling
Basin
Australia
TasmaniaSouth East Coast
(Vic)
North East Coast

Summary
• La Niña declared in early December (weak)
• Summer rainfall below average, despite reasonable December rainfall in some regions
• Soil moisture very much below average in Queensland; some increases in other regions
• Bushfire risks heightened—dry conditions and extreme temperatures
• Northern monsoon onset delayed; now active and exerting broader influence
• Above-average rainfall likely in February, especially in the west
• High to near-median streamflows more likely for January to March
Thank you
QuestionsGary Allan
Photo: XXXXXXXXXXXXXXXXXX

Introduction to Meteorology
Course
Meteorology Trainer and Course Manager
Philip Perkins
• Learn about weather and climate• 23 two-day courses around Australia
in 2018
• Canberra courses at the Bureau's
office (Treasury Building, Parkes)• 10-11 April
• 25-26 September
• Courses for agencies can be arranged
• Introduction to Climate course
coming

Next Briefing
Thursday, 1 March 2018
Photo: Malcolm Watson