national children’s
TRANSCRIPT
National Children’s
Food Survey II
Main Report
Irish Universities Nutrition Alliance (IUNA)

Table of contents
Chapter 1 Background and Methodology
This chapter provides a detailed description of the background information and methodology
used in the National Children’s Food Survey II (NCFS II).
Chapter 2 Sampling data
This chapter provides information about the socio-demographic details of the children who
took part in NCFS II.
Table 2.1 Number of participants in the survey by gender and age group (n & (%))
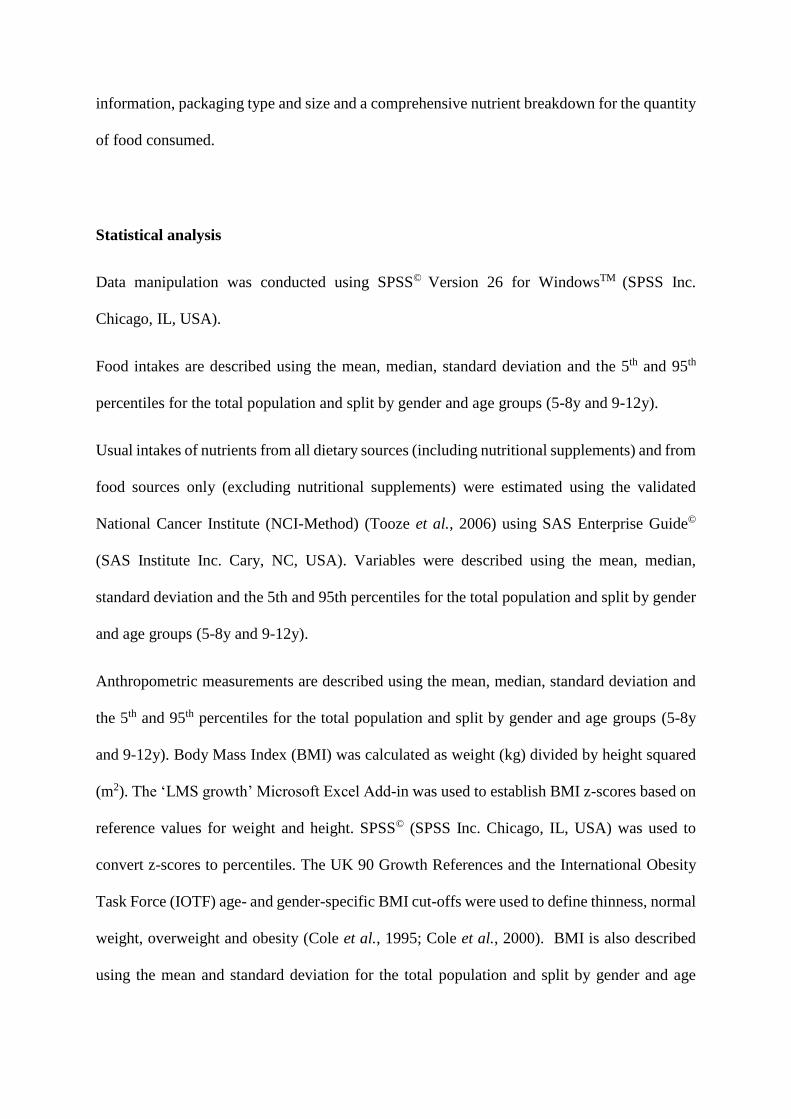
Table 2.2 Number of participants in the survey for the total population and by gender
and age group (n & (%))
Table 2.3 Geographical location of participants for the total population and by gender
and age group (n & (%))
Table 2.4 Social class and socio-economic group of participants for the total population
and by gender and age group (n & (%))
Table 2.5 Education level of participants' parents for the total population and by gender
and age group (n & (%))
Chapter 3 Food Consumption
This chapter presents the intakes of different food groups for the total population and by
consumers only.
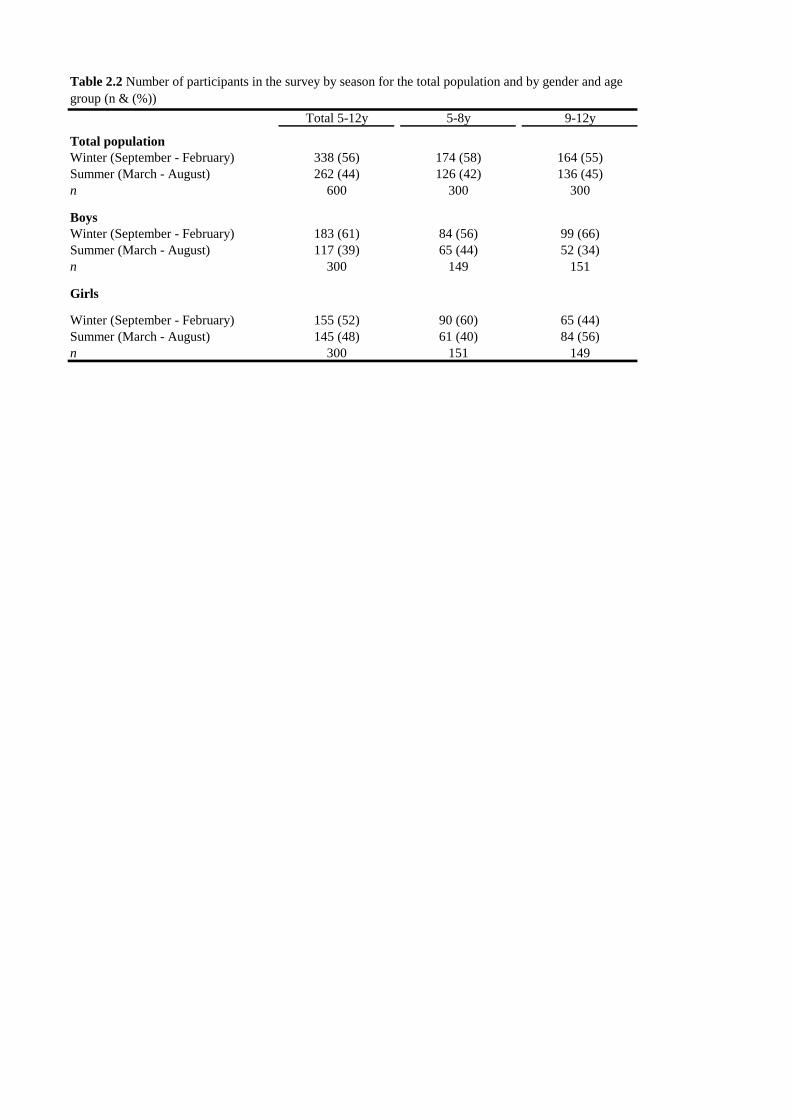
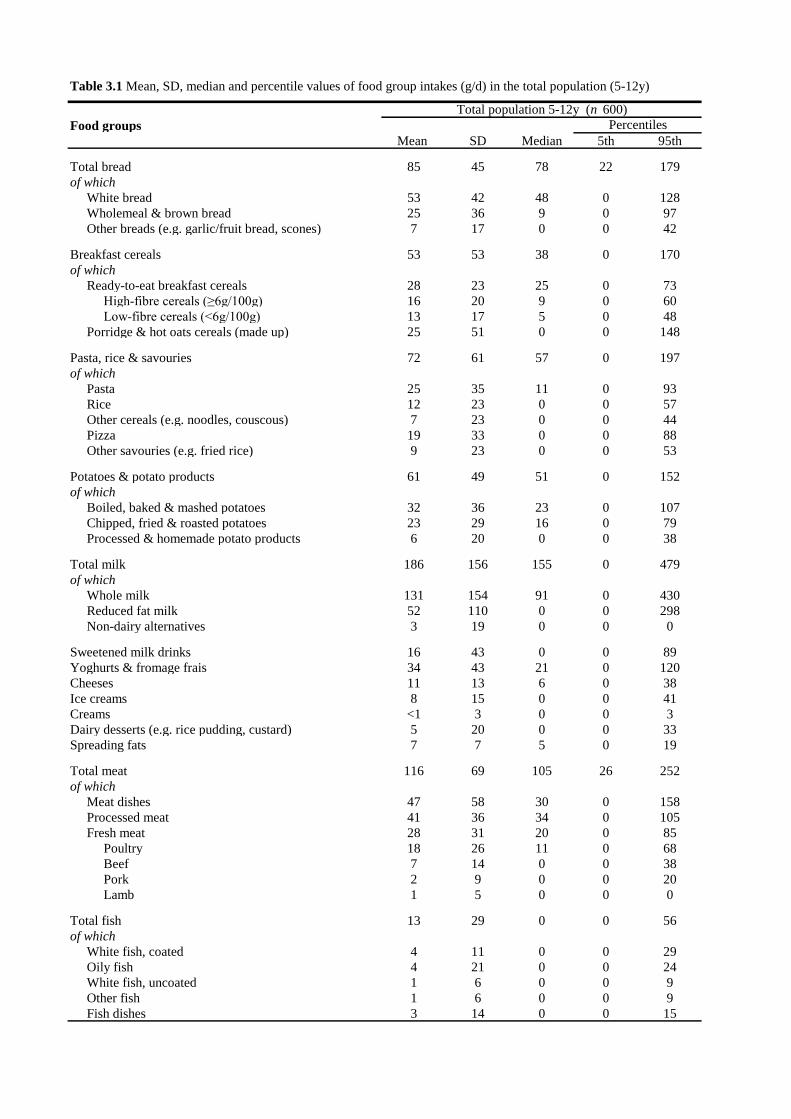
Table 3.1 Mean, SD, median and percentile values of food group intakes (g/d) in the
total population (5-12y)
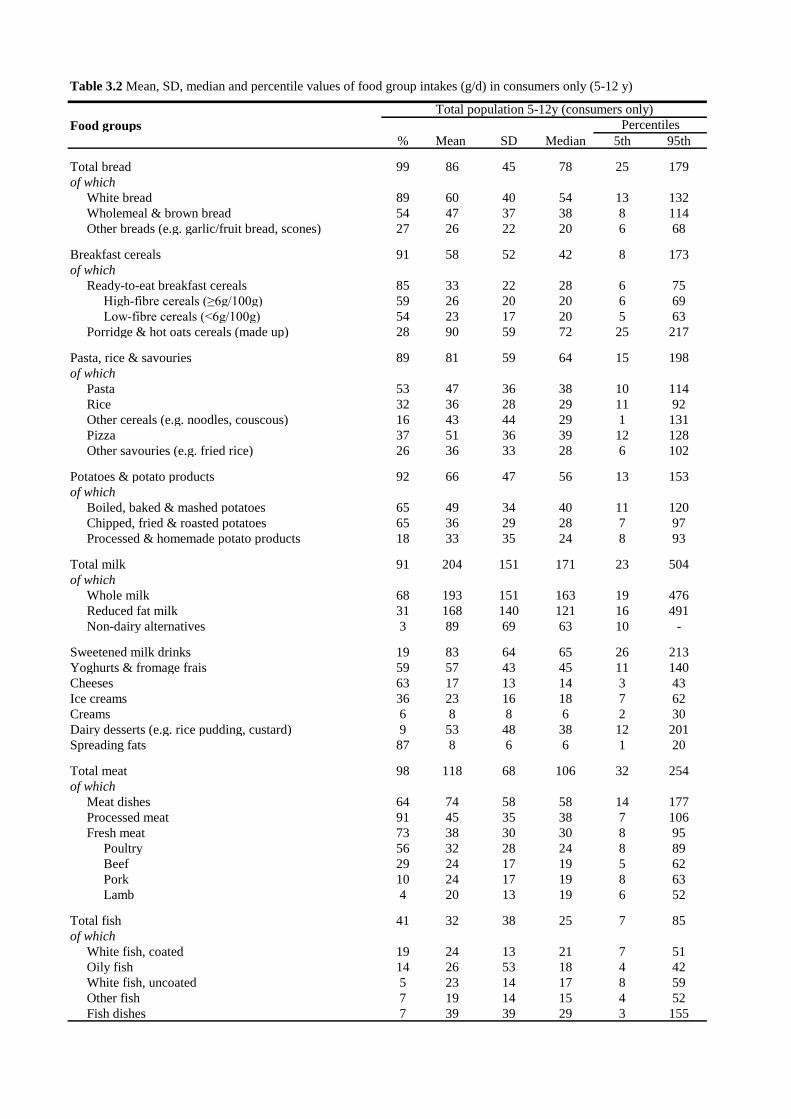
Table 3.2 Mean, SD, median and percentile values of food group intakes (g/d) in
consumers only (5-12y)
Table 3.3 Mean, SD, median and percentile values of food group intakes (g/d) by age
group, in the total population
Table 3.4 Mean, SD, median and percentile values of food group intakes (g/d) by age
group, in consumers only
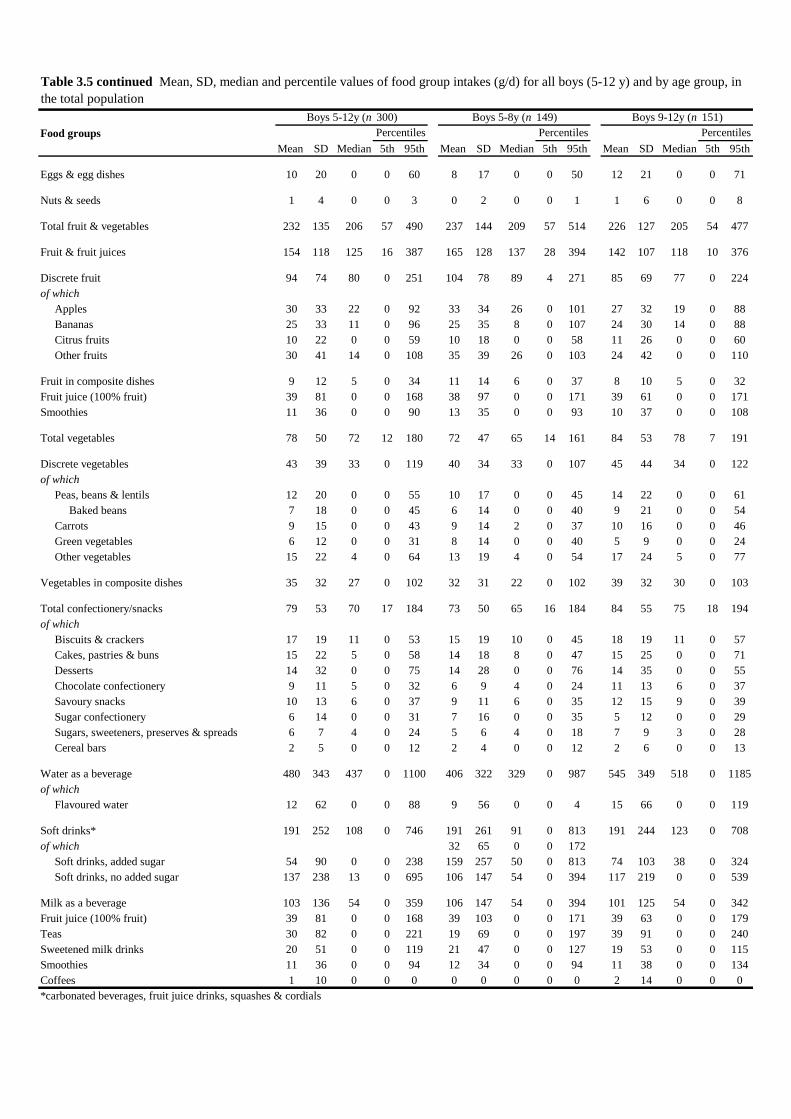
Table 3.5 Mean, SD, median and percentile values of food group intakes (g/d) for all
boys (5-12y) and by age group, in the total population
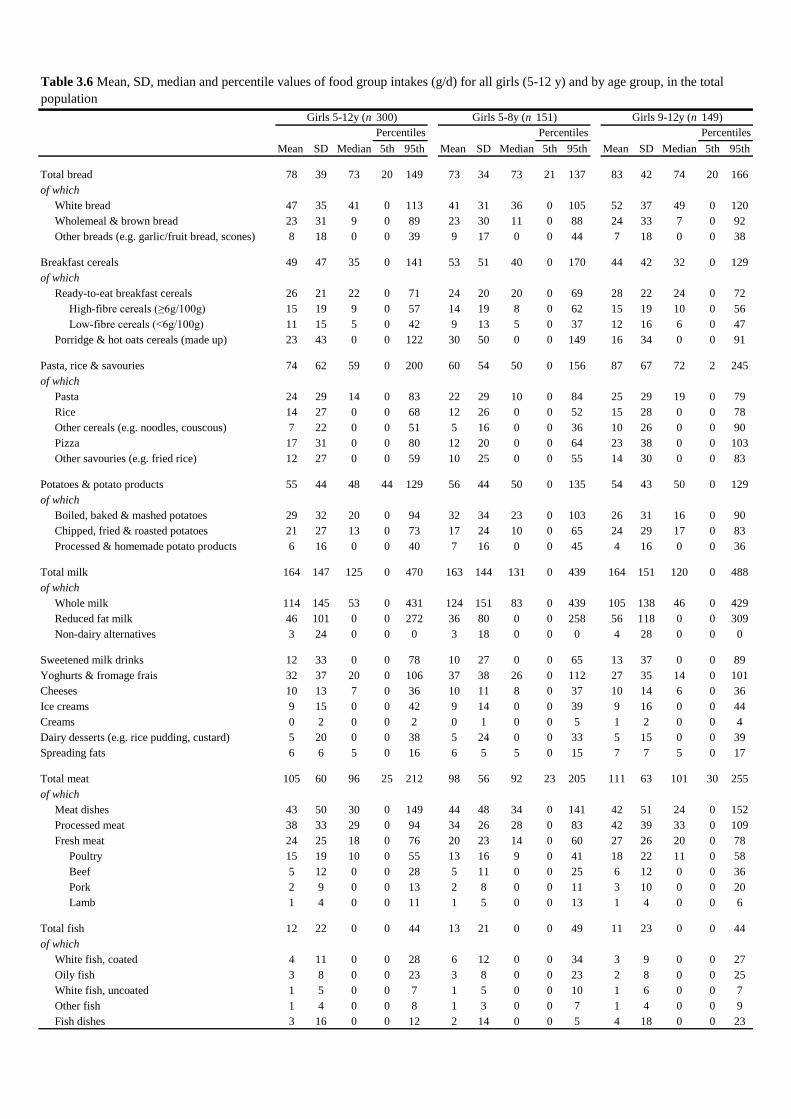
Table 3.6 Mean, SD, median and percentile values of food group intakes (g/d) for all
girls (5-12y) and by age group, in the total population
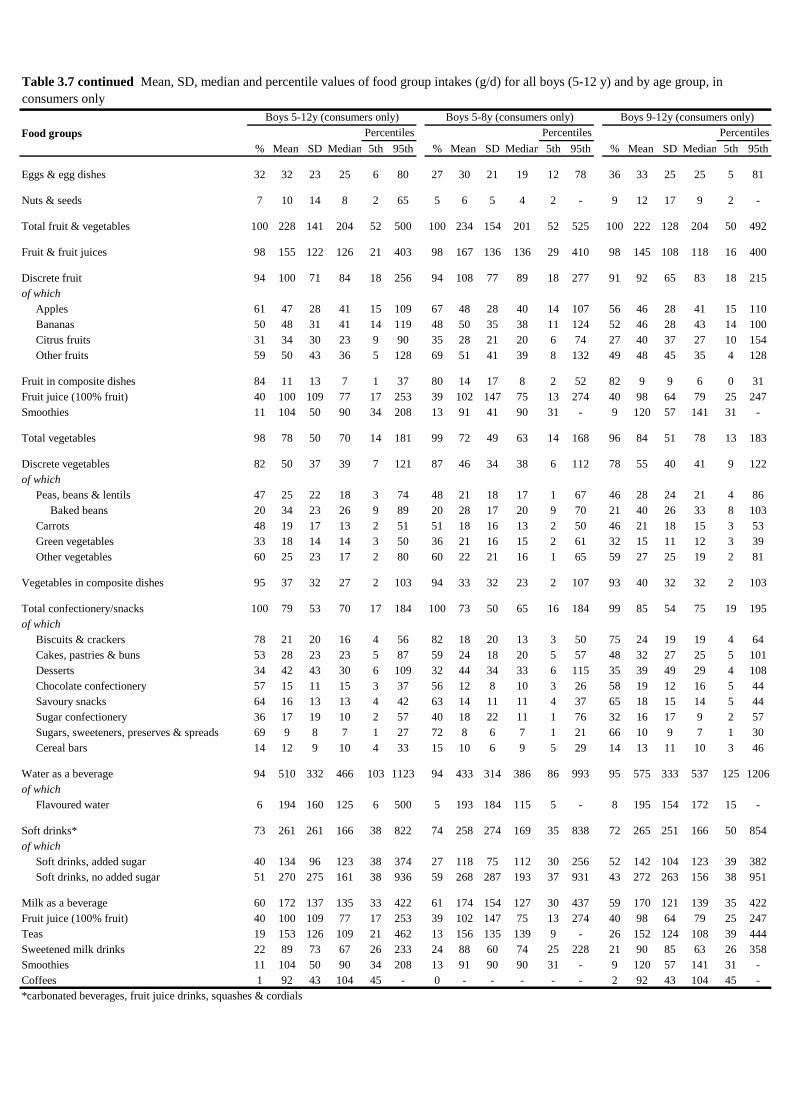
Table 3.7 Mean, SD, median and percentile values of food group intakes (g/d) for all
boys (5-12y) and by age group, in consumers only
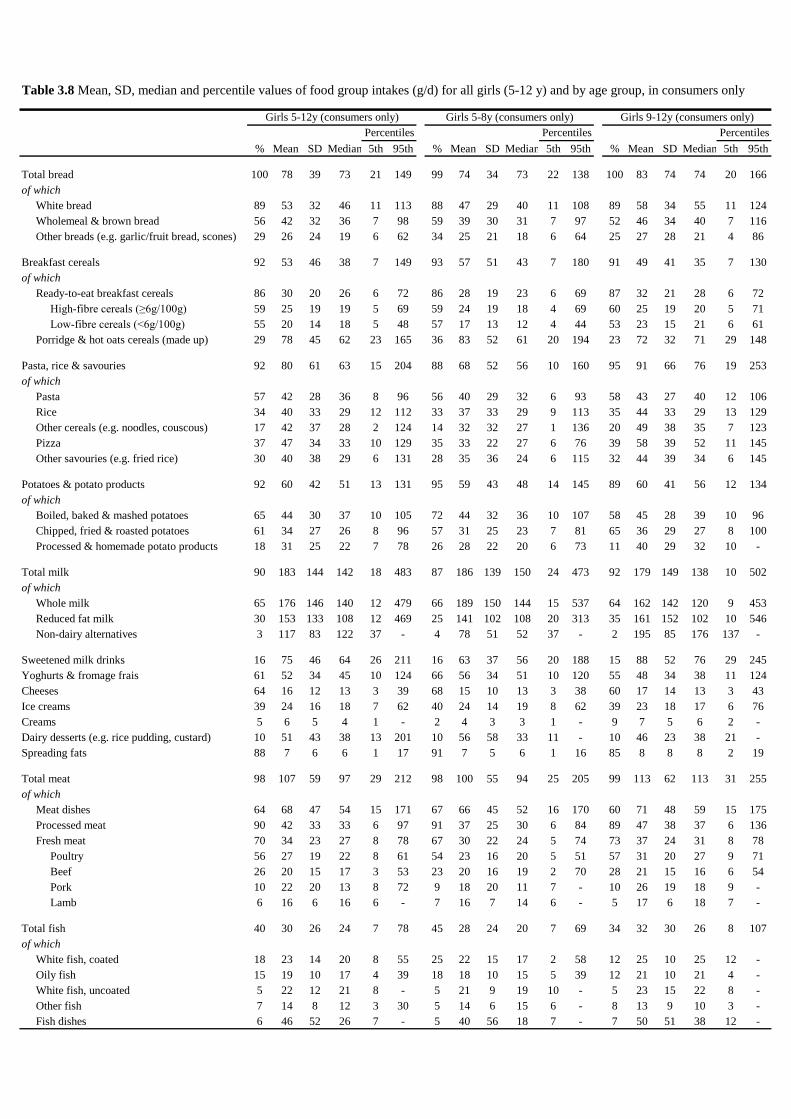
Table 3.8 Mean, SD, median and percentile values of food group intakes (g/d) for all
girls (5-12y) and by age group, in consumers only
Chapter 4 Nutrient Intakes
This chapter provides information on energy, macronutrient, dietary fibre, vitamin and mineral
intakes.
Table 4.1 Mean, SD, median and percentile values for daily energy, macronutrient,
dietary fibre, vitamin and mineral intakes in children aged 5-12 years (total
population)
Table 4.2 Mean, SD, median and percentile values for daily energy, macronutrient,
vitamin and mineral intakes by gender
Table 4.3 Mean, SD, median and percentile values for daily energy, macronutrient,
vitamin and mineral intakes by age group
Table 4.4 Mean, SD, median and percentile values for daily energy, macronutrient,
vitamin and mineral intakes for boys, by age group
Table 4.5 Mean, SD, median and percentile values for daily energy, macronutrient,
vitamin and mineral intakes for girls, by age group
Table 4.6 Mean, SD, median and percentile values for daily total vitamin A (µg) intakes
from all sources and food sources for the total population and by gender and
age group
Table 4.7 Mean, SD, median and percentile values for daily retinol (µg) intakes from
all sources and food sources for the total population and by gender and age
group
Table 4.8 Mean, SD, median and percentile values for daily carotene (µg) intakes from
all sources and food sources for the total population and by gender and age
group
Table 4.9 Mean, SD, median and percentile values for daily vitamin D (µg) intakes
from all sources and food sources for the total population and by gender and
age group
Table 4.10 Mean, SD, median and percentile values for daily total vitamin E (mg)
intakes from all sources and food sources for the total population and by
gender and age group
Table 4.11 Mean, SD, median and percentile values for daily thiamin (mg) intakes from
all sources and food sources for the total population and by gender and age
group
Table 4.12 Mean, SD, median and percentile values for daily riboflavin (mg) intakes
from all sources and food sources for the total population and by gender and
age group
Table 4.13 Mean, SD, median and percentile values for daily total niacin (mg) intakes
from all sources and food sources for the total population and by gender and
age group
Table 4.14 Mean, SD, median and percentile values for daily vitamin B6 (mg) intakes
from all sources and food sources for the total population and by gender and
age group
Table 4.15 Mean, SD, median and percentile values for daily vitamin B12 (µg) intakes
from all sources and food sources for the total population and by gender and
age group
Table 4.16 Mean, SD, median and percentile values for daily total folate (µg) intakes
from all sources and food sources for the total population and by gender and
age group age group and gender
Table 4.17 Mean, SD, median and percentile values for daily dietary folate equivalents
(µg) intakes from all sources and food sources for the total population and by
gender and age group
Table 4.18 Mean, SD, median and percentile values for daily biotin (µg) intakes from all
sources and food sources for the total population and by gender and age group
age group and gender
Table 4.19 Mean, SD, median and percentile values for daily pantothenate (mg) intakes
from all sources and food sources for the total population and by gender and
age group
Table 4.20 Mean, SD, median and percentile values for daily vitamin C (mg) intakes
from all sources and food sources for the total population and by gender and
age group
Table 4.21 Mean, SD, median and percentile values for daily potassium (mg) intakes
from all sources and food sources for the total population and by gender and
age group
Table 4.22 Mean, SD, median and percentile values for daily calcium (mg) intakes from
all sources and food sources for the total population and by gender and age
group by age group and gender
Table 4.23 Mean, SD, median and percentile values for daily iron (mg) intakes from all
sources and food sources for the total population and by gender and age group
Table 4.24 Mean, SD, median and percentile values for daily magnesium (mg) intakes
from all sources and food sources for the total population and by gender and
age group
Table 4.25 Mean, SD, median and percentile values for daily zinc (mg) intakes from all
sources and food sources by for the total population and by gender and age
group age group and gender
Table 4.26 Mean, SD, median and percentile values for daily copper (mg) intakes from
all sources and food sources for the total population and by gender and age
group
Table 4.27 Mean, SD, median and percentile values for daily phosphorus (mg) intakes
from all sources and food sources for the total population and by gender and
age group
Table 4.28 Contribution (%) of food groups to mean daily intakes of energy,
macronutrients and dietary fibre in children aged 5-12 years
Table 4.29 Contribution (%) of food groups to mean daily vitamin intakes in children
aged 5-12 years
Table 4.30 Contribution (%) of food groups to mean daily mineral intakes in children
aged 5-12 years
Chapter 5 Anthropometric measurements
This chapter provides information on anthropometric measurements.
Table 5.1 Mean, SD, median and percentile values of anthropometric measurements by
age group and gender
Table 5.2 Prevalence (%) of overweight and obesity in children aged 5-12 years using
UK 90 growth references
Table 5.3 Prevalence (%) of overweight and obesity in children aged 5-12 years using
the IOTF cut-offs
Table 5.4 Mean, SD and median values of BMI (kg/m2) for children aged 5-12 years
by demographic factors and age group
Table 5.5 Mean, SD and median values of BMI (kg/m2) for boys aged 5-12 years by
demographic factors and age group
Table 5.6 Mean, SD and median values of BMI (kg/m2) for girls aged 5-12 years by
demographic factors and age group
Chapter 6 Physical Activity Levels
This chapter provides information on physical activity levels.
Table 6.1 Median time (minutes/day) spent in physical and sedentary activities and
watching screens by children aged 5-12 years
Table 6.2 Median time (minutes/day) spent watching screens, television and gaming by
children aged 5-12 years
Table 6.3 Median time (minutes/day) spent participating in total, physical and
sedentary activities by children aged 5-12 years

Chapter 1 Background and Methodology

Background
This report describes the methods and main findings on food and beverage consumption,
nutrient intakes, anthropometric measurements and physical activity levels from the National
Children’s Food Survey II (NCFS II). The NCFS II was a cross-sectional survey designed to
assess the food and nutrient intakes in a nationally representative sample of 600 children aged
5 to 12 years in the Republic of Ireland.
The electronic database compiled from the survey represents a valuable resource and is suitable
for a wide range of applications related to food safety and nutrition. These include assessment
of exposure to chemical and biological hazards in foods, development and implementation of
food and nutrition policy and food product development and promotion.
The NCFS II was carried out by the Irish Universities Nutrition Alliance (IUNA), a formal
alliance of the nutrition centres at academic institutions in Ireland including University College
Cork, University College Dublin, Cork Institute of Technology and Technological University
Dublin, which is committed to joint initiatives in research and teaching. The survey was carried
out by the following teams:
University College Cork Prof Albert Flynn, Emeritus Professor in Nutrition
Dr Laura Kehoe, Joint Project Co-ordinator
Ms Ciara Kingston, Research Nutritionist
Ms Róisín McCarthy, Research Nutritionist
Ms Stephanie O’ Regan, Research Nutritionist
Ms Aisling Walsh, Research Nutritionist
Dr Jacqueline Lyons, Postdoctoral Research Nutritionist
Dr Emma O’ Sullivan, Postdoctoral Research Nutritionist

Cork Institute of Technology Dr Janette Walton, Lecturer in Nutrition
Mr Eoin Morrissey, Research Nutritionist
University College Dublin Dr Breige McNulty, Lecturer in Nutrition
Dr Maria Buffini, Joint Project Co-ordinator
Dr Anne Nugent, Senior Lecturer in Nutrition
Ms Aileen O’ Connor, Research Nutritionist
Ms Aisling O’ Donnell, Research Nutritionist
Ms Aoibhín Moore Heslin, Research Nutritionist
Technological University Dublin Prof John Kearney, Professor in Nutrition and Epidemiology
Ms Stephanie Rahill, Research Nutritionist
The NCFS II was funded by the Irish Department of Agriculture, Food and the Marine (DAFM)
under the 2015 Food Institutional Research Measure (FIRM) awards.

National Children’s Food Survey II (NCFS II) Methodology
Ethical approval
Ethical approval was obtained from the Clinical Research Ethics Committee of the Cork
Teaching Hospitals and the Human Ethics Research Committee of University College Dublin
(Ref: ECM 4 (aa) 07/02/17).
Sampling
The NCFS II was a cross-sectional survey that was carried out between April 2017 and May
2018 by the nutrition units in University College Cork, University College Dublin, Cork
Institute of Technology and Dublin Technological University, which form part of the Irish
Universities Nutrition Alliance (IUNA). The NCFS II was designed to assess food and nutrient
intakes in a nationally representative sample of children aged 5 to 12 years in the Republic of
Ireland (n 600).
Selection of schools
A database of primary schools in Ireland (obtained from the Department of Education and
Skills www.education.ie) was used to select schools to provide a demographically balanced
sample with respect to urban/rural divide and socio-economic grouping. All schools in this
database (n 3124) were classified according to the size of the school; small (<200 pupils),
medium (200-499 pupils) and large (>500 pupils). Schools were further classified according to
gender served (all males, all females or mixed), location (urban or rural) and whether they were
disadvantaged or not disadvantaged. Schools were randomly selected to participate so that in

the final sample, the proportions of children attending each of the categories of schools
reflected that of the proportions according to the database.
Participant recruitment
An introductory letter and information about the survey was posted to the principal of each
selected school. This was followed up by a phone call from the survey coordinator. If the
principal agreed to his/her schools’ participation in the survey, a suitable date and time to visit
the school was arranged. Of the schools contacted, 80% agreed to take part in the study. The
school principal was provided with information packs (containing an introductory letter, an
information brochure and a reply slip). Students were randomly selected from the school roll
and given these information packs to bring home to their parents/guardians. If the
parents/guardians and the selected child were interested in finding out more about participating
in the survey, they were instructed to fill out their contact details on the reply slip and return it
to the school. Children who returned a reply slip were excluded if they were not between the
ages of 5 and 12 years, if they belonged to an age or gender or geographical location category
for which the appropriate number of children had already been recruited, or if another member
of their household had already been recruited for participation in the survey. A researcher
contacted the parents/guardians of all eligible children who returned a reply slip and if they
agreed to participate in the survey, a suitable time and date for a researcher to visit was
arranged. The researcher then visited the home to explain the survey in more detail and to
obtain consent from both parents/guardians and the child. All researchers were qualified
nutritionists. The overall response rate for the survey was 65%. Demographic analysis of the
sample has shown it to be representative of children in Ireland with respect to age, gender and
geographical location when compared to Census 2016 data (Central Statistics Office, 2017).
However, the final sample contained a higher proportion of children of professional workers
and a lower proportion of children of semi-skilled and unskilled workers than the national
population and data in this report have been weighted to account for these differences.
Food intake data collection
Food and beverage intake data were collected using a 4-day weighed food record. For all
participants, the study period included at least one weekend day. Participants were provided
with a food diary and a digital food scales and asked to record detailed information regarding
the amount, type and brand of all foods, beverages and nutritional supplements consumed, as
well as the amount of any leftovers. The cooking methods used, the packaging size and type,
and details of recipes were also recorded. Additionally, data were collected on the time of each
eating or drinking occasion, the participant’s definition of each eating or drinking occasion
(e.g. morning snack, lunch) and the location of preparation of the meal or snack (e.g. home,
school, childminder). Researchers made three visits to the participant’s home over the survey
period: an initial training visit to demonstrate how to complete the food diary and use the
weighing scales; a second visit 24-36 hours into the recording period to review the diary and
clarify details regarding specific food descriptors and quantities; and a final visit one or two
days after the recording period had ended to review the last days and collect the food diary.
Food quantification
A quantification protocol that had been established by the IUNA for the North/South Ireland
Food Consumption Survey (NSIFCS) (Harrington et al., 2001) was adapted for the NCFS II.
It is summarised as follows:

(1) Weighed (by participant/manufacturer’s weights) - A portable food scales (Tanita KD-
400, Japan) was provided to each participant. Researchers provided detailed
instructions (including a demonstration) on how to use the scales. This method was
used to quantify 76% of foods and drinks consumed. A further 11% of foods were
quantified using manufacturer’s weights. To facilitate collection of such data,
participants were provided with a storage bag and asked to retain packaging from food
and beverages consumed throughout the recording period.
(2) Food atlas - An age-appropriate photographic food atlas (Foster et al., 2010) was used
to quantify 7% of foods and beverages consumed.
(3) Food Portion Sizes – ‘The Irish Food Portion Sizes Database’ (Lyons and Giltinan,
2013) and ‘Food Portion Sizes’ (Ministry of Agriculture Fisheries and Food, 1997)
were used to quantify 3% of foods and beverages consumed.
(4) Household Measures – Household measures (e.g. teaspoon, tablespoon, pint) were used
to quantify 1% of foods and beverages consumed.
(5) Estimated - Food quantities were defined as estimated when the researcher made an
estimate of the amount likely to have been consumed based on their knowledge of the
participant’s eating habits as observed during the recording period. This quantification
method was used for 2% of foods and beverages consumed.
Estimation of nutrient intakes
Nutritics© software was used to estimate nutrient intakes from food intakes using data from
McCance and Widdowson’s The Composition of Foods, seventh edition and sixth edition (for
a small number of foods) (Food Standards Agency, 2002; Food Standards Agency, 2015).
During the survey, modifications were made to include recipes of composite dishes, nutritional
supplements, fortified foods and generic Irish foods that were commonly consumed.
Anthropometric measurements
Anthropometric measurements were taken by the researcher in the participant’s home. Where
possible, height, weight, body composition, and waist and hip circumference were measured
for the child. Height, weight and body composition were also measured for the
parents/guardians where possible.
Height was measured to the nearest 0.1cm using the Leicester portable height measure (Seca,
Birmingham, UK) with the participant’s head positioned in the Frankfurt Plane. Measurements
were taken barefoot with the participant’s back to the backboard of the height measure ensuring
their feet, buttocks and occiput (back of skull) were touching the backboard.
Weight and body composition were measured (in duplicate) to the nearest 0.1kg using a Tanita
body composition analyser BC-420MA (Tanita Ltd, GB). Participants were weighed after
having voided, wearing light clothing and without shoes.
Waist and hip circumference were measured (in duplicate) to the nearest 0.1cm using a Seca
201 Measuring Tape (Seca, Birmingham, UK). Waist circumference was taken at the naked
site where possible with the waist defined as the mid-point between the bottom of the rib cage
(10th rib) and the supra-iliac crest (top of the hip). Hip measurements were taken over light
clothing around the greater trochanter.
Defining overweight and obesity
Body Mass Index (BMI) was calculated as weight (kg) divided by height squared (m2). The

UK 90 Growth References and the International Obesity Task Force (IOTF) age- and gender-
specific BMI cut-offs were used to define thinness, normal weight, overweight and
obesity.(Cole et al., 1995; Cole et al., 2000).
Urine Collection
Participants were asked to provide a once off first void morning urine sample (~30ml) during
the recording period. Participants were provided with a sterile collection container to collect
the urine sample on the second (or final) survey visit. They were also provided with an ice pack
and a thermal cooler bag and asked to keep the sample chilled. Once collected by the researcher,
the urine sample was stored appropriately on dry ice and transported to UCC or UCD for
storage at -80℃. Urine samples were collected from 95% (n 572) of participants for the analysis
of a number of markers of nutritional status.
Questionnaires
Participants in the NCFS II completed four questionnaires including:
Health & Lifestyle Questionnaire: This questionnaire collected information on participants’
general health and lifestyle characteristics including medicine usage, dental health, allergy
information, nutritional supplement usage (over the last 12 months) and parents/guardians
perceptions of their child’s diet and weight status. Information was also collected on
parents/guardians’ education levels and socio-demographics. The education level and socio-
demographic level of the participant was defined using that of the highest category from both
parents/guardians.

Physical Activity Questionnaire: Validated questionnaires were used to estimate levels of
physical activity for the child. The Child Physical Activity Questionnaire (C-PAQ) was used
for children aged 5-8 years and the Youth Physical Activity Questionnaire (Y-PAQ) was used
for children aged 9-12 years (Corder et al., 2009).
Food Choice & Eating Behaviour Questionnaire: Validated questionnaires including the Child
Eating Behaviour Questionnaire (CEBQ) and the Feeding Practices and Structure
Questionnaire (FSPQ) were used to evaluate the determinants of food choice and eating
behaviour, together with the non-responsive and structure-related feeding strategies that
parents utilise during mealtimes (Wardle et al., 2001; Jansen et al., 2016).
Evaluation Questionnaire: The researcher administered this questionnaire at the final visit.
This identified whether the child’s eating habits had been usual during the recording period.
A coding manual was developed for the questionnaires and all coded questionnaires were
entered (in duplicate) into the customised DaSurvey software package (Dazult Ltd, Co. Kildare,
Republic of Ireland). DaSurvey uses a rules based validation process permitting answers from
the coding manual only.
Quality control
A number of quality procedures were put in place to minimise error and ensure consistency
throughout the collection and manipulation of the data. Researchers received training that
included role-play workshops prior to commencing fieldwork, where they were trained to take
a natural and friendly approach to fieldwork and to avoid prompting foods. This was carried
out in an attempt to make participants feel at ease and so to ensure that the most reliable data
possible could be obtained. It was stressed to participants that they should not try to change or
‘improve’ their diet during the recording period. At the end of the recording period, participants
and their parents/guardians were asked whether the child’s food intake had been the same as
usual, less than usual or more than usual during the recording period and to explain why this
might have been. They were also asked if there were any items consumed during the four day
recording period which had not yet been written down. If so, details on such items were then
recorded by the researcher in the food diary.
Each researcher was primarily responsible for the collection, quantification, coding and data
entry of their own participants’ food diaries. Energy under reporters (19.5%) were identified
by evaluating reported energy intake (as a ratio of energy intake to basal metabolic rate (BMR)
(EI:BMR)) against presumed age-specific energy cut offs calculated on the basis of reported
levels of physical activity (Goldberg et al., 1991; Black, 2000). Energy under reporting was
taken into account during certain analyses (e.g. in estimating the prevalence of inadequate
micronutrient intakes). Researchers were also asked to rate each participants food diary as
‘accurate and complete’, ‘inaccurate and complete’, ‘accurate and incomplete’ and ‘inaccurate
and incomplete’ so that data quality could be considered during certain analyses.
Databases
The food intake database for NCFS II comprises 41778 rows of data that relate to each food
and beverage item consumed by each of the participants at every eating occasion throughout
the four recording days. For each item consumed, the database contains information on the
day of the week, meal number in the day, name of the eating occasion (e.g. breakfast, snack),
time and location of consumption, weight of the food or beverage consumed, brand
information, packaging type and size and a comprehensive nutrient breakdown for the quantity
of food consumed.
Statistical analysis
Data manipulation was conducted using SPSS© Version 26 for WindowsTM (SPSS Inc.
Chicago, IL, USA).
Food intakes are described using the mean, median, standard deviation and the 5th and 95th
percentiles for the total population and split by gender and age groups (5-8y and 9-12y).
Usual intakes of nutrients from all dietary sources (including nutritional supplements) and from
food sources only (excluding nutritional supplements) were estimated using the validated
National Cancer Institute (NCI-Method) (Tooze et al., 2006) using SAS Enterprise Guide©
(SAS Institute Inc. Cary, NC, USA). Variables were described using the mean, median,
standard deviation and the 5th and 95th percentiles for the total population and split by gender
and age groups (5-8y and 9-12y).
Anthropometric measurements are described using the mean, median, standard deviation and
the 5th and 95th percentiles for the total population and split by gender and age groups (5-8y
and 9-12y). Body Mass Index (BMI) was calculated as weight (kg) divided by height squared
(m2). The ‘LMS growth’ Microsoft Excel Add-in was used to establish BMI z-scores based on
reference values for weight and height. SPSS© (SPSS Inc. Chicago, IL, USA) was used to
convert z-scores to percentiles. The UK 90 Growth References and the International Obesity
Task Force (IOTF) age- and gender-specific BMI cut-offs were used to define thinness, normal
weight, overweight and obesity (Cole et al., 1995; Cole et al., 2000). BMI is also described
using the mean and standard deviation for the total population and split by gender and age

groups (5-8y and 9-12y), and according to demographic factors such as location, education
level and social class.
Physical activity levels are described in median minutes spent participating in physical
activities, sedentary activities and screen time for the total population and split by gender and
age groups (5-8y and 9-12y), and split by weekday and weekend day.

Bibliography
Black, A. E. (2000). Critical evaluation of energy intake using the Goldberg cut-off for energy
intake:basal metabolic rate. A practical guide to its calculation, use and limitations.
International Journal of Obesity, 24(9) 1119-1130.
Central Statistics Office (2017) Census 2016 Summary Results - Part 1. Dublin, Ireland:
Central Statistics Office.
Cole, T. J., Bellizzi, M. C., Flegal, K. M. & Dietz, W. H. (2000). Establishing a standard
definition for child overweight and obesity worldwide: international survey. BMJ,
320(7244) 1240.
Cole, T. J., Freeman, J. & Preece, M. (1995). Body mass index reference curves for the UK,
1990. Archives of Disease in Childhood, 73(1) 25-29.
Corder, K., van Sluijs, E., Wright, A., Whincup, P., Wareham, N. & Ekelund, U. (2009). Is it
possible to assess free-living physical activity and energy expenditure in young people
by self-report? Americal Journal of Clinical Nutrition, 89(3) 862-870.
Food Standards Agency 2002. McCance and Widdowson's The Composition of Foods, 6th ed,
Cambridge: Royal Society of Chemistry
Food Standards Agency 2015. McCance and Widdowson's The Composition of Foods, 7th ed,
Cambridge: Royal Society of Chemistry.
Foster, E., Hawkins, A. & Adamson, A. 2010. Young Person's Food Atlas: Primary School,
London, Food Standards Agency.
Goldberg, G., Black, A., Jebb, S., Cole, T., Murgatroyd, P., Coward, W. & Prentice, A. (1991).
Critical evaluation of energy intake data using fundamental principles of energy
physiology: 1. Derivation of cut-off limits to identify under-recording. European
Journal of Clinical Nutrition, 45(12) 569-581.

Harrington, K., Robson, P., Kiely, M., Livingstone, M., Lambe, J. & Gibney, M. (2001). The
North/South Ireland Food Consumption Survey: survey design and methodology.
Public Health Nutrition, 4(5a) 1037-1042.
Jansen, E., Williams, K. E., Mallan, K. M., Nicholson, J. M. & Daniels, L. A. (2016). The
Feeding Practices and Structure Questionnaire (FPSQ-28): A parsimonious version
validated for longitudinal use from 2 to 5 years. Appetite, 100(1) 172-180.
Lyons, J. & Giltinan, M. 2013. The Irish Food Portion Sizes Database, First Edition,
www.iuna.net
Ministry of Agriculture Fisheries and Food 1997. Food Portion Sizes, London, The Stationary
Office.
Tooze, J. A., Midthune, D., Dodd, K. W., Freedman, L. S., Krebs-Smith, S. M., Subar, A. F.,
Guenther, P. M., Carroll, R. J. & Kipnis, V. (2006). A New Statistical Method for
Estimating the Usual Intake of Episodically Consumed Foods with Application to Their
Distribution. Journal of the American Dietetic Association, 106(10) 1575-1587.
Wardle, J., Guthrie, C. A., Sanderson, S. & Rapoport, L. (2001). Development of the Children's
Eating Behaviour Questionnaire. Journal of Child Psychology and Psychiatry, 42(7)
963-970.

Chapter 2 Sampling Data

Total 5-12y 5-8y 9-12y
Boys 300 (50) 149 (25) 151 (25)
Girls 300 (50) 151 (25) 149 (25)
n 600 300 300
Table 2.1 Number of participants in the survey by gender and age group (n & (%))
Total 5-12y 5-8y 9-12y
Total population
Winter (September - February) 338 (56) 174 (58) 164 (55)
Summer (March - August) 262 (44) 126 (42) 136 (45)
n 600 300 300
Boys
Winter (September - February) 183 (61) 84 (56) 99 (66)
Summer (March - August) 117 (39) 65 (44) 52 (34)
n 300 149 151
Girls
Winter (September - February) 155 (52) 90 (60) 65 (44)
Summer (March - August) 145 (48) 61 (40) 84 (56)
n 300 151 149
Table 2.2 Number of participants in the survey by season for the total population and by gender and age
group (n & (%))

Total 5-12y 5-8y 9-12y
Total population
Open country/village 239 (39) 122 (41) 117 (39)
Small town 77 (13) 37 (12) 40 (13)
Large town 174 (29) 85 (28) 89 (30)
City 110 (18) 56 (19) 54 (18)
n 600 300 300
Boys
Open country/village 121 (40) 61 (41) 60 (40)
Small town 40 (13) 19 (13) 21 (14)
Large town 99 (33) 46 (31) 53 (35)
City 40 (13) 23 (15) 17 (11)
n 300 149 151
Girls
Open country/village 118 (39) 61 (40) 57 (38)
Small town 37 (12) 18 (12) 19 (13)
Large town 75 (25) 39 (26) 36 (24)
City 70 (23) 33 (22) 37 (25)
n 300 151 149
Table 2.3 Geographical location of participants for the total population and by gender and
age group (n & (%))

Total 5-12y 5-8y 9-12y
Total population
Social Class
Professional workers 397 (66) 211 (71) 186 (62)
Non-manual workers 102 (17) 48 (16) 54 (18)
Skilled manual workers 54 (9) 20 (7) 34 (11)
Semi-skilled/unskilled workers 43 (7) 18 (6) 25 (8)
Socio-economic group
Employers and managers 138 (23) 63 (21) 75 (25)
Higher professional 145 (24) 83 (28) 62 (21)
Lower professional 117 (20) 64 (21) 53 (18)Non-manual 115 (19) 54 (18) 61 (20)
Manual skilled 24 (4) 8 (3) 16 (5)
Semi-skilled 26 (4) 14 (5) 12 (4)
Unskilled 5 (<1) 2 (1) 3 (1)
Own account workers 7 (1) 1 (<1) 6 (2)
Farmers 12 (2) 6 (2) 6 (2)
Agricultural workers 2 (<1) 1 (<1) 1 (<1)
Students 5 (<1) 1 (<1) 4 (1)
n 596 297 299
Boys
Social Class
Professional workers 188 (63) 104 (71) 84 (56)
Non-manual workers 53 (18) 20 (14) 33 (22)
Skilled manual workers 32 (11) 12 (8) 20 (13)
Semi-skilled/unskilled workers 25 (8) 11 (7) 14 (9)
Socio-economic group
Employers and managers 54 (18) 24 (16) 30 (20)
Higher professional 67 (22) 44 (30) 23 (15)
Lower professional 64 (21) 34 (23) 30 (20)Non-manual 61 (20) 22 (15) 39 (26)
Manual skilled 14 (5) 5 (3) 9 (6)
Semi-skilled 18 (6) 10 (7) 8 (5)
Unskilled 3 (1) 1 (1) 2 (1)
Own account workers 4 (1) 1 (1) 3 (2)
Farmers 7 (2) 4 (3) 3 (2)
Agricultural workers 2 (<1) 1 (1) 1 (1)
Students 4 (1) 1 (1) 3 (2)
n 298 147 151
Girls
Social Class
Professional workers 209 (70) 107 (71) 102 (69)
Non-manual workers 49 (16) 28 (19) 21 (14)
Skilled manual workers 22 (7) 8 (5) 14 (9)
Semi-skilled/unskilled workers 18 (6) 7 (5) 11 (7)
Socio-economic group
Employers and managers 84 (28) 39 (26) 45 (30)
Higher professional 78 (26) 39 (26) 39 (26)
Lower professional 53 (18) 30 (20) 23 (15)Non-manual 54 (18) 32 (21) 22 (15)
Manual skilled 10 (3) 3 (2) 7 (5)
Semi-skilled 8 (3) 4 (3) 4 (3)
Unskilled 2 (<1) 1 (1) 1 (1)
Own account workers 3 (1) 0 (0) 3 (2)
Farmers 5 (2) 2 (1) 3 (2)
Agricultural workers 0 (0) 0 (0) 0 (0)
Students 1 (<1) 0 (0) 1 (1)
n 298 150 148
*Excludes 4 whose occupation was unknown or insufficiently described
Note: SC & SEG level relates to that of the parents/guardians of participants
Table 2.4 Social class and socio-economic group of participants for the total population and by gender
and age group (n & (%))

Total 5-12y 5-8y 9-12y
Total population
Primary and intermediate 37 (6) 16 (5) 21 (7)
Secondary 44 (7) 18 (6) 26 (9)
Tertiary 516 (86) 266 (89) 250 (84)
n 597 300 297
Boys
Primary and intermediate 22 (7) 10 (7) 12 (8)
Secondary 26 (9) 11 (7) 15 (10)
Tertiary 250 (84) 128 (86) 122 (82)
n 298 149 149
Girls
Primary and intermediate 15 (5) 6 (4) 9 (6)
Secondary 18 (6) 7 (5) 11 (7)
Tertiary 266 (89) 138 (91) 128 (87)
n 299 151 148
*Excludes 3 missing values
Note: Education level relates to that of the parents/guardians of participants
Table 2.5 Education level of participants' parents for the total population and by gender and
age group (n & (%))

Chapter 3 Food Consumption
Food groups
Mean SD Median 5th 95th
Total bread 85 45 78 22 179
of which
White bread 53 42 48 0 128
Wholemeal & brown bread 25 36 9 0 97
Other breads (e.g. garlic/fruit bread, scones) 7 17 0 0 42
Breakfast cereals 53 53 38 0 170
of which
Ready-to-eat breakfast cereals 28 23 25 0 73
High-fibre cereals (≥6g/100g) 16 20 9 0 60
Low-fibre cereals (˂6g/100g) 13 17 5 0 48
Porridge & hot oats cereals (made up) 25 51 0 0 148
Pasta, rice & savouries 72 61 57 0 197
of which
Pasta 25 35 11 0 93
Rice 12 23 0 0 57
Other cereals (e.g. noodles, couscous) 7 23 0 0 44
Pizza 19 33 0 0 88
Other savouries (e.g. fried rice) 9 23 0 0 53
Potatoes & potato products 61 49 51 0 152
of which
Boiled, baked & mashed potatoes 32 36 23 0 107
Chipped, fried & roasted potatoes 23 29 16 0 79
Processed & homemade potato products 6 20 0 0 38
Total milk 186 156 155 0 479
of which
Whole milk 131 154 91 0 430
Reduced fat milk 52 110 0 0 298
Non-dairy alternatives 3 19 0 0 0
Sweetened milk drinks 16 43 0 0 89
Yoghurts & fromage frais 34 43 21 0 120
Cheeses 11 13 6 0 38
Ice creams 8 15 0 0 41
Creams <1 3 0 0 3
Dairy desserts (e.g. rice pudding, custard) 5 20 0 0 33
Spreading fats 7 7 5 0 19
Total meat 116 69 105 26 252
of which
Meat dishes 47 58 30 0 158
Processed meat 41 36 34 0 105
Fresh meat 28 31 20 0 85
Poultry 18 26 11 0 68
Beef 7 14 0 0 38
Pork 2 9 0 0 20
Lamb 1 5 0 0 0
Total fish 13 29 0 0 56
of which
White fish, coated 4 11 0 0 29
Oily fish 4 21 0 0 24
White fish, uncoated 1 6 0 0 9
Other fish 1 6 0 0 9
Fish dishes 3 14 0 0 15
Percentiles
Total population 5-12y (n 600)
Table 3.1 Mean, SD, median and percentile values of food group intakes (g/d) in the total population (5-12y)

Food groups
Mean SD Median 5th 95th
Eggs & egg dishes 10 17 0 0 47
Nuts & seeds <1 4 0 0 5
Total fruit & vegetables 221 129 201 53 444
Fruit & fruit juices 147 115 125 10 349
Discrete fruit 90 70 78 0 229
of which
Apples 27 30 20 0 82
Bananas 20 29 0 0 79
Citrus fruits 11 23 0 0 59
Other fruits 32 43 16 0 112
Fruit in composite dishes 9 14 5 0 31
Fruit juice (100% fruit) 38 75 0 0 161
Smoothies 11 36 0 0 90
Total vegetables 74 49 67 12 165
Discrete vegetables 40 38 30 0 111
of which
Peas, beans & lentils 11 21 0 0 55
Baked beans 7 19 0 0 43
Carrots 9 14 2 0 39
Green vegetables 6 11 0 0 26
Other vegetables 14 20 5 0 53
Vegetables in composite dishes 34 32 25 0 96
Total confectionery/snacks 76 48 67 17 162
of which
Biscuits & crackers 16 17 11 0 47
Cakes, pastries & buns 15 21 8 0 56
Desserts 13 28 0 0 65
Chocolate confectionery 9 11 5 0 30
Savoury snacks 9 12 6 0 32
Sugar confectionery 7 16 0 0 32
Sugars, sweeteners, preserves & spreads 5 7 3 0 18
Cereal bars 2 6 0 0 15
Water as a beverage 450 315 405 22 1037
of which
Flavoured water 11 55 0 0 63
Soft drinks* 160 221 83 0 595
of which
Soft drinks, added sugar 50 93 0 0 217
Soft drinks, no added sugar 110 201 0 0 483
Milk as a beverage 91 127 47 0 357
Fruit juice (100% fruit) 38 75 0 0 161
Teas 28 78 0 0 203
Sweetened milk drinks 16 43 0 0 89
Smoothies 11 36 0 0 90
Coffees 1 11 0 0 0
*carbonated beverages, fruit juice drinks, squashes & cordials
Table 3.1 continued Mean, SD, median and percentile values of food group intakes (g/d) in the total population (5-
12y)
Total population 5-12y (n 600)
Percentiles
Food groups
% Mean SD Median 5th 95th
Total bread 99 86 45 78 25 179
of which
White bread 89 60 40 54 13 132
Wholemeal & brown bread 54 47 37 38 8 114
Other breads (e.g. garlic/fruit bread, scones) 27 26 22 20 6 68
Breakfast cereals 91 58 52 42 8 173
of which
Ready-to-eat breakfast cereals 85 33 22 28 6 75
High-fibre cereals (≥6g/100g) 59 26 20 20 6 69
Low-fibre cereals (˂6g/100g) 54 23 17 20 5 63
Porridge & hot oats cereals (made up) 28 90 59 72 25 217
Pasta, rice & savouries 89 81 59 64 15 198
of which
Pasta 53 47 36 38 10 114
Rice 32 36 28 29 11 92
Other cereals (e.g. noodles, couscous) 16 43 44 29 1 131
Pizza 37 51 36 39 12 128
Other savouries (e.g. fried rice) 26 36 33 28 6 102
Potatoes & potato products 92 66 47 56 13 153
of which
Boiled, baked & mashed potatoes 65 49 34 40 11 120
Chipped, fried & roasted potatoes 65 36 29 28 7 97
Processed & homemade potato products 18 33 35 24 8 93
Total milk 91 204 151 171 23 504
of which
Whole milk 68 193 151 163 19 476
Reduced fat milk 31 168 140 121 16 491
Non-dairy alternatives 3 89 69 63 10 -
Sweetened milk drinks 19 83 64 65 26 213
Yoghurts & fromage frais 59 57 43 45 11 140
Cheeses 63 17 13 14 3 43
Ice creams 36 23 16 18 7 62
Creams 6 8 8 6 2 30
Dairy desserts (e.g. rice pudding, custard) 9 53 48 38 12 201
Spreading fats 87 8 6 6 1 20
Total meat 98 118 68 106 32 254
of which
Meat dishes 64 74 58 58 14 177
Processed meat 91 45 35 38 7 106
Fresh meat 73 38 30 30 8 95
Poultry 56 32 28 24 8 89
Beef 29 24 17 19 5 62
Pork 10 24 17 19 8 63
Lamb 4 20 13 19 6 52
Total fish 41 32 38 25 7 85
of which
White fish, coated 19 24 13 21 7 51
Oily fish 14 26 53 18 4 42
White fish, uncoated 5 23 14 17 8 59
Other fish 7 19 14 15 4 52
Fish dishes 7 39 39 29 3 155
Percentiles
Table 3.2 Mean, SD, median and percentile values of food group intakes (g/d) in consumers only (5-12 y)
Total population 5-12y (consumers only)

Food groups
% Mean SD Median 5th 95th
Eggs & egg dishes 35 28 19 22 8 74
Nuts & seeds 8 9 10 7 1 21
Total fruit & vegetables 100 221 129 201 53 444
Fruit & fruit juices 97 151 114 128 22 351
Discrete fruit 92 98 68 85 18 235
of which
Apples 63 43 28 35 12 100
Bananas 47 43 29 36 13 105
Citrus fruits 32 35 29 24 9 86
Other fruits 64 50 44 35 6 133
Fruit in composite dishes 84 11 14 6 1 35
Fruit juice (100% fruit) 40 94 94 75 17 238
Smoothies 12 94 55 84 25 209
Total vegetables 99 75 49 68 13 165
Discrete vegetables 85 47 37 39 5 114
of which
Peas, beans & lentils 45 24 26 17 3 72
Baked beans 20 33 29 25 7 83
Carrots 52 18 15 13 3 47
Green vegetables 38 16 12 13 3 40
Other vegetables 59 24 21 17 2 68
Vegetables in composite dishes 95 36 32 27 3 96
Total confectionery/snacks 99 77 48 68 18 162
of which
Biscuits & crackers 80 20 17 15 4 51
Cakes, pastries & buns 57 27 22 20 5 77
Desserts 35 38 35 29 6 100
Chocolate confectionery 59 15 11 11 3 37
Savoury snacks 63 15 12 12 3 37
Sugar confectionery 40 17 21 10 2 59
Sugars, sweeteners, preserves & spreads 66 8 7 6 1 23
Cereal bars 18 12 8 11 4 32
Water as a beverage 95 471 307 420 84 1038
of which
Flavoured water 7 162 140 118 16 442
Soft drinks* 67 238 233 161 38 766
of which
Soft drinks, added sugar 40 124 111 89 27 373
Soft drinks, no added sugar 47 235 240 150 38 844
Milk as a beverage 58 158 131 114 30 410
Fruit juice (100% fruit) 41 94 94 75 17 238
Teas 19 149 122 110 23 437
Sweetened milk drinks 19 83 64 65 26 213
Smoothies 12 94 55 84 25 209
Coffees 1 77 55 49 13 -
*carbonated beverages, fruit juice drinks, squashes & cordials
Table 3.2 continued Mean, SD, median and percentile values of food group intakes (g/d) in consumers only (5-12 y)
Total population 5-12y (consumers only)
Percentiles

Food groups
Mean SD Median 5th 95th Mean SD Median 5th 95th
Total bread 79 39 75 22 157 91 50 84 22 204
of which
White bread 45 35 40 0 114 61 46 55 0 154
Wholemeal & brown bread 26 33 13 0 96 25 38 0 0 105
Other breads (e.g. garlic/fruit bread, scones) 9 17 0 0 48 6 16 0 0 32
Breakfast cereals 55 55 39 0 172 52 50 37 0 162
of which
Ready-to-eat breakfast cereals 25 20 21 0 63 31 25 28 0 79
High-fibre cereals (≥6g/100g) 14 18 8 0 56 17 22 10 0 63
Low-fibre cereals (˂6g/100g) 11 15 5 0 42 14 19 6 0 53
Porridge & hot oats cereals (made up) 30 55 0 0 160 21 47 0 0 143
Pasta, rice & savouries 61 57 50 0 181 82 64 68 0 199
of which
Pasta 23 35 7 0 91 27 35 16 0 103
Rice 11 23 0 0 49 12 24 0 0 62
Other cereals (e.g. noodles, couscous) 5 22 0 0 36 8 24 0 0 54
Pizza 15 27 0 0 70 23 37 0 0 101
Other savouries (e.g. fried rice) 7 20 0 0 49 11 26 0 0 65
Potatoes & potato products 56 44 48 0 134 65 53 56 0 157
of which
Boiled, baked & mashed potatoes 30 34 21 0 97 33 38 25 0 117
Chipped, fried & roasted potatoes 19 24 13 0 70 27 32 20 0 97
Processed & homemade potato products 7 22 0 0 30 6 17 0 0 41
Total milk 179 154 145 0 465 192 156 163 0 498
of which
Whole milk 134 161 95 0 435 129 147 80 0 413
Reduced fat milk 42 89 0 0 255 60 125 0 0 337
Non-dairy alternatives 3 16 0 0 0 2 21 0 0 0
Sweetened milk drinks 15 39 0 0 95 16 46 0 0 89
Yoghurts & fromage frais 39 43 25 0 125 29 43 11 0 113
Cheeses 11 13 7 0 39 10 14 5 0 36
Ice creams 8 14 0 0 38 8 16 0 0 43
Creams 0 1 0 0 0 1 3 0 0 4
Dairy desserts (e.g. rice pudding, custard) 5 20 0 0 33 4 20 0 0 35
Spreading fats 6 5 6 0 18 7 7 5 0 22
Total meat 101 61 95 24 210 130 72 117 35 270
of which
Meat dishes 43 54 32 0 133 51 62 28 0 168
Processed meat 37 30 30 0 93 45 40 39 0 116
Fresh meat 21 23 16 0 67 34 36 25 0 97
Poultry 13 18 4 0 46 22 31 15 0 83
Beef 6 13 0 0 35 8 15 0 0 41
Pork 2 8 0 0 13 3 10 0 0 24
Lamb 1 4 0 0 0 1 6 0 0 0
Total fish 13 21 0 0 52 14 35 0 0 60
of which
White fish, coated 5 11 0 0 30 4 10 0 0 31
Oily fish 3 9 0 0 24 4 29 0 0 25
White fish, uncoated 1 6 0 0 9 1 6 0 0 8
Other fish 1 4 0 0 8 2 7 0 0 11
Fish dishes 2 13 0 0 11 3 15 0 0 20
Table 3.3 Mean, SD, median and percentile values of food group intakes (g/d) by age group, in the total population
Total Population 5-8y (n 300)
Percentiles
Total Population 9-12y (n 300)
Percentiles

Food groups
Mean SD Median 5th 95th Mean SD Median 5th 95th
Eggs & egg dishes 10 17 0 0 45 10 18 0 0 49
Nuts & seeds 0 2 0 0 2 1 5 0 0 8
Total fruit & vegetables 221 127 198 59 435 229 125 210 57 444
Fruit & fruit juices 152 114 129 27 340 149 113 124 8 353
Discrete fruit 97 74 81 5 256 87 68 78 0 221
of which
Apples 31 32 23 0 100 25 30 18 0 83
Bananas 21 30 5 0 84 20 29 0 0 80
Citrus fruits 10 17 0 0 44 12 27 0 0 62
Other fruits 35 42 24 0 103 30 44 11 0 124
Fruit in composite dishes 10 14 5 0 37 8 11 5 0 29
Fruit juice (100% fruit) 34 80 0 0 149 41 66 0 0 180
Smoothies 11 32 0 0 90 13 42 0 0 109
Total vegetables 70 45 65 12 158 80 52 74 12 173
Discrete vegetables 39 32 33 0 97 43 42 31 0 121
of which
Peas, beans & lentils 10 16 1 0 42 12 24 0 0 60
Baked beans 6 13 0 0 37 8 22 0 0 50
Carrots 10 13 5 0 35 9 15 0 0 42
Green vegetables 7 12 0 0 30 5 9 0 0 24
Other vegetables 12 17 5 0 45 16 23 6 0 65
Vegetables in composite dishes 31 30 23 0 94 37 31 28 0 96
Total confectionery/snacks 73 46 62 16 160 80 50 71 18 164
of which
Biscuits & crackers 14 16 10 0 41 17 18 12 0 53
Cakes, pastries & buns 15 20 9 0 51 15 22 5 0 59
Desserts 14 26 0 0 75 12 29 0 0 54
Chocolate confectionery 7 9 4 0 23 11 13 5 0 36
Savoury snacks 8 11 5 0 31 10 13 8 0 32
Sugar confectionery 8 16 0 0 32 6 15 0 0 36
Sugars, sweeteners, preserves & spreads 5 6 3 0 16 6 7 3 0 23
Cereal bars 2 5 0 0 13 3 7 0 0 16
Water as a beverage 372 282 312 29 894 521 328 475 3 1106
of which
Flavoured water 9 50 0 0 20 13 59 0 0 106
Soft drinks* 159 224 75 0 632 160 218 90 0 604
of which
Soft drinks, added sugar 31 62 0 0 163 67 112 0 0 298
Soft drinks, no added sugar 128 217 38 0 627 93 184 0 0 479
Milk as a beverage 97 134 51 0 367 86 119 42 0 337
Fruit juice (100% fruit) 34 80 0 0 149 41 66 0 0 180
Teas 16 55 0 0 115 39 93 0 0 269
Sweetened milk drinks 15 39 0 0 95 16 46 0 0 89
Smoothies 11 32 0 0 90 12 39 0 0 96
Coffees 0 3 0 0 0 2 14 0 0 0
*carbonated beverages, fruit juice drinks, squashes & cordials
Table 3.3 continued Mean, SD, median and percentile values of food group intakes (g/d) by age group, in the total
population
Total Population 5-8y (n 300) Total Population 9-12y (n 300)
Percentiles Percentiles

Food groups
% Mean SD Median 5th 95th % Mean SD Median 5th 95th
Total bread 99 80 39 76 23 157 100 92 50 84 27 204
of which
White bread 87 52 33 44 12 116 90 67 44 60 13 158
Wholemeal & brown bread 60 43 33 32 8 100 49 51 41 40 7 126
Other breads (e.g. garlic/fruit bread, scones) 31 28 21 22 7 64 24 25 24 18 5 74
Breakfast cereals 92 59 55 42 7 179 90 58 50 42 9 171
of which
Ready-to-eat breakfast cereals 86 29 19 25 6 68 85 36 23 32 7 84
High-fibre cereals (≥6g/100g) 58 24 18 20 5 67 61 28 21 21 7 71
Low-fibre cereals (˂6g/100g) 54 20 16 16 5 53 54 26 18 22 5 65
Porridge & hot oats cereals (made up) 34 89 61 62 23 225 23 92 55 76 26 218
Pasta, rice & savouries 88 70 56 56 11 191 90 90 61 77 18 203
of which
Pasta 52 44 38 33 8 103 54 50 34 43 14 120
Rice 33 33 29 27 10 91 31 39 28 30 12 97
Other cereals (e.g. noodles, couscous) 13 42 49 28 1 197 19 44 40 30 2 124
Pizza 36 41 31 31 11 121 39 59 38 52 13 129
Other savouries (e.g. fried rice) 24 31 31 21 5 97 28 41 34 32 7 124
Potatoes & potato products 94 60 43 50 13 136 90 73 50 61 13 165
of which
Boiled, baked & mashed potatoes 69 44 32 36 10 107 61 54 35 48 11 130
Chipped, fried & roasted potatoes 65 30 25 21 6 76 64 42 32 33 9 109
Processed & homemade potato products 22 31 40 21 8 99 15 36 27 30 9 116
Total milk 91 197 151 163 29 483 91 211 151 181 18 505
of which
Whole milk 68 197 160 154 21 530 68 190 143 167 17 450
Reduced fat milk 30 142 111 108 23 341 32 190 158 137 11 578
Non-dairy alternatives 4 69 43 57 25 - 2 134 99 132 10 -
Sweetened milk drinks 20 78 53 63 25 213 18 89 73 72 33 280
Yoghurts & fromage frais 67 59 40 46 11 139 53 56 46 42 11 144
Cheeses 66 17 12 14 3 42 59 17 14 13 3 44
Ice creams 37 23 14 18 7 55 35 24 18 18 7 76
Creams 4 5 2 5 1 - 7 9 10 7 2 44
Dairy desserts (e.g. rice pudding, custard) 9 51 46 33 11 201 8 56 50 38 21 234
Spreading fats 91 7 5 6 1 19 83 9 7 6 1 23
Total meat 98 103 60 95 26 211 99 132 71 118 37 271
of which
Meat dishes 65 66 54 52 14 161 63 81 61 68 15 197
Processed meat 92 40 29 33 6 93 90 50 39 41 7 127
Fresh meat 68 31 22 26 6 72 78 44 35 33 11 103
Poultry 51 25 17 21 5 64 60 37 32 27 10 99
Beef 27 22 16 20 4 53 31 25 18 19 6 67
Pork 9 20 17 14 6 74 12 26 16 21 9 64
Lamb 5 16 7 16 4 - 4 23 16 19 6 -
Total fish 44 29 23 23 7 84 37 37 50 26 7 89
of which
White fish, coated 23 23 13 19 7 51 15 26 12 25 9 51
Oily fish 16 19 12 17 3 43 12 34 78 18 4 87
White fish, uncoated 5 24 15 19 9 - 5 22 13 17 8 -
Other fish 6 14 7 13 5 - 8 22 16 18 3 55
Fish dishes 6 38 38 29 4 - 8 41 40 35 2 167
Total Population 5-8y (consumers only) Total Population 9-12y (consumers only)
Table 3.4 Mean, SD, median and percentile values of food group intakes (g/d) by age group, in consumers only
Percentiles Percentiles

Food groups
% Mean SD Median 5th 95th % Mean SD Median 5th 95th
Eggs & egg dishes 35 27 18 20 8 71 34 29 21 23 8 79
Nuts & seeds 5 7 5 7 2 - 10 10 12 8 1 37
Total fruit & vegetables 98 219 133 196 53 444 100 224 124 205 55 444
Fruit & fruit juices 98 153 118 129 29 350 97 150 110 125 16 352
Discrete fruit 96 101 72 84 17 257 90 95 64 86 18 221
of which
Apples 68 44 29 33 10 106 58 42 26 35 12 93
Bananas 48 42 30 31 10 117 46 44 28 39 14 103
Citrus fruits 33 28 18 22 8 66 30 41 37 28 10 145
Other fruits 72 49 44 35 6 129 57 51 45 35 5 153
Fruit in composite dishes 79 12 16 7 1 48 76 9 12 6 1 29
Fruit juice (100% fruit) 38 94 117 74 15 206 43 94 72 75 22 243
Smoothies 12 86 44 89 29 179 12 101 64 80 21 232
Total vegetables 99 70 45 64 14 158 98 80 52 74 12 173
Discrete vegetables 89 43 31 37 5 98 80 52 41 41 7 126
of which
Peas, beans & lentils 50 20 17 15 1 59 41 20 17 15 1 59
Baked beans 22 24 15 20 6 51 18 43 38 32 10 103
Carrots 57 17 14 12 3 45 47 19 17 14 3 49
Green vegetables 41 17 13 13 3 50 36 14 10 12 3 32
Other vegetables 59 21 19 15 1 62 59 26 23 19 2 79
Vegetables in composite dishes 95 33 31 24 3 97 96 38 32 30 3 97
Total confectionery/snacks 100 73 45 63 16 160 99 80 49 71 20 164
of which
Biscuits & crackers 84 17 16 13 3 44 77 22 17 18 4 57
Cakes, pastries & buns 62 25 20 18 5 75 52 29 23 25 5 85
Desserts 37 39 29 30 6 101 33 37 41 27 5 103
Chocolate confectionery 58 11 8 10 3 26 60 18 13 14 4 45
Savoury snacks 61 13 11 9 3 37 64 16 12 13 4 38
Sugar confectionery 45 17 21 11 1 62 36 17 22 9 2 59
Sugars, sweeteners, preserves & spreads 67 7 6 5 1 18 65 9 8 7 1 27
Cereal bars 16 11 6 10 5 23 19 13 10 11 4 38
Water as a beverage 96 388 276 326 62 907 95 548 314 503 116 1128
of which
Flavoured water 6 157 153 88 5 - 8 165 135 125 23 488
Soft drinks* 67 239 237 176 34 815 68 237 229 158 41 740
of which
Soft drinks, added sugar 31 101 74 75 24 249 48 139 126 100 30 399
Soft drinks, no added sugar 53 241 247 181 38 819 41 227 229 135 38 826
Milk as a beverage 61 158 141 113 26 412 55 157 121 116 31 402
Fruit juice (100% fruit) 38 94 117 74 15 206 43 94 72 75 22 243
Teas 14 113 104 78 9 390 23 169 127 142 29 445
Sweetened milk drinks 20 78 53 63 25 213 18 89 73 72 33 280
Smoothies 12 86 44 89 29 179 12 101 64 80 21 232
Coffees 0 - - - - - 2 82 59 75 13 -
*carbonated beverages, fruit juice drinks, squashes & cordials
Percentiles Percentiles
Table 3.4 continued Mean, SD, median and percentile values of food group intakes (g/d) by age group, in consumers only
Total Population 5-8y (consumers only) Total Population 9-12y (consumers only)

Food groups
Mean SD Median 5th 95th Mean SD Median 5th 95th Mean SD Median 5th 95th
Total bread 93 50 86 26 202 86 43 81 25 180 99 55 92 27 220
of which
White bread 59 47 54 0 156 49 38 45 0 119 68 52 60 0 163
Wholemeal & brown bread 27 39 8 0 106 28 36 18 0 99 25 42 0 0 116
Other breads (e.g. garlic/fruit bread, scones) 7 15 0 0 45 9 17 0 0 49 5 13 0 0 31
Breakfast cereals 58 58 41 0 184 56 59 39 0 178 59 56 44 0 194
of which
Ready-to-eat breakfast cereals 30 25 27 0 75 26 20 24 0 63 34 27 30 0 88
High-fibre cereals (≥6g/100g) 16 21 10 0 60 14 17 8 0 49 18 23 11 0 67
Low-fibre cereals (˂6g/100g) 14 19 5 0 54 12 17 4 0 49 16 20 8 0 60
Porridge & hot oats cereals (made up) 28 57 0 0 163 30 59 0 0 163 25 56 0 0 165
Pasta, rice & savouries 70 61 56 0 196 62 60 50 0 203 77 60 66 0 188
of which
Pasta 26 40 0 0 105 23 40 0 0 96 29 40 0 0 115
Rice 10 19 0 0 49 10 19 0 0 46 9 18 0 0 50
Other cereals (e.g. noodles, couscous) 6 25 0 0 39 6 27 0 0 43 7 23 0 0 39
Pizza 21 35 0 0 97 18 32 0 0 80 23 37 0 0 101
Other savouries (e.g. fried rice) 7 18 0 0 50 5 14 0 0 39 9 21 0 0 63
Potatoes & potato products 66 53 56 0 157 56 44 50 0 135 75 58 64 0 170
of which
Boiled, baked & mashed potatoes 34 39 24 0 118 29 34 20 0 89 39 42 30 0 130
Chipped, fried & roasted potatoes 26 31 17 0 90 21 24 15 0 71 30 35 24 0 102
Processed & homemade potato products 6 23 0 0 38 6 27 0 0 29 7 18 0 0 44
Total milk 207 160 175 0 513 195 164 160 0 502 217 157 197 0 548
of which
Whole milk 148 160 107 0 432 143 170 102 0 443 152 152 116 0 410
Reduced fat milk 57 117 0 0 317 49 97 0 0 247 64 132 0 0 372
Non-dairy alternatives 2 12 0 0 0 3 15 0 0 4 1 10 0 0 0
Sweetened milk drinks 20 51 0 0 119 21 47 0 0 127 19 53 0 0 115
Yoghurts & fromage frais 36 49 23 0 136 41 47 25 0 143 32 50 3 0 128
Cheeses 11 14 5 0 41 12 15 5 0 45 10 14 5 0 37
Ice creams 7 14 0 0 38 7 13 0 0 38 8 15 0 0 43
Creams 0 3 0 0 4 0 1 0 0 5 1 4 0 0 4
Dairy desserts (e.g. rice pudding, custard) 4 21 0 0 31 4 15 0 0 46 4 24 0 0 31
Spreading fats 7 7 5 0 22 7 6 6 0 19 7 7 5 0 23
Total meat 127 74 114 32 265 104 65 96 25 231 147 76 132 44 289
of which
Meat dishes 50 66 30 0 164 41 59 26 0 127 59 70 32 0 201
Processed meat 45 37 40 0 115 41 33 34 0 114 48 40 43 0 121
Fresh meat 32 35 24 0 96 22 23 17 0 71 40 42 30 0 123
Poultry 20 31 12 0 80 13 19 0 0 59 26 37 17 0 97
Beef 8 16 0 0 45 7 14 0 0 39 9 17 0 0 48
Pork 3 9 0 0 24 2 7 0 0 20 3 10 0 0 26
Lamb 1 5 0 0 0 0 2 0 0 0 1 7 0 0 0
Total fish 14 34 0 0 64 13 20 0 0 66 16 43 0 0 74
of which
White fish, coated 5 11 0 0 32 5 11 0 0 30 5 11 0 0 35
Oily fish 4 29 0 0 25 3 9 0 0 26 5 39 0 0 25
White fish, uncoated 1 6 0 0 10 1 7 0 0 13 1 6 0 0 11
Other fish 2 7 0 0 11 1 4 0 0 9 2 9 0 0 24
Fish dishes 3 11 0 0 19 3 11 0 0 28 3 12 0 0 19
Boys 5-8y (n 149)
Percentiles
Boys 9-12y (n 151)
Percentiles
Table 3.5 Mean, SD, median and percentile values of food group intakes (g/d) for all boys (5-12 y) and by age group, in the total
population
Boys 5-12y (n 300)
Percentiles
Food groups
Mean SD Median 5th 95th Mean SD Median 5th 95th Mean SD Median 5th 95th
Eggs & egg dishes 10 20 0 0 60 8 17 0 0 50 12 21 0 0 71
Nuts & seeds 1 4 0 0 3 0 2 0 0 1 1 6 0 0 8
Total fruit & vegetables 232 135 206 57 490 237 144 209 57 514 226 127 205 54 477
Fruit & fruit juices 154 118 125 16 387 165 128 137 28 394 142 107 118 10 376
Discrete fruit 94 74 80 0 251 104 78 89 4 271 85 69 77 0 224
of which
Apples 30 33 22 0 92 33 34 26 0 101 27 32 19 0 88
Bananas 25 33 11 0 96 25 35 8 0 107 24 30 14 0 88
Citrus fruits 10 22 0 0 59 10 18 0 0 58 11 26 0 0 60
Other fruits 30 41 14 0 108 35 39 26 0 103 24 42 0 0 110
Fruit in composite dishes 9 12 5 0 34 11 14 6 0 37 8 10 5 0 32
Fruit juice (100% fruit) 39 81 0 0 168 38 97 0 0 171 39 61 0 0 171
Smoothies 11 36 0 0 90 13 35 0 0 93 10 37 0 0 108
Total vegetables 78 50 72 12 180 72 47 65 14 161 84 53 78 7 191
Discrete vegetables 43 39 33 0 119 40 34 33 0 107 45 44 34 0 122
of which
Peas, beans & lentils 12 20 0 0 55 10 17 0 0 45 14 22 0 0 61
Baked beans 7 18 0 0 45 6 14 0 0 40 9 21 0 0 54
Carrots 9 15 0 0 43 9 14 2 0 37 10 16 0 0 46
Green vegetables 6 12 0 0 31 8 14 0 0 40 5 9 0 0 24
Other vegetables 15 22 4 0 64 13 19 4 0 54 17 24 5 0 77
Vegetables in composite dishes 35 32 27 0 102 32 31 22 0 102 39 32 30 0 103
Total confectionery/snacks 79 53 70 17 184 73 50 65 16 184 84 55 75 18 194
of which
Biscuits & crackers 17 19 11 0 53 15 19 10 0 45 18 19 11 0 57
Cakes, pastries & buns 15 22 5 0 58 14 18 8 0 47 15 25 0 0 71
Desserts 14 32 0 0 75 14 28 0 0 76 14 35 0 0 55
Chocolate confectionery 9 11 5 0 32 6 9 4 0 24 11 13 6 0 37
Savoury snacks 10 13 6 0 37 9 11 6 0 35 12 15 9 0 39
Sugar confectionery 6 14 0 0 31 7 16 0 0 35 5 12 0 0 29
Sugars, sweeteners, preserves & spreads 6 7 4 0 24 5 6 4 0 18 7 9 3 0 28
Cereal bars 2 5 0 0 12 2 4 0 0 12 2 6 0 0 13
Water as a beverage 480 343 437 0 1100 406 322 329 0 987 545 349 518 0 1185
of which
Flavoured water 12 62 0 0 88 9 56 0 0 4 15 66 0 0 119
Soft drinks* 191 252 108 0 746 191 261 91 0 813 191 244 123 0 708
of which 32 65 0 0 172
Soft drinks, added sugar 54 90 0 0 238 159 257 50 0 813 74 103 38 0 324
Soft drinks, no added sugar 137 238 13 0 695 106 147 54 0 394 117 219 0 0 539
Milk as a beverage 103 136 54 0 359 106 147 54 0 394 101 125 54 0 342
Fruit juice (100% fruit) 39 81 0 0 168 39 103 0 0 171 39 63 0 0 179
Teas 30 82 0 0 221 19 69 0 0 197 39 91 0 0 240
Sweetened milk drinks 20 51 0 0 119 21 47 0 0 127 19 53 0 0 115
Smoothies 11 36 0 0 94 12 34 0 0 94 11 38 0 0 134
Coffees 1 10 0 0 0 0 0 0 0 0 2 14 0 0 0
*carbonated beverages, fruit juice drinks, squashes & cordials
Boys 5-12y (n 300) Boys 5-8y (n 149) Boys 9-12y (n 151)
Percentiles Percentiles Percentiles
Table 3.5 continued Mean, SD, median and percentile values of food group intakes (g/d) for all boys (5-12 y) and by age group, in
the total population
Mean SD Median 5th 95th Mean SD Median 5th 95th Mean SD Median 5th 95th
Total bread 78 39 73 20 149 73 34 73 21 137 83 42 74 20 166
of which
White bread 47 35 41 0 113 41 31 36 0 105 52 37 49 0 120
Wholemeal & brown bread 23 31 9 0 89 23 30 11 0 88 24 33 7 0 92
Other breads (e.g. garlic/fruit bread, scones) 8 18 0 0 39 9 17 0 0 44 7 18 0 0 38
Breakfast cereals 49 47 35 0 141 53 51 40 0 170 44 42 32 0 129
of which
Ready-to-eat breakfast cereals 26 21 22 0 71 24 20 20 0 69 28 22 24 0 72
High-fibre cereals (≥6g/100g) 15 19 9 0 57 14 19 8 0 62 15 19 10 0 56
Low-fibre cereals (˂6g/100g) 11 15 5 0 42 9 13 5 0 37 12 16 6 0 47
Porridge & hot oats cereals (made up) 23 43 0 0 122 30 50 0 0 149 16 34 0 0 91
Pasta, rice & savouries 74 62 59 0 200 60 54 50 0 156 87 67 72 2 245
of which
Pasta 24 29 14 0 83 22 29 10 0 84 25 29 19 0 79
Rice 14 27 0 0 68 12 26 0 0 52 15 28 0 0 78
Other cereals (e.g. noodles, couscous) 7 22 0 0 51 5 16 0 0 36 10 26 0 0 90
Pizza 17 31 0 0 80 12 20 0 0 64 23 38 0 0 103
Other savouries (e.g. fried rice) 12 27 0 0 59 10 25 0 0 55 14 30 0 0 83
Potatoes & potato products 55 44 48 44 129 56 44 50 0 135 54 43 50 0 129
of which
Boiled, baked & mashed potatoes 29 32 20 0 94 32 34 23 0 103 26 31 16 0 90
Chipped, fried & roasted potatoes 21 27 13 0 73 17 24 10 0 65 24 29 17 0 83
Processed & homemade potato products 6 16 0 0 40 7 16 0 0 45 4 16 0 0 36
Total milk 164 147 125 0 470 163 144 131 0 439 164 151 120 0 488
of which
Whole milk 114 145 53 0 431 124 151 83 0 439 105 138 46 0 429
Reduced fat milk 46 101 0 0 272 36 80 0 0 258 56 118 0 0 309
Non-dairy alternatives 3 24 0 0 0 3 18 0 0 0 4 28 0 0 0
Sweetened milk drinks 12 33 0 0 78 10 27 0 0 65 13 37 0 0 89
Yoghurts & fromage frais 32 37 20 0 106 37 38 26 0 112 27 35 14 0 101
Cheeses 10 13 7 0 36 10 11 8 0 37 10 14 6 0 36
Ice creams 9 15 0 0 42 9 14 0 0 39 9 16 0 0 44
Creams 0 2 0 0 2 0 1 0 0 5 1 2 0 0 4
Dairy desserts (e.g. rice pudding, custard) 5 20 0 0 38 5 24 0 0 33 5 15 0 0 39
Spreading fats 6 6 5 0 16 6 5 5 0 15 7 7 5 0 17
Total meat 105 60 96 25 212 98 56 92 23 205 111 63 101 30 255
of which
Meat dishes 43 50 30 0 149 44 48 34 0 141 42 51 24 0 152
Processed meat 38 33 29 0 94 34 26 28 0 83 42 39 33 0 109
Fresh meat 24 25 18 0 76 20 23 14 0 60 27 26 20 0 78
Poultry 15 19 10 0 55 13 16 9 0 41 18 22 11 0 58
Beef 5 12 0 0 28 5 11 0 0 25 6 12 0 0 36
Pork 2 9 0 0 13 2 8 0 0 11 3 10 0 0 20
Lamb 1 4 0 0 11 1 5 0 0 13 1 4 0 0 6
Total fish 12 22 0 0 44 13 21 0 0 49 11 23 0 0 44
of which
White fish, coated 4 11 0 0 28 6 12 0 0 34 3 9 0 0 27
Oily fish 3 8 0 0 23 3 8 0 0 23 2 8 0 0 25
White fish, uncoated 1 5 0 0 7 1 5 0 0 10 1 6 0 0 7
Other fish 1 4 0 0 8 1 3 0 0 7 1 4 0 0 9
Fish dishes 3 16 0 0 12 2 14 0 0 5 4 18 0 0 23
Girls 5-12y (n 300)
Percentiles
Girls 5-8y (n 151)
Percentiles
Table 3.6 Mean, SD, median and percentile values of food group intakes (g/d) for all girls (5-12 y) and by age group, in the total
population
Girls 9-12y (n 149)
Percentiles

Mean SD Median 5th 95th Mean SD Median 5th 95th Mean SD Median 5th 95th
Eggs & egg dishes 9 15 0 0 42 11 16 0 0 44 7 13 0 0 37
Nuts & seeds 1 3 0 0 7 0 2 0 0 3 1 3 0 0 9
Total fruit & vegetables 218 116 203 59 406 206 107 185 59 383 231 215 124 59 430
Fruit & fruit juices 147 108 130 15 335 138 97 123 23 322 155 134 118 5 350
Discrete fruit 89 67 79 0 221 90 68 76 5 224 88 80 67 0 225
of which
Apples 26 29 18 0 80 28 31 21 0 101 23 28 16 0 78
Bananas 17 25 0 0 67 17 24 5 0 69 16 26 0 0 66
Citrus fruits 11 23 0 0 54 9 16 0 0 40 13 28 0 0 69
Other fruits 36 45 21 0 129 35 45 22 0 100 37 45 18 0 147
Fruit in composite dishes 8 13 5 0 29 9 15 4 0 36 8 12 5 0 27
Fruit juice (100% fruit) 37 66 0 0 149 30 59 0 0 140 43 71 0 0 190
Smoothies 12 38 0 0 90 9 28 0 0 77 16 45 0 0 116
Total vegetables 72 47 66 12 161 68 43 64 10 159 76 50 71 12 166
Discrete vegetables 39 35 30 0 103 37 30 32 0 90 41 40 29 0 124
of which
Peas, beans & lentils 10 21 0 0 50 9 15 1 0 42 11 25 0 0 60
Baked beans 6 18 0 0 38 5 12 0 0 33 7 23 0 0 48
Carrots 9 13 4 0 34 10 12 6 0 36 9 13 0 0 32
Green vegetables 6 9 0 0 24 6 10 0 0 24 6 9 0 0 25
Other vegetables 14 19 7 0 50 11 15 7 0 42 16 22 7 0 59
Vegetables in composite dishes 33 30 26 1 90 31 29 23 0 91 43 40 34 3 103
Total confectionery/snacks 73 42 65 16 157 72 41 62 15 152 75 43 68 17 160
of which
Biscuits & crackers 15 13 12 0 43 14 11 11 0 37 16 15 13 0 47
Cakes, pastries & buns 15 20 9 0 55 16 21 10 0 71 15 19 6 0 54
Desserts 12 22 0 0 61 14 23 0 0 63 10 21 0 0 53
Chocolate confectionery 9 11 5 0 30 7 9 4 0 23 10 13 5 0 36
Savoury snacks 8 10 5 0 28 7 10 4 0 28 9 10 6 0 28
Sugar confectionery 8 17 0 0 37 8 16 0 0 30 7 18 0 0 43
Sugars, sweeteners, preserves & spreads 4 5 2 0 15 4 5 2 0 13 5 6 3 0 17
Cereal bars 3 6 0 0 16 2 5 0 0 15 3 7 0 0 18
Water as a beverage 417 280 388 51 963 338 231 299 54 770 494 302 440 7 1033
of which
Flavoured water 10 46 0 0 63 8 43 0 0 30 12 50 0 0 95
Soft drinks* 127 178 56 0 489 128 175 59 0 386 126 180 56 0 504
of which
Soft drinks, added sugar 45 96 0 0 201 30 59 0 0 158 60 121 0 0 248
Soft drinks, no added sugar 82 148 0 0 314 98 163 0 0 344 66 131 0 0 313
Milk as a beverage 78 115 36 0 341 88 120 41 0 357 69 110 0 0 342
Fruit juice (100% fruit) 37 66 0 0 149 30 60 0 0 140 42 70 0 0 176
Teas 25 73 0 0 167 12 34 0 0 100 38 96 0 0 297
Sweetened milk drinks 12 33 0 0 78 21 47 0 0 127 13 37 0 0 89
Smoothies 11 35 0 0 87 9 29 0 0 84 13 40 0 0 96
Coffees 1 11 0 0 0 0 0 0 0 0 2 15 0 0 0
*carbonated beverages, fruit juice drinks, squashes & cordials
Girls 5-12y (n 300) Girls 5-8y (n 151) Girls 9-12y (n 149)
Percentiles Percentiles Percentiles
Table 3.6 continued Mean, SD, median and percentile values of food group intakes (g/d) for all girls (5-12 y) and by age group, in
the total population

Food groups
% Mean SD Median 5th 95th % Mean SD Median 5th 95th % Mean SD Median 5th 95th
Total bread 99 94 49 86 28 202 99 86 42 81 27 181 99 100 54 92 29 220
of which
White bread 89 66 45 59 13 157 87 56 36 53 12 119 91 75 50 63 13 176
Wholemeal & brown bread 52 51 41 40 8 134 60 47 35 34 9 112 45 56 48 42 6 178
Other breads (e.g. garlic/fruit bread, scones) 25 27 20 20 5 69 28 31 20 27 6 68 22 23 20 16 5 75
Breakfast cereals 91 64 57 46 8 195 91 61 59 42 7 193 90 66 55 49 10 205
of which
Ready-to-eat breakfast cereals 84 36 23 32 7 80 86 30 19 26 6 63 83 41 25 34 9 90
High-fibre cereals (≥6g/100g) 59 27 21 22 7 70 58 24 16 22 6 61 61 30 23 22 8 79
Low-fibre cereals (˂6g/100g) 53 27 19 21 5 64 51 23 18 19 5 63 54 29 19 25 5 66
Porridge & hot oats cereals (made up) 27 102 68 87 25 229 31 96 70 76 25 255 23 109 65 112 23 223
Pasta, rice & savouries 87 81 58 66 13 198 87 71 59 56 12 214 86 89 56 78 13 196
of which
Pasta 49 54 43 45 12 129 48 48 47 33 11 148 50 58 39 49 15 130
Rice 30 32 21 28 11 67 32 30 22 25 10 69 29 33 19 32 9 67
Other cereals (e.g. noodles, couscous) 14 45 51 29 1 183 11 57 63 41 1 - 17 39 43 24 1 165
Pizza 38 55 37 43 17 140 37 49 37 38 16 154 39 60 37 52 17 128
Other savouries (e.g. fried rice) 22 32 25 27 3 81 20 25 21 16 2 78 24 37 27 31 7 104
Potatoes & potato products 91 73 51 61 14 163 93 61 43 52 13 136 90 84 55 74 20 174
of which
Boiled, baked & mashed potatoes 64 53 36 44 11 130 65 45 32 36 10 112 63 61 38 51 23 144
Chipped, fried & roasted potatoes 68 38 31 29 6 102 73 29 24 20 5 76 64 47 34 39 12 111
Processed & homemade potato products 19 35 25 25 8 115 18 35 56 22 8 232 19 34 27 29 6 109
Total milk 92 225 155 191 30 531 94 207 161 164 30 519 90 241 147 223 30 551
of which
Whole milk 71 209 153 178 28 510 70 206 169 164 29 533 72 212 140 196 23 450
Reduced fat milk 31 182 146 137 17 535 34 142 119 100 25 411 29 222 160 197 13 579
Non-dairy alternatives 3 62 41 62 10 - 4 61 37 63 25 - 1 65 64 75 10 -
Sweetened milk drinks 22 89 73 67 26 233 24 88 60 74 25 228 21 90 85 63 26 358
Yoghurts & fromage frais 58 62 50 45 13 162 67 62 46 45 13 165 50 63 54 45 12 156
Cheeses 62 18 14 15 3 47 65 19 14 15 3 47 59 17 14 13 2 50
Ice creams 32 23 17 18 7 63 33 21 15 18 6 54 31 24 18 18 7 81
Creams 6 9 10 6 4 - 6 5 1 6 4 - 5 13 14 8 4 -
Dairy desserts (e.g. rice pudding, custard) 7 57 54 48 12 250 9 45 30 48 10 - 6 73 73 45 22 -
Spreading fats 86 8 7 6 1 23 91 8 6 6 1 19 81 9 7 7 1 24
Total meat 98 129 73 114 37 266 98 106 65 97 27 232 99 149 74 134 51 290
of which
Meat dishes 64 79 67 60 13 203 63 65 62 52 12 156 65 90 69 76 14 237
Processed meat 92 49 36 43 7 116 93 44 32 35 6 114 91 53 39 46 8 127
Fresh meat 76 42 35 31 8 103 69 32 21 27 6 72 82 49 41 36 12 132
Poultry 56 36 33 25 9 99 48 27 19 22 5 68 63 42 39 27 11 103
Beef 32 26 17 20 6 66 31 24 15 21 5 55 33 28 19 20 7 72
Pork 11 25 14 23 7 64 9 22 14 21 5 - 13 26 14 23 12 73
Lamb 3 26 19 19 4 - 2 16 8 19 4 - 4 30 21 32 6 -
Total fish 41 35 46 25 6 85 43 30 22 25 7 84 40 40 61 26 5 89
of which
White fish, coated 19 24 12 21 7 50 22 23 11 20 7 50 18 26 13 25 5 51
Oily fish 13 33 76 19 3 55 14 21 14 20 2 55 12 45 108 18 4 -
White fish, uncoated 5 24 15 17 9 - 5 27 19 19 9 - 6 21 13 17 9 -
Other fish 7 23 16 16 5 55 7 13 8 12 5 - 7 31 16 26 10 -
Fish dishes 8 34 25 29 2 88 7 36 23 32 4 - 8 33 28 26 2 -
Percentiles
Boys 5-12y (consumers only) Boys 5-8y (consumers only) Boys 9-12y (consumers only)
Table 3.7 Mean, SD, median and percentile values of food group intakes (g/d) for all boys (5-12 y) and by age group, in consumers only
Percentiles Percentiles
Food groups
% Mean SD Median 5th 95th % Mean SD Median 5th 95th % Mean SD Median 5th 95th
Eggs & egg dishes 32 32 23 25 6 80 27 30 21 19 12 78 36 33 25 25 5 81
Nuts & seeds 7 10 14 8 2 65 5 6 5 4 2 - 9 12 17 9 2 -
Total fruit & vegetables 100 228 141 204 52 500 100 234 154 201 52 525 100 222 128 204 50 492
Fruit & fruit juices 98 155 122 126 21 403 98 167 136 136 29 410 98 145 108 118 16 400
Discrete fruit 94 100 71 84 18 256 94 108 77 89 18 277 91 92 65 83 18 215
of which
Apples 61 47 28 41 15 109 67 48 28 40 14 107 56 46 28 41 15 110
Bananas 50 48 31 41 14 119 48 50 35 38 11 124 52 46 28 43 14 100
Citrus fruits 31 34 30 23 9 90 35 28 21 20 6 74 27 40 37 27 10 154
Other fruits 59 50 43 36 5 128 69 51 41 39 8 132 49 48 45 35 4 128
Fruit in composite dishes 84 11 13 7 1 37 80 14 17 8 2 52 82 9 9 6 0 31
Fruit juice (100% fruit) 40 100 109 77 17 253 39 102 147 75 13 274 40 98 64 79 25 247
Smoothies 11 104 50 90 34 208 13 91 41 90 31 - 9 120 57 141 31 -
Total vegetables 98 78 50 70 14 181 99 72 49 63 14 168 96 84 51 78 13 183
Discrete vegetables 82 50 37 39 7 121 87 46 34 38 6 112 78 55 40 41 9 122
of which
Peas, beans & lentils 47 25 22 18 3 74 48 21 18 17 1 67 46 28 24 21 4 86
Baked beans 20 34 23 26 9 89 20 28 17 20 9 70 21 40 26 33 8 103
Carrots 48 19 17 13 2 51 51 18 16 13 2 50 46 21 18 15 3 53
Green vegetables 33 18 14 14 3 50 36 21 16 15 2 61 32 15 11 12 3 39
Other vegetables 60 25 23 17 2 80 60 22 21 16 1 65 59 27 25 19 2 81
Vegetables in composite dishes 95 37 32 27 2 103 94 33 32 23 2 107 93 40 32 32 2 103
Total confectionery/snacks 100 79 53 70 17 184 100 73 50 65 16 184 99 85 54 75 19 195
of which
Biscuits & crackers 78 21 20 16 4 56 82 18 20 13 3 50 75 24 19 19 4 64
Cakes, pastries & buns 53 28 23 23 5 87 59 24 18 20 5 57 48 32 27 25 5 101
Desserts 34 42 43 30 6 109 32 44 34 33 6 115 35 39 49 29 4 108
Chocolate confectionery 57 15 11 15 3 37 56 12 8 10 3 26 58 19 12 16 5 44
Savoury snacks 64 16 13 13 4 42 63 14 11 11 4 37 65 18 15 14 5 44
Sugar confectionery 36 17 19 10 2 57 40 18 22 11 1 76 32 16 17 9 2 57
Sugars, sweeteners, preserves & spreads 69 9 8 7 1 27 72 8 6 7 1 21 66 10 9 7 1 30
Cereal bars 14 12 9 10 4 33 15 10 6 9 5 29 14 13 11 10 3 46
Water as a beverage 94 510 332 466 103 1123 94 433 314 386 86 993 95 575 333 537 125 1206
of which
Flavoured water 6 194 160 125 6 500 5 193 184 115 5 - 8 195 154 172 15 -
Soft drinks* 73 261 261 166 38 822 74 258 274 169 35 838 72 265 251 166 50 854
of which
Soft drinks, added sugar 40 134 96 123 38 374 27 118 75 112 30 256 52 142 104 123 39 382
Soft drinks, no added sugar 51 270 275 161 38 936 59 268 287 193 37 931 43 272 263 156 38 951
Milk as a beverage 60 172 137 135 33 422 61 174 154 127 30 437 59 170 121 139 35 422
Fruit juice (100% fruit) 40 100 109 77 17 253 39 102 147 75 13 274 40 98 64 79 25 247
Teas 19 153 126 109 21 462 13 156 135 139 9 - 26 152 124 108 39 444
Sweetened milk drinks 22 89 73 67 26 233 24 88 60 74 25 228 21 90 85 63 26 358
Smoothies 11 104 50 90 34 208 13 91 90 90 31 - 9 120 57 141 31 -
Coffees 1 92 43 104 45 - 0 - - - - - 2 92 43 104 45 -
*carbonated beverages, fruit juice drinks, squashes & cordials
Boys 5-12y (consumers only) Boys 5-8y (consumers only) Boys 9-12y (consumers only)
Percentiles Percentiles Percentiles
Table 3.7 continued Mean, SD, median and percentile values of food group intakes (g/d) for all boys (5-12 y) and by age group, in
consumers only
% Mean SD Median 5th 95th % Mean SD Median 5th 95th % Mean SD Median 5th 95th
Total bread 100 78 39 73 21 149 99 74 34 73 22 138 100 83 74 74 20 166
of which
White bread 89 53 32 46 11 113 88 47 29 40 11 108 89 58 34 55 11 124
Wholemeal & brown bread 56 42 32 36 7 98 59 39 30 31 7 97 52 46 34 40 7 116
Other breads (e.g. garlic/fruit bread, scones) 29 26 24 19 6 62 34 25 21 18 6 64 25 27 28 21 4 86
Breakfast cereals 92 53 46 38 7 149 93 57 51 43 7 180 91 49 41 35 7 130
of which
Ready-to-eat breakfast cereals 86 30 20 26 6 72 86 28 19 23 6 69 87 32 21 28 6 72
High-fibre cereals (≥6g/100g) 59 25 19 19 5 69 59 24 19 18 4 69 60 25 19 20 5 71
Low-fibre cereals (˂6g/100g) 55 20 14 18 5 48 57 17 13 12 4 44 53 23 15 21 6 61
Porridge & hot oats cereals (made up) 29 78 45 62 23 165 36 83 52 61 20 194 23 72 32 71 29 148
Pasta, rice & savouries 92 80 61 63 15 204 88 68 52 56 10 160 95 91 66 76 19 253
of which
Pasta 57 42 28 36 8 96 56 40 29 32 6 93 58 43 27 40 12 106
Rice 34 40 33 29 12 112 33 37 33 29 9 113 35 44 33 29 13 129
Other cereals (e.g. noodles, couscous) 17 42 37 28 2 124 14 32 32 27 1 136 20 49 38 35 7 123
Pizza 37 47 34 33 10 129 35 33 22 27 6 76 39 58 39 52 11 145
Other savouries (e.g. fried rice) 30 40 38 29 6 131 28 35 36 24 6 115 32 44 39 34 6 145
Potatoes & potato products 92 60 42 51 13 131 95 59 43 48 14 145 89 60 41 56 12 134
of which
Boiled, baked & mashed potatoes 65 44 30 37 10 105 72 44 32 36 10 107 58 45 28 39 10 96
Chipped, fried & roasted potatoes 61 34 27 26 8 96 57 31 25 23 7 81 65 36 29 27 8 100
Processed & homemade potato products 18 31 25 22 7 78 26 28 22 20 6 73 11 40 29 32 10 -
Total milk 90 183 144 142 18 483 87 186 139 150 24 473 92 179 149 138 10 502
of which
Whole milk 65 176 146 140 12 479 66 189 150 144 15 537 64 162 142 120 9 453
Reduced fat milk 30 153 133 108 12 469 25 141 102 108 20 313 35 161 152 102 10 546
Non-dairy alternatives 3 117 83 122 37 - 4 78 51 52 37 - 2 195 85 176 137 -
Sweetened milk drinks 16 75 46 64 26 211 16 63 37 56 20 188 15 88 52 76 29 245
Yoghurts & fromage frais 61 52 34 45 10 124 66 56 34 51 10 120 55 48 34 38 11 124
Cheeses 64 16 12 13 3 39 68 15 10 13 3 38 60 17 14 13 3 43
Ice creams 39 24 16 18 7 62 40 24 14 19 8 62 39 23 18 17 6 76
Creams 5 6 5 4 1 - 2 4 3 3 1 - 9 7 5 6 2 -
Dairy desserts (e.g. rice pudding, custard) 10 51 43 38 13 201 10 56 58 33 11 - 10 46 23 38 21 -
Spreading fats 88 7 6 6 1 17 91 7 5 6 1 16 85 8 8 8 2 19
Total meat 98 107 59 97 29 212 98 100 55 94 25 205 99 113 62 113 31 255
of which
Meat dishes 64 68 47 54 15 171 67 66 45 52 16 170 60 71 48 59 15 175
Processed meat 90 42 33 33 6 97 91 37 25 30 6 84 89 47 38 37 6 136
Fresh meat 70 34 23 27 8 78 67 30 22 24 5 74 73 37 24 31 8 78
Poultry 56 27 19 22 8 61 54 23 16 20 5 51 57 31 20 27 9 71
Beef 26 20 15 17 3 53 23 20 16 19 2 70 28 21 15 16 6 54
Pork 10 22 20 13 8 72 9 18 20 11 7 - 10 26 19 18 9 -
Lamb 6 16 6 16 6 - 7 16 7 14 6 - 5 17 6 18 7 -
Total fish 40 30 26 24 7 78 45 28 24 20 7 69 34 32 30 26 8 107
of which
White fish, coated 18 23 14 20 8 55 25 22 15 17 2 58 12 25 10 25 12 -
Oily fish 15 19 10 17 4 39 18 18 10 15 5 39 12 21 10 21 4 -
White fish, uncoated 5 22 12 21 8 - 5 21 9 19 10 - 5 23 15 22 8 -
Other fish 7 14 8 12 3 30 5 14 6 15 6 - 8 13 9 10 3 -
Fish dishes 6 46 52 26 7 - 5 40 56 18 7 - 7 50 51 38 12 -
Percentiles
Girls 5-12y (consumers only) Girls 5-8y (consumers only) Girls 9-12y (consumers only)
Table 3.8 Mean, SD, median and percentile values of food group intakes (g/d) for all girls (5-12 y) and by age group, in consumers only
Percentiles Percentiles
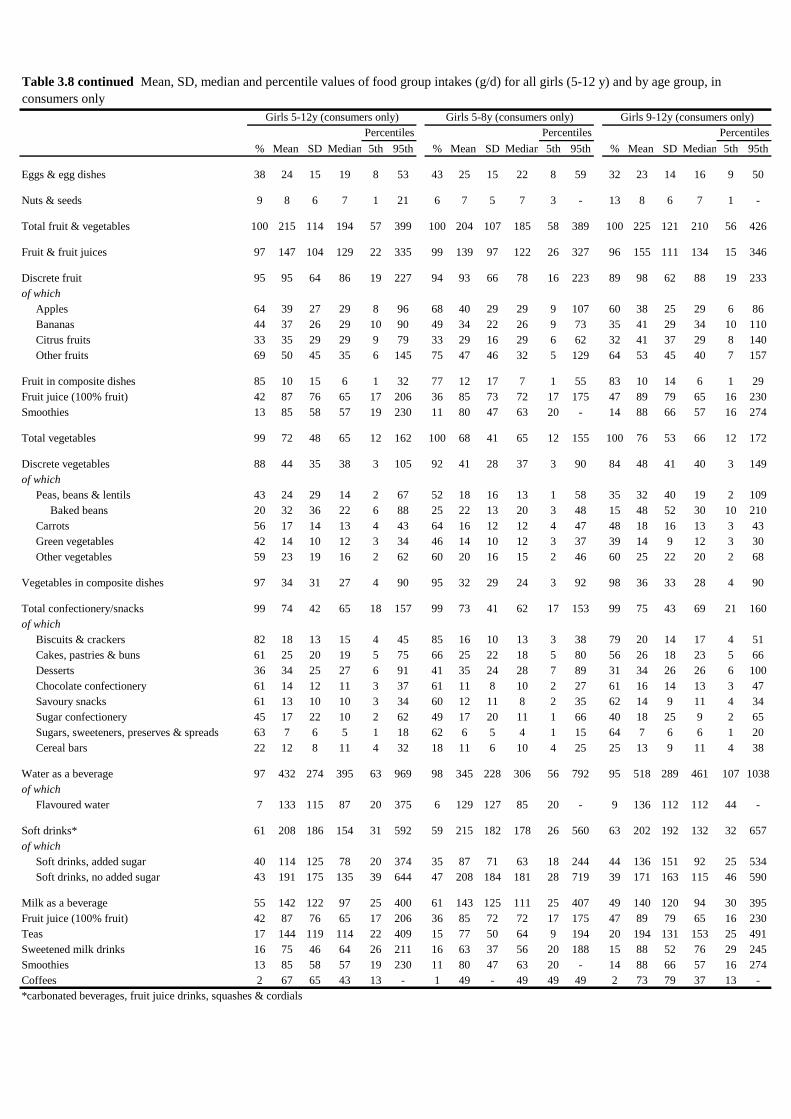
% Mean SD Median 5th 95th % Mean SD Median 5th 95th % Mean SD Median 5th 95th
Eggs & egg dishes 38 24 15 19 8 53 43 25 15 22 8 59 32 23 14 16 9 50
Nuts & seeds 9 8 6 7 1 21 6 7 5 7 3 - 13 8 6 7 1 -
Total fruit & vegetables 100 215 114 194 57 399 100 204 107 185 58 389 100 225 121 210 56 426
Fruit & fruit juices 97 147 104 129 22 335 99 139 97 122 26 327 96 155 111 134 15 346
Discrete fruit 95 95 64 86 19 227 94 93 66 78 16 223 89 98 62 88 19 233
of which
Apples 64 39 27 29 8 96 68 40 29 29 9 107 60 38 25 29 6 86
Bananas 44 37 26 29 10 90 49 34 22 26 9 73 35 41 29 34 10 110
Citrus fruits 33 35 29 29 9 79 33 29 16 29 6 62 32 41 37 29 8 140
Other fruits 69 50 45 35 6 145 75 47 46 32 5 129 64 53 45 40 7 157
Fruit in composite dishes 85 10 15 6 1 32 77 12 17 7 1 55 83 10 14 6 1 29
Fruit juice (100% fruit) 42 87 76 65 17 206 36 85 73 72 17 175 47 89 79 65 16 230
Smoothies 13 85 58 57 19 230 11 80 47 63 20 - 14 88 66 57 16 274
Total vegetables 99 72 48 65 12 162 100 68 41 65 12 155 100 76 53 66 12 172
Discrete vegetables 88 44 35 38 3 105 92 41 28 37 3 90 84 48 41 40 3 149
of which
Peas, beans & lentils 43 24 29 14 2 67 52 18 16 13 1 58 35 32 40 19 2 109
Baked beans 20 32 36 22 6 88 25 22 13 20 3 48 15 48 52 30 10 210
Carrots 56 17 14 13 4 43 64 16 12 12 4 47 48 18 16 13 3 43
Green vegetables 42 14 10 12 3 34 46 14 10 12 3 37 39 14 9 12 3 30
Other vegetables 59 23 19 16 2 62 60 20 16 15 2 46 60 25 22 20 2 68
Vegetables in composite dishes 97 34 31 27 4 90 95 32 29 24 3 92 98 36 33 28 4 90
Total confectionery/snacks 99 74 42 65 18 157 99 73 41 62 17 153 99 75 43 69 21 160
of which
Biscuits & crackers 82 18 13 15 4 45 85 16 10 13 3 38 79 20 14 17 4 51
Cakes, pastries & buns 61 25 20 19 5 75 66 25 22 18 5 80 56 26 18 23 5 66
Desserts 36 34 25 27 6 91 41 35 24 28 7 89 31 34 26 26 6 100
Chocolate confectionery 61 14 12 11 3 37 61 11 8 10 2 27 61 16 14 13 3 47
Savoury snacks 61 13 10 10 3 34 60 12 11 8 2 35 62 14 9 11 4 34
Sugar confectionery 45 17 22 10 2 62 49 17 20 11 1 66 40 18 25 9 2 65
Sugars, sweeteners, preserves & spreads 63 7 6 5 1 18 62 6 5 4 1 15 64 7 6 6 1 20
Cereal bars 22 12 8 11 4 32 18 11 6 10 4 25 25 13 9 11 4 38
Water as a beverage 97 432 274 395 63 969 98 345 228 306 56 792 95 518 289 461 107 1038
of which
Flavoured water 7 133 115 87 20 375 6 129 127 85 20 - 9 136 112 112 44 -
Soft drinks* 61 208 186 154 31 592 59 215 182 178 26 560 63 202 192 132 32 657
of which
Soft drinks, added sugar 40 114 125 78 20 374 35 87 71 63 18 244 44 136 151 92 25 534
Soft drinks, no added sugar 43 191 175 135 39 644 47 208 184 181 28 719 39 171 163 115 46 590
Milk as a beverage 55 142 122 97 25 400 61 143 125 111 25 407 49 140 120 94 30 395
Fruit juice (100% fruit) 42 87 76 65 17 206 36 85 72 72 17 175 47 89 79 65 16 230
Teas 17 144 119 114 22 409 15 77 50 64 9 194 20 194 131 153 25 491
Sweetened milk drinks 16 75 46 64 26 211 16 63 37 56 20 188 15 88 52 76 29 245
Smoothies 13 85 58 57 19 230 11 80 47 63 20 - 14 88 66 57 16 274
Coffees 2 67 65 43 13 - 1 49 - 49 49 49 2 73 79 37 13 -
*carbonated beverages, fruit juice drinks, squashes & cordials
Girls 5-12y (consumers only) Girls 5-8y (consumers only) Girls 9-12y (consumers only)
Percentiles Percentiles Percentiles
Table 3.8 continued Mean, SD, median and percentile values of food group intakes (g/d) for all girls (5-12 y) and by age group, in
consumers only

Chapter 4 Nutrient Intakes

Mean SD Median 5th 95th
Macronutrients & Fibre
Energy (MJ) 6.3 1.2 6.2 4.5 8.3
Energy (kcal) 1487 275 1469 1067 1969
Protein (g) 59.6 14.1 58.0 39.2 85.3
Total fat (g) 55.8 12.7 54.8 36.8 78.5
Saturated fat (g) 23.4 5.6 23.0 15.0 33.4
Monounsaturated fat (g) 22.9 5.6 22.4 14.7 32.9
Polyunsaturated fat (g) 9.3 2.5 9.0 5.8 13.8
Carbohydrate (g) 196.9 38.3 194.8 137.9 264.2
Total sugar (g) 73.7 19.4 72.3 44.4 108.1
Free sugar (g) 38.4 14.9 36.6 17.4 65.6
Dietary fibre (g) 14.4 3.5 14.1 9.2 20.7
Protein (% TE) 16.2 2.1 16.0 13.0 19.9
Total fat (% TE) 33.3 3.8 33.3 27.0 39.6
Saturated fat (% TE) 14.0 2.2 14.0 10.6 17.7
Monounsaturated fat (% TE) 13.6 1.8 13.6 10.7 16.6
Polyunsaturated fat (% TE) 5.5 1.0 5.5 4.1 7.3
Carbohydrate (% TE) 50.0 4.3 50.1 42.8 57.0
Total sugar (% TE) 18.7 4.0 18.5 12.5 25.6
Free Sugar (% TE) 9.5 3.4 9.2 4.5 15.6
Dietary fibre (g/10MJ) 23.5 4.3 23.2 16.9 30.9
Vitamins*
Total Vitamin A (µg) 666 307 613 274 1243
Retinol (µg) 292 146 268 101 565
Carotene (µg) 2397 1828 1920 600 5823
Vitamin D (µg) 4.2 3.1 3.5 0.9 10.1
Vitamin E (mg) 6.9 2.9 6.5 3.0 12.4
Thiamin (mg) 1.4 0.4 1.4 0.8 2.2
Riboflavin (mg) 1.6 0.6 1.5 0.8 2.6
Total Niacin (mg) 28.8 7.5 28.0 18.2 42.5
Vitamin B6 (mg) 1.5 0.5 1.4 0.8 2.5
Vitamin B12 (µg) 4.6 1.8 4.4 2.1 8.0
Total folate (µg) 211 65 204 117 330
Dietary Folate Equivalents (µg) 253 97 238 122 432
Biotin (µg) 25.3 11.2 23.3 10.9 46.4
Pantothenate (mg) 5.3 1.8 5.1 2.8 8.8
Vitamin C (mg) 73 42 65 22 154
Minerals*
Sodium (mg) 1657 365 1627 1114 2310
Potassium (mg) 2019 486 1980 1296 2891
Calcium (mg) 791 241 767 438 1224
Iron (mg) 9.0 2.4 8.7 5.4 13.4
Magnesium (mg) 194 47 190 124 279
Zinc (mg) 7.3 2.1 7.1 4.4 11.1
Copper (mg) 0.8 0.2 0.7 0.5 1.1
Phosphorus (mg) 1008 256 986 628 1467
*All sources including nutritional supplements
TE: Total Energy
Percentiles
Total population 5-12y (n 600)
Table 4.1 Mean, SD, median and percentile values for daily energy, macronutrient, dietary fibre, vitamin and
mineral intakes in children aged 5-12 years (total population)

Mean SD Median 5th 95th Mean SD Median 5th 95th
Macronutrients & Fibre
Energy (MJ) 6.7 1.2 6.6 4.8 8.7 5.9 1.0 5.8 4.3 7.6
Energy (kcal) 1583 280 1567 1147 2065 1398 238 1388 1023 1810
Protein (g) 64.8 14.8 63.5 42.9 91.2 54.8 11.6 53.8 37.4 75.3
Total fat (g) 59.2 13.2 58.2 39.2 82.4 52.7 11.3 51.9 35.4 72.6
Saturated fat (g) 24.7 5.8 24.3 15.9 34.7 22.2 5.2 21.9 14.4 31.3
Monounsaturated fat (g) 24.4 5.8 23.9 15.7 34.7 21.5 4.9 21.1 14.1 30.2
Polyunsaturated fat (g) 9.9 2.6 9.6 6.2 14.7 8.7 2.1 8.4 5.6 12.5
Carbohydrate (g) 208.6 38.7 206.7 148.4 275.3 186.2 34.7 184.6 132.0 246.6
Total sugar (g) 77.4 19.6 76.1 47.8 111.9 70.3 18.6 69.0 42.3 103.3
Free sugar (g) 39.0 15.2 37.2 17.6 66.6 37.8 14.6 36.1 17.2 64.6
Dietary fibre (g) 15.5 3.6 15.3 10.1 21.9 13.4 3.1 13.2 8.7 18.9
Protein (% TE) 16.5 2.1 16.4 13.2 20.2 15.9 2.0 15.7 12.8 19.4
Total fat (% TE) 33.2 3.9 33.2 26.9 39.6 33.4 3.8 33.4 27.2 39.7
Saturated fat (% TE) 13.9 2.1 13.9 10.4 17.5 14.2 2.1 14.1 10.7 17.8
Monounsaturated fat (% TE) 13.6 1.8 13.6 10.7 16.7 13.6 1.8 13.5 10.7 16.6
Polyunsaturated fat (% TE) 5.6 1.0 5.5 4.1 7.4 5.5 1.0 5.4 4.1 7.2
Carbohydrate (% TE) 49.8 4.4 49.9 42.5 56.8 50.2 4.3 50.3 43.0 57.1
Total sugar (% TE) 18.5 4.1 18.3 12.2 25.5 18.9 3.9 18.7 12.8 25.6
Free Sugar (% TE) 9.1 3.3 8.8 4.3 15.1 9.8 3.4 9.5 4.8 16.0
Dietary fibre (g/10MJ) 23.8 4.3 23.6 17.2 31.2 23.2 4.2 22.9 16.7 30.6
Vitamins*
Total Vitamin A (µg) 702 319 649 292 1301 632 291 582 260 1174
Retinol (µg) 317 152 294 115 601 269 136 246 92 523
Carotene (µg) 2405 1837 1926 599 5854 2390 1820 1913 601 5794
Vitamin D (µg) 4.4 3.1 3.7 1.0 10.5 4.1 3.0 3.3 0.9 9.8
Vitamin E (mg) 7.3 3.1 6.9 3.2 13.0 6.5 2.7 6.1 2.9 11.6
Thiamin (mg) 1.5 0.4 1.5 0.9 2.3 1.3 0.4 1.3 0.8 2.0
Riboflavin (mg) 1.8 0.6 1.7 0.9 2.8 1.4 0.5 1.4 0.7 2.4
Total Niacin (mg) 31.6 7.8 30.8 20.0 45.5 26.3 6.1 25.8 17.3 37.2
Vitamin B6 (mg) 1.7 0.6 1.6 0.9 2.7 1.4 0.5 1.3 0.7 2.2
Vitamin B12 (µg) 5.1 1.9 4.9 2.4 8.6 4.2 1.6 4.0 1.8 7.1
Total folate (µg) 229 67 222 131 349 194 59 188 109 300
Dietary Folate Equivalents (µg) 276 101 263 137 462 231 87 219 113 391
Biotin (µg) 28.7 11.9 26.8 13.0 51.0 22.2 9.4 20.7 9.9 39.8
Pantothenate (mg) 5.9 1.9 5.6 3.2 9.4 4.9 1.6 4.6 2.6 7.8
Vitamin C (mg) 74 43 66 22 156 72 42 64 22 152
Minerals*
Sodium (mg) 1787 374 1760 1221 2443 1537 313 1517 1059 2088
Potassium (mg) 2195 494 2161 1445 3060 1858 418 1830 1222 2596
Calcium (mg) 871 243 853 509 1303 717 213 699 402 1098
Iron (mg) 9.7 2.5 9.5 6.0 14.2 8.3 2.1 8.1 5.1 12.1
Magnesium (mg) 211 48 208 139 296 178 40 176 117 249
Zinc (mg) 8.0 2.1 7.8 4.9 11.8 6.7 1.7 6.5 4.1 9.8
Copper (mg) 0.8 0.2 0.8 0.5 1.2 0.7 0.2 0.7 0.4 1.0
Phosphorus (mg) 1104 259 1086 712 1558 920 219 905 588 1306
*All sources including nutritional supplements
TE: Total Energy
Boys 5-12y (n 300)
Percentiles
Girls 5-12y (n 300)
Percentiles
Table 4.2 Mean, SD, median and percentile values for daily energy, macronutrient, vitamin and mineral intakes by gender

Mean SD Median 5th 95th Mean SD Median 5th 95th
Macronutrients & Fibre
Energy (MJ) 5.8 1.0 5.8 4.3 7.5 6.7 1.1 6.7 5.0 8.7
Energy (kcal) 1380 234 1369 1017 1788 1600 270 1582 1184 2069
Protein (g) 55.0 11.8 54.0 37.5 76.1 64.5 14.8 62.9 43.0 91.1
Total fat (g) 51.6 11.0 50.8 34.9 71.0 60.3 12.8 59.3 41.1 82.9
Saturated fat (g) 22.1 5.2 21.8 14.3 31.3 24.8 5.7 24.3 16.2 34.7
Monounsaturated fat (g) 20.8 4.7 20.4 13.8 29.1 25.1 5.6 24.6 16.8 35.0
Polyunsaturated fat (g) 8.5 2.1 8.3 5.5 12.3 10.1 2.6 9.8 6.4 14.8
Carbohydrate (g) 183.9 34.2 182.0 131.0 243.7 210.8 37.6 208.5 152.8 276.2
Total sugar (g) 71.2 19.1 69.8 42.6 105.1 76.3 19.4 74.9 47.2 110.7
Free sugar (g) 35.4 13.9 33.7 15.9 60.9 41.6 15.2 39.9 20.1 69.3
Dietary fibre (g) 13.8 3.3 13.5 8.9 19.6 15.1 3.6 14.7 9.7 21.6
Protein (% TE) 16.1 2.1 15.9 12.9 19.7 16.3 2.1 16.1 13.0 20.0
Total fat (% TE) 33.1 3.9 33.1 26.8 39.5 33.5 3.8 33.5 27.4 39.8
Saturated fat (% TE) 14.2 2.2 14.2 10.7 17.8 13.8 2.1 13.8 10.4 17.4
Monounsaturated fat (% TE) 13.3 1.8 13.3 10.5 16.3 13.9 1.8 13.9 11.1 16.9
Polyunsaturated fat (% TE) 5.5 1.0 5.4 4.0 7.2 5.6 1.0 5.5 4.2 7.4
Carbohydrate (% TE) 50.2 4.3 50.3 43.0 57.1 49.8 4.3 49.9 42.6 56.7
Total sugar (% TE) 19.4 4.0 19.2 13.1 26.2 18.0 3.9 17.8 12.0 24.7
Free Sugar (% TE) 9.4 3.4 9.0 4.4 15.4 9.6 3.4 9.3 4.7 15.7
Dietary fibre (g/10MJ) 24.1 4.3 23.9 17.5 31.6 22.8 4.1 22.6 16.5 30.0
Vitamins*
Total Vitamin A (µg) 659 303 607 270 1231 673 310 619 278 1257
Retinol (µg) 291 144 268 102 561 292 148 267 101 569
Carotene (µg) 2317 1754 1853 575 5679 2482 1900 1993 634 5962
Vitamin D (µg) 4.4 3.1 3.7 1.0 10.5 4.1 3.0 3.3 0.9 9.8
Vitamin E (mg) 6.7 2.8 6.3 2.9 11.9 7.2 3.0 6.7 3.1 12.8
Thiamin (mg) 1.3 0.4 1.3 0.8 2.0 1.5 0.4 1.4 0.9 2.3
Riboflavin (mg) 1.6 0.6 1.5 0.7 2.6 1.6 0.6 1.6 0.8 2.7
Total Niacin (mg) 26.9 6.4 26.3 17.5 38.3 30.9 8.0 29.9 19.4 45.3
Vitamin B6 (mg) 1.5 0.5 1.4 0.7 2.4 1.6 0.6 1.5 0.8 2.6
Vitamin B12 (µg) 4.6 1.8 4.4 2.1 7.8 4.7 1.9 4.4 2.1 8.1
Total folate (µg) 205 63 199 114 321 216 67 208 120 337
Dietary Folate Equivalents (µg) 248 94 234 119 422 258 99 243 124 441
Biotin (µg) 24.4 10.5 22.5 10.7 44.2 26.3 11.7 24.2 11.3 48.4
Pantothenate (mg) 5.1 1.8 4.9 2.7 8.4 5.6 1.9 5.3 2.9 9.1
Vitamin C (mg) 73 42 64 22 154 74 42 65 22 154
Minerals*
Sodium (mg) 1526 312 1504 1054 2080 1796 367 1764 1248 2445
Potassium (mg) 1906 440 1873 1243 2689 2141 504 2095 1391 3035
Calcium (mg) 778 235 756 432 1204 804 245 779 446 1246
Iron (mg) 8.5 2.2 8.3 5.2 12.5 9.5 2.6 9.2 5.7 14.1
Magnesium (mg) 183 43 180 119 259 206 49 201 133 293
Zinc (mg) 7.0 1.9 6.8 4.3 10.3 7.7 2.2 7.4 4.6 11.7
Copper (mg) 0.7 0.2 0.7 0.4 1.0 0.8 0.2 0.8 0.5 1.2
Phosphorus (mg) 957 234 939 605 1375 1063 267 1038 668 1538
*All sources including nutritional supplements
TE: Total Energy
Total Population 5-8y (n 300)
Percentiles
Total Population 9-12y (n 300)
Percentiles
Table 4.3 Mean, SD, median and percentile values for daily energy, macronutrient, vitamin and mineral intakes by age group

Mean SD Median 5th 95th Mean SD Median 5th 95th
Macronutrients & Fibre
Energy (MJ) 6.1 1.0 6.1 4.6 7.8 7.3 1.1 7.2 5.6 9.1
Energy (kcal) 1447 230 1441 1089 1850 1731 254 1720 1337 2161
Protein (g) 58.0 11.9 57.2 40.3 79.4 72.3 14.1 71.2 51.4 96.9
Total fat (g) 53.6 11.1 53.0 36.7 73.4 65.4 12.6 64.6 46.3 87.2
Saturated fat (g) 22.9 5.2 22.7 15.0 32.3 26.6 5.7 26.2 17.9 36.4
Monounsaturated fat (g) 21.7 4.7 21.4 14.6 30.2 27.3 5.5 26.9 19.0 36.9
Polyunsaturated fat (g) 8.8 2.1 8.7 5.8 12.7 11.2 2.6 10.9 7.4 15.8
Carbohydrate (g) 193.3 33.8 192.2 140.9 252.6 225.2 36.7 223.5 168.5 287.7
Total sugar (g) 75.4 19.2 74.3 46.4 109.8 79.6 19.8 78.2 49.9 114.0
Free sugar (g) 35.5 13.8 34.0 16.0 61.4 42.8 15.6 41.0 20.8 70.8
Dietary fibre (g) 14.5 3.3 14.3 9.6 20.4 16.6 3.6 16.4 11.3 22.9
Protein (% TE) 16.2 2.1 16.1 13.0 19.8 16.9 2.2 16.7 13.6 20.6
Total fat (% TE) 32.8 3.8 32.8 26.5 39.2 33.6 3.8 33.6 27.4 39.9
Saturated fat (% TE) 14.0 2.2 14.0 10.6 17.7 13.7 2.1 13.7 10.3 17.3
Monounsaturated fat (% TE) 13.2 1.8 13.2 10.4 16.3 14.0 1.8 14.0 11.2 17.0
Polyunsaturated fat (% TE) 5.4 1.0 5.4 4.0 7.2 5.7 1.0 5.7 4.3 7.5
Carbohydrate (% TE) 50.4 4.3 50.5 43.2 57.4 49.1 4.3 49.2 41.9 56.1
Total sugar (% TE) 19.6 4.0 19.5 13.3 26.5 17.3 3.8 17.2 11.5 23.8
Free Sugar (% TE) 9.0 3.3 8.7 4.2 15.0 9.3 3.3 8.9 4.4 15.2
Dietary fibre (g/10MJ) 24.2 4.3 24.0 17.6 31.8 23.3 4.2 23.1 16.9 30.6
Vitamins*
Total Vitamin A (µg) 678 308 629 281 1273 728 329 673 309 1336
Retinol (µg) 302 146 281 108 582 333 157 309 125 621
Carotene (µg) 2292 1713 1849 571 5679 2528 1956 2019 642 6069
Vitamin D (µg) 4.3 3.0 3.6 0.9 10.3 4.6 3.2 3.8 1.1 10.7
Vitamin E (mg) 6.6 2.8 6.3 2.9 11.9 8.1 3.2 7.6 3.8 13.9
Thiamin (mg) 1.4 0.4 1.4 0.9 2.2 1.7 0.4 1.6 1.0 2.5
Riboflavin (mg) 1.7 0.6 1.7 0.9 2.7 1.9 0.6 1.8 1.0 2.9
Total Niacin (mg) 28.3 6.4 27.8 18.7 40.0 35.2 7.6 34.5 23.9 48.5
Vitamin B6 (mg) 1.5 0.5 1.5 0.8 2.5 1.8 0.6 1.7 1.0 2.8
Vitamin B12 (µg) 4.9 1.8 4.7 2.3 8.3 5.4 1.9 5.2 2.7 8.8
Total folate (µg) 220 65 214 126 338 239 68 232 140 360
Dietary Folate Equivalents (µg) 264 97 253 131 447 288 104 274 146 477
Biotin (µg) 26.7 11.0 25.1 12.2 47.7 30.8 12.5 28.9 14.5 53.7
Pantothenate (mg) 5.6 1.8 5.4 3.0 8.9 6.2 2.0 6.0 3.5 9.8
Vitamin C (mg) 74 43 66 22 158 74 43 65 22 154
Minerals*
Sodium (mg) 1621 309 1606 1151 2173 1969 353 1947 1434 2578
Potassium (mg) 2027 439 2004 1361 2812 2379 485 2348 1646 3218
Calcium (mg) 845 237 828 493 1273 900 246 880 537 1332
Iron (mg) 8.9 2.3 8.8 5.6 13.0 10.6 2.5 10.4 6.8 15.1
Magnesium (mg) 195 42 193 130 271 230 47 227 159 311
Zinc (mg) 7.4 1.9 7.2 4.6 10.8 8.8 2.1 8.6 5.7 12.5
Copper (mg) 0.7 0.2 0.7 0.5 1.1 0.9 0.2 0.9 0.6 1.3
Phosphorus (mg) 1023 234 1011 669 1442 1192 256 1175 805 1636
*All sources including nutritional supplements
TE: Total Energy
Boys 5-8y (n 149) Boys 9-12y (n 151)
Percentiles Percentiles
Table 4.4 Mean, SD, median and percentile values for daily energy, macronutrient, vitamin and mineral intakes for boys, by age group

Mean SD Median 5th 95th Mean SD Median 5th 95th
Macronutrients & Fibre
Energy (MJ) 5.5 0.9 5.5 4.1 7.1 6.2 1.0 6.2 4.7 7.9
Energy (kcal) 1317 220 1306 976 1692 1482 227 1474 1125 1876
Protein (g) 52.1 11.0 51.2 35.9 71.5 57.5 11.5 56.6 40.2 78.0
Total fat (g) 49.7 10.6 48.9 33.6 68.2 55.8 11.1 55.1 38.7 75.4
Saturated fat (g) 21.4 5.1 21.0 13.7 30.2 23.2 5.1 22.9 15.3 32.2
Monounsaturated fat (g) 20.0 4.5 19.6 13.3 27.8 23.1 4.8 22.8 15.8 31.6
Polyunsaturated fat (g) 8.2 2.0 8.0 5.3 11.8 9.1 2.1 8.9 6.0 13.0
Carbohydrate (g) 175.0 32.2 173.2 125.4 230.3 197.9 33.4 196.6 145.7 256.0
Total sugar (g) 67.4 18.1 65.9 40.3 99.2 73.4 18.5 72.2 45.4 106.2
Free sugar (g) 35.3 13.9 33.5 15.8 60.5 40.5 14.8 38.9 19.5 67.5
Dietary fibre (g) 13.1 3.1 12.9 8.5 18.5 13.7 3.1 13.4 9.0 19.1
Protein (% TE) 16.0 2.1 15.8 12.8 19.5 15.7 2.0 15.6 12.7 19.2
Total fat (% TE) 33.4 3.9 33.3 27.1 39.7 33.5 3.7 33.5 27.4 39.7
Saturated fat (% TE) 14.3 2.2 14.3 10.9 18.0 14.0 2.1 13.9 10.6 17.5
Monounsaturated fat (% TE) 13.4 1.8 13.3 10.6 16.3 13.8 1.7 13.8 11.0 16.8
Polyunsaturated fat (% TE) 5.5 1.0 5.4 4.1 7.3 5.5 1.0 5.4 4.1 7.2
Carbohydrate (% TE) 50.0 4.3 50.1 42.8 57.0 50.4 4.2 50.5 43.3 57.2
Total sugar (% TE) 19.2 4.0 19.0 13.0 25.9 18.6 3.8 18.4 12.6 25.2
Free Sugar (% TE) 9.7 3.4 9.3 4.7 15.8 10.0 3.4 9.7 5.0 16.1
Dietary fibre (g/10MJ) 24.0 4.3 23.8 17.4 31.5 22.3 4.0 22.1 16.2 29.3
Vitamins*
Total Vitamin A (µg) 641 298 588 262 1196 623 284 576 259 1157
Retinol (µg) 281 141 258 97 543 256 129 236 88 499
Carotene (µg) 2341 1792 1858 580 5676 2441 1847 1974 629 5872
Vitamin D (µg) 4.6 3.2 3.8 1.0 10.7 3.6 2.6 2.9 0.8 8.6
Vitamin E (mg) 6.7 2.8 6.3 2.9 11.9 6.3 2.6 6.0 2.8 11.2
Thiamin (mg) 1.3 0.4 1.2 0.7 1.9 1.3 0.4 1.3 0.8 2.0
Riboflavin (mg) 1.4 0.5 1.4 0.7 2.4 1.4 0.5 1.4 0.7 2.3
Total Niacin (mg) 25.7 6.0 25.1 16.8 36.3 27.0 6.1 26.6 18.0 38.0
Vitamin B6 (mg) 1.4 0.5 1.3 0.7 2.2 1.4 0.5 1.3 0.7 2.2
Vitamin B12 (µg) 4.3 1.7 4.1 1.9 7.3 4.0 1.6 3.9 1.8 6.9
Total folate (µg) 192 59 186 107 298 196 58 190 111 302
Dietary Folate Equivalents (µg) 232 88 219 112 393 231 86 219 113 389
Biotin (µg) 22.2 9.5 20.6 9.8 39.9 22.2 9.3 20.7 10.0 39.7
Pantothenate (mg) 4.8 1.6 4.5 2.5 7.7 4.9 1.6 4.8 2.7 7.9
Vitamin C (mg) 71 42 62 21 150 73 42 65 23 153
Minerals*
Sodium (mg) 1437 287 1416 1004 1936 1641 305 1624 1175 2178
Potassium (mg) 1791 410 1761 1175 2506 1927 416 1901 1293 2662
Calcium (mg) 716 216 696 399 1099 718 210 701 406 1096
Iron (mg) 8.1 2.1 7.9 5.0 11.9 8.5 2.1 8.3 5.3 12.3
Magnesium (mg) 173 40 170 113 242 184 40 182 123 255
Zinc (mg) 6.6 1.7 6.4 4.1 9.7 6.8 1.7 6.6 4.2 9.9
Copper (mg) 0.7 0.2 0.6 0.4 1.0 0.7 0.2 0.7 0.5 1.1
Phosphorus (mg) 894 217 877 569 1273 947 218 933 616 1333
*All sources including nutritional supplements
TE: Total Energy
Girls 5-8y (n 151) Girls 9-12y (n 149)
Percentiles Percentiles
Table 4.5 Mean, SD, median and percentile values for daily energy, macronutrient, vitamin and mineral intakes for girls, by age group

Total 5-12y Boys 5-12y Girls 5-12y Total 5-8y Total 9-12y Boys 5-8y Girls 5-8y Boys 9-12y Girls 9-12y
n 600 n 300 n 300 n 300 n 300 n 149 n 151 n 151 n 149
All sources*
Mean 666 702 632 659 673 678 641 728 623
SD 307 319 291 303 310 308 298 329 284
Median 613 649 582 607 619 629 588 673 576
5th percentile 274 292 260 270 278 281 262 309 259
95th percentile 1243 1301 1174 1231 1257 1273 1196 1336 1157
97.5th percentile 1413 1476 1339 1408 1423 1436 1373 1521 1313
Food sources
Mean 602 630 577 586 619 591 582 672 572
SD 247 257 235 240 254 240 239 269 230
Median 563 590 540 549 578 556 543 631 537
5th percentile 278 290 268 271 288 274 268 320 268
95th percentile 1066 1112 1012 1036 1093 1050 1025 1165 1002
97.5th percentile 1194 1238 1141 1168 1222 1174 1162 1311 1123
*including nutritional supplements
Table 4.6 Mean, SD, median and percentile values for daily total vitamin A (µg) intakes from all sources and food sources for the total population and by gender and age group
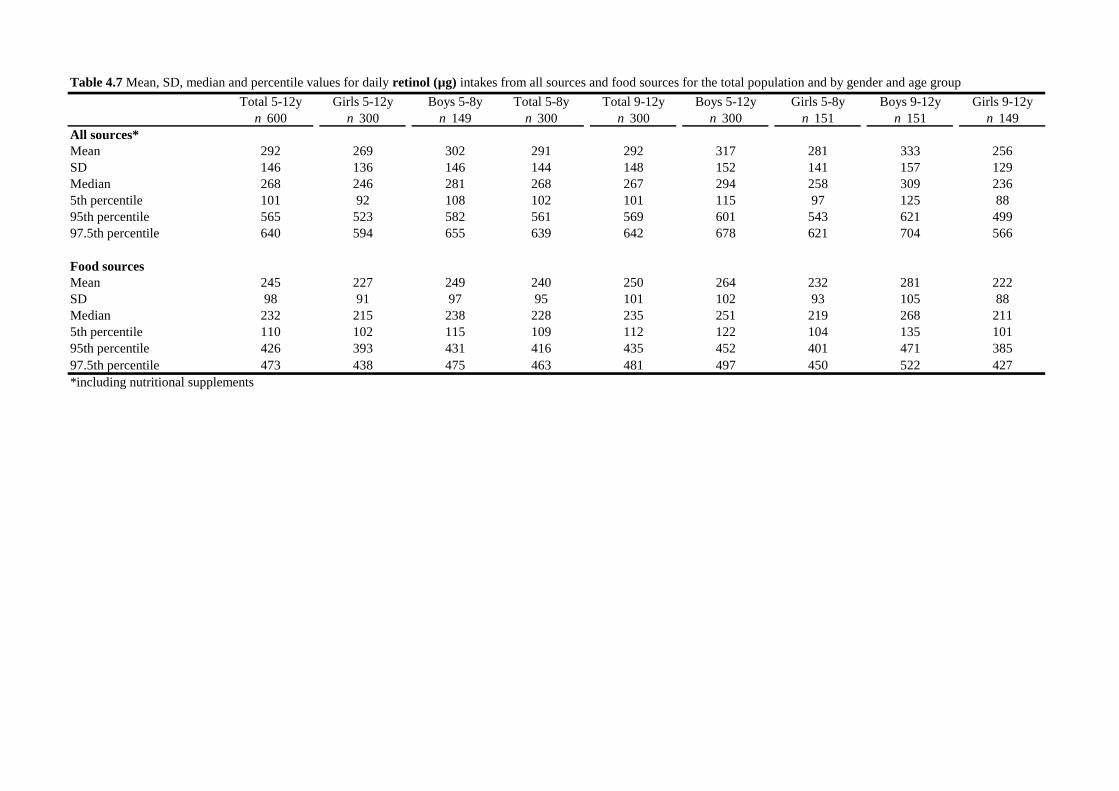
Total 5-12y Girls 5-12y Boys 5-8y Total 5-8y Total 9-12y Boys 5-12y Girls 5-8y Boys 9-12y Girls 9-12y
n 600 n 300 n 149 n 300 n 300 n 300 n 151 n 151 n 149
All sources*
Mean 292 269 302 291 292 317 281 333 256
SD 146 136 146 144 148 152 141 157 129
Median 268 246 281 268 267 294 258 309 236
5th percentile 101 92 108 102 101 115 97 125 88
95th percentile 565 523 582 561 569 601 543 621 499
97.5th percentile 640 594 655 639 642 678 621 704 566
Food sources
Mean 245 227 249 240 250 264 232 281 222
SD 98 91 97 95 101 102 93 105 88
Median 232 215 238 228 235 251 219 268 211
5th percentile 110 102 115 109 112 122 104 135 101
95th percentile 426 393 431 416 435 452 401 471 385
97.5th percentile 473 438 475 463 481 497 450 522 427
*including nutritional supplements
Table 4.7 Mean, SD, median and percentile values for daily retinol (µg) intakes from all sources and food sources for the total population and by gender and age group
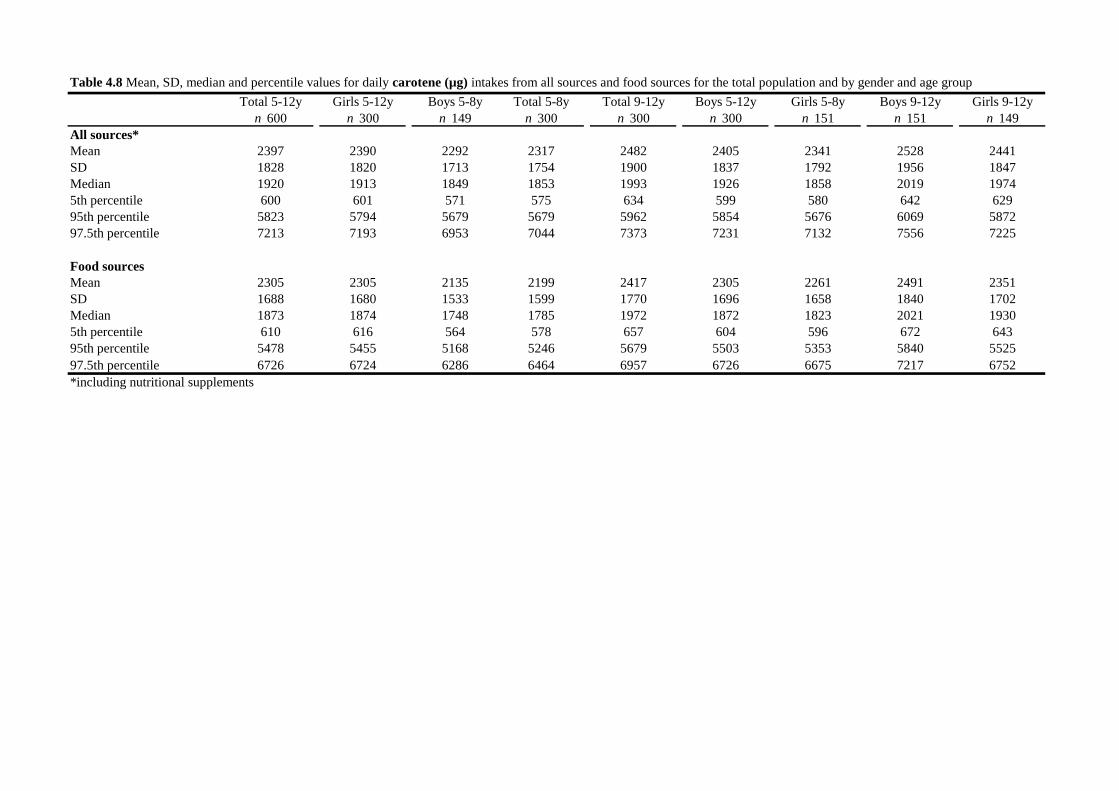
Total 5-12y Girls 5-12y Boys 5-8y Total 5-8y Total 9-12y Boys 5-12y Girls 5-8y Boys 9-12y Girls 9-12y
n 600 n 300 n 149 n 300 n 300 n 300 n 151 n 151 n 149
All sources*
Mean 2397 2390 2292 2317 2482 2405 2341 2528 2441
SD 1828 1820 1713 1754 1900 1837 1792 1956 1847
Median 1920 1913 1849 1853 1993 1926 1858 2019 1974
5th percentile 600 601 571 575 634 599 580 642 629
95th percentile 5823 5794 5679 5679 5962 5854 5676 6069 5872
97.5th percentile 7213 7193 6953 7044 7373 7231 7132 7556 7225
Food sources
Mean 2305 2305 2135 2199 2417 2305 2261 2491 2351
SD 1688 1680 1533 1599 1770 1696 1658 1840 1702
Median 1873 1874 1748 1785 1972 1872 1823 2021 1930
5th percentile 610 616 564 578 657 604 596 672 643
95th percentile 5478 5455 5168 5246 5679 5503 5353 5840 5525
97.5th percentile 6726 6724 6286 6464 6957 6726 6675 7217 6752
*including nutritional supplements
Table 4.8 Mean, SD, median and percentile values for daily carotene (µg) intakes from all sources and food sources for the total population and by gender and age group

Total 5-12y Girls 5-12y Boys 5-8y Total 5-8y Total 9-12y Boys 5-12y Girls 5-8y Boys 9-12y Girls 9-12y
n 600 n 300 n 149 n 300 n 300 n 300 n 151 n 151 n 149
All sources*
Mean 4.2 4.1 4.3 4.4 4.1 4.4 4.6 4.6 3.6
SD 3.1 3.0 3.0 3.1 3.0 3.1 3.2 3.2 2.6
Median 3.5 3.3 3.6 3.7 3.3 3.7 3.8 3.8 2.9
5th percentile 0.9 0.9 0.9 1.0 0.9 3.7 1.0 1.1 0.8
95th percentile 10.1 9.8 10.3 10.5 9.8 10.5 10.7 10.7 8.6
97.5th percentile 12.1 11.7 12.3 12.6 11.6 12.6 13.0 12.9 10.3
Food sources
Mean 3.3 3.1 3.3 3.3 3.3 3.5 3.4 3.8 2.8
SD 1.9 1.8 1.9 1.9 2.0 2.0 2.0 2.1 1.7
Median 2.9 2.7 2.9 2.9 2.8 3.1 3.0 3.3 2.5
5th percentile 1.0 0.9 1.0 1.0 1.0 1.1 1.0 1.2 0.8
95th percentile 7.0 6.6 7.0 7.1 7.0 7.4 7.1 7.8 6.0
97.5th percentile 8.2 7.7 8.1 8.3 8.1 8.6 8.4 9.1 7.0
*including nutritional supplements
Table 4.9 Mean, SD, median and percentile values for daily vitamin D (µg) intakes from all sources and food sources for the total population and by gender and age group

Total 5-12y Girls 5-12y Boys 5-8y Total 5-8y Total 9-12y Boys 5-12y Girls 5-8y Boys 9-12y Girls 9-12y
n 600 n 300 n 149 n 300 n 300 n 300 n 151 n 151 n 149
All sources*
Mean 6.9 6.5 6.6 6.7 7.2 7.3 6.7 8.1 6.3
SD 2.9 2.7 2.8 2.8 3.0 3.1 2.8 3.2 2.6
Median 6.5 6.1 6.3 6.3 6.7 6.9 6.3 7.6 6.0
5th percentile 3.0 2.9 2.9 2.9 3.1 3.2 2.9 3.8 2.8
95th percentile 12.4 11.6 11.9 11.9 12.8 13.0 11.9 13.9 11.2
97.5th percentile 13.8 12.9 13.2 13.3 14.3 14.5 13.4 15.6 12.5
Food sources
Mean 5.9 5.6 5.6 5.5 6.3 6.3 5.5 7.0 5.7
SD 1.9 1.8 1.8 1.8 2.0 2.1 1.8 2.1 1.7
Median 5.6 5.4 5.4 5.3 6.0 6.0 5.3 6.8 5.5
5th percentile 3.2 3.1 3.1 3.1 3.5 3.4 3.0 4.1 3.2
95th percentile 9.5 8.8 8.9 8.8 10.1 10.0 8.7 10.8 8.9
97.5th percentile 10.4 9.6 9.7 9.6 11.0 10.9 9.6 11.8 9.7
*including nutritional supplements
Table 4.10 Mean, SD, median and percentile values for daily vitamin E (mg) intakes from all sources and food sources for the total population and by gender and age group

Total 5-12y Girls 5-12y Boys 5-8y Total 5-8y Total 9-12y Boys 5-12y Girls 5-8y Boys 9-12y Girls 9-12y
n 600 n 300 n 149 n 300 n 300 n 300 n 151 n 151 n 149
All sources*
Mean 1.4 1.3 1.4 1.3 1.5 1.5 1.3 1.7 1.3
SD 0.4 0.4 0.4 0.4 0.4 0.4 0.4 0.4 0.4
Median 1.4 1.3 1.4 1.3 1.4 1.5 1.2 1.6 1.3
5th percentile 0.8 0.8 0.9 0.8 0.9 0.9 0.7 1.0 0.8
95th percentile 2.2 2.0 2.2 2.0 2.3 2.3 1.9 2.5 2.0
97.5th percentile 2.4 2.1 2.3 2.2 2.5 2.5 2.1 2.7 2.2
Food sources
Mean 1.3 1.2 1.3 1.3 1.4 1.4 1.2 1.5 1.3
SD 0.3 0.3 0.3 0.3 0.4 0.4 0.3 0.4 0.3
Median 1.3 1.2 1.3 1.2 1.4 1.4 1.2 1.5 1.2
5th percentile 0.8 0.8 0.9 0.8 0.9 0.9 0.8 1.0 0.8
95th percentile 2.0 1.8 1.9 1.8 2.0 2.1 1.7 2.2 1.8
97.5th percentile 2.1 1.9 2.0 2.0 2.2 2.2 1.9 2.3 1.9
*including nutritional supplements
Table 4.11 Mean, SD, median and percentile values for daily thiamin (mg) intakes from all sources and food sources for the total population and by gender and age group

Total 5-12y Girls 5-12y Boys 5-8y Total 5-8y Total 9-12y Boys 5-12y Girls 5-8y Boys 9-12y Girls 9-12y
n 600 n 300 n 149 n 300 n 300 n 300 n 151 n 151 n 149
All sources*
Mean 1.6 1.4 1.7 1.6 1.6 1.8 1.4 1.9 1.4
SD 0.6 0.5 0.6 0.6 0.6 0.6 0.5 0.6 0.5
Median 1.5 1.4 1.7 1.5 1.6 1.7 1.4 1.8 1.4
5th percentile 0.8 0.7 0.9 0.7 0.8 0.9 0.7 1.0 0.7
95th percentile 2.6 2.4 2.7 2.6 2.7 2.8 2.4 2.9 2.3
97.5th percentile 2.9 2.6 3.0 2.8 3.0 3.1 2.6 3.2 2.5
Food sources
Mean 1.5 1.4 1.6 1.5 1.5 1.7 1.4 1.7 1.4
SD 0.5 0.4 0.5 0.5 0.5 0.5 0.5 0.5 0.4
Median 1.5 1.3 1.6 1.4 1.5 1.6 1.3 1.7 1.3
5th percentile 0.8 0.7 0.9 0.8 0.8 0.9 0.7 1.0 0.7
95th percentile 2.4 2.2 2.5 2.4 2.5 2.6 2.2 2.6 2.1
97.5th percentile 2.6 2.4 2.7 2.6 2.7 2.8 2.4 2.9 2.3
*including nutritional supplements
Table 4.12 Mean, SD, median and percentile values for daily riboflavin (mg) intakes from all sources and food sources for the total population and by gender and age group
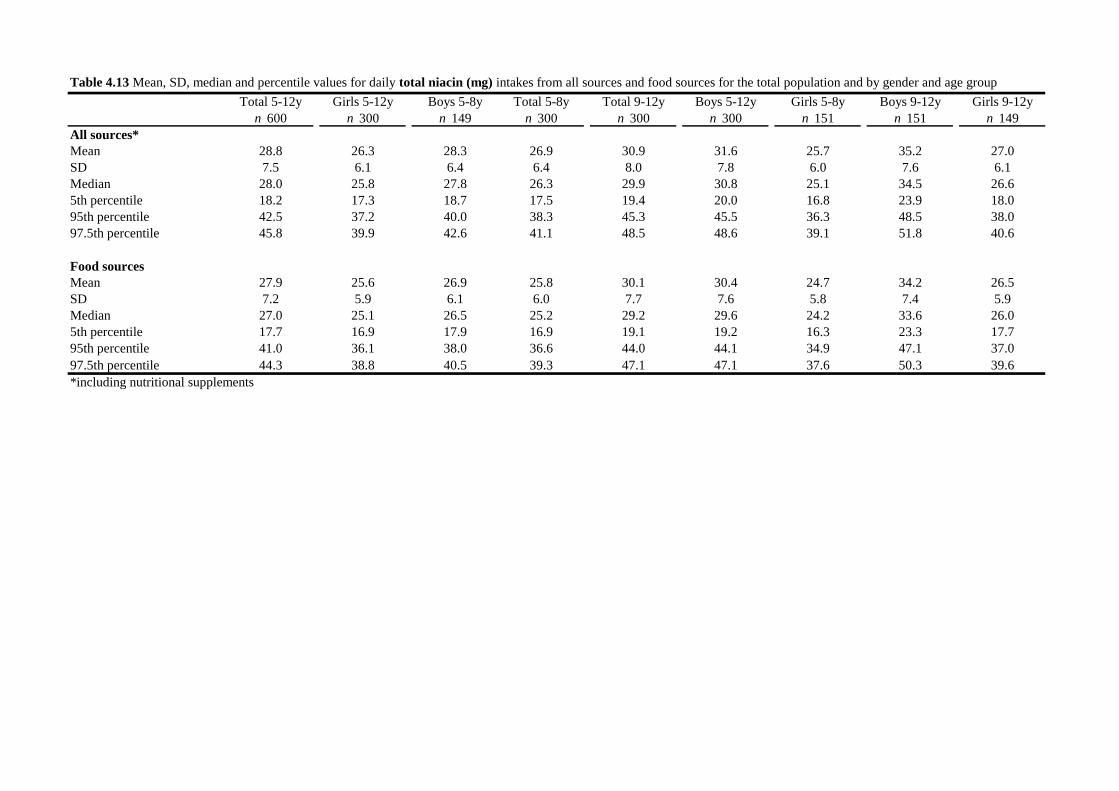
Total 5-12y Girls 5-12y Boys 5-8y Total 5-8y Total 9-12y Boys 5-12y Girls 5-8y Boys 9-12y Girls 9-12y
n 600 n 300 n 149 n 300 n 300 n 300 n 151 n 151 n 149
All sources*
Mean 28.8 26.3 28.3 26.9 30.9 31.6 25.7 35.2 27.0
SD 7.5 6.1 6.4 6.4 8.0 7.8 6.0 7.6 6.1
Median 28.0 25.8 27.8 26.3 29.9 30.8 25.1 34.5 26.6
5th percentile 18.2 17.3 18.7 17.5 19.4 20.0 16.8 23.9 18.0
95th percentile 42.5 37.2 40.0 38.3 45.3 45.5 36.3 48.5 38.0
97.5th percentile 45.8 39.9 42.6 41.1 48.5 48.6 39.1 51.8 40.6
Food sources
Mean 27.9 25.6 26.9 25.8 30.1 30.4 24.7 34.2 26.5
SD 7.2 5.9 6.1 6.0 7.7 7.6 5.8 7.4 5.9
Median 27.0 25.1 26.5 25.2 29.2 29.6 24.2 33.6 26.0
5th percentile 17.7 16.9 17.9 16.9 19.1 19.2 16.3 23.3 17.7
95th percentile 41.0 36.1 38.0 36.6 44.0 44.1 34.9 47.1 37.0
97.5th percentile 44.3 38.8 40.5 39.3 47.1 47.1 37.6 50.3 39.6
*including nutritional supplements
Table 4.13 Mean, SD, median and percentile values for daily total niacin (mg) intakes from all sources and food sources for the total population and by gender and age group

Total 5-12y Girls 5-12y Boys 5-8y Total 5-8y Total 9-12y Boys 5-12y Girls 5-8y Boys 9-12y Girls 9-12y
n 600 n 300 n 149 n 300 n 300 n 300 n 151 n 151 n 149
All sources*
Mean 1.5 1.4 1.5 1.5 1.6 1.7 1.4 1.8 1.4
SD 0.5 0.5 0.5 0.5 0.6 0.6 0.5 0.6 0.5
Median 1.4 1.3 1.5 1.4 1.5 1.6 1.3 1.7 1.3
5th percentile 0.8 0.7 0.8 0.7 0.8 0.9 0.7 1.0 0.7
95th percentile 2.5 2.2 2.5 2.4 2.6 2.7 2.2 2.8 2.2
97.5th percentile 2.7 2.5 2.8 2.6 2.8 2.9 2.5 3.1 2.5
Food sources
Mean 1.3 1.2 1.3 1.3 1.4 1.5 1.2 1.6 1.3
SD 0.4 0.3 0.3 0.3 0.4 0.4 0.3 0.4 0.3
Median 1.3 1.2 1.3 1.2 1.4 1.4 1.2 1.6 1.3
5th percentile 0.8 0.8 0.9 0.8 0.9 0.9 0.8 1.0 0.8
95th percentile 2.0 1.8 1.9 1.8 2.1 2.1 1.7 2.2 1.8
97.5th percentile 2.1 1.9 2.1 2.0 2.2 2.2 1.9 2.4 2.0
*including nutritional supplements
Table 4.14 Mean, SD, median and percentile values for daily vitamin B6 (mg) intakes from all sources and food sources for the total population and by gender and age group

Total 5-12y Girls 5-12y Boys 5-8y Total 5-8y Total 9-12y Boys 5-12y Girls 5-8y Boys 9-12y Girls 9-12y
n 600 n 300 n 149 n 300 n 300 n 300 n 151 n 151 n 149
All sources*
Mean 4.6 4.2 4.9 4.6 4.7 5.1 4.3 5.4 4.0
SD 1.8 1.6 1.8 1.8 1.9 1.9 1.7 1.9 1.6
Median 4.4 4.0 4.7 4.4 4.4 4.9 4.1 5.2 3.9
5th percentile 2.1 1.8 2.3 2.1 2.1 2.4 1.9 2.7 1.8
95th percentile 8.0 7.1 8.3 7.8 8.1 8.6 7.3 8.8 6.9
97.5th percentile 8.8 7.9 9.1 8.7 8.9 9.4 8.1 9.7 7.7
Food sources
Mean 4.4 3.9 4.6 4.3 4.4 4.8 4.0 5.1 3.8
SD 1.6 1.4 1.5 1.5 1.6 1.6 1.4 1.6 1.4
Median 4.2 3.8 4.5 4.1 4.2 4.7 3.8 5.0 3.7
5th percentile 2.1 1.9 2.3 2.1 2.1 2.5 1.9 2.7 1.8
95th percentile 7.2 6.4 7.4 7.0 7.4 7.7 6.6 8.0 6.3
97.5th percentile 7.9 7.0 8.0 7.7 8.1 8.4 7.2 8.8 6.9
*including nutritional supplements
Table 4.15 Mean, SD, median and percentile values for daily vitamin B12 (µg) intakes from all sources and food sources for the total population and by gender and age group

Total 5-12y Girls 5-12y Boys 5-8y Total 5-8y Total 9-12y Boys 5-12y Girls 5-8y Boys 9-12y Girls 9-12y
n 600 n 300 n 149 n 300 n 300 n 300 n 151 n 151 n 149
All sources*
Mean 211 194 220 205 216 229 192 239 196
SD 65 59 65 63 67 67 59 68 58
Median 204 188 214 199 208 222 186 232 190
5th percentile 117 109 126 114 120 131 107 140 111
95th percentile 330 300 338 321 337 349 298 360 302
97.5th percentile 358 327 365 349 365 378 327 391 328
Food sources
Mean 201 186 209 196 206 217 183 225 189
SD 57 52 57 56 59 59 52 60 52
Median 195 181 204 190 199 211 178 219 184
5th percentile 118 110 126 115 122 130 108 138 113
95th percentile 305 279 312 297 311 322 276 331 282
97.5th percentile 329 304 336 321 336 347 301 358 305
*including nutritional supplements
Table 4.16 Mean, SD, median and percentile values for daily total folate (µg) intakes from all sources and food sources for the total population and by gender and age group

Total 5-12y Girls 5-12y Boys 5-8y Total 5-8y Total 9-12y Boys 5-12y Girls 5-8y Boys 9-12y Girls 9-12y
n 600 n 300 n 149 n 300 n 300 n 300 n 151 n 151 n 149
All sources*
Mean 253 231 264 248 258 276 232 288 231
SD 97 87 97 94 99 101 88 104 86
Median 238 219 253 234 243 263 219 274 219
5th percentile 122 113 131 119 124 137 112 146 113
95th percentile 432 391 447 422 441 462 393 477 389
97.5th percentile 479 436 494 471 488 511 441 530 432
Food sources
Mean 236 218 246 231 241 255 217 265 219
SD 82 74 82 80 83 85 75 87 73
Median 225 208 237 221 229 245 207 254 210
5th percentile 124 116 133 122 127 137 114 145 117
95th percentile 387 353 400 378 394 412 353 423 353
97.5th percentile 426 391 438 419 433 452 392 467 389
*including nutritional supplements
Table 4.17 Mean, SD, median and percentile values for daily dietary folate equivalents (µg) intakes from all sources and food sources for the total population and by gender and age
group

Total 5-12y Girls 5-12y Boys 5-8y Total 5-8y Total 9-12y Boys 5-12y Girls 5-8y Boys 9-12y Girls 9-12y
n 600 n 300 n 149 n 300 n 300 n 300 n 151 n 151 n 149
All sources*
Mean 25.3 22.2 26.7 24.4 26.3 28.7 22.2 30.8 22.2
SD 11.2 9.4 11.0 10.5 11.7 11.9 9.5 12.5 9.3
Median 23.3 20.7 25.1 22.5 24.2 26.8 20.6 28.9 20.7
5th percentile 10.9 9.9 12.2 10.7 11.3 13.0 9.8 14.5 10.0
95th percentile 46.4 39.8 47.7 44.2 48.4 51.0 39.9 53.7 39.7
97.5th percentile 52.3 45.1 53.4 50.0 54.4 56.7 45.4 60.5 44.7
Food sources
Mean 22.2 19.9 23.2 21.3 23.1 24.7 19.5 26.2 20.2
SD 6.8 5.7 6.5 6.4 7.1 6.9 5.7 7.1 5.7
Median 21.3 19.3 22.7 20.6 22.1 23.9 18.9 25.5 19.7
5th percentile 12.5 11.6 13.9 12.2 13.1 14.6 11.3 16.0 11.9
95th percentile 34.6 30.3 35.2 33.0 35.9 37.2 29.8 38.8 30.6
97.5th percentile 37.6 33.0 38.0 35.9 39.0 40.0 32.6 42.1 33.2
*including nutritional supplements
Table 4.18 Mean, SD, median and percentile values for daily biotin (µg) intakes from all sources and food sources for the total population and by gender and age group
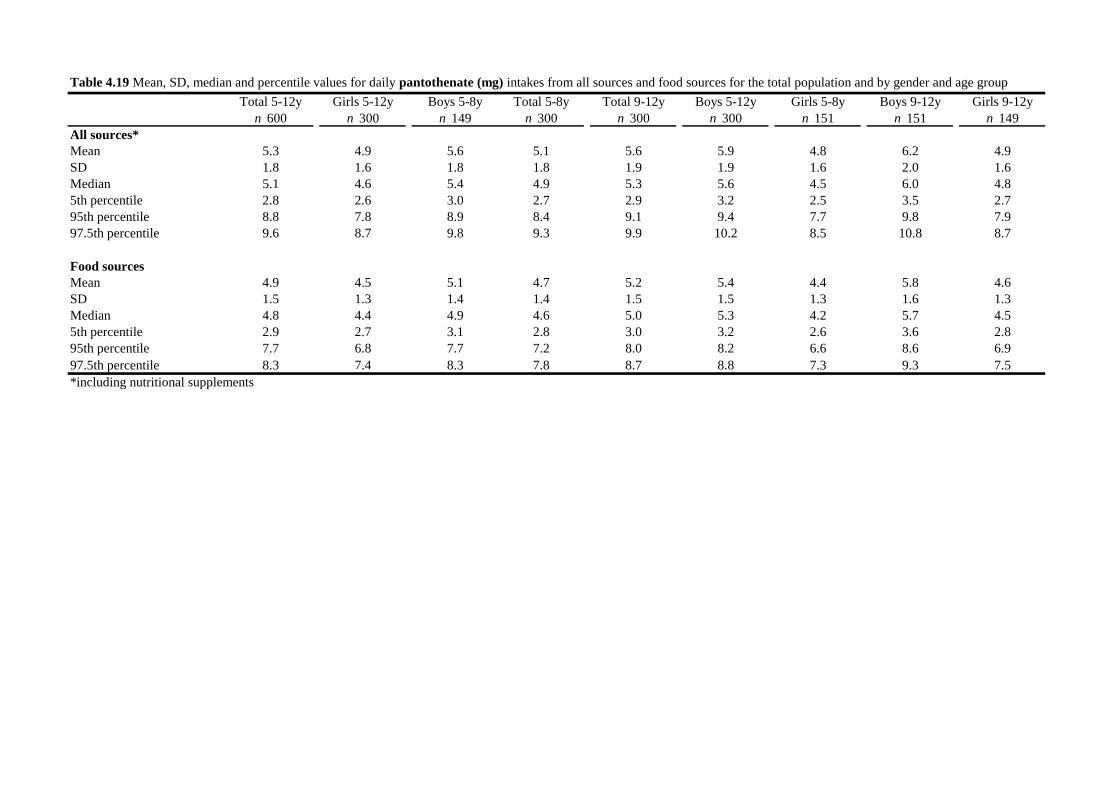
Total 5-12y Girls 5-12y Boys 5-8y Total 5-8y Total 9-12y Boys 5-12y Girls 5-8y Boys 9-12y Girls 9-12y
n 600 n 300 n 149 n 300 n 300 n 300 n 151 n 151 n 149
All sources*
Mean 5.3 4.9 5.6 5.1 5.6 5.9 4.8 6.2 4.9
SD 1.8 1.6 1.8 1.8 1.9 1.9 1.6 2.0 1.6
Median 5.1 4.6 5.4 4.9 5.3 5.6 4.5 6.0 4.8
5th percentile 2.8 2.6 3.0 2.7 2.9 3.2 2.5 3.5 2.7
95th percentile 8.8 7.8 8.9 8.4 9.1 9.4 7.7 9.8 7.9
97.5th percentile 9.6 8.7 9.8 9.3 9.9 10.2 8.5 10.8 8.7
Food sources
Mean 4.9 4.5 5.1 4.7 5.2 5.4 4.4 5.8 4.6
SD 1.5 1.3 1.4 1.4 1.5 1.5 1.3 1.6 1.3
Median 4.8 4.4 4.9 4.6 5.0 5.3 4.2 5.7 4.5
5th percentile 2.9 2.7 3.1 2.8 3.0 3.2 2.6 3.6 2.8
95th percentile 7.7 6.8 7.7 7.2 8.0 8.2 6.6 8.6 6.9
97.5th percentile 8.3 7.4 8.3 7.8 8.7 8.8 7.3 9.3 7.5
*including nutritional supplements
Table 4.19 Mean, SD, median and percentile values for daily pantothenate (mg) intakes from all sources and food sources for the total population and by gender and age group

Total 5-12y Girls 5-12y Boys 5-8y Total 5-8y Total 9-12y Boys 5-12y Girls 5-8y Boys 9-12y Girls 9-12y
n 600 n 300 n 149 n 300 n 300 n 300 n 151 n 151 n 149
All sources*
Mean 73 72 74 73 74 74 71 74 73
SD 42 42 43 42 42 43 42 43 42
Median 65 64 66 64 65 66 62 65 65
5th percentile 22 22 22 22 22 22 21 22 23
95th percentile 154 152 158 154 154 156 150 154 153
97.5th percentile 180 177 183 180 179 181 177 180 178
Food sources
Mean 61 61 62 60 62 61 59 60 63
SD 29 29 29 29 29 29 29 29 29
Median 56 56 57 55 57 56 54 55 59
5th percentile 23 23 24 23 24 23 22 23 25
95th percentile 116 116 118 115 116 116 112 114 118
97.5th percentile 132 132 134 131 132 132 128 130 134
*including nutritional supplements
Table 4.20 Mean, SD, median and percentile values for daily vitamin C (mg) intakes from all sources and food sources for the total population and by gender and age group

Total 5-12y Girls 5-12y Boys 5-8y Total 5-8y Total 9-12y Boys 5-12y Girls 5-8y Boys 9-12y Girls 9-12y
n 600 n 300 n 149 n 300 n 300 n 300 n 151 n 151 n 149
All sources*
Mean 2019 1858 2027 1906 2141 2195 1791 2379 1927
SD 486 418 439 440 504 494 410 485 416
Median 1980 1830 2004 1873 2095 2161 1761 2348 1901
5th percentile 1296 1222 1361 1243 1391 1445 1175 1646 1293
95th percentile 2891 2596 2812 2689 3035 3060 2506 3218 2662
97.5th percentile 3079 2773 2981 2862 3225 3242 2684 3418 2829
Food sources
Mean 2019 1858 2027 1906 2140 2195 1791 2378 1927
SD 486 418 439 440 503 494 409 485 416
Median 1980 1830 2004 1873 2095 2160 1761 2348 1901
5th percentile 1296 1222 1361 1243 1391 1445 1175 1646 1293
95th percentile 2890 2596 2812 2689 3033 3060 2506 3217 2662
97.5th percentile 3078 2773 2981 2862 3224 3240 2684 3416 2829
*including nutritional supplements
Table 4.21 Mean, SD, median and percentile values for daily potassium (mg) intakes from all sources and food sources for the total population and by gender and age group
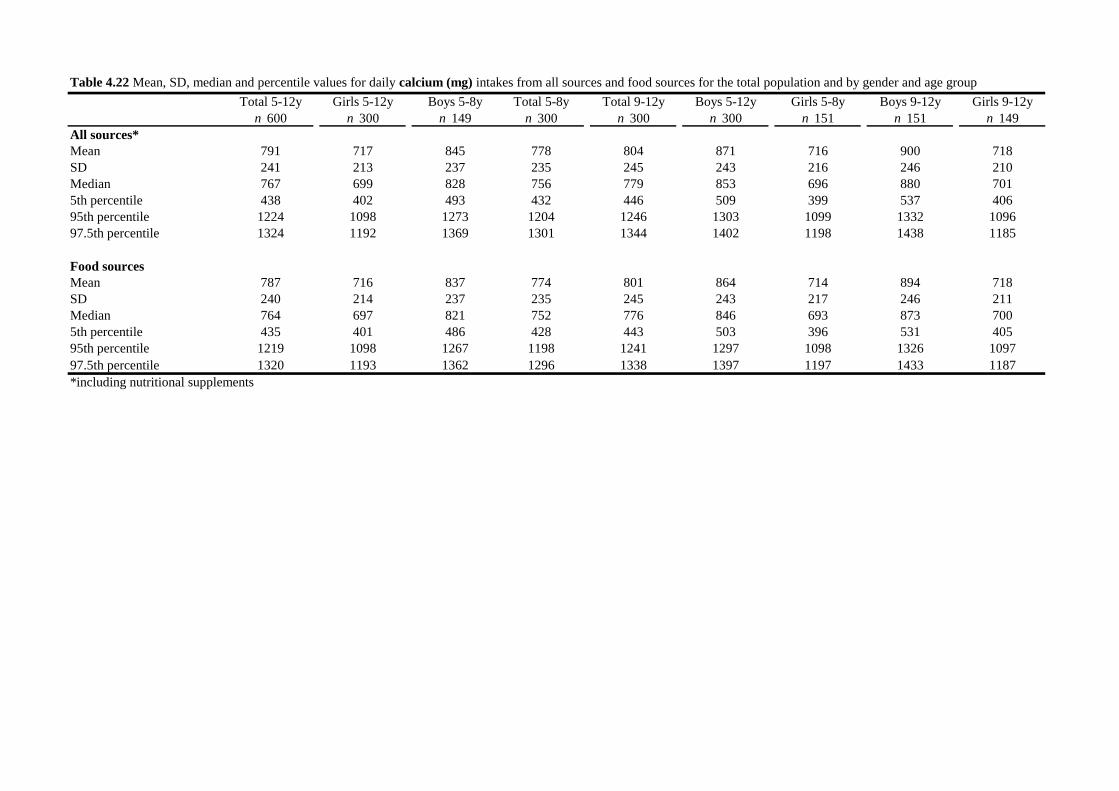
Total 5-12y Girls 5-12y Boys 5-8y Total 5-8y Total 9-12y Boys 5-12y Girls 5-8y Boys 9-12y Girls 9-12y
n 600 n 300 n 149 n 300 n 300 n 300 n 151 n 151 n 149
All sources*
Mean 791 717 845 778 804 871 716 900 718
SD 241 213 237 235 245 243 216 246 210
Median 767 699 828 756 779 853 696 880 701
5th percentile 438 402 493 432 446 509 399 537 406
95th percentile 1224 1098 1273 1204 1246 1303 1099 1332 1096
97.5th percentile 1324 1192 1369 1301 1344 1402 1198 1438 1185
Food sources
Mean 787 716 837 774 801 864 714 894 718
SD 240 214 237 235 245 243 217 246 211
Median 764 697 821 752 776 846 693 873 700
5th percentile 435 401 486 428 443 503 396 531 405
95th percentile 1219 1098 1267 1198 1241 1297 1098 1326 1097
97.5th percentile 1320 1193 1362 1296 1338 1397 1197 1433 1187
*including nutritional supplements
Table 4.22 Mean, SD, median and percentile values for daily calcium (mg) intakes from all sources and food sources for the total population and by gender and age group
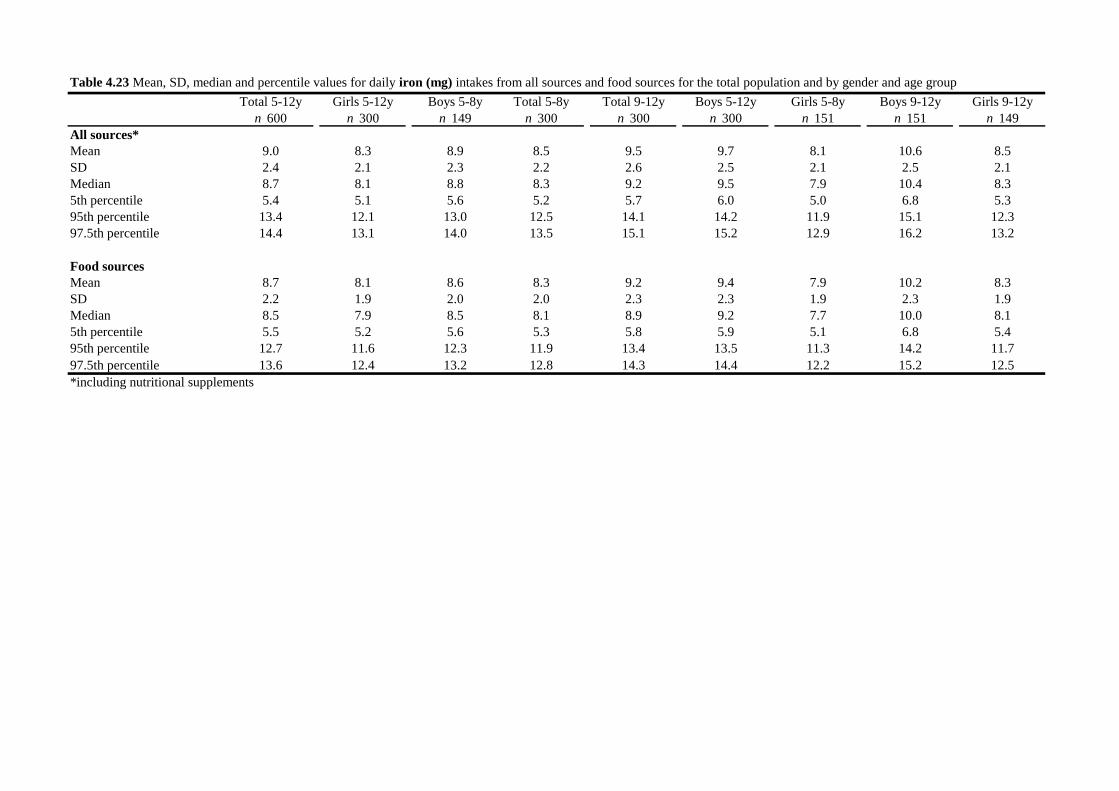
Total 5-12y Girls 5-12y Boys 5-8y Total 5-8y Total 9-12y Boys 5-12y Girls 5-8y Boys 9-12y Girls 9-12y
n 600 n 300 n 149 n 300 n 300 n 300 n 151 n 151 n 149
All sources*
Mean 9.0 8.3 8.9 8.5 9.5 9.7 8.1 10.6 8.5
SD 2.4 2.1 2.3 2.2 2.6 2.5 2.1 2.5 2.1
Median 8.7 8.1 8.8 8.3 9.2 9.5 7.9 10.4 8.3
5th percentile 5.4 5.1 5.6 5.2 5.7 6.0 5.0 6.8 5.3
95th percentile 13.4 12.1 13.0 12.5 14.1 14.2 11.9 15.1 12.3
97.5th percentile 14.4 13.1 14.0 13.5 15.1 15.2 12.9 16.2 13.2
Food sources
Mean 8.7 8.1 8.6 8.3 9.2 9.4 7.9 10.2 8.3
SD 2.2 1.9 2.0 2.0 2.3 2.3 1.9 2.3 1.9
Median 8.5 7.9 8.5 8.1 8.9 9.2 7.7 10.0 8.1
5th percentile 5.5 5.2 5.6 5.3 5.8 5.9 5.1 6.8 5.4
95th percentile 12.7 11.6 12.3 11.9 13.4 13.5 11.3 14.2 11.7
97.5th percentile 13.6 12.4 13.2 12.8 14.3 14.4 12.2 15.2 12.5
*including nutritional supplements
Table 4.23 Mean, SD, median and percentile values for daily iron (mg) intakes from all sources and food sources for the total population and by gender and age group

Total 5-12y Girls 5-12y Boys 5-8y Total 5-8y Total 9-12y Boys 5-12y Girls 5-8y Boys 9-12y Girls 9-12y
n 600 n 300 n 149 n 300 n 300 n 300 n 151 n 151 n 149
All sources*
Mean 194 178 195 183 206 211 173 230 184
SD 47 40 42 43 49 48 40 47 40
Median 190 176 193 180 201 208 170 227 182
5th percentile 124 117 130 119 133 139 113 159 123
95th percentile 279 249 271 259 293 296 242 311 255
97.5th percentile 297 267 287 276 312 313 259 330 271
Food sources
Mean 193 178 192 182 205 209 172 228 184
SD 46 40 42 42 48 47 39 46 40
Median 189 175 190 179 200 206 169 225 182
5th percentile 124 117 129 119 133 138 113 158 124
95th percentile 276 248 267 256 290 292 240 308 254
97.5th percentile 294 265 283 272 308 310 257 327 270
*including nutritional supplements
Table 4.24 Mean, SD, median and percentile values for daily magnesium (mg) intakes from all sources and food sources for the total population and by gender and age group
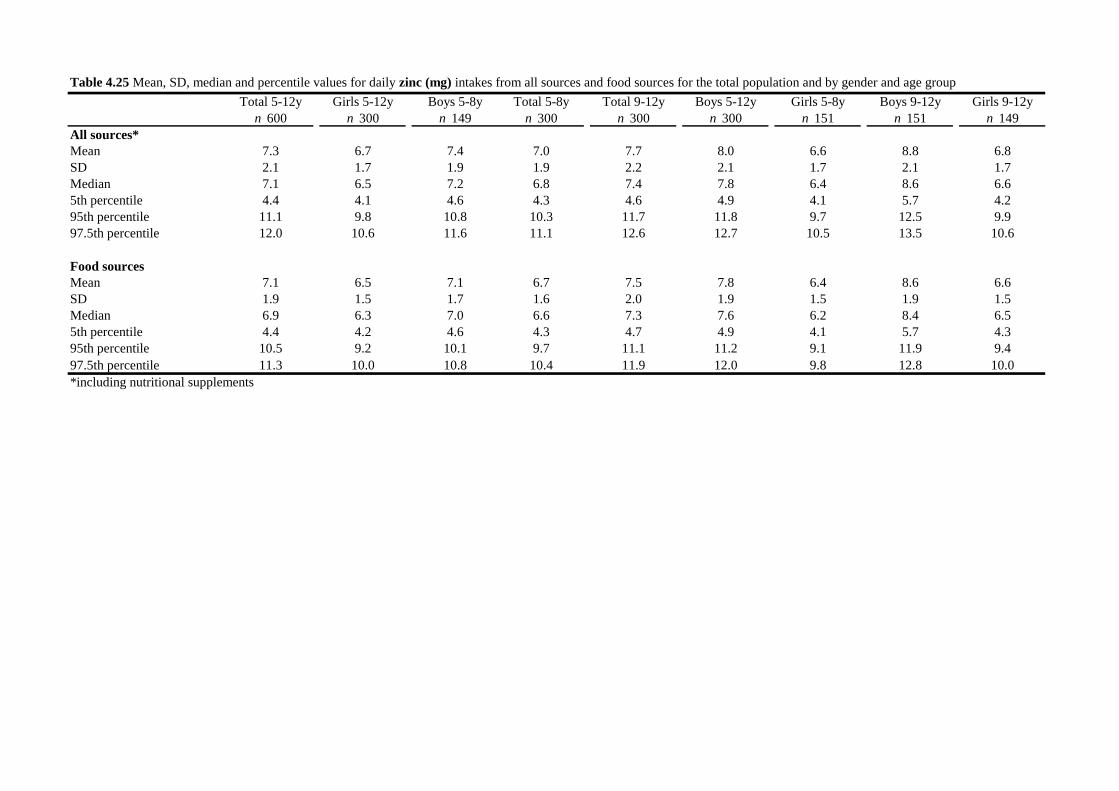
Total 5-12y Girls 5-12y Boys 5-8y Total 5-8y Total 9-12y Boys 5-12y Girls 5-8y Boys 9-12y Girls 9-12y
n 600 n 300 n 149 n 300 n 300 n 300 n 151 n 151 n 149
All sources*
Mean 7.3 6.7 7.4 7.0 7.7 8.0 6.6 8.8 6.8
SD 2.1 1.7 1.9 1.9 2.2 2.1 1.7 2.1 1.7
Median 7.1 6.5 7.2 6.8 7.4 7.8 6.4 8.6 6.6
5th percentile 4.4 4.1 4.6 4.3 4.6 4.9 4.1 5.7 4.2
95th percentile 11.1 9.8 10.8 10.3 11.7 11.8 9.7 12.5 9.9
97.5th percentile 12.0 10.6 11.6 11.1 12.6 12.7 10.5 13.5 10.6
Food sources
Mean 7.1 6.5 7.1 6.7 7.5 7.8 6.4 8.6 6.6
SD 1.9 1.5 1.7 1.6 2.0 1.9 1.5 1.9 1.5
Median 6.9 6.3 7.0 6.6 7.3 7.6 6.2 8.4 6.5
5th percentile 4.4 4.2 4.6 4.3 4.7 4.9 4.1 5.7 4.3
95th percentile 10.5 9.2 10.1 9.7 11.1 11.2 9.1 11.9 9.4
97.5th percentile 11.3 10.0 10.8 10.4 11.9 12.0 9.8 12.8 10.0
*including nutritional supplements
Table 4.25 Mean, SD, median and percentile values for daily zinc (mg) intakes from all sources and food sources for the total population and by gender and age group

Total 5-12y Girls 5-12y Boys 5-8y Total 5-8y Total 9-12y Boys 5-12y Girls 5-8y Boys 9-12y Girls 9-12y
n 600 n 300 n 149 n 300 n 300 n 300 n 151 n 151 n 149
All sources*
Mean 0.8 0.7 0.7 0.7 0.8 0.8 0.7 0.9 0.7
SD 0.2 0.2 0.2 0.2 0.2 0.2 0.2 0.2 0.2
Median 0.7 0.7 0.7 0.7 0.8 0.8 0.6 0.9 0.7
5th percentile 0.5 0.4 0.5 0.4 0.5 0.5 0.4 0.6 0.5
95th percentile 1.1 1.0 1.1 1.0 1.2 1.2 1.0 1.3 1.1
97.5th percentile 1.2 1.1 1.1 1.1 1.3 1.3 1.0 1.4 1.1
Food sources
Mean 0.7 0.7 0.7 0.7 0.8 0.8 0.7 0.9 0.7
SD 0.2 0.2 0.2 0.2 0.2 0.2 0.2 0.2 0.2
Median 0.7 0.7 0.7 0.7 0.8 0.8 0.6 0.8 0.7
5th percentile 0.5 0.5 0.5 0.5 0.5 0.5 0.4 0.6 0.5
95th percentile 1.1 1.0 1.0 1.0 1.1 1.1 0.9 1.2 1.0
97.5th percentile 1.2 1.1 1.1 1.0 1.2 1.2 1.0 1.3 1.1
*including nutritional supplements
Table 4.26 Mean, SD, median and percentile values for daily copper (mg) intakes from all sources and food sources for the total population and by gender and age group
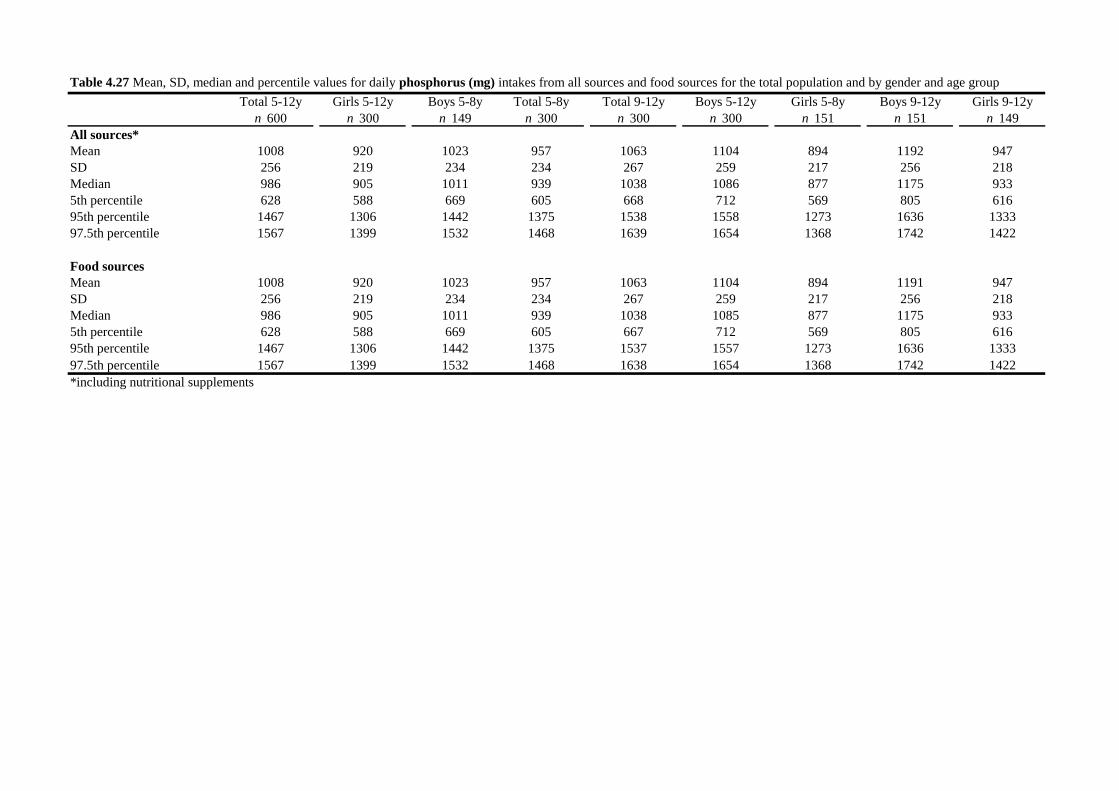
Total 5-12y Girls 5-12y Boys 5-8y Total 5-8y Total 9-12y Boys 5-12y Girls 5-8y Boys 9-12y Girls 9-12y
n 600 n 300 n 149 n 300 n 300 n 300 n 151 n 151 n 149
All sources*
Mean 1008 920 1023 957 1063 1104 894 1192 947
SD 256 219 234 234 267 259 217 256 218
Median 986 905 1011 939 1038 1086 877 1175 933
5th percentile 628 588 669 605 668 712 569 805 616
95th percentile 1467 1306 1442 1375 1538 1558 1273 1636 1333
97.5th percentile 1567 1399 1532 1468 1639 1654 1368 1742 1422
Food sources
Mean 1008 920 1023 957 1063 1104 894 1191 947
SD 256 219 234 234 267 259 217 256 218
Median 986 905 1011 939 1038 1085 877 1175 933
5th percentile 628 588 669 605 667 712 569 805 616
95th percentile 1467 1306 1442 1375 1537 1557 1273 1636 1333
97.5th percentile 1567 1399 1532 1468 1638 1654 1368 1742 1422
*including nutritional supplements
Table 4.27 Mean, SD, median and percentile values for daily phosphorus (mg) intakes from all sources and food sources for the total population and by gender and age group
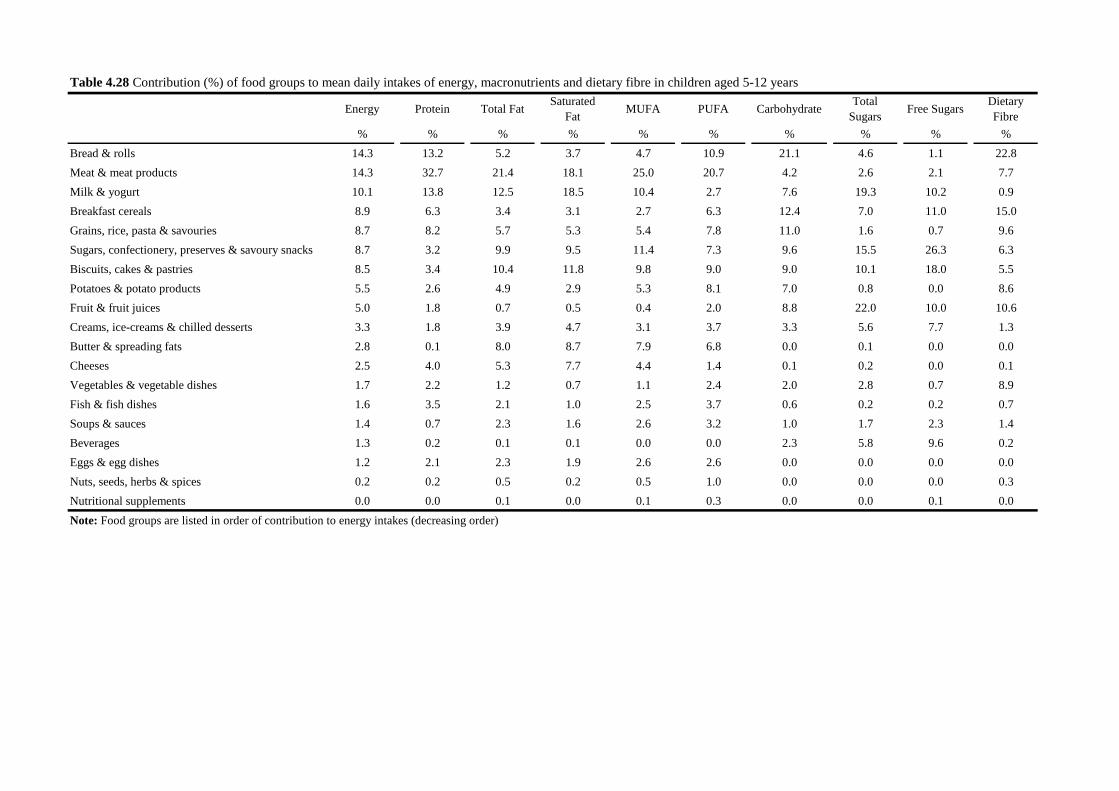
Energy Protein Total FatSaturated
FatMUFA PUFA Carbohydrate
Total
SugarsFree Sugars
Dietary
Fibre
% % % % % % % % % %
Bread & rolls 14.3 13.2 5.2 3.7 4.7 10.9 21.1 4.6 1.1 22.8
Meat & meat products 14.3 32.7 21.4 18.1 25.0 20.7 4.2 2.6 2.1 7.7
Milk & yogurt 10.1 13.8 12.5 18.5 10.4 2.7 7.6 19.3 10.2 0.9
Breakfast cereals 8.9 6.3 3.4 3.1 2.7 6.3 12.4 7.0 11.0 15.0
Grains, rice, pasta & savouries 8.7 8.2 5.7 5.3 5.4 7.8 11.0 1.6 0.7 9.6
Sugars, confectionery, preserves & savoury snacks 8.7 3.2 9.9 9.5 11.4 7.3 9.6 15.5 26.3 6.3
Biscuits, cakes & pastries 8.5 3.4 10.4 11.8 9.8 9.0 9.0 10.1 18.0 5.5
Potatoes & potato products 5.5 2.6 4.9 2.9 5.3 8.1 7.0 0.8 0.0 8.6
Fruit & fruit juices 5.0 1.8 0.7 0.5 0.4 2.0 8.8 22.0 10.0 10.6
Creams, ice-creams & chilled desserts 3.3 1.8 3.9 4.7 3.1 3.7 3.3 5.6 7.7 1.3
Butter & spreading fats 2.8 0.1 8.0 8.7 7.9 6.8 0.0 0.1 0.0 0.0
Cheeses 2.5 4.0 5.3 7.7 4.4 1.4 0.1 0.2 0.0 0.1
Vegetables & vegetable dishes 1.7 2.2 1.2 0.7 1.1 2.4 2.0 2.8 0.7 8.9
Fish & fish dishes 1.6 3.5 2.1 1.0 2.5 3.7 0.6 0.2 0.2 0.7
Soups & sauces 1.4 0.7 2.3 1.6 2.6 3.2 1.0 1.7 2.3 1.4
Beverages 1.3 0.2 0.1 0.1 0.0 0.0 2.3 5.8 9.6 0.2
Eggs & egg dishes 1.2 2.1 2.3 1.9 2.6 2.6 0.0 0.0 0.0 0.0
Nuts, seeds, herbs & spices 0.2 0.2 0.5 0.2 0.5 1.0 0.0 0.0 0.0 0.3
Nutritional supplements 0.0 0.0 0.1 0.0 0.1 0.3 0.0 0.0 0.1 0.0
Note: Food groups are listed in order of contribution to energy intakes (decreasing order)
Table 4.28 Contribution (%) of food groups to mean daily intakes of energy, macronutrients and dietary fibre in children aged 5-12 years
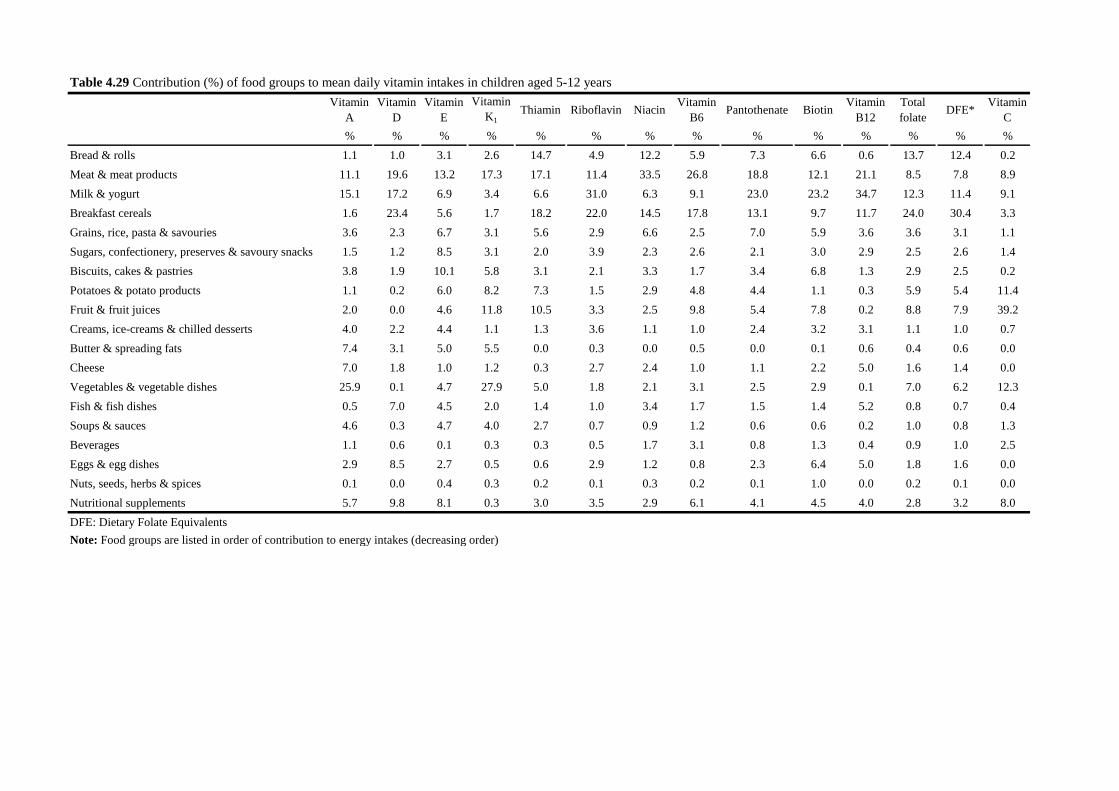
Vitamin
A
Vitamin
D
Vitamin
E
Vitamin
K1
Thiamin Riboflavin NiacinVitamin
B6Pantothenate Biotin
Vitamin
B12
Total
folateDFE*
Vitamin
C
% % % % % % % % % % % % % %
Bread & rolls 1.1 1.0 3.1 2.6 14.7 4.9 12.2 5.9 7.3 6.6 0.6 13.7 12.4 0.2
Meat & meat products 11.1 19.6 13.2 17.3 17.1 11.4 33.5 26.8 18.8 12.1 21.1 8.5 7.8 8.9
Milk & yogurt 15.1 17.2 6.9 3.4 6.6 31.0 6.3 9.1 23.0 23.2 34.7 12.3 11.4 9.1
Breakfast cereals 1.6 23.4 5.6 1.7 18.2 22.0 14.5 17.8 13.1 9.7 11.7 24.0 30.4 3.3
Grains, rice, pasta & savouries 3.6 2.3 6.7 3.1 5.6 2.9 6.6 2.5 7.0 5.9 3.6 3.6 3.1 1.1
Sugars, confectionery, preserves & savoury snacks 1.5 1.2 8.5 3.1 2.0 3.9 2.3 2.6 2.1 3.0 2.9 2.5 2.6 1.4
Biscuits, cakes & pastries 3.8 1.9 10.1 5.8 3.1 2.1 3.3 1.7 3.4 6.8 1.3 2.9 2.5 0.2
Potatoes & potato products 1.1 0.2 6.0 8.2 7.3 1.5 2.9 4.8 4.4 1.1 0.3 5.9 5.4 11.4
Fruit & fruit juices 2.0 0.0 4.6 11.8 10.5 3.3 2.5 9.8 5.4 7.8 0.2 8.8 7.9 39.2
Creams, ice-creams & chilled desserts 4.0 2.2 4.4 1.1 1.3 3.6 1.1 1.0 2.4 3.2 3.1 1.1 1.0 0.7
Butter & spreading fats 7.4 3.1 5.0 5.5 0.0 0.3 0.0 0.5 0.0 0.1 0.6 0.4 0.6 0.0
Cheese 7.0 1.8 1.0 1.2 0.3 2.7 2.4 1.0 1.1 2.2 5.0 1.6 1.4 0.0
Vegetables & vegetable dishes 25.9 0.1 4.7 27.9 5.0 1.8 2.1 3.1 2.5 2.9 0.1 7.0 6.2 12.3
Fish & fish dishes 0.5 7.0 4.5 2.0 1.4 1.0 3.4 1.7 1.5 1.4 5.2 0.8 0.7 0.4
Soups & sauces 4.6 0.3 4.7 4.0 2.7 0.7 0.9 1.2 0.6 0.6 0.2 1.0 0.8 1.3
Beverages 1.1 0.6 0.1 0.3 0.3 0.5 1.7 3.1 0.8 1.3 0.4 0.9 1.0 2.5
Eggs & egg dishes 2.9 8.5 2.7 0.5 0.6 2.9 1.2 0.8 2.3 6.4 5.0 1.8 1.6 0.0
Nuts, seeds, herbs & spices 0.1 0.0 0.4 0.3 0.2 0.1 0.3 0.2 0.1 1.0 0.0 0.2 0.1 0.0
Nutritional supplements 5.7 9.8 8.1 0.3 3.0 3.5 2.9 6.1 4.1 4.5 4.0 2.8 3.2 8.0
DFE: Dietary Folate Equivalents
Note: Food groups are listed in order of contribution to energy intakes (decreasing order)
Table 4.29 Contribution (%) of food groups to mean daily vitamin intakes in children aged 5-12 years
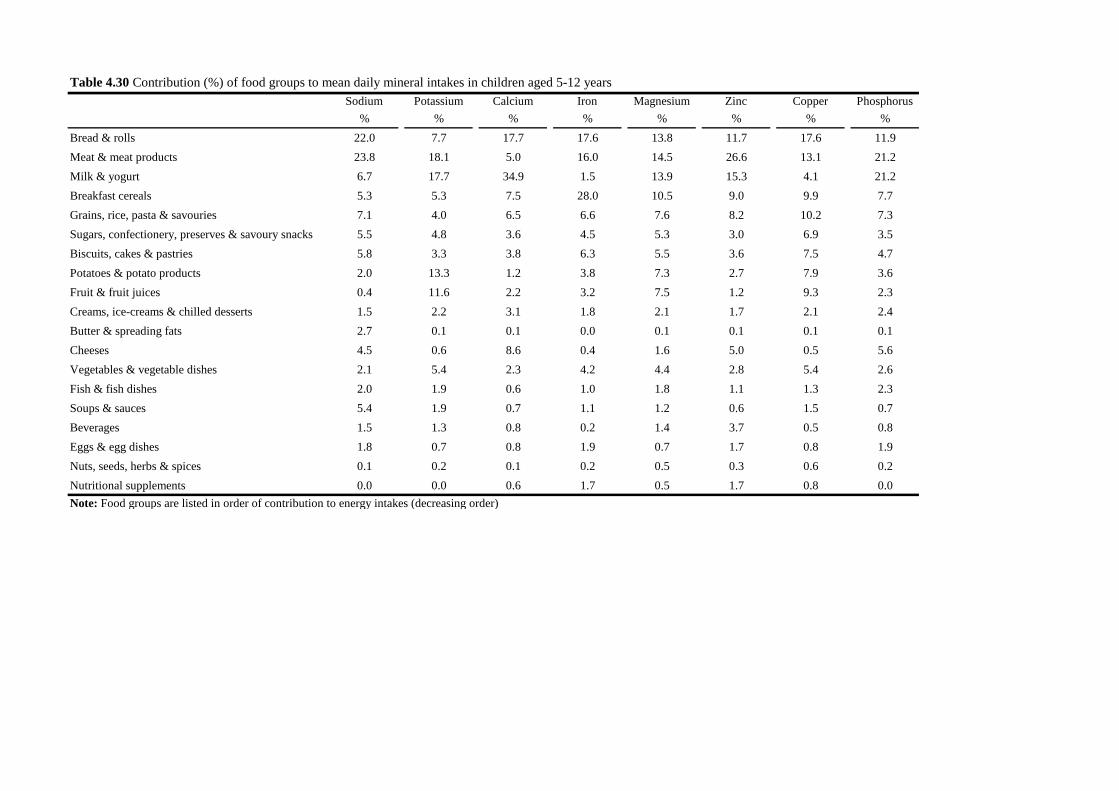
Sodium Potassium Calcium Iron Magnesium Zinc Copper Phosphorus
% % % % % % % %
Bread & rolls 22.0 7.7 17.7 17.6 13.8 11.7 17.6 11.9
Meat & meat products 23.8 18.1 5.0 16.0 14.5 26.6 13.1 21.2
Milk & yogurt 6.7 17.7 34.9 1.5 13.9 15.3 4.1 21.2
Breakfast cereals 5.3 5.3 7.5 28.0 10.5 9.0 9.9 7.7
Grains, rice, pasta & savouries 7.1 4.0 6.5 6.6 7.6 8.2 10.2 7.3
Sugars, confectionery, preserves & savoury snacks 5.5 4.8 3.6 4.5 5.3 3.0 6.9 3.5
Biscuits, cakes & pastries 5.8 3.3 3.8 6.3 5.5 3.6 7.5 4.7
Potatoes & potato products 2.0 13.3 1.2 3.8 7.3 2.7 7.9 3.6
Fruit & fruit juices 0.4 11.6 2.2 3.2 7.5 1.2 9.3 2.3
Creams, ice-creams & chilled desserts 1.5 2.2 3.1 1.8 2.1 1.7 2.1 2.4
Butter & spreading fats 2.7 0.1 0.1 0.0 0.1 0.1 0.1 0.1
Cheeses 4.5 0.6 8.6 0.4 1.6 5.0 0.5 5.6
Vegetables & vegetable dishes 2.1 5.4 2.3 4.2 4.4 2.8 5.4 2.6
Fish & fish dishes 2.0 1.9 0.6 1.0 1.8 1.1 1.3 2.3
Soups & sauces 5.4 1.9 0.7 1.1 1.2 0.6 1.5 0.7
Beverages 1.5 1.3 0.8 0.2 1.4 3.7 0.5 0.8
Eggs & egg dishes 1.8 0.7 0.8 1.9 0.7 1.7 0.8 1.9
Nuts, seeds, herbs & spices 0.1 0.2 0.1 0.2 0.5 0.3 0.6 0.2
Nutritional supplements 0.0 0.0 0.6 1.7 0.5 1.7 0.8 0.0
Note: Food groups are listed in order of contribution to energy intakes (decreasing order)
Table 4.30 Contribution (%) of food groups to mean daily mineral intakes in children aged 5-12 years

Chapter 5 Anthropometric Measurements
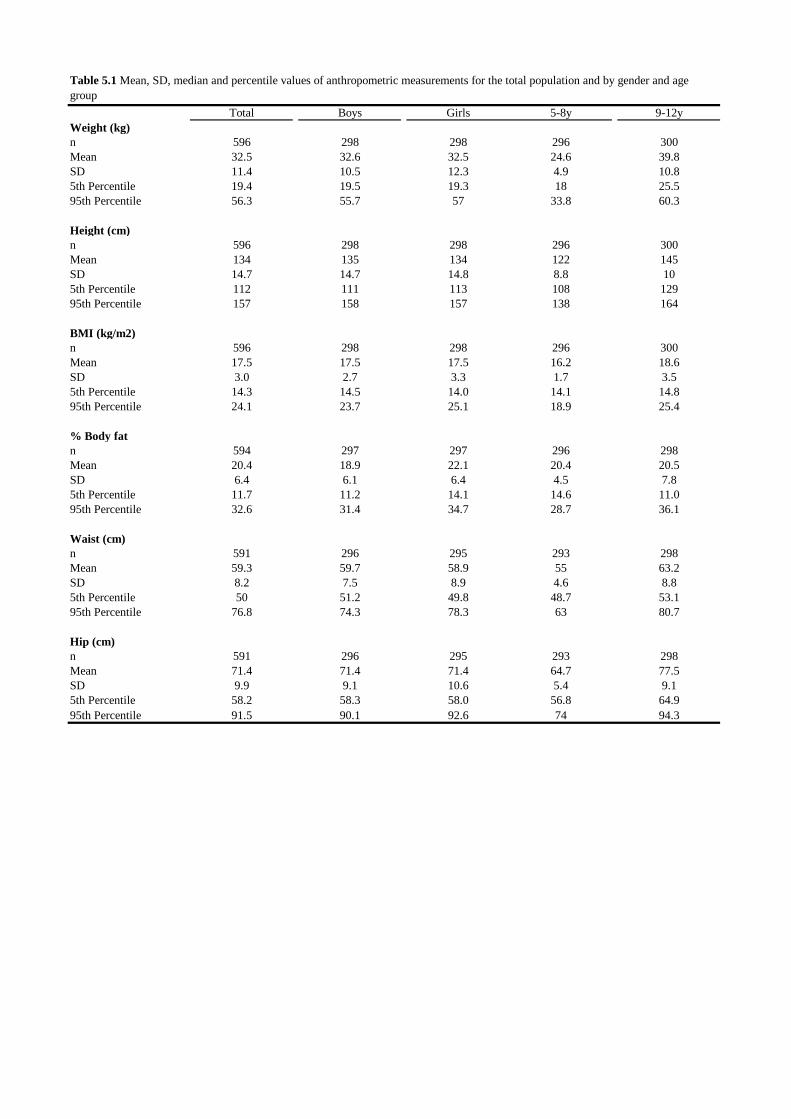
Total Boys Girls 5-8y 9-12y
Weight (kg)
n 596 298 298 296 300
Mean 32.5 32.6 32.5 24.6 39.8
SD 11.4 10.5 12.3 4.9 10.8
5th Percentile 19.4 19.5 19.3 18 25.5
95th Percentile 56.3 55.7 57 33.8 60.3
Height (cm)
n 596 298 298 296 300
Mean 134 135 134 122 145
SD 14.7 14.7 14.8 8.8 10
5th Percentile 112 111 113 108 129
95th Percentile 157 158 157 138 164
BMI (kg/m2)
n 596 298 298 296 300
Mean 17.5 17.5 17.5 16.2 18.6
SD 3.0 2.7 3.3 1.7 3.5
5th Percentile 14.3 14.5 14.0 14.1 14.8
95th Percentile 24.1 23.7 25.1 18.9 25.4
% Body fat
n 594 297 297 296 298
Mean 20.4 18.9 22.1 20.4 20.5
SD 6.4 6.1 6.4 4.5 7.8
5th Percentile 11.7 11.2 14.1 14.6 11.0
95th Percentile 32.6 31.4 34.7 28.7 36.1
Waist (cm)
n 591 296 295 293 298
Mean 59.3 59.7 58.9 55 63.2
SD 8.2 7.5 8.9 4.6 8.8
5th Percentile 50 51.2 49.8 48.7 53.1
95th Percentile 76.8 74.3 78.3 63 80.7
Hip (cm)
n 591 296 295 293 298
Mean 71.4 71.4 71.4 64.7 77.5
SD 9.9 9.1 10.6 5.4 9.1
5th Percentile 58.2 58.3 58.0 56.8 64.9
95th Percentile 91.5 90.1 92.6 74 94.3
Table 5.1 Mean, SD, median and percentile values of anthropometric measurements for the total population and by gender and age
group

Total 5-8y 9-12y
All (n) (596) (296) (300)
Underweight 1.1 0.8 1.4
Normal 83.2 89.4 77.5
Overweight 8.4 7.3 9.5
Obese 4.9 1.8 7.6
Morbidly obese 2.4 0.7 4.0
Overweight & obese 15.7 9.7 21.1
Boys (n) (298) (147) (151)
Underweight 0.7 0.0 1.3
Normal 83.8 87.2 80.8
Overweight 8.1 10.4 6.2
Obese 5.1 1.1 8.6
Morbidly obese 2.3 1.4 3.1
Overweight & obese 15.5 12.9 17.9
Girls (n) (298) (149) (149)
Underweight 1.6 1.6 1.5
Normal 82.6 91.7 73.8
Overweight 8.8 4.2 13.2
Obese 4.6 2.6 6.5
Morbidly obese 2.5 0.0 5.0
Overweight & obese 15.9 8.8 24.7
*Excludes 4 missing values
Table 5.2 Prevalence (%) of overweight and obesity in Irish children
aged 5-12 years using UK 90 growth references†
†Cole TJ, Freeman JV & Preece MA (1995) Body mass index reference
curves for the UK, 1990. Archives of Disease in Childhood 73 (1) 25-
29.
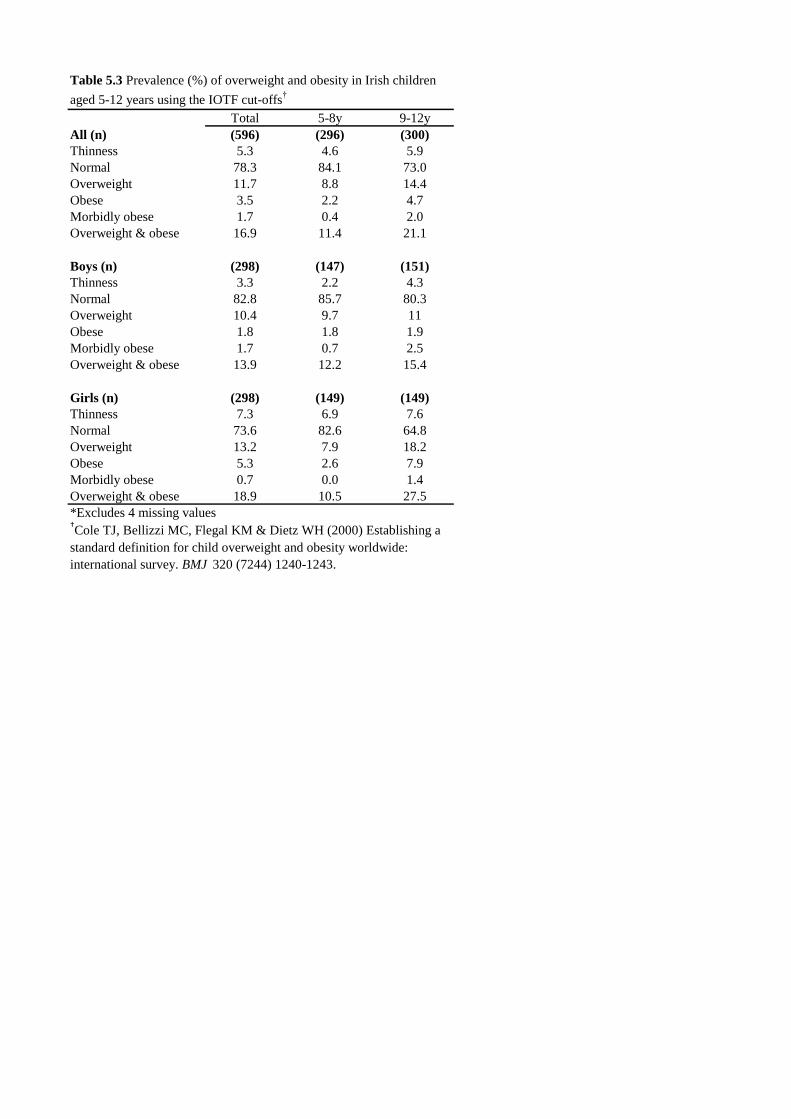
Total 5-8y 9-12y
All (n) (596) (296) (300)
Thinness 5.3 4.6 5.9
Normal 78.3 84.1 73.0
Overweight 11.7 8.8 14.4
Obese 3.5 2.2 4.7
Morbidly obese 1.7 0.4 2.0
Overweight & obese 16.9 11.4 21.1
Boys (n) (298) (147) (151)
Thinness 3.3 2.2 4.3
Normal 82.8 85.7 80.3
Overweight 10.4 9.7 11
Obese 1.8 1.8 1.9
Morbidly obese 1.7 0.7 2.5
Overweight & obese 13.9 12.2 15.4
Girls (n) (298) (149) (149)
Thinness 7.3 6.9 7.6
Normal 73.6 82.6 64.8
Overweight 13.2 7.9 18.2
Obese 5.3 2.6 7.9
Morbidly obese 0.7 0.0 1.4
Overweight & obese 18.9 10.5 27.5
*Excludes 4 missing values
Table 5.3 Prevalence (%) of overweight and obesity in Irish children
aged 5-12 years using the IOTF cut-offs†
†Cole TJ, Bellizzi MC, Flegal KM & Dietz WH (2000) Establishing a
standard definition for child overweight and obesity worldwide:
international survey. BMJ 320 (7244) 1240-1243.
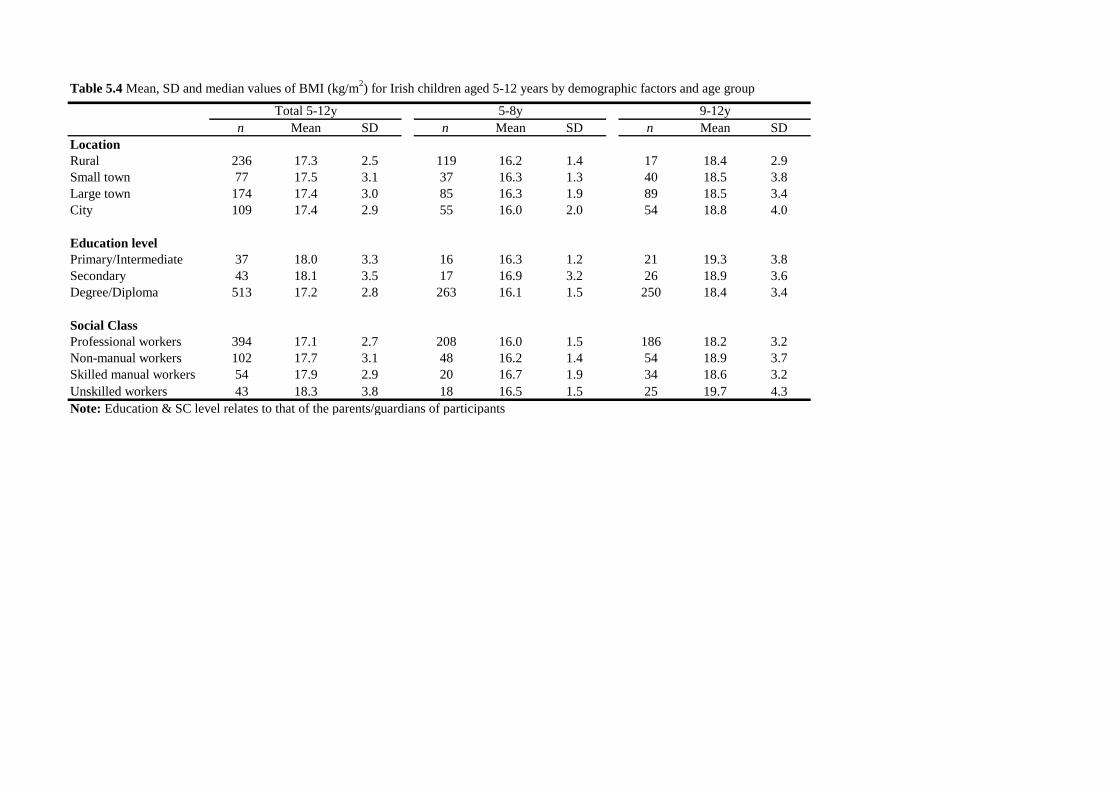
n Mean SD n Mean SD n Mean SD
Location
Rural 236 17.3 2.5 119 16.2 1.4 17 18.4 2.9
Small town 77 17.5 3.1 37 16.3 1.3 40 18.5 3.8
Large town 174 17.4 3.0 85 16.3 1.9 89 18.5 3.4
City 109 17.4 2.9 55 16.0 2.0 54 18.8 4.0
Education level
Primary/Intermediate 37 18.0 3.3 16 16.3 1.2 21 19.3 3.8
Secondary 43 18.1 3.5 17 16.9 3.2 26 18.9 3.6
Degree/Diploma 513 17.2 2.8 263 16.1 1.5 250 18.4 3.4
Social Class
Professional workers 394 17.1 2.7 208 16.0 1.5 186 18.2 3.2
Non-manual workers 102 17.7 3.1 48 16.2 1.4 54 18.9 3.7
Skilled manual workers 54 17.9 2.9 20 16.7 1.9 34 18.6 3.2
Unskilled workers 43 18.3 3.8 18 16.5 1.5 25 19.7 4.3
Note: Education & SC level relates to that of the parents/guardians of participants
Table 5.4 Mean, SD and median values of BMI (kg/m2) for Irish children aged 5-12 years by demographic factors and age group
Total 5-12y 5-8y 9-12y

n Mean SD n Mean SD n Mean SD
Location
Rural 120 17.2 2.3 60 16.3 1.2 60 18.2 2.7
Small town 40 17.5 2.2 19 16.6 1.5 21 18.3 2.5
Large town 99 17.5 3.1 46 16.4 1.9 53 18.4 3.6
City 39 17.1 2.9 22 16.6 2.7 17 17.8 3.2
Education level
Primary/Intermediate 22 18.2 3.3 10 16.7 1.4 12 19.4 4.0
Secondary 25 17.4 2.7 10 17.6 3.8 15 17.2 1.8
Degree/Diploma 249 17.3 2.6 127 16.3 1.5 122 18.3 3.0
Social Class
Professional workers 187 17.0 2.4 103 16.2 1.4 84 18.1 2.8
Non-manual workers 53 17.5 2.5 20 16.6 1.5 33 18.1 2.8
Skilled manual workers 32 18.0 3.0 12 16.8 1.2 20 18.6 3.5
Unskilled workers 25 18.0 3.4 11 16.7 1.7 14 19.0 4.0
Note: Education & SC level relates to that of the parents/guardians of participants
Table 5.5 Mean, SD and median values of BMI (kg/m2) for Irish boys aged 5-12 years by demographic factors and age group
Total 5-12y 5-8y 9-12y

n Mean SD n Mean SD n Mean SD
Location
Rural 116 17.3 2.8 59 16.0 1.5 57 18.6 3.2
Small town 37 17.5 3.8 18 16.0 1.1 19 18.8 4.9
Large town 75 17.3 2.9 39 16.1 1.9 36 18.6 3.3
City 70 17.5 3.7 33 15.6 1.3 37 19.2 4.2
Education level
Primary/Intermediate 15 17.7 3.3 6 15.6 0.3 9 19.1 3.6
Secondary 18 19.2 4.3 7 15.9 1.9 11 21.3 4.0
Degree/Diploma 264 17.2 3.1 136 16.0 1.6 128 18.5 3.6
Social Class
Professional workers 207 17.1 2.9 105 15.9 1.5 12 18.3 3.4
Non-manual workers 49 17.8 3.7 28 16.0 1.2 21 20.2 4.5
Skilled manual workers 22 17.8 2.9 8 16.6 2.8 14 18.5 2.8
Unskilled workers 18 18.8 4.3 7 16.2 1.1 11 20.5 4.8
Note: Education & SC level relates to that of the parents/guardians of participants
Total 5-12y 5-8y 9-12y
Table 5.6 Mean, SD and median values of BMI (kg/m2) for Irish girls aged 5-12 years by demographic factors and age group

Chapter 6 Physical Activity Levels
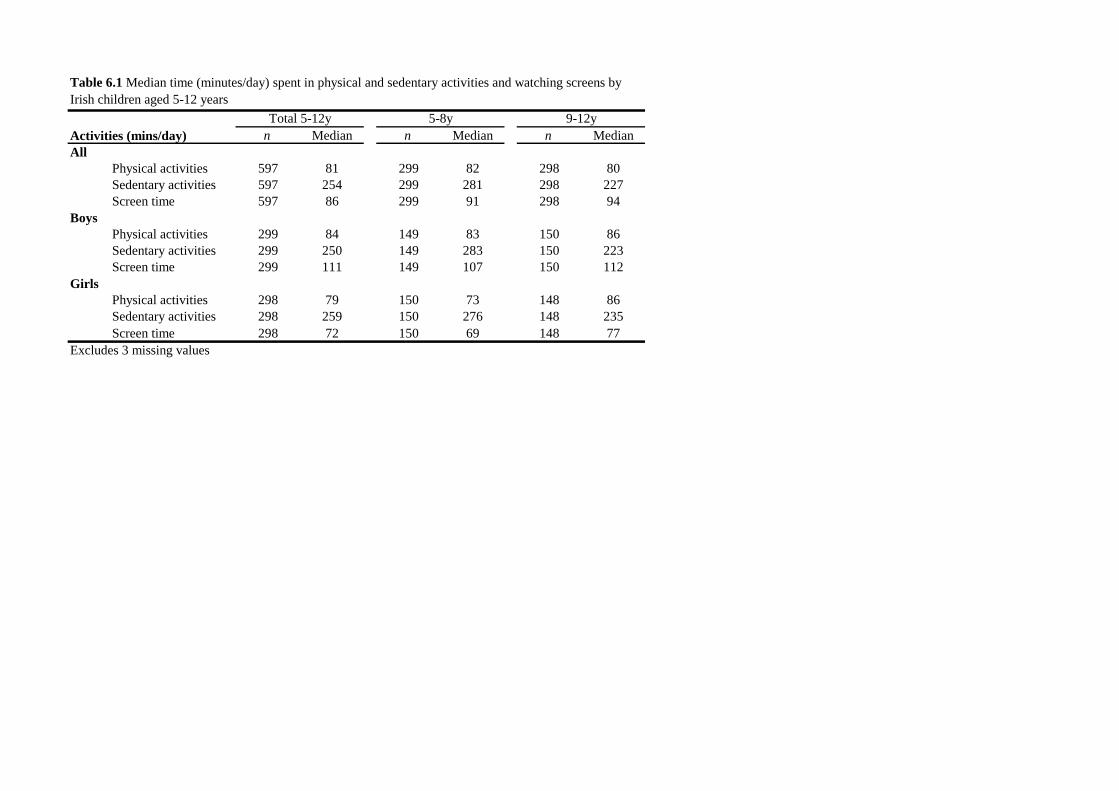
Activities (mins/day) n Median n Median n Median
All
Physical activities 597 81 299 82 298 80
Sedentary activities 597 254 299 281 298 227
Screen time 597 86 299 91 298 94
Boys
Physical activities 299 84 149 83 150 86
Sedentary activities 299 250 149 283 150 223
Screen time 299 111 149 107 150 112
Girls
Physical activities 298 79 150 73 148 86
Sedentary activities 298 259 150 276 148 235
Screen time 298 72 150 69 148 77
Excludes 3 missing values
Total 5-12y 5-8y 9-12y
Table 6.1 Median time (minutes/day) spent in physical and sedentary activities and watching screens by
Irish children aged 5-12 years

Activities (mins/day) n Weekday Weekend n Weekday Weekend n Weekday Weekend
All
Total screen time 597 63 135 299 60 135 298 72 120
Gaming (computer, tablet & console) 597 24 60 299 12 45 298 33 60
TV viewing 597 30 60 299 36 90 298 30 60
Boys
Total screen time 299 84 150 149 77 180 150 84 150
Gaming (computer, tablet & console) 299 36 90 149 21 60 150 36 90
TV viewing 299 36 60 149 36 90 150 36 60
Girls
Total screen time 298 60 120 150 60 120 148 60 120
Gaming (computer, tablet & console) 298 24 45 150 6 30 148 27 52
TV viewing 298 30 90 150 34 90 148 24 60
Excludes 3 missing values
Table 6.2 Median time (minutes/day) spent watching screens, television and gaming by children aged 5-12 years
Total 5-12y 5-8y 9-12y
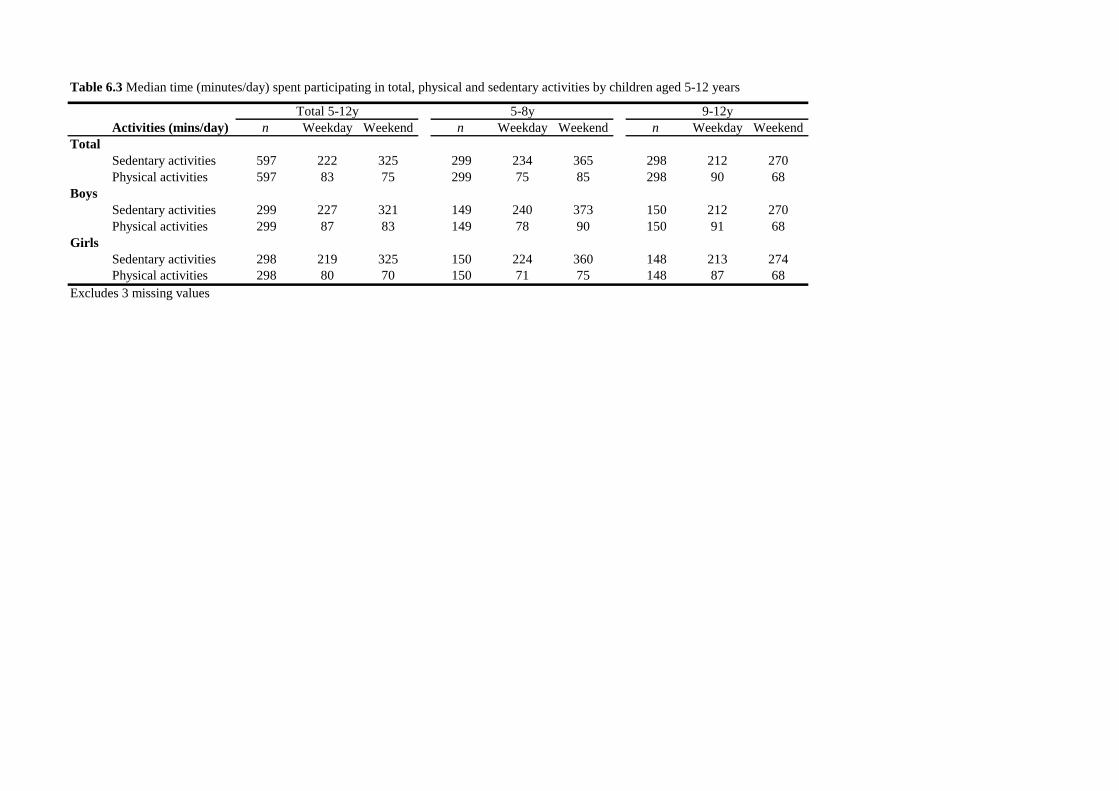
Activities (mins/day) n Weekday Weekend n Weekday Weekend n Weekday Weekend
Total
Sedentary activities 597 222 325 299 234 365 298 212 270
Physical activities 597 83 75 299 75 85 298 90 68
Boys
Sedentary activities 299 227 321 149 240 373 150 212 270
Physical activities 299 87 83 149 78 90 150 91 68
Girls
Sedentary activities 298 219 325 150 224 360 148 213 274
Physical activities 298 80 70 150 71 75 148 87 68
Excludes 3 missing values
Table 6.3 Median time (minutes/day) spent participating in total, physical and sedentary activities by children aged 5-12 years
Total 5-12y 5-8y 9-12y