national bureau of economic research · pdf filematching firms, managers and incentives ......
TRANSCRIPT

NBER WORKING PAPER SERIES
MATCHING FIRMS, MANAGERS AND INCENTIVES
Oriana BandieraAndrea PratLuigi Guiso
Raffaella Sadun
Working Paper 16691http://www.nber.org/papers/w16691
NATIONAL BUREAU OF ECONOMIC RESEARCH1050 Massachusetts Avenue
Cambridge, MA 02138January 2011
We thank seminar participants at Columbia GSB, Duke, Kellogg, Houston, Leicester, LSE, MIT OrganizationalEconomics, NBER Summer Institute, Peking University, Shanghai School of Finance and Economics,Texas A&M, Rotman School of Management and Tsinghua University for useful comments. We aregrateful to Pat Bayer, Nick Bloom, Tito Boeri, Patrick Bolton, Daniel Ferreira, Luis Garicano, JosephHotz, Casey Ichniowski, Rachel Kranton, Marco Ottaviani, Steve Pischke, Michael Riordan, FabianoSchivardi, Scott Stern, Seth Sanders, Duncan Thomas, John Van Reenen, Eric Verhoogen and Tillvon Wachter for useful discussions at various stages of the project. We are thankful to Enrico Pedrettiand Francesco Papa for their help in data collection. This research was made possible by generousfunding from Fondazione Rodolfo Debenedetti. The views expressed herein are those of the authorsand do not necessarily reflect the views of the National Bureau of Economic Research.
NBER working papers are circulated for discussion and comment purposes. They have not been peer-reviewed or been subject to the review by the NBER Board of Directors that accompanies officialNBER publications.
© 2011 by Oriana Bandiera, Andrea Prat, Luigi Guiso, and Raffaella Sadun. All rights reserved. Shortsections of text, not to exceed two paragraphs, may be quoted without explicit permission providedthat full credit, including © notice, is given to the source.

Matching Firms, Managers and IncentivesOriana Bandiera, Andrea Prat, Luigi Guiso, and Raffaella SadunNBER Working Paper No. 16691January 2011JEL No. J24,L2
ABSTRACT
We exploit a unique combination of administrative sources and survey data to study the match betweenfirms and managers. The data includes manager characteristics, such as risk aversion and talent; firmcharacteristics, such as ownership; detailed measures of managerial practices relative to incentives,dismissals and promotions; and measurable outcomes, for the firm and for the manager. A parsimoniousmodel of matching and incentive provision generates an array of implications that can be tested withour data. Our contribution is twofold. We disentangle the role of risk-aversion and talent in determininghow firms select and motivate managers. In particular, risk-averse managers are matched with firmsthat offer low-powered contracts. We also show that empirical findings linking governance, incentives,and performance that are typically observed in isolation, can instead be interpreted within a simpleunified matching framework.
Oriana BandieraLondon School of [email protected]
Andrea PratLondon School of EconomicsSTICERDLondon WC2 2AE [email protected]
Luigi GuisoEuropean University InstituteEconomics DepartmentVilla San Paolo50133 [email protected]
Raffaella SadunHarvard Business SchoolMorgan Hall 219Soldiers FieldBoston, MA 02163and [email protected]

1 Introduction
Personnel economics is concerned with two problems that firms face: how to find the right
employees and how to motivate them. Moreover, matching and incentives are tightly related:
di!erent people pursue di!erent goals. A firm should select a hiring policy in view of the
incentive structure it has in place; and it should select an incentive structure in view of the
people it wants to hire.
In a recent survey, however, Oyer and Schaefer (2010) conclude that personnel economics
has made more progress on the understanding of incentive provision than on matching. In
particular, relatively little is known about the ways firms and workers generate economic
surplus by matching appropriately, and on the mechanism through which firms strategically
design job packages to source appropriate workers. A key obstacle to advancement in this
area has been the dearth of integrated evidence, due to the fact that most datasets only
contain information on one side of the match.
In this paper we are able to analyze the matching mechanism using a unique dataset which
provides detailed information on employees, firms and the contracts that tie them. Our data,
which covers a random sample of Italian managers, draws from a variety of sources: our own
manager survey that contains information on contracts, managers and firms characteristics,
managers social security data on earnings throughout their career, and firms balance sheet
data. The data contains direct measures of manager characteristics, like risk aversion and tal-
ent; firm characteristics, such as ownership and governance structure; contract characteristics,
such as sensitivity to performance both through variable pay and implicit career incentives;
and measurable outcomes such as manager e!ort and firm performance. To the best of our
knowledge, this is the first time that — for any category of workers — firm-level information
is combined with such a rich characterization of managerial preferences and compensation
data drawn from individual social security records.
Our empirical analysis is guided by a simple model where firms and managers match
through the choice of incentive policies, and entry decisions, manager-firm matches, com-
pensation schemes, e!ort exertion, and firm performance are endogenously determined. The
model generates an array of predictions, which can be tested on our data. Our contribution is
twofold. First, we show empirically for the first time that managers’ risk aversion and talent
are correlated with the incentives they are o!ered and, through these, with the characteristics
of the firms that hire them. Second, we observe in our data a number of relations that have
been reported, in isolation, in other works. Hence, our contribution is to show that, for the
set of workers and firms under consideration, these regularities can be understood within a
2

parsimonious theoretical framework.
The model is based on the following primitives: a continuum of potential managers, who
have heterogenous talent and risk aversion; a continuum of potential firms, which di!er by
the weight their owners put on the private benefit of control vis-a-vis profits, and by their
idiosyncratic cost or revenue component; and a set of possible contracts that managers and
firms can sign, defined by a fixed compensation and the slope of the performance-based
component. The power of the contract should be viewed broadly, both as explicit incentives
(bonus) and implicit incentives (promotions and dismissals).
The framework illustrates how managers and firms match through incentives. Other
things equal, managers who are risk averse and have little talent prefer low-powered incen-
tives. Other things equal, firm owners who put a higher weight on the private benefit of
control rather than profits also prefer low-powered incentives, because high-powered incen-
tives give managers a large stake in the firm’s profit, and therefore increase the probability
that managers will oppose owners who want to extract private benefits at the expense of
profits. This means that certain owners may be willing to trade o! higher profits arising
from good management to contain the risk of losing control.1
An equilibrium is such that: (i) firms are active if and only if their expected payo! is
non-negative; (ii) managers are employed if and only if they receive at least their reservation
utility; (iii) matches between firms, managers, and contracts are stable, even taking into con-
sideration inactive firms and managers; (iv) contracts between matched firms and managers
are optimal; (v) managers exert the optimal amount of e!ort given their contract. It is im-
portant to stress that our model does not assume an exogenous distribution of active firms
or managers. In equilibrium, only firms that generate a non-negative payo! to their owners
will be active. Similarly, only managers that can create a positive surplus for some firm will
be employed as managers. Thus one can think of the underlying population as containing
all potential firms and all potential managers. Rather than trying ex-post to correct for a
“survivor bias,” our model o!ers a set of testable predictions on observed matches that build
on equilibrium entry conditions.
We show that there exists a unique equilibrium. The equilibrium is characterized by
assortative matching and yields four testable implications: (1) In a stable assignment of
1The owner/manager of an Italian firm puts it in colorful terms: “I’d rather be worth 100 million euros,
have fun now and enjoy people’s respect when I am the senile chairman of my firm, than be worth a billion
and get paid fat dividends by a little ******* with a Harvard MBA, who runs my firm and lectures me at
board meetings.” This comment was related to us in an email by a top-50 European CEO, with a Harvard
MBA. Our translation.
3

managers to firms, the slope of the contract a firm o!ers is positively correlated to the talent
of a manager and negatively correlated to his risk aversion; (2) Managerial outcomes are
linked to incentives: in equilibrium managers who face steep contracts exert a higher level of
e!ort, receive a higher expected compensation (both total and variable), and obtain a higher
overall expected utility; (3) Firms whose owners put more weight on the private benefit of
control are less likely to o!er more performance-sensitive contracts; (4) Firms that o!er more
high powered incentives have higher profits. While each individual prediction is consistent
with other models, we are not aware of a framework that can account for all four of them.
The aim of our empirical analysis is to present evidence on the rich set of equilibrium
correlations suggested by the theory. We base our results on a unique data set which we
created with the purpose of studying both matching and incentives. As discussed above,
its defining feature is that it combines detailed information on all three components of the
match, namely managers and firms characteristics, and the contracts that tie them. The
survey was administered to 603 individuals sampled from the universe of Italian service sector
executives. Our sample managers rank high in the hierarchy of the firms they work for: 60%
report directly to the CEO and a further 28% to the board. We also observe the managers’
compensation history since their first appearance on the labour market from social security
records, and we have standard accounting data on the firms.
We report four key findings, in line with the four theoretical predictions above.
First, we find that policies that create a tighter link between performance and reward
attract managers who are more talented and more risk-tolerant. Using an index that sum-
marizes the “contract” between firms and managers - i.e. whether firms reward, promote and
dismiss managers based on their performance - we show that firms o!ering a one standard
deviation steeper contract are more likely to attract high-talent managers by 16 percentage
points of the sample mean, and the ones they attract have a degree of risk tolerance that is
10 percent above the mean. The latter result speaks to the debate on the trade-o! between
risk and incentives. In line with classic agency theory but contrary to most available evidence
(Prendergast 2002), measures of risk tolerance and incentive power are positively related in
our data. Our findings can however be reconciled with the existing evidence by noting that we
measure the agent’s risk preferences directly rather than relying on proxies for risk aversion
such as the agent’s wealth or using variation in the riskiness of the environment instead of
the agent’s preferences. Our estimates therefore do not su!er from the bias due to correlated
unobservables or endogenous matching discussed in Prendergast (2002) and Ackerberg and
4

Botticini (2002), respectively.23
Second, we find that managers who are o!ered steeper contracts exert more e!ort, receive
higher fixed and variable pay, receive more non-pecuniary benefits, and (not obviously) are
more satisfied with their job. For instance, raising our incentive index by one standard
deviation is associated with an increase in the probability that the manager works more
than 60 hours a week by 16% of the sample mean, an increase in variable pay by a third
of the sample mean, and higher chances that he is very satisfied about his job as large as
12% of the sample mean. Reassuringly, the estimated correlation between incentives and pay
is robust to using administrative (and thus objective) social security earnings data instead
of our survey measures: hence, the correlation is not due to reporting errors or to survey
reporting biases. Even more interestingly, when we use the time variation in social security
earnings to compute the volatility of managers earnings through time, we find that steeper
incentives are correlated with observed higher earnings variability, consistent with the fact
that steeper contracts (as measured in the survey) implies that the managers bear more risk
(as measured in observed time series of earnings).
Third, we use information on the firms’ ownership structure to test whether the incentive
packages o!ered by firms depend on the weight their owners put on the benefit of private
control. More specifically, we exploit the variation between family owned and widely held
firms. This choice is rooted in the family firms literature (discussed below), which documents
how family-owners often perceive the firm as an opportunity to address family issues and
frictions. In this context, owners attribute a value to the firm as an “amenities provider”,
even though the provision of such amenities might not be profit maximizing. In this con-
text, direct control is extremely valuable as it minimizes the probability that other external
owners might oppose the extraction of such private benefits. On the other extreme, di!used
ownership makes it much harder for a single owner to extract private benefits from the firm.
2 Prendergast (2002) argues that delegation is more likely when the environment is more uncertain, and
that, because performance pay is positively correlated with delegation, this generates a spurious positive cor-
relation between environment uncertainty and incentive power when the degree of delegation is unobservable.
Ackerberg and Botticini (2002) argue that a spurious positive correlation can emerge because risk loving agents
are endogenously matched to risky environments and at the same time prefer high powered incentives. Using
agents’ wealth as a proxy for risk aversion does not solve the problem because the riskiness of the environment
is correlated with the error through the proxy error.3Our findings are complementary to existing evidence on executive pay that shows a negative correlation
between stock volatility and pay performance sensitivity (Aggarwal and Samwick 1999). That literature
focusses on endogenous variations in risk due to the characteristics of the environment, whereas we measure
the characteristics of the managers that determine their preferences for performance pay.
5

In line with this view, we find that, compared to widely-held firms, family-owned firms o!er
flatter compensation schemes. Namely, family firms are less likely to o!er bonuses as a func-
tion of individual or team performance, to promote and fire their managers based on their
performance, and to use formal appraisals throughout the managers’ career. Di!erences are
sizeable: unconditionally, the di!erence between the percentage of widely held and family
firm that o!er performance bonuses is 13 percentage points, and the corresponding di!er-
ence among firms that o!er fast track promotions for exceptional performers is 9 percentage
points. Controlling for sector and firm size, we show that the incentive index is significantly
weaker for family firms — up to 30% of one standard deviation. These findings are consistent
with an established view that, compared to anonymous and institutional shareholders, large
individual owners use corporate resources to generate ego rents, on-the-job amenities, or as-
set diversion (Demsetz and Lehn 1985). Such activities are mostly non-contractible and they
require e!ective direct control. They become more di"cult when the firm is run by talented
outsiders whose pay depends on firm performance — hence the comparative disadvantage of
family firms in the provision of managerial incentives.
Fourth, we estimate the correlation between incentives and firm performance measures
from balance sheet data and find that firms that o!er high powered incentives have higher
productivity, profits, and returns on capital. This is consistent with a Demsetzian view that,
in equilibrium, active but under-performing firms must o!er some other form of reward to
their owners.
Although some of these findings have been observed in isolation by other authors (more
detail is provided in the literature section), the value added of this paper lies in showing
that these relations all hold for the same set of firms and managers and can all be accounted
for by our parsimonious matching model. Furthermore, while our data does not allow us to
identify causal relations directly, the consistency of all the correlations we estimate with the
predictions of the model strongly supports its validity. Being able to observe all sides of the
match allows us to rule out alternative theories that might be consistent with a subset of the
correlations we report, but not the whole set.4
The rest of the paper proceeds as follows. Section 2 discusses the theoretical model and
4One such prominent alternative is that family firms have a more e!ective monitoring technology and hence
they do not need to o!er high powered incentives. If that hypothesis were driving the results, however, we would
expect managers who are better monitored to work harder and to have a higher fixed wage, to compensate
for the higher e!ort. Our estimates indicate that the opposite is true: managers who face weaker incentives
work less hard and have a lower base wage. Section 5 discusses this and other alternative explanations in more
detail.
6

illustrates its main testable predictions. Section 3 presents our data and shows how we map
the model’s variables into their empirical counterpart. Section 4 shows the evidence. Section
5 discusses the robustness of our results. Section 6 summarizes and concludes.
1.1 Literature Review
The main contribution of our paper is to integrate phenomena in personnel economics that
were usually analyzed individually.
On the theory side, our model belongs to the manager-firm assignment literature initiated
by Rosen (1982). Two recent papers (Landier (2008) and Terviö (2008)) provide tractable
CEO-firm matching models, where CEOs di!er on talent and firms di!er on size/productivity.
Our model is particularly close to an independent paper by Edmans and Gabaix (2010), which
endogenizes the contract between the CEO and the firm and obtains a concise close-form
characterization of equilibrium incentives and matches.5
On the empirical side, the four findings discussed above relate to four lively strands of
literature that we now briefly discuss. The first set of results — equilibrium matching — is close
to the large literature on firm-employee matching (see Lazear and Oyer 2007, for a review).
The distinctive feature of our work is that we highlight one possible determinant of the match
value, namely the firm’s and the managers’ preferences over high powered incentives.6
An important determinant of matching patterns, explored by Terviö (2008) and Gabaix
and Landier (2008), is firm heterogeneity in terms of size. While the main focus of this
paper is governance, our empirical analysis always controls for size. Our analysis confirms
the presence of the strong complementarity between size, talent, and pay predicted by the
assignment models above. In our sample, more talented managers are matched with larger
firms and the level of managerial pay is increasing in firm size. Friebel and Giannetti (2009)
study endogenous matching between firms and workers. In their model, large firms have
better access than small firms to financing but they also investigate more thoroughly new
ideas and are more likely to reject them. Workers di!er in their creativity, namely in how
likely they are to have promising ideas. The authors characterize the matching equilibrium
and analyze the e!ects of relaxing individual borrowing constraints. The key predictions of
5The focus of Edmans and Gabaix (2010) is quite di!erent from ours. They calibrate their model with
US data and show that the potential loss from talent allocation is much larger than the potential loss from
ine"cient contracting.6Our rich data allows us to overcome the identification issue pinpointed by Eeckhout and Kircher (2000).
As they show, wage data alone is not su"cient to identify matching patterns. However, we have direct
information on worker and firm characteristics.
7

the model are consistent with evidence available from the US Survey of Consumer Finances.
While we consider a di!erent set of employees — managers rather than creative workers — and
we utilize a di!erent empirical approach — a purpose-designed employee-employer survey —
our paper shares Friebel and Giannetti’s goal of identifying the role of talent and risk aversion
in the allocation of workers to firms.7
The second set of results relates to the vast literature (summarized in Lazear and Oyer
2007) on how incentives a!ect worker behavior. In line with most of that body of work, our
managers appear to work harder when they face steeper contracts. The results also relate to
the literature that seeks to explain the correlation between pay for performance, pay levels
and inequality both for CEOs (Hall and Liebman, 1998) and workers in general (Lemieux
et al 2009). We contribute to the debate by measuring contract steepness directly, as our
survey records whether both pay and career progressions are related to performance. In
contrast, the existing literature relies on outcome measures either by regressing total pay
on firm performance or by measuring whether workers have received bonuses during their
employment with the firm.
The third set of results — how ownership a!ects managerial practices — relate to a num-
ber of works at the intersection of personnel economics and corporate governance (Burkart,
Panunzi, and Shleifer 2003, Bertrand and Schoar 2006, Bloom and Van Reenen 2007, Leslie
and Oyer 2008), which study firm ownership as the key firm characteristics that drives the
adoption of di!erent managerial practices. The distinction between concentrated and di!use
ownership is a particularly salient one in that literature.8
Our findings can be seen as a validation of the “cultural” view of family firms (Bertrand
and Schoar 2006). The objective function of family owners contains a non-monetary compo-
nent. We interpret this as family firms valuing direct control per se, so that retaining direct
control gives rise to private benefits that the owner (the family) can enjoy in addition to the
utility from monetary profits. Private benefits can derive from the status associated with
leading a business, from the “amenity potential” of influencing the firm’s choices (Demsetz
and Lehn 1985), from the use of firm resources for personal purposes, or from the opportu-
7 Other examples of recent worker-firm endogenous matching models include Garicano and Hubbard (2007)
for law firms, and Besley and Ghatak (2005) and Francois (2007) for the non-profit sector.
See also Rose and Sheppard’s (1997) analysis of the link between firm diversification and CEO compensation.
The authors provide evidence that managers of diversified companies appear to be paid more. By comparing
the compensation of newly appointed and experienced CEOs, the paper shows that the premium is due to
higher ability rather than entrenchment.8 For evidence on the relevance of family ownership see Claessens, Djankov, and Lang, 2000, Faccio and
Lang (2002), and La Porta, Lopez-de-Silanes, and Shleifer (1999).
8

nity to use the firm to address family issues, for example finding a prestigious job for a low
ability o!spring. Valuing direct control is not inconsistent with family ownership per se hav-
ing a positive e!ect on performance, because, for instance, trust among family members can
substitute for poor governance as suggested by Burkart, Panunzi, and Shleifer (2003). Our
model indeed allows for family firms to have a comparative advantage on other dimensions.
Finally, the results on the link with firm performance relate to the literature on human
resources management and, more specifically, managerial practices (Black and Lynch 2001,
Bloom and Van Reenen 2007, Bonin et al 2007, and Ichniowski, Shaw, and Prennushi 1997).
In particular, we contribute to the literature on the e!ect of family ownership on performance
through the choice of CEO and management (Bertrand and Schoar 2006, Pérez-González
2006, Bennedsen, Nielsen, Perez-Gonzalez, and Wolfenzon 2007, and Lippi and Schivardi
2010). Like these papers, we find that family firms may twist the choice of the manager
towards less talented ones and thus provide a rationale for why they might perform worse
even when not intrinsically less e"cient — as the family firm owner’s quote reported earlier
seems to suggest. However, while in these papers what a!ects firm performance is the refusal
to choose from a wider set of managers and rely on the restricted pool of family (or social
network) members, in our case performance may be a!ected because less able and risk tolerant
managers self-select into family businesses at any time, not only at succession and even among
family businesses that choose to be run by professional managers.
Our findings that family firms o!er contracts that attract risk averse and less talented
managers and pay them less, are consistent with Sraer and Thesmar (2007) who show that,
compared to widely held firms, French family firms employ less skilled workers, o!er long-
run labor contracts that provide implicit insurance, and pay lower wages. Our paper is
complementary with work by Cai, Li, Park, and Zhou (2008). While in our study we compare
managers in non-family firms with non-family managers in family firms, they focus their
attention on the di!erence between family managers and outside managers employed by
family firms. Evidence from their detailed survey of Chinese family firms reveals that outside
managers are o!ered contracts that are more performance-sensitive. Our and their papers
taken together indicate that governance issues play a key role in the process of selecting and
motivating managerial talent.
2 Theory
This short theoretical section adapts a workhorse agency model — linear contracts, quadratic
payo!s, normally distributed additive noise — to the problem at hand. Our main contribution
9

lies in allowing heterogeneity on both sides of the managerial market and in letting the terms
of the contract be decided by the two parties. While some of our results have already been
discussed individually elsewhere and none of them will surprise people familiar with agency
problems, it is useful to provide a unified conceptual framework to interpret the rich set of
patterns that emerge from our data.
This section presents an informal analysis of the model. A formal characterization and
all the proofs are available in the attached Appendix.
2.1 Model
To produce, a firm requires one manager. Suppose firm i is matched with manager j. The
manager generates a product
yj =!!j (xj + "j) ,
where xj " 0 is the e!ort level chosen by the manager, !j is the manager’s talent, and "j is
normally distributed with mean zero and variance #2 and it’s uncorrelated across firms (or
managers). The parameter !j will be discussed shortly.
The wage that firm i pays to manager j is a linear function of the productivity signal
wij = ai + biyj
The parameter bi represents the link between pay and performance. The compensation
scheme should be interpreted broadly. Besides explicit contingent payments, such as bonuses
and stock options, the manager can also be o!ered implicit incentives (career concerns): if
he performs well, he will be promoted. In our model, both personnel policies will result in a
higher bi.
The manager has a CARA utility function
Uj = # exp $j
"wij #
1
2x2#,
where $j denotes j’s risk aversion coe"cient. There is a mass of potential managers, whose
human capital !j and risk aversion coe"cient $j are uniformly and independently distributed
on a rectangle [0, $̄]$$0, !̄%. The total mass is $̄!̄.9 To avoid di"cult signaling and screening
issues, we assume that the characteristics of individual managers (!,$) are observable.10
9 An important assumption here is that talent and risk aversion are independently distributed. While there
is some evidence that (cognitive) ability is positively related to risk taking (Frederick 2005), in our data there
appears to be no correlation between risk attitudes and measures of human capital.10 If the characteristics were not observable, the manager will have an incentive to pretend that he is more
10

We now turn to firms. The owners of firm i pursue the following objective:
V i = !i +&1# %g
'"i,
where !i denotes the standard corporate profit, while "i represents some other form of benefit
that the owners may receive from the company. This benefit has to do with direct control and
can be material (use of company resources for personal entertainment) or of a less tangible
sort (the status that derives from managing a company, the utility of keeping the firm “in
the family,” or the guarantee of prestigious jobs for friends or relatives). The parameter %g
represents the weight that the owners put on the benefit of direct control and it depends on
g, the ownership form. For the sake of simplicity, in what follows we allow for two types of
ownership, denoted by F and N , although the model can be extended to allow for a larger
variety of ownership structures. The main di!erence between F and N lies in the weight
that owners put on direct control, %F and %N respectively. In particular, F firms put more
weight on direct control than shareholders than N firms, such that %F < %N .1112
The firm profit is given by:
!i = yj # wij + hg # ki,
where the production yj and the compensation wij have already been discussed. The third
term, hg, represents an intrinsic profit di!erential between F and N firms. We remain ag-
nostic as to whether this di!erence is positive or negative. The fourth term, ki, represents
idiosyncratic fixed costs (or profit opportunities) faced by di!erent firms. For any ownership
type g, there is a potential mass of entrants and each entrant i is characterized by an idio-
syncratic cost ki. We assume that firms are distributed as follows: For every k " 0, the mass
of firms with ki % k is equal to k.1314
talented than he actually is. However, given !j , the manager would have no incentive to mis-represent his
risk attitudes because the contract that he is o!ered in equilibrium maximizes his expected utility given his
risk-aversion coe"cient "j .11 In particular, one can assume — although it is not necessary — that N firms have no direct control benefit:
#N = 1.
#F < #N .
12 The results would continue to hold if we assumed V i = #̃g!i +
!1! #̃
g""i.
13 Qualitatively, results would be unchanged if one assumed that the distribution of potential F -firms is
di!erent from the distribution of potential N -firms.14 The entry condition could be extended to allow for the possibility of N -firms to be bought out by families
and F -firms to be sold to the market.
11

The (potential) control benefit is given by
"i = "g # bi!j ,
where "g is a constant, which may depend on the ownership form g. The second term, bi!j ,
captures one of the key ideas of this paper: granting control to an outside manager dilutes
the owners’ ability to extract private benefits from the firm.15
The second term is crucial for our analysis and requires a careful discussion. Why is the
control benefit that an owner can extract from her firm decreasing in her manager’s talent
and incentive? We view the term as the reduced form of an un-modeled subgame between
the owner and the manager. Suppose the owner can obtain a private benefit by misusing
some of the firm’s productive inputs (buying a private jet, hiring friends and family, running
a pet project, etc.). This happens after the manager is hired and it is non-contractible ex
ante. Suppose that the manager can spend e!ort to prevent the owner from appropriating
resources. How motivated will the manager be to fight back?
Owner appropriation reduces the pool of resources that is available to the manager. It
is reasonable to expect that the amount of resources available and the manager’s talent are
complements in the creation of profits. The manager’s bonus is then the product of resources
times talent times profit share. The manager’s willingness to fight resource appropriation is
an increasing function of bi!j .16
To keep notation to a minimum, we set "N = 0, and hN = 0. These two variables do not
a!ect matching and contract choice; they only determine the number of N -firms and F -firms
that are active in equilibrium. Note that "F and hF can be positive or negative.
Firm entry is endogenous. In equilibrium: (i) The owners of every active firm i maximize
V i; (ii) A firm i is active if and only if the maximized V i is greater than the outside option
(normalized at zero).17
The timeline is as follows: (i) Each firm chooses whether to become active; (ii) A matching
market between firms and managers opens. Manager-firm pairs sign linear contracts; (iii)
Managers who are hired by firms choose how much e!ort they exert.15 Even if one assumes that the benefit "i does not depend on the manager’s talent !j directly (namely
that "i = "g! bi), there is still an indirect complementarity between incentives and talent, because firms that
o!er high-performance schemes attract more talented workers. Hence, one should expect all our main results
to go through (albeit in a less tractable setting).16 One could make this argument explicit in the model. It would require adding a second dimension to
the manager e!ort (fighting back the owner) and modeling the owner’s strategic choices. The theory section
would become even longer and more complex, without much gain.17 One could have di!erent outside options for F -firms and N -firms, but that would be equivalent to a
change in hF and hF .
12

2.2 Equilibrium
An equilibrium (in pure-strategies) of this model is a situation where: (a) A firm is active
if and only if it receives a non-negative expected payo!; (b) All manager-firm matches are
stable, namely no pair made of one manager and one firm, who are currently not matched to
each other, can increase their payo!s by leaving their current partners (if any) and signing
an employment contract with each other; (c) All matched pairs select the contract that max-
imizes joint surplus; (d) All managers choose the optimal level of e!ort, given the contracts
they have signed.
The present section o!ers an informal analysis of the model. A formal result is provided
in the end of the section and proven in the appendix.
Let us begin from the last step: e!ort choice. Given a contract with slope bi, manager
chooses e!ort
x̂j = bi!!j .
As the surplus created by the relationship can be allocated costlessly to the firm or the
manager through the fixed compensation variable a, the contract between the two parties
must maximize the sum of their expected payo!s. The surplus-maximizing contract has slope
b̂i&$j'=
%g1 + $j#
2.
The contract power is decreasing in the risk aversion coe"cient of the manager, $j , and in
the profit weight of the firm owners, %g. The manager’s product given the optimal contract
is
yj =!!j x̂j =
%g1 + $j#
2!j .
This means that there is a positive complementarity between the profit weight %g and man-
agerial talent !j and a negative complementarity between %g and the risk-aversion coe"cient
$j . F -firms have a comparative advantage in low-talent, risk-averse managers.
This comparative advantage translates into a matching equilibrium where managers with
high talent and low risk aversion work for N -firms, managers with medium talent and higher
risk aversion work for F -firms, and less talented managers are unemployed.
To see that this must be the case, consider two managers, A and B, and assume that A
is more talented and less risk-averse than B. Suppose for contradiction that A works for an
F -firm and B works for an N -firm. The total surplus (the sum of V i and Uj) generated by
the two firms is lower than the total surplus that would be generated by the same two firms
if they swapped managers. This means that either the F -firm and manager B or the N -firm
13

and manager A can increase their joint payo! by leaving their current partners and forming
a new match. The same line of reasoning applies to an unemployed manager who is more
talented and risk tolerant than a manager who is currently employed.
See the figure below for an example of such a matching equilibrium. Managers are uni-
formly distributed on a two-dimensional space of talent and risk aversion. The space is
divided into three regions. The upper left region contains talented risk-takers employed by
N -firms. The middle region is made of less talented and more risk-averse managers who work
for F -firms. The managers in the remaining region are unemployed.
0 1 2 3 4 50.80
0.82
0.84
0.86
0.88
0.90
0.92
0.94
0.96
0.98
1.00
1.02
risk-aversion
talent
N-firms
F-firms
not employed
Equilibrium allocation of managers to firms
The regions in the figure are determined by indi!erence conditions. Managers on the line
that separates the F -region from the unemployment region receive an expected utility equal
to their outside option. Managers on the line between the F -region and the N -region are
indi!erent between working for an N -firm or for an F -firm.
The expected payo! of firm i is
E$V i%= E
$!i +
&1# %g
'"i%
= &i + E$hg # ki +
&1# %g
'"g%,
where the term
&i = E$yj # wij #
&1# %g
'bi!j
%
14

can be seen as management-related payo!. Competition among firms guarantees that all
active F -firms have the same management-related payo! &F and all active N -firm have the
same management-related payo! &N . The comparative advantage of N -firms in incentive
provision means that &N > &F .
The size of the F -region in the figure above corresponds to the mass of F -firms that are
active, nF . Similarly, the size of the N -region equals the mass of N -firms, nN . The variables
nF and nN are determined endogenously by the free entry condition. Firm i is active if and
only if E$V i%" 0. This means that the F -firm with the lowest payo! satisfies
&F + hF # ki + (1# %F )"F = 0
while the N -firm with the lowest payo! satisfies
&N # ki = 0
2.3 Testable implications
The equilibrium characterization above yields an array of predictions regarding observable
variables, which we group into four implications.
The first set of predictions relates to how managers are matched to incentive schemes:
Implication 1 (Manager-Incentive Match) The slope of the contract that manager j
faces in equilibrium is negatively correlated with his risk aversion coe!cient and positively
correlated with his talent.
Implication 1 shows how managerial human capital is matched to firms in equilibrium.
Managers with high risk aversion and low talent face low-powered incentives. If that was not
the case, there could be gains from breaking existing pairs and forming new matches.
We can also predict how the manager’s e!ort and his performance will be related to the
incentive scheme he faces:
Implication 2 (Manager Performance) Controlling for risk aversion, the slope of the
contract that manager j faces in equilibrium is positively correlated with the manager’s: (a)
E"ort; (b) Variable compensation; (c) Total compensation; and (d) Utility.
Implication 2 describes what happens to the manager once he is matched to a firm.
Managers who face steep contracts work harder. That’s both because of the direct incentive
e!ect and because they are more talented (and talent and e!ort are complements). As a
15

result, they produce more output and they receive more performance-related compensation.
Finally, a revealed preference argument shows that managers who are o!ered a high contract
slope must have a higher utility than managers who are o!ered a less steep contract (because
being talented can obtain the same product with less e!ort).
The third set of predictions relates to incentive power. If an F -firm and an N -firm hire
managers with identical risk aversion, the F -firm will o!er a flatter contract because it has a
higher control premium. Formally, %F > %N implies:
b̂F&$j'=
%F1 + $j#
2<
%N1 + $j#
2= b̂N
&$j'.
We can write this result as:
Implication 3 (Firm-Incentive Match) F -firms o"er less steep contracts than N firms.
This result constitutes a third testable implication: F -firms o!er contracts that are less
performance-sensitive. Note that this prediction holds a fortiori if we do not condition for
the manager’s characteristics, as more risk-averse managers work for F -firms.
An additional prediction of our theory is that managers do not have an intrinsic produc-
tivity advantage in F or N firms. Implications 1 and 2 imply that all the e!ects on manager’s
characteristics and performance come from the incentive structure. Once controlling for in-
centives, the data should display no residual firm ownership e!ect.
The model also makes some predictions on the link between incentive provision and firm
performance. Before getting into that, it is important to stress that our theory does not
say whether performance will be higher in N -firms or in F -firms. This is for two reasons.
First, F firms may have some intrinsic business advantage or disadvantage, captured by hF .
Second, the fixed component of "F determines endogenously the threshold of idiosyncratic
cost ki that induces F -firms to be active, and hence their performance. As a result, we can
construct numerical examples where profits are higher in F -firms and numerical examples
where they are higher in N -firms.
However, our model makes predictions on the correlation between firm performance and
incentive provision, conditional on ownership:
Implication 4 (Firm Performance) Controlling for ownership, the slope of the contract
is positively correlated with the firm’s profit !i.
The intuition for this last prediction is immediate. As an increase in the contract slope
bi reduces control benefits, the firms who choose a higher slope must in equilibrium be
compensated with a higher expected profit.
16

3 Empirical Analysis: Data Description
3.1 Data Sources
Our empirical analysis exploits three data sources: (i) a novel survey of Italian managers
that we designed to collect detailed information on their characteristics, the firms they work
for and the incentives they face, (ii) Amadeus and the Italian Company Accounts Database,
which contain information on the firms’ balance sheets, demographics, and employment lev-
els,18 and (iii) the Social Security Database, which contains longitudinal information from
administrative records on the managers’ job position, pay, and employer since they joined
the labor force.
The distinctive and unique feature of our survey is that it collects information on both
sides of the market: the firms and the managers they employ. In particular, we collect
measures of the firms’ ownership structure and details on their incentive policies on three
dimensions: bonus pay, promotion, and dismissal decisions. On the managers’ side, we collect
information on the managers’ risk aversion, talent, work e!ort, compensation package, and
job satisfaction.
One advantage of using data from a continental European country like Italy is that all-
encompassing rules about collective labor bargaining result in unambiguous job definitions.
The job title of “manager” (dirigente in Italian) applies only to the set of workers that have
a manager collective contract, a fact that is recorded by social security data.19 Italy has four
managerial collective agreements: manufacturing, credit and insurance, trade and services,
and public sector.
To avoid dealing with sector-specific contractual provisions, we focused on the managers in
the trade and service sector. Managers in our sample are selected from the members directory
of Manageritalia, an association of professional managers operating in the Italian trade and
services sectors. Importantly, Manageritalia members account for 96% of all managers in
the trade and service sectors. Hence, by sampling from the Manageritalia directory we
18 Amadeus is an extensive accounting database covering more than 9 million public and private companies
across Europe, of which approximatively 580,000 are in Italy. The Company Accounts Database is based on
information provided by commercial banks that covers all the banks’ largest clients. The data is collected by
Centrale dei Bilanci, an organization established in the early 80s by the Bank of Italy and Italian Banks with
the purpose of recording and sharing information on borrowers.19 There is a very clear distinction between being a manager and the closest collective contract job title,
which corresponds to “clerical employee” (quadro in Italian). Indeed the two categories are represented by
di!erent trade unions and have di!erent pensions schemes. The di!erence in terms of social status is also
immediately perceived.
17

are sampling from almost all the population of managers in that sector. These, in turn,
make up for 20% of all Italian managers.20 The Manageritalia members directory contains
22,100 managers employed by 8,739 firms. To make sure we obtain balance sheet data, we
sample from the 2,012 firms that can be matched with Amadeus and the Italian Company
Accounts Database. The balance sheet data-sets and, a fortiori, our sampling universe, are
skewed towards large firms. To maintain comparability across managerial tasks we focus on
managers employed in the three main operational areas — general administration, finance,
and sales. We randomly assign each firm to one of the three areas and randomly select one
manager within each firm. The final sampling universe contains 605 each of general directors,
finance directors, and sales directors, for a total of 1,815 observations.21
The administration of the survey was outsourced to Erminero & Co. — a well established
survey firm located in Milan, Italy. The 1,815 sample managers were contacted by phone
to schedule a subsequent phone interview, administered by a team of 35 analysts trained
by Erminero & Co, and closely monitored by our research team. The response rate was
33%, with an average duration of 21 minutes per interview. Thus, our final sample contains
603 observations, equally split across the three operational areas.22 Our sample managers
rank high in the firm hierarchy: most of them (60%) report only to the CEO, and a further
28% directly to the board. Only 2% rank three layers below the CEO. Moreover, 97.5% of
sample managers are outsiders, namely they do not belong to the family when the firm is
family owned. Reassuringly, respondents and non-respondents are employed by observation-
ally identical firms. Indeed we find no evidence that the probability of participating in the
survey is correlated to firm’s size, labor productivity, profits, return on capital employed,
or sector (Table A1 in the Appendix). Respondents also look similar to non-respondents
on demographics (gender and age) and tenure on the job. Respondents however have lower
wages but the di!erence, while precisely estimated, is small as the median weekly wage for
20 Social security data indicate that in 2006, the number of individuals employed on a “manager contract”
in the private sector were 117,000. Of these, 23,000 belong to the trade and private service sectors, and 22,100
belong to Manageritalia. Managers working for Italian branches of multinational firms belong to the trade and
service sectors even if the firm itself is classified as industry–e.g. car manufacturers–as long as no production
plants are located in Italy.21 We do not sample from the 197 firms for which the Manageritalia member list does not contain managers
employed in the main three operational areas.22 In our regressions we always include controls for manager operational area. We also collected detailed
information on the interview process, including information on the interviewees’ tenure in the company, tenure
in the post, seniority and gender, and interviewer identifiers. We use these variables to account for measurement
error in the survey variables across some specifications.
18
respondents is 8% lower than for non-respondents (!1648 vs. !1786). This is consistent
with non-respondents having a higher opportunity cost of time, as expected. Reassuringly,
however, the pay distribution have considerable overlap, and, as discussed below, there is
considerable variation within our sample. Moreover, despite this level di!erence, respondents
and non-respondents have a similar career path, as we find no di!erence in the average yearly
rate of pay growth. Finally, while social security data do not contain information on incentive
policies, we can proxy sensitivity of pay to performance by calculating the standard deviation
of pay of the same manager across years in the same firm. Table A1 shows that respondents
and non-respondents do not di!er on this dimension.
3.2 Firm Characteristics and Performance
The main characteristics of our sample firms are summarized in Table 1, Panel A. The table
shows that family ownership is the most common ownership structure: 47% of the firms are
owned by the founder (19%) or their family (28%). The percentage of family firms is in line
with the findings of La Porta, Lopez-de-Silanes, and Shleifer (1999), who report that 60% of
Italian medium-sized publicly traded firms belong to a family (including both founders and
second generations firms). Widely held firms account for 30% of the sample.23 The remaining
23% is divided between cooperatives and firms owned by the State (8%), firms owned by their
management (2%), and firms owned by a group of private individuals (13%). As there is no
a priori reason to believe that the importance attached to the “amenity potential” of control
by these firms is similar to either family firms or widely held firms, we keep this category
separate in the analysis that follows.
The survey also contains information on firm size, sector, and multinational status. Over
90% of the sample firms employ less than 500 people. In more detail, 39% are small firms
with 10 or fewer employees, a further 20% have between 50 and 100 employees, and the
remaining 41% have more than 100 employees. All sample firms belong to the service sector,
within which the three most frequent categories are Wholesale (45% of the sample), Business
Services (11%), and Retail and Specialized IT services (4%). Finally, 58% of the firms in our
sample are subsidiaries of a multinational company and in 21% of the cases the multinational’s
headquarters are in Italy.24
23 Widely held firms are companies where no party detains more than 25% of the shares. We include in this
category also private equity firms (8% of the sample), but the results are qualitatively similar once we include
private equity in the residual ownership category.24 Most sample firms are incorporated in the region of Lombardy (58%), followed by Emilia (9%), Lazio
(9%), Veneto (8%), Piedmont (5%), and Tuscany (5%). This reflects the uneven geographical distribution of
19

The last three rows of Table 1, Panel A report measures of firm performance from
Amadeus. For each firm we use the last year for which data is available, which is 2007 for 62%
of the sample firms and 2006 for 35% of them. We use three measures of performance: labor
productivity (defined as operating revenues divided by the number of employees), profits per
worker (computed as earnings before interests and tax divided by the number of employees),
and ROCE (operating income scaled with capital employed). For each measure we drop the
top and bottom 1%, to remove outliers possibly due to measurement errors. Table 1 shows
that the distribution of productivity and profits is heavily skewed to the left, the median
is much smaller than the mean, indicating that there is a long tail of firms that perform
considerably better than most of the sample. Finally, we observe considerable heterogeneity
along all three measures — the standard deviation is between 1.3 and 2.3 times the mean.
3.3 Incentive Policies
The model in Section 2 makes it precise how the choice of incentive policies attracts di!erent
types of managers. To provide evidence on this issue we collected information on three types
of firms’ policies that can be made conditional on manager’s performance: pay, promotions,
and dismissals. This way we obtain a detailed picture of the firms’ incentive policies and
can exploit variation along all three dimensions. For each type of policy we ask whether
the outcome depends on the manager’s performance and whether this is evaluated through
a formal appraisal system. The latter is crucial to ensure that managers know the exact
mapping from performance to reward, which determines the e!ectiveness of the incentive
scheme. In fact, our data shows that two thirds of the managers who are formally appraised
know exactly how bonus payments are calculated, whereas the corresponding share in firms
that do not have a formal appraisal system is one half.
To measure the sensitivity of pay to performance, we asked whether managers can earn
a bonus, whether this is a function of performance and whether it is awarded through an
established appraisal process. We summarize this information into two variables, bonus 1
(equal to 1 if bonus is conditional on performance and zero otherwise) and bonus 2 (equal to
1 if bonus is based on formal appraisal; zero otherwise). Half of the firms in our sample o!er
bonuses as a function of individual or team performance targets that are agreed in advance;25
in 33% of firms, bonuses are awarded through a formal appraisal system (Table 1, Panel B).
To measure the e!ect of performance on the manager’s career prospects within the firm
firms across the country.25 Overall, 70% of the firms o!er a bonus scheme, but for 20% the bonus is either a function of firm-wide
performance or awarded at the discretion of the owners.
20

we asked whether fast promotion tracks for star performers exist, whether promotions depend
on performance (as opposed to tenure or good relationships with the owners), and whether
they are decided through formal appraisals. The variable promotion 1 equals one when fast
tracks exist and zero otherwise. We define promotion 2 to equal one if performance is an
important factor for promotion. Finally, promotion 3 equals one if promotions are decided
within a well-defined system of formal appraisal. On average, 37% of sample firms report to
have fast tracks for star performers, promotions depend on performance in 74% of the cases,
and 34% of firms have a formal appraisal system to determine promotions (Table 1, Panel
B).
Finally, we measure whether poor performance can be cause for dismissal, and, again,
whether dismissals are decided through a formal appraisal system. The variable firing 1 is
equal to 1 if in the past five years managers have been dismissed due to failure in meeting their
performance objectives, and 0 otherwise. Overall, only 11% of firms have dismissed managers
in the last five years, and 5% of these report doing so because of poor performance.26 Finally,
firing 2 equals one when dismissals are decided through a formal appraisal system, and this
happens in 23% of the sample firms (Table 1, Panel B) .
For parsimony, we combine the various incentive policies in a sole index that equals the
sum of the measures described above. The findings are qualitatively unchanged if we use
other summary measures, such as the first principal component. The resulting index takes
values between 0 and 7, with higher values denoting policies that create a tighter link between
reward and performance. The median firm adopts 2 out of the 7 incentive policies we consider,
and the standard deviation of the index is 1.74. Just under 10% of the sample firms o!er no
explicit reward for performance, while only 0.5% adopt all seven measures.
3.4 Manager Characteristics, Pay and Performance
The manager survey provides a wealth of information on manager characteristics that are
summarized in Table 1, Panel C. Managers are on average 47 years old, and 90% of them are
males.27
The theoretical model of Section 2 implies that a key variable driving the firm-manager
match is the manager’s attitude towards risk. To shed light on this, we follow an emerging
26 The other, non-exclusive, reasons given for dismissals are “poor market conditions” (4%) and “disagree-
ment with the owners” (6%).27 This is in line with the figures for the manager population as a whole from social security records. In
the last available year (2004), average age was 47 and the share of males 88%. See Bandiera et al (2008) for
details.
21

literature that tries to elicit individual risk preference parameters and characterize their
heterogeneity by using large-scale surveys (e.g. Barsky et. al. 1997, Guiso and Paiella 2008,
and Dohmen et al 2006). Our approach di!ers from most of the literature that analyzes
the risk-incentive trade-o! using measures of the riskiness of the environment or agents’
wealth as a proxy for their risk aversion. As such, it does not su!er from the bias caused by
omitted variables and endogenous matching discussed by Prendergast (2002) and Ackerberg
and Botticini (2002).
We collected two measures of risk attitudes that aim at measuring the managers’ own
preference and the riskiness of the choices they make for the firm, respectively. Measures
of this sort have been shown to correlate with actual risk taking in a field experiment by
Dohmen et al (2006).
To measure the managers’ own risk preference we ask them to choose between a prospect
that yields 1 million euros for sure (the safe choice) and a binary risky prospect that yields 0
with probability p and 10 million with the complementary probability (1-p), where p varies
between 0.01 and 0.8 at intervals of size 0.1. Suppose that for very low probability of zero
return (and thus a very high probability of making 10 million) the manager prefers the risky
prospect to 1 million euro for sure. We take as our risk attitude measure p!, defined to be the
level of p at which the manager switches from the risky to the safe prospect. Obviously p! is
inversely related to risk aversion, that is risk averse managers are willing to bear losses only if
the probability is low. Table 1 shows that the average manager prefers the safe prospect when
the risky one fails with probability 0.2 or higher. More interestingly, Table 1 also shows that
managers’ risk attitudes are quite heterogeneous — the standard deviation of our measure is
18.94.
To measure the managers’ choice of risk for the firm we ask them explicitly to choose
between alternative projects that present a trade-o! between risk and expected profits in a
qualitative scale from 0 to 10, where 0 indicates the safest and least profitable project.28 The
average manager is just above the midpoint (5.7) and again there is considerable heterogene-
ity across managers. Interestingly, the two risk attitudes measures are strongly correlated
(correlation coe"cient 0.24) consistent with the model idea that managers with a high per-
sonal degree of risk tolerance self select into firms where this risk tolerance is required when
28 The question reads as follows: “We would now like you to think to some important decisions you have
taken or might take on behalf of your firm. These are strategic decisions whose outcome is uncertain, with a
positive correlation between expected earnings and risk. On a scale from 0 to 10, where 0 means you would
choose the safest option with the lowest expected earnings while 10 refers to very risky projects that have a
very high rate of return in case of success, what would you choose?”
22

making strategic decisions for the firm.
To complement our measures of risk aversion we also collect proxy measures for the man-
agers’ access to informal insurance. Intuitively, for a given degree of risk aversion, managers
who have better access to insurance should be willing to bear more risk in general as this
reduces background risk (Kimball 1993 and Gollier 2004). Following the literature that high-
lights the importance of inter-vivos transfers from Italian parents to their o!springs,29 we col-
lect information on the managers’ family socioeconomic background to proxy for their ability
to smooth risk. The underlying assumption is that managers whose parents are wealthy are
better equipped to bear risk as the latter can be bu!ered by their parents’ wealth. Through-
out we proxy family background by fathers’ college education, which is strongly correlated
to occupation and income; as Table 1 shows, 16% of the sample managers’ fathers have a
college degree.
The next set of variables aim to proxy for the managers’ talent. The first two refer to the
managers’ human capital, as measured by college and executive education degrees. In our
sample, 50% of the managers hold a college degree, and 56% hold an executive degree.30 To
capture additional aspects of managerial quality beyond education, we measure “desirability”
by asking managers whether they received any job o!er during the three years prior to the
interview; 71% reported that this was the case.
It is important to note that the measures of risk attitudes and talent exhibit independent
variation: no correlation between any two measures is higher than 0.06. This is crucial for
our purposes as it allows us to identify matching on risk and talent separately.31
Finally, Table 1, Panel D reports measures of the managers’ e!ort, remuneration, and
job satisfaction. We proxy managerial e!ort by the number of hours worked over a week. In
our sample 37% of managers works 60 hours or longer.32 The average annual fixed salary
of a manager is approximately 100,000 Euro, while the bonus amounts, on average, to 15%
of the fixed salary. On average, managers in our sample receive 4.2 non-monetary benefits
out of a list of seven potential benefits.33 Finally 50% of the managers in our sample report
29 See, e.g., Cannari and D’Alessio (2008) and Guiso and Jappelli (1999).30 This relatively low figure is consistent with the information arising from existing surveys of Italian
managers (see Bandiera et. al. 2008).31We discuss in more detail the validity of the risk aversion variable in the robustness section.32 To minimize measurement error due to the choice of a particular week, the survey asks managers to pick
the number of hours they work in the “typical” week out of 5 possible choices: (i) 40 hours or fewer, (ii) about
40 hours, (iii) about 50 hours, (iv) about 60 hours, (v) 60 hours or more.33 The list of benefits include: company car (available to 83% of our sample managers), flexible hours (85%),
telecommuting (27%), training (71%), sabbatical periods (6%), health insurance (74%), and life insurance
(74%).
23

to be “extremely satisfied” about their job. Only 5% report to be “unsatisfied,” while the
remaining part of the sample is “satisfied.”
4 Empirical Analysis: Findings
We organize the empirical evidence in four parts that match the four set of predictions ob-
tained in Section 2. We start by estimating the relation between the firms’ incentive policies
and the risk and talent of the managers they hire in equilibrium. We will show that firms
o!ering stronger incentives attract managers who are more risk tolerant and more talented.
Second, we estimate the correlation between the strength of incentives and managers’ out-
comes. We will show that managers who are o!ered stronger incentives exert more e!ort,
receive higher fixed and variable pay, receive more non-pecuniary benefits, and are more sat-
isfied with their job. Third, we estimate the correlation between the weight given to keeping
a direct control of the firm (as proxied by ownership) and the strength of managerial incen-
tives. We will show that family ownership, which in our setting reveals a stronger preference
for direct control, is negatively correlated with the adoption of bonus systems related to
individual or team performance, and with the adoption of practices that promote and fire
employees based on their performance. Fourth, we estimate the correlation between incen-
tives and firm performance. We will show that firms that o!er high powered incentives have
higher productivity, profits, and returns on capital.
It is important to make precise that our aim is to present evidence on a rich set of
equilibrium correlations that are suggested by the theory. We do not, at any stage, aim
at identifying the causal e!ect of ownership on incentives or incentives on performance, as
neither varies exogenously. However, at the end of this section we discuss a number of
alternative interpretations of our findings and argue that, when taken together our evidence
while consistent with the matching model, is not consistent with any of these alternatives.
4.1 Incentives and Managers’ Characteristics
We begin by testing Implication 1, namely that high powered incentives attract managers
who are less risk averse and, conditional on risk aversion, more talented. Starting with risk
aversion, we estimate the conditional correlation:
Ri = 'RIj +Xj!
R+Yi"R + (Rij (1)
where Ri is a measure of the manager risk aversion and Ij is the incentive policies index.
24

Throughout the empirical analysis, Xj includes the firm’s multinational status, employment
levels, and SIC2 industry codes. Yi includes the manager’s tenure, seniority level, whether
he belongs to the owner family, and his operational area (general administration, finance,
sales).34 Finally we add interviewers’ dummies and control for the duration of the interview
to account for potential noise in the measurement of the incentive policies.
Columns (1) and (2) of Table 2 estimate (1) for our measure of the manager own risk
preferences with and without the controls vectors Xj and Yi. Recall that our risk preference
measure — the probability of failure of the risky project the manager is willing to bear — is
inversely related to risk aversion. Columns (1) and (2) then show that risk tolerant managers
are more likely to be o!ered high powered incentives. The estimates of 'R are positive and
significantly di!erent from zero at conventional levels. Column (2) estimate implies that
one standard deviation increase in the index is associated with a 1.75 increase in the risk
preference measure, or 10% of a standard deviation of the risk tolerance measure.
It is important to note that the interpretation of the findings is qualitatively una!ected
if our measure captures the manager’s risk attitudes when he takes a decision on behalf of
his firm instead of his individual risk aversion parameter $j . If so, our measure e!ectively
captures bi$j , namely the portion of the risk taken by the firm that ends up to the manager
through his incentive scheme. Note that the finding that bi$j is smaller when bi is higher
implies a fortiori that $j is smaller when bi is higher.
In Columns (3) and (4) we define Ri directly as the manager’s own account of the risks
he takes on behalf of the firm using our second measure of the manager’s risk attitude. The
findings indicate that high powered incentives are associated with managers who take more
risks. The estimates in Column (4) show that one standard deviation increase of the index
is associated with a 0.17 increase in the risk measure, or 10% of its standard deviation.
As a complement to our measures of attitude towards risk, in Columns (5) and (6) we
regress the manager’s father education level, as a proxy for the availability of informal in-
surance through his family, on the incentive index. In line with the earlier results, we find
that managers whose fathers are better equipped to o!er insurance are matched to firms that
o!er steeper incentives. One standard deviation increase in the incentive index increases the
probability that the manager’s father has a college degree by 0.05 (30% of the sample mean).
34 On average, managers have 6.6 years of tenure (standard deviation is 3.6). Seniority is characteristic of
the standardized managerial contract. In our sample 7% have a lower management contract, 72% a middle
management contract, and 21% an upper management contract. Only 2.5% of our sample managers belong
to the family who owns the firm. Finally, by construction, managers are equally split between the three
operational areas.
25

The second part of Implication 1 indicates that, conditional on risk aversion, high powered
incentives attract more talented managers. To test this, in Table 3 we estimate the conditional
correlation:
Ti = 'T Ij + )
TRi +Xj!T +Yi"
T + (Tij (2)
where Ti are measures of the manager’s talent, Ri is the measure of the manager’s own risk
tolerance, and all the other variables are defined above. The findings in Table 3 provide broad
support to the prediction that “better” managers are attracted by steep incentives. For all
our measures of talent, 'T is positive and significantly di!erent from zero at conventional
levels. Namely, managers who work under high powered incentives are more likely to have a
college degree, to have attained executive education, and to be “desirable,” namely to have
received job o!ers from other firms in the last three years. Using the estimates with the full
set of controls, we find that one standard deviation increase in the incentive index increases
the probability that the manager has a college degree by 0.08 (16% of the unconditional
mean), that he has an executive education degree by 0.10 (18% of the mean), and that he has
received outside o!ers by 0.08 (17% of the mean). Finally, we note that there is a positive
correlation between firm size and managerial talent: larger firms are more likely to hire more
skilled managers. This is in line with the prediction of a large class of manager-firm matching
models, from Lucas (1978), to Rosen, (1982) and Terviö (2008).
4.2 Incentives and Managers’ Outcomes
Implication 2 links the firms’ incentive policies to managers’ e!ort, pay, and job satisfaction.
It predicts that, holding constant their risk tolerance, managers who are o!ered steeper
incentives work harder, receive higher fixed and variable pay, and have higher utility. To
provide evidence on this, Table 4 reports estimates of the conditional correlation:
Oi = 'OIj + )
ORi +Xj!O +Yi"
O + (Oij (3)
where Oi are our measures of managers’ outcomes and all the other variables are defined
above. Proxying e!ort by hours worked, Columns (1) and (2) show that managers who are
o!ered steeper incentives work longer hours. The estimate of 'O is positive, and statistically
and economically significant. One standard deviation increase in the incentive index is as-
sociated with a 0.06 increase in the probability that the manager works more than 60 hours
per week, which corresponds to 16% of the sample mean.
26

Columns (3) to (6) show that managers who are o!ered steeper incentives receive higher
fixed and variable pay. The estimates of 'O with the full set of firm and manager controls
indicate that one standard deviation increase in the incentive index is associated with an
increase of 2,900 euros in fixed pay and an even larger amount of 4,375 euros in variable
pay. These correspond to 10% and 25% of one standard deviation in fixed and variable pay,
respectively. Managers who are o!ered steeper incentives also receive a larger number of job
benefits. The estimates in Column (8) imply that one standard deviation increase in the
incentive index is associated with 0.24 more benefits, equal to 17% of a standard deviation
of the number of benefits in the sample.
Finally, to measure the managers’ level of utility we ask them to report their level of
satisfaction on the job. Only 5% report to be unsatisfied, while 45% is satisfied, and 50% is
very satisfied. Columns (9) and (10) show that managers who are o!ered steeper incentives
feel happier. According to the estimate in Column (10), one standard deviation increase in
the incentive index is associated with a 0.06 increase in the probability that the manager
reports to be very satisfied, which is as large as 12% of the sample mean.
4.3 Firm Ownership and Incentives
Implication 3 predicts that firms attaching a higher weight to direct control (F firms in our
notation) will tend to o!er a weaker link between reward and performance than N firms.
We exploit the di!erence between family firms and firms owned by disperse shareholders to
proxy for the F and N firms described in our model. In particular, our key assumption is
that families put more weight on direct control than shareholders of widely held firms, such
that %F < %N .
This choice is rooted in the family firms literature (discussed in the Introduction), which
documents how family-owners often perceive the firm as an opportunity to address family
issues and frictions . In this context, owners attribute a value to the firm as an “amenities
provider”, even though the provision of such amenities might not be profit maximizing (Kets
de Vries,1993). Alternatively, since the boundaries of the firm and those of the family are
less clearly defined in family-firms, the transfer of these amenities from the firm to the family
is more e"cient in family firms and thus more of these amenities are transferred. In either
case, %F < %N .
Unconditionally we find that family firms do o!er a weaker link between reward and
performance than dispersed shareholders firms. Family firms are less likely to o!er bonuses
based on individual performance (44% versus 57%), to have promotion fast tracks (32%
27

versus 41%), and to have dismissed managers for failure to meet performance targets (3%
versus 6%). Family firms are also less likely to award bonuses, decide on promotions, and
fire employees through a formal appraisal process and in all cases the gap between the two
types of firms is not only statistically significant (see last column) but also substantial. Only
performance seems to matter for promotions regardless of ownership.
In Table 5 we test whether these di!erences are robust to controlling for a rich set of
manager and firm characteristics, which might create a spurious correlation between firm
ownership and incentive policies. We estimate the conditional correlation:
Pij = *FDFj + *
oDoj +Xj# +Yi$ + "ij (4)
where Pij are the di!erent incentive policies adopted by firm j as reported by manager i,
DFj = 1 if firm j belongs to its founder or a family and 0 otherwise, DOj = 1 if the firm belongs
to the government, a cooperative or its managers and 0 otherwise. The coe"cient of interest
is *F , namely the di!erence in incentive policies between family-owned and dispersedly owned
firms, and Xj and Yi are the vectors of firm, manager, and interview controls defined above.
Table 5 shows that the di!erence in personnel policies between family firms and firms
owned by disperse shareholders are robust to the inclusion of this rich set of controls. The
first two columns estimate (4) for the aggregate index built as the sum of all seven policy
measures. Both in Columns (1) and (2) *F is negative and significantly di!erent from zero at
conventional levels. The magnitude of the coe"cient indicates that the di!erences between
family and dispersed shareholder firms are large: with the full set of controls the incentive
index is 0.51 points smaller in family compared to dispersedly owned firms. This di!erence
amounts to 18% of the sample mean and 30% of a standard deviation of the incentive index.
The remaining columns estimate (4) for the three subcomponent of the index: bonuses,
promotions, and dismissals. Throughout *F is negative and significantly di!erent from zero
at conventional levels, indicating that family firms choose low powered incentives on all
dimensions.
Table 5 also shows that high powered incentives are more likely to be o!ered by firms
that are part of multinational corporations. None of the other controls are correlated with
incentive policies. Namely, the strength of incentives is not correlated with firm size or
industry sector, or with the managers’ tenure, seniority, and operational area.
While the findings are consistent with Implication 3, and hence with the assumption
that family firms put more weight on the “amenity value” of control, "ij contains all other
unobservable characteristics that di!er by ownership and could be driving the results. For
28

instance, family firms might have a better monitoring technology and hence less need to
o!er performance incentives. We will discuss this and other alternative explanations in the
robustness section.
4.4 Incentives and Firms’ Outcomes
The final step of our analysis presents evidence on Implication 4, which suggests a positive
correlation between incentive policies and firm performance. Though, as said, our data does
not allow us to identify a causal relationship, we are nevertheless interested in establishing
whether the data are consistent with this model prediction.
In Table 6 we estimate the conditional correlation over a repeated cross section:
Zjt = !Ij +Xjt++ %t + ,jt (5)
where Zjt measures the performance of firm j in year t, %t are year fixed e!ects, and all other
variables are as defined above. We consider three alternative measures of firm performance
a) labour productivity (log of sales/employees); b) profits per employee; and c) return on
capital employed, all measured yearly for the period 2004 to 2007. To account for the fact
that error terms ,jt are correlated within firm across years we cluster the standard errors at
the firm level. Firm performance measures are obtained by matching our survey data with
Amadeus, an extensive accounting database covering more than 9 million public and private
companies across Europe, of which approximately 580,000 are in Italy.35 Once we clean the
accounting data dropping the first and the bottom percentiles of the performance variables
and taking into account missing observations for some items, we end up with a sample of 554
observations.36
The estimation results are reported in Table 6. Two points are worth of note. First, the
incentive index carries a positive coe"cient significant at conventional levels for all measures
of productivity. A one standard deviation increase in the incentive index is associated with
a 5%, 8%, and 9% of a standard deviation increase of log-productivity, profits, and return
on capital, respectively. Second, this finding is robust to controlling for ownership structure;
namely it is not merely due to the incentive index capturing systematic di!erences in per-
formance directly due to di!erent ownership structures. The estimates of the coe"cient on
family ownership is negative throughout but only precisely estimated for labor productivity.
Thus, once di!erences in the power of incentives are accounted for, we find no evidence of a
35 To match the two datasets we use the unique company identifier Codice Cerved.36 The results are qualitatively similar without these cleaning procedures.
29

systematic di!erence in profits between family and shareholder owned firms, a feature itself
in line with the implications of our model with endogenous firm entry.
5 Robustness and Alternative Interpretations
5.1 Unobserved Heterogeneity in Manager Characteristics
The residuals in (1),(2), and (3), contain unobservable manager characteristics that can gen-
erate a spurious correlation between the incentive index and the outcome of interest. This
concern is particularly serious in survey-data because unobservable psychological characteris-
tics of the respondent may lead to systematic mis-reporting. For instance, managers who are
more self-confident might be more likely to overestimate their control over their pay, hence
more likely to report facing high powered incentives, and at the same time more likely to take
risks and to overestimate their earnings. Unobservable self-confidence could therefore gener-
ate a spurious correlation between incentive power and risk tolerance, and between incentive
power and earnings.
We can probe the robustness of our survey data directly using social security records that
contain detailed information on the managers’ pay and occupation since the beginning of
their careers. Hence we can estimate (3) using the social security administrative earnings
data that are not a!ected by perception errors or other managers’ unobservable traits, which
could in turn contaminate self-reported variables. Table 7 reports the estimates of:
Qi = -Ij +Yi. + /i (6)
where Qi is the logarithm of manager i’s pay and the vector of controls Yi includes the
manager’s seniority level, whether he belongs to the owner family, his tenure in the current
firm and category (general administration, finance, sales), overall tenure since his first job,
the number of firms he has worked for, and the average number of weeks worked in a year,
duration of the interview and interviewer dummies. For comparison, columns (1) and (2)
report the estimate of (6) using pay data from the survey, whereas in Columns (3) and (4)
we use pay data from the social security records. Throughout - is positive and precisely
estimated. Moreover, the estimates of - obtained with our survey data or with the social
security records are quantitatively similar, reassuring us directly on the reliability of our
survey earnings and indirectly on our incentive index.
Since the social security records contain information on the managers’ entire careers, we
can further refine the evidence that incentive policies are matched to the managers’ type
30

by regressing managerial pay in previous jobs on current incentives. Under the plausible
assumption that managers’ risk attitudes and ability are stable traits one should find that a
given managers matches with firms that o!er similar types of incentive contracts. Consistent
with this, columns (5) and (6) show that managers who currently face high powered incentives,
had higher levels of pay throughout their career.
Furthermore, while the social security records do not contain information on the managers’
risk preferences, they allow us to measure earnings variability, which, by revealed preference,
is an indicator of the risk the manager is willing to bear. To provide further evidence on the
validity of our incentive measure, we exploit the time variation in earnings in the social secu-
rity records and test whether high powered incentives result in a higher earnings variability,
as they should if the managers who face steep incentives bear more risk in equilibrium.37 We
estimate the same specification as in (6) with the standard deviation of yearly pay computed
over the managers’ time at the firm on the left hand side. Columns (7) to (10) show that
earnings variability and the power of incentives are correlated: managers hired by firms that
o!er high powered incentives face more earnings variability, and have done so throughout
their careers. This is additional evidence in support of our matching model: throughout his
career, a bold, talented manager tends to be matched with firms that o!er steep incentives.
Finally, another potential concern is that our risk aversion measure is correlated with other
unobservable personal characteristics, which in turn may determine matching and incentive
preferences. While this hypothesis cannot be verified within our dataset, we can explore this
question using another survey of 2,295 Italian entrepreneurs and managers, which is focused
on the measurement of risk aversion (measured in the very same way used in this paper)
and its link with other managerial characteristics (Guiso and Rustichini 2010). In line with
our results, risk aversion is not statistically correlated with measures of cognitive ability.
Reassuringly, the risk aversion measure is also not statistically correlated with managerial
personality traits that could a!ect the matching process, such as optimism, confidence and
the ability sustain e!ort. On the other hand, we find evidence that our risk aversion measure
is correlated with actual risk taking behavior of managers outside their work environment.
Appendix 2 discusses data and results of the external validation analysis in more detail.
37 In our model, earnings variability can be computed directly. The realized wage variance is
V ar (w) = V ar!biyj
"=!bi"2$2.
Hence the realized standard deviation is linear in the power of the incentive contract faced by the manager.
31

5.2 Alternative Interpretations
Taken together our findings are consistent with the rich set of equilibrium correlations sug-
gested by the model outlined in Section 2. Incentive policies are correlated with the type
of managers hired in equilibrium: the strength of incentives is positively correlated with the
managers risk tolerance and with their talent. Incentive policies are also correlated with
managers’ e!ort, their compensation package, and their utility: managers who face stronger
incentives work harder, receive higher fixed and variable pay, and (not obviously) are happier.
Ownership type is correlated with incentive policies: compared to firms owned by disperse
shareholders, family firms o!er lower powered incentives. Finally, stronger incentives are
positively correlated with firm performance.
Although some of these results have been already observed in isolation in previous work,
this is the first time that specific personnel policies are analyzed in conjunction with such a
rich array of firm and manager characteristics. Compared to prior studies, this gives us the
unique opportunity to explore the validity of alternative theories that have been proposed in
the past, especially with regards to the understanding of the di!erence between family firms
and other types of ownership.
For example, similarly to what we show in Table 5, Bloom and Van Reenen (2007) re-
port that family owned firms are less likely to adopt "modern" management practices, which
include basic practices related to the provision of performance incentives and the adoption
of practices that promote and dismiss workers based on their performance. The absence of
detailed information on workers’ e!ort and characteristics, however, complicates the interpre-
tation of this finding. First, family firms may have a better monitoring technology, and hence
less need to o!er explicit performance incentives (Roe 2003, Mueller and Philippon 2006).
This would explain the observed correlation between ownership and incentives. A related
hypothesis is that family firms may have access to other technologies to motivate managers,
e.g. non-taxable benefits, and hence do not need to o!er explicit monetary incentives to
reward performance, so that e!ective performance is better rewarded even if incentives are
low.
Having data on all sides of the match, we are able to show that both hypotheses - the
family firm advantage in monitoring and motivating their employees - are actually not sup-
ported by the data. For example, if family firms were better at monitoring their employees,
this would imply a comparative advantage in incentive provision, which in turn would lead to
three conclusions, which are all falsified in the data. First, managers who face better monitor-
ing should work harder. To the extent that hours worked are a proxy for e!ort, the estimates
32

of (3) indicate that the opposite is true: managers who face weaker explicit incentives work
less hard.38 Second, better monitoring implies higher productivity. In a competitive labor
market, where firms are competing to hire managers, then more productive managers should
be paid more. The findings suggest that the opposite is true: both fixed and variable pay are
lower in family firms. Third, if e!ort and talent are complements in the production function
(as it is standard to assume), a comparative advantage in monitoring should translate in a
comparative advantage in employing talented managers. But the estimates of (2) suggest the
opposite: managers who face stronger incentives are more talented. Similarly, if family firms
were better at motivating their employees, we should observe low powered incentives to be
correlated with higher managerial talent and e!ort. The estimates of (2) and (3) indicate the
opposite.
As a further check, we investigate whether family firms might o!er flatter incentives as
they happen to be in sectors where managerial e!ort is less relevant. To shed light on this
hypothesis we estimate (4) without industry controls, then with SIC2 industry codes, and
finally with SIC3 industry codes. The estimated coe"cient of family ownership in the three
specifications is -.57, -.53, and -.59, significantly di!erent from zero at the 5% level. The fact
that the estimated coe"cient of family ownership remains constant as we add increasingly
fine industry controls rules out that family owned and widely held firms sort into di!erent
sectors. While it remains possible that firms sort within each three digit industry, for instance
di!erent types of beauty salons or dry cleaners, the extent to which the returns to managerial
e!ort can di!er within such narrowly defined groups is likely to be limited.
6 Conclusions
Personnel economics models produce an array of testable predictions on workers and firms
match, how firm characteristics drive incentive schemes, how incentives determine worker
behavior, and how worker behavior determines firm performance. Due to data limitations,
previous empirical work focused on individual predictions.
This paper has explored the potential of utilizing integrated personnel data, combining
information about the worker’s characteristics, the firm’s characteristics, and the terms of
the (implicit and explicit) contract linking the worker and the firm. A wide array of empir-
ical regularities can be accounted for by a simple model where incentives and matches are
endogenously determined.
38 Of course, one can always argue that the number of hours and weekends worked is not a good proxy of
e!ort.
33

The combination of novel and comprehensive data and a simple theory that features
widely shared heterogeneity in firms governance has allowed us to make progress along two
lines. First, we have showed the key relevance of manager’s willingness to bear risk as well
as talent as key factors in driving matching with firms. Highly talented and risk tolerant
managers tend to match with firms that value these characteristics the most. Second, we
have o!ered a unified account of several findings in the literature treated so far in isolation
and sometimes thought to be independent instead of stemming from the same problem.
References
[1] Ackerberg, Daniel A. and Botticini, Maristella. 2002. “Endogenous Matching and
the Empirical Determinants of Contract Form.” Journal of Political Economy, 110:564-
91.
[2] Aggarwal, Rajesh K. and Samwick, Andrew A. 1999. “The Other Side of the
Trade-O!: The Impact of Risk on Executive Compensation.” Journal of Political Econ-
omy, 107:65-105.
[3] Bandiera, Oriana; Guiso, Luigi; Prat, Andrea and Sadun, Ra!aella. 2008.
“Italian Managers: Fidelity or Performance?” Rodolfo De Benedetti FoundationWorking
Paper.
[4] Barsky, Robert B.; Juster, F. Thomas; Kimball, Miles S. and Shapiro,
Matthew D. 1997. “Preference Parameters and Behavioral Heterogeneity: An Ex-
perimental Approach in the Health and Retirement Study.” The Quarterly Journal of
Economics, 112 (2):537-79.
[5] Bennedsen, Morten; Nielsen, Kasper Meisner; Perez-Gonzalez, Francisco
and Wolfenzon, Daniel. 2007. “Inside the Family Firm: The Role of Families in
Succession Decisions and Performance.” Quarterly Journal of Economics, 122:647-91.
[6] Bertrand, Marianne and Schoar, Antoinette. 2003. "Managing with Style: The
E!ect of Managers on Firm Policies." Quarterly Journal of Economics, 118:1169-208.
[7] –—. 2006. “The Role of Family in Family Firms.” Journal of Economic Perspectives,
20:73-96.
[8] Besley, Timothy and Ghatak, Maitreesh. 2005. “Competition and Incentives with
Motivated Agents.” American Economic Review, 95:616-36.
34

[9] Black, Sandra E. and Lynch, Lisa M. 2001. “How to Compete: The Impact of
Workplace Practices and Information Technology on Productivity.” Review of Economics
& Statistics, 83:434-45.
[10] Bloom, Nicholas and Van Reenen, John. 2007. “Measuring and Explaining Man-
agement Practices across Firms and Countries.” Quarterly Journal of Economics, 122
(4):1351-408.
[11] Bonin, Holger; Dohmen, Thomas; Falk, Armin; Hu!man, David and Sunde,
Uwe. 2007. “Cross-Sectional Earnings Risk and Occupational Sorting: The Role of Risk
Attitudes.” Labour Economics, 14:926-37.
[12] Burkart, Mike; Panunzi, Fausto and Shleifer, Andrei. 2003. “Family Firms.”
Journal of Finance, 58:2167-202.
[13] Cai, Hongbin; Li, Hongbin; Park, Albert and Zho, Li-An. 2008. “Family Ties
and Organizational Design: Evidence from Chinese Private Firms.” Unpublished.
[14] Cannari, Luigi and D’Alessio, Giovanni. 2008. “Intergenerational Transfers in
Italy.” Bank of Italy Research Paper No. A9. http://ssrn.com/paper=1182562.
[15] Claessens, Stijn; Djankov, Simeon and Lang, Larry H. P. 2000. “The Separation
of Ownership and Control in East Asian Corporations.” Journal of Financial Economics,
58:81-112.
[16] Demsetz, Harold and Lehn, Kenneth. 1985. “The Structure of Corporate Owner-
ship: Causes and Consequences.” Journal of Political Economy, 93:1155.
[17] Dohmen, Thomas; Falk, Armin; Hu!man, David; Schupp, Juergen; Sunde,
Uwe and Wagner, Gert G. 2006. “Individual Risk Attitudes: New Evidence from a
Large, Representative, Experimentally-Validated Survey.” CEPR Discussion Paper No.
5517. http://ssrn.com/paper=906866.
[18] Eeckhout, Jan and Kircher, Philipp (2010). Identifying Sorting — In Theory. Review of
Economic Studies. Forthcoming
[19] Edmans, Alex and Gabaix, Xavier (2010). Risk and the CEO Market: Why Do
Some Large Firms Hire Highly-Paid, Low-Talent CEOs?” Mimeo, 2010.
[20] Faccio, Mara and Lang, Larry H. P. 2002. “The Ultimate Ownership of Western
European Corporations.” Journal of Financial Economics, 65:365-95.
35

[21] Francois, Patrick. 2007. “Making a Di!erence.” RAND Journal of Economics, 38:714-
32.
[22] Frederick, Shane. 2005. “Cognitive Reflection and Decision Making.” Journal of Eco-
nomic Perspectives, 19 (4):25-42.
[23] Friebel, Guido and Giannetti, Mariassunta. 2009. “Fighting for Talent: Risk-
Taking, Corporate Volatility, and Organisation Change.” Economic Journal, 119:1344-
73.
[24] Gabaix, Xavier and Landier, Augustin. 2008. “Why Has CEO Pay Increased So
Much?” Quarterly Journal of Economics, 123:49-100.
[25] Garicano, Luis and Hubbard, Thomas N. 2007“Managerial Leverage Is Limited
by the Extent of the Market: Hierarchies, Specialization, and the Utilization of Lawyers’
Human Capital.” Journal of Law & Economics, 50 (1):1-43.
[26] Gollier, Christian. 2004. The Economics of Risk and Time. Cambridge, MA: MIT
Press.
[27] Guiso, Luigi and Jappelli, Tullio. 2002. “Private Transfers, Borrowing Constraints,
and the Timing of Homeownership.” Journal of Money, Credit & Banking, 34:315-39.
[28] Guiso, Luigi and Paiella, Monica. 2008. “Risk Aversion, Wealth, and Background
Risk.” Journal of the European Economic Association, 6:1109-50.
[29] Guiso, Luigi and Rustichini, Aldo, 2010, “A contribution to understanding the size
and profitability of firms: The role of a biological factor”, University of Minnesota mimeo
[30] Hall Brian and Je!rey B. Liebman, 1998. "Are CEOs Really Paid Like Bureau-
crats?," The Quarterly Journal of Economics, MIT Press, vol. 113(3), pages 653-691,
August.
[31] Holt, C. A., S. K. Laury (2002): “Risk Aversion and Incentive E!ects,” American
Economic Review, 92(5), 1644—1655.
[32] Ichniowski, Casey and Shaw, Kathryn. 2003. “Beyond Incentive Pay: Insiders’
Estimates of the Value of Complementary Human Resource Management Practices.”
The Journal of Economic Perspectives, 17 (1):155-80.
36

[33] Ichniowski, Casey; Shaw, Kathryn and Prennushi, Giovanna. 1997.“The E!ects
of Human Resource Management Practices on Productivity: A Study of Steel Finishing
Lines.” The American Economic Review, 87 (3):291-313.
[34] Kets de Vries, M. F. R.. 1993. "The dynamics of family controlled firms:The good
and bad news", Organizational Dynamics, 21,3,59-71.
[35] Kimball, Miles S. 1993. “Standard Risk Aversion.” Econometrica, 61:589-611.
[36] La Porta, Rafael; Lopez-de-Silanes, Florencio and Shleifer, Andrei. 1999. “Cor-
porate Ownership around the World.” Journal of Finance, 54:471-517.
[37] Lazear, Edward P. 2005. “Output-Based Pay: Incentives or Sorting?” In Accounting
for Worker Well-Being, ed. S. W. Polachek, 1-25. Amsterdam; Boston: JAI.
[38] Lazear, Edward P. and Oyer, Paul. 2007. “Personnel Economics.”
National Bureau of Economic Research Working Paper Series No. 13480.
http://www.nber.org/papers/w13480.
[39] Lemieux, Thomas, MacLeod, Bentley and Daniel Parent, 2009. "Performance
Pay and Wage Inequality-super-," The Quarterly Journal of Economics, MIT Press, vol.
124(1), pages 1-49, February.
[40] Leslie, Phillip and Oyer, Paul. 2008. “Managerial Incentives and Value Creation:
Evidence from Private Equity.” National Bureau of Economic Research Working Paper
Series No. 14331. http://www.nber.org/papers/w14331.pdf.
[41] Lippi, Francesco and Schivardi, Fabiano. 2010. “Corporate Control and Executive
Selection” EIEF mimeo.
[42] Lucas, Robert E. Jr. 1978. “On the Size Distribution of Business Firms.” Bell Journal
of Economics, 9:508-23.
[43] Mueller, Holger M. and Philippon, Thomas. 2006. “Family Firms,
Paternalism, and Labor Relations.” NYU Working Paper No. CLB-06-019.
http://ssrn.com/paper=1291607.
[44] Oyer, Paul and Schaefer, Scott 2010 "Personnel Economics: Hiring and Incentives"
forthcoming in Handbook of Labor Economics, vol. 4, Ashenfelter and Card, eds,
37

[45] Pérez-González, Francisco. 2006. “Inherited Control and Firm Performance.” Amer-
ican Economic Review, 96:1559-88.
[46] Persico, Nicola, Andrew Postlewaite and Dan Silverman (2004), “The E!ect of
Adolescent Experience on Labor Market Outcomes: The Case of Height”, Journal of
Political Economy 112(5), pp. 1019-53
[47] Prendergast, Canice. 2002. “The Tenuous Trade-O! between Risk and Incentives.”
Journal of Political Economy, 110:1071-102.
[48] Roe, Mark J. 2003. Political Determinants of Corporate Governance: Political Context,
Corporate Impact. Oxford; New York: Oxford University Press.
[49] Rose, Nancy L. and Shepard, Andrea .1997. “Firm Diversification and CEO Com-
pensation: Managerial Ability or Executive Entrenchment?” The RAND Journal of
Economics, 28 (3):489-514.
[50] Rosen, Sherwin. 1982. “Authority, Control, and the Distribution of Earnings.” Bell
Journal of Economics, 13:311-23.
[51] Scheier MF, Carver CS, Bridges MW. (1994), "Distinguishing optimism from
neuroticism (and trait anxiety, self-mastery, and self-esteem): a reevaluation of the Life
Orientation Test," Journal of personality and Social Psychology, 67(6): 1063-78.
[52] Sraer, David and Thesmar, David. 2007. “Performance and Behavior of Family
Firms: Evidence from the French Stock Market.” Journal of the European Economic
Association, 5:709-51.
[53] Terviö, Marko. 2008. “The Di!erence That CEOs Make: An Assignment Model Ap-
proach.” American Economic Review, 98:642-68.
38

7 Appendix 1: Formal Result and Proofs
The model presented above yields the following equilibrium characterization:39
Proposition 1 Suppose that $̄ is su!ciently small. In equilibrium, N -firms and F -firmsuse contracts with slopes
b̂N&$j'=
%N1 + $j#
2
b̂F&$j'=
%F1 + $j#
2
Manager j is matched with an N -firm if and only if
!j "2 (&N # &F )%2N # %
2F
&1 + $j#
2'
(7)
and, if not, he is matched with an F -firm if and only if
!j "2&F
%2F
&1 + $j#
2'
(8)
where
&F =%2F&2 + $̄#2
'$̄
D!̄$̄
&N =%2N
&2 + $̄#2
'$̄ + %2F
&%2N # %
2F
'
D!̄$̄
WithD =
&%2F + %
2N
' &2 + $̄#2
'$̄ +
&2 + $̄#2
'2$̄2 + %2F
&%2N # %
2F
'
Proof. See Appendix.
Equation (7) is the condition that determines the boundary between the N -region and the
F -region. Similarly, (8) describes the boundary between the F -region and the unemployment
region. The proposition also provides precise expressions for the management-related equi-
librium payo!s &F and &N , which in turn pin down the region boundaries. It is immediately
visible that the management-related payo! is greater in N -firms than in F -firms, which — as
we discussed above — is due to the comparative advantage that N -firms have when it comes
to incentive provision.
The proof of Proposition 1 follows the informal discussion above, with the addition of a
somewhat laborious computation of the actual fixed point of the matching problem.
39 The technical condition that "̄ is su"ciently small (i.e. there is more heterogeneity in talent than in riskaversion) guarantees that the regions depicted in figure 1 are trapezoids rather than triangles. If the conditionfails, one would have a di!erent characterization but with similar properties.
39

7.1 Proof of proposition 1
Given the CARA assumption, if w is normally distributed, the manager’s expected payo!
can be written as
E [u] = E [w]#1
2$V [w]#
1
2x2.
Given a and b, the manager chooses x to maximize E (u):
x̂ = argmaxxE [w]#
1
2$V [w]#
1
2x2
= argmaxxa+ bE [y]#
1
2b2$V [y]#
1
2x2
= argmaxxa+ bE
(!!j (x+ ")
)#1
2b2$V
(!!j (x+ ")
)#1
2x2
= argmaxxa+ b
!!jx#
1
2b2$!j#
2 #1
2x2
The first-order condition on x yields
x̂j = bi!!j .
The manager’s expected payo! is hence
E [Uj ] = ai + bi!!j x̂#
1
2
&bi'2$j!j#
2 #1
2x̂2j
= ai +&bi'2!j #
1
2
&bi'2$!j#
2 #1
2
&bi'2!j
The expected payo! for a firm that employs manager j at wage (a, b) is
E$V i%= E
$yj # wij + h
g # ki%+&1# %g
' &"# bi!j
'
= bi!j # ai #&bi'2!j + h
g # ki +&1# %g
' &"# bi!j
'
Let Sij = E [Uj ] + E$V i%denote the total surplus generated by the match between firm i
and manager j. As the fixed component can be used to distribute the surplus between the
firm and the worker, it is easy to see that the firm will always want to maximize surplus and
pay the manager her reservation wage (determined in equilibrium by what he could get if he
worked for another firm).
The surplus is
Sij = E [Uj ] + E$V i%
=
"%gb
i #1
2
&1 + $#2
' &bi'2#!j +
&hg # ki +
&1# %g
'"'
Di!erentiating the surplus function with respect to bi we obtain the optimal contract slope:
bi =%g
1 + $j#2
40

Hence, the maximal surplus is
Sij =
*%g
%g1 + $j#
2#1
2
&1 + $#2
'" %g1 + $j#
2
#2+!j +
&hg # ki +
&1# %g
'"'
=1
2
%2g1 + $j#
2!j +
&hg # ki +
&1# %g
'"'
Restrict attention to the first term of Sij , which can be thought of as the management-related
component of the match surplus. It depends on %g. We let:
SF&!j , $j
'=
1
2
%2F1 + $j#
2!j
SN&!j , $j
'=
1
2
%2N1 + $j#
2!j
Next, we examine match stability. Note that, for all !j and $j ,
SN&!j , $j
'> SF
&!j , $j
'
Also, given !j " !k and $j % $k (with at least a strict inequality), the following three
inequalities hold
SN&!j , $j
'> SN (!k, $k)
SF&!j , $j
'> SF (!k, $k)
SN&!j , $j
'# SF
&!j , $j
'> SN (!k, $k)# SF (!k, $k)
Given two managers j and k with !j > !k and $j < $k, the following three statements are
always false (because they contradict, respectively, one of the three inequalities just stated —
a new match could be formed with a higher surplus):
• Manager k works for an N -firm and manager j is unemployed
• Manager k works for an F -firm and manager j is unemployed
• Manager k works for an N -firm and manager j works for an F -firm
This restricts the shape of the regions of manager types that work for N , F , or are
unemployed. It is easy to see that if $̄ is su"ciently small, the regions must be trapezes, as
in figure 1.
Note that we can write
SF&!j , $j
'= E [Uj ] + %F b
i!j # ai #&bi'2!j
SN&!j , $j
'= E [Uj ] + %Nb
i!j # ai #&bi'2!j
41

Perfect competition among firms means that all F -firms must have the same management-
related payo!
&F = %F bi!j # ai #
&bi'2!j
and all N -firms must have the same management-related payo!
&N = %Nbi!j # ai #
&bi'2!j
A manager j who is employed by an F -firm receives expected utility
uj = SF&!j , $j
'# &F
and every manager j that is employed by an N -firm receives utility
uj = SN&!j , $j
'# &N
The managers on the line that separates the F region from the unemployment region
receive their outside option: zero. Hence all the surplus goes to the firm
SF&!j , $j
'= &F
The managers on the line that separates the F region and theN region are indi!erent between
working for an N -firm and an F -firm. Hence
SN&!j , $j
'# &N = SF
&!j , $j
'# &F
These two indi!erence condition can be applied to the extreme cases: $j = 0 and $j = $̄,
yielding
SF (tF , 0) = &F
SF (sF , $̄) = &F
SN (tN , 0)# SF (tN , 0) = &N # &F
SN (sN , $̄)# SF (sN , $̄) = &N # &F
We can re-write the first four equations as
1
2%2F tF = &F
1
2
%2F1 + $̄#2
sF = &F
1
2%2N tN #
1
2%2F tN = &N # &F
1
2
%2N1 + $̄#2
sN #1
2
%2F1 + $̄#2
sN = &N # &F
42

That is
tF =2&F
%2F
sF =2&F
%2F
&1 + $̄#2
'
tN =2 (&N # &F )%2N # %
2F
sN =2 (&N # &F )%2N # %
2F
&1 + $̄#2
'
The area of the regions (trapezes) correspond to the mass of firms in business. Hence
(tF + sF ) $̄
2= !̄$̄ # nF # nN
(tN + sN ) $̄
2= !̄$̄ # nN
Then
&F
%2F
&2 + $̄#2
'$̄ = !̄$̄ # nN # nF (9)
&N # &F%2N # %
2F
&2 + $̄#2
'$̄ = !̄$̄ # nN (10)
Finally, the entry condition on F -firms implies that the expected payo! of the least
profitable F -firm (let’s call it ı̄) is zero:
E$V i%= E
$yj # wij + hF # k
i%+ (1# %F )
&"F # bi!j
'
= bi!j # ai #&bi'2!j + hF # ki + (1# %F )
&"F # bi!j
'
= &F + hF # kı̄ + (1# %F )"F = 0
implying
kı̄ = &F + hF + (1# %F )"F
As there are kı̄ F -firms with a lower k, the mass of active F -firms is
nF = &F + hF + (1# %F )"F
Similarly, the mass of active F -firms is
nF = &F
Hence (9) and (10) become
&F&2 + $̄#2
'$̄ = %2F
&!̄$̄ # &N + hN + (1# %N )"# &F # hF # (1# %F )"
'
(&N # &F )&2 + $̄#2
'$̄ =
&%2N # %
2F
' &!̄$̄ # &N
'
43

Let GF = hF + (1# %F )"F , H =&2 + $̄#2
'$̄, F & %2F and N & %2N # %
2F . Then,
&FH = F&!̄$̄ # &N # &F #GF
'
(&N # &F )H = N&!̄$̄ # &N
'
with solution
&F = FH!$ # (H +N)GF
2FH + FN +HN +H2
&N =FH!$ + FN!$ +HN!$ # FHGF
2FH + FN +HN +H2
which can be written as
&F =%2F&2 + $̄#2
'$̄ #
&2 + $̄#2 + %2N # %
2F
'GF
D!̄$̄
&N =%2F&2 + $̄#2
'$̄!̄$̄ + %2F
&%2N # %
2F
'!̄$̄ +
&2 + $̄#2
'$̄&%2N # %
2F
'!̄$̄ # %2F
&2 + $̄#2
'$̄GF
D%2F&%2N # %
2F
'!̄$̄ + %2N
&2 + $̄#2
'!̄$̄2 # %2F
&2 + $̄#2
'$̄GF
D
With
D = 2FH + FN +HN +H2
= 2%2FH + %2F&%2N # %
2F
'+H
&%2N # %
2F
'+H2
= %2FH + %2F&%2N # %
2F
'+ %2NH +H2
= %2F&2 + $̄#2
'$̄ + %2N
&2 + $̄#2
'$̄ +
&2 + $̄#2
'2$̄2 + %2F
&%2N # %
2F
'
=&%2F + %
2N
' &2 + $̄#2
'$̄ +
&2 + $̄#2
'2$̄2 + %2F
&%2N # %
2F
'
7.2 Proof of implication 1
Manager j is characterized by talent !j and risk aversion $j . An increase in the risk-aversion
coe"cient $j leads to a decrease in
b̂i&$j'=
%g1 + $j#
2,
both because!g
1+"j#2 is decreasing in $j and because, for $j large enough, the value of b̂
i&$j'
jumps from !N1+"j#
2 down to!F
1+"j#2 .
The contract slope b̂i is non-decreasing in !j : while!g
1+"j#2 does not depend on !j , for !j
large enough, the value of b̂i&$j'jumps from !F
1+"j#2 up to
!N1+"j#
2 .
44

7.3 Proof of implication 2
For (a), note that the manager’s e!ort is x̂j = bi!!j . Hence, it is positively correlated to
bi both directly and indirectly (because, by implication 1 the contract slope is positively
correlated with !j).
Part (b) is immediate as the (expected) variable compensation is bix̂j . Hence, it is in-
creasing in bi both directly and indirectly (through x̂j , as per (a)).
It is useful to show (d) before (c). The proof relies on a revealed preference argument.
Consider two employed managers with the same risk-aversion coe"cient $, but di!erent
talent levels: !"" > !". In equilibrium, the first manager has contract (a"", b"") while the second
receives (a", b"). We already know that b"" " b", but we cannot say anything about the fixed
part.
The two managers have respectively expected utilities
U "" = a"" +&b""'2!"" #
1
2
&b""'2$!""#2 #
1
2
&b""'2!""
U " = a" +&b"'2!" #
1
2
&b"'2$!"#2 #
1
2
&b"'2!"
If the !""-manager were o!ered contract (a", b") and exerted the same e!ort as the other
manager, he would still have a higher utility because he is more productive. By a revealed
preference argument, if the manager chooses to work for a firm that o!ers contract (a"", b"")
and chooses a higher level of e!ort, he must get a utility level that is at least as high.
For (c), consider the same two managers as in point (d) and note that U "" " U " implies
that the di!erence between the expected total compensation of the two managers can be
written as:,a"" +
&b""'2!""-#,a" +
&b"'2!"-
""1
2
&b""'2$!""#2 +
1
2
&b""'2!""##"1
2
&b"'2$!"#2 +
1
2
&b"'2!"#
=1
2
&$#2 + 1
' ,&b""'2!"" #
&b"'2!"-
" 0
7.4 Proof of implication 4
As we saw in the proof of proposition 1, in equilibrium all F -firms have the same management-
related payo! &F and all N -firms have the same management-related payo! &N .
Recall that management-related payo! is defined as
&g = %gbi!j # ai #
&bi'2!j
Hence, if &g is constant and the direct-control part of the payo!, namely #&bi'2!j , becomes
more negative, the profit part %gbi!j # ai must increase.
45

8 Appendix 2: Risk Aversion Measures: External Validation
In this section we provide some support for the risk aversion measure we use, in order to
address the main concerns that it raises: that it may reflect attributes that we do not observe
and cannot control for, which happen to be correlated with the matching between the manager
and the firm. We have already provided evidence that elicited risk attitudes are unlikely
to reflect skills, as measured by educational attainment. In this section we use an external
validity test in order to support our contention that answers to our lottery measures do indeed
reflect risk preferences of the entrepreneurs and not other potentially matching-relevant traits.
To this end, we rely on a sample of 2,295 Italian entrepreneurs and managers who par-
ticipated in the Ania Survey on Small Companies, conducted in 2008 using face to face
interviews. This survey targeted the CEO of the company, and elicited a large number of
relevant traits including measures of risk attitudes and abilities. A detailed description of
the data is available in Guiso and Rustichini (2010).
The managers were asked the exact same investment lottery question that we employ in
this paper, i.e. they were asked to reveal their preferences over a lottery. The average level
of the risk tolerance indicator is 20.06 which is very similar to the one in our sample; the
standard deviation is 26.6, a bit larger than that in our sample. The Ania survey also provides
additional measures of business relevant personality traits and ability: a) optimism; b) an
indicator of (over)confidence; c) an index of obstinacy and will power; and d) a measure of
ability to sustain enduring e!ort. Additionally, the survey provides a rich set of information
on managers’ physical traits and job experience. Finally, matching may be related to some
dimension of personal connections, which could in turn be correlated with risk attitudes. For
instance, firms may have a preference for a manager born in the same area where the firm
is located. If there is a systematic relation between place of birth and risk preferences, our
correlations may reflect matching on networking and not on risk preferences. We test this
hypothesis including dummies for the region where the manager was born.
In this appendix we analyze the correlation between our risk aversion measures and these
additional variables. The results of these regressions, controlling also for CEOs demograph-
ics and education (a dummy for college degree), are shown in Table A2. Risk tolerance is
decreasing in age and higher for males, a pattern that has been found in many other studies
of risk attitudes (e.g. Barsky et. al. (1999); Dohmen et. al. (2009)). Reassuringly, other
measures of managerial ability which could in principle be relevant for the matching mech-
anism are in fact uncorrelated with risk aversion. For example, job experience, measured
by the number of years the CEO has been in control of the firm and the year he started
46

working, is uncorrelated with risk tolerance. We also do not find evidence of any statistical
correlation between our measure of risk aversion and CEO height (which has been found to
capture economic success by Persico et al 2004), whether the manager was the firstborn and
whether the father was an entrepreneur (proxying for inherited entrepreneurial ability). We
cannot reject the hypothesis that region of birth fixed e!ects have some explanatory power -
we cannot reject them being jointly equal to zero - but their size is small.
The second column adds to the specification the grade obtained by the manager at the
end of the secondary school (Esame di Maturità), a possibly more precise proxy for cognitive
ability which we do not have in our main sample (since some managers have not completed the
secondary school the sample size is slightly smaller). Even this more sophisticated measure
of cognitive ability turns out not to be correlated with risk attitudes.
In the third column we include as additional regressors the managerial personality traits
described above. Three of the four measures — optimism, confidence and ability to sustain
e!ort — are not statistically correlated with risk tolerance. The only variable that appears
to be correlated with our measure of risk preferences is obstinacy. CEOs that do not give
up easily when faced with an unanticipated problem are more risk tolerant. In so far this
attitude is important in the matching mechanism, our measure of risk preferences captures
it as well. On the other hand, obstinacy may be regarded as a dimension of a person risk
attitudes, in so far as being less afraid of obstacles because of a high persistence, one is also
more prepared to take risks.40
Finally, the Ania survey allows us to verify whether the elicited measure of risk tolerance
is able to capture actual risk taking behavior even outside the manager’s workplace, using
information on the portfolio allocation of their private wealth. Table A3 shows the results of
a probit regressions, where the dependent variable is a dummy for whether the CEO has any
stock of listed companies — an indicator of willingness to take extra risk in addition to those
involved in managing the firm (and owning shares of private business wealth). Measured
risk tolerance is strongly and positively correlated with stock ownership, suggesting that our
lottery question is indeed capturing managerial preferences for risk. Interestingly, obstinacy
has no predictive power once we control for risk attitudes.
40The obstinacy indicator is based on the following question: "If you are trying to achieve an objective andall of the sudden you are faced with an obstacle, would be give up as the first di"culties show up or wouldyou never give up? Provide your answer on a scale between 0 and 10, with 10 meaning that you would nevergive up and zero that you would give up immediately.
47

!"#$%&'()'*+,&+-.&'"+/&0)
!"#$"%&$'()*$+'
123&45'',-$'!"#$"%&$'!".$/'!0'#)1(23$.'40'3-$'021')5'0$&$"'()6!#7'!".!#43)+08',-$0$'4+$'$9246'3)':'!5''3-$+$'!0'4';)"20';40$.')"'!".!&!.246')+'3$41'($+5)+14"#$'<;)"20':=>''!5'3-$';)"20'!0';40$.')"'5)+146'4((+4!0460'<;)"20'?=>'!5'3-$'@+1'-40'5403'3+4#A0'5)+'034+'($+5)+1$+0'<(+)1)%)"':=>'!5'(+)1)%)"0'.$($".'')"'($+5)+14"#$'<(+)1)%)"'?=>'!5'(+)1)%)"0'4+$';40$.')"'5)+146'4((+4!0460'<(+)1)%)"'B=>'!5'14"4C$+0'*$+$'@+$.'!"'3-$'6403'B'7$4+0'.2$'3)'())+'($+5)+14"#$'<@+!"C':=>'!5'3-$'.$#!0!)"0'3)'.!01!00'!0';40$.')"'5)+146'4((+4!0460'<@+!"C'?=8''

!"#$%&'&(&)*+,&-."+"/0$+*12/1 341 5$"# 5$6*"# 70"#6"+6&8$9*"2:#
!"#$%&'()*+,-.(/0+12+,13#4$% 567 689: 6 68;6!"#$%&'()*+<(4$/0+=$/4 567 6876 6 6895!"#$%&'()*+!>'$% 567 68?7 6 689?@(A$*+B$>"$$#+;6+-#4+C66+$.)/10$$& 567 68?6 6 68?:@(A$*+1D$%+C66+$.)/10$$& 567 689C 6 689EF3/G#-G1#-/+HIC+(2+J%.+(&+-+&3B&(4(-%0+12+-+.3/G#-G1#-/K 567 68;L C 689EM%143NGD(>0+HO+C666+P@QK ;9: C:?68C9 LE;8L6 ?7C6896M%1J>&+HO+C666+P@QK ;5C :98E6 7?8?E C5E8L6R!ST ;9C C:869 C;8:C ?7875!"#$%&;&(&<#/$#29$&!:%*/*$1 341 5$"# 5$6*"# 70"#6"+6&
8$9*"2:#U1#3&+4$)$#4++1#+>$-.+1%+(#4(D(43-/+)$%21%.-#N$+HB1#3&+CK 567 68;6 C 68;6U1#3&+B-&$4+1#+21%.-/+-))%-(&-/&+HB1#3&+?K 567 6877 6 689:V'$+J%.+'-&+2-&>+>%-NW&+21%+&>-%+)$%21%.$%&+H)%1.1G1#+CK 567 687: 6 689LM%1.1G1#&+4$)$#4++1#+)$%21%.-#N$+H)%1.1G1#+?K 567 68:9 C 6899M%1.1G1#&+B-&$4+1#+21%.-/+-))%-(&-/&+H)%1.1G1#+7K 567 6879 6 689:F-#-X$%&+J%$4+(#+>'$+/-&>+7+0$-%&+43$+>1+)11%+)$%21%.-#N$+HJ%(#X+CK 567 686; 6 68??Q$N(&(1#&+>1+4(&.(&&+B-&$4+1#+21%.-/+-))%-(&-/+HJ%(#X+?K 567 68?7 6 689?Y#N$#GD$+Y#4$O+H@3.+-N%1&&+D-%(-B/$&+/(&>$4+(#+M-#$/+UK 567 ?8;5 ?866 C8:9
!"#$%&-&(&5"#"=$+&-."+"/0$+*12/1 341 5$"# 5$6*"# 70"#6"+6&8$9*"2:#
8$,:=+">.*/1ZX$ 567 958EL 95 :8C?[$#4$%+HCI.$#K 567 68E6 C 6876
?*1@&"#6&<#1A+"#/$R(&W+)%$2$%$#N$&+H(#D$&>.$#>+/1\$%0K 567 ?6875 ?6 CL8E9R(&W+N'1(N$&+ 567 ;8:6 5 C8:9,->'$%+'-&+S1//$X$+Q$X%$$ 567 68C5 6 687:
B"%$#0S1//$X$+Q$X%$$ 567 68;6 C 68;6TO$N3GD$+T43N-G1# 567 68;5 C 68;6F-#-X$%+'-&+%$N$(D$4+1]$%&+1D$%+)-&>+7+0$-%& 567 68:C C 6895!"#$%&8&(&5"#"=$+&3A0/:,$1 341 5$"# 5$6*"# 70"#6"+6&
8$9*"2:#<1%W&+56+1%+.1%$+'13%&+)$%+"$$W 567 687: 6 689L,(O$4+)-0+HT3%1&+O+<$$WK 567 CE678:6 C5L?8: ;5L8?^-%(-B/$+)-0+HT3%1&+O+<$$WK 567 ?EE856 ?C587 7?;85_3.B$%+12+B$#$J>& 567 98?6 9 C87LF-#-X$%+(&+D$%0+&-G&J$4+-B13>+'(&+`1B+HIC+(2+0$&K 567 68;6 6 68;6
!"#$%&#'()*%&+',"(-.%/+'#"01V1>-/+)-0a+N3%%$#>+J%.a+/-&>+-D-(/-B/$+0$-%+HT3%1&+O+<$$WK ;:? CL768C6 C5;L8: L::876ZD$%-X$+>1>-/+)-0a+-//+)-&>+J%.&+-#4+0$-%&+HT3%1&+O+<$$WK ;?: ;LL8E6 ;?C8E 7?987b$-%/0+&>-#4-%4+4$D(-G1#+12+)-0a+N3%%$#>+J%. 9CE 997876 7778E ;?58LLZD$%-X$+0$-%/0+&>-#4-%4+4$D(-G1#+12+)-0a+-//+J%.&+-#4+0$-%& 95; ??C85E C;E8: ?L?895
B"4%$&C&(&7A,,"+D&70"212/1
E:0$1F&&Z//+D-%(-B/$&+-%$+2%1.+>'$+F-#-X$%Y>-/(-+&3%D$0a+"(>'+>'$+$ON$)G1#+12+M%143NGD(>0a+M%1J>&+-#4+R!STa+2%1.+ZFZQTP@+-#4+S1.)$#&-G1#+4->-+(#+M-#$/+Q+2%1.+Y_M@+H@1N(-/+@$N3%(>0K+%$N1%4&8+!>'$%+1"#$%&'()+(#N/34$&*+X1D$%#.$#>+1"#$4a+N11)$%-GD$&a+.-#-X$%+1"#$4+-#4+J%.&+1"#$4+B0+-+X%13)+12+)%(D->$+(#4(D(43-/&8+M%143NGD(>0+(&+4$J#$4+-&+1)$%-G#X+%$D$#3$&+1D$%+>'$+#3.B$%+12+$.)/10$$&8+M%1J>&+-%$+4$J#$4+-&+$-%#(#X&+B$21%$+(#>$%$&>&+-#4+>-O-G1#++1D$%+>'$+#3.B$%+12+$.)/10$$&8+R!ST+(&+4$J#$4+-&+1)$%-G#X+(#N1.$+1D$%+N-)(>-/+$.)/10$48+V'$+#3.B$%+12+1B&$%D-G1#&+21%+@1N(-/+@$N3%(>0+%$N1%4&+D-%(-B/$&+(&+&.-//$%+43$+>1+.(&&(#X+D-/3$&8+V'$+/-&>+-D-(/-B/$+0$-%+(&+?669+21%+:;c+12+>'$+&-.)/$a+?66;+21%+?8;ca+?665+21%+?8;c+-#4+?66:+21%+>'$+%$.-(#(#X+?6c8+V'$+-D$%-X$+JO$4+N1.)$#&-G1#+(&+N1.)3>$4+1D$%+-//+0$-%&+-#4+J%.&+>'$+.-#-X$%+'-&+"1%W$4+21%+H(#N/34(#X+#1#d.-#-X$%(-/+)1&(G1#&K8+V'$++&>-#4-%4+4$D(-G1#+(&+N1.)3>$4+1#/0+(2+>'$+.-#-X$%+'-&+"1%W$4+21%+->+/$-&>+7+0$-%&+(#+>'$+&-.$+J%.8+

!"#$%&'&(&&)*+%*,-%.&"*/&01.2&
)*+%*,-%&)*/%3 !"#$#%% !"&#&%% !"''(%%% !"'!!%% !"!)(%%% !"!)(%%*!"+)(, *!"+#', *!"!+), *!"!+#, *!"!!&, *!"!'!,
456 -!"'./ -!"!!. -!"!'&*'"#.), *!"'$', *!"!($,
78(988&%:;$<=%%. -!"$#$ !"'+$ !"!+/*)"'#/, *!")!&, *!"!+$,
988>&%:;$<=%%. )"+!/ !"!&( !"!)'*)")!!, *!"'#$, *!"!($,
?<*.@"*@ '#"'+'%%% $/"&/(%%% $"+'#%%% ."#'/%%% !"'!!%%% -!"'$'*'"('/, *#"&/!, *!"'(), *'"'/', *!"!)., *!"))/,
A#.%B-",<*. $!( $!( $!( $!( $!( $!(?<*@B<$. 01 234 01 234 01 234
01.2C&)*/1-1/D"$&EB%F%B%*+%
01.2C&G1B:&)*-%.@:%*@&?H<1+%.
)*F<B:"$&)*.DB"*+%C&G"@H%BI.&6/D+",<*
0153467819:45745;<=;>=73>>1>47?<7@;>3<5A34?4"77%%%7*%%,7*%,7?<=?B;53474?C<?DB;<B37;575A37'EF7.EF7;<=7'!E7G3H3GF7>34@3BIH3GJ"7K1<5>1G47?<BG:=375A37L;<;C3>M4743<?1>?5J7G3H3GF77NA35A3>7A3793G1<C475175A371N<3>7O;L?GJF7A?4753<:>37;<=7B;53C1>J7*C3<3>;G7;=L?<?45>;I1<F7D<;<B3F74;G34,F7?<=?B;51>47O1>75A37D>LM47PQK7)7B1=34F7=:>;I1<71O75A37?<53>H?3N7;<=7?<53>H?3N3>7=:LL?34"778?4R7@>3O3>3<B37?475A37@>19;9?G?5J71O7O;?G:>375A37L;<;C3>7?47N?GG?<C751793;>75177BA11437;7>?4RJ7?<H345L3<57@>1S3B575A;57J?3G=47'!7L?GG?1<73:>147?O74:BB344O:G7;<=7!7?O7<15F7?<453;=71O7;74;O37@>1S3B575A;57J?3G=47'7L?GG?1<7N?5A7B3>5;?<5J"78?4R7BA1?B347?475A3743GO7>3@1>53=7>?4R?<34471O7?<H345L3<57BA1?B3471<793A;GO71O75A37D>L71H3>;7;7'-'!74B;G3"77T;5A3>M47U=:B;I1<73V:;G47'7?O75A37L;<;C3>M47O;5A3>7A;47;7B1GG3C37=3C>33F7!715A3>N?43"7

!"#$"%&$'!"($) !"!#$%%% !"!#&%%% !"!'!%%% !"!$!%%% !"!$!%%% !"!#&%%%(!"!)*+ (!"!)&+ (!"!))+ (!"!)&+ (!"!)!+ (!"!)*+
*+,-'./$0$/$"#$ !"!!) !"!!) !"!!) !"!!) !"!!*%%% !"!!*%%(!"!!)+ (!"!!)+ (!"!!)+ (!"!!)+ (!"!!)+ (!"!!)+
123 ,!"!)& !"))-%% !"!)#(!"!#.+ (!"!#-+ (!"!##+
456755'$89:;<$$, !"!'! !"!/- ,!"!!&(!"!'!+ (!"!')+ (!"!$.+
755='$89:;<$$, !")!!% !")).%% !"!'&(!"!$*+ (!"!$)+ (!"!#$+
>;",?@"? !"&'!%%% !"&!) !"&-!%%% !"!.* !"$&*%%% )"##!%%%(!"!#!+ (!"&!!+ (!"!#!+ (!"&-)+ (!"!&-+ (!"&).+
AB,$/&@%;", '!& '!& '!& '!& '!& '!&>;"?/;:, 01 234 01 234 01 234
C@B:$'D'6''!"#$"%&$,'@"('1@"@E$/'C@:$"?
1@"@E$/'>;::$E$'F$E/$$'GH7'+0'<$,I
1@"@E$/'3)$#J%&$'3(J#@%;"'GH7'+0'<$,I
F$,+/@B+:+?<'GH7'+0'1@"@E$/'K@,'/$#$+&$('L;B';M$/,'+"'
9@,?'?K/$$'<$@/,I
0153467819:45745;<=;>=73>>1>47?<7@;>3<5A34?4"77%%%7(%%+7(%+7?<=?B;53474?C<?DB;<B37;575A37)EF7$EF7;<=7)!E7G3H3GF7>34@3BIH3GJ"7K1<5>1G47?<BG:=375A37L;<;C3>M4743<?1>?5J7G3H3GF7NA35A3>7A3793G1<C475175A371N<3>7O;L?GJF7A?4753<:>37;<=7B;53C1>J7(C3<3>;G7;=L?<?45>;I1<F7D<;<B3F74;G34+F7?<=?B;51>47O1>75A37D>LM47PQK7*7B1=34F7=:>;I1<71O75A37?<53>H?3N7;<=7?<53>H?3N3>7=:LL?34"778?4R7@>3O3>3<B37?475A37@>19;9?G?5J71O7O;?G:>375A37L;<;C3>7?47N?GG?<C751793;>7517BA11437;7>?4RJ7?<H345L3<57@>1S3B575A;57J?3G=47)!7L?GG?1<73:>147?O74:BB344O:G7;<=7!7?O7<15F7?<453;=71O7;74;O37@>1S3B575A;57J?3G=47)7L?GG?1<7N?5A7B3>5;?<5J"77

!"#$"%&$'!"($) !"!#$%%% !"!#&%%% !"!'#%%% !"!##%% !"!&$%%% !"!'(%%% !")$!%%% !")#$%%% !"!#!%%% !"!#&%%%*!"!))+ *!"!)#+ *!"!)#+ *!"!)&+ *!"!!,+ *!"!!(+ *!"!#)+ *!"!#$+ *!"!))+ *!"!)#+
*+,-'./$0$/$"#$ -!"!!! -!"!!! !"!!. !"!!#%% !"!!#%%% !"!!#%%% !"!!. !"!!. !"!!) !"!!!*!"!!)+ *!"!!)+ *!"!!)+ *!"!!)+ *!"!!)+ *!"!!)+ *!"!!#+ *!"!!#+ *!"!!)+ *!"!!)+
123 -!"!$! !"!)( !"!/#%%% !".!( -!"!.!*!"!'&+ *!"!&!+ *!"!./+ *!")./+ *!"!'/+
456755'$89:;<$$, -!"!'. !")''%% !"!#$ !"!/# -!"!.(*!"!&/+ *!"!$,+ *!"!#/+ *!")&&+ *!"!$!+
755='$89:;<$$, !"!/#% !")&/%%% !"!!/ !"!&$ -!"!#'*!"!&!+ *!"!&,+ *!"!##+ *!")#(+ *!"!&'+
>;",?@"? !".(&%%% -!".$# )",&.%%% !"/&&%%% !")!.%%% !")&' #",'&%%% ,"!//%%% !"'!)%%% )"'/(%%%*!"!#/+ *!".&/+ *!"!',+ *!".(,+ *!"!.'+ *!")(/+ *!"))!+ *!"($.+ *!"!')+ *!"#&/+
AB,$/&@%;", $!# $!# $!# $!# $!# $!# $!# $!# $!# $!#>;"?/;:, 01 234 01 234 01 234 01 234 01 234
2C8B$/';0'D$"$E?,
F@B:$'G'6'!"#$"%&$,'@"('1@"@H$/'D$I@&+;/
J;/-,'8;/$'?I@"'K5'I;C/,'9$/'L$$-
M+)$('.@< N@/+@B:$'.@<O;B',@%,0@#%;"'PQ7'+0'
&$/<'I@99<R
0153467819:45745;<=;>=73>>1>47?<7@;>3<5A34?4"%%%7*%%+7*%+7?<=?B;53474?C<?DB;<B37;575A37)EF7&E7F;<=7)!E7G3H3GF7>34@3BIH3GJ"7K1<5>1G47?<BG:=375A37L;<;C3>M4743<?1>?5J7G3H3GF7NA35A3>7A3793G1<C475175A371N<3>7O;L?GJF7A?4753<:>37;<=7B;53C1>J7*C3<3>;G7;=L?<?45>;I1<F7D<;<B3F74;G34+F7?<=?B;51>47O1>75A37D>LM47PQK7.7B1=34F=:>;I1<71O75A37?<53>H?3N7;<=7?<53>H?3N3>7=:LL?34"778?4R7@>3O3>3<B37?475A37@>19;9?G?5J71O7O;?G:>375A37L;<;C3>7?47N?GG?<C751793;>7517BA11437;7>?4RJ7?<H345L3<57@>1S3B575A;57J?3G=47)!7L?GG?1<73:>147?O74:BB344O:G7;<=7!7?O7<15F7?<453;=71O7;74;O37@>1S3B575A;57J?3G=47)7L?GG?1<7N?5A7B3>5;?<5J"77

!"#$%&'&(&)*+,&-./%+01*2&"/3&4%+05//%$&45$*6*%0
)",*$7&5+&)58/3%+&-./%+01*2 !"#$%"&&& !"#'()&&& !"#()(&&& !"#*)+&& !"#('"&&& !"#*,)&& !"#**+&& !"#*'(&&&-"#*$%. -"#*+$. -"#")(. -"#"+%. -"#"+). -"#*"". -"#"%). -"#"''.
-91%+&-./%+01*2 !"#("/ !"#(%" !"#"$/ !"#"'* !"#**+ !"#*", !"#"(* !"#"+"-"#*,%. -"#(*$. -"#"+'. -"#",). -"#*"/. -"#**$. -"#"'$. -"#"$%.
:;< "#+/$&&& "#%*)&&& "#/",&&& "#**"&&-"#*',. -"#")(. -"#"+$. -"#"%).
'=(>==&%,2$57%%0 !"#((" !"#"$" !"#"', !"#*"(&-"#*,,. -"#",". -"#*"). -"#"',.
>==?&%,2$57%%0 !"#"/' "#"*+ "#"() !"#"+"-"#*)(. -"#")). -"#",(. -"#"'".
@5/09"/9 (#,*"&&& "#*,$ "#,)+&&& !"#/"/ *#',"&&& "#/%$ "#/%/&&& "#*'/-"#*(,. -(#''$. -"#"'$. -*#*%,. -"#"$+. -*#/)'. -"#"/). -"#)'(.
-#0%+A"B5/0 $"/ $"/#"" $"/ $"/ $"/ $"/ $"/ $"/@5/9+5$0 01 234 01 234 01 234 01 234
C5/80&D/3%E 4+5,5B5/0&D/3%E F*0,*00"$&&D/3%ED/6%/BA%&D/3%E
015346#718945:45;<=;>=:3>>1>4:?<:@;>3<5A34?4#:&&&:-&&.:-&.:?<=?B;534:4?C<?DB;<B3:;5:5A3:*EF:'E:;<=:*"E:G3H3GF:>34@3BIH3GJ#:KA3::?<B3<IH3:?<=3L:?4:5A3:49M:1N:;GG:43H3<:?<B3<IH3:@1G?B?34:G?453=:?<:O;<3G:PF:K;8G3:*#:KA3:81<94:?<=3L:?4:5A3:49M:1N:!"#$%&:;<=:!"#$%':F:;4:=3D<3=:?<:K;8G3:*#:KA3:@>1M1I1<4:?<=3L:?4:5A3:49M:1N:()"*"+"#&,-()"*"+"#',-()"*"+"#./-KA3:=?4M?44;G:?<=3L:?4:5A3:49M:1N:0)1#2&,-0)1#2'/-:Q1<5>1G4:?<BG9=3:5A3:M;<;C3>R4:43<?1>?5J:G3H3GF:SA35A3>:A3:83G1<C4:51:5A3:1S<3>:N;M?GJF:A?4:53<9>3:;<=:B;53C1>J:-C3<3>;G:;=M?<?45>;I1<F:D<;<B3F:4;G34.F:?<=?B;51>4:N1>:5A3:D>MR4:TUQ:(:B1=34F:=9>;I1<:1N:5A3:?<53>H?3S:;<=:?<53>H?3S3>:=9MM?34#::

!"#$%&'()*+,&-.''(/ 01-23()*+,&-.''( 4-5' !"#$%&'()*+,&-.''(/ 01-23()*+,&-.''( 4-5'
6"5'"78'96":'; !"!##$ %"&!&$$ '"'()$$ !"!*($ %"+(%$$ '"++)$$,!"!+*- ,*"%'%- ,!")%#- ,!"!+*- ,*"%!)- ,!")%)-
<%+=&.9-19<->":'19?@"'1(A=, .!"++'$$ .')"#!& !"/)&,!"'!!- ,'*"!)'- ,+"'/'-
?3A'19?@"'1(A=, .!"!(+ .+&"#(&$ .'"+*/,!"'+'- ,'#"('&- ,+"//*-
BC* !"!)/ '+")*& .*"!%#$ .!"!'' ("&%% .+"%!/,!"!(!- ,'!")%(- ,'"%&#- ,!"!(*- ,'!"&*#- ,'"('%-
DEFGEE9'+,&-.''( !"')* #+"&'&$$$ &"/*#$$$ !"')# #*"*#)$$$ &"/&/$$$,!"'!(- ,'*"'&+- ,+"**#- ,!"'!(- ,'*"'**- ,+"*+(-
GEEH9'+,&-.''( !"%#&$$$ %%"*!)$$$ )"#&'$$ !"%+%$$$ %%"'/#$$$ )"&+/$$,!"''/- ,'/"*)(- ,+"#+%- ,!"''(- ,'/"*''- ,+"#*&-
I-"(3%"3 ("(+%$$$ &)"*!( .'+"!'( ("/''$$$ &)")!) .''"/%!,!"*&)- ,)!"!+%- ,%"&+&- ,!"*)&- ,)!"*%&- ,%"(**-
?J('18%7-"( '('* '()' '%/+ '('* '()' '%/+C>+J'19-K921+( ))% )&( )&% ))% )&( )&%I-"31-&( 012 012 012 012 012 012
L%J&'9MF96"5'"78'(N9?@"'1(A=,9%":90'1K-1+%"5'
345126"7849:25725;<=;>=71>>4>27?@:251>1=7;575A17B>C7@1D1@7E<7F;>1<5A12E2"$$$7,$$-7,$-7E<=E?;51272EG<EB?;<?17;575A17'HI7)H7I;<=7'!H7@1D1@I7>12F1?JD1@K"77LA17<:C91>74M74921>D;J4<27D;>E127=:175475A17=EN1>1<57;D;E@;9E@E5K74M75A17F1>M4>C;<?17C1;2:>12"7O<7;@@7?4@:C<27P17=>4F75A1754F7;<=794Q4C7'H77B>C27>;<R1=79K7F1>M4>C;<?1"77S4<5>4@27E<?@:=17E<=E?;54>27M4>75A17B>CT27UOS7+7?4=12I7=:>;J4<74M75A17E<51>DE1P7;<=7E<51>DE1P1>7=:CCE12"777

!"#$%&'(&)*+%*,-%.&"*/&0"*"1%23"$&4"5&678+3"$&7%+923:5&;":"<6=< 6>< 6?< 6@< 6A< 6B< 6'< 6C< 6D< 6=E<
;%F%*/%*:&G"23"#$%
7:",.,+.&+8HF9:%/&8-%2
)*+%*,-%&)*/%I !"!#!$$$ !"!%&$$$ !"!%#$$$ !"!%%$$$ !"!%'$$$ !"!()$$ !"!)*$$$ !"!##$$ !"!#&$$ !"!+!$$,!"!!'- ,!"!!&- ,!"!**- ,!"!*!- ,!"!*#- ,!"!*%- ,!"!.*- ,!"!.#- ,!"!.(- ,!"!.&-
0JK !"!.) !"!%# !"!&&$ !"!*& !"!.&,!"!((- ,!"!(+- ,!"!#+- ,!"!&*- ,!"!&%-
AE(=EE&%HF$85%%. !"!'($$ !"**+$$ !"!%+ !"!'# !"!(*,!"!%*- ,!"!%#- ,!"!)#- ,!"**.- ,!"**'-
=EEL&%HF$85%%. !"!&)$$$ !"!#+ !"!%( !"!#& !"!+),!"!(+- ,!"!('- ,!"!#+- ,!"!&'- ,!"*!*-
M8*.:"*: )"#*!$$$ +")+#$$$ )"(!%$$$ +"%&'$$$ +"*!.$$$ +"!.)$$$ #"+.+$$$ #"..*$$$ %"&.%$$$ %")%*$$$,!"!.#- ,!".'*- ,!"!(*- ,!".+*- ,!"!%+- ,!"%%+- ,!"!+*- ,!"'')- ,!"!+'- ,*"*+'-
N#.%2-",8*. #). #). #). #). #.) #.) %*& %*& %+# %+#
M8*:28$. /0 123 /0 123 /0 123 /0 123 /0 123
$*64"5<&792-%5&;":"
M922%*:&O32H
$*64"5<&)J47&P%+82/. $*67:"*/"2/&;%-3",8*&4"5<
M922%*:&O32H(Q".:&R-"3$"#$%&S%"2
R-%2"1%&8-%2&F".:&T8#.
M922%*:&O32HR-%2"1%&8-%2&F".:&
T8#.
/04235"6708934634:;<:=<62==0=36>;6?:=2;4@23>3"$$$6,$$-6,$-6>;<>A:42363>B;>CA:;A26:464@26*DE6#DE6:;<6*!D6F2G2FE6=23?2AHG2FI"66J@26;9K82=60L60832=G:H0;36>363K:FF2=6<926406K>33>;B6G:F9236>;64@26M0A>:F6M2A9=>4I6=2A0=<3"6J@26F:346:G:>F:8F26I2:=6>36.!!%6L0=6)#D60L64@263:K?F2E6.!!#6L0=6."#DE6.!!+6L0=6."#DE6:;<6.!!)6L0=64@26=2K:>;>;B6.!D"6J@26:G2=:B26A0K?2;3:H0;6>;6A0F9K;36,#-6:;<6,+-66>36A0K?942<60G2=6:FF6I2:=36:;<6C=K364@26K:;:B2=6@:36N0=O2<6L0=6,>;AF9<>;B6;0;PK:;:B2=>:F6?03>H0;3-"6J@2634:;<:=<6<2G>:H0;6>;6A0F9K;36,)-6:;<6,'-6>36A0K?942<60G2=64@26I2:=36N0=O2<6>;64@26A9==2;46C=K"6J@26<2?2;<2;46G:=>:8F26>;6A0F9K;36,&-6:;<6,*!-6>36A0K?942<6:364@26K2:;60L64@2634:;<:=<6<2G>:H0;360L6I2:=FI62:=;>;B36>;6:FF64@26C=K364@26K:;:B2=66@:36N0=O2<6L0="6QFF634:;<:=<6<2G>:H0;36:=26A0K?942<60;FI6>L64@26K:;:B2=6@:36N0=O2<6L0=6:46F2:346(6I2:=36>;64@263:K26C=K"66R0;4=0F36>;AF9<2564@26K:;:B2=S3632;>0=>4I6F2G2FE6N@24@2=6@2682F0;B364064@260N;2=6L:K>FI60L64@26A9==2;46C=KE6@>3642;9=26>;64@26A9==2;46C=K6:;<6A:42B0=I6,B2;2=:F6:<K>;>34=:H0;E6C;:;A2E63:F23-E60G2=:FF642;9=263>;A26@>36C=346T08E64@26;9K82=60L6C=K36@26@:36N0=O2<6L0=E6:;<64@26:G2=:B26;9K82=60L6N22O36N0=O2<6>;6:6I2:=E6<9=:H0;60L64@26>;42=G>2N6:;<6>;42=G>2N2=6<9KK>23"666

!"#$%&'(&)"*+$%&)%$%,-./0"/%$&'1&234*&56"4",7%438-,8!"#$%&'()*+,&-).-/-01-0&'2,"%,$3-'-45,3)'6'%7'&8-'9"+'%)'%0'&8-'),+/3-:';'#&8-"<%)-
=#>'?(+/3#@+-0&A B;C;DE B;C;F6 B;C;DF B;C;DD?;C;EFA ?;C;EGA ?;C;EFA ?;C;EFA
=#>'?H,3-)I(+/3#@--)A B;C;EJ?;C;DDA
!"#9&)I(+/3#@--) B;C;;;?;C;;;A
KLM( B;C;;6?;C;;6A
L$)-"2,*#0) NN;; NEOG NDOP NE;EQ%+-'!-"%#1 E;;FBE;;J E;;FBE;;J E;;FBE;;J E;;FBE;;JR5+$-"'#7'S%"+)'%0'!#/53,*#0 6GG; 6GG; 6GG; 6GFPR5+$-"'#7'S%"+)'%0'H,+/3- NG; NG; NG; NNJH%TE'15++%-) @-) @-) @-) @-)U-,"'15++%-) @-) @-) @-) @-)
0"/%$&91&:"/";%4&56"4",7%438-,8!"#$%&'()*+,&-).-/-01-0&'2,"%,$3-'-45,3)'6'%7'&8-'9"+'%)'%0'&8-'),+/3-:';'#&8-"<%)-
=#>'?V>-A B;C6FP B;C;PJ ;CE;N ;C6ON ;C6DO?;CEE;A ?;CEEJA ?;CEDJA ?;CEDPA ?;CEPNA
W-01-"'?6X+-0A ;C6FN ;C6F6 ;C6P6Y ;C6P6Y ;CEE6Y?;C;PPA ?;C;PPA ?;C6;6A ?;C6;6A ?;C66NA
=#>'?&-05"-'%0'T5""-0&'9"+A B;C;DE B;C;EO B;C;D; ;C;;;?;C;DNA ?;C;DNA ?;C;DNA ?;C;JOA
=#>'?T5""-0&'/,@A B;CEPOYYY B;CEOGYYY B;CEEDY?;C;JEA ?;C;JDA ?;C6EOA
=#>'?+-,0'@-,"3@'/,@'>"#<&8A B;C;FG B;C;NE?;C;GNA ?;C;ODA
=#>'?)&,01,"1'1-2%,*#0'#7'/,@A B;C;GO?;C;JPA
L$)-"2,*#0) 6JD6 6JD6 6JD6 6JD6 6EPNR5+$-"'#7'Z,0,>-")'%0'!#/53,*#0 6JD6 6JD6 6JD6 6JD6 6EPNR5+$-"'#7'Z,0,>-")'%0'H,+/3- NJE NJE NJE NJE F6P
R#&-)['YYY'?YYA'?YA'%01%T,&-)')%>0%9T,0T-',&'&8-'6\:'N\',01'6;\'3-2-3:'"-)/-T*2-3@C'K#$5)&')&,01,"1'-""#")'T35)&-"-1',&'&8-'9"+'3-2-3'%0'/,"-0&8-)%)C'Q8-'05+$-"'#7'9"+)'%)'3#<-"'&8,0'&8-'/#/53,*#0'<-'),+/3-1'7"#+'?6O6NA'15-'&#'+%))%0>'2,35-)'%0'&8-'$,3,0T-')8--&'1,&,C'
R#&-)[C'K#$5)&')&,01,"1'-""#")'%0'/,"-0&8-)%)CYYY'?YYA'?YA'%01%T,&-)')%>0%9T,0T-',&'&8-'6\:'N\',01'6;\'3-2-3:'"-)/-T*2-3@C''Q8-'05+$-"'#7'#$)-"2,*#0)'?6JD6A'%)')+,33-"'&8,0'&8-'05+$-"'#7'+,0,>-")'<-'),+/3-1'7"#+'?6O6NA'15-'&#'+%))%0>'2,35-)'%0'&8-'H#T%,3'H-T5"%&@'"-T#"1)C'Q-05"-'%)'&8-'05+$-"'#7'@-,")'&8-'+,0,>-"'8,)'$--0'<#"]%0>'7#"'&8-'T5""-0&'9"+C'M5""-0&'/,@'%)'-45,3'&#'&#&,3',005,3'/,@'1%2%1-1'$@'<--])'<#"]-1'%0'E;;FC'Z-,0'@-,"3@'/,@'>"#<&8'-45,3)'&8-'+-,0'@-,"3@'T8,0>-'%0'/,@')%0T-'&8-'+,0,>-"^)'9")&'_#$'50*3'E;;FC'Q8-')&,01,"1'1-2%,*#0'#7'/,@'%)'T#+/5&-1'#2-"'&8-'@-,")'<#"]-1'%0'&8-'T5""-0&'9"+'%7'&8-'+,0,>-"'8,)'<#"]-1'7#"',&'3-,)&'D'@-,")C'''
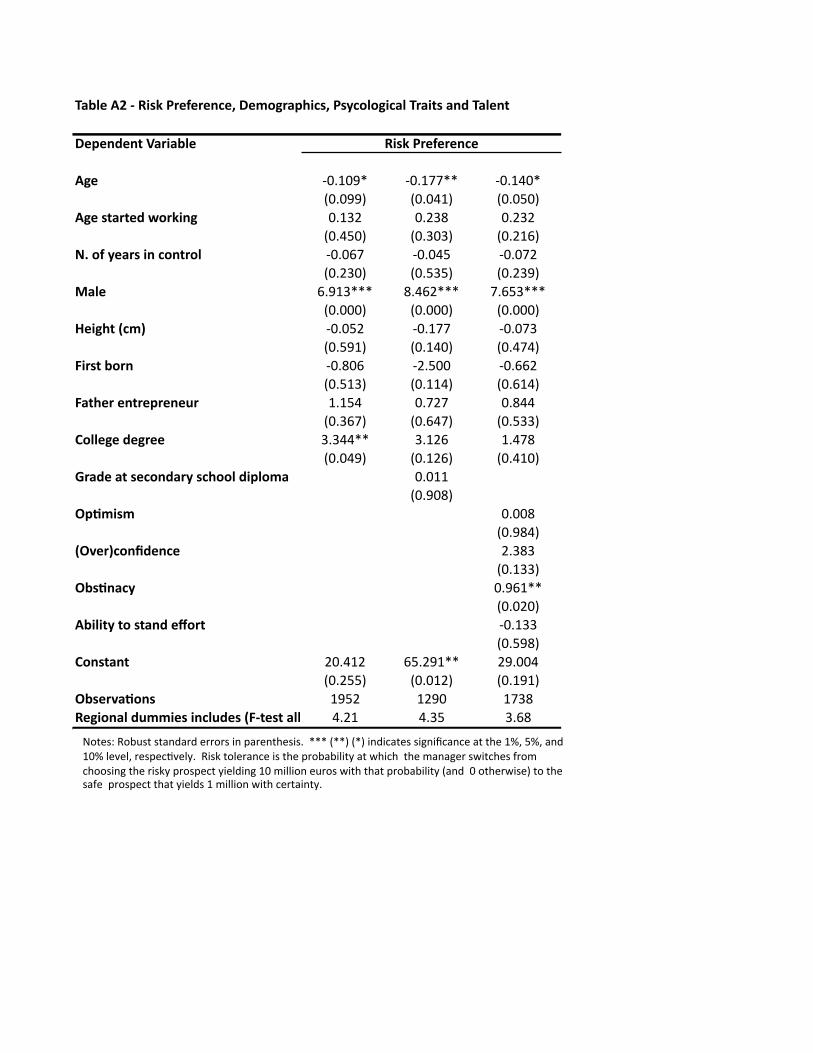
!"#$%&'(&)&*+,-&./%0%/%12%3&4%567/"89+2,3&.,:26$67+2"$&!/"+;,&"1<&!"$%1;
4%8%1<%1;&="/+"#$%
'7% !"#$"%& !"#$''&& !"#$("&)"#"%%* )"#"($* )"#"+"*
'7%&,;"/;%<&>6/-+17 "#$,- "#-,. "#-,-)"#(+"* )"#,",* )"#-$/*
?@&60&:%"/,&+1&261;/6$& !"#"/' !"#"(+ !"#"'-)"#-,"* )"#+,+* )"#-,%*
A"$% /#%$,&&& .#(/-&&& '#/+,&&&)"#"""* )"#"""* )"#"""*
B%+79;&C25D !"#"+- !"#$'' !"#"',)"#+%$* )"#$("* )"#('(*
E+/,;/1 !"#."/ !-#+"" !"#//-)"#+$,* )"#$$(* )"#/$(*
E";9%/&%1;/%8/%1%F/ $#$+( "#'-' "#.(()"#,/'* )"#/('* )"#+,,*
G6$$%7%&<%7/%% ,#,((&& ,#$-/ $#('.)"#"(%* )"#$-/* )"#($"*
H/"<%&";&,%261<"/:&,2966$&<+8$65" "#"$$)"#%".*
I8J5+,5& "#"".)"#%.(*
CIK%/D261L<%12% -#,.,)"#$,,*
I#,J1"2: "#%/$&&)"#"-"*
'#+$+;:&;6&,;"1<&%M6/;& !"#$,,)"#+%.*
G61,;"1; -"#($- /+#-%$&& -%#""()"#-++* )"#"$-* )"#$%$*
I#,%/K"J61, $%+- $-%" $',.*%7+61"$&<F55+%,&+12$F<%,&CE);%,;&"$$&%NF"$&;6&O%/6D&(#-$ (#,+ ,#/.
*+,-&./%0%/%12%
0123456718942642:;<:=<63==1=46>;6?:=3;2@34>4#66&&&6)&&*6)&*6>;<>A:23464>B;>CA:;A36:262@36$DE6+DE6:;<6$"D6F3G3FE6=34?3AHG3FI#667>4J621F3=:;A36>462@36?=18:8>F>2I6:26K@>A@662@36L:;:B3=64K>2A@346M=1L6A@114>;B62@36=>4JI6?=14?3A26I>3F<>;B6$"6L>FF>1;639=146K>2@62@:26?=18:8>F>2I6):;<66"612@3=K>43*62162@364:M366?=14?3A262@:26I>3F<46$6L>FF>1;6K>2@6A3=2:>;2I#6

!"#$%&'(&)*+,",-+"$&&.+/0&!"0+,1&",2&.+/0&34%5%4%,-%
6%7%,2%,8&9"4+"#$%
.+/0&8:$%4",-% !"!!#$$$ !"!!#$$$%!"!!!& %!"!!!&
'1% !"!!'$$ !"!!($%!"!#(& %!"!)*&
'1%&/8"48%2&;:40+,1 !"!!' !"!!+%!"'#!& %!"#((&
<=&:5&>%"4/&+,&-:,84:$& !"!!# !"!!#%!"()(& %!"'#'&
?"$% !"!'( !"!'#%!"(#'& %!"(,(&
@%+1A8&B-CD !"!!( !"!!(%!"#*#& %!"(#!&
*+4/8&#:4, -!"!!! !"!!)%!"*.'& %!".#+&
*"8A%4&%,84%74%,%E4 !"!(' !"!#'%!"(('& %!")+(&
F:$$%1%&2%14%% !"!.*$$$ !"!,,$$%!"!!!& %!"!#'&
G7HC+/C& -!"!!(%!"/),&
BGI%4D-:,J2%,-% !"!(/%!"(+,&
G#/H,"-> !"!!.%!"(#+&
'#+$+8>&8:&/8",2&%K:48& !"!!(%!").)&
G#/%4I"H:,/ #*)( #/'.
*+,",-+"$&.+/0&!"0+,1
0123456718942642:;<:=<63==1=46>;6?:=3;2@34>4"66$$$6%$$&6%$&6>;<>A:23464>B;>CA:;A36:262@36#DE6)DE6:;<6#!D6F3G3FE6=34?3AHG3FI"66J>;:;A>:F6=>4K62:K>;B6>46:6<9LLI63M9:F6216#6>N62@36L:;:B3=6@:46421AK461N6F>423<6A1L?:;>346>;6@>46?3=41;:F6?1=O1F>16834><3461P>;B6:;I6421AK61N6@>46C=L6"67>4K621F3=:;A36>462@36?=18:8>F>2I6:26P@>A@662@36L:;:B3=64P>2A@346N=1L6A@114>;B62@36=>4KI6?=14?3A26I>3F<>;B6#!6L>FF>1;639=146P>2@62@:26?=18:8>F>2I6%:;<66!612@3=P>43&62162@364:N366?=14?3A262@:26I>3F<46#6L>FF>1;6P>2@6A3=2:>;2I"66