national broadband deployment approach: new zealand
TRANSCRIPT
National Broadband Deployment Approach: New Zealand
WIK ConferenceNational Strategies for Ultrabroadband Infrastructure
Deployment: Experiences and Challenges
Radisson Blu Hotel, Berlin 26-27 April 2010
Dr Kris FunstonDeputy Chief EconomistEconomic Services BranchNew Zealand Commerce Commission
2
Acknowledgement and Disclaimer
• Any views expressed in this presentation are my own, and are not necessarily shared by the New Zealand Commerce Commission.
• I would like to acknowledge the helpful contributions of Dr Ross Patterson, Anthony Morris, Sharoon Abas, Stephen Hudson, Reto Bleisch from the Commerce Commission, Dr Rob Albon from the ACCC, Sean Mosby from the Ministry of Economic Development, and Crown Fibre Holdings.
• I am solely responsible for the contents.
3
Introduction• AIM: An overview of broadband in NZ, with particular focus on the Govt
initiative to accelerate roll out of Fibre-to-the-Premises (FTTP) Ultra-Fast Broadband (UFB) network (100/50Mbps) to 75% New Zealanders.
• Structure:(i) Overview of NZ Market(ii) Developments facilitating Broadband Market from 2004-Present(ii) Recent Performance of NZ Broadband Market(iii) Govt UFB Investment Initiative- Objective, Ownership Structure, Financing Arrangements, Services Supplied,
Regulatory/Governance Arrangements(iv) Rural Broadband(v) Willingness to Pay?(vi) Private v Public Investment in Broadband(vii) Future Challenges
1. Overview of NZ Market• New Zealand. Key Statistics:
Population approx 4.3 million
2008/09 Telecommunications Industry revenue over $6bn (€3.19bn), Investment $1.69bn (€ 0.9bn) Telecom New Zealand invested $1.21bn (€0.64bn)
4
Fixed Line Market- 1.87 million fixed lines, $2.82bn (€1.50bn) revenues in 2008/09 - Telecom New Zealand nationwide fixed line network , 76% revenues 2008/09 - TelstraClear competing cable access network Wellington and Christchurch- Five smaller fixed line operators (including Vodafone) with core networks
Mobile Market- 4.7 million mobile connections, $1.92bn (€1bn) mobile retail revenue in 2008/2009 - Until recently Telecom CDMA network vs Vodafone GSM network- 2009, Telecom launched 3G GSM network & new entrant 2degrees
Summary- NZ small country with limited intermodal competition.- Only in 2009 that 3 MNOs compete using same technology

2. Developments Facilitating Broadband in NZ
Operational Separation Undertakings agreed between Telecom and Government 31 March 2008:FTTN build, 10-20 Mbps to 80% of New Zealanders by Dec 2011.3,600 new cabinets & 2,500 km of new fibre.Total Investment of NZ$1.4bn (€0.74bn) by Chorus.
Sub Loop decision
Commission regulatory powers enhanced. Key features:Telecom operationally separated 3 units –Access (Chorus), Wholesale & Retailintroduction of unbundled copper & sub loop regulation; removal of speed constraint on bitstream service;backhaul services regulation.
Minister accepted Commission recommendation not to unbundle local loop. Telecom agreed to achieve wholesale targets. Bitstream service regulated with capped upstream speed 128 kbps.
NZ slipped behind OECD peers in broadband. Telecom not met wholesale targets.
Govt stocktake of sector
2004
2005
2006
2007
2008
2009
Telecommunications Act reform
Unbundled local loop & Bitstream service decision
Govt proposed FTTP network & Regional Broadband Initiative
2001 Telecommunications Act 2001
6
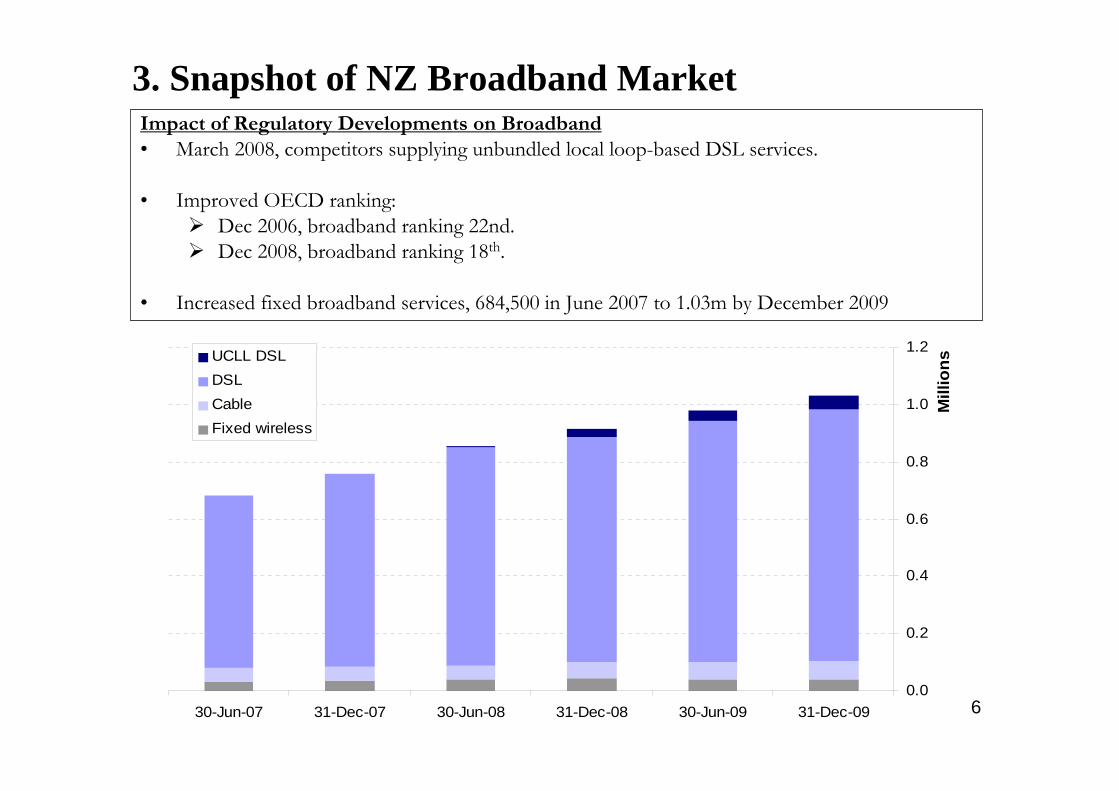
3. Snapshot of NZ Broadband MarketImpact of Regulatory Developments on Broadband• March 2008, competitors supplying unbundled local loop-based DSL services.
• Improved OECD ranking:Dec 2006, broadband ranking 22nd. Dec 2008, broadband ranking 18th.
• Increased fixed broadband services, 684,500 in June 2007 to 1.03m by December 2009
0.0
0.2
0.4
0.6
0.8
1.0
1.2
31-Dec-0930-Jun-0931-Dec-0830-Jun-0831-Dec-0730-Jun-07
Mill
ionsUCLL DSL
DSLCableFixed wireless
7
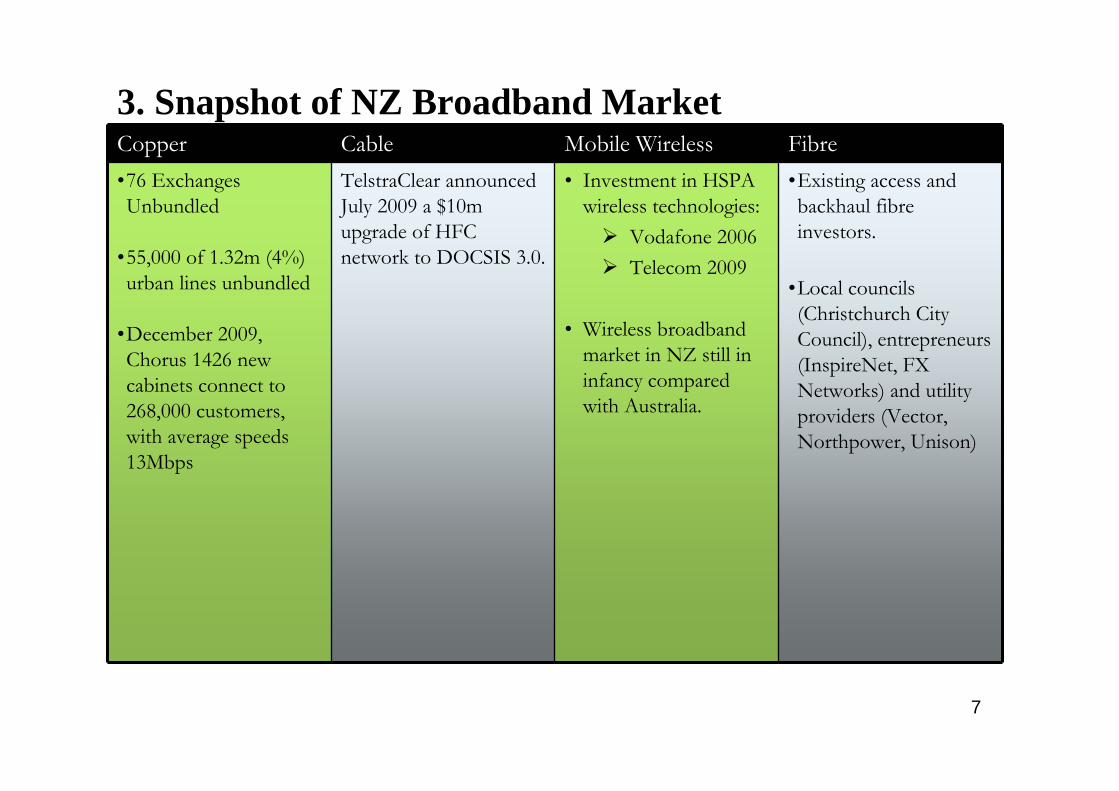
3. Snapshot of NZ Broadband MarketCopper Cable Mobile Wireless Fibre•76 Exchanges Unbundled
•55,000 of 1.32m (4%) urban lines unbundled
•December 2009, Chorus 1426 new cabinets connect to 268,000 customers, with average speeds 13Mbps
TelstraClear announced July 2009 a $10m upgrade of HFC network to DOCSIS 3.0.
• Investment in HSPA wireless technologies:
Vodafone 2006 Telecom 2009
• Wireless broadband market in NZ still in infancy compared with Australia.
•Existing access and backhaul fibre investors.
•Local councils (Christchurch City Council), entrepreneurs (InspireNet, FX Networks) and utility providers (Vector, Northpower, Unison)
8
3. Snapshot of NZ Broadband Market
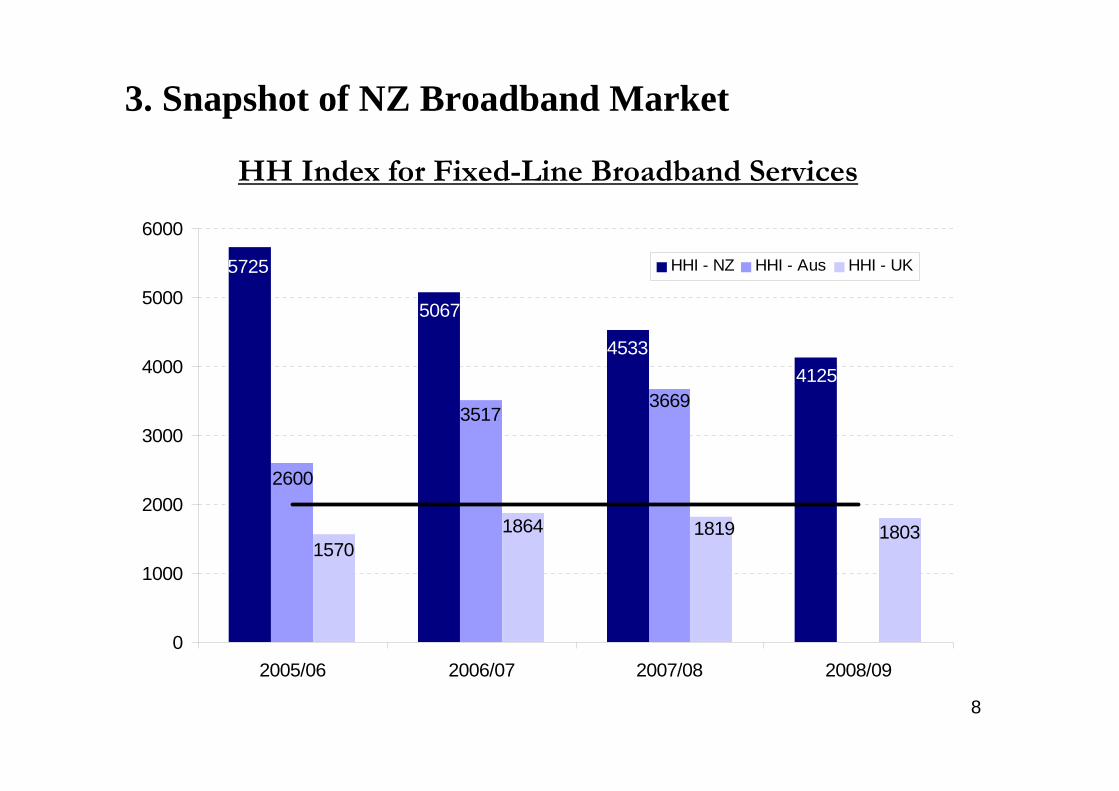
HH Index for Fixed-Line Broadband Services
41254533
5067
5725
2600
35173669
1803181918641570
0
1000
2000
3000
4000
5000
6000
2005/06 2006/07 2007/08 2008/09
HHI - NZ HHI - Aus HHI - UK

4. Ultra Fast Broadband (UFB) in NZ
• Nov 2008, National Government elected –election promise to build a UFB network.
• March 2009, NZ Govt Broadband Investment Initiative announced. (See www.med.govt.nz)
• UFB critical for growth of NZ economy. Proposed $1.5bn (€0.79bn) Govt funding.
• Estimated cost UFB network NZ$3-6bn (€1.58-3.16bn).
• Expectation funding matched by private sector investor/s chosen through tenders.
• Making significant contribution to growth
• Not crowding out private sector investment
• Avoid entrenching or lining pockets existing suppliers
• Avoid excessive duplication
• Focus on new infrastructure investment vspreservation of legacy assets
• Ensuring affordable broadband
UFB Principles
ObjectiveTo accelerate roll-out of UFB (i.e. 100Mbps/50mbps) to 75% New Zealanders over 10 years concentrating in the first 6 years priority to business, schools, health services plus greenfielddevelopments and certain tranches of residential areas
UFB Funding Plan
Acknowledged tension between principles –most controversial avoiding access duplication.

10
4. UFB in NZ - Outstanding Issues
Other issues:Demand Initiative – government to encourage public sector, particularly health and education, to use fibre networkComplementary Measures – facilitating access to poles and passive infrastructure such as ducts to build UFBRural Broadband Initiative – deals with remaining population
• Demand-side analysis, in terms of consumer willingness to pay for UFB services, not addressed.

11
4. Ownership Structure of UFB Investment
• LFC operates as infrastructure carrier
• LFC not allowed to be retailer or, if LFC does own and operate retail business:Is required to divest its retail arm; orA 49% cap on shareholding of partner, or smaller representation on LFC Board imposed
CFH –wholly owned Crown company
Partner
LFC
Strategic Partnership Agreement
• Network Investment managed by “Crown Fibre Holdings”(CFH) – driven by Government objective
• Manages tender process
• Monitors LFCs performance
• Private investor/s chosen through competitive tender process
12
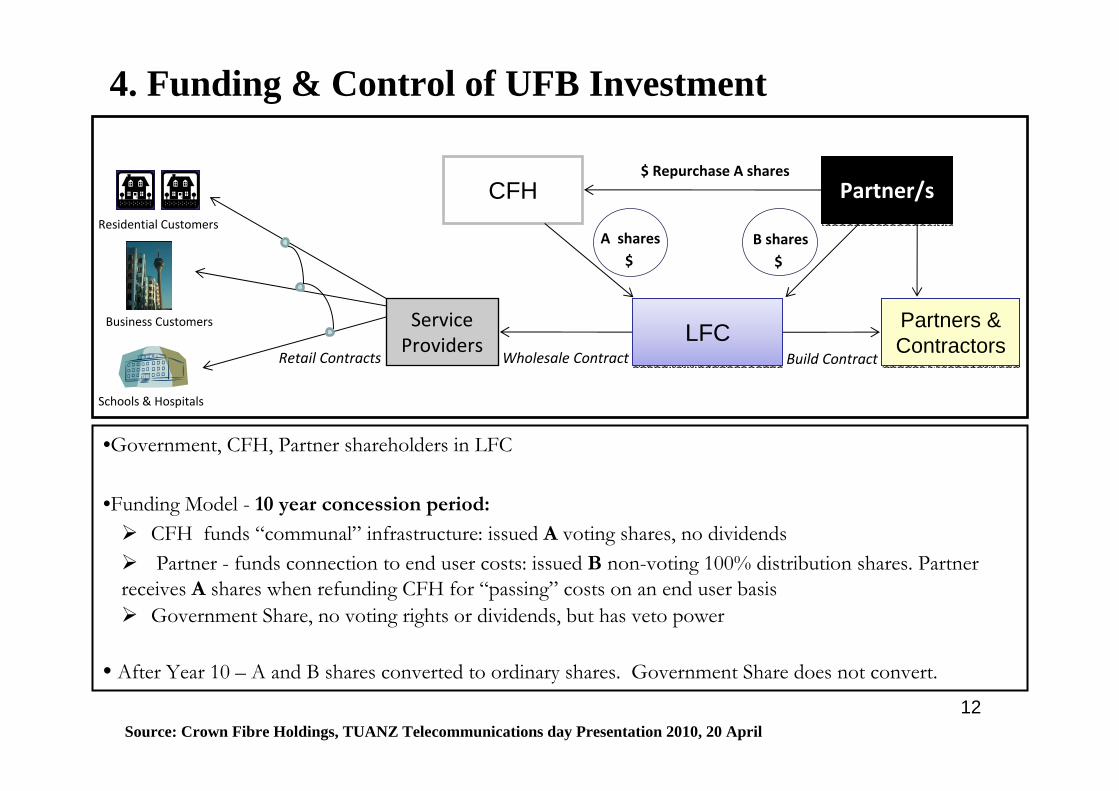
4. Funding & Control of UFB Investment
CFH Partner/sPartner/s
Partners & ContractorsPartners & Contractors
Service Providers
$ Repurchase A shares
Build ContractWholesale Contract
Residential Customers
Business Customers
Schools & Hospitals
Retail Contracts
B shares$
Source: Crown Fibre Holdings, TUANZ Telecommunications day Presentation 2010, 20 April
•Government, CFH, Partner shareholders in LFC
•Funding Model - 10 year concession period:
CFH funds “communal” infrastructure: issued A voting shares, no dividendsPartner - funds connection to end user costs: issued B non-voting 100% distribution shares. Partner
receives A shares when refunding CFH for “passing” costs on an end user basis Government Share, no voting rights or dividends, but has veto power
• After Year 10 – A and B shares converted to ordinary shares. Government Share does not convert.
LFCLFC
A shares$

13
4. Funding and Control of UFB Investment (2)
• Traditional Model, Private Operator faces all Penetration risk
$10k passing and $1k connection to be funded ($11k) funded by one customer
• UFB model, Operator only has passing cost on connection of end user
– $2k passing costs and $1k connection ($3k) funded by one customer– Home Fibre Access Price can be lower
Fibre Build out down street
$2k Passing Costrefunded to CFHon connection
$2k $2k $2k $2k $2k
Illustrative cost to pass premises paid by CFH
Source: Crown Fibre Holdings, TUANZ Telecommunications day Presentation 2010, 20 April
Connection Cost$1k paid by operator
IllustrativeIllustrative

14
4. Services Supplied by UFB NetworkSupply of Services:• Open access wholesale-only business model.
• Mandated supply of Layer 1 dark fibre.
• In contrast to Australia, optional supply of Layer 2 service. Layer 2 service expected to be similar to Ofcom’s “ALA”service.
• Aim to incentivise partners to co-invest in Layer 2 bitstream services with LFC (not part of Govt funding)

15
4. Regulatory/Governance Regime for UFB
No ExplicitRegulation
Deed of Undertakings
•Consumer interest protected by Govt’s Share which entrenches Open Access obligations
•Limited concern about anti-competitive behaviour LFC •Telecommunications and Commerce Act still applies•Proposal for Commission to Monitor and Enforce Open Access Obligations
•Behavioural undertakings proposed, established by Deed of Undertaking between LFC and Government.
•Upfront rules to provide certainty to investors. Key aspects:
LFC must operate consistently with open access guiding principles:
Any-to-any connectivity
Any network technology
Low cost to change providers
Equality of access
LFC must abide by the equivalence and non-discrimination requirements
Pricing Pricing commercially negotiated
16
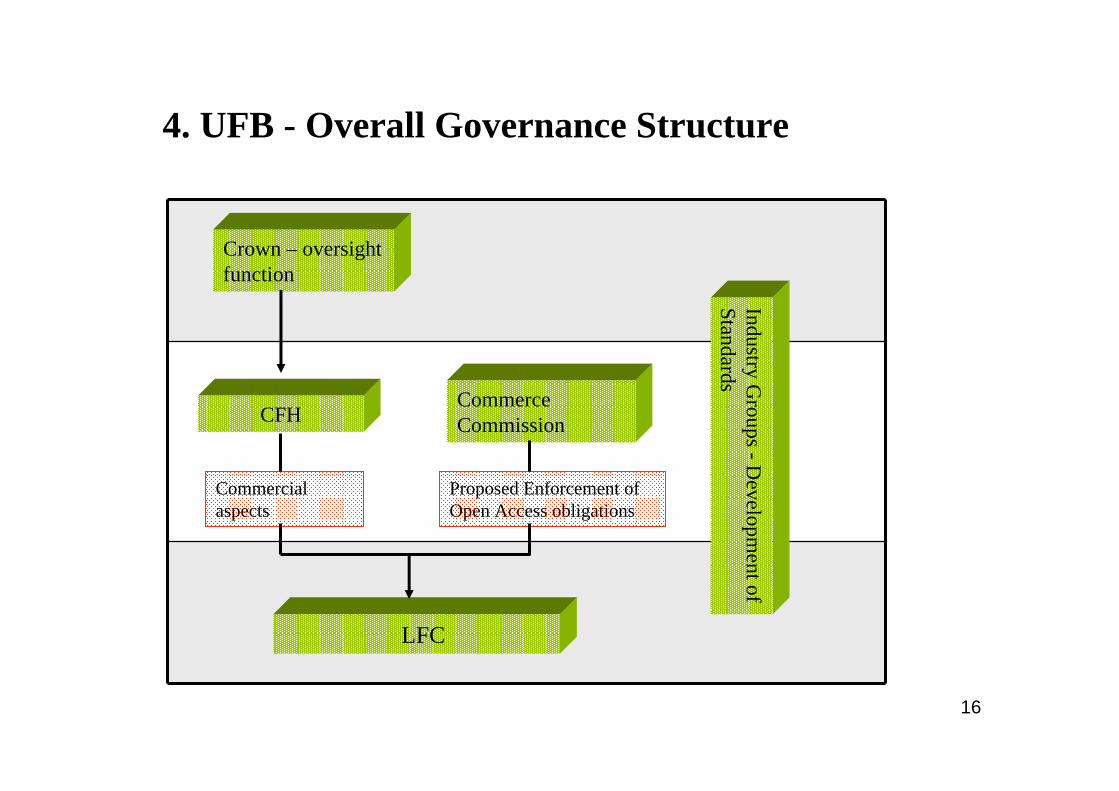
4. UFB - Overall Governance Structure
Crown – oversight function
CFH Commerce Commission
LFC
Commercialaspects
Proposed Enforcement of Open Access obligations
Industry Groups -D
evelopment of
Standards
17
4. UFB - Partner Selection Process• ITP Formal invitation to participate closed 29 January 2010.
• 33 proposals received from 18 parties and consortia:
Telecom NZ
Axia Net Media – International Fibre Operator
Regional Fibre Group – 18 community-owned fibre companies’ (Includes electricity lines businesses e.g. Vector, Unison)
• 14 electricity lines companies submitted bids
• 2 nationwide responses
• Due diligence and evaluation target date 30 June 2010
• Negotiation to final agreement target date 30 Sept 2010

18
5. Regional Broadband Initiative (RBI)
• Complements UFB Initiative. Targets remaining 25% of New Zealanders.• Grant rather than co-investment model. Approx NZ$300m (€160m) in grants
over 6 years• Competitive tender process – Expressions of Interests then Requests for
Proposals – based on 19 regions• Bidders must meet minimum requirements, building open access infrastructure
that facilitates broadband service via a variety of access technologies
RBI objectivesimprove coverage of fast broadband so 97% of NZ households and enterprises can
access broadband services of 5 Mbps or better, and the remaining 3% at least 1 Mbpsconnect 97% of schools to fibre at speeds of at least 100 Mbps, with the remaining
3% at speeds of 10 Mbps
19
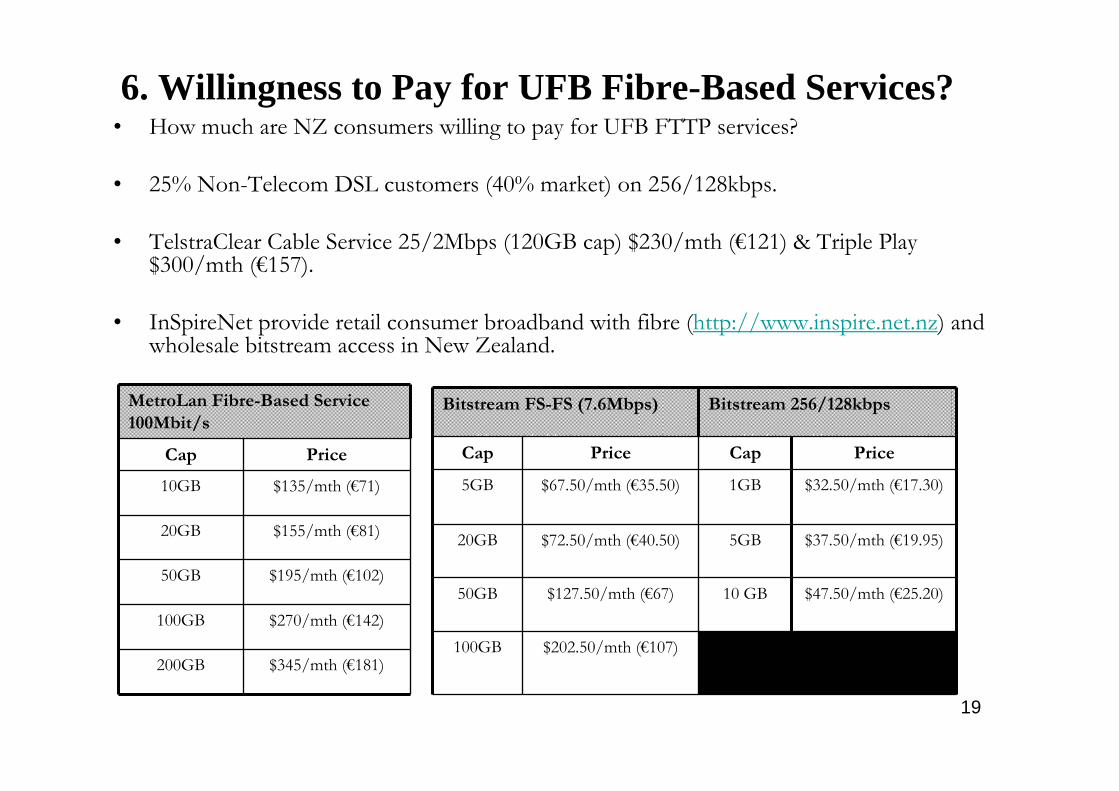
6. Willingness to Pay for UFB Fibre-Based Services?• How much are NZ consumers willing to pay for UFB FTTP services?
• 25% Non-Telecom DSL customers (40% market) on 256/128kbps.
• TelstraClear Cable Service 25/2Mbps (120GB cap) $230/mth (€121) & Triple Play $300/mth (€157).
• InSpireNet provide retail consumer broadband with fibre (http://www.inspire.net.nz) and wholesale bitstream access in New Zealand.
Bitstream FS-FS (7.6Mbps) Bitstream 256/128kbps
Cap Price Cap Price
5GB $67.50/mth (€35.50) 1GB $32.50/mth (€17.30)
20GB $72.50/mth (€40.50) 5GB $37.50/mth (€19.95)
50GB $127.50/mth (€67) 10 GB $47.50/mth (€25.20)
100GB $202.50/mth (€107)
MetroLan Fibre-Based Service100Mbit/s
Cap Price
10GB $135/mth (€71)
20GB $155/mth (€81)
50GB $195/mth (€102)
100GB $270/mth (€142)
200GB $345/mth (€181)
20
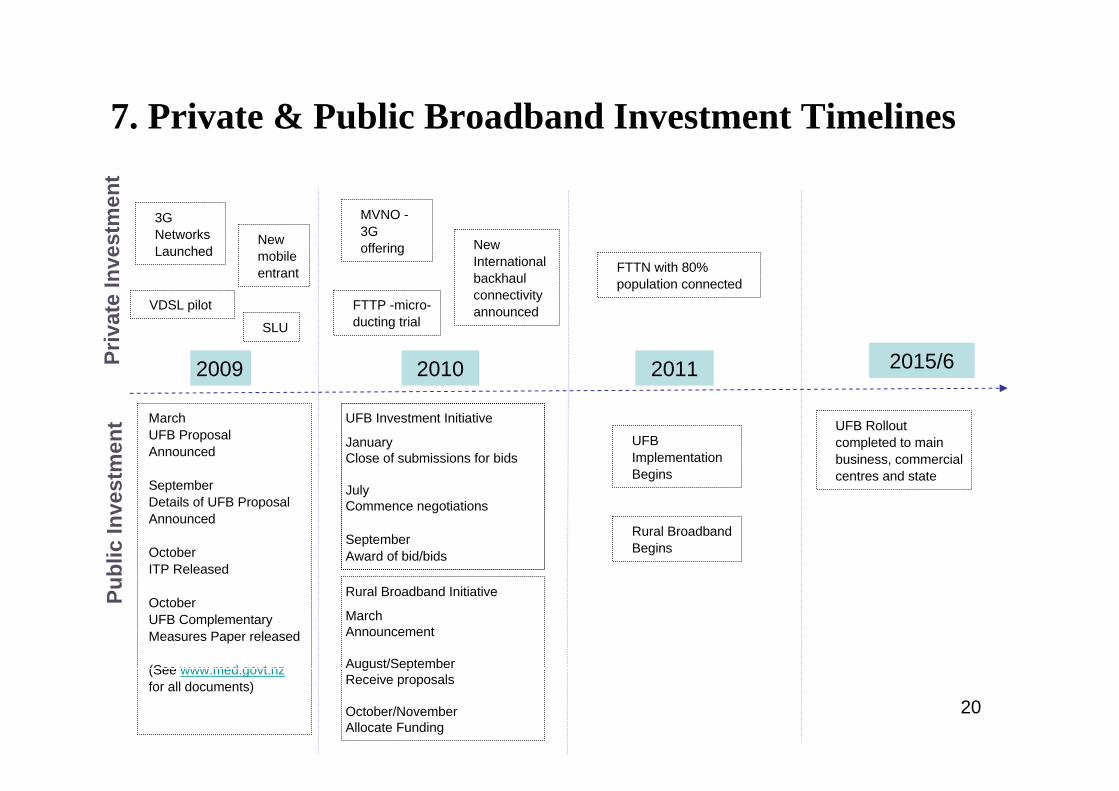
7. Private & Public Broadband Investment Timelines
2009 2010 2011
MarchUFB Proposal Announced
SeptemberDetails of UFB Proposal Announced
October ITP Released
OctoberUFB Complementary Measures Paper released
(See www.med.govt.nzfor all documents)
UFB Investment Initiative
JanuaryClose of submissions for bids
JulyCommence negotiations
September Award of bid/bids
Rural Broadband Initiative
MarchAnnouncement
August/SeptemberReceive proposals
October/NovemberAllocate Funding
UFB Implementation Begins
UFB Rollout completed to main business, commercial centres and state
Priv
ate
Inve
stm
ent
Publ
ic In
vest
men
t
2015/6
Rural Broadband Begins
3G Networks Launched
VDSL pilot
MVNO -3G offering New
mobile entrant
FTTP -micro-ducting trial
FTTN with 80% population connected
SLU
New International backhaul connectivity announced
21
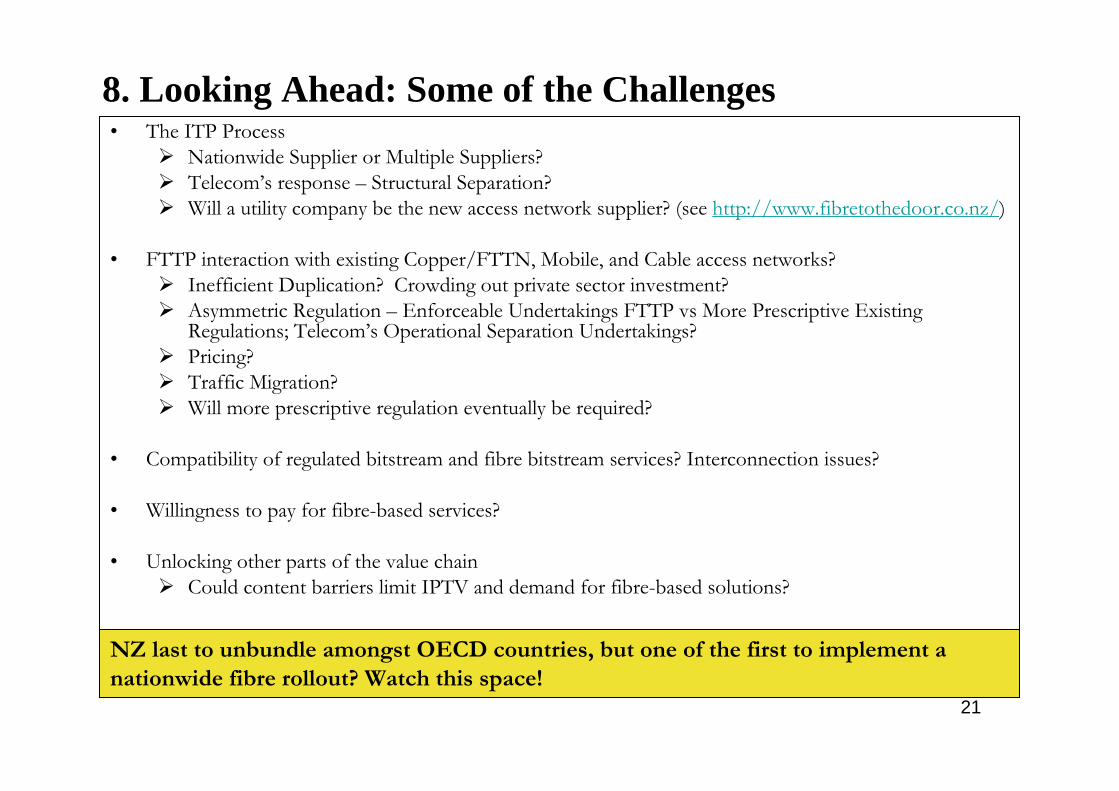
8. Looking Ahead: Some of the Challenges• The ITP Process
Nationwide Supplier or Multiple Suppliers?Telecom’s response – Structural Separation?Will a utility company be the new access network supplier? (see http://www.fibretothedoor.co.nz/)
• FTTP interaction with existing Copper/FTTN, Mobile, and Cable access networks? Inefficient Duplication? Crowding out private sector investment?Asymmetric Regulation – Enforceable Undertakings FTTP vs More Prescriptive Existing Regulations; Telecom’s Operational Separation Undertakings?Pricing?Traffic Migration?Will more prescriptive regulation eventually be required?
• Compatibility of regulated bitstream and fibre bitstream services? Interconnection issues?
• Willingness to pay for fibre-based services?
• Unlocking other parts of the value chainCould content barriers limit IPTV and demand for fibre-based solutions?
NZ last to unbundle amongst OECD countries, but one of the first to implement a nationwide fibre rollout? Watch this space!