national assessment of title i interim report volume ii ... · web viewthis running record...
TRANSCRIPT


ACKNOWLEDGMENTS
This report reflects the contributions of many institutions and individuals. We would like to first thank the study funders. The Institute of Education Sciences of the U.S. Department of Education and the Smith Richardson Foundation funded the evaluation component of the study. Funders of the interventions included the Heinz Endowments, the W.K. Kellogg Foundation, the Grable Foundation, the Institute of Education Sciences, the Ambrose Monell Foundation, Barksdale Reading Institute, the Haan Foundation for Children, the Richard King Mellon Foundation, the Raymond Foundation, and the Rockefeller Foundation. We also thank the Rockefeller Brothers Fund for the opportunity to hold a meeting of the Scientific Advisory Panel and research team at their facilities in 2004.
We gratefully acknowledge Audrey Pendleton of the Institute of Education Sciences for her support and encouragement throughout the study. Many individuals at Mathematica Policy Research contributed to the writing of this report. In particular, Mark Dynarski provided critical comments and review of the report. Micki Morris and Daryl Hall were instrumental in editing and producing the document, with assistance from Donna Dorsey and Alfreda Holmes.
Important contributions to the study were received from several others. At Mathematica, Nancy Carey, Valerie Williams, Jessica Taylor, Season Bedell-Boyle, and Shelby Pollack assisted with data collection, and Mahesh Sundaram managed the programming effort. At the Allegheny Intermediate Unit (AIU), Jessica Lapinski served as the liaison between the evaluators and AIU school staff. At AIR, Marian Eaton and Mary Holte made major contributions to the design and execution of the implementation study, while Terry Salinger, Sousan Arafeh, and Sarah Shain made additional contributions to the video analysis. Paul William and Charles Blankenship were responsible for the programming effort, while Freya Makris and Sandra Smith helped to manage and compile the data. We also thank Anne Stretch, a reading specialist and independent consultant, for leading the training on test administration.
Finally, we would particularly like to acknowledge the assistance and cooperation of the teachers and principals in the Allegheny Intermediate Unit, without whom this study would not have been possible.


CONTENTS
Chapter Page
EXECUTIVE SUMMARY.......................................................................vii
I INTRODUCTION.....................................................................................1
A. OVERVIEW.......................................................................................1
B. READING DIFFICULTIES AMONG STRUGGLING READERS.........1
C. STRATEGIES FOR HELPING STRUGGLING READERS..................2
D. EVALUATION DESIGN AND IMPLEMENTATION...........................4
II DESIGN AND IMPLEMENTATION OF STUDY......................................7
A. THE RANDOM ASSIGNMENT OF SCHOOLS AND STUDENTS......7
B. DATA...............................................................................................17
III IMPLEMENTATION ANALYSIS............................................................27
A. INSTRUCTION PROVIDED TO STUDENTS IN THE TREATMENT GROUP............................................................................................27
B. INSTRUCTION PROVIDED TO STUDENTS IN THE CONTROL GROUP............................................................................................29
C. DELIVERY OF INTERVENTION INSTRUCTION............................30
D. SELECTION, TRAINING, AND SUPPORT OF TEACHERS.............33
E. TEACHER QUALITY AND FIDELITY OF INSTRUCTIONAL IMPLEMENTATION........................................................................38
F. TIME-BY-INSTRUCTIONAL-ACTIVITY ANALYSES........................46
G. TEACHER REPORTS OF STUDENTS’ HOURS OF READING INSTRUCTION................................................................................49
v

CONTENTS (continued)
Chapter Page
IV IMPACT ANALYSIS..............................................................................53
A. ESTIMATION METHOD..................................................................53
B. INTERPRETATION OF IMPACTS...................................................58
C. CONTEXT OF THE IMPACTS.........................................................59
D. IMPACTS FOR THIRD-GRADE STUDENTS....................................61
E. IMPACTS FOR FIFTH-GRADE STUDENTS....................................63
F. IMPACTS FOR SUBGROUPS OF THIRD AND FIFTH GRADERS. .63
G. DO THE INTERVENTIONS CLOSE THE READING GAP?............67
REFERENCES....................................................................................105
APPENDICES:
A: DETAILS OF STUDY DESIGN AND IMPLEMENTATION.............A-1B: DATA COLLECTION......................................................................B-1C: WEIGHTING ADJUSTMENTS AND MISSING DATA....................C-1D: DETAILS OF STATISTICAL METHODS........................................D-1E: INTERVENTION IMPACTS ON SPELLING AND
CALCULATION........................................................................................E-1F: INSTRUCTIONAL GROUP CLUSTERING.....................................F-1G: PARENT SURVEY..........................................................................G-1H: TEACHER SURVEY AND BEHAVIORAL RATING FORMS...........H-1I: INSTRUCTIONAL GROUP VIDEOTAPE ANALYSIS.......................I-1J: VIDEOTAPE CODING GUIDELINES FOR EACH READING
PROGRAM......................................................................................J-1K: SUPPORTING TABLES..................................................................K-1L: SAMPLE TEST ITEMS...................................................................L-1M: IMPACT ESTIMATE STANDARD ERRORS AND P-VALUES........M-1N: ASSOCIATION BETWEEN INSTRUCTIONAL GROUP
HETEROGENEITY AND THE OUTCOME.....................................N-1O: TEACHER RATING FORM............................................................O-1P: SCHOOL SURVEY.........................................................................P-1Q: SCIENTIFIC ADVISORY BOARD...................................................Q-1
vi

EXECUTIVE SUMMARY
EVALUATION CONTEXT
According to the National Assessment of Educational Progress (U.S. Department of Education 2003), nearly 4 in 10 fourth graders read below the basic level. Unfortunately, these literacy problems get worse as students advance through school and are exposed to progressively more complex concepts and courses. Historically, nearly three-quarters of these students never attain average levels of reading skill. While schools are often able to provide some literacy intervention, many lack the resourcesteachers skilled in literacy development and appropriate learning materialsto help older students in elementary school reach grade level standards in reading.
The consequences of this problem are life changing. Young people entering high school in the bottom quartile of achievement are substantially more likely than students in the top quartile to drop out of school, setting in motion a host of negative social and economic outcomes for students and their families.
For their part, the nation’s 16,000 school districts are spending hundreds of millions of dollars on often untested educational products and services developed by textbook publishers, commercial providers, and nonprofit organizations. Yet we know little about the effectiveness of these interventions. Which ones work best, and for whom? Under what conditions are they most effective? Do these programs have the potential to close the reading gap?
To help answer these questions, we initiated an evaluation of either parts or all of four widely used programs for elementary school students with reading problems. The programs are Corrective Reading, Failure Free Reading, Spell Read P.A.T., and Wilson Reading, all of which are expected to be more intensive and skillfully delivered than the programs typically provided in public schools.1 The programs incorporate explicit and systematic instruction in the basic reading skills in which struggling readers are frequently deficient. Corrective Reading, Spell Read P.A.T., and Wilson Reading were implemented to provide word-level instruction, whereas Failure Free Reading focused on building reading comprehension and vocabulary in addition to word-level skills. Recent reports from small-scale research and clinical studies provide some evidence that the reading skills of students with severe reading difficulties in late elementary school can be substantially improved by providing, for a sustained period of time, the kinds of skillful, systematic, and explicit instruction that these programs offer (Torgesen 2005).
1 These four interventions were selected from more than a dozen potential program providers by members of the Scientific Advisory Board of the Haan Foundation for Children. See Appendix Q for a list of the Scientific Advisory Board members.
vii

EVALUATION PURPOSE AND DESIGN
Conducted just outside Pittsburgh, Pennsylvania, in the Allegheny Intermediate Unit (AIU), the evaluation is intended to explore the extent to which the four reading programs can affect both the word-level reading skills (phonemic decoding, fluency, accuracy) and reading comprehension of students in grades three and five who were identified as struggling readers by their teachers and by low test scores. Ultimately, it will provide educators with rigorous evidence of what could happen in terms of reading improvement if intensive, small-group reading programs like the ones in this study were introduced in many schools.
This study is a large-scale, longitudinal evaluation comprising two main elements. The first element of the evaluation is an impact study of the four interventions. This evaluation report is addressing three broad types of questions related to intervention impacts:
What is the impact of being in any of the four remedial reading interventions, considered as a group, relative to the instruction provided by the schools? What is the impact of being in one of the remedial reading programs that focuses primarily on developing word-level skills, considered as a group, relative to the instruction provided by the schools? What is the impact of being in each of the four particular remedial reading interventions, considered individually, relative to the instruction provided by the schools?
Do the impacts of programs vary across students with different baseline characteristics?
To what extent can the instruction provided in this study close the reading gap and bring struggling readers within the normal range, relative to the instruction provided by their schools?
To answer these questions, the impact study was based on a scientifically rigorous design—an experimental design that uses random assignment at two levels: (1) 50 schools from 27 school districts were randomly assigned to one of the four interventions, and (2) within each school, eligible children in grades 3 and 5 were randomly assigned to a treatment group or to a control group. Students assigned to the intervention group (treatment group) were placed by the program providers and local coordinators into instructional groups of three students. Students in the control groups received the same instruction in reading that they would have ordinarily received. Children were defined as eligible if they were identified by their teachers as struggling readers and if they scored at or below the 30th percentile on a word-level reading test and at or above the 5th percentile on a vocabulary test. From an original pool of 1,576 3rd and 5th grade students identified as struggling readers, 1,042 also met the test-score criteria. Of these eligible students, 772 were given permission by their parents to participate in the evaluation.
viii

The second element of the evaluation is an implementation study that has two components: (1) an exploration of the similarities and differences in reading instruction offered in the four interventions and (2) a description of the regular instruction that students in the control group received in the absence of the interventions and the regular instruction received by the treatment group beyond the interventions.
Test data and other information on students, parents, teachers, classrooms, and schools is being collected several times over a three-year period. Key data collection points pertinent to this summary report include the period just before the interventions began, when baseline information was collected, and the period immediately after the interventions ended, when follow-up data were collected. Additional follow-up data for students and teachers are being collected in 2005 and again in 2006.
THE INTERVENTIONS
We did not design new instructional programs for this evaluation. Rather, we employed either parts or all of four existing and widely used remedial reading instructional programs: Spell Read P.A.T., Corrective Reading, Wilson Reading, and Failure Free Reading.
As the evaluation was originally conceived, the four interventions would fall into two instructional classifications with two interventions in each. The interventions in one classification would focus only on word-level skills, and the interventions in the other classification would focus equally on word-level skills and reading comprehension/vocabulary.
Corrective Reading and Wilson Reading were modified to fit within the first of these classifications. The decision to modify these two intact programs was justified both because it created two treatment classes that were aligned with the different types of reading deficits observed in struggling readers and because it gave us sufficient statistical power to contrast the relative effectiveness of the two classes. Because Corrective Reading and Wilson Reading were modified, results from this study do not provide complete evaluations of these interventions; instead, the results suggest how interventions using primarily the word-level components of these programs will affect reading achievement.
With Corrective Reading and Wilson Reading focusing on word-level skills, it was expected that Spell Read P.A.T. and Failure Free Reading would focus on both word-level skills and reading comprehension/vocabulary. In a time-by-activity analysis of the instruction that was actually delivered, however, it was determined that three of the programs—Spell Read P.A.T., Corrective Reading, and Wilson Reading—focused primarily on the development of word-level skills), and one—Failure Free Reading—provided instruction in both word-level skills and the development of comprehension skills and vocabulary.
ix

Spell Read Phonological Auditory Training (P.A.T.) provides systematic and explicit fluency-oriented instruction in phonemic awareness and phonics along with every-day experiences in reading and writing for meaning. The phonemic activities include a wide variety of specific tasks focused on specific skill mastery and include, for example, building syllables from single sounds, blending consonant and vowel sounds, and analyzing or breaking syllables into their individual sounds. Each lesson also includes reading and writing activities intended to help students apply their phonically based reading skills to authentic reading and writing tasks. The Spell Read intervention had originally been one of the two “word-level plus comprehension” interventions, but after the time x activity analysis, we determined that it was more appropriately grouped as a “word-level” intervention.
Corrective Reading uses scripted lessons that are designed to improve the efficiency of instruction and to maximize opportunities for students to respond and receive feedback. The lessons involve very explicit and systematic instructional sequences, including a series of quick tasks that are intended to focus students’ attention on critical elements for successful word identification as well as exercises intended to build rate and fluency through oral reading of stories that have been constructed to counter word-guessing habits. Although the Corrective Reading program does have instructional procedures that focus on comprehension, they were originally designated as a “word-level intervention,” and the developer was asked not to include these elements in this study.
Wilson Reading uses direct, multi-sensory, structured teaching based on the Orton-Gillingham methodology. The program is based on 10 principles of instruction, some of which involve teaching fluent identification of letter sounds; presenting the structure of language in a systematic, cumulative manner; presenting concepts in the context of controlled as well as non-controlled text; and teaching and reinforcing concepts with visual-auditory-kinesthetic-tactile methods. Similar to Corrective Reading, the Wilson Program has instructional procedures that focus on comprehension and vocabulary, but since they were originally designated as a “word-level” intervention, they were asked not to include these in this study.
Failure Free Reading uses a combination of computer-based lessons, workbook exercises, and teacher-led instruction to teach sight vocabulary, fluency, and comprehension. The program is designed to have students spend approximately one-third of each instructional session working within each of these formats, so that they are not taught simultaneously as a group. Unlike the other three interventions in this study, Failure Free does not emphasize phonemic decoding strategies. Rather, the intervention depends upon building the student’s vocabulary of “sight words” through a program involving multiple exposures and text that is engineered to support learning of new words. Students read material that is designed to be of interest
x

to their age level while also challenging their current independent and instructional reading level. Lessons are based on story text that is controlled for syntax and semantic content.
MEASURES OF READING ABILITY
Seven measures of reading skill were administered at the beginning and end of the school year to assess student progress in learning to read. As outlined below, these measures of reading skills assessed phonemic decoding, word reading accuracy, text reading fluency, and reading comprehension.
Phonemic Decoding
Word Attack (WA) subtest from the Woodcock Reading Mastery Test-Revised (WRMT-R)
Phonemic Decoding Efficiency (PDE) subtest from the Test of Word Reading Efficiency (TOWRE)
Word Reading Accuracy and Fluency
Word Identification (WI) subtest from the WRMT-R
Sight Word Efficiency (SWE) subtest from the TOWRE
Oral Reading Fluency subtest from Edformation, Inc. The text of this report refers to the reading passages as “Aimsweb” passages, which is the term used broadly in the reading practice community.
Reading Comprehension
Passage Comprehension (PC) subtest from the WRMT-R
Passage Comprehension from the Group Reading Assessment and Diagnostic Evaluation (GRADE)
For all tests except the Aimsweb passages, the analysis uses grade-normalized standard scores, which indicate where a student falls within the overall distribution of reading ability among students in the same grade. Scores above 100 indicate above-average performance; scores below 100 indicate below-average performance. In the population of students across the country at all levels of reading ability, standard scores are constructed to have a mean of 100 and a standard deviation of 15, implying that approximately 70 percent of all students’ scores will fall between 85 and 115 and that approximately 95 percent of all students’ scores will fall between 70 and 130. For the Aimsweb passages, the score used in this analysis is the median correct words per minute from three grade-level passages.
xi

IMPLEMENTING THE INTERVENTIONS
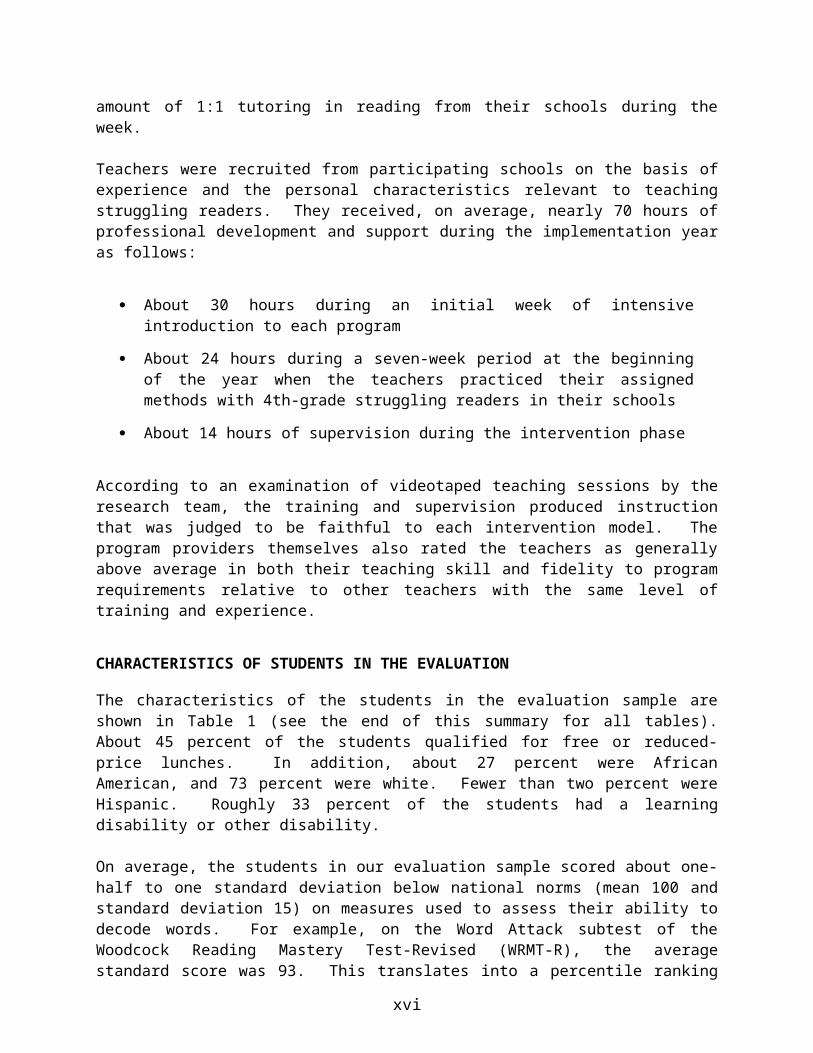
The interventions were implemented from the first week of November 2003 through the first weeks in May 2004. During this time students received, on average, about 90 hours of instruction, which was delivered five days a week to groups of three students in sessions that were approximately 50 minutes long. A small part of the instruction was delivered in groups of two, or 1:1, because of absences and make-up sessions. Since many of the sessions took place during the student’s regular classroom reading instruction, teachers reported that students in the treatment groups received less reading instruction in the classroom than did students in the control group (1.2 hours per week versus 4.4 hours per week.). Students in the treatment group received more small-group instruction than did students in the control group (6.8 hours per week versus 3.7 hours per week). Both groups received a very small amount of 1:1 tutoring in reading from their schools during the week.
Teachers were recruited from participating schools on the basis of experience and the personal characteristics relevant to teaching struggling readers. They received, on average, nearly 70 hours of professional development and support during the implementation year as follows:
About 30 hours during an initial week of intensive introduction to each program
About 24 hours during a seven-week period at the beginning of the year when the teachers practiced their assigned methods with 4th-grade struggling readers in their schools
About 14 hours of supervision during the intervention phase
According to an examination of videotaped teaching sessions by the research team, the training and supervision produced instruction that was judged to be faithful to each intervention model. The program providers themselves also rated the teachers as generally above average in both their teaching skill and fidelity to program requirements relative to other teachers with the same level of training and experience.
CHARACTERISTICS OF STUDENTS IN THE EVALUATION
The characteristics of the students in the evaluation sample are shown in Table 1 (see the end of this summary for all tables). About 45 percent of the students qualified for free or reduced-price lunches. In addition, about 27 percent were African American, and 73 percent were white. Fewer than two percent were Hispanic. Roughly 33 percent of the students had a learning disability or other disability.
On average, the students in our evaluation sample scored about one-half to one standard deviation below national norms (mean 100 and standard deviation 15)
xii

on measures used to assess their ability to decode words. For example, on the Word Attack subtest of the Woodcock Reading Mastery Test-Revised (WRMT-R), the average standard score was 93. This translates into a percentile ranking of 32. On the TOWRE test for phonemic decoding efficiency (PDE), the average standard score was 83, at approximately the 13th percentile. On the measure of word reading accuracy (Word Identification subtest for the WRMT-R), the average score placed these students at the 23rd percentile. For word reading fluency, the average score placed them at the 16th percentile for word reading efficiency (TOWRE SWE), and third- and fifth-grade students, respectively, read 41 and 77 words per minute on the oral reading fluency passages (Aimsweb). In terms of reading comprehension, the average score for the WRMT-R test of passage comprehension placed students at the 30th percentile, and for the Group Reading and Diagnostic Assessment (GRADE), they scored, on average, at the 23rd percentile.
This sample, as a whole, was substantially less impaired in basic reading skills than most samples used in previous research with older reading disabled students. These earlier studies typically examined samples in which the phonemic decoding and word reading accuracy skills of the average student were below the tenth percentile and, in some studies, at only about the first or second percentile. Students in such samples are much more impaired and more homogeneous in their reading abilities than the students in this evaluation and in the population of all struggling readers in the United States. Thus, it is not known whether the findings from these previous studies pertain to broader groups of struggling readers in which the average student’s reading abilities fall between, say, the 20th and 30th percentiles. This evaluation can help to address this issue. It obtained a broad sample of struggling readers, and is evaluating in regular school settings the kinds of intensive reading interventions that have been widely marketed by providers and widely sought by school districts to improve such students’ reading skills.
DISCUSSION OF IMPACTS
This first year report assesses the impact of the four interventions on the treatment groups in comparison with the control groups immediately after the end of the reading interventions. In particular, we provide detailed estimates of the impacts, including the impact of being randomly assigned to receive any of the interventions, being randomly assigned to receive a word-level intervention, and being randomly assigned to receive each of the individual interventions. For purposes of this summary, we focus on the impact of being randomly assigned to receive any intervention compared to receiving the instruction that would normally be provided. These findings are the most robust because of the larger sample sizes. The full report also estimates impacts for various subgroups, including students with weak and strong initial word attack skills, students with low or high beginning vocabulary scores, and students who either qualified or did not qualify for free or reduced price school lunches. 2
2 The impacts described here represent the impact of being selected to participate in one of the interventions. A small number of students selected for the interventions did not
xiii

The impact of each of the four interventions is the difference between average treatment and control group outcomes. Because students were randomly assigned to the two groups, we would expect the groups to be statistically equivalent; thus, with a high probability, any differences in outcomes can be attributed to the interventions. Also because of random assignment, the outcomes themselves can be defined either as test scores at the end of the school year, or as the change in test scores between the beginning and end of the school year (the “gain”). In the tables of impacts (Tables 2-4), we show three types of numbers. The baseline score shows the average standard score for students at the beginning of the school year. The control gain indicates the improvement that students would have made in the absence of the interventions. Finally, the impact shows the value added by the interventions. In other words, the impact is the amount that the interventions increased students’ test scores relative to the control group. The gain in the intervention group students’ average test scores between the beginning and end of the school year can be calculated by adding the control group gain and the impact. In practice, impacts were estimated using a hierarchical linear model that included a student-level model and a school-level model. In the student-level model, we include indicators for treatment status and grade level as well as the baseline test score. The baseline test score was included to increase the precision with which we measured the impact, that is, to reduce the standard error of the estimated impact. The school-level model included indicators that show the intervention to which each school was randomly assigned and indicators for the blocking strata used in the random assignment of schools to interventions. Below, we describe some of the key interim findings:
For third graders, we found that the four interventions combined had impacts on phonemic decoding, word reading accuracy and fluency, and reading comprehension. There are fewer significant impacts for fifth graders than for third graders (see Table 2). The impacts of the three word-level interventions combined were similar to those for all four interventions combined. Although many of the impacts shown in Table 2 for third graders are positive and statistically significant when all, or just the three word-level, interventions are considered, it is noteworthy that on the GRADE, which is a group-administered test for reading comprehension, the impact estimate and the estimated change in standard scores for the control group indicate that there was not a substantial improvement in reading comprehension in the intervention groups relative to the larger normative sample for the
participate, and about 7.5 percent received less than a full dose (80 hours) of instruction. Estimation of the effect of an intervention on participants and those who participated for 80 or more hours requires that stronger assumptions be made than when estimating impacts for those offered the opportunity to participate, and we cannot have the same confidence in the findings as we do with the results discussed in this summary. Our full report presents estimates of the effects for participants and those who participated for at least 80 hours. These findings are similar to those reported here.
xiv

test. Instead, this evidence suggests that the interventions helped these students maintain their relative position among all students and not lose ground in reading comprehension, as measured by the GRADE test. Results from the GRADE test are particularly important, because this test, more than others in the battery, closely mimics the kinds of testing demands (group administration, responding to multiple choice comprehension questions) found in current state-administered reading accountability measures.
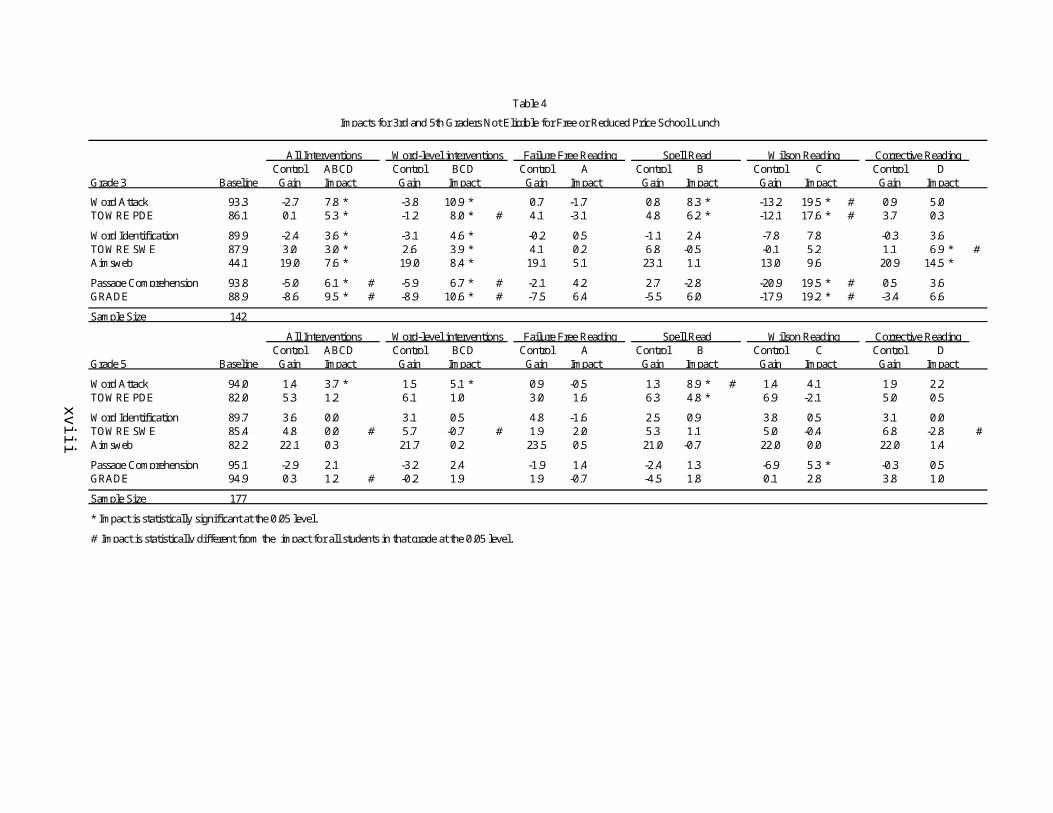
Among key subgroups, the most notable variability in findings were observed for students who qualified for free or reduced price lunches and those who did not. Although the ability to compare impacts between groups is limited by the relatively small samples, we did generally find significant impacts on the reading outcomes for third graders who did not qualify and few significant impacts for those who did qualify (see Tables 3 and 4), when all four interventions are considered together and when the three word-level interventions are considered together. These findings for third graders may be driven in part by particularly large negative gains among the control group students in the schools assigned to one intervention.
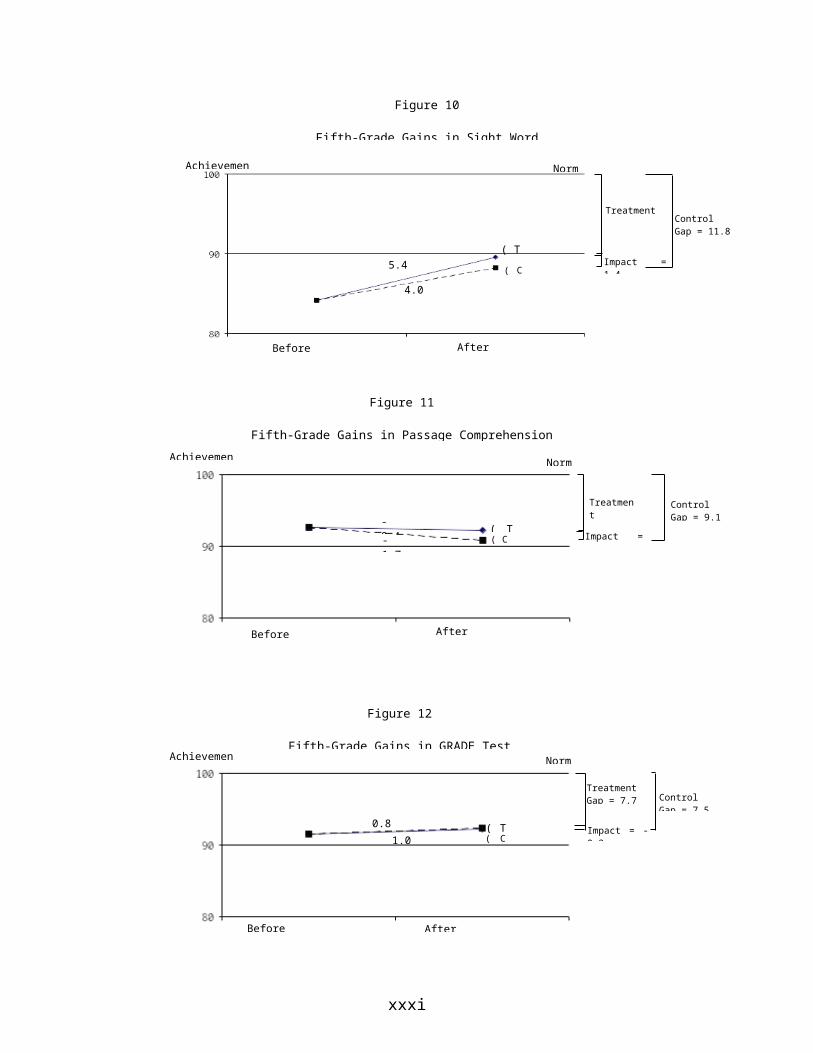
At the end of the first year, the reading gap for students in the intervention group was generally smaller than the gap for students in the control group when considering all four interventions together. The reading gap describes the extent to which the average student in one of the two evaluation groups (intervention or control) is lagging behind the average student in the population (see Figures 1-12 and Table 5). The reduction in the reading gap attributable to the interventions at the end of the school year is measured by the interventions’ impact relative to the gap for the control group, the latter showing how well students would have performed if they had not been in one of the interventions. Being in one of the interventions reduced the reading gap on Word Attack skills by about two-thirds for third graders. On other word-level tests and a measure of reading comprehension, the interventions reduced the gap for third graders by about one-fifth to one-quarter. For fifth graders, the interventions reduced the gap for Word Attack and Sight Word Efficiency by about 60 and 12 percent, respectively.3
Future reports will focus on the impacts of the interventions one year after they ended. At this point, it is still too early to draw definitive conclusions about the impact of the interventions assessed in this study. Based on the results from earlier research (Torgesen et al. 2001), there is a reasonable possibility that students who substantially improved their phonemic decoding
3 In future analyses, we plan to explore another approach for estimating the impact of the interventions on closing the reading gap. This approach will contrast the percentage of students in the intervention groups and the control groups who scored within the “normal range” on the standardized tests.
xv

skills will continue to improve in reading comprehension relative to average readers. Consistent with the overall pattern of immediate impacts, we would expect more improvement in students who were third graders when they received the intervention relative to fifth graders. We are currently processing second-year data (which includes scores on the Pennsylvania state assessments) and expect to release a report on that analysis within the next year.
xvi
xvii

xvi
Control Control Control Control Control ControlGrade 3 Baseline Gain Gain Gain Gain Gain Gain
Word Attack 92.6 0.2 5.0 * 0.0 6.8 * 0.7 -0.5 2.5 6.5 * -3.0 8.8 * 0.5 5.2 *TOWRE PDE 85.6 3.0 3.0 * 2.6 4.4 * 4.1 -1.3 4.1 7.1 * 0.2 5.8 * 3.6 0.4
Word Identification 88.7 -0.6 2.3 * -0.6 2.6 * -0.5 1.3 0.4 2.0 -2.3 2.5 0.1 3.3 *TOWRE SWE 86.5 3.4 2.7 * 3.6 2.8 * 2.9 2.6 4.9 0.7 3.5 3.1 2.4 4.6 *Aimsweb 40.9 20.6 4.9 * 20.3 5.9 * 21.5 1.9 22.6 1.0 17.5 6.0 20.9 10.7 *
Passage Comprehension 91.8 0.9 1.2 1.5 0.7 -0.8 2.7 2.4 0.2 -0.5 1.0 2.6 0.9GRADE 86.2 -4.0 4.6 * -3.1 4.4 -6.5 5.3 -4.2 4.9 -4.3 4.2 -0.9 4.2
Sample Size 335 335 242 93 92 71 79
Control Control Control Control Control ControlGrade 5 Baseline Gain Gain Gain Gain Gain Gain
Word Attack 93.1 2.2 2.7 * 2.4 3.9 * 1.3 -0.9 3.2 5.3 * 2.0 4.4 * 2.1 1.9TOWRE PDE 81.0 5.9 1.4 6.3 1.5 4.6 1.1 7.9 4.1 * 6.8 -1.4 # 4.3 1.9
Word Identification 88.7 2.9 0.5 2.8 0.9 3.1 -0.6 2.8 0.1 2.6 2.1 3.1 0.3TOWRE SWE 84.2 4.0 1.4 * 4.5 1.3 2.4 1.7 5.6 2.1 4.6 -0.5 3.4 2.2Aimsweb 77.4 19.1 2.0 18.7 2.8 20.5 -0.3 19.6 3.6 19.4 -0.1 17.1 4.9
Passage Comprehension 92.7 -1.7 1.3 -2.1 1.6 -0.6 0.3 -1.2 0.6 -3.7 2.5 -1.4 1.8GRADE 91.5 1.0 -0.2 0.8 0.3 1.6 -1.6 -0.5 -0.7 -0.7 1.3 3.6 0.3
Sample Size 407 407 281 126 104 91 86
* Impact is statistically significant at the 0.05 level.
# Impact is statistically different from the 3rd grade impact at the 0.05 level.
Note: Sample sizes indicate the number of students randomly assigned to the intervention or control group, excluding students with missing test scores at the beginning or end of the school year.
B CAll Interventions Word-level interventions Corrective ReadingFailure Free Reading Spell Read Wilson Reading
Table 2
Impacts for 3rd and 5th Graders
Corrective ReadingAll Interventions Word-level interventions Failure Free Reading Spell Read Wilson ReadingABCDImpact
BCDImpact
DImpact
AImpact
BImpact
CImpact
DImpact Impact Impact Impact Impact ImpactABCD BCD A

Control Control Control Control Control ControlGrade 3 Baseline Gain Gain Gain Gain Gain Gain
Word Attack 92.2 1.3 4.7 * 1.6 5.9 * 0.7 1.3 1.7 8.4 * 0.2 6.0 * # 2.8 3.3TOWRE PDE 85.3 4.6 1.8 4.5 2.6 # 4.9 -0.7 5.1 6.2 * 1.9 3.6 # 6.5 -2.0
Word Identification 88.0 0.2 1.1 0.3 1.1 -0.2 1.0 2.3 -0.6 -1.4 1.2 0.0 2.8TOWRE SWE 85.5 3.5 1.3 4.0 0.7 2.2 3.0 4.1 -0.8 3.9 2.5 3.9 0.4 #Aimsweb 38.6 20.3 2.0 19.6 3.1 22.5 -1.1 22.0 -1.9 16.1 6.4 20.7 4.7
Passage Comprehension 90.4 3.3 -0.8 # 4.2 -1.2 # 0.7 0.4 3.5 0.5 4.5 -2.6 # 4.5 -1.5GRADE 84.4 -2.0 0.1 # -0.7 -0.8 # -6.0 2.5 -2.6 1.6 -1.4 -2.1 # 1.8 -1.7
Sample Size 193
Control Control Control Control Control ControlGrade 5 Baseline Gain Gain Gain Gain Gain Gain
Word Attack 92.5 3.5 0.6 4.1 1.5 1.7 -2.3 5.7 0.8 # 3.7 3.0 2.8 0.8TOWRE PDE 80.1 6.5 0.6 6.6 1.0 6.2 -0.5 8.9 2.9 7.2 -1.2 3.8 1.3
Word Identification 87.8 2.4 0.4 2.5 0.7 2.2 -0.4 2.5 -1.2 2.1 3.0 * 3.0 0.2TOWRE SWE 83.2 2.6 3.7 * # 2.9 3.8 * # 1.6 3.2 4.5 3.9 * 4.1 1.0 0.3 6.5 * # Aimsweb 73.4 14.7 3.1 14.0 4.5 16.6 -1.1 16.0 8.6 * 13.7 0.7 12.4 4.4
Passage Comprehension 90.6 -0.1 -0.3 -0.3 -0.1 0.5 -0.9 0.6 -0.8 -0.8 -0.8 -0.8 1.3GRADE 88.6 3.2 -4.1 * # 3.1 -3.7 3.3 -5.4 4.9 -6.1 * 1.0 -4.2 3.3 -0.8
Sample Size 230
* Impact is statistically significant at the 0.05 level.
# Impact is statistically different from the impact for all students in that grade at the 0.05 level.
DImpact Impact Impact Impact Impact ImpactABCD BCD A B
CImpact
C
DImpact
AImpact
BImpact
ABCDImpact
BCDImpact
Table 3
Impacts for 3rd and 5th Graders Eligible for Free or Reduced Price School Lunch
Corrective ReadingAll Interventions Word-level interventions Failure Free Reading Spell Read Wilson Reading
Corrective ReadingAll Interventions Word-level interventions Failure Free Reading Spell Read Wilson Reading
xvii

Control Control Control Control Control ControlGrade 3 Baseline Gain Gain Gain Gain Gain Gain
Word Attack 93.3 -2.7 7.8 * -3.8 10.9 * 0.7 -1.7 0.8 8.3 * -13.2 19.5 * # 0.9 5.0TOWRE PDE 86.1 0.1 5.3 * -1.2 8.0 * # 4.1 -3.1 4.8 6.2 * -12.1 17.6 * # 3.7 0.3
Word Identification 89.9 -2.4 3.6 * -3.1 4.6 * -0.2 0.5 -1.1 2.4 -7.8 7.8 -0.3 3.6TOWRE SWE 87.9 3.0 3.0 * 2.6 3.9 * 4.1 0.2 6.8 -0.5 -0.1 5.2 1.1 6.9 * # Aimsweb 44.1 19.0 7.6 * 19.0 8.4 * 19.1 5.1 23.1 1.1 13.0 9.6 20.9 14.5 *
Passage Comprehension 93.8 -5.0 6.1 * # -5.9 6.7 * # -2.1 4.2 2.7 -2.8 -20.9 19.5 * # 0.5 3.6GRADE 88.9 -8.6 9.5 * # -8.9 10.6 * # -7.5 6.4 -5.5 6.0 -17.9 19.2 * # -3.4 6.6
Sample Size 142
Control Control Control Control Control ControlGrade 5 Baseline Gain Gain Gain Gain Gain Gain
Word Attack 94.0 1.4 3.7 * 1.5 5.1 * 0.9 -0.5 1.3 8.9 * # 1.4 4.1 1.9 2.2TOWRE PDE 82.0 5.3 1.2 6.1 1.0 3.0 1.6 6.3 4.8 * 6.9 -2.1 5.0 0.5
Word Identification 89.7 3.6 0.0 3.1 0.5 4.8 -1.6 2.5 0.9 3.8 0.5 3.1 0.0TOWRE SWE 85.4 4.8 0.0 # 5.7 -0.7 # 1.9 2.0 5.3 1.1 5.0 -0.4 6.8 -2.8 #Aimsweb 82.2 22.1 0.3 21.7 0.2 23.5 0.5 21.0 -0.7 22.0 0.0 22.0 1.4
Passage Comprehension 95.1 -2.9 2.1 -3.2 2.4 -1.9 1.4 -2.4 1.3 -6.9 5.3 * -0.3 0.5GRADE 94.9 0.3 1.2 # -0.2 1.9 1.9 -0.7 -4.5 1.8 0.1 2.8 3.8 1.0
Sample Size 177
* Impact is statistically significant at the 0.05 level.
# Impact is statistically different from the impact for all students in that grade at the 0.05 level.
Corrective ReadingAll Interventions Word-level interventions Failure Free Reading Spell Read Wilson Reading
Table 4
Impacts for 3rd and 5th Graders Not Eligible for Free or Reduced Price School Lunch
Corrective ReadingAll Interventions Word-level interventions Failure Free Reading Spell Read Wilson ReadingABCDImpact
BCDImpact
DImpact
AImpact
BImpact
B
CImpact
C DImpact Impact Impact Impact Impact ImpactABCD BCD A
xviii

xix

Figure 1
Third Grade Gains in Word Attack
xxii
Before Intervention After Intervention
( C )
( T )
Achievement Norm
Treatment Gap = 8.4
Impact = 3.0
ControlGap = 11.4
Before Intervention
Figure 2
Third Grade Gains in Phonemic Decoding Efficiency
After Intervention
Treatment Gap = 2.2
80
90
100
B F
( C )
( T )
Achievement Norm
Impact = 5.0
ControlGap = 7.25.0a
0.2b
aTreatment group gainbControl group gain
80
90
100
B F
6.0
3.0
( C )
( T )
Achievement Norm
TreatmentGap = 9.6
Impact = 2.3
Control Gap = 11.9
Before Intervention After Intervention
Figure 3
Third Grade Gains in Word Identification
1.7
-0.6

xxiii
80
90
100
B F
( C )
( T )
Achievement Norm
Treatment Gap = 7.4
Impact = 2.7
ControlGap = 10.1
Before Intervention After Intervention
Figure 4
Third Grade Gains in Sight Word Efficiency
6.1
3.4
80
90
100
B F
( C )
( T )
Achievement Norm
Treatment Gap = 6.1
Impact = 1.2
ControlGap = 7.3
Figure 5
Third Grade Gains in Passage Comprehension
Before Intervention After Intervention
2.1
0.9
80
90
100
B F
( C )
( T )
Achievement Norm
Treatment Gap = 13.1
Impact = 4.6
ControlGap = 17.7
Figure 6
Third Grade Gains in GRADE Test
Before Intervention After Intervention
0.7
-4.0

Figure 7
Fifth-Grade Gains in Word Attack
xxiv
( T ) ( C )
( C )( T )
( C )( T )
Achievement Norm
Treatment Gap = 7.9
Impact = 0.5
ControlGap = 8.4
Before Intervention After Intervention
Figure 9
Fifth-Grade Gains in Word Identification
Treatment Gap = 2.0
Achievement Norm
Impact = 2.7
ControlGap = 4.7
Before Intervention After Intervention
4.8
2.2
Achievement Norm
Treatment Gap = 11.7
Impact = 1.4
ControlGap = 13.1
Before Intervention
Figure 8
Fifth-Grade Gains in Phonemic Decoding Efficiency
After Intervention
5.9
7.3
B F
80
90
100
B F
3.4
2.9

xxv
( C )( T )
Achievement Norm
Treatment Gap = 10.4
Impact = 1.4
ControlGap = 11.8
Before Intervention After Intervention
Figure 10
Fifth-Grade Gains in Sight Word Efficiency
5.4
4.0
( C )( T )
Achievement Norm
Treatment Gap = 7.8
Impact = 1.3
ControlGap = 9.1
Figure 11
Fifth-Grade Gains in Passage Comprehension
Before Intervention After Intervention
-0.4-1.7
( C )( T )
Achievement Norm
Treatment Gap = 7.7
Impact = -0.2
ControlGap = 7.5
Figure 12
Fifth-Grade Gains in GRADE Test
Before Intervention After Intervention
0.81.0

I. INTRODUCTION
A. OVERVIEW
According to the National Assessment of Educational Progress (U.S. Department of Education 2003), nearly 4 in 10 fourth graders read below the basic level. Unfortunately, such literacy problems get worse as students advance through school and are exposed to progressively more complex concepts and courses. Historically, nearly three-quarters of these students never attain average levels of reading skill, and the consequences are life changing. Young people entering high school in the bottom quartile of achievement are substantially more likely than students in the top quartile to drop out of school, setting in motion a host of negative social and economic outcomes for students and their families.
To address this problem, many school districts have created remedial programs that aim to produce, on average, about one year’s gain in reading skills for each year of instruction. However, if children begin such programs two years below grade level, they will never “close the gap” between themselves and average readers. Recent studies have found that children placed in special education after third grade typically achieve a year’s gain or less in reading skill for each year in special education (McKinney 1990; Zigmond 1996). Thus, it is not surprising that most special education programs in the United States fail to close the gap in reading skills for the children they serve (Hanushek, Kain, and Rivkin 1998; Vaughn, Moody, and Schuman 1998).
As an alternative to such special education programs, many of the nation’s school districts are spending substantial resources—hundreds of millions of dollars—on educational products and services developed by textbook publishers, commercial providers, and nonprofit organizations. Several studies have recently shown that intensive, skillfully-delivered instruction can accelerate the development of reading skills in children with very severe reading disabilities, and do so at a much higher pace than is typically observed in special education programs (Lovett et al. 2000; Rashotte, Torgesen, and McFee 2001; Torgesen et al. 2001; Wise, Ring, and Olson 1999). Yet, we know little about the effectiveness of these interventions for broader populations of struggling readers in regular school settings. Which interventions work best, and for whom? Under what conditions are they most effective? Do these programs have the potential to close the reading gap between struggling and average readers?
To help answer these questions, we designed an experimental evaluation of four widely used programs for elementary school students with reading problems. Before describing these programs and the evaluation in detail, we review the findings from studies that have assessed the specific reading difficulties encountered by struggling readers.
1

B. READING DIFFICULTIES AMONG STRUGGLING READERS
The available data demonstrate that a large fraction of students in the late elementary school grades are unable to read at a basic level. However, to design effective instructional approaches that will substantially improve these students’ reading skills, we must understand the specific nature of their reading difficulties. Research on this issue has revealed that struggling readers in late elementary school typically have problems with (1) accuracy, (2) fluency, and (3) comprehension.
When asked to read passages at their grade level, struggling readers make many more errors in reading the words as compared with average readers (Manis, Custodio, and Szeszulski 1993; Stanovich and Siegel 1994). Two limitations in reading skill typically underlie these accuracy problems. When struggling readers encounter an unfamiliar word, they tend to place too much reliance on guessing it based primarily on the context or meaning of the passage (Share and Stanovich 1995). They are typically forced to guess from context because their phonemic analysis skills—their ability to use “phonics” to assist in the word identification process—are significantly impaired (Bruck 1990; Siegel 1989). The other underlying limitation is that in grade-level text, children with reading difficulties encounter more words that they cannot read “by sight” than do average readers (Jenkins et al. 2003).
Lack of ability to accurately recognize many words that occur in grade-level text (limited “sight word” vocabulary) also limits these children’s reading fluency. In fact, recent research has demonstrated that the primary factor that limits struggling readers’ fluency is the high proportion of words in grade-level text that they cannot recognize at a single glance (Jenkins, Fuchs, van den Broek, Espin, and Deno 2003; Torgesen and Hudson in press; Torgesen, Rashotte, and Alexander 2001). Problems with reading fluency are emerging as one of the most common and difficult to remediate traits of older struggling readers (Torgesen and Hudson in press). For example, a recent study of the factors associated with unsatisfactory performance on one state’s third-grade reading accountability measure—a measure of comprehension of complex text—found that students reading at the lowest of five levels on the test had reading fluency scores at the 6th percentile (Schatschneider et al. 2004).
The third type of reading problem experienced by almost all struggling readers in late elementary school involves difficulties comprehending written text. For many poor readers, comprehension difficulties are caused primarily by accuracy and fluency problems (Share and Stanovich 1995). Children in this group often have average to above-average general verbal or language comprehension skills, but their ability to comprehend text is hampered by their limited ability to read words accurately and fluently. When their word-level reading problems are remediated, their reading comprehension skills tend to improve to a level that is more consistent with their general verbal skills (Snowling 2000; Torgesen et al. 2001). The weak comprehension skills of children in another large group of poor readers are attributable to not only accuracy and fluency problems but also general verbal skills—particularly vocabulary skills—that are significantly below average (Snow, Burns, and
2

Griffen 1998), often because their home environments have not exposed them to rich language learning opportunities (Hart and Risley 1995). Even when the word-level reading skills of these children are brought into the average range, they may continue to struggle with comprehension because they lack the vocabulary and background knowledge necessary to understand complex text at the upper elementary level. Finally, poor readers in mid- to late elementary school are also frequently deficient in the use of effective comprehension strategies because they missed opportunities to acquire them while struggling to read words accurately or were not taught them explicitly by their reading teachers (Brown, Palincsar, and Purcell l986; Mastropieri and Scruggs 1997).
C. STRATEGIES FOR HELPING STRUGGLING READERS
In light of what has been learned about the specific reading problems of poor readers, we designed this evaluation to contrast two intervention classifications. One of these intervention classifications—referred to as word level—includes methods that focus on improving word-level reading skills so that they no longer limit children’s ability to comprehend text. Such methods devote the majority of their instructional time to establishing phonemic awareness, phonemic decoding skills, and word and passage reading fluency. Methods in this classification sometimes include activities to check comprehension (such as asking questions and discussing the meaning of what is read), but this instruction is incidental to the primary focus on improving word-level reading skills. The bulk of instructional and practice time in methods included within this classification is focused on building children’s ability to read text accurately and fluently. The second intervention classification—referred to as word level plus comprehension—includes methods that more evenly balance instructional time between activities to build word-level skills and activities devoted to building vocabulary and reading comprehension strategies. These interventions include extended activities that are designed to increase comprehension and word knowledge (vocabulary), and these activities would take roughly the same amount of instructional time as the activities designed to increase word reading accuracy and fluency.
Although we sought to contrast word level and word level plus comprehension methods, we did not design new instructional programs to fit these two classifications. Rather, we employed either parts or all of four existing and widely used remedial reading instructional programs: Corrective Reading, Failure Free Reading, Spell Read P.A.T, and Wilson Reading. These four interventions were selected from more than a dozen potential program providers. The selection was done by members of the Scientific Advisory Board of the Haan Foundation for Children. The Haan Foundation coordinated the selection process and funding for the interventions.4 The decision to modify these intact programs was justified both because it created two treatment classes that were aligned with the different types of reading deficits observed in struggling readers (discussed above) and because it gave us sufficient statistical power to contrast the relative effectiveness of the two classes. There were not enough schools available in the sample to support direct contrasts of
4 A complete list of members of the advisory board is provided in Appendix Q.
3

effectiveness between the programs considered individually. Because Corrective Reading and Wilson Reading were both modified in order to fit them within the two treatment classes, results from this study do not provide complete evaluations of these interventions; instead, the results suggest how interventions using primarily the word level components of these programs will affect reading achievement.
Another potentially important difference between the instructional emphases of the interventions in this evaluation and how such programs might be implemented in a nonresearch school setting or a clinical setting is that in these other settings, the balance of activities within a program can be varied to suit the needs of individual students. Within the context of this study, however, the relative balance of instructional activities between word-level skills and vocabulary/comprehension skills was to be held constant across students within each program. Despite this restriction, it was still possible for instructors to vary, for example, the rate of movement through the instructional content or the specific vocabulary taught according to children’s needs.
Finally, all four interventions delivered instruction to groups of three students “pulled out” of their regular classroom activities. Although “pull out” methods for remedial instruction have received some criticism over the last 20 years (Speece and Keogh 1996), we specified this approach for several reasons. First, all of the smaller-scale research that has produced significant acceleration of reading growth in older students used some form of a “pull out” method, with instruction delivered either in small groups or individually. Second, we are aware of no evidence that the level of intensity of instruction required to significantly accelerate reading growth in older students can be achieved by inclusion methods or other techniques that do not teach students in relatively small, homogeneous groups for regular periods of time every day (Zigmond 1996). Although the type of instruction offered in this study might be achieved by “push in” programs in which small groups are taught within their regular classroom, this was not a practical solution for this study because our instructional groups of struggling readers were comprised of children assigned to several different regular classrooms within each school.5
From this discussion, it is evident that this study is an evaluation of interventions that both focus on particular content and are delivered in a particular manner. Our decision to manipulate both of these dimensions simultaneously is consistent with one of the most important goals of the study: to examine the extent to which the reading skills of struggling readers in grades three and five could be significantly accelerated if high quality instruction was delivered with sufficient intensity and skill. It also means, of course, that if there is a significant impact of an intervention compared to the control group, the impact could be related to either the increased intensity of instruction or to the particular focus of the intervention.
5 One implication of providing pull out instruction is that the intervention students might receive less reading instruction in their regular classrooms or through other instruction provided by their schools. The implementation study revealed that this occurred.
4

D. EVALUATION DESIGN AND IMPLEMENTATION
We designed the evaluation to address a number of different questions, only some of which are addressed in this initial report. In this report, we provide preliminary answers to the following questions:
1. What is the impact of being in any of the four remedial reading interventions, considered as a group, relative to the instruction provided by the schools? What is the impact of being in one of the remedial reading programs that focuses primarily on developing word-level skills, considered as a group, relative to the instruction provided by the schools? What is the impact of being in each of the four particular remedial reading interventions, considered individually, relative to the instruction provided by the schools?
2. Do the impacts of programs vary across students with different baseline characteristics?
3. To what extent can the instruction provided in this study close the reading gap and bring struggling readers within the normal range, relative to the instruction provided by their schools?
We implemented the evaluation in the Allegheny Intermediate Unit (AIU), which is located just outside Pittsburgh, Pennsylvania. The evaluation is a large-scale, longitudinal evaluation comprising two main elements. The first element of the evaluation is an impact study of the four interventions based on a scientifically rigorous design—an experimental design that uses random assignment at two levels: (1) 50 schools from 27 school districts in the AIU were randomly assigned to one of the four interventions and (2) within each school, eligible children in grades 3 and 5 were randomly assigned to a treatment group or to a control group. Students assigned to the intervention group (treatment group) were placed by the program providers and local coordinators into instructional groups of three students. Students in the control groups received the same instruction in reading that they would have ordinarily received.
Children were defined as eligible if they were identified by their teachers as struggling readers and if they scored at or below the 30th percentile on a word-level reading test and at or above the 5th percentile on a vocabulary test. From an original pool of 1,576 3rd and 5th grade students identified as struggling readers, 1,042 also met the test-score criteria. Of these eligible students, 772 were given permission by their parents to participate in the evaluation.
The second element of the evaluation is an implementation study that has two components: (1) an exploration of the similarities and differences in reading instruction offered in the four interventions and (2) a description of the regular instruction that students in the control group received in the absence of the
5
interventions and the regular instruction received by the treatment group beyond the interventions.
The interventions provided instruction to students in the treatment group from the first week of November 2003 through the first weeks in May 2004. During this time, the students received, on average, about 90 hours of instruction, which was delivered five days a week to groups of three students in sessions that were approximately 50 minutes long. A small amount of the instruction was delivered in groups of two, or one on one, because of absences and make-up sessions.The teachers who provided intervention instruction were recruited from participating schools on the basis of experience and the personal characteristics relevant to teaching struggling readers. They received, on average, nearly 70 hours of professional development and support during the implementation year.
To address the research questions presented above, we are collecting test data and other information on students, parents, teachers, classrooms, and schools several times over a three-year period. Key data collection points pertinent to this initial report include the period just before the interventions began, when baseline information was collected, and the period immediately after the interventions ended, when follow-up data were collected. Additional follow-up data for students and teachers are being collected in 2005 and again in 2006. In this report, we present findings from the implementation study and estimates of the impacts of the interventions just after the interventions ended.
6


II. DESIGN AND IMPLEMENTATION OF STUDY
This evaluation has two main elements: (1) an impact study and (2) an implementation study. The implementation study examines the instruction provided by the four interventions and the instruction provided outside of the interventions to both the students who participated in the interventions and those who did not. Although this chapter describes some of the data that we have collected for the implementation study, we describe the design and findings of that study in detail in the next chapter.
This chapter focuses mainly on the impact study. The impact study is based on a scientifically rigorous design—an experimental design that uses random assignment at two levels: (1) schools were randomly assigned to one of the four interventions, and (2) within each school, eligible children in grades three and five were randomly assigned to a treatment group or to a control group. Randomization at the school-level was done so that the interventions would be implemented within similar schools. Randomization at the student-level ensures that the students in the treatment and control groups are only randomly different from one another on all background covariates, including reading ability at the beginning of the school year. Thus, differences in outcomes at the end of the school year can be attributed to the interventions and not to pre-existing differences between the groups.6 All student-level analyses account for the clustering of students within schools, as detailed in Chapter IV.
In the remainder of this chapter, we describe how schools and students were randomized. Then, we describe the data that we have collected for the evaluation.
6 A power analysis was done to estimate the minimum detectable impacts (MDI) given the study design, the actual number of schools and students enrolled, the variability in the follow-up test scores explained by the variability in baseline test scores, and the estimated intraclass correlation. For the power calculations, the two-tailed significance level is 0.05 with a power of 0.80. Other parameters are based on the observed data for two of the main reading measures: Word Attack and GRADE. The observed R-squared values between the baseline and follow-up tests are 0.48 and 0.35 for Word Attack and GRADE, respectively. The observed intraclass correlations for Word Attack and GRADE are 0.11 and 0.15, respectively. This analysis indicated that, when estimating separate impacts for third and fifth graders, the MDI’s for testing whether the four interventions combined or the three word-level interventions combined had an impact are approximately 0.3 (in standard deviation units); the MDI for testing whether an individual intervention had an impact is approximately 0.55. When testing subgroup impacts, the MDI’s for all interventions combined and for each intervention individually are approximately 0.35 and 0.7, respectively. A power analysis based on assumed values for relevant parameters and a desire to detect impacts of 0.5 standard deviations guided the design of the study.
7

A. THE RANDOM ASSIGNMENT OF SCHOOLS AND STUDENTS
1. Randomization of Schools
We implemented the intervention in the Allegheny Intermediate Unit (AIU), located just outside Pittsburgh, Pennsylvania. The AIU consists of 42 school districts and about 125 elementary schools. Not all schools that agreed to participate in the study had sufficient numbers of eligible third- and fifth-grade students, and some schools had only third or fifth grade, not both. Thus, we partnered some schools to form “school units” such that each school unit would have two third-grade and two fifth-grade instructional groups consisting of three students per instructional group. From a pool of 52 schools, we formed 32 school units, and randomly assigned the 32 school units to the four interventions, within four strata defined by the percentage of students eligible for free or reduced- price school lunch. One school unit (consisting of two schools) dropped out of the study after randomization but before it learned of its random assignment, leaving 31 school units and 50 schools in the study.7,8
To assess the similarity of the intervention groups after randomly assigning schools, Table II.1 shows the distribution of school unit–level covariates across the four groups of school units assigned to each intervention. Appendix A also compares the schools in the study with other schools in the AIU and with schools nationwide. Tables II.2 and II.3 present comparisons based on student-level covariates, and the final columns of each of those tables also show tests of significance for differences in student-level covariates across the four interventions (for grades three and five, respectively). The only two significant differences in the school unit–level covariates across the four interventions are both attributable to differences in school size. By chance, five of the six smallest schools were assigned to Wilson Reading and so some of the variables directly related to enrollment (total enrollment and average class size) differ across the four interventions. On student-level covariates, we observe only a difference on the racial distribution in the schools. With just 32 school units randomized, it is not surprising to observe some differences among the four groups. While small differences may affect the inferences we draw from the impact analysis when comparing interventions, our impact analyses are based on the differences in reading achievement for students in treatment and control groups within school units rather than between school units. Thus, small differences among interventions are not critical and should not bias our impact estimates for individual interventions. In addition, when the student-level randomization is assessed, the students in the treatment and control groups are very similar to each other (see Tables II.2 through II.5).
7 Because we did not collect data from the two schools that dropped out, we cannot include those schools in the analyses. Exclusion of those schools could have affected the comparisons across the four interventions by making the distributions of students across the interventions slightly different. However, an analysis of the distributions of student-level covariates across the four interventions shows that the effects of the school exclusions were minimal (see Tables II.2 and II.3).
8 Figure A.1 of Appendix A illustrates the selection of schools and the process of randomizing school units to the four interventions.
8

2. Randomization of Students
After we randomized school units to one of the four interventions, we randomized the eligible students within each school and grade either to receive the intervention (the treatment group) or not to receive the intervention (the control group). The student-level randomization process was as follows:9
Identify Potentially Eligible Students. Teachers in the 50 schools identified 1,576 struggling readers in third or fifth grade for screening. Nearly all (1,502) of these students were screened.10
9 Separately for each intervention, Figures A.2 through A.5 of Appendix A show the details of students’ progression through the study. Appendix A also details the data collection process.
10 For the following reasons, 74 students were not screened: the parents returned passive consent forms that declined screening (37), students transferred to other schools before the screening (25), or other reasons (12), such as expulsion, retention in the previous grade, home schooling, or severe disability.
9

Determine Eligibility. Of those 1,502 students screened, 1,042 were eligible for the study based on the following eligibility criteria:
- Scoring at or above the fifth percentile on a test of verbal ability (Peabody Picture Vocabulary Test—Revised) - Scoring at or below the 30th percentile on a word-level reading ability test (Test of Word Reading Efficiency (TOWRE), Phonemic Decoding Efficiency and Sight Word Efficiency subtests combined)- Students were also required to have written parental consent to participate in the study; 779 of the test-score eligible students received this consent.
10

Randomly Assign Eligible Students to the Treatment and Control Groups. 772 of the eligible students who had parental consent were randomized to the treatment group or the control group.11 Within each school unit and grade, 3, 6, or 12 eligible students were randomly chosen to receive the intervention.12 A total of 458 students were assigned to the treatment group. The remaining 314 students were assigned to the control group. Once students were assigned to the treatment group within a school, program operators assigned the treatment students to instructional groups composed of three students each, based on each program’s own test results and constraints regarding students’ schedules.
11 Seven of the 779 students were not randomized because they came from grades in schools from which we obtained an insufficient number of eligible students or from schools in which we did not use students from that grade (because students from another school in the same school unit were included in the study instead).
12 The number of students in each school and grade chosen to receive the treatment depended on the number of intervention slots available (based on expectations of the number of eligible students per school).
11
12
13

14

15

Using all 1,502 students screened, Table II.6 compares the test scores of the 1,042 students eligible based on test scores with the 460 students ineligible based on test scores. As the eligibility criteria would suggest, the eligible students demonstrated lower word-level reading ability (as measured by the TOWRE test) than the ineligible students but higher verbal ability (as measured by the Peabody Picture Vocabulary test).13 Table II.7 compares the test scores of the 263 students eligible based on test scores but whose parents did not give consent with the 779 students fully eligible based on test scores and consent; 772 of the eligible students were randomly assigned to the treatment or control group. There is only one statistically significant difference in the average screening test scores of the two groups, indicating that the students who received consent are similar to the students who did not receive consent, at least on these measures of word-level reading and verbal ability.
The study had almost no nonresponse at baseline or follow-up data collection, and most students received the instruction for the group to which they were assigned. That is, no control students received the intervention, and few treatment students did not receive any intervention. In particular, 13 students assigned to the treatment group did not receive any intervention; of the 13, 9 did not receive the intervention but remained in the study while 4 withdrew from the study. An additional 3 treatment students and 2 control students withdrew from the study after the first week.14
The final analysis sample contains fewer students (742) than the 772 students randomized to one of the interventions. The study dropped 30 students for one of two reasons: either they were in one school unit that did not have any control students, or they did not take the follow-up tests at the end of the school year. Specifically, in the Corrective Reading group, one school unit did not have enough eligible students to allow for any control students. Given that the absence of controls prevents a comparison of treatment and control outcomes in that school unit, we dropped the 9 treatment students in the school unit from the analysis.15 In addition, 21 students (13 treatments and 8 controls) did not take any of the reading tests at the end of the school year.16
13 Among third graders, the difference in Peabody Picture Vocabulary test scores between eligible and ineligible students was not statistically significant at the .05 level. The scores were significantly different between eligible and ineligible fifth-grade students.
14 The 9 withdrawals resulted from students’ moves to a new school, parents not wanting their child in the control group, emotional issues, a student scoring well on the intervention’s test, the student missing out on something in the regular classroom, and other unspecified reasons. The 13 treatment group drop-outs were the result of severe behavioral issues, parents not consenting to separating siblings, students’ requests to leave the intervention, student stress/medication issues, students’ moving, and other unspecified reasons.
15 To permit estimation of school unit–level parameters, the hierarchical model used to estimate impacts requires treatment and control students within each school.
16 Nearly half of these 21 students (9) had withdrawn from the study. Other nonrespondents at the end of the school year were not tested because of illness, difficulties in contacting the students, or because the student had moved.
16
For each intervention and grade, Tables II.2 and II.3 separately compare the covariates of students in the treatment and control groups in the final analysis sample; Tables II.4 and II.5 do the same for all interventions combined and the three word-level interventions combined.
Even though all the mean scores for intervention and control group students are below average for the students’ grade level, Tables II.4 and II.5 demonstrate that these students are, on average, only moderately impaired in word-level reading skills. For example, on the widely used measures from the Woodcock Reading Mastery Test-Revised (WRMT-R, Woodcock 1998), the third-grade students in the treatment groups achieved average standard scores of 90, 93, and 93 on the Word Identification, Word Attack, and Passage Comprehension tests, respectively. These scores fall between the 25th and 32nd
17

percentiles, meaning that approximately half the students in the third-grade sample began the study with phonemic decoding scores above the 30th percentile and that many had scores solidly within the average range (between the 40th and 60th percentiles). The scores for fifth grade were similar: 88 for Word Identification, 93 for Word Attack, and 92 for Passage Comprehension. These baseline scores for word- level skills are much higher than corresponding scores from a set of 13 intervention samples recently reviewed by Torgesen (2005). The students in those studies were of approximately the same ages as those in the present study, and their average baseline standard score for Word Attack was 75 and their average baseline score for Word Identification was 73. These scores, which are below the fifth percentile, indicate that the average students in these other studies had reading skills that were substantially more impaired than the reading skills of the students in our sample and the population of struggling readers in the United States.
Within each intervention and grade, we observed a few significant differences in student characteristics at baseline between students assigned to the treatment group and students assigned to the control group (see Tables II.2
18
and II.3). Most of the differences are scattered across tests and interventions and are not surprising; a few differences would be expected even with random assignment. There are more significant differences when we compare the treatment and control groups in the
19

combined group of all interventions and the combined group of the three word-level interventions, particularly among third graders (see Tables II.4 and II.5).17
We also compared the distributions of covariates between the treatment and control groups within key subgroups defined by students' scores on the Word Attack test and by free or reduced-price school lunch eligibility. The results are broadly similar to those shown in Tables II.2 through II.5, with scattered differences across interventions but no apparent systematic differences
17 In fact, even if the covariate distributions were exactly the same in the treatment and control groups, we would expect 5 percent of the differences (1 of 20 characteristics) to be significantly different at the 0.05 level given the design of the statistical tests used here. When adjustments for multiple comparisons are made, many of the significant differences that are scattered across characteristics and interventions are no longer significant, although many of the differences seen among third graders in the four interventions combined remain. See Chapter IV and Appendix D for more discussion of the techniques used to adjust for multiple comparisons. We focus here on the results derived without any adjustment for multiple comparisons because not doing such an adjustment is in fact conservative when assessing balance in baseline covariates, unlike the situation when estimating impacts, where it is more conservative to do an adjustment.
20

between the treatment and control groups. For third-grade students with low Word Attack scores, there are statistically significant differences in some test scores when comparing students in the Corrective Reading schools, and when comparing treatment and control students across the interventions combined. Almost no significant differences are seen for fifth-grade students with low Word Attack scores. For students with high Word Attack scores, almost no significant differences are seen for third-grade students, however there are some differences in the test scores of fifth-grade treatment and control group students in the Wilson Reading and Spell Read schools and when examining the interventions combined. Within the subgroup of students eligible for free or reduced-price school lunch, there are almost no differences between third-grade students in the treatment and control groups within each of the four interventions, but a few differences for fifth-grade students in the Spell Read and Corrective Reading schools. The results for students not eligible for free or reduced-price school lunch are very similar to those shown in Tables II.2-II.5 for the full sample, with some differences among third-grade students in Wilson Reading and when considering the interventions combined, and a few differences for fifth-grade students in Wilson Reading schools.
It is important to note that many of these reading tests are highly correlated with one another and thus the significance tests performed are not independent. For example, the Rapid Automatized Naming tests are all done at the same point in time and are testing similar skills (see Section B). Also, because students were randomly assigned to treatment or control status, the differences between the treatment and control groups are due entirely to chance. To adjust for these chance differences, we include the baseline value of each test as a predictor variable in the outcome models used to estimate impacts, a specification that was chosen before these differences were seen.
Depending on the number of eligible students in their school and grade, students had varying probabilities of assignment to the treatment group. Thus, all student-level analyses are conducted using weights that account for the unequal treatment probabilities and ensure that the treatment and control students weight up to represent the same population: that of all students in the study, where the students from each school are weighted proportional to the number of treatment slots given to that school. The weights also adjust for student dropout and nonresponse, and account for the randomization strata without any control students. Full details of the weighting procedure are given in Appendix C.
B. DATA
Test data and other information on students, parents, teachers, classrooms, and schools is being collected several times over a three-year period. Key data collection points pertinent to this report include the period just before the interventions began, when baseline information was collected, and the period immediately after the interventions ended, when follow-up data were collected. Additional follow-up data for students and teachers are being collected in 2005
21

and again in 2006. There are three major types of information used in this report: measures of student performance, measures of student characteristics and the instruction they received, and measures of study implementation and fidelity.
1. Measures of Student Performance
The tests used to assess student performance fall into three categories. First, seven measures of reading skill were administered at baseline and follow-up to assess student progress in learning to read. Second, measures of language skills were administered only at baseline in order to assess the relationship between individual differences in performance on these measures and individual differences in response to the interventions. Third, two other academic measures were administered at baseline and follow-up. A measure of spelling skill assessed the impact of remedial reading instruction on spelling ability, and a measure of mathematical calculation skill assessed the impact of receiving the interventions in reading on an academic skill that is theoretically unrelated to improvements in reading. In a sense, the last measure is a “control” measure for effects of participation in the interventions on a skill that was not directly taught. The following describes each measurement category. Descriptions of each of these tests can be found in Exhibit 1 at the end of this chapter, and examples of items from the seven measures of reading skill can be found in Appendix L.
a. Measures of Reading
The measures of reading skills assessed phonemic decoding, word reading accuracy, text reading fluency, and reading comprehension. A sample test item from each of these tests is given in Appendix L. The seven tests, classified into three categories of reading skills, are:
Phonemic Decoding
Word Attack (WA) subtest from the Woodcock Reading Mastery Test-Revised (WRMT-R; Woodcock 1998)
Phonemic Decoding Efficiency (PDE) subtest from the Test of Word Reading Efficiency (TOWRE; Torgesen, Wagner, and Rashotte 1999)
Word Reading Accuracy and Fluency
Word Identification (WI) subtest from the WRMT-R
Sight Word Efficiency (SWE) subtest from the TOWRE
22
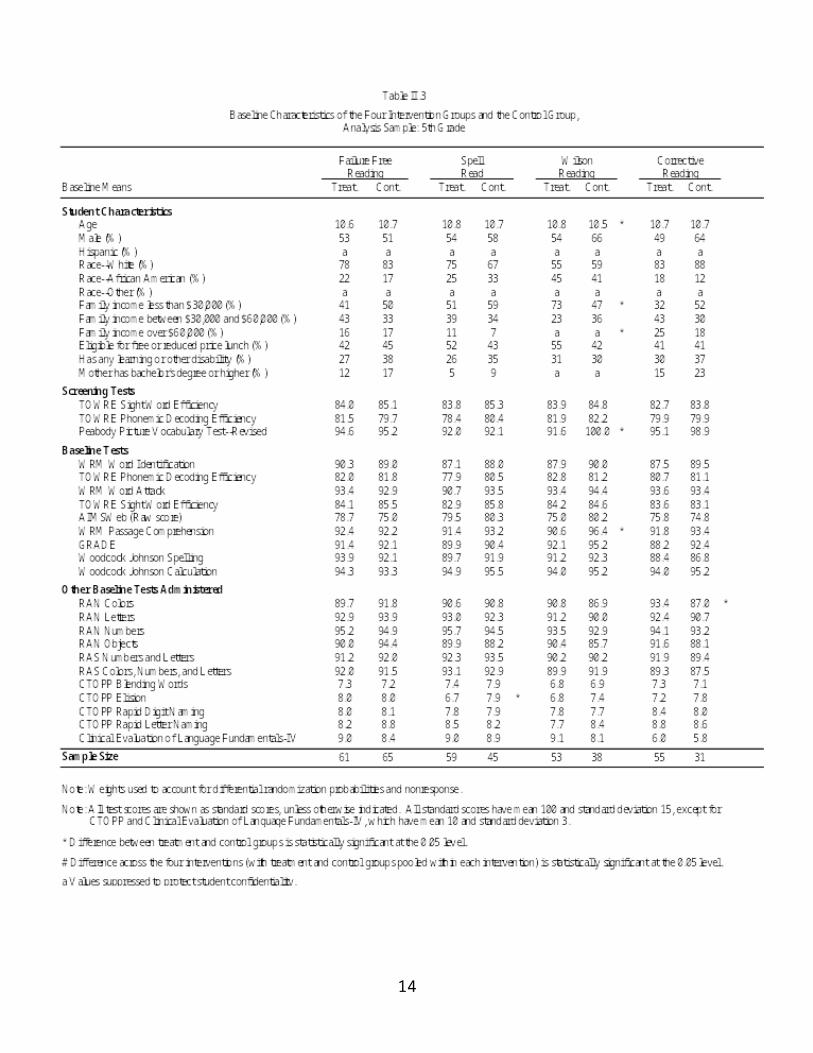
Oral Reading Fluency subtest from Edformation, Inc., (Howe and Shinn, 2002). The text of this report refers to these passages as Aimsweb passages, which is the term used broadly in the reading practice community.
Reading Comprehension
Passage Comprehension (PC) subtest from the WRMT-R
Passage Comprehension from the Group Reading Assessment and Diagnostic Evaluation (GRADE; Williams 2001)
b. Measures of Language
These measures assessed phonemic awareness, rapid automatic naming ability, syntactic skill, and vocabulary. The tests included (1) the Peabody Picture Vocabulary test (PPVT-III; Dunn and Dunn 1997), (2) subtests from the Comprehensive Test of Phonological Processes (CTOPP; Wagner, Torgesen, and Rashotte 1999), (3) subtests from the Rapid Automatized Naming and Rapid Alternating Stimulus Tests (RAN/RAS; Wolf and Denkla 2005), and (4) a subtest from the Clinical Evaluation of Language Fundamentals-Fourth Edition (CELF; Semel, Wiig, and Secord 2003).
23

c. Measures of Spelling and Mathematics Calculation Ability
The spelling and calculation subtests from the Woodcock-Johnson III Tests of Achievement (WJ-III; Woodcock, McGrew, and Mather 2001) assessed spelling and mathematics calculation abilities.
2. Timing of Student-Level Data Collection and Correlations Among Measures
Table II.8 shows the time points during the study at which the above tests were administered, as well as estimates of the test reliability. Even though the above tests are grouped by the skills they measure, the correlations of the tests—even among tests measuring similar constructs—were not always large. For example, the correlation between the Word Attack and Phonemic Decoding Efficiency tests was .64, the average correlation among the three tests measuring word reading accuracy and fluency was .55, and the correlation between the Passage Comprehension and GRADE tests was .44. These correlations are somewhat lower in the present sample than those reported elsewhere for the same tests. For example, the manual for the TOWRE test (Torgesen, Wagner, and Rashotte 1999) reports a correlation of .91 between the Word Attack and Phonemic Decoding Efficiency tests for a sample of at-risk third-grade students. A correlation of .87 between the two tests was reported in the same manual for a large random sample of fifth-grade students. Similarly, the test manual also reported correlations between the Word Identification and Sight Word Efficiency tests for the same samples of third- and fifth-grade students at .92 and .86, respectively. The manual for the Woodcock Reading Mastery Test-Revised (Woodcock 1998) reports a correlation between the Word Identification measure and Passage Comprehension measure of .67 for third graders and .59 for fifth graders. The lack of a strong correlation between the two measures of reading comprehension may reflect several differences in the way the tests are administered and the types of required responses. Table II.9 presents the full set of correlations among the seven measures of reading. The shaded boxes indicate tests that measure similar constructs: baseline tests measuring phonemic decoding skills, baseline tests measuring reading fluency and accuracy, and baseline tests measuring reading comprehension.
For all tests except the Aimsweb passages, the analysis used grade-normalized standard scores, which indicate where a student falls within the overall distribution of reading ability among students in the same grade.18,19 Scores above 100 indicate above-average performance; scores below 100 indicate
18 When possible, we standardized scores to the grade and month (e.g., we used different standardizations for fall and spring test administrations, when possible).
19 We could not calculate standard scores for the Aimsweb test because the timing of the test administrations made it difficult to standardize the tests appropriately. Instead, the present report presents raw scores. As contrasted with the other tests, the raw score for the Aimsweb has a simple substantive meaning in that it corresponds to the number of words read correctly.
24

below-average performance. In the population of students across the country at all levels of reading ability, standard scores are constructed to have a mean of 100 and a standard deviation of 15, implying that approximately 70 percent of all students’ scores will fall between 85 and 115 and that approximately 95 percent of all students’ scores will fall between 70 and 130.20 For the Aimsweb passages, the score used in this analysis is the median correct words per minute from three grade-level passages.
20 The test standardizations use a “norming” population for each test, with data collected and analyzed by each test’s publisher. The norming populations are selected to be representative of the national population of students at a given age or grade level.
25

Table II.8
Tests Administered at Beginning and End of the School Year
Test Administered at Screening, Baseline, and/or Follow-upScreening
(September-October)Baseline
(October-November)Follow-up(May-June) Reliability
Measures of Reading
Phonemic Decoding
Woodcock Test-R (WRMT-R) Word Attack (WA) 0.90a
Test of Word Reading Efficiency (TOWRE)Phonemic Decoding Efficiency (PDE) 0.93b
Word Reading Accuracy and Fluency
WRMT-R Word Identification (WI) 0.94a
TOWRE Sight Word Efficiency (SWE) 0.95b
Aimsweb Oral Reading Passages (AIMS) 0.92b
Reading Comprehension
WRMT-R Passage Comprehension (PCG) 0.82a
Group Reading Assessment and Diagnostic EvaluationPassage Comprehension (GRADE)
Grade 3: 0.88c
Grade 5: 0.90c
Measures of Language
Comprehensive Test of Phonological Processes (CTOPP)
Phoneme Blending 0.84c
Phoneme Elision 0.89c
Rapid Automatic Naming of Letters 0.92c
Rapid Automatic Naming of Numbers 0.87c
20

TABLE II.8 (continued)
Test Administered at Screening, Baseline, and/or Follow-upScreening
(September-October)Baseline
(October-November)Follow-up(May-June) Reliability
Rapid Automated Naming (RAN)
Colors 0.90d
Objects 0.84d
Numbers 0.92d
Letters 0.90d
Rapid Alternating Stimulus (RAS)
2-set 0.90d
3-set 0.91d
Peabody Picture Vocabulary Test—Revised (PPVT-III) 0.95c
Clinical Evaluation of Language Fundamentals–IV(CELF-IV) Formulated Sentences
0.87c
Other Tests
Woodcock Johnson Tests of Achievement-III (WJ-III)
Spelling 0.89c
Calculation 0.85c
a: Split-half reliabilityb: Alternate-form reliabilityc: Internal consistency reliability
d: Test-retest reliability
21

Table II.9
Correlations among Reading Tests at Baseline (All Students)
Word Attack
TOWREPDE
Word Identification
TOWRE SWE Aimsweb
Passage Comprehension Grade
Word Attack 1.00 0.64 0.64 0.46 0.36 0.53 0.34TOWRE PDE 1.00 0.59 0.62 0.28 0.43 0.26Word Identification 1.00 0.66 0.48 0.58 0.40
TOWRE SWE Baseline 1.00 0.50 0.58 0.36
Aimsweb 1.00 0.44 0.45Passage Comprehension 1.00 0.44
GRADE 1.00
3. Measures of Student Characteristics and Instruction Received
a. Parent Survey
A parent survey was administered at the time the letters of permission were sent to students’ homes. The survey asked a range of questions concerning student background and demographic characteristics such as socioeconomic status (parental education and employment), school history (mobility), medical history, and primary language spoken in the home. In addition, the survey asked parents about their child’s history of special tutoring in reading that occurred outside school.
b. Classroom Teacher Survey
Each child’s regular classroom teacher completed a survey twice during the intervention year. The first survey, administered in the fall, asked the teacher to characterize the reading instruction each child received in the regular classroom as well as any special reading instruction or reading programs the child attended outside the regular classroom. If the student had an individual education plan (IEP) for special education, the teacher detailed the type of instruction specified. In addition to describing the instruction received by each child, the teacher reported on the instruction that each child in the intervention group typically missed when attending intervention sessions. As for the second survey administered in the spring, the teacher not only answered the same questions about instruction asked by the first survey but also filled out a classroom behavior rating form for each child. The behavior rating scales were adapted from the Multigrade Behavior Inventory (Agronin, Holahan, Shaywitz, and Shaywitz 1992) and Iowa-Connors Teacher Rating Scale (Loney and Milich l982).
22

c. Intervention Attendance Logs
To detail the amount of intervention instruction received by each student in the intervention group, each intervention teacher maintained an attendance log indicating the number of minutes of instruction received by each student each day.
4. Measures of Study Implementation and Fidelity
A variety of data sources were utilized in the implementation and fidelity analyses, including videotapes of instructional group sessions and ratings of teacher quality and program fidelity. To assess the intervention teachers, trainers from the individual reading programs and staff from the AIU rated each intervention teacher on multiple occasions during the year. The AIU staff ratings were based on observations of specific class sessions, while the trainers’ ratings were based on impressions formed over the course of extended interactions with the intervention teachers. In addition, each intervention teacher was videotaped twice, with the videotapes used to assess teacher quality as well as to detail the amount of time, on average, that each of the four interventions spent on various reading activities. Finally, intervention teachers kept a log of the training they received throughout the school year. These data sources are described further in Chapter III.
23

EXHIBIT 1. STUDENT PERFORMANCE MEASURES
READING MEASURES
Phonemic Decoding
Word Attack subtest from the Woodcock Reading Mastery Test-Revised (WRMT-R; Woodcock 1998) requires students to pronounce printed nonwords that are spelled according to conventional English spelling patterns.
Phonemic Decoding Efficiency subtest from the Test of Word Reading Efficiency (TOWRE; Torgesen, Wagner, and Rashotte 1999) requires students to pronounce nonwords from a list of increasing difficulty as fast as they can. The score is the number of words correctly pronounced within 45 seconds.
Word Reading Accuracy and Fluency
Word Identification subtest from the WRMT-R requires students to pronounce real words from a list of increasing difficulty. The child’s score is the total number of words read correctly before reaching a ceiling, which is determined when the child makes a specific number of errors in a row.
Sight Word Efficiency subtest from the TOWRE requires students to pronounce real words from a list of increasing difficulty as fast as they can. The score is the number of words correctly pronounced within 45 seconds.
Oral Reading Fluency subtest from Edformation, Inc., (Howe and Shinn, 2002) requires students to read three passages at their grade level (third or fifth); their score is the median number of correct words per minute for the three passages. The text of this report refers to these passages as Aimsweb passages, which is the term used broadly in the reading practice community.
Reading Comprehension
Passage Comprehension subtest from the WRMT-R requires students to read short passages that contain a blank substituted for one of the words. The task is to use the context of the passage to determine what word should fill the blank. The subtest uses the cloze procedure for estimating reading comprehension ability. This measure of reading comprehension has been widely used in other intervention research with older students, so it provides one basis for comparing results from this study with those from earlier research.
Passage Comprehension subtest from the Group Reading Assessment and Diagnostic Evaluation (GRADE; Williams 2001) requires students to read short passages and answer multiple-choice questions. The present study used this test because it relies on a method for assessing reading comprehension that is similar to methods widely used in the United States for state level accountability testing. It is administered in a group setting and requires students to read passages and answer questions independently. Despite a time limit, most students are able to complete all of the items.
SPELLING AND MATHEMATICS CALCULATION ABILITY MEASURES
Spelling subtest from the Woodcock-Johnson III Tests of Achievement (WJIII; Woodcock, McGrew, and Mather 2001) requires students to spell words that are dictated to them
Calculation subtest from the WJIII requires students to perform mathematical calculations of increasing difficulty until they miss a certain number of problems in a row.
24

LANGUAGE MEASURES
Peabody Picture Vocabulary Test, Third Edition (PPVT-III; Dunn and Dunn 1997) is a measure of receptive vocabulary in which the subject is required to select a picture that best depicts the verbal stimulus given by the examiner.
Subtests from the Comprehensive Test of Phonological Processes (CTOPP; Wagner, Torgesen, and Rashotte 1999)
- Blending subtest. Measures a student’s ability to blend together separate phonemes to form words.
- Elision subtest. Measures a student’s ability to manipulate the sounds in orally presented words. For example, the student might be asked to indicate the word that is made when the word split is pronounced without saying the phoneme /l/.
- Rapid naming for letters/numbers. Each subtest requires the student to name a matrix of six letters/numbers each randomly repeated six times, for a total of 36 items. The child’s score is the time required to name all the items. The test is administered twice, and the student’s score is the average of the two administrations.
Subtests from the Rapid Automatized Naming and Rapid Alternating Stimulus Tests (RAN/RAS; Wolf and Denkla 2005.)
Rapid Automatized Naming. Each subtest requires the student to name 5 high-frequency items randomly repeated 10 times in an array of 5 rows for a total of 50 stimulus items. Each row of 10 items contains two examples of each of the 5 items. The student’s score is the time required to name all the items.
- Colors—each item is a color- Objects—each item is an object - Numbers—each item is a number- Letters—each item is a letter
Rapid Alternating Stimulus—each subtest requires the student to name items from the previous subtests that are randomly repeated 10 times in an array of 5 rows for a total of 50 stimulus items. The student’s score is the time required to name all of the items.
- 2-set numbers and letters—each row of 10 items contains one example of each of the 5 numbers and letters used in the subtests above.
- 3-set colors, numbers, and letters—each row of 10 items contains colors, numbers, and letters used in the subtests above. Each item occurs 3 or 4 times in the array.
Sentence Assembly Test from the Clinical Evaluation of Language Fundamentals, Fourth Edition (Semel, Wiig, and Secord 2003) requires the student to arrange words in a grammatically correct form to make a statement or ask a question.
25


III. IMPLEMENTATION ANALYSIS
The purpose of this evaluation is to estimate the impact of four reading interventions on student reading achievement, given that each of the interventions was delivered with as much fidelity and skill as could be attained in a standard school setting. Procedures to ensure high quality implementation included careful selection of teachers to deliver the interventions, initial training and on-going supervision of the instructors by the program developers, and the use of a full-time study coordinator whose duties included working with school personnel to facilitate the scheduling of intervention sessions and to minimize student absences. Although these preconditions for successful implementation were established, we also evaluated the quality and fidelity of the instructional implementation. In this way, we could be assured that observed impacts could be attributed to an intervention that was implemented as planned. Overall, the training and supervision produced instruction that was judged to be highly faithful to each intervention model.
This chapter documents in detail the procedures that were undertaken to ensure such high quality implementation, describes the instruction provided to students in the treatment and control groups, and presents the analyses supporting the conclusion that the interventions were implemented with high fidelity. This implementation and fidelity analysis utilized teacher surveys and ratings of intervention group teachers (by both AIU and reading program staff), as well as videotapes of instructional group sessions. The videotapes provide information on the quality of instruction as well as on the amount of time spent by each program on particular reading activities, thus allowing an exploration of the similarities and differences in reading instruction offered in the four interventions.
A. INSTRUCTION PROVIDED TO STUDENTS IN THE TREATMENT GROUP
The following three criteria informed the selection of interventions evaluated in this study: (1) the extent to which program providers had the capability to provide the teacher training and supervision required by the study design; (2) the extent of existing evidence of the method’s effectiveness in remediating reading difficulties in older children; and (3) the “fit” of the instructional methods within the two instructional contrasts.
We circulated a request for applications to all known program providers with the capacity to participate in the study and, in return, received 12 applications. Nine applications characterized themselves as word level plus comprehension interventions (WL+C) and 3 as word level (WL) interventions. Two members of the study’s scientific advisory board rated the quality of the research evidence available establishing the efficacy of each of the instructional programs, and the methods were then ranked by their scores on this dimension. With too few
27

qualified applicants in the WL instructional category, the advisory board invited one of the highly qualified applications in the WL+C category to submit the word-level component of its program under the WL category. One of the applicants in the WL+C category who was initially invited to participate had to decline because of other commitments during the study’s time frame. One initial difficulty that became apparent early in the selection process was that the remaining two highest-rated WL+C interventions used substantially different methods to teach word-level reading skills. However, given that this initial difference did not violate the basic premise of the instructional category, we included both methods in the WL+C category. The interventions within each intervention category were as follows:
Word Level Plus Comprehension Interventions. The two interventions in the WL+C category were Spell Read Phonological Auditory Training (Spell Read P.A.T.; MacPhee, 1990) and Failure Free Reading (Lockavitch 1996).
Word-Level Interventions. The two interventions in the word-level category were Corrective Reading (Engelmann, Carnine, & Johnson, 1999; Engelmann, Meyer, Carnine, Becker, Eisele, & Johson, 1999; Engelmann, Meyer, Johnson, & Carnine, 1999) and the Wilson Reading System, Third Edition (Wilson 2002). It is important to note that complete versions of both of these interventions contain instructional routines and materials that focus directly on comprehension and vocabulary, but, for purposes of this study, the program providers agreed to focus exclusively on word-level skills.
Below, we briefly describe the four interventions.
Spell Read Phonological Auditory Training (P.A.T.) provides systematic and explicit fluency-oriented instruction in phonemic awareness and phonics along with everyday experiences in reading and writing for meaning. The phonemic activities involve a wide variety of specific tasks based on specific skill mastery, including, for example, building syllables from single sounds, blending consonant sounds with vowel sounds, and analyzing or breaking syllables into their individual sounds. Each lesson also includes language-rich reading and writing activities intended to ensure that students use their language in combination with phonologically based reading skills when reading and writing.
The program consists of 140 sequential lessons divided into three phases. The lesson sequence begins by teaching the sounds that are easiest to hear and manipulate and then progresses to the more difficult sounds and combinations. More specifically, Phase A introduces the primary spelling of 18 vowels and 26 consonants and the consonant-vowel, vowel-consonant, and consonant-vowel-consonant patterns. The goals of Phase B are to teach the secondary spellings of sounds and consonant blends and to bring students to fluency at the two-syllable level. In Phase C, students learn beginning and ending clusters and work toward mastery of multisyllabic words. A part of every lesson involves “shared reading” of leveled trade books and discussion of content. Students also spend time at the end of every lesson writing in response to what they
28

read that day. All groups began with the first lesson but then progressed at a pace commensurate with their ability to master the material. By the end of the intervention period, the students receiving Spell Read instruction had reached points ranging from the end of phase A to the initial lessons of level C.
Failure Free Reading uses a combination of computer-based lessons, workbook exercises, and teacher-led instruction to teach sight vocabulary, fluency, and comprehension. Students spend approximately a third of each instructional session working within each of these formats, so that they spend most of their time working independently rather than in a small group. Unlike the other three interventions, Failure Free Reading does not emphasize phonemic decoding strategies. Rather, it builds the student’s vocabulary of “sight words” through a program involving several exposures and text that is engineered to support learning of new words. Students read material that is designed to be of interest to their age level while challenging their current independent and instructional reading level. Lessons are based on story text controlled for syntax and semantic content. Each lesson progresses through a cycle of previewing text content and individual word meanings, listening to text read aloud, discussing text context, reading the text content with support, and reviewing the key ideas in the text in worksheet and computer formats. Teachers monitor student success and provide as much repetition and support as students need to read the day’s selection.
Although the students are grouped for instruction as in the other three interventions, the lessons in Failure Free Reading are highly individualized, with each student progressing at his or her own pace based on initial placement testing and frequent criterion testing. Two levels of story books are available. Students who show mastery at the second level progress to a related program called Verbal Master, which uses the same instructional principles but emphasizes vocabulary building and writing activities rather than passage reading. Verbal Master activities include listening to definitions and applications of target vocabulary words and interpreting and constructing sentences containing the target words. The curriculum also provides reinforcement exercises such as sentence completion and fill-in-the-blank activities as well as basic instruction in composition. Most of the third grade students assigned to the Failure Free condition spent all of their instructional time working within the first and second level of story sequences. On the other hand, 65 percent of the fifth grade students spent half or more of their instructional time in Verbal Master.
Corrective Reading uses scripted lessons that are designed to improve the efficiency of “teacher talk” and to maximize opportunities for students to respond to and receive feedback. The lessons involve explicit and systematic instructional sequences that include a series of quick tasks intended to focus students’ attention on critical elements for successful word identification. The tasks also include exercises that build rate and fluency through oral reading of stories that have been carefully constructed to counter word-guessing habits. The decoding strand, which was the component of Corrective Reading used in the present study, includes four levels—A, B1, B2, and C. Placement testing is
29

used to start each group at the appropriate level, although, as we will see, the instructional groups in the study were relatively heterogeneous in terms of their beginning skills; therefore, the study did not always permit an optimal match with every child’s initial instructional level. The lessons provided during the study clustered in Levels B1 and B2, with some groups progressing to Level C. By the end of B1, the curriculum covers all of the vowels and basic sound combinations in written English, the “silent-e rule,” and some double consonant-ending words. Students also learn to separate word endings from many words with a root-plus-suffix structure, to build and decompose compound words, and to identify underlying sounds within written words. Level B2 addresses more irregularly spelled words, sound combinations, difficult consonant blends, and compound words while Level C focuses on strengthening students’ ability to read grade-level academic material and naturally occurring text such as that in magazines. Explicit vocabulary instruction is also introduced in Level C, but this component was not provided for those groups that, in fact, reached level C in this program.
The Wilson Reading System uses direct, multisensory structured teaching based on the Orton-Gillingham methodology. Based on 10 principles of instruction, the program teaches sounds to automaticity; presents the structure of language in a systematic, cumulative manner; presents concepts within the context of controlled and noncontrolled written text; and teaches and reinforces concepts with visual-auditory-kinesthetic-tactile methods. Each Wilson Reading lesson includes separate sections that emphasize word study, spelling, fluency, and comprehension. Given that Wilson Reading was assigned to the word-level condition in this study, teachers were not trained in the comprehension and vocabulary components of the method, nor were they included in the instructional sessions.
The program includes 12 steps. Steps 1 through 6 establish foundational skills in word reading while Steps 7 through 12 present more complex rules of language, including sound options, spelling rules, and morphological principles. In keeping with the systematic approach to teaching language structure, all students begin with Step 1, but groups are then free to move at a pace commensurate with their skill level. By the end of the intervention period, all students receiving the Wilson Reading intervention had progressed to somewhere between Steps 4 and 6.
B. INSTRUCTION PROVIDED TO STUDENTS IN THE CONTROL GROUP
Students assigned to the control group were to receive the type and amount of intervention instruction they would have received from their schools in the absence of the study. As seen when we report on the total amount of instruction provided to all groups, the amount of small-group and individualized instruction received by students in the control group was considerable; in fact, it approached the amount provided to the students in each intervention condition. With students in the study spread across 27 school districts, with potentially different reading curricula, the nature of the
30

instruction received by the students in the control group was probably variable. Although we have data on the amount of reading instruction received by each student in the control group, we did not collect data like we did for students in the interventions indicating how that time was distributed across different types of reading activities, such as time building word-level skills versus time developing comprehension skills or vocabulary. This limits our ability to describe the reading instruction received by students in the control group and compare that instruction to the instruction provided to students in the interventions.
C. DELIVERY OF INTERVENTION INSTRUCTION
The study plan called for delivering as close to 100 hours of instruction as possible in 60-minute sessions, five days a week, to groups of three students. After random assignment to the intervention or control group within each school unit, the intervention students were placed in instructional groups according to their classroom schedules. An attempt was also made to match students in the instructional groups as closely as possible on their initial levels of word reading skill so that instruction could be targeted on student needs more effectively, but this was not always possible given the small numbers of students assigned to the interventions at each grade. Each teacher was to teach four groups a day. The actual implementation of instruction differed in several ways from the study’s plan. The major deviations pertained to amount of instruction provided, size of instructional groups, and group homogeneity in terms of beginning word-level reading skills. Each of these issues is addressed below.
1. Intensity of Interventions
In planning the study, we recognized that groups occasionally would not be able to meet or would have to cut short their instruction. In fact, occurrences such as school assemblies, snow days, and school closings for other reasons sometimes prevented groups from receiving instruction. In addition, individual students were absent on some days. To offset these unavoidable irregularities, we put into place several strategies as follows:
First, the intervention groups were scheduled to run for more than 100 days so that, on average, students would accumulate 100 hours of intervention.
Second, substitute teachers were hired and trained so that groups could meet when the regular teacher was absent.
Third, the local coordinator worked with classroom teachers and administrators at the participating schools to try to minimize disruptions to the intervention groups.
31

Fourth, intervention teachers were asked to conduct make-up sessions for students who missed significant amounts of group time.
A central question of implementation fidelity is whether participants received the intended dose of the intervention. To answer this question, the study asked intervention teachers to maintain attendance logs on which they recorded, for each school day during the implementation period, (1) whether the group met, (2) which students were present or absent, (3) the number of minutes of instruction for each student, and (4) the number of minutes of make-up instruction for each student, if any.
Using the sample of videotapes collected for the instructional fidelity analysis (18 to 20 videotapes per reading program), we compared total session time recorded on the tape with the minutes of instruction recorded by the intervention teacher on the attendance log. The modal entry for the attendance log was 60 minutes, although some sessions were recorded as shorter or, occasionally, longer. On average, the time recorded on the videotape, from the moment the students entered the room to the moment they were dismissed, was 5.9 minutes shorter than the time recorded on the attendance log. No pattern in the discrepancy was associated with whether the attendance log showed a straight 60 minutes or some other number. Based on the available information, we determined that 5.9 minutes should be subtracted from each log entry in calculating the total hours of intervention for each student.
Table III.1 displays the percentage of students who reached certain benchmarks in total hours of intervention, including students who received at least 80 hours of intervention; students who received at least 40 hours of intervention but fewer than 80; and students who received at fewer than 40 hours of intervention. As can be seen, over 90 percent of students in the treatment group received at least 80 hours of instruction.
Table III.1
Percentage of Students Attaining Different Levels of Intervention Hours
More than 80 92.3More than 40 but fewer than 80 4.5Fewer than 40 3.2
When we considered group size, we found that, across the four reading interventions, more than three-quarters of intervention hours were delivered to groups of three students, as intended. Very few hours, on average, were delivered to only one student. We observed no significant differences between interventions with regard to average total hours or average hours by group size
32

(see Appendix K for details).21 However, we did note one significant difference by grade level, with fifth-grade students receiving fewer (88) total hours of intervention, on average, than third-grade students (93 hours) [t(399) = 2.88, p < .01].
Finally, we investigated the average hours of instruction delivered by substitute rather than regular teachers for each intervention: Failure Free Reading = 4, Spell Read = 3, Wilson Reading = 6, and Corrective Reading = 6. The hours did not differ significantly between interventions (see Appendix K for details). However, three of the teachers in the Wilson Reading program were permanently replaced by a teacher from the substitute teacher pool for the last two to four weeks of instruction because the regular teachers left on maternity leave. If these “permanent substitute” hours were added to the total hours delivered by substitute teachers, then Wilson Reading would clearly differ from the other interventions in terms of total number of hours delivered by substitutes.
2. Instructional Group Heterogeneity
In providing remedial instruction to older students in word-level reading skills, it is common practice to form instructional groups that are as homogeneous as possible with regard to the basic skills being taught. Clearly, appropriate grouping of students for instruction was of concern to three of the study’s four program providers. Corrective Reading, for example, administers a placement test that allows students to be placed in the program at the appropriate point depending on initial skill level. Although both Spell Read and Wilson Reading start at the same point for all students, students progress through the program in accordance with their mastery of skills. If students work at different levels of knowledge and skill, teachers find it difficult to target instruction at the appropriate level for every student.
The study design called for the random selection of six students in grade three and six students in grade five, within each school unit, to participate in the intervention. The remaining students were placed in the control group and received the services they would normally receive in the absence of the intervention. In addition to the approach that we implemented, two other approaches were considered when designing the experiment: (1) do random assignment within strata defined by test scores or (2) use the approach that we implemented, but after selecting six students for the treatment group, sort them into two groups of three based on test scores. We used our approach so that program developers could form groups the way that they normally would given the mix of students who were eligible for an intervention according to the study criteria and selected at random to receive the intervention.
21 Because this evaluation was not designed to compare the individual interventions with each other, there is relatively low power for conducting a series of tests for pairwise differences between the interventions. We conduct, instead, one test for differences across all four interventions on each variable of interest.
33

One approach for reducing within-group heterogeneity would have been to impose more stringent eligibility criteria, by, for example, lowering the upper threshold on the word-level screening test from the 30th percentile to the 20th percentile. That, however, would have substantially reduced the size of the evaluation sample and the power to detect impacts. Another approach to reducing heterogeneity would have been to implement the evaluation in schools with many more eligible students and create at least several instructional groups in each school—an approach that was largely infeasible in the AIU. Given the relatively small number of students selected for the intervention and the range of students identified through the eligibility screening process, program developers may have had to create groups with more heterogeneity than they would have if they were working with larger numbers of students. However, in follow-up conversations, the program developers indicated that the extent of within-group heterogeneity that existed within this study was not unusual in comparison with what they normally confront when delivering their interventions in other settings.
Table III.2 shows the average range between the highest and lowest scores on the baseline Word Attack measure for the instructional groups in each condition. There were no significant differences in the heterogeneity of the groups across methods or grades. On average, the range of scores within the instructional groups on the beginning measure of phonemic decoding skill was almost a full standard deviation.22
22 Appendix N provides information on an analysis done to assess the effects of instructional group heterogeneity on students’ reading outcomes. No consistent pattern in the relationship between instructional group heterogeneity and reading outcomes was found.
34

Table III.2
Mean Range of Baseline Word Attack Scores within Instructional Groups
Failure FreeReading Spell Read
WilsonReading
CorrectiveReading
Third GradeMean 14.3 13.5 13.1 13.2Standard deviation 9.3 7.0 6.6 7.3N 56 57 51 48
Fifth GradeMean 15.8 12.4 17.4 14.2Standard deviation 8.5 9.6 9.8 6.9N 60 60 54 59
D. SELECTION, TRAINING, AND SUPPORT OF TEACHERS
1. Teacher Selection
We selected the intervention teachers from the schools that agreed to participate in the study. The principal of each school sought volunteers and then nominated two or three teachers to be interviewed by the research coordinator. We then used four criteria to select intervention teachers from among potential participants: (1) experience and interest in providing the type of intensive instruction examined in the study; (2) willingness to be randomly assigned to one of four intervention methods, one of which would be highly scripted; (3) personality and capability as assessed informally by the interviewer; and (4) scores on tests of phonemic awareness and phonemic decoding fluency. The second criterion required careful explanation as some teachers object strongly to working within a scripted curricula. The fourth criterion was essential because three of the four interventions involved explicit instruction in phonics; moreover, two of the program providers (Spell Read and Wilson Reading) indicated that teachers who struggle with “phonics” have a more difficult time gaining proficiency in the delivery of instruction within their programs. As part of their interview, the teachers agreed to take the Elision subtest from the CTOPP and the Phonemic Decoding Efficiency subtest from the TOWRE.
Our goal was to hire 44 teachers (10 for each intervention plus 4 substitutes). Because of difficulties at two of the schools originally recruited into the study, Wilson Reading and Corrective Reading ended up with 9 rather than 10 teachers regularly leading instructional groups.23 For the 38 teachers eventually recruited into the study (excluding substitutes), Table III.3 shows the average years of teacher experience, by intervention.
23 A tenth Corrective Reading teacher was trained and delivered instruction, but, with no control students at the school to which she was assigned, her students were not included in the analyses for the study.
35
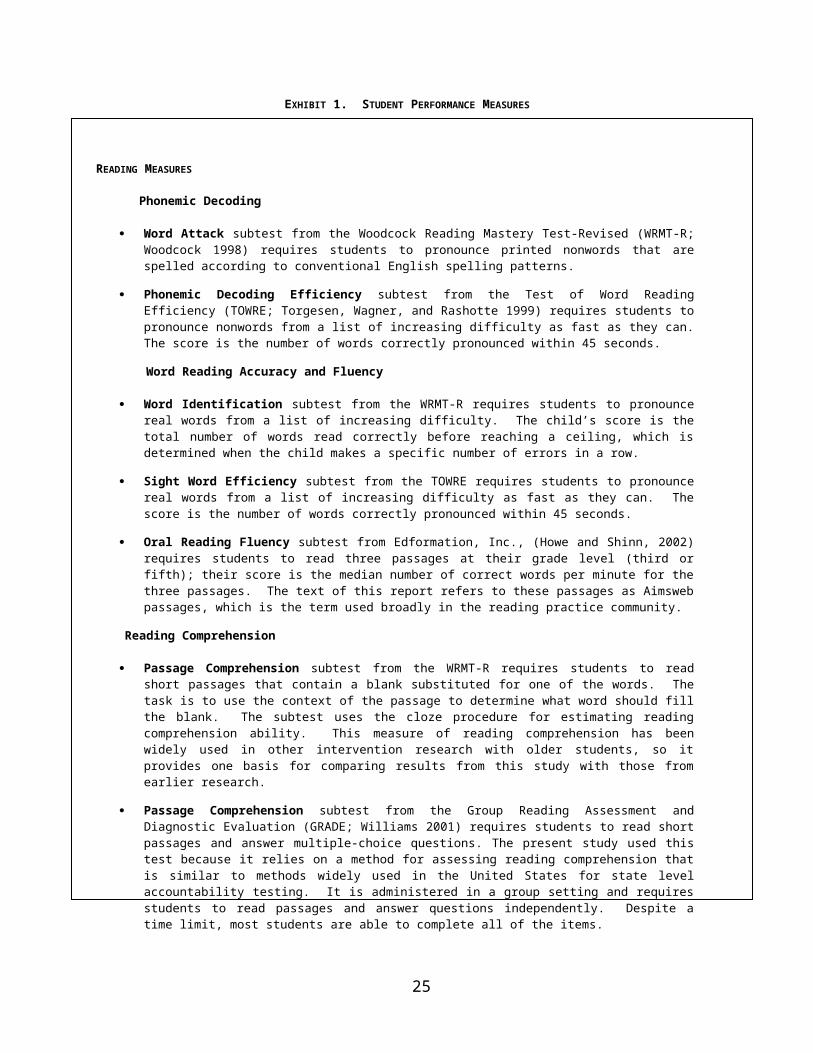
The teachers in the Failure Free program had significantly more years of teaching experience than those delivering the Wilson Reading program
[Tukey’s HSD (Alpha: .05, Error: 34) = 75.58].24 Another way to
24 Although we can not provide the details for each program for confidentiality reasons, there were no significant differences across programs in terms of the highest degree obtained by teachers [X2(6, N=38) = 10.09, p=.12].
36
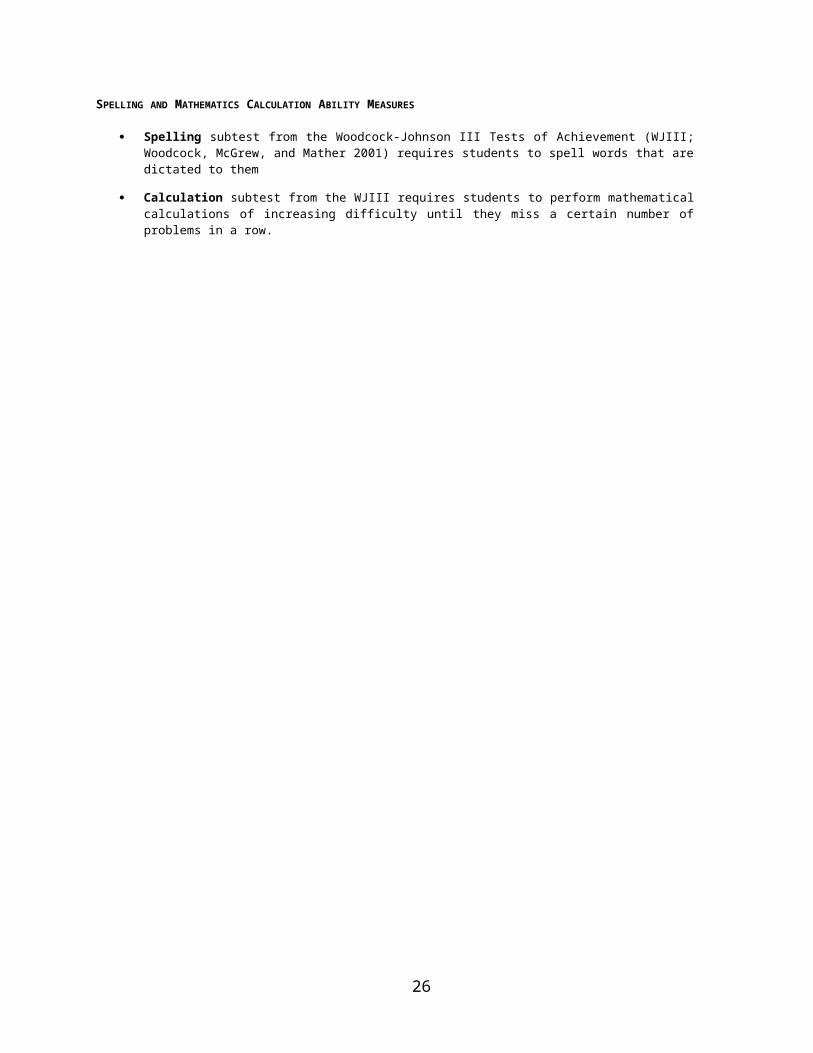
Table III.3
Average Years of Teaching Experience, by Intervention
Failure FreeReading Spell Read
Wilson Reading
Corrective Reading
Average Years of Teaching Experience 20 11.1 8.9 15.3
look at teacher training is to consider the area of certification. The most common certifications were no systematic associations between type of certification and instructional program [X2(12, N=38) = 10.05, p=.61].
Table III.4 reports the raw scores for teachers in each condition on the measures of phonemic awareness and phonemic decoding efficiency. The groups were not significantly different with regards to either measure (phonemic awareness [F(3,34 = 0.72, p = 0.5447]; phonemic decoding efficiency [F(3,34) = 2.80, p = .0549]).
Although the age of the teachers in this study fell outside the range of the standardization sample for both of these tests, it is possible to provide some perspective on the above scores by comparing them to the normative performance of the oldest group (20 year olds) from that sample. Compared to this group, the average standard score of our intervention teachers on the Elision subtest was 105, with a range from 90 to 110. The average standard score on Phonemic Decoding Efficiency was 97, with a range from 79 to 120. The average standard score on the latter measure for each instructional condition was Corrective Reading = 106, Spell Read = 100, and Wilson Reading and Failure Free Reading = 93. Thus, almost all of the teachers fell within the average range on these measures of phonemic awareness and phonemic decoding fluency, but a few in several of the conditions performed substantially below average for adults.
2. Teacher Training and Support
Representatives of the four reading programs used in the interventions trained the intervention teachers. Initial training was provided in a week-long session before school began. Following this initial training, teachers practiced delivering the interventions for about seven weeks with groups of fourth grade students from participating schools. During this practice period, trainers provided weekly training and observation contacts with the teachers. During the implementation phase with third and fifth graders, program providers made at least monthly follow-up visits with the teachers. Providers could, however, increase their follow-up support at their discretion in order to model more closely the typical support given to teachers involved in their programs. In fact, all four interventions chose to increase their support such that each teacher received an average 38.3 hours of professional development during
37

approximately nine months of the practice and implementation period, with nearly 24 of the hours concentrated in the six- to eight-week practice period.
The initial training was conducted over five days. All of the teachers (including substitutes) convened in one setting but spent most of the training time working with trainers from the specific reading intervention to which they were assigned. During the week, a few training hours were devoted to explaining the purposes of the study and the logistics of student selection, formation of reading groups, student assessments, and record keeping. We estimate that, on average, teachers received training related to the delivery of their reading interventions for about 6.5 hours per day, or 32.5 hours for five days.
38

Table III.4
Raw Scores for Teachers on Measures of Phonemic Decoding Efficiency and Phonemic Awareness
Metric
Failure Free Reading Spell Read Wilson Reading Corrective Reading
MeanStandardDeviation Mean
StandardDeviation Mean
StandardDeviation Mean
StandardDeviation
Phoneme Elision 19.3 0.82 18.9 1.10 18.8 1.20 18.7 0.82Phonemic Decoding Efficiency 50.2 6.99 55.5 6.98 50.3 8.56 57.9 4.84
In general, the August training was structured to allow the teachers to experience their program from the perspective of a student. The teachers gradually took on more of the teaching behaviors as they practiced with their peers and with the trainer. The providers of Wilson Reading and Spell Read, which include detailed phonemic training as part of their programs, spent proportionally more time shaping teachers’ skills in recognizing and reproducing phonemic patterns. The provider of Failure Free Reading spent nearly all of the initial training week on the computer-based aspect of the program. The provider of Corrective Reading, which contains a substantial number of specific, scripted teaching routines, worked with teachers to help them master the small-group instruction routines and gain familiarity with lesson formats.
For several reasons, there was some variation in the modes and amount of training that teachers received during the study. Several teachers attended only some of the initial five days of training or missed them altogether because of either personal circumstances or the fact that they had not been hired when the training took place. Trainers returned to deliver make-up training in late August and early September.
Another source of variation was differences in the amount and type of follow-up support that programs typically provided to teachers. While the study team agreed that the interventions could follow their typical practice after the initial training, the study team put in place procedures for documenting follow-up training and coaching activities. In this way, we were able to analyze and report on differences in training/coaching activities, something of potential interest if decision makers consider adopting the interventions in the future.
To document the amount and type of professional development that teachers received subsequent to the initial August training, both teachers and trainers maintained logs of their training-related activities. The forms provided space to record the date and duration of each activity and the number of participating teachers and trainers. In addition, the logs provided a series of check-off boxes to characterize the type of activity. Professional development activities through which teachers received guidance or support from the reading program providers included the following:
39

Group instruction delivered by a reading program trainer (a meeting of all or most teachers delivering a particular reading program, during which the trainer presented new material and/or teachers discussed issues that had arisen as they worked with students)
Coaching (the trainer worked with teachers in a classroom setting either individually or with other teachers observing)
Telephone consultations of at least five minutes’ duration focusing on instructional issues
Independent study (Wilson Reading teachers were encouraged to work through a self-paced online course that reinforced information provided during the August training; other teachers reviewed training materials or pursued additional reading on their own)
Comparisons between activities recorded in the teacher and trainer logs revealed some inconsistencies in individuals’ reports of the occurrence and duration of specific training events. Consequently, we based our estimates of the total hours of support provided to teachers on the combined reports of teachers and their trainers. (When a teacher and trainer reported different durations for a single event, we used the average of the two reports as the event duration.) In view of the incompleteness of the data submitted by individual teachers and trainers and the differences in details provided for the same events by different reporters, the following summary should be understood as an approximation rather than as a precise accounting of the professional development in which teachers participated.
Table III.5 summarizes the average hours of instruction and support that teachers received during the initial training, practice, and implementation phases of the study. The phases are defined as follows:
The training phase, including the intensive training received before school began and make-up training provided in August and September
The practice phase (with fourth-grade students between September and the beginning of the implementation phase)
The implementation phase (with third- and fifth-grade students who were the subjects of the experimental study, beginning in November)
On average, teachers received almost 69 hours of professional development during the study—over 30 hours during the intensive training phase, 24 during the practice phase, and 14 during the implementation phase. With training, coaching, independent study, and telephone consultations considered together, we observed statistically significant differences between programs in the number of hours of professional development received by teachers during the implementation phase [F(3,34) = 22.66, p<.0001] and overall at the .05 level
40

[F(3,34) = 3.92, p =.0165], but not during the intensive training or practice phases.
The interventions also varied somewhat in the mix of supports each provided (see Tables III.6 through III.8). The vast majority of professional development hours (64) took the form of training or coaching. However, the two interventions for which fewer training and coaching hours were reported, Wilson Reading and Failure Free Reading, used additional methods to support their teachers. Wilson Reading augmented its face-to-face training and coaching with an online course that included video clips of Wilson Reading training sessions, comments on the content covered in each part of the curriculum, and demonstrations of instructional techniques. Wilson Reading teachers reported that they spent an average 11 hours in independent study in contrast to teachers in the other interventions, who averaged about 20 minutes of independent study during the year. Follow-up support for Failure Free Reading teachers included periodic voluntary telephone conferences with program providers. Failure Free Reading teachers reported that they participated in about 5.9 hours of telephone conferencing over the year in contrast to teachers in other interventions, who averaged about 25 minutes of telephone conversations.
41

Table III.5
Average Hours of Professional Development Received by Teachers, by Interventiona
All Interventions
(N = 38)
Failure Free Reading(N = 10)
Spell Read(N = 10)
WilsonReading (N = 9)
Corrective Reading(N = 9)
Intensive training phase 30.5 29.6 30.1 29.4 32.8Practice phase 23.9 25.2 24.9 18.9 26.4Implementation phase 14.4 8.7 23.1 14.2 11.6 *Overall 68.8 63.5 78.1 62.5 70.8 *
aProfessional development includes training and coaching by reading program staff, independent study of program materials, and telephone conferences.* Overall difference between groups is statistically significant at the 0.05 level.
Table III.6
Average Hours of Training and Coaching Received by Teachers from Reading Program Staff
All Interventions
(N = 38)
Failure Free Reading(N = 10)
Spell Read
(N = 10)
Wilson Reading(N = 9)
Corrective Reading(N = 9)
Intensive training phase 30.5 29.6 30.1 29.4 32.8Practice phase 21.0 21.3 24.6 11.4 26.2 *Implementation phase 12.6 6.1 22.6 9.9 11.5 *Overall 64.1 57.0 77.3 50.8 70.6 *
* Overall difference between groups is statistically significant at the 0.05 level.
Table III.7
Average Hours of Independent Study Reported by Teachers
All Interventions
(N = 38)
Failure FreeReading(N = 10)
SpellRead
(N = 10)
Wilson Reading(N = 9)
Corrective Reading(N = 9)
Practice phase 2.0 0.6 0.2 7.5 0.1Implementation phase 0.9 0.0 0.0 3.7 0.0 *Overall 2.9 0.6 0.2 11.2 0.1 *
* Overall difference between groups is statistically significant at the 0.05 level.
42

Table III.8
Average Hours of Telephone Consultations Reported by Teachers
All Interventions
(N = 38)
Failure Free Reading (N = 10)
Spell Read (N = 10)
Wilson Reading (N = 9)
Corrective Reading(N = 9)
Practice phase 0.9 3.3 0.09 0.05 0.07 *Implementation phase 0.9 2.6 0.50 0.49 0.04 *Overall 1.8 5.9 0.58 0.54 0.11 *
* Overall difference between groups is statistically significant at the 0.05 level.
In summary, over the course of the study, the reading program providers delivered nearly 70 hours of training and professional development to intervention teachers. The total amount of professional development and the amount of face-to-face coaching and instruction offered by the various programs differed significantly from intervention to intervention. However, all the program providers agreed that the amount of training and professional development equaled or exceeded what they would typically deliver to new teachers in a school setting.
In addition to the support provided by the program providers, the study coordinators from the AIU assisted teachers in dealing with issues related to scheduling instructional sessions, obtaining permission forms from parents, rescheduling instructional sessions, and behavior management that arose in the course of instruction.
E. TEACHER QUALITY AND FIDELITY OF INSTRUCTIONAL IMPLEMENTATION
The study evaluated the performance of the intervention teachers along two dimensions: (1) the fidelity with which they implemented the specific requirements of the reading program to which they were assigned and (2) the extent to which they exhibited more general behaviors, such as good organization, that are consistent with good-quality teaching.
Two sources of data contributed to the fidelity evaluation while a third source was available for the evaluation of general teacher quality. For the fidelity evaluation, we obtained two rounds of ratings from the reading program trainers and coded two videotapes of each teacher. For the more general teacher quality evaluation, we used data from these same two sources and obtained ratings for an average of three sessions per teacher observed by the AIU coordinators. The value of the videotape analysis was that it allowed for an independent and fine-grained analysis of instructor behavior. However, resource constraints dictated that such an analysis could cover only a small sample of the instructors’ total performance. Moreover, there were significant aspects of the program implementations that did not lend themselves to
43

evaluation through this type of time-sampling methodology. In particular, all of the programs had some expectation that instructors would pace the instruction and individualize the intervention in relation to each student’s progress, and this is not readily observed in an analysis of a single instructional session. (The extent to which instructors were expected to tailor the instruction varied from program to program, however, with Corrective Reading making the fewest demands in this respect and Wilson Reading making the greatest.)
The ratings by the program providers, who worked with the instructors on an ongoing basis, offered the opportunity to capture this missing information on pacing, as well as other aspects of instructor performance. In addition, the providers were clearly expert in the fidelity requirements of their specific programs, so their ratings could not be criticized for missing critical aspects of instructor behaviors. On the other hand, however, the providers had a stake in the outcomes of the study and thus could not be classed as independent observers. To balance concerns about the provider’s stakeholder status, all ratings of the fidelity of the intervention were collected before the providers were given any information about the impact on student performance. In fact, information on student outcomes was also withheld from the study staff responsible for the fidelity analysis until after that analysis was complete.
All of the teacher quality and fidelity evaluations focus on the regular teachers, not on the substitutes. As shown in the section on hours of intervention, the regular teachers delivered a high percentage of the total intervention hours. The following discussion considers the two types of rating data and the videotape analysis.
1. Trainer Ratings of Fidelity and Teacher Quality
Trainers rated teachers twice: in the fall (at the end of the practice period) and in the spring (near the end of the intervention period). The trainers provided two types of ratings: (1) a global estimate of how a teacher’s performance compared with the performance of all teachers with similar amounts of training and teaching experience that the trainer had ever observed, and (2) ratings on eight dimensions of the teacher’s delivery of the program. The first five dimensions specifically address intervention fidelity while the remainder deal with general teacher quality.
Table III.9 shows the average global ratings assigned by each program, based on a six-point scale that locates the teacher within percentile ranges (1 = lowest 10 percent, 2 = lowest quarter but not lowest 10 percent, 3 = lower half but not lowest quarter, and so on). The table shows that, on average and despite significant differences among programs, trainers judged teachers to fall somewhere in the top half among similarly experienced teachers whom they had observed. In the fall, the average ratings earned by the Spell Read teachers were lower and significantly different [Tukey’s HSD (Alpha: .05, Error: 34) = 1.006] than the ratings earned by the Failure Free Reading or Corrective Reading teachers. (In the spring, the ratings of the Wilson Reading teachers
44

were significantly lower than those of the Corrective Reading teachers [Tukey’s HSD (Alpha: .05, Error: 34) = 1.90]. However, given that trainers rated only those teachers trained in their given intervention, it is not possible to determine the extent to which the observed differences across programs may reflect rater bias rather than actual differences in teacher quality.
Table III.10 summarizes the ratings on eight dimensions of program delivery. The ratings used a seven-point scale ranging from 1 = unsatisfactory performance through 3 = satisfactory performance to 7 = expert performance. The average ratings on all eight dimensions in both fall and spring generally ranged from about 4.0 to 6.8—well above the satisfactory (3) level. We thus see that the program providers did not have any serious reservations about the quality and fidelity of the instruction delivered in this study.
2. Ratings of Instructional Sessions by AIU Staff
AIU staff observed each intervention teacher about three times during the year, at roughly two-month intervals. Observations lasted for approximately a half hour, with the teachers’ performance during the period rated on seven dimensions in accordance with a three-point scale (1 = significant problems, 2 = minor problems, 3 = satisfactory performance). We used the sum of the ratings to construct an overall session rating as well. The range for the summary scale was 7 to 21, although no session received a summary score lower than 13.
45

Table III.9
Trainers’ Global Ratings of Program Implementation
Overall, the ratings suggest that, on average, AIU staff saw consistent instruction and classroom management during their visits to the instructional groups. Average session ratings for the four programs ranged from 19.6 to 20.6 (see Table III.11), and were not significantly different at the .05 level [F(3,107) = 2.38, p = .0732]. All of the average dimensional ratings were at least 2.5 points, and most were over 2.8. Variations among programs were significant at the .05 level in only two instances: mean ratings for the Wilson Reading sessions were lower than those for other programs on the teachers’ management of student behavior [F(3,107) = .0042, p = .0042] and on the provision of feedback in a positive manner [F(3,107) = 7.06, p = .0002]. (Wilson Reading ratings on these two dimensions were 2.5 and 2.7, respectively.)
3. Videotape Analysis
The intervention period provided opportunities to complete two videotaped observations of each intervention teacher, one videotape of a third-grade instructional group and the other of a fifth-grade instructional group. A total of 38 teachers were videotaped, 9 each from Corrective Reading and Wilson Reading and 10 each from Spell Read and Failure Free Reading. Each videotape covered an entire instructional session. The study made every effort to complete the first videotaping of each teacher during the first half of the intervention period and the second during the second half, although the logistics of developing a workable videotaping schedule sometimes necessitated a shorter-than-desired period between the two sessions.
Trained coders analyzed the videotapes with respect to the core instructional elements of each of the four interventions and the manner in which the elements might be expected to interact in order to achieve desired outcomes. The output of the analysis took the form of a “running record” for each videotape. This running record provided a running summary of the activities taking place in the classroom, on a minute-by-minute basis, and was the basis for both the ratings of fidelity/general teacher quality and the time-by-activity analysis discussed later in this section. Appendix I presents the coding procedures used to analyze the videotapes.
The study hired and trained seven coders, all educators with experience teaching reading in the primary grades, to assist with the construction of the running records. The coders analyzed each of the 76 recorded sessions, and a
46
Failure Free Reading Spell Read
Wilson Reading
Corrective Reading
Global implementation rating (1–6 scale) Mean N Mean N Mean N Mean NFall 2003 6.00 10 4.00 10 5.00 9 5.56 9Spring 2004 5.30 10 4.10 10 3.61 9 5.67 9

sample of 18 sessions, distributed across the four reading programs, was reanalyzed by a second coder who constructed a second running record.
The videotape analysis of the interventions followed a general procedure for all four interventions but also focused on various features specific to each intervention. Coders noted the beginning and ending times for each activity within a session and were directed to note and time stamp significant events,
47

Table III.10
Trainers’ Ratings of Eight Dimensions of Program Implementation
Failure Free Reading Spell Read Wilson Reading Corrective Reading
Rating Dimensions Mean N Mean N Mean N Mean N
Fall 2003 Ratings1. Lessons include all prescribed program elements,
appropriate sequence, and time frame3.60 10 4.90 10 4.22 9 5.78 9
2. Mastery of program techniques, materials, and technology
3.10 10 4.50 10 4.44 9 5.67 9
3. Program’s prompting, correction, and questioning strategies used
3.30 10 4.60 10 4.78 9 6.00 9
4. Effective lesson delivery, attention to pacing and transitions
3.30 10 4.90 10 4.78 9 5.89 9
5. Lesson plans and program record keeping completed 3.70 10 4.90 10 5.00 8 6.11 96. Student performance monitored, attention divided equally
among students3.50 10 4.50 10 5.00 9 6.00 9
7. Intervention as necessary to maintain students’ attention and appropriate behavior
3.90 10 4.80 10 5.00 9 5.89 9
8. Good rapport and use of positive reinforcement 3.90 10 5.40 10 5.11 9 6.11 9
Spring 2004 Ratings1. Lessons include all prescribed program elements,
appropriate sequence, and time frame5.50 10 5.20 10 5.00 9 6.56 9
2. Mastery of program techniques, materials, and technology
5.50 10 5.00 10 5.33 9 6.44 9
3. Program’s prompting, correction, and questioning strategies used
5.90 10 4.90 10 5.56 9 6.56 9
4. Effective lesson delivery, attention to pacing and transitions
5.70 10 5.00 10 5.00 9 6.44 9
5. Lesson plans and program record keeping completed 6.10 10 5.10 10 5.56 9 6.78 96. Student performance monitored, attention divided equally
among students6.00 10 4.60 10 5.11 9 6.44 9
7. Intervention as necessary to maintain students’ attention and appropriate behavior
6.80 10 4.80 10 5.33 9 6.11 9
8. Good rapport and use of positive reinforcement 6.70 10 5.10 10 5.56 9 6.44 9
41

Table III.11
AIU Staff Ratings of General Teacher Quality
Failure Free Reading Spell Read
Wilson Reading
Corrective Reading
Rating Dimension Mean N Mean N Mean N Mean N1. Managed time appropriately 2.90 29 2.83 30 2.88 25 2.81 272. Was well prepared 2.86 29 2.97 29 2.88 25 2.93 273. Followed effective instructional procedures 2.97 29 2.90 30 2.92 25 2.85 274. Managed student behavior effectively 2.93 29 2.73 30 2.52 25 2.85 27
5. Monitored student behavior effectively 2.93 29 2.97 30 2.92 25 2.85 276. Provided feedback in a positive manner 2.97 29 2.93 30 2.68 25 3.00 27
7. Had good rapport with students 3.00 29 2.93 30 2.80 25 2.93 27
Overall session rating 20.55 29 20.27 30 19.60 25 20.22 27N = number of sessions rated.
depending on the intervention, that occurred within each activity. In Corrective Reading sessions, for example, coders made note of the teacher’s use of correcting procedures while, in Spell Read sessions, coders noted the teacher’s monitoring of hand motions. Coders noted the extent to which teachers “wove” previously learned concepts into new instruction in Wilson Reading sessions. As a more individualized program, Failure Free Reading required separate analysis of the instructional experiences of each student, with the most attention devoted to capturing teacher-student interactions and somewhat less attention directed to noting time either on the computer or engaged in individual written work.
Coders wrote brief notes describing types of motivators (e.g., candy, stickers, bonus points, and so forth.), evidence of homework, the nature of the instructional space (e.g., size of room, noise level, and so forth), and their impressions of the affective environment of the lesson. In addition, coders filled out a sheet that summarized key components of the observation. Although some components addressed by the summary sheets were intervention-specific, all addressed teacher organization and preparation, classroom management, and positive reinforcement and praise. Program providers reviewed the coding conventions for the analysis of each intervention and modified them before use by the coders.
After completion of the running records, two study staff members undertook the fidelity/teacher quality analysis by using a set of dimensions that were as comparable as possible across programs. The dimensions included (1) coverage of program content, (2) use of program techniques, (3) management of instruction, (4) appropriate use of positive reinforcement, (5) general affective environment, and (6) total teaching time. In addition, appropriate allocation of time across session components was a factor for every reading program except Corrective Reading. (The highly constrained session script used in Corrective Reading ensures an appropriate allocation of time across components.)
49

In some cases, the dimensions required further refinement in order to capture potential differences in the teacher’s fidelity across disparate program elements. For example, in Spell Read, content coverage, time allocation, and technique needed to be rated separately for the phonemic portion of the lesson and for the story reading portion of the lesson.
The two study staff members coded each dimension on a three-point scale. A code of 3 indicated that performance on that dimension met criterion. (Meeting criterion did not necessarily signify that performance was highly expert but rather that it was faithful to the basic requirements of the program.) A code of 2 indicated minor deviations from the criterion, and a code of 1 indicated moderate deviations. There were no instances of extreme deviations.
The specific coding systems were submitted to the reading program providers for comment and approval. All of the providers were satisfied that the specified dimensions and criteria would capture fidelity within the context of a single session. However, the study staff and program providers agreed that some important features of program implementation did not lend themselves to evaluation in the context of a single session. For example, the session analysis was not suited to evaluating the extent to which teachers were able to judge the specific strengths and weaknesses of individual students over time and thus adjust the pacing or choice of discretionary exercises accordingly. In Wilson Reading, in particular, which accords teachers considerable latitude in constructing sessions out of a variety of available lesson materials, appropriate session planning is an important skill.
The same two study staff members rated each running record. In the case of more than one running record for the same videotape, they rated each running record separately. The Kappa statistics for inter-rater reliability—across raters and across ratings made from different running records—were: Corrective Reading = .89, Spell Read = .80, Wilson Reading = .90, and Failure Free Reading = .84. These levels of agreement were high, but not unexpected given that the two raters had both been involved in the development of the rating scheme and had detailed discussions about the kinds of evidence that would be used to support the ratings before they began.
Tables III.12 through III.15 present the average ratings on the fidelity dimensions coded for each program. As seen in Table III.12, average scores were above 2.75 on most dimensions, indicating that most Corrective Reading sessions met criterion on these dimensions. However, average scores were lower for proper use of program techniques and total teaching time. With respect to program techniques, the problems reflect the fact that Corrective Reading operates with a highly prescriptive formula for student corrections; many teachers did not strictly adhere to that formula. (Other shortcomings in technique were also observed, but the infractions affecting the correction routine were the most common.) With respect to total teaching time, criterion was set at 55 minutes or more time. Even though program providers and project staff generally agreed that 55 minutes or more was an appropriate criterion, a high proportion of sessions in all programs failed to meet the
50

criterion. In the case of Corrective Reading, most sessions were between 45 and 55 minutes in length, which resulted in ratings of “minor problems” on the total teaching time dimension.
Table III.13 shows that, for Spell Read, average scores were 2.50 or higher on most dimensions. The exceptions were coverage of lesson content—reading and writing (2.37), proper use of program techniques—reading and writing (2.47), and total teaching time (2.35).
Table III.14 presents the Wilson Reading ratings. Given the program’s greater variability in session structure (different activities occur on different days), the average ratings for some dimensions are based on fewer than 18 sessions. However we once again see that most dimensions have average scores above 2.50. As with Spell Read, the lower-rated dimensions are concentrated in the areas of passage reading Wilson Reading than for Corrective Reading or Spell Read (although not more pronounced than for and total teaching time. In fact, deficiencies with regard to total teaching time were more pronounced for Failure Free Reading, as discussed below). Of the 17 Wilson Reading sessions evaluated for total teaching time, only 3 sessions met the 55-minute criterion, 8 sessions lasted between 45 and 55 minutes and demonstrated minor time criterion problems, and 6 sessions had moderate problems such that total session length was less than 45 minutes. One Wilson Reading session could not be rated on the time dimension because the videotape stopped before the session concluded.
51

Table III.12
Scores on Fidelity Dimensions Coded from Videotapes: Corrective Reading
Average Scorea
Coverage of lesson content 2.78Proper use of program techniques 1.83Management of instruction 2.94Positive reinforcement 2.89Affective environment 2.83Total teaching time 2.22
a Scale: 3=meets criterion; 2=minor problems; 1=moderate problems
Table III.13
Scores on Fidelity Dimensions Coded from Videotapes: Spell Read P.A.T.
Average Scorea
Coverage of lesson content—phonics 2.60Duration of lesson content—phonics 2.90Coverage of lesson content—reading and writing 2.37Duration of lesson content—reading and writing 2.50Proper use of program techniques—phonics 2.50Proper use of program techniques—reading and writing 2.47Management of instruction 2.85Positive reinforcement 2.90Affective environment 2.85Total teaching time 2.35
a Scale: 3=meets criterion; 2=minor problems; 1=moderate problems
Table III.14
Scores on Fidelity Dimensions Coded from Videotapes: Wilson Reading
Average Scorea
Coverage of lesson content—decoding 2.78Duration of lesson content—decoding 2.50Coverage of lesson content—encoding 2.88Duration of lesson content—encoding 2.87Coverage of lesson content—passage reading 2.69Duration of lesson content—passage reading 2.43Proper use of program techniques—decoding and encoding 2.56Proper use of program techniques—passage reading 2.46Management of instruction 2.78Positive reinforcement 2.56Affective environment 2.72
Total teaching time 1.82 a Scale: 3=meets criterion; 2=minor problems; 1=moderate problems
52

Finally, Table III.15 provides the ratings for Failure Free Reading. Even more than with the other programs, Failure Free Reading exhibited deficiencies in adherence to the criterion for total teaching time. Only 2 of the 20 videotaped sessions met the criterion of a 55-minute session, and 6 received a rating of “moderate problems” on the time dimension, resulting in an average score of 1.80 on this dimension. The three dimensions that measured the allocation of time across teaching modalities (teacher-directed, independent student, and computer activities) also earned relatively low average scores (2.0 to 2.10). According to program guidelines, students are expected to spend 20 minutes in each modality. To meet criterion for a particular modality, each student had to spend between 15 and 25 minutes working in that modality during a given session.
Failure Free Reading offers teachers considerable flexibility in meeting program goals. However, a central tenet of the program is that teachers should provide extensive scaffolding so that students do not experience reading failures. The average score of 2.40 on the program techniques dimension reflected instances in which the scaffolding was somewhat inadequate.
In summary, there were relatively few instances of moderate fidelity problems, and no instances of severe fidelity problems, across programs and dimensions. Such problems as did occur tended to be concentrated in the fine points of program techniques and total session time. With many sessions in all four programs running shorter than intended, it was also the case that activities at the ends of the sessions tended to get short changed more often than activities occurring earlier. This was particularly evident in Spell Read, where nearly all of the sessions met criterion for the duration of the phonics portion of the lesson, but only about half met the criterion for the duration of the reading and writing activity that came at the end of the session. This had implications for the time-by-activity described in the next section.
4. Cross-Program Comparisons on Videotape Ratings
To compare videotape ratings across programs we collapsed the ratings for each program into a common set of dimensions and then constructed two superordinate ratings. We considered the first, which captured the coverage, time allocation, and program technique dimensions, as representing program fidelity. We classified the second, which encompassed management of instruction, positive reinforcement, affective environment, and, in the case of Failure Free Reading, monitoring student activity, as representing general teaching quality. The superordinate ratings were based on the average scores for the contributing dimensions, after setting aside the “not applicable” ratings.
The mean scores for the overall fidelity rating, by program, were as follows: Corrective Reading = 2.38, Spell Read = 2.61, Wilson Reading = 2.7, and Failure Free Reading = 2.29. These scores were significantly different across the four groups [F(3, 956) = 23.26, p<.001]. Mean scores for the overall teaching quality rating were as follows: Corrective Reading = 2.91, Spell Read = 2.91, Wilson Reading = 2.76, and Failure Free Reading = 2.86. These
53

ratings were also significantly different across the four groups [F(3,622) =5.10, p<.01].
5. Summary of Fidelity and Teacher Quality Ratings
In summary, the several sources of ratings for intervention teachers on both implementation fidelity and general teacher quality included ratings by the reading program trainers who observed the teachers and coached them over a period of months, ratings by the AIU project coordinators who observed a sample of instructional sessions, and ratings based on a sample of videotaped sessions. On all measures, the
54

Table III.15
Scores on Fidelity Dimensions Coded from Videotape: Failure Free Reading
Average Scorea
Coverage of lesson content 2.65Duration by modality
Teacher-directed activity 2.10Independent student activities 2.00Computer activities 2.05
Proper use of program techniques 2.40Management of instruction 2.75Monitoring student activity 2.75Positive reinforcement 2.85Affective environment 2.90Total teaching time 1.80
a Scale: 3=meets criterion; 2=minor problems; 1=moderate problems
average scores fell well within the acceptable range for every program. The videotape analysis, however, made it clear that initial expectations for average session length were overly optimistic. Like the proverbial 50-minute therapy hour, the majority of one-hour sessions lasted between 50 and 55 minutes, probably reflecting the realities of elementary school life in which the time required for students to transition from one instructional setting to another is subtracted from the time allocated for instruction.
F. TIME-BY-INSTRUCTIONAL-ACTIVITY ANALYSES
Knowledge of the instruction actually received by students in the study can assist with interpretation of the impacts and assess how closely the program models were followed. As part of our implementation analysis, we conducted two examinations intended to provide more detail on the instruction received by students in each instructional condition. First, we noted how far each instructional group progressed through the available program materials and compared group progress against the scope and sequence for each reading program. Second, we conducted a detailed time-by-activity analysis of the sample of videotaped sessions that were also used in the fidelity analysis. In the latter case, we constructed a set of coding categories for application across programs in order to compare the distribution of activities in each program against each other (see Appendix I). The comparison allowed us to highlight similarities and differences among programs and provided evidence regarding the suitability of the initial planned contrast, which grouped two program interventions as “word level” and the other two as “word level plus comprehension.”

1. Progression Through Program Materials
All of the programs provided for flexible pacing through the program materials in order to accommodate the entry skills of the students and the speed with which they master new content. For Corrective Reading, Wilson Reading, and Spell Read, the average capabilities of each three-student instructional group determined the pace. As noted, some of the groups were heterogeneous with regard to students’ basic reading skills, leading to difficulties in matching instructional pace to individual student needs. For Failure Free Reading, on the other hand, each student progressed at his or her own pace. Wilson Reading and Spell Read used a common starting point for all instructional groups, whereas Corrective Reading and Failure Free Reading started the groups or students at different points, depending on pretest results. As a result of such individualized starting points and/or pacing, students were exposed to different portions of their assigned program during the study’s instructional period. Appendix I provides a summary of the scope and sequence for each reading program as related to the modal end points for the instructional groups.
Notably, Corrective Reading, Wilson Reading, and Spell Read all provide systematic and explicit instruction in phonemic decoding strategies for reading new words in text. Consequently, progress through the curricula implies exposure to an increasingly broad range of letter/sound combinations and syllable types as well as to an increasing number of irregular words. Passage reading also progresses in complexity as students master additional decoding rules, particularly in programs that base passage reading on controlled text (Corrective Reading and Wilson Reading).
Although Failure Free Reading does not use explicit phonemic instruction, students encounter increasingly complex words and passages as they advance through the program. However, at a certain point, Failure Free Reading students who completed the available story sequences moved into an entirely different type of instruction called Verbal Master, which focuses on learning vocabulary words and practicing writing skills rather than on passage reading.
Given that the Failure Free Reading modules target students with very low reading levels and that many students in this study were near or just below average, a substantial portion of the fifth-grade students assigned to this intervention progressed to Verbal Master at some point during the instructional sequence. Sixty-five percent of fifth-grade students spent half or more of their instructional time in Verbal Master. Fewer than three third-grade students spent half or more of their instructional time in Verbal Master.25
25 We cannot disclose the actual number of third-grade students in this category due to Institute for Education Sciences confidentiality standards.

2. Time-by-Activity Analysis
Using the same running records that were constructed for the fidelity coding, we undertook a time-by-activity analysis of 18 Corrective Reading, 18 Wilson Reading, 20 Spell Read, and 20 Failure Free Reading sessions that had been videotaped over the course of the intervention period. Based on the running records, we noted beginning and ending times for each activity observed within the session and used coders’ notes in conjunction with the relevant instructional materials (such as students’ workbooks and instructors’ manuals) to analyze each activity along three dimensions: (1) language level; (2) instructional process; and (3) format. Appendix I details the coding structure used for the analysis, and it also provides a detailed treatment of differences among the programs in the three coding categories.
3. Comparison of Interventions
It was our intention in this study to pair instructional interventions into two categories. We paired Corrective Reading and Wilson Reading as word-level interventions, in which instruction would focus primarily on the development of word-recognition skills and emphasize learning to read with accuracy and fluency. We paired Spell Read and Failure Free Reading as word-level plus comprehension interventions that would strike an even balance between word-level skill development and activities intended to develop vocabulary and comprehension. However, as is documented by the analyses reported in Appendix I, the interventions originally conceived of as pairs sometimes were significantly different from one another along one or more dimensions while programs in opposite pairs were sometimes more similar to one another.
The most important point from the detailed time by activity analysis reported in Appendix I is that, across the instructional programs, the distribution of time in word-level versus vocabulary/comprehension activities did not conform to the categorization of the interventions based on the description of instructional activities from the program providers. As implemented, one of the programs in the WL category, Corrective Reading, spent more time on comprehension-oriented activities than one of the interventions in the WL+C condition, Spell Read. Failure Free Reading was the only intervention that had a relatively even balance between word-level and comprehension/vocabulary instruction. An estimate of total time spent during each instructional session on activities to increase reading accuracy/fluency was obtained by adding together the times in the decoding and encoding categories reported in Appendix I. Conversely, an estimate of the time spent on vocabulary/comprehension activities was obtained by adding together the times in the vocabulary and comprehension categories. Table III.16 displays the resultant distribution of instructional time (in minutes) spent by each program in each of these two major areas. Overall instructional time is reduced to the extent that sessions tended to run shorter than the anticipated hour as well as by time transitions between activities and by any time spent off task. The lower overall amount of instructional time noted for the Wilson program in Table III.16 is at least partially a function of how the

instructional times were coded from the videotapes. We entered the start and stop times for each instructional activity, and did not include set up or transition time in these counts. If students were getting out letter tiles, or putting away journals, etc., we did not count that as part of the instructional time, even if the teacher was beginning to talk about the next task. The Wilson Reading program was more affected by this rule than the other programs, although the overall session time for the Wilson teachers was also slightly shorter than for the other programs (Wilson = 51.9 minutes, Failure Free = 53.9 minutes, Corrective = 54.5 minutes, and Spell Read = 50.4 minutes).
Table III.16
Minutes per Session Spent on Instruction to Improve Word Reading Accuracy/Fluency versus Time Spent on Activities Related to Vocabulary/Comprehension
Failure Free Reading Spell Read Wilson Reading Corrective Reading
Word level 23.6 43.6 40.8 39.1Comprehension/vocabulary 25.6 9.0 2.8 13.4Total time 49.2 52.6 43.6 52.5
This time by instructional activity analysis suggests that, in terms of the distribution of activities focused on word-level versus vocabulary/comprehension skills, Corrective Reading was more similar to Failure Free Reading than was Spell Read. However, Corrective Reading is much more similar to Wilson Reading and Spell Read in its approach to increasing accuracy and fluency of word reading than it is to Failure Free Reading, which does not teach phonemic decoding strategies at all. Furthermore, in terms of total amount of time per session devoted to instruction focused on building word reading accuracy and fluency, Corrective Reading is very similar to the other two phonemically oriented programs. Because the distribution of instructional activities across programs differed from expectations and because of the particularly large differences between the three phonemically oriented programs and Failure Free Reading with respect to the method used to increase reading accuracy, we could not justify reliance on the original instructional categorization scheme in the analysis of instructional impacts. Where programs are grouped together for the sake of statistical power to examine differences between intervention and control conditions, we group together the three phonemically oriented approaches. We also do not make direct contrasts between instructional conditions because, without being able to group programs together in a two-by-two categorization, the present experiment does not have sufficient statistical power to warrant such comparisons.
In retrospect, it is unfortunate that we were not able to complete a pilot time by activity analysis of the instructional conditions before the study was implemented. However, given the time frame under which this study was designed, funded, and implemented, it was simply not possible to do the kind of

analysis that could have helped us determine the lack of fit between our classifications and the programs that were chosen for the study. In the case of Spell Read, moreover, even a detailed review of program documents would not have revealed the extent of the misfit, which arose in this specific implementation, apparently as a consequence of compressing program delivery into a 60 minute time period, rather than the 70 minute session preferred by the program. Within the instructor’s guide, as well as within the training provided to the teachers, the word level elements are highly structured and take a considerable amount of time to complete in a way that is true to the design of the program. As a consequence, the less highly structured reading and writing component, which also comes at the end of the session, was not given as much instructional time as planned.
G. TEACHER REPORTS OF STUDENTS’ HOURS OF READING INSTRUCTION
The survey forms filled out by the classroom teachers asked questions intended to elicit information about and quantify the reading instruction delivered to each student in the intervention and control groups. Some of the questions pertaining to the reading mix asked how much reading instruction each student received in large groups, small groups, and one-on-one settings. The questions also allowed us to categorize the instructors providing the reading instruction as either “General education teachers” or “Specialist teachers,” the latter defined here as a special education teacher, a Title I teacher, an ESL teacher, a reading specialist, or other instructor.
We analyzed data from the classroom teacher surveys using a weighted conditional two-level hierarchical linear model, with students and school units making up the two levels. These data were analyzed in a manner similar to the outcomes for reading performance, and a more detailed explanation of those procedures is provided in Chapter IV.
During data cleaning, we discovered that the total number of hours of reading instruction reported for some students (i.e., the sum of large-group, small-group, and one-on-one instructional hours) were implausibly high (e.g., 45 hours per week) and thus erroneous. Given that we were unable to find a pattern in these erroneous reports that would allow us to make corrections, we decided to limit the analysis to students whose reported reading instruction totaled no more than 20 hours per week. We chose the 20-hour cut-off criterion (4 hours per day) because it is a high but not implausible number of instructional hours for struggling readers to receive. The analysis included information on 701 students (412 intervention students and 289 control students) with plausible values for total instructional hours.
We created a measure of total weekly hours of reading instruction for each student by summing responses reported by the classroom teachers for weekly hours of reading instruction (other than instruction provided by our intervention teachers) in the following six modalities: large group, generalist

teacher; large group, specialist teacher; small group, generalist teacher; small group, specialist teacher; one-on-one, generalist teacher; one-on-one, specialist teacher. For students in the intervention group, we added a constant amount of 4.5 hours of small-group instruction per week. The results of our comparisons of instructional hours received by intervention and control students are summarized below. Overall, we found no significant difference [t(650) = 1.47, p = .1415] between the combined intervention groups’ mean 9.3 average weekly hours of reading instruction and the combined control groups’ mean 8.7 hours. We also found no significant differences in total hours between grades three and five [t(650) = 1.81, p = .0711].
Figure III.1 presents the average number of weekly reading instructional hours for the intervention and control groups disaggregated by size of the instructional group (large, small, one-on-one), and by who provided the instruction (generalist, specialist, teachers from this study) together with the total hours in each of these categories. Generalist teachers delivered most of the large-group reading instruction, and the control group as a whole received significantly more large-group generalist hours than the intervention group [t(650) = -4.08, p < .0001].
The intervention group received more small-group intervention hours than the control group, with significant differences observed in generalist [t(649) = -2.22, p = .0267], specialist [t(649) = -3.57, p = .0004], and intervention teacher (provided by this study) small-group hours. Most of the small-group reading instruction hours received by the intervention groups came from the 4.5 hours of pull out instruction provided by the study. One-on-one average weekly reading instructional hours were uniformly small (less than 1 hour), with the differences between the combined intervention and control groups not significant [t(649) = -1.46, p = .1453]. Differences in specialist one-on-one hours were not significant between the combined intervention groups and the combined control groups [t(649) = -1.52, p = .1282].
Figure III.1
Average Hours of Reading Instruction per Week in Groups with Different Types of Instructorsand of Differing Instructional Size, for Combined Intervention and Combined Control Groups

1. Average Weekly Hours of Reading Instruction by Intervention
Regardless of instructional group size, we also analyzed average weekly hours of total reading instruction for each of the four interventions, comparing them against their individual controls (see Figure III.2). Overall, when looking at the sum of the average weekly hours provided by generalist teachers, specialist teachers, and intervention teachers, we found, at the program level, that only the Corrective Reading intervention differed significantly from its control at the .05 level [t(650) = 1.98, p = .0482]. We did, however, find more significant differences between each intervention program and its control with regard to the mix of small, large, and one-on-one specialist and generalist hours of weekly reading instruction.Figure III.3 presents the same average hours of reading instruction data, but in groups of different instructional size: large, small, and one-on-one instructional settings. Most noticeable in Figure III.3 is the large magnitude of the small-group reading instructional hours, whereby students in each of the four program interventions received, on average, more than 6 hours of small-group reading instruction per week. Indeed, small-group reading instruction hours represent the large share of the reading instruction hours received by the students in the four intervention programs. This is in contrast to the four intervention controls, which had uniformly fewer small-group hours. Predictably, most of the small-group reading instruction came from the 4.5 hours of pull out instruction provided by the study.
Differences between individual intervention groups and their individual controls with regard to small-group generalist hours were significant at the .01 level for Failure Free Reading [t(650) = -2.57, p = .0104] and at the .05 level for Corrective Reading [t(650) = -1.96, p = .05] while differences with regard to small-group specialist hours were significant at the .01 level for Failure Free Reading [t(650) = -3.46, p = .0006] and Spell Reading P.A.T. [t(650) = -3.31, p = .001].

Figure III.3 also illustrates that a general education teacher delivered most of the weekly large-group reading instruction. Here, we found significant differences between the intervention groups and their controls at the .05 level for Failure Free Reading [t(650) = -2.24, p = .0257], at the .1 level for Spell Read [t(650) = -1.7, p = .0903], and the .01 level for Wilson Reading [t(650) = -3.07, p = .0022.]. We also found significant differences in the number of hours of large-group reading instruction provided by a specialist for Failure Free Reading [t(650) = -4.47, p = <.0001].
In addition, Figure III.3 shows that treatment students received less than one hour a week of one-on-one reading instruction. There were significant differences identified between the program interventions and their controls with regard to generalist one-on-one hours at the .01 level for Failure Free: [t(650) = -3.39, p=.0007] and at the .05 level for Spell Read [t(650) = 2.14, p=.0328]. In terms of specialist one-on-one hours, there were no significant differences observed between the programs (see details in Appendix K).
2. Tutoring Outside Normal School Hours
The classroom teachers answered questions about any private tutoring in reading that each of their students might be receiving outside normal school hours. When teachers did not know if a particular student was receiving private tutoring, we excluded the student from the tutoring analysis. As a result, only 627 out of 772 observations were available. Overall, we found no significant differences in average weekly hours of private tutoring by treatment/control status [F(1,627)=.97, p=.3254], treatment program [F(4,624)=.51, p=.7299], or grade [F(1,626)=.99, p=.3205]. On average, the control group received .1 hour of weekly tutoring and the treatment group overall .06 hour of average weekly private tutoring outside normal school hours.

Figure III.2
Average Hours of Reading Instruction per Week, in Groups with Different Types of Instructors, for Program Intervention Groups and Program Controls
Figure III.3
Average Hours of Reading Instruction per Week in Groups with Different Types of Instructors and of
Different Size for Program Intervention Groups and Program Controls
0
1
2
3
4
5
6
7
8
9
Failu
re F
ree
Inte
rven
tion
Failu
re F
ree
Con
trol
Spe
ll R
ead
Inte
rven
tion
Spe
ll R
ead
Con
trol
Wils
on R
eadi
ngIn
terv
entio
n
Wils
on R
eadn
gC
ontro
l
Cor
rect
ive
Rea
ding
Inte
rven
tion
Cor
rect
ive
Rea
ding
Con
trol
Failu
re F
ree
Inte
rven
tion
Failu
re F
ree
Con
trol
Spe
ll R
ead
P.A
.T.
Inte
rven
tion
Spe
ll R
ead
P.A
.T.
Con
trol
Wils
on R
eadi
ngIn
terv
entio
n
Wils
on R
eadi
ngC
ontro
l
Cor
rect
ive
Rea
ding
Inte
rven
tion
Cor
rect
ive
Rea
ding
Con
trol
Failu
re F
ree
Inte
rven
tion
Failu
re F
ree
Con
trol
Spe
ll R
ead
P.A
.T.
Inte
rven
tion
Spe
ll R
ead
P.A
.T.
Con
trol
Wils
on R
eadi
ngIn
terv
entio
n
Wils
on R
eadi
ngC
ontro
l
Cor
rect
ive
Rea
ding
Inte
rven
tion
Cor
rect
ive
Rea
ding
Con
trol
Large Group Small Group One-on-One
Experimental
Specialist
Generalist
0
2
4
6
8
10
12
Failure FreeIntervention
Failure FreeControl
Spell ReadIntervention
Spell ReadControl
Wilson ReadingIntervention
Wilson ReadngControl
CorrectiveReading
Intervention
CorrectiveReading Control
ExperimentalGeneralistSpecialist

IV. IMPACT ANALYSIS
The main objective of this evaluation is to estimate the impacts of the four interventions on students’ reading skills. Specifically, we estimate the impacts of the four interventions combined, the three word-level interventions combined, and each of the four individual interventions for not only all third-grade and all fifth-grade students eligible for the interventions, but also several key subgroups of students. In this chapter, we present the findings of our impact analysis after describing our estimation methods and technical and contextual issues pertaining to the interpretation of the impact estimates.
A. ESTIMATION METHOD
The experimental design can be described as a randomized blocks design with random assignment carried out at two levels. First, as discussed in Chapter II, we randomly assigned 32 school units to the four interventions within blocking strata determined by the percentage of students eligible for free or reduced-price school lunch.26 Next, within schools, we randomly assigned eligible students within grade levels (third or fifth) to the treatment or control group. The resultant data have a hierarchical structure of students nested within school units.
To reflect the fact that students within a school unit are not independent, in estimating intervention impacts and standard errors we used a weighted two-level hierarchical linear model (HLM) that allows for nested data.27 The first level corresponds to students within school units and the second to the school units, accounting for the clustering (nonindependence) of students in school units.
Research has shown that the impacts of interventions may vary by age and that older students experience more difficulty in improving their reading skills (Torgesen 2005). To test for differential impacts, we estimated impacts separately for third and fifth graders. The model is:
26 The sample includes 31 school units with about 740 students; one school unit dropped out of the study after random assignment, but before learning the intervention to which it had been assigned.
27 We also investigated a three-level model that includes a level for the clustering of students in instructional groups. The results are similar when using the three-level model; see Appendix F for details of that model and the results. In most cases, standard errors of the impacts are smaller in the three-level model, but not enough to change our conclusions about impacts.

Level One: Student (i) within school unit (j)
Level Two: School unit (j)
where

For our analyses, we use a centered pretest score:
,
where is the weighted mean of the pretest score across all students in the evaluation sample. By mean-centering the pretest score (the score at the beginning of the school year), we can interpret parameters and combinations of parameters in the level-one model as means for students with the average baseline test score. For example, the impacts, estimated as described below, are interpreted as the impact for a student in a given grade (third or fifth) with a baseline test score equal to the average baseline test score.
The level-one model (Equation ) relates a student’s post-intervention test scores to a treatment indicator, an indicator for being in third grade, the student’s pretest score, and a residual term (unexplained variation). The level-two model (Equation ) relates the level-one parameters (coefficients
) to indicators showing the interventions to which the school units were randomly assigned as well as the blocking strata. The interventions Failure Free Reading, Spell Read, Wilson Reading, and

Corrective Reading are denoted as A, B, C, and D, respectively.28 The blocking strata grouped school units into four approximately equal-sized groups based on the percentage of students eligible for free or reduced-price school lunch (FRPL). We represent the four blocking strata with three dummy variables, where each dummy variable equals 1 for school units that belong to that blocking stratum, and zero otherwise.29
1. Estimation of Impacts
The main parameters of interest are those from which we estimate the impacts of the interventions on students’ reading skills, where an impact is defined as the regression-adjusted difference in the average achievement scores for the treatment and control groups.30,31 As we describe later, we compute three sets of impacts. The first set describes the impact of the interventions on all students. This set of impacts shows how much difference an intervention will make if it is made available to students with characteristics similar to those of the students in the evaluation sample. This is also the most robust estimate of program impacts because it involves the fewest assumptions when estimating the impacts. The second and third sets of impacts describe the intervention impacts on those who participated in the interventions and on those who received at least 80 hours of instruction, respectively. Given that almost all students in the treatment group received some of the treatment and that a very large percentage received 80 or more hours of instruction, the results are similar regardless of the definition of impacts. From the HLM model, we estimate impacts for each of the four interventions.32
We also estimate the impact of assignment to any of the interventions—denoted as the combined intervention impact (ABCD) —as the average of the four intervention impacts.
As explained earlier in this report, we had originally intended to group the four intervention programs into two intervention classes, word-level interventions
28 The listed order of the interventions and labels A, B, C, and D are arbitrary and not related to the performance of the interventions. In the hierarchical model, we can represent the four interventions with three dummy variables: A, B, and C. Intervention D is represented when the dummy variables for interventions A, B, and C all equal zero (i.e., A=B=C=0).
29 When estimating impacts, we weight the blocking strata effects equally.
30 Our analyses compare the treatment students in each intervention to control students in the same schools, which require minimal assumptions about how the controls differ across interventions compared with an analysis that pools all of the controls. The impacts refer to the average impacts across school units and to students with the average baseline test score.
31 Appendix C provides details on deriving the impact equations.
32 We used HLM 5 ® software published by Scientific Software International, Inc., to obtain the HLM estimates. We obtained parameter estimates using the restricted maximum likelihood (REML) procedure, as discussed in Raudenbush and Bryk (2002).

and word-level–plus comprehension/vocabulary interventions. However, the time-by-activity analysis indicated that such a categorization was not accurate. In actuality, three of the interventions, Corrective Reading, Spell Read, and Wilson Reading, were appropriately grouped as phonemically oriented word-level interventions while the fourth, Failure Free Reading, provided non-phonemically oriented support for reading accuracy and fluency along with instruction in comprehension and vocabulary. For the analyses reported here, we consider impacts for:
1. All interventions combined (ABCD)
2. The three word-level interventions combined: Spell Read, Wilson Reading, and Corrective Reading (BCD)
3. The four individual interventions (A,B,C,D)
In addition to estimating impacts for all third or all fifth graders, we estimated impacts for subgroups of students within each grade. The ability to estimate impacts for subgroups and to test for differences in impacts between subgroups is important in that it allows for potentially better targeting of interventions, for example, to students with especially low phonemic decoding skills. To estimate subgroup impacts, we modified the model specification in Equation (IV.1) to allow for different impacts (within each grade) for a subgroup (see Appendix C).33
We define the impacts when grouping interventions as:
where the intervention impacts for Failure Free Reading (A), Spell Read (B), Wilson Reading (C), and Corrective Reading (D), respectively, are:
33 Preliminary analyses showed substantial differences in impacts by grade. Because of the differences in impacts, we allowed subgroup impacts to vary by grade level. When we designed the study, our power analyses assumed that we could combine grades when conducting subgroup analyses. Because we cannot, our ability to detect significant impacts for subgroups is diminished. The probability of detecting differences between subgroups is particularly low. See Chapter II for estimates of minimum detectable impacts.

where for third graders and for fifth graders.34 When the interventions are grouped, each intervention in the group receives equal weight.
2. Effect of Treatment on the Treated
The impacts described in the previous section are known as intent-to-treat (ITT) impacts because they estimate the impact of random assignment to one of the interventions (the treatment group), without taking into account whether students actually receive the treatment. In this study, a few students assigned to the treatment group did not participate in one of the interventions. To adjust for students not participating in the intervention or for participating for substantially fewer hours than planned, we provide additional estimates of intervention impacts. We refer to these estimates as the impact of the treatment on the treated (TOT).35 A TOT impact takes into account the treatment received by students in the study but requires additional assumptions that are untestable.36 In this evaluation, a small number of students assigned to the treatment group (13 students, or less than 1 percent) did not receive any instruction and are labeled as no-shows. (Students’ reasons for dropping out of the treatment group are described in Chapter II.) In addition, approximately 7 percent of treatment group members received fewer than 80 hours of instruction, which we defined as the threshold for receiving a “full dose” of the intervention. When estimating the effect of the treatment on the treated, we considered both definitions of “the treated.”37
34 The sum of the three blocking strata parameters ( ) is multiplied by ¼ because of the fourth blocking stratum, which is the excluded category. The term could
also be written as .
35 This is also sometimes referred to as the Complier Average Causal Effect (CACE) or the Instrumental Variables (IV) estimate.
36 Two major assumptions are involved in estimating the TOT impacts. The first is that assignment to the treatment group has no impact on students who do not participate in one of the interventions (Rubin’s exclusion restriction, see Angrist, Imbens, and Rubin 1996). For treatment group students who did not show up for any instruction, the assumption is reasonable. However, for those with between 1 and 79 hours of instruction, the assumption probably is not reasonable, and we must use caution in interpreting the TOT estimate for students with the “full dose” (> 79 hours). The second major assumption is that some individuals participate in one of the interventions only when assigned to the treatment group (compliers). The assumption is reasonable here, as most members of the treatment group do participate in one of the interventions, and individuals assigned to the control group do not have access to the interventions. Both of these assumptions are untestable because we observe each individual’s behavior and outcomes only under the treatment to which they were assigned; it is impossible to observe the behavior and outcomes of individuals as if they had been assigned to another group. Thus there are no data available on which to test these assumptions.

Because the TOT impacts rely on untestable assumptions, we present the ITT impacts as the main results and present the TOT impacts in supplementary tables. In this setting, with no control group students who receive the intervention, the TOT impact estimates will always be equal to or greater than the ITT impact estimates. The TOT impacts in this study are similar to the ITT impacts because the percentage of treatment students who received the intervention is very high (0.99 for any treatment received and 0.93 for those with at least 80 hours of treatment). Therefore, the adjustment for no-shows increases impacts by about 1 percent while the adjustment for those who do not receive at least 80 hours of intervention increases impacts by about 8 percent. For example, for an ITT impact of 4 standard score points, the TOT impact adjusted for no-shows is about 4.04 points, and the TOT impact adjusted for those receiving fewer than 80 hours of interventions is 4.28 points.
B. INTERPRETATION OF IMPACTS
In this study we are interested in estimating the impact of the four remedial reading interventions relative to the instruction that students ordinarily receive. When interpreting the impacts of the four interventions on students’ reading skills it is important to consider three elements of the broader context in which the interventions were operating: (1) where the students began in terms of reading ability at the beginning of the school year, (2) how much improvement the students would have had in the absence of the interventions, and (3) the amount of the intervention that treatment and control students actually received.

We illustrate the first two elements using a hypothetical example, in Figure

IV.1.38 At the beginning of the school year, all students in the intervention (represented by “T”) and control (represented by “C”) groups started out at approximately the same point—due to randomization—with an average baseline

test score of 85 (16th percentile).39 This is similar to the actual baseline test scores seen for students in this study (see Tables II.2 through II.7).
The improvement that students would have made in the absence of the interventions is indicated by the gain that the students in the control group experienced between the beginning and end of the school year. In Figure IV.1, this gain is 4 standard score points, as shown by the dashed line.
Because standard scores show students’ relative standings in a national population of students at a given grade level, we would expect the average gain to be 0 if we had a national sample of students at all levels of reading ability. However, the students in this example (and in the actual study) began the year reading below grade level, indicated by standard scores less than 100. For such students, positive gains indicate the amount by which the students at least partially “caught up” to the average student in their grade. Negative gains indicate the amount by which the students fell further behind.
The impact shows the value added by the intervention; that is, the gain above that achieved by the control group. In other words, the impact is the amount that the interventions increased students’ test scores relative to the control group. Because of random assignment, the intervention and control groups started out at the same place (85, in this example), and thus the impact can be calculated by comparing

Figure IV.1
Hypothetical Example of Gains and Impact
either the end of year test scores for the intervention and control groups or the test score gains for the intervention and control groups. Using the end of the year test scores, the impact in Figure IV.1 is 95-89=6 (T2-C2). Alternatively, using gain scores, the impact in Figure IV.1 is (95-85)-(89-85)=10-4=6 ((T2-T1)-(C2-C1)). Thus, the intervention in this example raised students’ test scores 6 points higher than they would have been without the intervention.
The change (“gain”) in the intervention group students’ average test scores between the beginning and end of the school year can be calculated by adding the control group gain and the impact, as illustrated in Figure IV.1. If the control group students’ average score increased between the beginning and end of the school year and there is a positive impact, then the treatment group gain will also be positive, as in Figure IV.1, where the treatment group gain is 10 points. However, if the control group students’ scores decreased between the beginning and end of the school year, then the intervention group may also experience a negative gain, even if the impact is positive. Depending on the relative magnitudes of the control group gain and the impact, a negative control group gain combined with a positive impact may imply that the
37 See Bloom (1984); Angrist, Imbens, and Rubin (1996); or Little and Rubin (2000) for general background information on computing TOT estimates.
38 The third element is discussed in the next section.
39 Randomization ensures that the treatment and control students start out with similar reading ability (similar test scores). However, there may still be small differences between the groups that are attributable to chance, unless the samples are very large. The HLM model in this analysis adjusts for the small differences that may exist between the groups.
74

intervention group students held their ground (or improved) while the control group declined, or may imply that the intervention group experienced a negative gain as well.
C. CONTEXT OF THE IMPACTS
We now consider our empirical findings pertaining to the three elements of the broader context for this evaluation: (1) where the students began in terms of reading ability at the beginning of the school year, (2) how much improvement the students would have had in the absence of the interventions, and (3) the amount of the intervention that treatment and control students actually received. Indicating where students began, the first column of Table IV.1 shows the baseline test scores of students in third and fifth grades. (All tables appear at the end of this chapter.) The average baseline test scores are all below
75

average (less than 100)—ranging from a low of 81 (10th percentile) for the Phonemic Decoding Efficiency test in the fifth grade to a high of 93 (32nd percentile) for Word Attack in third and fifth grades, and Passage Comprehension in fifth grade. Although not as severely impaired as many of the students studied in previous small-scale assessments of intensive reading interventions (see the review by Torgesen, 2005), the typical student in our evaluation is struggling with basic reading skills. That student along with a substantial fraction of the broad range of students included in our sample are among those often targeted by providers and school districts for the types of interventions that we are evaluating. Such targeting is a response to both the needs of these students and the fact that except perhaps in the largest urban school districts, most schools would have only a small number of students in each grade who are as severely impaired as the students included in some previous studies. While it is important to assess the effectiveness of interventions for these more severely impaired students, the results obtained might not pertain to broader groups of struggling readers that include less severely impaired students. Hence, we have drawn our sample from regular elementary schools and included students with a relatively wide range of reading difficulties.
When we assess the improvement that students had in the absence of the interventions, we see mostly positive gains among the control students in both third and fifth grade, as presented in Table IV.1. In the third-grade pooled (ABCD) control group, students typically had positive gains between 0 and 3 standard score points, but there were some negative gains, particularly on the reading comprehension subtest from the Group Reading Assessment and Diagnostic Evaluation (GRADE). The negative gain on the GRADE test suggests that the average student in the study lost ground relative to other students on this reading comprehension test. That is, if third-grade students selected for the study had not participated in an intervention, we would expect them, on average, to lose ground in their ability to extract meaning from text, as measured by the GRADE test. Among fifth graders, the gains were nearly all positive, generally between 1 and 6 standard score points. The exception for fifth-grade control students is the Passage Comprehension test, which had a small negative gain.
The generally positive gains experienced by the control students indicate that these students’ reading ability improved between the beginning and end of the school year relative to the normal growth expected during this time. A positive control gain may be due to students’ usual classroom instruction, additional instruction received in or out of school, or a statistical phenomenon known as “regression to the mean.” Regression to the mean can occur when students are selected for a study because of low scores on a test because students are more likely to be selected when testing error was negative. The next test is more likely to have a positive testing error or a smaller negative testing error, which appears to be a gain but is instead an artifact. In the case of the present study, students were selected on the basis of their screening—not baseline—scores. Thus, for the sample of all students, the regression to the mean effect should have occurred between screening and baseline testing, not between baseline and follow up. Thus, the phenomenon of regression to the mean is not
76

likely to play a significant role in explaining the reading gains of students in either the intervention or control groups in the study sample. However, in subgroup comparisons that select students because of either low or high scores on a given measure within the total sample, regression to the mean could certainly explain some of the improvement (or some of the decline) in scores between the baseline and follow-up testing.
The final contextual element to consider when interpreting impacts is the amount and type of reading instruction that the students in the study actually received. During the school year, each student in the intervention group was supposed to receive approximately 60 minutes of reading instruction per school day. However, as reported in Chapter III, we found that when the interventions were implemented, students received 54.1 minutes of instruction per day on average, and the amount of instruction received was similar across the interventions. By design, none of the control students received the intervention. Instead, the students in the control group received their typical instruction, which included regular classroom instruction and often included other services such as another pull out program. Thus, the impacts presented in Tables IV.1 to IV.10—the ITT impacts—show the effects of students’ being given the opportunity to receive a little less than one hour of intensive reading instruction per day, implemented as a pull out program from their usual classrooms, where they might have received some additional reading instruction if they had not been assigned to the intervention group. Tables IV.21 to IV.30 provide parallel estimates of the effect of actually receiving the intervention, which take into account the percentage of intervention students who did not participate (TOT impacts). We define participation in two ways: (1) receiving any intervention instruction and (2) receiving more than 80 hours of instruction. Because nearly all students in the intervention group participated for at least one hour (99 percent), and most received over 80 hours of instruction (93 percent), the TOT estimates are very similar to the ITT estimates discussed in the text.
Preliminary analyses showed substantially different patterns of impacts by grade. Although the impacts are not significantly different at the 0.05 level between the third and fifth graders, the point estimates of the impacts for the two grades often appear quite different (see Table IV.1). Furthermore, more significant impacts—that is, impacts that are different from zero—are found for third graders than for fifth graders. In light of these findings, we present results separately by grade in the following sections.
As discussed in Chapter II, we present impacts on seven measures of reading ability that fall into three categories. Two tests measure phonemic decoding ability: the Woodcock Reading Mastery Test-R Word Attack test and the Phonemic Decoding Efficiency subtest of the Test of Word Reading Efficiency. Three tests measure word reading accuracy and fluency: the Woodcock Reading Mastery Test-R Word Identification test, the Sight Word Efficiency subtest of the Test of Word Reading Efficiency, and the Oral Reading Fluency (Aimsweb) test. The third category, reading comprehension, is assessed using the Woodcock Reading Master Test-R Passage Comprehension test and the
77
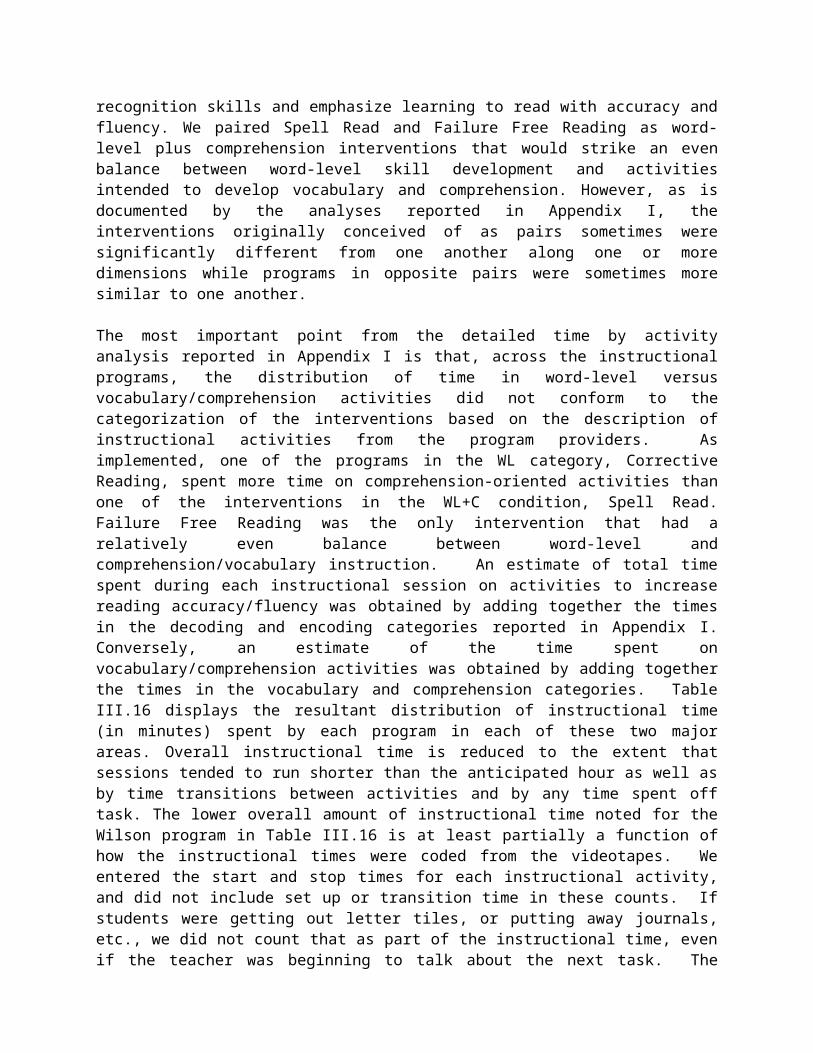
Group Reading Assessment and Diagnostic Evaluation (GRADE) Passage Comprehension subtest.
When estimating impacts for multiple outcomes—such as these seven measures of reading ability—and testing multiple interventions, there is a concern that some estimated impacts will be found to be significantly different from zero, even if there is actually no impact of the interventions (a “Type 1” error). In fact, even if there were no differences between the treatment and control groups, five percent of test statistics comparing the outcomes of the two groups would be expected to be significant at the five percent level just by chance. A variety of procedures have been developed to address the concerns around this, with varying levels of complexity. To maintain a straightforward presentation of results, without introducing the complexities of and debate surrounding the details of the implementation of multiple comparisons adjustments, the impacts presented here in the main text do not include an adjustment for multiple comparisons. However, we present in Appendix D the results using two methods that adjust the significance levels of tests to account for the number of tests being performed: the Bonferroni correction, and a more powerful adjustment developed by Benjamini and Hochberg (1995) that is particularly relevant for this study, where interest is in assessing the impact of an intervention on multiple outcomes. The results in Appendix D show that adjustments for multiple comparisons do not affect the general conclusions of this report.
D. IMPACTS FOR THIRD-GRADE STUDENTS
Combined, the four interventions improved the phonemic decoding skills of third graders, raising Word Attack scores by approximately 5 standard score points (effect size 0.33)40 and Phonemic Decoding Efficiency scores by approximately 3 points (effect size 0.20), as seen in Tables IV.1 and IV.11. These impacts for the pooled interventions (ABCD) suggest that being assigned to one of the reading interventions moved students in the interventions up the distribution of phonemic decoding ability approximately 5 to 10 percentile points more than they would have gained had they not been in one of the interventions.41 When assessing the impacts of the three word-level
40 The impacts presented in this report are generally in terms of standard scores; however, they can also be expressed as effect sizes, which divide the impact by the standard deviation of the standard score. The effect sizes corresponding to the impacts in Tables IV.1 through IV.10 are shown in Tables IV.11 through IV.20. Because an objective of the study is to measure the extent to which struggling readers catch up with students in the full population, we use the population standard deviation of each test to calculate effect sizes. This standard deviation is 15 for all tests, with the exception of the Aimsweb, which has a standard deviation of 39 for third graders and 47 for fifth graders. An effect size of 1 means that the intervention increased test scores by 1 standard deviation.
41 Effect sizes can be converted into the number of percentile points by which the intervention moved students up in the distribution of reading ability. For example, for students who started out at approximately the 16th percentile on most tests, an effect size of 0.3 means that the interventions moved students up 8 percentile points more than they would have risen had they not received the intervention. Therefore, if control group students move from the 16th to the 18th percentile, the treatment group students would
78

interventions (BCD)—Spell Read, Wilson Reading, and Corrective Reading—we also found impacts on both of these measures of phonemic decoding ability. However, individually, not all of the interventions had impacts on the accuracy and fluency of phonemic decoding. Failure Free Reading had no impacts on these measures, and Corrective Reading had an impact only on Word Attack test scores and not on Phonemic Decoding Efficiency test scores. In contrast, Spell Read and Wilson Reading improved scores on both tests, with effect sizes of approximately 0.4 to 0.6, corresponding to moving students in those interventions up the distribution of reading ability approximately 12 to 19 percentile points more than they would have gained had they not been in one of the interventions.
The four interventions combined and the three word-level interventions combined improved reading accuracy and fluency. This is primarily due to impacts of Corrective Reading, as Failure Free Reading, Spell Read, and Wilson Reading had no impacts on fluency. Corrective Reading improved scores on the Word Identification test by about 3 standard score points (effect size 0.22), scores on the Sight Word Efficiency test by about 5 points (effect size 0.30), and the number of correct words per minute read on the oral reading passages (Aimsweb) by about 11 words (effect size 0.27). These impacts correspond to moving students up the distribution of reading ability by approximately 5 to 10 percentile points more than they would have gained had they not been in one of the interventions.
Together, the four interventions had an impact of about 5 standard score points on third graders’ reading comprehension (effect size 0.31) as measured by the GRADE test, but not as measured by the Passage Comprehension test. Although the impact is substantial for the GRADE, it is important to consider the experience of the control group. For the controls, there was a decline in comprehension scores of about 4 points between the fall baseline test and the spring follow-up test. Thus, the impact of 5 standard score points on comprehension for the combined interventions was obtained mostly because of this decline in scores in the control group. Students in the intervention groups actually gained only 1 standard score point, in absolute terms, between the baseline and follow up testing. In addition, despite the combined impact on GRADE test scores, neither the three word-level interventions combined nor any of the individual interventions had a statistically significant impact on either measure of reading comprehension.
E. IMPACTS FOR FIFTH-GRADE STUDENTS
The interventions had fewer impacts for fifth graders than for third graders (see Table IV.1 for impacts and Table IV.11 for effect sizes). Combined, the four interventions improved fifth graders’ phonemic decoding skills by approximately 3 points (effect size 0.18) on the Word Attack test, but they did not have a statistically significant impact on Phonemic Decoding Efficiency test scores. At the end of fifth grade, students in the control group had an average
move from the 16th to the 26th percentile. Appendix K gives approximate percentile increases for other effect sizes, for the students in this study.
79

Word Attack score of approximately 95 (37th percentile), while the average score among students in the interventions was approximately 98 (45th percentile). The three word-level interventions also improved scores on the Word Attack test, with an impact of about 4 points (effect size 0.26), but they did not have a statistically significant impact on scores on the Phonemic Decoding Efficiency test. Across the individual interventions, only Spell Read and Wilson Reading had significant impacts on Word Attack test scores, and only Spell Read had a significant impact on Phonemic Decoding Efficiency test scores. Spell Read and Wilson Reading increased Word Attack test scores by about 5 and 4 standard score points, respectively, corresponding to effect sizes of 0.35 and 0.29.
For fifth graders, the four interventions combined had an impact on only one of the three measures of reading accuracy and fluency: an impact of approximately 1 point (effect size 0.09) on Sight Word Efficiency test scores. Neither the three word-level interventions combined nor any of the individual interventions had an impact on any of the measures of reading accuracy and fluency.
The four interventions, combined, did not affect fifth graders’ reading comprehension skills. Similarly, neither the three word-level interventions combined nor any of the individual interventions improved fifth graders’ reading comprehension by either measure.
F. IMPACTS FOR SUBGROUPS OF THIRD AND FIFTH GRADERS
Three of the four interventions—Spell Read, Wilson Reading, and Corrective Reading—focus on improving students’ word-level reading skills. In order to examine whether the impacts of these interventions and the fourth intervention—Failure Free—were greater for students who began the interventions with more significant impairments in their word-level reading skills (specifically their phonemic decoding skills), we formed subgroups of students based on their entering scores on the Word Attack subtest. Students who began the study with lower scores on Word Attack were further subdivided into those who entered the study with lower or higher scores on the Peabody Picture Vocabulary Test. Since broad vocabulary is one of the significant factors that contribute to performance on measures of reading comprehension (Stahl, 1998), it is of interest to determine whether the impact of the interventions varied among students with different entering scores on this dimension. In addition, because the No Child Left Behind legislation has increased funding for and attention on Title 1 schools, which by definition have high proportions of low-income students, we also examined the impacts of the interventions on students who qualified for free or reduced-price school lunch to determine if the interventions were particularly effective for that group.
The study was not designed to estimate the impacts of the individual interventions on subgroups of students and thus did not enroll sufficient numbers of students to obtain precise estimates of such impacts. For this reason, we focus on the impacts of the four interventions combined and the
80

three word-level interventions combined. The full subgroup results—including the estimated impacts of the individual interventions on subgroups of students—are presented in Tables IV.2 through IV.10, with effect sizes shown in Tables IV.12 through IV.20.
All of the tables of subgroup results contain two types of significance tests. One significance test is used to assess whether the impact for that subgroup is statistically different from 0, as indicated by an asterisk. That is, within a subgroup—for example, third graders with Word Attack scores below the 30th percentile at the beginning of the school year—an asterisk indicates that the interventions improved reading ability, as measured by that particular test, as compared with the control group. The other significance test is whether the impact for the subgroup is different from the overall impact (within grade levels), as indicated by a pound sign (#). In the example above, a pound sign would indicate that the impact for third graders with low Word Attack scores at the beginning of the year was significantly different from that for all third graders. Comparing third graders with low Word Attack scores to all third graders is algebraically equivalent to comparing third graders with low Word Attack scores to third graders with high Word Attack scores. With the exception of comparisons between impacts for third and fifth graders, in the text we describe the tests as that of a comparison between students with low Word Attack scores and all students because we are interested in determining whether the impacts would be different had we enrolled only students with low Word Attack scores, as compared to the full range of scores found in the study.42
42 The estimated impacts are model-based estimates, derived from the estimated parameters of the two-level hierarchical linear model specified earlier in this chapter. From those estimated parameters, we also derive standard errors for the estimated impacts and statistics for conducting significance tests pertaining to the impacts. These standard errors and test statistics are reported in Appendix M. Although model-based impact estimates are more precise than, for example, simple difference-of-means estimates, some of the reported impacts—especially those for small subgroups—are estimated much less precisely than other impacts that are presented, such as those for all third graders or all fifth graders. When the data do not enable us to have substantial confidence in an estimated impact because, for example, there is substantial variability in outcomes across a small sample of students, the standard error for the impact estimate will be large relative to the impact estimate. Furthermore, the test statistic for testing the hypothesis that the impact is zero will be relatively small, providing insufficient evidence to reject the hypothesis. Then, we conclude that the impact is “not significant.” When assessing the potential implications of such a finding, however, it is important to keep in mind the power of the evaluation to detect significant impacts and, especially, the fact that the minimum detectable impact (MDI) of an individual intervention on a subgroup is fairly large—0.7, as noted in Chapter II. (The MDI on a subgroup is 0.35 for the four interventions combined.) As discussed above, the evaluation was not designed to estimate the impacts of the individual interventions on subgroups of students and, thus, did not enroll sufficiently large numbers of students to obtain precise estimates of such impacts. In fact, based on findings from previous studies, this evaluation was designed to detect fairly large impacts—even for all eligible students in a grade—and not to estimate small impacts precisely.
81

1. Students with Relatively Low or High Word Attack Scores at Baseline
The first subgroup examined is students who entered the study with relatively low scores in phonemic decoding—specifically, Word Attack test scores below the 30th percentile. Although the overall average score on the Word Attack test for this subgroup is still substantially higher than has been reported in many earlier intervention studies of substantially more impaired students of this age, there were no students in this group with average or above average scores in phonemic decoding before the intervention began.
The impacts for students with low Word Attack scores were generally similar to those for the full sample of students (see Table IV.2). Among third graders with low Word Attack scores, the four interventions combined and the three word-level interventions combined had positive impacts on both measures of phonemic decoding, as was seen for all third graders. Likewise, the four interventions combined and the three word-level interventions combined improved scores on the measure of reading accuracy (Word Identification) for all third graders and for third graders with low Word Attack scores. However, while the four interventions combined and the three word-level interventions combined also improved scores on the Sight Word Efficiency and Aimsweb fluency tests for the sample of all third graders, they did not improve scores on these tests for third graders with low Word Attack scores. The impacts on reading comprehension are similar to those for the full sample, with impacts on GRADE test scores but not on Passage Comprehension test scores. The three word-level interventions also had a statistically significant impact on GRADE test scores for these students.
Among fifth graders with low Word Attack scores, the impacts are similar to those seen for all fifth graders. For fifth graders with low Word Attack scores, the four interventions combined improved Word Attack test scores and one measure of reading accuracy and fluency, albeit a different measure than was seen for the full sample of fifth graders—Word Identification rather than Sight Word Efficiency. The three word-level interventions improved Word Attack scores among this group, as for all fifth-graders, but also improved scores on the Word Identification test. Although for some of the reading measures the size of the impact appears to be larger for the low Word Attack group than for the sample as a whole, the impacts for these two groups are not significantly different from each other in most cases. We thus cannot conclude that low scores on the Word Attack test at the beginning of the school year made a reliable and consistent difference in the size of impacts obtained.
Consistent with that conclusion, in general, the impacts for students with relatively high Word Attack scores at baseline are also similar to those for all students, among both third and fifth graders (see Table IV.3). Among third graders with Word Attack scores greater than 92, the four interventions combined had impacts on almost all of the same tests as was seen for all third graders. The Aimsweb and GRADE tests are the exception; impacts on these test scores are seen for the full sample but not for students with relatively high Word Attack scores. As was seen for the sample of all fifth-grade students,
82

there are only scattered impacts among fifth-grade students with Word Attack scores above 92. In this group the four interventions combined and the three word-level interventions combined had impacts on scores of only one test: the Aimsweb test of reading fluency, a test on which no impacts were seen for the full sample of fifth graders.
2. Students with Relatively Low or High Vocabulary at Baseline
Because the impacts of the interventions may vary by students’ broad vocabulary level, we also examined impacts for students with relatively high or relatively low verbal ability according to the Peabody Picture Vocabulary Test—Revised (selecting scores above or below the 30th percentile, respectively). The patterns of impacts for third and fifth graders in these two subgroups are fairly similar to those seen for all third- and fifth-grade students, respectively.
Slightly fewer impacts are seen for third graders with low Peabody Picture Vocabulary test scores than were seen for all third graders. However, none of the differences in impacts is statistically significant (see Table IV.4). It appears as though the four interventions had slightly more impacts on third-grade students who began the year with relatively high Peabody Picture Vocabulary test scores (see Table IV.5), as compared to all third graders, although again, none of the differences in impacts is statistically significant. The four interventions combined improved scores on all three measures of reading accuracy and fluency for third-grade students with high Peabody Picture Vocabulary test scores. For students with low Peabody Picture Vocabulary test scores, the four interventions improved only Sight Word Efficiency scores. The three word-level interventions improved Word Identification and Aimsweb scores for students with high verbal ability, and Sight Word Efficiency scores for students with low verbal ability.
Among the fifth graders with relatively high or low Peabody Picture Vocabulary test scores, the impacts of the four interventions combined, and the three word-level interventions combined are similar to those for all fifth graders. The exceptions for students with low Peabody Picture Vocabulary test scores are that the four interventions combined improved not only Word Attack and Sight Word Efficiency scores but also scores on the Phonemic Decoding Efficiency test. The three word-level interventions combined improved scores on the Word Identification and Sight Word Efficiency tests in addition to the Word Attack test. The exceptions for students with high Peabody Picture Vocabulary test scores are that the four interventions combined did not improve scores on the Sight Word Efficiency test, but the four interventions combined and the three word-level interventions combined improved scores on the Passage Comprehension test in addition to scores on the Word Attack test.
83

3. Subgroups Defined Jointly by Baseline Phonemic Decoding and Vocabulary Scores
There was some expectation that the impacts of the interventions might be larger for students with low phonemic decoding ability but relatively high vocabulary, as this would create a sample that is more consistent with the way reading disabilities have been defined, and previous studies have found large impacts for students with severe disabilities (Lyon and Shaywitz 2003). We therefore examined impacts within subgroups defined by baseline Word Attack and Peabody Picture Vocabulary test scores. Each subgroup is approximately 25 percent of the full sample. We generally did not find large differences in impacts across subgroups defined by these tests (see Tables IV.6 through IV.8). The following is a summary of the impacts for three groups of students of particular interest defined by these two tests:
Students with Low Word Attack and Low Peabody Picture Vocabulary Test Scores.43 Very few impacts are seen among third graders in this group. In fact, the four interventions combined had an impact only on scores on the GRADE test, and the three word-level interventions combined did not have a statistically significant impact on any measure of reading ability. For fifth graders in this group, the four interventions combined had positive impacts on scores on the Phonemic Decoding Efficiency and Sight Word Efficiency tests.
Students with Low Word Attack and High Peabody Picture Vocabulary Test Scores.44 Few impacts are seen for students in this group in either grade. Among third graders in this group, the four interventions combined had impacts only on scores on the GRADE test. The three word-level interventions also improved Word Attack scores. Among fifth graders in this group, the four interventions combined and the three word-level interventions combined had impacts only scores on the Word Attack test.
Students with High Word Attack and High Peabody Picture Vocabulary Test Scores.45 Among the third graders in this group, the four interventions combined and the three word-level interventions combined improved Word Attack scores. The four interventions combined and the three word-level interventions combined did not have a statistically significant impact on any other test scores, except that the three word-level interventions had a
43 Students in this group had low reading ability as measured by the Word Attack test (below the 30th percentile) and low verbal ability, as measured by the Peabody Picture Vocabulary test (below the 30th percentile).
44 This group of students had low reading ability (below the 30th percentile) but relatively high vocabulary skills (above the 30th percentile) at the beginning of the school year.
45 These students began the year with relatively high reading ability and vocabulary skills (above the 30th percentile on both tests).
84

negative impact on Passage Comprehension scores in this group. Among fifth graders in this group, the four interventions combined and the three word-level interventions combined had impacts only on the two measures of phonemic decoding; no impacts were seen on reading fluency and accuracy or comprehension for fifth graders.
These findings suggest that the large effects found in some previous studies of severely impaired students might not pertain to broader groups of struggling readers that include, for example, students with only moderately impaired phonemic decoding skills.
4. Subgroups Defined by Eligibility Status for Free or Reduced-Price School Lunch
Because of increased attention on schools with a high proportion of low-income students, we examined whether impacts vary with students’ socioeconomic status by estimating impacts (in Tables IV.9 and IV.10) within subgroups defined by eligibility for free or reduced-price school lunch (FRPL).46 Among third graders, larger impacts were seen for the 58 percent of students ineligible for FRPL (with relatively high family income) than for the 42 percent of students eligible for FRPL (with relatively low family income). The four interventions combined and the three word-level interventions combined had an impact only on Word Attack for third-grade students eligible for FRPL, but had impacts on every test for students ineligible for FRPL, with some significant differences between the groups. The large impacts on all tests for third-grade students ineligible for FRPL appear to be primarily attributable to large impacts of Wilson Reading for this group, which may in turn be partially due to the fact that the Wilson Reading control students ineligible for FRPL experienced large declines in almost all test scores.
Few impacts of the four interventions combined are seen for fifth-grade students who are either eligible or ineligible for FRPL (see Tables IV.9 and IV.10). Among the 57 percent of fifth graders who are eligible for FRPL, the four interventions combined and the three word-level interventions combined had a positive impact only on the Sight Word Efficiency test of reading fluency, and the four interventions combined had a negative impact on the GRADE test of comprehension. Among the 43 percent of fifth-grade students ineligible for FRPL, the four interventions combined and the three word-level interventions combined had impacts only on the Word Attack test of phonemic decoding.
G. DO THE INTERVENTIONS CLOSE THE READING GAP?
The impact estimates show that for most outcomes that measured word-level skills and comprehension, third graders in one of the four interventions had better reading scores than the control students who received their ordinary
46 Information on students’ eligibility for free or reduced-price school lunch was generally obtained from school records. See Appendix C for more details.
85

instruction. For fifth graders, impacts of the four interventions combined were found only for Word Attack and Sight Word Efficiency. To assess the extent to which the interventions helped to close the reading gap during the period of the intervention, we assess how much smaller the gap is for students in the interventions than for students in the control group at the end of the school year. Our standard for determining each group’s reading gap is the score (of 100) for an average reader in the national population of students. Thus, the gap for the control group, for example, is 100 minus the average standard score for the group. If the average score is 90, the gap is 100 - 90 = 10. The reading gap describes the extent to which the average student in one of the two evaluation groups (intervention or control) is lagging behind the average student in the population.
On most outcomes, the average student in our evaluation was between one-half and one standard deviation—about 7 to 15 standard score points—below the population average before the interventions started (see Figures IV.2-IV.13 and Table IV.31).47 By the end of the school year when the interventions had ended, third-grade students in the control group were still generally between one-half and one standard deviation below the population average, while fifth-grade students in the control group were about one-third to three-quarters of a standard deviation below.
Reflecting the estimated pattern of impacts, the gaps at the end of the school year for students in the interventions were smaller than those for the students in the control group, although as noted above, only some of the impacts are statistically significant. To quantify the effect of the interventions on closing the gap, we computed a statistic that shows the reduction in the gap due to the interventions relative to the size of the gap for the control group at the end of the school year.48
Table IV.31 shows that the gap for third-grade students in the control group in phonemic decoding skills on the Phonemic Decoding Efficiency subtest of the TOWRE, for example, is about 11 standard score points at the end of the third grade (100 - 89). Students in the intervention group had an average standard score that was about 8 points below the population mean (100 - 92). The 3 point difference in the reading gap for those in the intervention and control groups represents the impact of the interventions and shows that being in one of the interventions reduced the gap by about one-quarter (3/11 = 0.27). As another example, the almost 5 point impact on the GRADE, which is a measure of reading comprehension, also results in a gap reduction of about 25 percent. The result for GRADE is particularly interesting because third graders in the control group lost ground relative to the national average between the beginning and the end of the school year, which increased the gap in reading
47 In terms of percentiles, the average student in our evaluation was at about the 31st percentile on a measure such as Word Attack and the 18th percentile on the GRADE test.
48 The relative gap reduction due to the intervention was computed as: RGR=[(100-Mean for Control Group)-(100-Mean for Treatment Group at Follow-up)]/(100-Mean for Control Group at Follow-up)=IMPACT/(100-Mean for Control Group at Follow-up), where 100 is the mean for the normed population.
86

comprehension for these struggling readers. Students in the intervention group did not fall farther behind and, thus, the end of the year reading gap was smaller by about 5 points. However, despite this effect of the interventions, the average student in the interventions was approximately 14 standard score points below the average student in the nation at the end of the year. Results for the other outcomes show that the largest reduction in the reading gap for third graders occurred on the Word Attack test (69 percent reduction). On the tests for other word-level skills and reading comprehension, the interventions reduced the gap by about one-fifth or one-quarter after one year.
For fifth graders, the interventions reduced the gap by more than 50 percent on Word Attack and by about 12 percent on Sight Word Efficiency. For most of the other outcomes, for which impacts were not statistically significant, negligible reductions were observed. At the end of the school year, the gap for the average intervention student was approximately 2 points for Word Attack, 10 points for Sight Word Efficiency, and 8 points for the GRADE test of reading comprehension.49
49 These analyses examine whether the interventions closed the gap for the average student in the interventions. In future analyses, we plan to explore another approach for estimating the impact of the interventions on closing the reading gap. This approach will contrast the percentage of students in the intervention groups and the control groups who scored within the “normal range” on the standardized tests
87

Figure IV.2
Third-Grade Gains in Word Attack
88
Before Intervention After Intervention
( C )
( T )
Achievement Norm
Treatment Gap = 8.4
Impact = 3.0
ControlGap = 11.4
Before Intervention
Figure IV.3
Third-Grade Gains in Phonemic Decoding Efficiency
After Intervention
Treatment Gap = 2.2
80
90
100
90
80
B F
( C )
( T )
Achievement Norm
Impact = 5.0
ControlGap = 7.25.0a
0.2b
aTreatment group gainbControl group gain
80
90
100
B F
6.0
3.0
( C )
( T )
Achievement Norm
Treatment Gap = 9.6
Impact = 2.3
ControlGap = 11.9
Before Intervention After Intervention
Figure IV.4
Third-Grade Gains in Word Identification
1.7
-0.6

89
( C )
( T )
Achievement Norm
Treatment Gap = 7.4
Impact = 2.7
ControlGap = 10.1
Before Intervention After Intervention
Figure IV.5
Third-Grade Gains in Sight Word Efficiency
6.1
3.4
( C )
( T )
Achievement Norm
Treatment Gap = 6.1
Impact = 1.2
ControlGap = 7.3
Figure IV.6
Third-Grade Gains in Passage Comprehension
Before Intervention After Intervention
2.1
0.9
( C )
( T )
Achievement Norm
Treatment Gap = 13.1
Impact = 4.6
ControlGap = 17.7
Figure IV.7
Third-Grade Gains in GRADE Test
Before Intervention After Intervention
0.7
-4.0

Figure IV.8
Fifth-Grade Gains in Word Attack
90
( T )( C )
( C )( T )
( C )( T )
Achievement Norm
Treatment Gap = 7.9
Impact = 0.5
ControlGap = 8.4
Before Intervention After Intervention
Figure IV.10
Fifth-Grade Gains in Word Identification
Treatment Gap = 2.0
80
90
100
B F
Achievement Norm
Impact = 2.7
ControlGap = 4.7
Before Intervention After Intervention
4.8
2.2
Achievement Norm
Treatment Gap = 11.7
Impact = 1.4
ControlGap = 13.1
Before Intervention
Figure IV.9
Fifth-Grade Gains in Phonemic Decoding Efficiency
After Intervention
5.9
7.3
80
90
100
B F
3.4
2.9
91
80
90
100
B F
( C )
( T )
Achievement Norm
Treatment Gap = 10.4
Impact = 1.4
ControlGap = 11.8
Before Intervention After Intervention
Figure IV.11
Fifth-Grade Gains in Sight Word Efficiency
5.4
4.0
( C )( T )
Achievement Norm
Treatment Gap = 7.8
Impact = 1.3
ControlGap = 9.1
Figure IV.12
Fifth-Grade Gains in Passage Comprehension
Before Intervention After Intervention
-0.4
-1.7
( C )( T )
Achievement Norm
Treatment Gap = 7.7
Impact = -0.2
ControlGap = 7.5
Figure IV.13
Fifth-Grade Gains in GRADE Test
Before Intervention After Intervention
0.81.0

82
Control Control Control Control Control ControlGrade 3 Baseline Gain Gain Gain Gain Gain Gain
Word Attack 92.6 0.2 5.0 * 0.0 6.8 * 0.7 -0.5 2.5 6.5 * -3.0 8.8 * 0.5 5.2 *TOWRE PDE 85.6 3.0 3.0 * 2.6 4.4 * 4.1 -1.3 4.1 7.1 * 0.2 5.8 * 3.6 0.4
Word Identification 88.7 -0.6 2.3 * -0.6 2.6 * -0.5 1.3 0.4 2.0 -2.3 2.5 0.1 3.3 *TOWRE SWE 86.5 3.4 2.7 * 3.6 2.8 * 2.9 2.6 4.9 0.7 3.5 3.1 2.4 4.6 *Aimsweb 40.9 20.6 4.9 * 20.3 5.9 * 21.5 1.9 22.6 1.0 17.5 6.0 20.9 10.7 *
Passage Comprehension 91.8 0.9 1.2 1.5 0.7 -0.8 2.7 2.4 0.2 -0.5 1.0 2.6 0.9GRADE 86.2 -4.0 4.6 * -3.1 4.4 -6.5 5.3 -4.2 4.9 -4.3 4.2 -0.9 4.2
Sample Size 335
Control Control Control Control Control ControlGrade 5 Baseline Gain Gain Gain Gain Gain Gain
Word Attack 93.1 2.2 2.7 * 2.4 3.9 * 1.3 -0.9 3.2 5.3 * 2.0 4.4 * 2.1 1.9TOWRE PDE 81.0 5.9 1.4 6.3 1.5 4.6 1.1 7.9 4.1 * 6.8 -1.4 # 4.3 1.9
Word Identification 88.7 2.9 0.5 2.8 0.9 3.1 -0.6 2.8 0.1 2.6 2.1 3.1 0.3TOWRE SWE 84.2 4.0 1.4 * 4.5 1.3 2.4 1.7 5.6 2.1 4.6 -0.5 3.4 2.2Aimsweb 77.4 19.1 2.0 18.7 2.8 20.5 -0.3 19.6 3.6 19.4 -0.1 17.1 4.9
Passage Comprehension 92.7 -1.7 1.3 -2.1 1.6 -0.6 0.3 -1.2 0.6 -3.7 2.5 -1.4 1.8GRADE 91.5 1.0 -0.2 0.8 0.3 1.6 -1.6 -0.5 -0.7 -0.7 1.3 3.6 0.3
Sample Size 407
* Impact is statistically significant at the 0.05 level.
# Impact is statistically different from the 3rd grade impact at the 0.05 level.
Corrective ReadingAll Interventions Word-level interventions Failure Free Reading Spell Read Wilson Reading
Table IV.1
Impacts for 3rd and 5th Graders
Corrective ReadingAll Interventions Word-level interventions Failure Free Reading Spell Read Wilson ReadingABCDImpact
BCDImpact
DImpact
AImpact
BImpact
B
CImpact
C DImpact Impact Impact Impact Impact ImpactABCD BCD A

82
Control Control Control Control Control ControlGrade 3 Baseline Gain Gain Gain Gain Gain Gain
Word Attack 84.6 2.8 4.5 * 2.7 6.5 * 3.0 -1.5 5.9 6.0 -0.6 7.8 * 2.8 5.9TOWRE PDE 82.1 2.3 3.3 * 1.5 5.4 * 4.5 -2.7 4.0 7.8 * -0.9 5.7 1.4 2.5
Word Identification 85.2 -0.4 1.7 * -0.5 2.1 * 0.0 0.6 1.3 0.6 -3.8 3.6 * 0.9 2.1TOWRE SWE 82.8 3.2 2.1 3.0 2.4 3.8 1.1 5.4 -0.8 0.9 4.3 2.8 3.6Aimsweb 31.9 21.0 1.6 20.9 2.0 21.3 0.4 22.9 -5.3 15.0 7.2 24.7 4.2
Passage Comprehension 86.8 2.2 1.3 2.2 1.3 2.4 1.5 3.8 1.7 -1.7 3.1 4.4 -1.0GRADE 83.0 -6.5 6.7 * -6.3 7.1 * -7.1 5.5 -7.5 7.3 -6.7 4.6 -4.7 9.4
Sample Size 173
Control Control Control Control Control ControlGrade 5 Baseline Gain Gain Gain Gain Gain Gain
Word Attack 84.5 4.6 3.3 * 4.9 4.7 * 3.7 -0.8 3.3 8.0 * 6.9 2.9 4.5 3.2TOWRE PDE 75.5 6.4 1.6 7.1 1.8 4.0 1.0 7.5 6.6 * 9.0 -3.0 4.9 1.9
Word Identification 84.1 2.6 1.7 * # 2.7 1.6 * 2.2 2.0 # 3.5 0.1 2.4 2.1 2.1 2.7TOWRE SWE 81.3 3.7 1.3 4.3 1.4 1.8 0.7 5.4 2.7 5.8 -2.2 1.8 3.8 *Aimsweb 67.4 20.3 -1.4 # 20.1 -1.0 20.8 -2.7 26.0 -5.8 # 17.0 -1.7 17.3 4.5
Passage Comprehension 89.2 -0.8 1.0 -1.3 1.6 0.5 -0.8 0.0 1.0 -1.6 0.9 -2.2 2.8GRADE 88.2 0.9 1.2 1.4 0.9 -0.5 2.1 0.1 0.1 -0.6 4.1 4.5 -1.4
Sample Size 201
* Impact is statistically significant at the 0.05 level.
# Impact is statistically different from the impact for all students in that grade at the 0.05 level.
DImpact Impact Impact Impact Impact ImpactABCD BCD A B
CImpact
C
DImpact
AImpact
BImpact
ABCDImpact
BCDImpact
Table IV.2
Impacts for 3rd and 5th Graders with Low Baseline Word Attack Scores
Corrective ReadingAll Interventions Word-level interventions Failure Free Reading Spell Read Wilson Reading
Corrective ReadingAll Interventions Word-level interventions Failure Free Reading Spell Read Wilson Reading

82
Control Control Control Control Control ControlGrade 3 Baseline Gain Gain Gain Gain Gain Gain
Word Attack 101.1 -1.8 4.3 * -1.9 5.9 * -1.4 -0.3 -1.2 6.2 * -3.3 6.8 * -1.3 4.6TOWRE PDE 89.3 3.7 2.8 * 3.2 3.8 * 5.0 -0.2 4.6 5.9 * 0.4 5.7 * 4.6 -0.4
Word Identification 92.5 -1.3 3.0 * -1.5 3.2 * -0.7 2.3 -0.1 1.6 -2.7 2.9 -1.7 5.0 *TOWRE SWE 90.4 5.0 2.1 * 5.6 1.4 3.3 4.4 * 5.3 0.9 7.0 0.3 4.4 3.0Aimsweb 50.4 22.4 3.9 21.2 5.3 26.0 -0.3 22.5 2.4 17.2 6.1 23.9 7.5
Passage Comprehension 97.2 1.8 -1.2 3.5 -2.7 -3.1 3.2 1.0 -1.0 7.9 -8.3 * 1.5 1.1GRADE 89.8 -0.1 0.7 0.6 0.0 -2.1 2.6 0.8 1.1 0.3 -0.4 0.7 -0.5
Sample Size 162
Control Control Control Control Control ControlGrade 5 Baseline Gain Gain Gain Gain Gain Gain
Word Attack 101.7 0.5 1.6 0.9 2.5 -0.8 -1.0 3.1 2.8 0.1 2.7 -0.4 1.9TOWRE PDE 86.3 5.8 1.3 6.0 1.1 5.2 2.0 8.3 1.9 5.3 0.3 4.5 1.2
Word Identification 93.2 3.3 -0.6 # 3.2 0.0 3.8 -2.4 # 2.5 0.2 3.5 1.1 3.5 -1.3TOWRE SWE 87.1 4.4 1.7 5.0 1.1 2.4 3.5 * 6.1 2.1 4.4 0.7 4.6 0.6Aimsweb 87.3 17.1 5.3 * # 16.7 5.5 * 18.3 4.7 12.7 12.3 * # 21.6 -0.6 15.8 4.9
Passage Comprehension 96.1 -1.7 0.3 -1.9 0.3 -1.1 0.6 -2.2 0.3 -3.6 1.6 0.1 -1.2GRADE 94.7 1.2 -1.7 0.1 -0.3 4.6 -5.8 -3.1 1.3 -0.3 -2.6 3.7 0.4
Sample Size 206
* Impact is statistically significant at the 0.05 level.
# Impact is statistically different from the impact for all students in that grade at the 0.05 level.
Impact ImpactImpact Impact Impact ImpactC D
All Interventions Word-level interventionsABCD BCD A B
Failure Free Reading Spell Read
C DImpact Impact
Wilson Reading Corrective Reading
Impact Impact Impact ImpactABCD BCD A B
Table IV.3
Impacts for 3rd and 5th Graders with high baseline Word Attack scores
All Interventions Word-level interventions Failure Free Reading Spell Read Wilson Reading Corrective Reading

82
Control Control Control Control Control ControlGrade 3 Baseline Gain Gain Gain Gain Gain Gain
Word Attack 92.1 -0.4 4.9 * -0.2 6.1 * -1.0 1.2 3.0 7.5 * -1.9 6.6 * -1.6 4.2TOWRE PDE 85.3 3.3 2.3 4.0 2.5 1.0 1.5 6.9 4.1 2.4 3.0 2.8 0.5
Word Identification 87.9 -0.1 1.3 0.1 1.3 -0.4 1.1 1.9 0.0 -0.6 0.6 -1.1 3.5 *TOWRE SWE 86.1 3.2 3.6 * 3.0 4.1 * 3.6 2.2 3.6 2.2 3.3 4.9 2.1 5.1Aimsweb 38.9 21.8 0.5 22.2 0.0 20.6 2.1 25.0 -2.4 19.1 0.9 22.6 1.3
Passage Comprehension 90.0 0.5 1.4 1.4 0.7 -2.4 3.4 3.9 -0.6 1.5 -1.6 -1.1 4.4GRADE 83.6 -5.5 5.2 * -4.9 5.2 -7.5 4.9 -4.0 4.1 -6.6 3.6 -4.0 8.0
Sample Size 148
Control Control Control Control Control ControlGrade 5 Baseline Gain Gain Gain Gain Gain Gain
Word Attack 91.9 1.2 4.0 * 1.4 5.6 * 0.6 -0.7 4.8 4.5 * 1.0 6.5 * -1.5 5.7 *TOWRE PDE 80.1 5.3 2.6 * 6.1 2.5 2.9 3.0 9.2 3.3 * 4.6 2.0 4.4 2.1
Word Identification 86.8 1.6 1.5 1.3 2.4 * 2.4 -1.2 3.2 -0.8 0.1 5.1 * # 0.7 2.9TOWRE SWE 83.5 2.5 3.9 * # 2.8 4.0 * # 1.7 3.7 4.7 3.4 3.2 2.8 0.4 5.7 *Aimsweb 72.5 20.4 1.0 19.7 1.3 22.5 -0.1 18.1 6.0 18.5 1.8 22.4 -3.8
Passage Comprehension 89.6 -1.5 1.9 -1.7 2.3 -0.8 0.8 0.1 1.4 -1.1 1.4 -4.1 4.3GRADE 87.5 -2.0 1.2 -2.0 1.7 -1.9 -0.1 -1.2 0.4 -1.1 -1.8 -3.7 6.3
Sample Size 200
* Impact is statistically significant at the 0.05 level.
# Impact is statistically different from the impact for all students in that grade at the 0.05 level.
Corrective ReadingAll Interventions Word-level interventions Failure Free Reading Spell Read Wilson Reading
Table IV.4
Impacts for 3rd and 5th Graders with Low Screening Peabody Picture Vocabulary Test Scores
Corrective ReadingAll Interventions Word-level interventions Failure Free Reading Spell Read Wilson ReadingABCDImpact
BCDImpact
DImpact
AImpact
BImpact
B
CImpact
C DImpact Impact Impact Impact Impact ImpactABCD BCD A

82
Control Control Control Control Control ControlGrade 3 Baseline Gain Gain Gain Gain Gain Gain
Word Attack 93.0 0.4 5.5 * 0.2 7.4 * 0.9 -0.2 0.9 7.6 * -4.4 11.6 * 4.1 3.1TOWRE PDE 85.8 3.5 2.6 2.8 4.5 * 5.8 -3.1 2.0 9.2 * 2.2 4.2 4.2 0.1
Word Identification 89.4 -0.8 2.5 * -1.1 3.1 * 0.2 0.7 -0.5 2.6 -3.8 4.5 * 0.9 2.3TOWRE SWE 86.8 3.2 2.8 * 3.7 2.3 1.5 4.3 4.8 0.9 3.1 2.4 3.3 3.7Aimsweb 42.5 19.5 6.7 * 18.6 8.5 * 22.4 1.5 20.9 1.7 14.1 9.4 20.8 14.2 *
Passage Comprehension 93.2 0.1 2.0 0.3 1.7 -0.3 3.0 1.1 1.1 -2.7 2.6 2.4 1.3GRADE 88.3 -3.6 5.6 * -2.3 4.9 -7.3 7.6 -4.3 5.5 -4.3 7.4 1.6 1.7
Sample Size 187
Control Control Control Control Control ControlGrade 5 Baseline Gain Gain Gain Gain Gain Gain
Word Attack 94.2 1.5 3.0 * 1.7 4.1 * 0.9 -0.2 2.0 6.6 * 1.0 3.9 2.1 1.8TOWRE PDE 81.7 5.0 1.5 5.0 1.9 5.2 0.4 4.8 6.3 * 6.5 -3.0 3.5 2.3
Word Identification 90.2 3.0 0.3 2.9 0.3 3.1 0.5 2.1 0.5 3.7 0.1 # 3.0 0.2TOWRE SWE 84.8 4.4 0.3 # 4.9 0.2 # 2.6 0.6 6.3 1.5 4.2 -1.6 4.3 0.6Aimsweb 81.5 19.2 1.2 19.2 1.8 19.0 -0.6 21.9 -0.4 19.4 -1.6 16.4 7.5
Passage Comprehension 95.3 -3.1 2.4 * -3.9 2.9 * -0.6 0.8 -2.2 0.2 -9.1 6.0 * -0.4 2.4GRADE 94.8 1.3 0.3 1.1 0.8 2.0 -1.1 -1.6 0.6 -0.6 3.7 5.3 -2.1
Sample Size 207
* Impact is statistically significant at the 0.05 level.
# Impact is statistically different from the impact for all students in that grade at the 0.05 level.
DImpact Impact Impact Impact Impact ImpactABCD BCD A B
CImpact
C
DImpact
AImpact
BImpact
ABCDImpact
BCDImpact
Table IV.5
Impacts for 3rd and 5th Graders with High screening Peabody Picture Vocabulary Test Scores
Corrective ReadingAll Interventions Word-level interventions Failure Free Reading Spell Read Wilson Reading
Corrective ReadingAll Interventions Word-level interventions Failure Free Reading Spell Read Wilson Reading

82
Control Control Control Control Control ControlGrade 3 Baseline Gain Gain Gain Gain Gain Gain
Word Attack 85.5 1.1 3.5 1.4 5.0 0.2 -1.1 1.4 11.5 * 3.6 -2.6 -0.6 6.0TOWRE PDE 82.1 1.4 2.7 1.9 3.6 -0.1 0.2 6.7 4.4 -1.7 3.3 0.6 3.0
Word Identification 85.0 0.0 0.4 0.0 0.3 -0.2 0.7 2.6 -1.6 -1.1 -0.9 -1.4 3.4TOWRE SWE 82.5 4.0 2.1 4.5 1.8 2.5 3.0 5.8 -0.3 5.6 0.7 2.1 5.1Aimsweb 31.8 21.4 -0.9 20.6 -0.1 23.8 -3.5 22.4 -4.0 25.1 -5.6 14.3 9.3
Passage Comprehension 85.5 1.5 1.4 2.9 0.1 -2.6 5.5 7.0 -1.9 2.5 -2.5 -1.0 4.6GRADE 81.7 -7.4 6.4 * -6.3 5.7 -11.0 8.4 -5.1 4.0 -3.6 0.8 -10.0 12.2 *
Sample Size 81
Control Control Control Control Control ControlGrade 5 Baseline Gain Gain Gain Gain Gain Gain
Word Attack 83.7 3.3 3.8 2.8 5.9 * 4.6 -2.6 2.8 8.3 * 3.7 3.9 2.0 5.5TOWRE PDE 74.7 4.6 4.1 * 6.1 4.2 0.2 3.8 7.5 6.1 * 6.5 1.8 4.2 4.6
Word Identification 82.6 2.8 0.9 3.1 0.5 1.9 2.0 3.9 -1.0 2.8 0.9 2.5 1.7TOWRE SWE 80.0 4.3 3.6 * 5.2 3.5 1.3 4.0 5.3 4.0 6.2 2.7 4.2 3.8Aimsweb 62.7 25.8 -7.7 # 25.2 -7.4 # 27.8 -8.9 25.3 -4.9 20.9 -4.6 29.4 -12.5 #
Passage Comprehension 86.0 -3.6 5.6 -5.2 7.7 1.5 -0.8 -1.5 4.4 -6.1 7.4 -8.2 11.3GRADE 84.4 -3.8 3.1 -4.6 4.2 -1.1 -0.1 -4.4 4.1 -2.7 -0.2 -6.8 8.5
Sample Size 111
* Impact is statistically significant at the 0.05 level.
# Impact is statistically different from the impact for all students in that grade at the 0.05 level.
Corrective ReadingAll Interventions Word-level interventions Failure Free Reading Spell Read Wilson Reading
Table IV.6
Impacts for 3rd and 5th Graders with Low Baseline Word Attack and Low Screening Peabody Picture Vocabulary Test Scores
Corrective ReadingAll Interventions Word-level interventions Failure Free Reading Spell Read Wilson ReadingABCDImpact
BCDImpact
DImpact
AImpact
BImpact
B
CImpact
C DImpact Impact Impact Impact Impact ImpactABCD BCD A

82
Control Control Control Control Control ControlGrade 3 Baseline Gain Gain Gain Gain Gain Gain
Word Attack 83.9 5.2 4.0 5.8 5.3 * 3.5 0.2 7.3 4.4 -1.6 13.1 * 11.8 -1.7TOWRE PDE 82.1 3.8 2.3 3.1 4.4 5.8 -4.1 2.7 8.6 * 2.0 4.8 4.6 -0.1
Word Identification 85.4 0.1 1.7 0.0 2.4 0.6 -0.4 1.2 0.5 -4.7 5.7 * 3.4 0.9TOWRE SWE 83.1 2.1 2.4 1.9 2.6 2.8 1.7 4.4 0.1 -2.2 6.4 3.4 1.4Aimsweb 32.1 21.3 1.4 21.1 1.9 21.8 -0.4 23.8 -7.6 13.0 10.4 26.4 3.0
Passage Comprehension 87.9 2.7 2.5 1.9 3.0 5.0 1.0 3.8 2.6 -4.4 8.5 # 6.3 -2.2GRADE 84.1 -4.9 7.4 * -4.5 7.5 * -5.9 6.9 -6.2 5.3 -13.0 16.2 * # 5.7 1.1
Sample Size 92
Control Control Control Control Control ControlGrade 5 Baseline Gain Gain Gain Gain Gain Gain
Word Attack 85.4 4.5 3.5 * 4.8 4.7 * 3.7 0.1 4.1 8.2 * 6.2 3.5 4.0 2.4TOWRE PDE 76.3 6.3 0.6 6.5 1.3 5.9 -1.4 7.2 8.2 * 7.7 -4.8 4.5 0.3
Word Identification 85.6 2.7 1.4 2.9 1.2 2.2 2.1 3.6 0.1 2.9 0.9 2.3 2.6TOWRE SWE 82.6 3.3 -0.1 3.8 0.2 1.7 -0.9 4.6 3.4 4.7 -5.0 2.0 2.2Aimsweb 72.2 18.3 0.6 17.8 2.0 20.0 -3.9 25.3 -3.1 14.1 -0.3 13.8 9.4
Passage Comprehension 92.4 -1.6 1.0 -2.1 1.3 -0.2 0.0 -0.1 -0.2 -6.6 3.5 0.3 0.6GRADE 92.1 1.3 2.5 2.1 1.6 -1.2 5.2 1.6 -0.7 -2.5 9.1 7.0 -3.6
Sample Size 90
* Impact is statistically significant at the 0.05 level.
# Impact is statistically different from the impact for all students in that grade at the 0.05 level.
DImpact Impact Impact Impact Impact ImpactABCD BCD A B
CImpact
C
DImpact
AImpact
BImpact
ABCDImpact
BCDImpact
Table IV.7
Impacts for 3rd and 5th Graders With Low Baseline Word Attack and high Peabody Picture Vocabulary Test Scores
Corrective ReadingAll Interventions Word-level interventions Failure Free Reading Spell Read Wilson Reading
Corrective ReadingAll Interventions Word-level interventions Failure Free Reading Spell Read Wilson Reading

82
Control Control Control Control Control ControlGrade 3 Baseline Gain Gain Gain Gain Gain Gain
Word Attack 101.7 -4.1 6.4 * -4.9 8.9 * -1.8 -1.2 -7.4 12.6 * # -5.6 8.0 * -1.8 6.2 *TOWRE PDE 89.4 4.0 2.5 3.3 4.0 6.3 -2.0 3.0 7.3 * 1.2 6.0 5.6 -1.3
Word Identification 93.2 -1.2 2.8 -1.8 3.3 0.4 1.4 0.2 1.3 -3.9 3.4 -1.7 5.0TOWRE SWE 90.3 6.7 0.5 8.1 -1.0 2.4 4.9 7.4 -2.1 11.5 -3.5 # 5.4 2.7Aimsweb 52.5 20.1 6.9 18.0 8.9 26.7 1.0 20.3 2.4 10.9 12.0 22.6 12.2
Passage Comprehension 98.3 3.0 -3.5 5.1 -5.8 * # -3.5 3.4 0.2 -1.0 15.5 -18.7 * # -0.2 2.2GRADE 92.3 1.8 -1.8 # 3.8 -3.5 # -4.4 3.1 4.1 -4.2 # 7.3 -4.1 0.0 -2.0
Sample Size 95
Control Control Control Control Control ControlGrade 5 Baseline Gain Gain Gain Gain Gain Gain
Word Attack 101.6 -0.6 3.1 * -0.5 4.1 * -0.8 0.1 0.0 6.8 * -1.9 3.2 0.4 2.2TOWRE PDE 86.3 4.0 3.5 * 4.0 3.8 * 4.0 2.4 3.2 5.8 5.4 2.6 3.5 3.1
Word Identification 94.1 3.6 -0.8 3.2 -0.8 4.6 -0.7 1.4 0.7 4.0 -0.7 4.2 -2.2 # TOWRE SWE 86.7 4.6 1.9 5.7 1.4 1.3 3.6 4.9 2.7 6.0 2.3 6.1 -1.0 # Aimsweb 89.4 18.1 4.1 18.7 3.8 16.1 5.0 13.8 7.1 25.6 -1.0 16.7 5.4
Passage Comprehension 97.7 -3.6 2.4 -4.2 2.6 -1.8 2.1 -5.9 3.0 -5.8 2.6 -0.9 2.0GRADE 97.1 1.6 -1.1 0.4 0.9 5.1 -7.3 -5.0 4.7 1.0 -1.4 5.1 -0.6
Sample Size 117
* Impact is statistically significant at the 0.05 level.
# Impact is statistically different from the impact for all students in that grade at the 0.05 level.
Corrective ReadingAll Interventions Word-level interventions Failure Free Reading Spell Read Wilson Reading
Table IV.8
Impacts for 3rd and 5th Graders with High Baseline Word Attack and High Screening Peabody Picture Vocabulary Test Scores
Corrective ReadingAll Interventions Word-level interventions Failure Free Reading Spell Read Wilson ReadingABCDImpact
BCDImpact
DImpact
AImpact
BImpact
B
CImpact
C DImpact Impact Impact Impact Impact ImpactABCD BCD A

82

82
Control Control Control Control Control ControlGrade 3 Baseline Gain Gain Gain Gain Gain Gain
Word Attack 92.2 1.3 4.7 * 1.6 5.9 * 0.7 1.3 1.7 8.4 * 0.2 6.0 * # 2.8 3.3TOWRE PDE 85.3 4.6 1.8 4.5 2.6 # 4.9 -0.7 5.1 6.2 * 1.9 3.6 # 6.5 -2.0
Word Identification 88.0 0.2 1.1 0.3 1.1 -0.2 1.0 2.3 -0.6 -1.4 1.2 0.0 2.8TOWRE SWE 85.5 3.5 1.3 4.0 0.7 2.2 3.0 4.1 -0.8 3.9 2.5 3.9 0.4 #Aimsweb 38.6 20.3 2.0 19.6 3.1 22.5 -1.1 22.0 -1.9 16.1 6.4 20.7 4.7
Passage Comprehension 90.4 3.3 -0.8 # 4.2 -1.2 # 0.7 0.4 3.5 0.5 4.5 -2.6 # 4.5 -1.5GRADE 84.4 -2.0 0.1 # -0.7 -0.8 # -6.0 2.5 -2.6 1.6 -1.4 -2.1 # 1.8 -1.7
Sample Size 193
Control Control Control Control Control ControlGrade 5 Baseline Gain Gain Gain Gain Gain Gain
Word Attack 92.5 3.5 0.6 4.1 1.5 1.7 -2.3 5.7 0.8 # 3.7 3.0 2.8 0.8TOWRE PDE 80.1 6.5 0.6 6.6 1.0 6.2 -0.5 8.9 2.9 7.2 -1.2 3.8 1.3
Word Identification 87.8 2.4 0.4 2.5 0.7 2.2 -0.4 2.5 -1.2 2.1 3.0 * 3.0 0.2TOWRE SWE 83.2 2.6 3.7 * # 2.9 3.8 * # 1.6 3.2 4.5 3.9 * 4.1 1.0 0.3 6.5 * # Aimsweb 73.4 14.7 3.1 14.0 4.5 16.6 -1.1 16.0 8.6 * 13.7 0.7 12.4 4.4
Passage Comprehension 90.6 -0.1 -0.3 -0.3 -0.1 0.5 -0.9 0.6 -0.8 -0.8 -0.8 -0.8 1.3GRADE 88.6 3.2 -4.1 * # 3.1 -3.7 3.3 -5.4 4.9 -6.1 * 1.0 -4.2 3.3 -0.8
Sample Size 230
* Impact is statistically significant at the 0.05 level.
# Impact is statistically different from the impact for all students in that grade at the 0.05 level.
DImpact Impact Impact Impact Impact ImpactABCD BCD A B
CImpact
C
DImpact
AImpact
BImpact
ABCDImpact
BCDImpact
Table IV.9
Impacts for 3rd and 5th Graders Eligible for Free or Reduced Price School Lunch
Corrective ReadingAll Interventions Word-level interventions Failure Free Reading Spell Read Wilson Reading
Corrective ReadingAll Interventions Word-level interventions Failure Free Reading Spell Read Wilson Reading

82
Control Control Control Control Control ControlGrade 3 Baseline Gain Gain Gain Gain Gain Gain
Word Attack 93.3 -2.7 7.8 * -3.8 10.9 * 0.7 -1.7 0.8 8.3 * -13.2 19.5 * # 0.9 5.0TOWRE PDE 86.1 0.1 5.3 * -1.2 8.0 * # 4.1 -3.1 4.8 6.2 * -12.1 17.6 * # 3.7 0.3
Word Identification 89.9 -2.4 3.6 * -3.1 4.6 * -0.2 0.5 -1.1 2.4 -7.8 7.8 -0.3 3.6TOWRE SWE 87.9 3.0 3.0 * 2.6 3.9 * 4.1 0.2 6.8 -0.5 -0.1 5.2 1.1 6.9 * # Aimsweb 44.1 19.0 7.6 * 19.0 8.4 * 19.1 5.1 23.1 1.1 13.0 9.6 20.9 14.5 *
Passage Comprehension 93.8 -5.0 6.1 * # -5.9 6.7 * # -2.1 4.2 2.7 -2.8 -20.9 19.5 * # 0.5 3.6GRADE 88.9 -8.6 9.5 * # -8.9 10.6 * # -7.5 6.4 -5.5 6.0 -17.9 19.2 * # -3.4 6.6
Sample Size 142
Control Control Control Control Control ControlGrade 5 Baseline Gain Gain Gain Gain Gain Gain
Word Attack 94.0 1.4 3.7 * 1.5 5.1 * 0.9 -0.5 1.3 8.9 * # 1.4 4.1 1.9 2.2TOWRE PDE 82.0 5.3 1.2 6.1 1.0 3.0 1.6 6.3 4.8 * 6.9 -2.1 5.0 0.5
Word Identification 89.7 3.6 0.0 3.1 0.5 4.8 -1.6 2.5 0.9 3.8 0.5 3.1 0.0TOWRE SWE 85.4 4.8 0.0 # 5.7 -0.7 # 1.9 2.0 5.3 1.1 5.0 -0.4 6.8 -2.8 # Aimsweb 82.2 22.1 0.3 21.7 0.2 23.5 0.5 21.0 -0.7 22.0 0.0 22.0 1.4
Passage Comprehension 95.1 -2.9 2.1 -3.2 2.4 -1.9 1.4 -2.4 1.3 -6.9 5.3 * -0.3 0.5GRADE 94.9 0.3 1.2 # -0.2 1.9 1.9 -0.7 -4.5 1.8 0.1 2.8 3.8 1.0
Sample Size 177
* Impact is statistically significant at the 0.05 level.
# Impact is statistically different from the impact for all students in that grade at the 0.05 level.
Corrective ReadingAll Interventions Word-level interventions Failure Free Reading Spell Read Wilson Reading
Table IV.10
Impacts for 3rd and 5th Graders not Eligible for Free or Reduced Price School Lunch
Corrective ReadingAll Interventions Word-level interventions Failure Free Reading Spell Read Wilson ReadingABCDImpact
BCDImpact
DImpact
AImpact
BImpact
B
CImpact
C DImpact Impact Impact Impact Impact ImpactABCD BCD A

103
Grade 3
Word Attack 0.33 * 0.45 * -0.04 0.43 * 0.59 * 0.35 *TOWRE PDE 0.20 * 0.29 * -0.09 0.47 * 0.39 * 0.03
Word Identification 0.15 * 0.17 * 0.09 0.13 0.16 0.22 *TOWRE SWE 0.18 * 0.18 * 0.17 0.04 0.20 0.30 *Aimsweb 0.12 * 0.15 * 0.05 0.03 0.15 0.27 *
Passage Comprehension 0.08 0.05 0.18 0.02 0.07 0.06GRADE 0.31 * 0.29 0.35 0.33 0.28 0.28
Grade 5
Word Attack 0.18 * 0.26 * -0.06 0.35 * 0.29 * 0.12TOWRE PDE 0.09 0.10 0.07 0.28 * -0.10 # 0.13
Word Identification 0.03 0.06 -0.04 0.01 0.14 0.02TOWRE SWE 0.09 * 0.08 0.11 0.14 -0.03 0.15Aimsweb 0.04 0.06 -0.01 0.08 0.00 0.10
Passage Comprehension 0.09 0.11 0.02 0.04 0.17 0.12GRADE -0.01 0.02 -0.11 -0.05 0.09 0.02
Note: Population standard deviation = 15 for all tests except AimsWeb AimsWeb SD (Fall) 3rd grade = 39.2; AimsWeb SD (fall) 5th grade = 47
* Impact is statistically significant at the 0.05 level.
# Impact is statistically different from the 3rd grade impact at the 0.05 level
Effect Size Effect Size Effect Size Effect Size
Reading Reading
Effect Size Effect SizeC D
Failure Free Spell Wilson Corrective
interventions interventions
All Word-level
ABCDEffect Size
BCDEffect Size
Table IV.11
Effect Sizes for 3rd and 5th Graders
All Word-level Failure Free Spell Wilson CorrectiveReading Read Reading Reading
AEffect Size
BEffect Size
CEffect Size
DEffect Size
interventions interventions Reading ReadABCD BCD A B

104
Grade 3
Word Attack 0.30 * 0.44 * -0.10 0.40 0.52 * 0.39TOWRE PDE 0.22 * 0.36 * -0.18 0.52 * 0.38 0.17
Word Identification 0.11 * 0.14 * 0.04 0.04 0.24 * 0.14TOWRE SWE 0.14 0.16 0.07 -0.05 0.29 0.24Aimsweb 0.04 0.05 0.01 -0.13 0.18 0.11
Passage Comprehension 0.09 0.09 0.10 0.11 0.21 -0.06GRADE 0.45 * 0.47 * 0.37 0.48 0.31 0.63
Grade 5
Word Attack 0.22 * 0.31 * -0.05 0.54 * 0.20 0.21TOWRE PDE 0.11 0.12 0.07 0.44 * -0.20 0.13
Word Identification 0.12 * # 0.11 * 0.13 # 0.01 0.14 0.18TOWRE SWE 0.08 0.10 0.05 0.18 -0.15 0.25 *Aimsweb -0.03 # -0.02 -0.06 -0.12 # -0.04 0.09
Passage Comprehension 0.07 0.11 -0.06 0.07 0.06 0.19GRADE 0.08 0.06 0.14 0.01 0.27 -0.09
Note: Population standard deviation = 15 for all tests except AimsWeb AimsWeb SD (Fall) 3rd grade = 39.2; AimsWeb SD (fall) 5th grade = 47
* Impact statistically significant at the 0.05 level.
# Impact is statistically different from the overall impact for that grade at the 0.05 level
Effect Size Effect Size Effect Size Effect Size
Reading Reading
Effect Size Effect SizeC D
Failure Free Spell Wilson Corrective
interventions interventions
All Word-level
ABCDEffect Size
BCDEffect Size
Table IV.12
Effect Sizes for 3rd and 5th Graders With Low Baseline Word Attack Scores
All Word-level Failure Free Spell Wilson CorrectiveReading Read Reading Reading
AEffect Size
BEffect Size
CEffect Size
DEffect Size
interventions interventions Reading ReadABCD BCD A B

105
Grade 3
Word Attack 0.29 0.39 -0.02 0.41 0.45 0.31TOWRE PDE 0.19 0.25 -0.01 0.40 0.38 -0.03
Word Identification 0.20 0.21 0.15 0.11 0.19 0.34TOWRE SWE 0.14 0.09 0.29 0.06 0.02 0.20Aimsweb 0.10 0.14 -0.01 0.06 0.15 0.19
Passage Comprehension -0.08 -0.18 0.21 -0.06 -0.56 0.07GRADE 0.05 0.00 0.18 0.07 -0.03 -0.04
Grade 5
Word Attack 0.11 0.17 -0.07 0.19 0.18 0.13TOWRE PDE 0.09 0.08 0.13 0.13 0.02 0.08
Word Identification -0.04 # 0.00 -0.16 # 0.02 0.07 -0.08 #TOWRE SWE 0.12 0.08 0.24 0.14 0.04 0.04Aimsweb 0.11 # 0.12 0.10 0.26 # -0.01 0.10
Passage Comprehension 0.02 0.02 0.04 0.02 0.11 -0.08GRADE -0.11 -0.02 -0.39 0.09 -0.17 0.02
Note: Population standard deviation = 15 for all tests except AimsWeb AimsWeb SD (Fall) 3rd grade = 39.2; AimsWeb SD (fall) 5th grade = 47
* Impact statistically significant at the 0.05 level.
# Impact is statistically different from the overall impact for that grade at the 0.05 level
CorrectiveReading Read
Table IV.13
Effect Sizes for 3rd and 5th Graders with High Baseline Word Attack Scores
All Word-level Failure Free Spell WilsonReading Reading
ABCD BCD A B C Dinterventions
Effect Size Effect Size
Wilson
interventions
Effect Size Effect Size Effect Size
All Word-level Failure Free Spell
Effect Size
Corrective
C Dinterventions interventions
ABCD BCD A BReading Read
Effect Size Effect Size
Reading Reading
Effect Size Effect Size Effect Size Effect Size

106
Grade 3
Word Attack 0.33 * 0.41 * 0.08 0.50 * 0.44 * 0.28TOWRE PDE 0.15 0.17 0.10 0.27 0.20 0.03
Word Identification 0.09 0.09 0.08 0.00 0.04 0.23 *TOWRE SWE 0.24 * 0.27 * 0.15 0.15 0.33 0.34Aimsweb 0.01 0.00 0.05 -0.06 0.02 0.03
Passage Comprehension 0.09 0.05 0.23 -0.04 -0.10 0.29GRADE 0.34 * 0.35 0.32 0.27 0.24 0.53
Grade 5
Word Attack 0.27 * 0.37 * -0.05 0.30 * 0.43 * 0.38 *TOWRE PDE 0.17 * 0.16 0.20 0.22 * 0.13 0.14
Word Identification 0.10 0.16 * -0.08 -0.05 0.34 * # 0.19TOWRE SWE 0.26 * # 0.26 * # 0.25 0.23 0.19 0.38 *Aimsweb 0.02 0.03 0.00 0.13 0.04 -0.08
Passage Comprehension 0.13 0.16 0.05 0.09 0.09 0.28GRADE 0.08 0.11 -0.01 0.03 -0.12 0.42
Note: Population standard deviation = 15 for all tests except AimsWeb AimsWeb SD (Fall) 3rd grade = 39.2; AimsWeb SD (fall) 5th grade = 47
* Impact statistically significant at the 0.05 level.
# Impact is statistically different from the overall impact for that grade at the 0.05 level
ABCD BCD A Binterventions interventions Reading Read
CEffect Size
DEffect Size
AEffect Size
BEffect Size
Reading Read Reading Reading
Table IV.14
Effect Sizes for 3rd and 5th Graders with Low Peabody Picture Vocabular Test Scores
All Word-level Failure Free Spell Wilson Correctiveinterventions interventions
All Word-level
ABCDEffect Size
BCDEffect Size
Failure Free Spell Wilson CorrectiveReading Reading
Effect Size Effect SizeC D
Effect Size Effect Size Effect Size Effect Size

107
Grade 3
Word Attack 0.37 * 0.50 * -0.02 0.51 * 0.78 * 0.20TOWRE PDE 0.17 0.30 * -0.21 0.61 * 0.28 0.00
Word Identification 0.17 * 0.21 * 0.05 0.17 0.30 * 0.15TOWRE SWE 0.19 * 0.16 0.29 0.06 0.16 0.25Aimsweb 0.17 * 0.22 * 0.04 0.04 0.24 0.36 *
Passage Comprehension 0.13 0.11 0.20 0.07 0.17 0.09GRADE 0.37 * 0.33 0.51 0.37 0.50 0.11
Grade 5
Word Attack 0.20 * 0.27 * -0.01 0.44 * 0.26 0.12TOWRE PDE 0.10 0.12 0.03 0.42 * -0.20 0.15
Word Identification 0.02 0.02 0.04 0.04 0.01 # 0.02TOWRE SWE 0.02 # 0.01 # 0.04 0.10 -0.11 0.04Aimsweb 0.03 0.04 -0.01 -0.01 -0.03 0.16
Passage Comprehension 0.16 * 0.19 * 0.05 0.01 0.40 * 0.16GRADE 0.02 0.05 -0.07 0.04 0.25 -0.14
Note: Population standard deviation = 15 for all tests except AimsWeb AimsWeb SD (Fall) 3rd grade = 39.2; AimsWeb SD (fall) 5th grade = 47
* Impact statistically significant at the 0.05 level.
# Impact is statistically different from the overall impact for that grade at the 0.05 level
Effect Size Effect Size Effect Size Effect Size
Reading Reading
Effect Size Effect SizeC D
Failure Free Spell Wilson Corrective
interventions interventions
All Word-level
ABCDEffect Size
BCDEffect Size
Table IV.15
Effect Sizes for 3rd and 5th Graders with High Screening Peabody Picture Vocabulary Test Scores
All Word-level Failure Free Spell Wilson CorrectiveReading Read Reading Reading
AEffect Size
BEffect Size
CEffect Size
DEffect Size
interventions interventions Reading ReadABCD BCD A B

108
Grade 3
Word Attack 0.23 0.33 -0.07 0.77 * -0.18 0.40TOWRE PDE 0.18 0.24 0.01 0.29 0.22 0.20
Word Identification 0.03 0.02 0.04 -0.11 -0.06 0.23TOWRE SWE 0.14 0.12 0.20 -0.02 0.04 0.34Aimsweb -0.02 0.00 -0.09 -0.10 -0.14 0.24
Passage Comprehension 0.09 0.00 0.37 -0.13 -0.17 0.31GRADE 0.42 * 0.38 0.56 0.27 0.05 0.82 *
Grade 5
Word Attack 0.25 0.39 * -0.17 0.55 * 0.26 0.36TOWRE PDE 0.27 * 0.28 0.25 0.41 * 0.12 0.31
Word Identification 0.06 0.04 0.13 -0.07 0.06 0.12TOWRE SWE 0.24 * 0.23 0.27 0.26 0.18 0.26Aimsweb -0.16 # -0.16 # -0.19 -0.11 -0.10 -0.27 #
Passage Comprehension 0.37 0.51 -0.05 0.29 0.49 0.75GRADE 0.21 0.28 0.00 0.28 -0.01 0.57
Note: Population standard deviation = 15 for all tests except AimsWeb AimsWeb SD (Fall) 3rd grade = 39.2; AimsWeb SD (fall) 5th grade = 47
* Impact statistically significant at the 0.05 level.
# Impact is statistically different from the overall impact for that grade at the 0.05 level
ABCD BCD A Binterventions interventions Reading Read
CEffect Size
DEffect Size
AEffect Size
BEffect Size
Reading Read Reading Reading
Table IV.16
Effect Sizes for 3rd and 5th Graders with Low Baseline Word Attack and Low Screening PPVT Test Scores
All Word-level Failure Free Spell Wilson Correctiveinterventions interventions
All Word-level
ABCDEffect Size
BCDEffect Size
Failure Free Spell Wilson CorrectiveReading Reading
Effect Size Effect SizeC D
Effect Size Effect Size Effect Size Effect Size

109
Grade 3
Word Attack 0.27 0.35 * 0.01 0.30 0.88 * -0.12TOWRE PDE 0.15 0.29 -0.27 0.57 * 0.32 -0.01
Word Identification 0.11 0.16 -0.03 0.04 0.38 * 0.06TOWRE SWE 0.16 0.17 0.11 0.00 0.42 0.09Aimsweb 0.03 0.05 -0.01 -0.19 0.27 0.08
Passage Comprehension 0.17 0.20 0.07 0.17 0.57 # -0.15GRADE 0.49 * 0.50 * 0.46 0.36 1.08 * # 0.07
Grade 5
Word Attack 0.24 * 0.31 * 0.00 0.54 * 0.23 0.16TOWRE PDE 0.04 0.08 -0.09 0.55 * -0.32 0.02
Word Identification 0.09 0.08 0.14 0.01 0.06 0.17TOWRE SWE -0.01 0.01 -0.06 0.22 -0.33 0.14Aimsweb 0.01 0.04 -0.08 -0.07 -0.01 0.20
Passage Comprehension 0.06 0.09 0.00 -0.01 0.24 0.04GRADE 0.17 0.11 0.35 -0.04 0.61 -0.24
Note: Population standard deviation = 15 for all tests except AimsWeb AimsWeb SD (Fall) 3rd grade = 39.2; AimsWeb SD (fall) 5th grade = 47
* Impact statistically significant at the 0.05 level.
# Impact is statistically different from the overall impact for that grade at the 0.05 level
Effect Size Effect Size Effect Size Effect Size
Reading Reading
Effect Size Effect SizeC D
Failure Free Spell Wilson Corrective
interventions interventions
All Word-level
ABCDEffect Size
BCDEffect Size
Table IV.17
Effect Sizes for 3rd and 5th Graders with Low Baseline Word Attack and High Screening PVVT Test Scores
All Word-level Failure Free Spell Wilson CorrectiveReading Read Reading Reading
AEffect Size
BEffect Size
CEffect Size
DEffect Size
interventions interventions Reading ReadABCD BCD A B

110
Grade 3
Word Attack 0.43 * 0.60 * -0.08 0.84 * # 0.53 * 0.41 *TOWRE PDE 0.17 0.27 -0.13 0.49 * 0.40 -0.08
Word Identification 0.19 0.22 0.09 0.09 0.23 0.33TOWRE SWE 0.03 -0.07 0.33 -0.14 -0.23 # 0.18Aimsweb 0.18 0.23 0.03 0.06 0.31 0.31
Passage Comprehension -0.23 -0.39 * # 0.23 -0.07 -1.25 * # 0.15GRADE -0.12 # -0.23 # 0.21 -0.28 # -0.27 -0.14
Grade 5
Word Attack 0.20 * 0.27 * 0.00 0.45 * 0.21 0.15TOWRE PDE 0.23 * 0.25 * 0.16 0.38 0.17 0.21
Word Identification -0.05 -0.05 -0.05 0.04 -0.05 -0.15 #TOWRE SWE 0.13 0.09 0.24 0.18 0.15 -0.06 #Aimsweb 0.09 0.08 0.11 0.15 -0.02 0.12
Passage Comprehension 0.16 0.17 0.14 0.20 0.17 0.14GRADE -0.08 0.06 -0.49 0.31 -0.09 -0.04
Note: Population standard deviation = 15 for all tests except AimsWeb AimsWeb SD (Fall) 3rd grade = 39.2; AimsWeb SD (fall) 5th grade = 47
* Impact statistically significant at the 0.05 level.
# Impact is statistically different from the overall impact for that grade at the 0.05 level
ABCD BCD A Binterventions interventions Reading Read
CEffect Size
DEffect Size
AEffect Size
BEffect Size
Reading Read Reading Reading
Table IV.18
Effect Sizes for 3rd and 5th Graders with High Baseline Word Attack and High Screening PVVT Test Scores
All Word-level Failure Free Spell Wilson Correctiveinterventions interventions
All Word-level
ABCDEffect Size
BCDEffect Size
Failure Free Spell Wilson CorrectiveReading Reading
Effect Size Effect SizeC D
Effect Size Effect Size Effect Size Effect Size

111
Grade 3
Word Attack 0.32 * 0.39 * 0.09 0.56 * 0.40 * # 0.22TOWRE PDE 0.12 0.17 # -0.05 0.41 * 0.24 # -0.13
Word Identification 0.07 0.08 0.07 -0.04 0.08 0.19TOWRE SWE 0.08 0.05 0.20 -0.05 0.17 0.02 #Aimsweb 0.05 0.08 -0.03 -0.05 0.16 0.12
Passage Comprehension -0.05 # -0.08 # 0.03 0.04 -0.17 # -0.10GRADE 0.00 # -0.05 # 0.17 0.11 -0.14 # -0.11
Grade 5
Word Attack 0.04 0.10 -0.15 0.05 # 0.20 0.05TOWRE PDE 0.04 0.07 -0.03 0.19 -0.08 0.09
Word Identification 0.03 0.04 -0.03 -0.08 0.20 * 0.01TOWRE SWE 0.24 * # 0.25 * # 0.22 0.26 * 0.07 0.44 * #Aimsweb 0.07 0.10 -0.02 0.18 * 0.01 0.09
Passage Comprehension -0.02 -0.01 -0.06 -0.05 -0.06 0.09GRADE -0.28 * # -0.25 -0.36 -0.41 * -0.28 -0.06
Note: Population standard deviation = 15 for all tests except AimsWeb AimsWeb SD (Fall) 3rd grade = 39.2; AimsWeb SD (fall) 5th grade = 47
* Impact statistically significant at the 0.05 level.
# Impact is statistically different from the overall impact for that grade at the 0.05 level
Effect Size Effect Size Effect Size Effect Size
Reading Reading
Effect Size Effect SizeC D
Failure Free Spell Wilson Corrective
interventions interventions
All Word-level
ABCDEffect Size
BCDEffect Size
Table IV.19
Effect Sizes for 3rd and 5th Graders Eligible for Free or Reduced Price School Lunch
All Word-level Failure Free Spell Wilson CorrectiveReading Read Reading Reading
AEffect Size
BEffect Size
CEffect Size
DEffect Size
interventions interventions Reading ReadABCD BCD A B

112
Grade 3
Word Attack 0.52 * 0.73 * -0.12 0.55 * 1.30 * # 0.33TOWRE PDE 0.35 * 0.54 * # -0.20 0.42 * 1.17 * # 0.02
Word Identification 0.24 * 0.31 * 0.03 0.16 0.52 0.24TOWRE SWE 0.20 * 0.26 * 0.02 -0.03 0.34 0.46 * #Aimsweb 0.19 * 0.21 * 0.13 0.03 0.25 0.37 *
Passage Comprehension 0.41 * # 0.45 * # 0.28 -0.19 1.30 * # 0.24GRADE 0.64 * # 0.70 * # 0.43 0.40 1.28 * # 0.44
Grade 5
Word Attack 0.25 * 0.34 * -0.03 0.59 * # 0.27 0.15TOWRE PDE 0.08 0.07 0.10 0.32 * -0.14 0.03
Word Identification 0.00 0.03 -0.11 0.06 0.03 0.00TOWRE SWE 0.00 # -0.04 # 0.13 0.07 -0.02 -0.18 #Aimsweb 0.01 0.01 0.01 -0.02 0.00 0.03
Passage Comprehension 0.14 0.16 0.09 0.09 0.36 * 0.04GRADE 0.08 # 0.12 -0.05 0.12 0.19 0.07
Note: Population standard deviation = 15 for all tests except AimsWeb AimsWeb SD (Fall) 3rd grade = 39.2; AimsWeb SD (fall) 5th grade = 47
* Impact statistically significant at the 0.05 level.
# Impact is statistically different from the overall impact for that grade at the 0.05 level
ABCD BCD A Binterventions interventions Reading Read
CEffect Size
DEffect Size
AEffect Size
BEffect Size
Reading Read Reading Reading
Table IV.20
Effect Sizes for 3rd and 5th Graders not Eligible for Free or Reduced Price School Lunch
All Word-level Failure Free Spell Wilson Correctiveinterventions interventions
All Word-level
ABCDEffect Size
BCDEffect Size
Failure Free Spell Wilson CorrectiveReading Reading
Effect Size Effect SizeC D
Effect Size Effect Size Effect Size Effect Size

104
ITT TOT TOT ITT TOT TOT ITT TOT TOT ITT TOT TOT ITT TOT TOT ITT TOT TOTGrade 3 Impact Any Over 80 Impact Any Over 80 Impact Any Over 80 Impact Any Over 80 Impact Any Over 80 Impact Any Over 80Word Attack 5.0 5.0 5.4 6.8 6.9 7.4 -0.5 -0.5 -0.6 6.5 6.5 7.0 8.8 8.9 9.5 5.2 5.2 5.6TOWRE PDE 3.0 3.0 3.2 4.4 4.5 4.8 -1.3 -1.3 -1.4 7.1 7.2 7.7 5.8 5.8 6.2 0.4 0.4 0.4
Word Identification 2.3 2.3 2.5 2.6 2.6 2.8 1.3 1.4 1.5 2.0 2.0 2.2 2.5 2.5 2.7 3.3 3.3 3.6TOWRE SWE 2.7 2.8 2.9 2.8 2.8 3.0 2.6 2.6 2.8 0.7 0.7 0.7 3.1 3.1 3.3 4.6 4.6 4.9Aimsweb 4.9 4.9 5.3 5.9 5.9 6.4 1.9 1.9 2.0 1.0 1.0 1.1 6.0 6.0 6.4 10.7 10.8 11.6
Passage Comprehension 1.2 1.2 1.3 0.7 0.7 0.8 2.7 2.8 2.9 0.2 0.3 0.3 1.0 1.0 1.1 0.9 0.9 0.9GRADE 4.6 4.7 5.0 4.4 4.5 4.8 5.3 5.3 5.7 4.9 4.9 5.3 4.2 4.2 4.5 4.2 4.2 4.5
ITT TOT TOT ITT TOT TOT ITT TOT TOT ITT TOT TOT ITT TOT TOT ITT TOT TOTGrade 5 Impact Any Over 80 Impact Any Over 80 Impact Any Over 80 Impact Any Over 80 Impact Any Over 80 Impact Any Over 80Word Attack 2.7 2.7 2.9 3.9 3.9 4.2 -0.9 -0.9 -1.0 5.3 5.3 5.7 4.4 4.4 4.8 1.9 1.9 2.0TOWRE PDE 1.4 1.4 1.5 1.5 1.5 1.7 1.1 1.1 1.2 4.1 4.2 4.5 -1.4 -1.4 -1.5 1.9 1.9 2.1
Word Identification 0.5 0.5 0.5 0.9 0.9 0.9 -0.6 -0.6 -0.7 0.1 0.1 0.1 2.1 2.1 2.3 0.3 0.3 0.4TOWRE SWE 1.4 1.4 1.5 1.3 1.3 1.4 1.7 1.7 1.8 2.1 2.1 2.2 -0.5 -0.5 -0.5 2.2 2.2 2.4Aimsweb 2.0 2.0 2.2 2.8 2.8 3.0 -0.3 -0.3 -0.4 3.6 3.6 3.9 -0.1 -0.1 -0.1 4.9 4.9 5.3
Passage Comprehension 1.3 1.3 1.4 1.6 1.6 1.7 0.3 0.3 0.3 0.6 0.6 0.7 2.5 2.5 2.7 1.8 1.8 1.9GRADE -0.2 -0.2 -0.2 0.3 0.3 0.3 -1.6 -1.6 -1.7 -0.7 -0.7 -0.8 1.3 1.3 1.4 0.3 0.3 0.3
Note: Instruction amounts are Any (99.2%), Over 80 hours (92.5%)
CorrectiveRead
C D
Table IV.21
Effect of the Treatment on the Treated Impacts for 3rd and 5th Graders
ABCD BCD A B
Wilson
interventions
Reading Readinginterventions interventions Reading
C
All Word-level Failure Free Spell
DRead Reading
ABCD BCD A Binterventions Reading
Failure FreeReading
All CorrectiveSpell WilsonWord-level

103
ITT TOT TOT ITT TOT TOT ITT TOT TOT ITT TOT TOT ITT TOT TOT ITT TOT TOTGrade 3 Impact Any Over 80 Impact Any Over 80 Impact Any Over 80 Impact Any Over 80 Impact Any Over 80 Impact Any Over 80Word Attack 4.5 4.6 4.9 6.5 6.6 7.1 -1.5 -1.5 -1.6 6.0 6.0 6.5 7.8 7.8 8.4 5.9 5.9 6.4TOWRE PDE 3.3 3.4 3.6 5.4 5.4 5.8 -2.7 -2.7 -2.9 7.8 7.9 8.5 5.7 5.8 6.2 2.5 2.5 2.7
Word Identification 1.7 1.7 1.8 2.1 2.1 2.3 0.6 0.6 0.6 0.6 0.6 0.6 3.6 3.6 3.9 2.1 2.1 2.2TOWRE SWE 2.1 2.1 2.2 2.4 2.4 2.6 1.1 1.1 1.2 -0.8 -0.8 -0.8 4.3 4.3 4.7 3.6 3.7 3.9Aimsweb 1.6 1.7 1.8 2.0 2.1 2.2 0.4 0.4 0.5 -5.3 -5.3 -5.7 7.2 7.3 7.8 4.2 4.2 4.5
Passage Comprehension 1.3 1.4 1.5 1.3 1.3 1.4 1.5 1.5 1.6 1.7 1.7 1.8 3.1 3.2 3.4 -1.0 -1.0 -1.0GRADE 6.7 6.8 7.2 7.1 7.1 7.7 5.5 5.6 6.0 7.3 7.3 7.9 4.6 4.6 5.0 9.4 9.5 10.2
ITT TOT TOT ITT TOT TOT ITT TOT TOT ITT TOT TOT ITT TOT TOT ITT TOT TOTGrade 5 Impact Any Over 80 Impact Any Over 80 Impact Any Over 80 Impact Any Over 80 Impact Any Over 80 Impact Any Over 80Word Attack 3.3 3.4 3.6 4.7 4.7 5.1 -0.8 -0.8 -0.8 8.0 8.1 8.7 2.9 3.0 3.2 3.2 3.2 3.4TOWRE PDE 1.6 1.6 1.7 1.8 1.8 2.0 1.0 1.0 1.1 6.6 6.7 7.1 -3.0 -3.1 -3.3 1.9 1.9 2.1
Word Identification 1.7 1.7 1.9 1.6 1.6 1.8 2.0 2.0 2.2 0.1 0.1 0.1 2.1 2.1 2.3 2.7 2.7 2.9TOWRE SWE 1.3 1.3 1.4 1.4 1.5 1.6 0.7 0.7 0.8 2.7 2.8 3.0 -2.2 -2.2 -2.4 3.8 3.8 4.1Aimsweb -1.4 -1.4 -1.5 -1.0 -1.0 -1.1 -2.7 -2.7 -2.9 -5.8 -5.8 -6.3 -1.7 -1.7 -1.8 4.5 4.5 4.8
Passage Comprehension 1.0 1.0 1.1 1.6 1.6 1.7 -0.8 -0.8 -0.9 1.0 1.0 1.1 0.9 0.9 1.0 2.8 2.8 3.0GRADE 1.2 1.2 1.3 0.9 0.9 1.0 2.1 2.1 2.2 0.1 0.1 0.1 4.1 4.1 4.4 -1.4 -1.4 -1.5
Note: Instruction amounts are Any (99.2%), Over 80 hours (92.5%)
CorrectiveRead
C D
Table IV.22
Effect of the Treatment on the Treated Impacts for 3rd and 5th Graders with Low Baseline Word Attack Scores
ABCD BCD A B
Wilson
interventions
Reading Readinginterventions interventions Reading
C
All Word-level Failure Free Spell
DRead Reading
ABCD BCD A Binterventions Reading
Failure FreeReading
All CorrectiveSpell WilsonWord-level

103
ITT TOT TOT ITT TOT TOT ITT TOT TOT ITT TOT TOT ITT TOT TOT ITT TOT TOTGrade 3 Impact Any Over 80 Impact Any Over 80 Impact Any Over 80 Impact Any Over 80 Impact Any Over 80 Impact Any Over 80Word Attack 4.3 4.4 4.7 5.9 5.9 6.3 -0.3 -0.3 -0.3 6.2 6.2 6.7 6.8 6.8 7.3 4.6 4.7 5.0TOWRE PDE 2.8 2.8 3.0 3.8 3.8 4.1 -0.2 -0.2 -0.2 5.9 6.0 6.4 5.7 5.8 6.2 -0.4 -0.4 -0.4
Word Identification 3.0 3.0 3.2 3.2 3.2 3.4 2.3 2.3 2.5 1.6 1.6 1.8 2.9 2.9 3.1 5.0 5.1 5.4TOWRE SWE 2.1 2.2 2.3 1.4 1.4 1.5 4.4 4.4 4.7 0.9 0.9 1.0 0.3 0.3 0.4 3.0 3.0 3.2Aimsweb 3.9 3.9 4.2 5.3 5.3 5.7 -0.3 -0.3 -0.3 2.4 2.4 2.6 6.1 6.1 6.5 7.5 7.6 8.1
Passage Comprehension -1.2 -1.3 -1.3 -2.7 -2.7 -2.9 3.2 3.2 3.5 -1.0 -1.0 -1.0 -8.3 -8.4 -9.0 1.1 1.1 1.2GRADE 0.7 0.7 0.7 0.0 0.0 0.0 2.6 2.7 2.8 1.1 1.1 1.2 -0.4 -0.4 -0.5 -0.5 -0.6 -0.6
ITT TOT TOT ITT TOT TOT ITT TOT TOT ITT TOT TOT ITT TOT TOT ITT TOT TOTGrade 5 Impact Any Over 80 Impact Any Over 80 Impact Any Over 80 Impact Any Over 80 Impact Any Over 80 Impact Any Over 80Word Attack 1.6 1.6 1.7 2.5 2.5 2.7 -1.0 -1.0 -1.1 2.8 2.9 3.1 2.7 2.8 3.0 1.9 1.9 2.1TOWRE PDE 1.3 1.4 1.5 1.1 1.2 1.2 2.0 2.0 2.1 1.9 1.9 2.1 0.3 0.3 0.3 1.2 1.2 1.3
Word Identification -0.6 -0.6 -0.6 0.0 0.0 0.0 -2.4 -2.4 -2.6 0.2 0.2 0.3 1.1 1.1 1.1 -1.3 -1.3 -1.4TOWRE SWE 1.7 1.7 1.9 1.1 1.1 1.2 3.5 3.6 3.8 2.1 2.2 2.3 0.7 0.7 0.7 0.6 0.6 0.6Aimsweb 5.3 5.3 5.7 5.5 5.6 6.0 4.7 4.7 5.0 12.3 12.4 13.3 -0.6 -0.6 -0.7 4.9 4.9 5.3
Passage Comprehension 0.3 0.3 0.4 0.3 0.3 0.3 0.6 0.6 0.6 0.3 0.3 0.3 1.6 1.7 1.8 -1.2 -1.2 -1.3GRADE -1.7 -1.7 -1.8 -0.3 -0.3 -0.3 -5.8 -5.8 -6.3 1.3 1.3 1.4 -2.6 -2.6 -2.8 0.4 0.4 0.4
Note: Instruction amounts are Any (99.2%), Over 80 hours (92.5%)
Table IV.23
Effect of the Treatment on the Treated Impacts for 3rd and 5th Graders with High Baseline Word Attack Scores
All Word-level Failure Free Spell Wilson Correctiveinterventions interventions Reading Read
Wilson Corrective
ABCD BCD A BReading Reading
C D
Reading ReadingAll Word-level
interventions interventions Reading ReadFailure Free Spell
C DABCD BCD A B

103
ITT TOT TOT ITT TOT TOT ITT TOT TOT ITT TOT TOT ITT TOT TOT ITT TOT TOTGrade 3 Impact Any Over 80 Impact Any Over 80 Impact Any Over 80 Impact Any Over 80 Impact Any Over 80 Impact Any Over 80Word Attack 4.9 4.9 5.3 6.1 6.2 6.6 1.2 1.3 1.3 7.5 7.5 8.1 6.6 6.7 7.2 4.2 4.3 4.6TOWRE PDE 2.3 2.3 2.4 2.5 2.5 2.7 1.5 1.5 1.6 4.1 4.1 4.4 3.0 3.0 3.2 0.5 0.5 0.5
Word Identification 1.3 1.3 1.4 1.3 1.4 1.5 1.1 1.2 1.2 0.0 0.0 0.0 0.6 0.6 0.6 3.5 3.5 3.7TOWRE SWE 3.6 3.6 3.9 4.1 4.1 4.4 2.2 2.2 2.4 2.2 2.2 2.4 4.9 4.9 5.3 5.1 5.1 5.5Aimsweb 0.5 0.5 0.5 0.0 0.0 0.0 2.1 2.1 2.3 -2.4 -2.4 -2.5 0.9 0.9 1.0 1.3 1.3 1.4
Passage Comprehension 1.4 1.4 1.5 0.7 0.7 0.8 3.4 3.5 3.7 -0.6 -0.6 -0.7 -1.6 -1.6 -1.7 4.4 4.4 4.7GRADE 5.2 5.2 5.6 5.2 5.3 5.7 4.9 4.9 5.3 4.1 4.1 4.4 3.6 3.7 3.9 8.0 8.1 8.7
ITT TOT TOT ITT TOT TOT ITT TOT TOT ITT TOT TOT ITT TOT TOT ITT TOT TOTGrade 5 Impact Any Over 80 Impact Any Over 80 Impact Any Over 80 Impact Any Over 80 Impact Any Over 80 Impact Any Over 80Word Attack 4.0 4.0 4.3 5.6 5.6 6.0 -0.7 -0.7 -0.7 4.5 4.6 4.9 6.5 6.6 7.0 5.7 5.7 6.2TOWRE PDE 2.6 2.6 2.8 2.5 2.5 2.7 3.0 3.0 3.2 3.3 3.3 3.6 2.0 2.0 2.1 2.1 2.1 2.3
Word Identification 1.5 1.5 1.6 2.4 2.4 2.6 -1.2 -1.3 -1.3 -0.8 -0.8 -0.8 5.1 5.2 5.6 2.9 2.9 3.1TOWRE SWE 3.9 3.9 4.2 4.0 4.0 4.3 3.7 3.8 4.0 3.4 3.4 3.7 2.8 2.8 3.1 5.7 5.7 6.1Aimsweb 1.0 1.0 1.1 1.3 1.4 1.5 -0.1 -0.1 -0.1 6.0 6.1 6.5 1.8 1.9 2.0 -3.8 -3.8 -4.1
Passage Comprehension 1.9 2.0 2.1 2.3 2.3 2.5 0.8 0.8 0.9 1.4 1.4 1.5 1.4 1.4 1.5 4.3 4.3 4.6GRADE 1.2 1.2 1.3 1.7 1.7 1.8 -0.1 -0.1 -0.1 0.4 0.4 0.5 -1.8 -1.8 -1.9 6.3 6.4 6.8
Note: Instruction amounts are Any (99.2%), Over 80 hours (92.5%)
Failure FreeReading
All CorrectiveSpell WilsonWord-level
DRead Reading
ABCD BCD A Binterventions Reading
interventions interventions Reading
C
All Word-level Failure Free Spell
Table IV.24
Effect of the Treatment on the Treated Impacts for 3rd and 5th Graders with Low Screening Peabody Picture Vocabulary Test Scores
ABCD BCD A B
Wilson
interventions
Reading ReadingCorrective
ReadC D

103
ITT TOT TOT ITT TOT TOT ITT TOT TOT ITT TOT TOT ITT TOT TOT ITT TOT TOTGrade 3 Impact Any Over 80 Impact Any Over 80 Impact Any Over 80 Impact Any Over 80 Impact Any Over 80 Impact Any Over 80Word Attack 5.5 5.6 6.0 7.4 7.5 8.0 -0.2 -0.2 -0.2 7.6 7.7 8.2 11.6 11.7 12.6 3.1 3.1 3.3TOWRE PDE 2.6 2.6 2.8 4.5 4.5 4.8 -3.1 -3.1 -3.3 9.2 9.2 9.9 4.2 4.2 4.5 0.1 0.1 0.1
Word Identification 2.5 2.5 2.7 3.1 3.1 3.4 0.7 0.7 0.8 2.6 2.6 2.8 4.5 4.5 4.9 2.3 2.3 2.4TOWRE SWE 2.8 2.9 3.1 2.3 2.3 2.5 4.3 4.4 4.7 0.9 0.9 0.9 2.4 2.4 2.6 3.7 3.8 4.0Aimsweb 6.7 6.8 7.3 8.5 8.5 9.1 1.5 1.5 1.6 1.7 1.7 1.8 9.4 9.5 10.2 14.2 14.3 15.4
Passage Comprehension 2.0 2.0 2.2 1.7 1.7 1.8 3.0 3.1 3.3 1.1 1.1 1.2 2.6 2.6 2.8 1.3 1.3 1.4GRADE 5.6 5.6 6.0 4.9 4.9 5.3 7.6 7.7 8.2 5.5 5.6 6.0 7.4 7.5 8.0 1.7 1.7 1.8
ITT TOT TOT ITT TOT TOT ITT TOT TOT ITT TOT TOT ITT TOT TOT ITT TOT TOTGrade 5 Impact Any Over 80 Impact Any Over 80 Impact Any Over 80 Impact Any Over 80 Impact Any Over 80 Impact Any Over 80Word Attack 3.0 3.0 3.3 4.1 4.1 4.4 -0.2 -0.2 -0.2 6.6 6.6 7.1 3.9 4.0 4.2 1.8 1.8 2.0TOWRE PDE 1.5 1.5 1.6 1.9 1.9 2.0 0.4 0.4 0.4 6.3 6.4 6.8 -3.0 -3.0 -3.2 2.3 2.3 2.5
Word Identification 0.3 0.4 0.4 0.3 0.3 0.3 0.5 0.5 0.6 0.5 0.5 0.6 0.1 0.1 0.1 0.2 0.2 0.2TOWRE SWE 0.3 0.3 0.3 0.2 0.2 0.2 0.6 0.6 0.7 1.5 1.5 1.6 -1.6 -1.6 -1.8 0.6 0.6 0.7Aimsweb 1.2 1.2 1.3 1.8 1.8 2.0 -0.6 -0.6 -0.6 -0.4 -0.4 -0.5 -1.6 -1.6 -1.7 7.5 7.6 8.1
Passage Comprehension 2.4 2.4 2.5 2.9 2.9 3.1 0.8 0.8 0.8 0.2 0.2 0.2 6.0 6.1 6.5 2.4 2.4 2.6GRADE 0.3 0.3 0.3 0.8 0.8 0.8 -1.1 -1.1 -1.2 0.6 0.6 0.7 3.7 3.8 4.0 -2.1 -2.1 -2.3
Note: Instruction amounts are Any (99.2%), Over 80 hours (92.5%)
CorrectiveRead
C D
Table IV.25
Effect of the Treatment on the Treated Impacts for 3rd and 5th Graders with High Screening Peabody Picture Vocabulary Test Scores
ABCD BCD A B
Wilson
interventions
Reading Readinginterventions interventions Reading
C
All Word-level Failure Free Spell
DRead Reading
ABCD BCD A Binterventions Reading
Failure FreeReading
All CorrectiveSpell WilsonWord-level
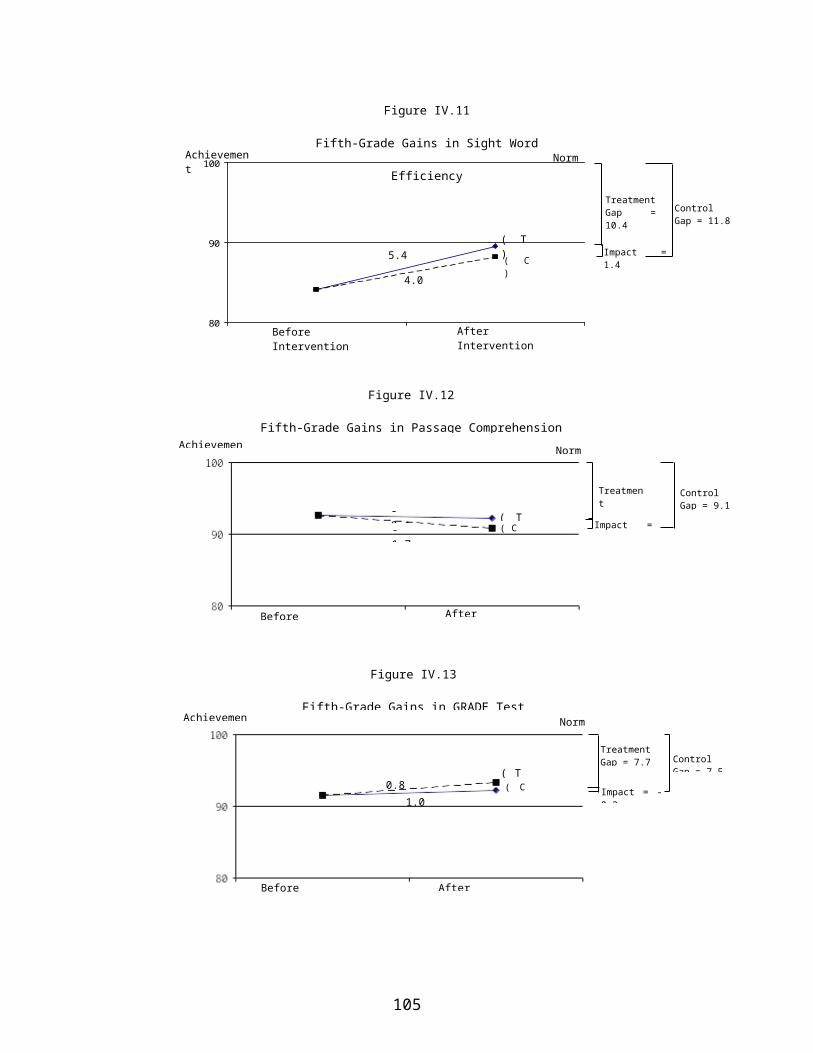
103
ITT TOT TOT ITT TOT TOT ITT TOT TOT ITT TOT TOT ITT TOT TOT ITT TOT TOTGrade 3 Impact Any Over 80 Impact Any Over 80 Impact Any Over 80 Impact Any Over 80 Impact Any Over 80 Impact Any Over 80Word Attack 3.5 3.5 3.7 5.0 5.0 5.4 -1.1 -1.1 -1.2 11.5 11.6 12.5 -2.6 -2.6 -2.8 6.0 6.1 6.5TOWRE PDE 2.7 2.7 2.9 3.6 3.6 3.8 0.2 0.2 0.2 4.4 4.4 4.7 3.3 3.4 3.6 3.0 3.0 3.2
Word Identification 0.4 0.4 0.4 0.3 0.3 0.3 0.7 0.7 0.7 -1.6 -1.6 -1.7 -0.9 -0.9 -1.0 3.4 3.5 3.7TOWRE SWE 2.1 2.1 2.3 1.8 1.8 2.0 3.0 3.0 3.2 -0.3 -0.3 -0.3 0.7 0.7 0.7 5.1 5.1 5.5Aimsweb -0.9 -0.9 -1.0 -0.1 -0.1 -0.1 -3.5 -3.5 -3.7 -4.0 -4.0 -4.3 -5.6 -5.6 -6.0 9.3 9.4 10.1
Passage Comprehension 1.4 1.4 1.5 0.1 0.1 0.1 5.5 5.5 5.9 -1.9 -1.9 -2.1 -2.5 -2.5 -2.7 4.6 4.6 5.0GRADE 6.4 6.4 6.9 5.7 5.7 6.1 8.4 8.5 9.1 4.0 4.1 4.4 0.8 0.8 0.8 12.2 12.3 13.2
ITT TOT TOT ITT TOT TOT ITT TOT TOT ITT TOT TOT ITT TOT TOT ITT TOT TOTGrade 5 Impact Any Over 80 Impact Any Over 80 Impact Any Over 80 Impact Any Over 80 Impact Any Over 80 Impact Any Over 80Word Attack 3.8 3.8 4.1 5.9 5.9 6.4 -2.6 -2.6 -2.8 8.3 8.4 9.0 3.9 3.9 4.2 5.5 5.5 5.9TOWRE PDE 4.1 4.1 4.4 4.2 4.2 4.5 3.8 3.8 4.1 6.1 6.2 6.6 1.8 1.9 2.0 4.6 4.7 5.0
Word Identification 0.9 0.9 1.0 0.5 0.5 0.6 2.0 2.0 2.2 -1.0 -1.0 -1.1 0.9 0.9 1.0 1.7 1.7 1.9TOWRE SWE 3.6 3.6 3.9 3.5 3.5 3.8 4.0 4.0 4.3 4.0 4.0 4.3 2.7 2.7 2.9 3.8 3.9 4.2Aimsweb -7.7 -7.8 -8.4 -7.4 -7.4 -7.9 -8.9 -9.0 -9.6 -4.9 -5.0 -5.3 -4.6 -4.6 -4.9 -12.5 -12.6 -13.5
Passage Comprehension 5.6 5.6 6.0 7.7 7.8 8.3 -0.8 -0.8 -0.9 4.4 4.4 4.8 7.4 7.5 8.0 11.3 11.4 12.2GRADE 3.1 3.1 3.4 4.2 4.2 4.5 -0.1 -0.1 -0.1 4.1 4.2 4.5 -0.2 -0.2 -0.2 8.5 8.6 9.2
Note: Instruction amounts are Any (99.2%), Over 80 hours (92.5%)
Failure FreeReading
All CorrectiveSpell WilsonWord-level
DRead Reading
ABCD BCD A Binterventions Reading
interventions interventions Reading
C
All Word-level Failure Free Spell
Table IV.26
Effect of the Treatment on the Treated Impacts for 3rd and 5th Graders with Low Baseline Word Attack Scores and Low Screening Peabody Picture Vocabulary Test Scores
ABCD BCD A B
Wilson
interventions
Reading ReadingCorrective
ReadC D

103
ITT TOT TOT ITT TOT TOT ITT TOT TOT ITT TOT TOT ITT TOT TOT ITT TOT TOTGrade 3 Impact Any Over 80 Impact Any Over 80 Impact Any Over 80 Impact Any Over 80 Impact Any Over 80 Impact Any Over 80Word Attack 3.5 3.5 3.7 5.0 5.0 5.4 -1.1 -1.1 -1.2 11.5 11.6 12.5 -2.6 -2.6 -2.8 6.0 6.1 6.5TOWRE PDE 2.7 2.7 2.9 3.6 3.6 3.8 0.2 0.2 0.2 4.4 4.4 4.7 3.3 3.4 3.6 3.0 3.0 3.2
Word Identification 0.4 0.4 0.4 0.3 0.3 0.3 0.7 0.7 0.7 -1.6 -1.6 -1.7 -0.9 -0.9 -1.0 3.4 3.5 3.7TOWRE SWE 2.1 2.1 2.3 1.8 1.8 2.0 3.0 3.0 3.2 -0.3 -0.3 -0.3 0.7 0.7 0.7 5.1 5.1 5.5Aimsweb -0.9 -0.9 -1.0 -0.1 -0.1 -0.1 -3.5 -3.5 -3.7 -4.0 -4.0 -4.3 -5.6 -5.6 -6.0 9.3 9.4 10.1
Passage Comprehension 1.4 1.4 1.5 0.1 0.1 0.1 5.5 5.5 5.9 -1.9 -1.9 -2.1 -2.5 -2.5 -2.7 4.6 4.6 5.0GRADE 6.4 6.4 6.9 5.7 5.7 6.1 8.4 8.5 9.1 4.0 4.1 4.4 0.8 0.8 0.8 12.2 12.3 13.2
ITT TOT TOT ITT TOT TOT ITT TOT TOT ITT TOT TOT ITT TOT TOT ITT TOT TOTGrade 5 Impact Any Over 80 Impact Any Over 80 Impact Any Over 80 Impact Any Over 80 Impact Any Over 80 Impact Any Over 80Word Attack 3.8 3.8 4.1 5.9 5.9 6.4 -2.6 -2.6 -2.8 8.3 8.4 9.0 3.9 3.9 4.2 5.5 5.5 5.9TOWRE PDE 4.1 4.1 4.4 4.2 4.2 4.5 3.8 3.8 4.1 6.1 6.2 6.6 1.8 1.9 2.0 4.6 4.7 5.0
Word Identification 0.9 0.9 1.0 0.5 0.5 0.6 2.0 2.0 2.2 -1.0 -1.0 -1.1 0.9 0.9 1.0 1.7 1.7 1.9TOWRE SWE 3.6 3.6 3.9 3.5 3.5 3.8 4.0 4.0 4.3 4.0 4.0 4.3 2.7 2.7 2.9 3.8 3.9 4.2Aimsweb -7.7 -7.8 -8.4 -7.4 -7.4 -7.9 -8.9 -9.0 -9.6 -4.9 -5.0 -5.3 -4.6 -4.6 -4.9 -12.5 -12.6 -13.5
Passage Comprehension 5.6 5.6 6.0 7.7 7.8 8.3 -0.8 -0.8 -0.9 4.4 4.4 4.8 7.4 7.5 8.0 11.3 11.4 12.2GRADE 3.1 3.1 3.4 4.2 4.2 4.5 -0.1 -0.1 -0.1 4.1 4.2 4.5 -0.2 -0.2 -0.2 8.5 8.6 9.2
Note: Instruction amounts are Any (99.2%), Over 80 hours (92.5%)
CorrectiveRead
C D
Table IV.27
Effect of the Treatment on the Treated Impacts for 3rd and 5th Graders with Low Baseline Word Attack and High Screening Peabody Picture Vocabulary Test Scores
ABCD BCD A B
Wilson
interventions
Reading Readinginterventions interventions Reading
C
All Word-level Failure Free Spell
DRead Reading
ABCD BCD A Binterventions Reading
Failure FreeReading
All CorrectiveSpell WilsonWord-level

103
ITT TOT TOT ITT TOT TOT ITT TOT TOT ITT TOT TOT ITT TOT TOT ITT TOT TOTGrade 3 Impact Any Over 80 Impact Any Over 80 Impact Any Over 80 Impact Any Over 80 Impact Any Over 80 Impact Any Over 80Word Attack 6.4 6.5 6.9 8.9 9.0 9.7 -1.2 -1.2 -1.3 12.6 12.7 13.7 8.0 8.1 8.7 6.2 6.3 6.7TOWRE PDE 2.5 2.6 2.7 4.0 4.1 4.4 -2.0 -2.0 -2.1 7.3 7.4 7.9 6.0 6.1 6.5 -1.3 -1.3 -1.4
Word Identification 2.8 2.8 3.0 3.3 3.3 3.5 1.4 1.4 1.5 1.3 1.3 1.4 3.4 3.5 3.7 5.0 5.1 5.4TOWRE SWE 0.5 0.5 0.5 -1.0 -1.0 -1.1 4.9 4.9 5.3 -2.1 -2.1 -2.3 -3.5 -3.6 -3.8 2.7 2.7 2.9Aimsweb 6.9 7.0 7.5 8.9 9.0 9.6 1.0 1.0 1.1 2.4 2.5 2.6 12.0 12.1 13.0 12.2 12.3 13.2
Passage Comprehension -3.5 -3.5 -3.8 -5.8 -5.9 -6.3 3.4 3.5 3.7 -1.0 -1.0 -1.1 -18.7 -18.9 -20.3 2.2 2.2 2.4GRADE -1.8 -1.8 -2.0 -3.5 -3.5 -3.7 3.1 3.1 3.4 -4.2 -4.3 -4.6 -4.1 -4.1 -4.4 -2.0 -2.1 -2.2
ITT TOT TOT ITT TOT TOT ITT TOT TOT ITT TOT TOT ITT TOT TOT ITT TOT TOTGrade 5 Impact Any Over 80 Impact Any Over 80 Impact Any Over 80 Impact Any Over 80 Impact Any Over 80 Impact Any Over 80Word Attack 3.1 3.1 3.3 4.1 4.1 4.4 0.1 0.1 0.1 6.8 6.9 7.4 3.2 3.2 3.4 2.2 2.2 2.4TOWRE PDE 3.5 3.5 3.7 3.8 3.9 4.1 2.4 2.4 2.6 5.8 5.8 6.2 2.6 2.6 2.8 3.1 3.1 3.4
Word Identification -0.8 -0.8 -0.8 -0.8 -0.8 -0.8 -0.7 -0.8 -0.8 0.7 0.7 0.7 -0.7 -0.7 -0.8 -2.2 -2.2 -2.4TOWRE SWE 1.9 1.9 2.1 1.4 1.4 1.5 3.6 3.6 3.9 2.7 2.8 3.0 2.3 2.3 2.5 -1.0 -1.0 -1.0Aimsweb 4.1 4.2 4.5 3.8 3.9 4.2 5.0 5.0 5.4 7.1 7.2 7.7 -1.0 -1.0 -1.1 5.4 5.5 5.9
Passage Comprehension 2.4 2.5 2.6 2.6 2.6 2.8 2.1 2.1 2.2 3.0 3.1 3.3 2.6 2.6 2.8 2.0 2.1 2.2GRADE -1.1 -1.2 -1.2 0.9 0.9 1.0 -7.3 -7.3 -7.9 4.7 4.7 5.1 -1.4 -1.4 -1.5 -0.6 -0.6 -0.6
Note: Instruction amounts are Any (99.2%), Over 80 hours (92.5%)
Failure FreeReading
All CorrectiveSpell WilsonWord-level
DRead Reading
ABCD BCD A Binterventions Reading
interventions interventions Reading
C
All Word-level Failure Free Spell
Table IV.28
Effect of the Treatment on the Treated Impacts for 3rd and 5th Graders with High Baseline Word Attack and High Screening Peabody Picture Vocabulary Test Scores
ABCD BCD A B
Wilson
interventions
Reading ReadingCorrective
ReadC D

103
ITT TOT TOT ITT TOT TOT ITT TOT TOT ITT TOT TOT ITT TOT TOT ITT TOT TOTGrade 3 Impact Any Over 80 Impact Any Over 80 Impact Any Over 80 Impact Any Over 80 Impact Any Over 80 Impact Any Over 80Word Attack 4.7 4.8 5.1 5.9 5.9 6.4 1.3 1.3 1.4 8.4 8.5 9.1 6.0 6.1 6.5 3.3 3.3 3.5TOWRE PDE 1.8 1.8 1.9 2.6 2.6 2.8 -0.7 -0.8 -0.8 6.2 6.3 6.7 3.6 3.6 3.8 -2.0 -2.0 -2.2
Word Identification 1.1 1.1 1.2 1.1 1.1 1.2 1.0 1.0 1.1 -0.6 -0.6 -0.7 1.2 1.2 1.3 2.8 2.9 3.1TOWRE SWE 1.3 1.3 1.4 0.7 0.7 0.8 3.0 3.0 3.2 -0.8 -0.8 -0.9 2.5 2.6 2.7 0.4 0.4 0.4Aimsweb 2.0 2.0 2.2 3.1 3.1 3.3 -1.1 -1.1 -1.1 -1.9 -1.9 -2.0 6.4 6.4 6.9 4.7 4.7 5.1
Passage Comprehension -0.8 -0.8 -0.9 -1.2 -1.2 -1.3 0.4 0.4 0.4 0.5 0.5 0.6 -2.6 -2.6 -2.8 -1.5 -1.6 -1.7GRADE 0.1 0.1 0.1 -0.8 -0.8 -0.8 2.5 2.6 2.7 1.6 1.6 1.7 -2.1 -2.2 -2.3 -1.7 -1.7 -1.9
ITT TOT TOT ITT TOT TOT ITT TOT TOT ITT TOT TOT ITT TOT TOT ITT TOT TOTGrade 5 Impact Any Over 80 Impact Any Over 80 Impact Any Over 80 Impact Any Over 80 Impact Any Over 80 Impact Any Over 80Word Attack 0.6 0.6 0.6 1.5 1.6 1.7 -2.3 -2.3 -2.5 0.8 0.8 0.9 3.0 3.1 3.3 0.8 0.8 0.9TOWRE PDE 0.6 0.6 0.7 1.0 1.0 1.1 -0.5 -0.5 -0.6 2.9 2.9 3.2 -1.2 -1.2 -1.3 1.3 1.3 1.4
Word Identification 0.4 0.4 0.4 0.7 0.7 0.7 -0.4 -0.4 -0.4 -1.2 -1.2 -1.3 3.0 3.0 3.2 0.2 0.2 0.2TOWRE SWE 3.7 3.7 4.0 3.8 3.8 4.1 3.2 3.3 3.5 3.9 3.9 4.2 1.0 1.0 1.1 6.5 6.6 7.1Aimsweb 3.1 3.2 3.4 4.5 4.6 4.9 -1.1 -1.1 -1.2 8.6 8.7 9.3 0.7 0.7 0.7 4.4 4.4 4.7
Passage Comprehension -0.3 -0.3 -0.3 -0.1 -0.1 -0.1 -0.9 -0.9 -0.9 -0.8 -0.8 -0.9 -0.8 -0.8 -0.9 1.3 1.3 1.4GRADE -4.1 -4.2 -4.5 -3.7 -3.7 -4.0 -5.4 -5.5 -5.9 -6.1 -6.2 -6.6 -4.2 -4.2 -4.5 -0.8 -0.8 -0.9
Note: Instruction amounts are Any (99.2%), Over 80 hours (92.5%)
CorrectiveRead
C D
Table IV.29
Effect of the Treatment on the Treated Impacts for 3rd and 5th Graders Eligible for Free or Reduced Price School Lunch
ABCD BCD A B
Wilson
interventions
Reading Readinginterventions interventions Reading
C
All Word-level Failure Free Spell
DRead Reading
ABCD BCD A Binterventions Reading
Failure FreeReading
All CorrectiveSpell WilsonWord-level

103
ITT TOT TOT ITT TOT TOT ITT TOT TOT ITT TOT TOT ITT TOT TOT ITT TOT TOTGrade 3 Impact Any Over 80 Impact Any Over 80 Impact Any Over 80 Impact Any Over 80 Impact Any Over 80 Impact Any Over 80Word Attack 7.8 7.8 8.4 10.9 11.0 11.8 -1.7 -1.7 -1.9 8.3 8.3 8.9 19.5 19.7 21.1 5.0 5.1 5.4TOWRE PDE 5.3 5.3 5.7 8.0 8.1 8.7 -3.1 -3.1 -3.3 6.2 6.3 6.8 17.6 17.7 19.0 0.3 0.3 0.3
Word Identification 3.6 3.6 3.9 4.6 4.6 5.0 0.5 0.5 0.6 2.4 2.5 2.6 7.8 7.8 8.4 3.6 3.6 3.9TOWRE SWE 3.0 3.0 3.2 3.9 3.9 4.2 0.2 0.2 0.3 -0.5 -0.5 -0.5 5.2 5.2 5.6 6.9 7.0 7.5Aimsweb 7.6 7.6 8.2 8.4 8.5 9.1 5.1 5.1 5.5 1.1 1.1 1.2 9.6 9.7 10.4 14.5 14.6 15.7
Passage Comprehension 6.1 6.2 6.6 6.7 6.8 7.3 4.2 4.2 4.6 -2.8 -2.8 -3.0 19.5 19.6 21.1 3.6 3.6 3.9GRADE 9.5 9.6 10.3 10.6 10.7 11.4 6.4 6.4 6.9 6.0 6.0 6.4 19.2 19.3 20.7 6.6 6.7 7.1
ITT TOT TOT ITT TOT TOT ITT TOT TOT ITT TOT TOT ITT TOT TOT ITT TOT TOTGrade 5 Impact Any Over 80 Impact Any Over 80 Impact Any Over 80 Impact Any Over 80 Impact Any Over 80 Impact Any Over 80Word Attack 3.7 3.7 4.0 5.1 5.1 5.5 -0.5 -0.5 -0.5 8.9 9.0 9.6 4.1 4.1 4.4 2.2 2.2 2.4TOWRE PDE 1.2 1.2 1.3 1.0 1.1 1.1 1.6 1.6 1.7 4.8 4.8 5.2 -2.1 -2.2 -2.3 0.5 0.5 0.5
Word Identification 0.0 0.0 0.0 0.5 0.5 0.5 -1.6 -1.6 -1.7 0.9 0.9 1.0 0.5 0.5 0.5 0.0 0.0 0.1TOWRE SWE 0.0 0.0 0.0 -0.7 -0.7 -0.7 2.0 2.0 2.1 1.1 1.1 1.2 -0.4 -0.4 -0.4 -2.8 -2.8 -3.0Aimsweb 0.3 0.3 0.3 0.2 0.2 0.3 0.5 0.5 0.6 -0.7 -0.7 -0.8 0.0 0.0 0.0 1.4 1.4 1.5
Passage Comprehension 2.1 2.2 2.3 2.4 2.4 2.6 1.4 1.4 1.5 1.3 1.3 1.4 5.3 5.4 5.8 0.5 0.5 0.6GRADE 1.2 1.2 1.3 1.9 1.9 2.0 -0.7 -0.7 -0.8 1.8 1.8 1.9 2.8 2.8 3.0 1.0 1.0 1.1
Note: Instruction amounts are Any (99.2%), Over 80 hours (92.5%)
Failure FreeReading
All CorrectiveSpell WilsonWord-level
DRead Reading
ABCD BCD A Binterventions Reading
interventions interventions Reading
C
All Word-level Failure Free Spell
Table IV.30
Effect of the Treatment on the Treated Impacts for 3rd and 5th Graders not Eligible for Free or Reduced Price School Lunch
ABCD BCD A B
Wilson
interventions
Reading ReadingCorrective
ReadC D

103
3rd GradeAverage at
baseline
Gap at baseline (Std.
Units)Intervention
GroupControl Group
Intervention Group
Control Group RGR
Word Attack 92.6 0.49 97.8 92.8 0.15 0.48 5.0 * 0.69TOWRE PDE 85.6 0.96 91.6 88.6 0.56 0.76 3.0 * 0.26
Word Identification 88.7 0.75 90.4 88.1 0.64 0.79 2.3 * 0.19TOWRE SWE 86.5 0.90 92.6 89.9 0.49 0.67 2.7 * 0.27Aimsweb NA NA NA NA NA NA NA
Passage Comprehension 91.8 0.55 93.9 92.7 0.40 0.48 1.2 0.17GRADE 86.2 0.92 86.9 82.3 0.87 1.18 4.6 * 0.26
5th GradeAverage at
baseline
Gap at baseline (Std.
Units)Intervention
GroupControl Group
Intervention Group
Control Group RGR
Word Attack 93.1 0.46 98.0 95.3 0.14 0.31 2.7 * 0.56TOWRE PDE 81.0 1.27 88.3 86.9 0.78 0.87 1.4 0.11
Word Identification 88.7 0.76 92.1 91.6 0.53 0.56 0.5 0.06TOWRE SWE 84.2 1.05 89.6 88.2 0.69 0.78 1.4 * 0.12Aimsweb NA NA NA NA NA NA NA Passage Comprehension 92.7 0.49 92.2 90.9 0.52 0.60 1.3 0.14GRADE 91.5 0.57 92.3 92.5 0.51 0.50 -0.2 -0.02
* Impact is statistically significant at the 0.05 level.
Note: RGR defined as RGR = (Impact/(100-Average for Control Group at follow-up).
Note: Gap defined as (100-Average Score)/15, where 100 is the population average and 15 is the population standard deviation.
Note: Values for Aimsweb not available because normed standard scores unavailable.
NA
Impact
Average at follow-up (Std. Units)
Impact
NA
Table IV.31
Relative Gap Reduction: All Interventions Combined
Average at follow-up (Std. Units)
Gap at follow-up
Gap at follow-up

104

REFERENCES
Agronin, M.E., J.M. Holahan, B.A. Shaywitz, and S.E. Shaywitz. “The Multi-Grade Inventory for Teachers.” In S.E. Shaywitz and B.A. Shaywitz, eds., Attention Deficit Disorder Comes of Age. Austin, TX: PRO-ED, 1992, p. 29-67.
Alexander, A., H. Anderson, P.C.Heilman, K.S. Voeller, and J.K Torgesen. “Phonological Awareness Training and Remediation of Analytic Decoding Deficits in a Group of Severe Dyslexics.” 1991 41: 193-206.
Angrist, Joshua D., Guido W. Imbens, and Donald B. Rubin. “Identification of Causal Effects Using Instrumental Variables.” Journal of the American Statistical Association 1996, 91(434).
Benjamini, Yoav, and Yosef Hochberg. “Controlling the False Discovery Rate: a Practical and Powerful Approach to Multiple Testing.” Journal of the Royal Statistical Society, Series B, 1995, 57(1): 289-300.
Bloom, Howard. “Accounting for No-Shows in Experimental Evaluation Designs.” Evaluation Review 1984, 8.
Brown, A.L., A.S. Palincsar, and L. Purcell. “Poor Readers: Teach, Don’t Label.” In U. Neisser, ed., The School Achievement of Minority Children: New Perspectives. Mahwah, NJ: Lawrence Erlbaum Assoc., l986, 105-143.
Bruck, M. “Word Recognition Skills of Adults with Childhood Diagnoses of Dyslexia.” Developmental Psychology 1990, 26: 439-454.
Dunn, L.M., and Dunn, L.M. Peabody Picture Vocabulary Test - Third Edition. Circle Pines, MN: AGS Publishing, 1997.
Elbaum, B., S. Vaughn, M.T. Hughes, and S.W. Moody. “How Effective Are One-to-One Tutoring Programs in Reading for Elementary Students at Risk for Reading Failure? A Meta-Analysis of the Intervention Research.” Journal of Educational Psychology 2000, 92: 605-619.
Engelmann, S., L. Carnine, G. Johnson. Corrective Reading, Word Attack Basics, Decoding A. Columbus, OH: SRA/McGraw-Hill, 1999.
Engelmann, S., L. Meyer, L. Carnine, W. Becker, J. Eisele, and G, Johnson. Corrective Reading, Decoding Strategies, Decoding B1 and B2. Columbus, OH: SRA/McGraw-Hill, 1999.
Engelmann, S., L. Meyer, G. Johnson, and L. Carnine. Corrective Reading, Skill Applications, Decoding C. Columbus, OH: SRA/McGraw-Hill, 1999.
105

Foorman, B., and J.K. Torgesen. “Critical Elements of Classroom and Small-Group Instruction to Promote Reading Success in All Children.” Learning Disabilities Research and Practice 2001, 16: 203-212.
Hanushek, E.A., J.F. Kain, and S.G. Rivkin. “Does Special Education Raise Academic Achievement for Students with Disabilities?” Working Paper No. 6690. Cambridge, MA: National Bureau of Economic Research, 1998.
Hart, B., and T.R. Risley. Meaningful Differences in the Everyday Experience of Young American Children. Baltimore: Paul H. Brookes Publishing Co., 1995.
Howe, K.B., and M.M. Shinn. “Standard Reading Assessment Passages for Use in General Outcome Assessment: A Manual Describing Development and Technical Features. Eden Prairie: MN: Edformation, Inc., 2002
Jenkins, J.R., L.S. Fuchs, P. van den Broek, C. Espin, and S.L Deno. “Sources of Individual Differences in Reading Comprehension and Reading Fluency.” Journal of Educational Psychology 2003, 95: 719-729.
Juel, C. “Learning to Read and Write: A Longitudinal Study of 54 Children from First Through Fourth Grades.” Journal of Educational Psychology 1988, 80: 437-447.
Little, Roderick J., and Donald B Rubin. “Causal Effects in Clinical and Epidemiological Studies via Potential Outcomes: Concepts and Analytical Approaches.” Annual Review of Public Health 2000, 21: 121-145.
Little, Roderick J., and Donald B Rubin. Statistical Analysis with Missing Data, Second Edition. Wiley Series in Probability and Statistics. Hoboken, NJ: Wiley Interscience, 2002.
Lockavitch, J. “Failure Free Reading.” Concord, NC: Failure Free Reading, 1996.
Loney, J., and R. Milich. “Hyperactivity, Inattention, and Aggression in Clinical Practice.” In M. Wolraich and D.D. Routh, eds., Advances in Developmental and Behavioral Pediatrics, 1982, 3: 1213-147.
Lovett, M.W., L. Lacerenza, S.L. Borden, J.C. Frijters, K.A. Steinbach, and M. DePalma. “Components of Effective Remediation for Developmental Reading Disabilities: Combining Phonological and Strategy-Based Instruction to Improve Outcomes.” Journal of Educational Psychology 2000, 92: 263-283.
Lyon, G.R., and S.E. Shaywitz. “A Definition of Dyslexia.” Annals of Dyslexia 2003, 53: 1-14.
MacPhee, K. “Spell Read Phonological Auditory Training (P.A.T.).” Rockville, MD: P.A.T. Learning Systems Inc., 1990.
106

Manis, F.R., R. Custodio, and P.A. Szeszulski. “Development of Phonological and Orthographic Skill: A Two-year Longitudinal Study of Dyslexic Children.” Journal of Experimental Child Psychology, 56, 1993, pp. 64-86.
Mastropieri, M.A., and T. Scruggs. “Best Practices in Promoting Reading Comprehension in Students with Learning Disabilities: 1976-1996.” Remedial and Special Education 1997, 18: 197-213.
Mathematica Policy Research, Inc. “A Proposal for the Evaluation of Reading Interventions Sponsored by The Power4Kids Initiative.” Submitted to the Haan Foundation, October 31, 2002 (with American Institutes for Research).
McKinney, J.D. “Longitudinal Research on the Behavioral Characteristics of Children with Learning Disabilities.” In J.K. Torgesen, ed., Cognitive and Behavioral Characteristics of Children with Learning Disabilities. Austin, TX.: PRO-ED, 1990.
National Reading Panel 2000. “Teaching Children to Read: An Evidence-Based Assessment of the Scientific Research Literature on Reading and its Implications for Reading Instruction.” Washington, DC: National Institute of Child Health and Human Development, 2000.
Rashotte, C.A., K. MacPhee, and J. Torgesen. “The Effectiveness of a Group Reading Instruction Program with Poor Readers in Multiple Grades.” Learning Disability Quarterly 2001, 24: 119-134.
Raudenbush, Stephen W., and Anthony Bryk. “Hierarchical Linear Models: Applications and Data Analysis Methods, Second Edition.” In Jan DeLeeuw and Richard A. Berk, eds., Advanced Quantitative Techniques in the Social Sciences Series, Volume 1. Sage Publications: Thousand Oaks, CA, 2002.
Schatschneider, C., J. Buck, J.K. Torgesen, R.K. Wagner, L. Hassler, S. Hecht, and K. Powell-Smith. “A Multivariate Study of Factors That Contribute to Individual Differences in Performance on the Florida Comprehensive Reading Assessment Test.” Technical Report 5, Tallahassee, FL: Florida Center for Reading Research, 2004.
Semel, E., E.H. Wiig, and W. Secord. “Clinical Evaluation of Language Fundamentals.” Fourth Edition. San Antonio, TX: The Psychological Corporation, 2003.
Share, D. L., and K. Stanovich. “Cognitive Processes in Early Reading Development: A Model of Acquisition and Individual Differences.” Issues in Education: Contributions from Educational Psychology 1995, 1: -57.
Siegel, L.S. “IQ Is Irrelevant to the Definition of Learning Disabilities.” Journal of Learning Disabilities 1989, 22: 469-479.
Snow, C.E., M.S. Burns, and P. Griffin. Preventing Reading Difficulties in Young Children. Washington, DC: National Academy Press, 1998.
107

Snowling, M. J. Dyslexia, 2nd edition. Oxford: Blackwell Publishers, 2000.
Speece, D.L., and B.K. Keogh. Research on Classroom Ecologies. Mahwah, NJ: Lawrence Erlbaum Assoc., 1996.
Stahl, S.A. Four Questions About Vocabulary Knowledge and Reading and Some Answers. In C. Hynd et al., eds. Learning from Text Across Conceptual Domains. Mahwah, NJ: Lawrence Erlbaum Associates, 1998.
Stanovich, K. E. “Matthew Effects in Reading: Some Consequences of Individual Differences in Acquisition of Literacy.” Reading Research Quarterly 1986, 21: 360-407.
Stanovich, K.E. and L.S. Siegel. “The Phenotypic Performance Profile of Reading-Disabled Children: A Regression-Based Test of the Phonological-Core Variable-Difference Model.” Journal of Educational Psychology 1994: 24-53.
Torgesen, J.K. “Avoiding the Devastating Downward Spiral: The Evidence that Early Intervention Prevents Reading Failure.” American Educator 2004, 28: 6-19.
Torgesen, J.K. “Recent Discoveries from Research on Remedial Interventions for Children with Dyslexia.” In M. Snowling and C. Hulme, eds., The Science of Reading. Oxford: Blackwell Publishers, 2005.
Torgesen, J.K., A. W. Alexander, R.K. Wagner, C.A. Rashotte, K. Voeller, T. Conway, and E. Rose. “Intensive Remedial Instruction for Children with Severe Reading Disabilities: Immediate and Long-Term Outcomes from Two Instructional Approaches.” Journal of Learning Disabilities 2001, 34: 33-58.
Torgesen, J.K., and S.R. Burgess. “Consistency of Reading-Related Phonological Processes throughout Early Childhood: Evidence from Longitudinal-Correlational and Instructional Studies.” In J. Metsala and L. Ehri, eds., Word Recognition in Beginning Reading. Hillsdale, NJ: Lawrence Erlbaum Assoc., 1998: 161-188.
Torgesen, J.K., and R. Hudson. “Reading Fluency: Critical Issues for Struggling Readers.” In S.J. Samuels and A. Farstrup, eds., Reading Fluency: The Forgotten Dimension of Reading Success. Newark, DE: International Reading Association (in press).
Torgesen, J.K., C.A. Rashotte, and A. Alexander. “Principles of Fluency Instruction in Reading: Relationships with Established Empirical Outcomes.” In M. Wolf, ed., Dyslexia, Fluency, and the Brain. Parkton, MD: York Press, 2001: 333-355.
Torgesen, J.K., R. K. Wagner, and C.A. Rashotte. Test of Word Reading Efficiency. Austin, TX: PRO-ED Publishing, Inc., 1999.
108

Truch, S. “Stimulating Basic Reading Processes Using Auditory Discrimination in Depth.” Annals of Dyslexia 1994, 44: pp. 60-80.
Truch, S. “Comparing Remedial Outcomes Using LIPS and Phono-Graphix: An In-Depth Look from a Clinical Perspective.” Calgary, Alberta, Canada: The Reading Foundation, Unpublished manuscript, 2003.
U.S. Department of Education, Institute of Education Sciences, National Center for Education Statistics. “The Nation’s Report Card: Reading Highlights 2003.” NCES 2004-452. Washington, DC: NCES. Available online at [www.nces.ed.gov/nationsreportcard/pdf/main2003/2004452.pdf].
Vaughn, S., S. Moody, and J.S. Schumm. “Broken Promises: Reading Instruction in the Resource Room.” Exceptional Children 1998, 64: 211-226.
Wagner, R. K., J.K. Torgesen, and C.A. Rashotte. Comprehensive Test of Phonological Processes. Austin, TX: PRO-ED Publishing, Inc., 1999.
Williams, K.T. Group Reading and Diagnostic Evaluation. Circle Pines, MN: American Guidance Service, 2001.
Wilson, B. The Wilson Reading System, Third Edition. Millbury, MA: Wilson Language Training Corp., 2002
Wise, B.W., J. Ring, and R.K. Olson. “Training Phonological Awareness With and Without Explicit Attention to Articulation.” Journal of Experimental Child Psychology 1999, 72: 271-304.
Wolf, M., and M. Denkla. Rapid Automatized Naming and Rapid Alternating Stimulus Tests. Austin, TX: PROED, Inc., 2005.
Woodcock, R.W. Woodcock Reading Mastery Tests-Revised NU (WRMT-R/NU). Circle Pines, MN: American Guidance Service, l998.
Woodcock, R.W., K.S. McGrew, and N. Mather. Woodcock-Johnson III Tests of Achievement. Itasca, IL: Riverside Publishing, 2001.
Zigmond, N. “Organization and Management of General Education Classrooms.” In D.L. Speece and B.K. Keogh, eds., Research on Classroom Ecologies. Mahwah, NJ: Lawrence Erlbaum Publishers, 1996: 163-190.
Zigmond, N. “Organization and Management of General Education Classrooms.” In D.L. Speece and B.K. Keogh, eds., Research on Classroom Ecologies. Mahwah, NJ: Lawrence Erlbaum Publishers, 1996: 163-190.
109

APPENDIX A
DETAILS OF STUDY DESIGN AND IMPLEMENTATION


A. STUDY DESIGN
This study was designed to estimate the impacts of four remedial reading programs using a scientifically rigorous experimental design involving both school-level and student-level randomization. The student-level randomization ensures that the estimates of the impacts of each of the interventions are obtained by comparing similar groups of students (the treatment and control groups), while the school-level randomization ensures that each of the interventions serves a similar mix of students, enabling comparison of the impacts of the four interventions.
We used the two-level random assignment design instead of a design where only schools were randomly assigned to one of the four interventions or a control condition for three primary reasons. First, randomizing students within schools gives us more power to detect significant impacts. Many more schools would have been required to obtain the same power if only schools were randomized. See Chapter II for more discussion of the statistical power of the study. Second, randomizing students within schools meant that we generated a control group from within the schools and so could provide the opportunity to participate in one of the interventions to at least some students in every school in the study. Preliminary discussions with AIU staff suggested that it would be much easier to gain the cooperation of the school districts and schools if we used our approach instead of the more straightforward one-level design, where none of the struggling readers in schools randomized to the control condition would receive any of the interventions. Third, we expect the distributions of student-level background covariates to be more similar between the treated and control groups when students are randomized within schools than if only schools were randomized. This is due to the larger number of students relative to the number of schools. When randomizing a small number of units (e.g., schools), there is a higher probability that the treated and control schools will be different on some background covariates, just by chance, than if there were a larger number of units randomized. In fact, in this study, by chance many of the smallest schools were randomized to the Wilson Reading condition. However, as discussed in Chapter II, this does not cause problems for the analysis because students were also randomized within schools.
The initial power analyses suggested that we could detect substantively meaningful impacts as statistically significant with a high probability when 40 schools were randomly assigned to one of four remedial reading interventions (Mathematica Policy Research, 2002). Each intervention would be implemented in 10 schools, and all treated students within each school would receive the same intervention. Within each school and grade (grades 3 and 5), eligible students would then be randomly assigned to the treatment group to receive the intervention, or to the control group. The interventions are delivered in instructional groups of three students, and the goal was to have two third-grade and two fifth-grade instructional groups within each school, with all four groups taught by one teacher. The expectation was that there would be approximately 10 eligible students in each school and grade, with six assigned to the treatment group and four to the control group. Once students were
A-3

randomly assigned to the treatment and control groups within each school, we expected the program developers would form the instructional groups within the treatment group.
B. IMPLEMENTATION OF DESIGN
Figures A.1 through A.5 detail the implementation of the study design. Figure A.1 describes the school-level randomization, including the number of schools enrolled and randomized to each of the four interventions. As explained in Chapter II, it was necessary in some cases to form school units such that each school unit had instructional groups serving both third and fifth grade. This first phase of randomization was done at the school-unit level.
Within the schools assigned to each of the interventions, we then used student-level randomization to assign students to either the treatment or control group. Figures A.2 through A.5 offer details on this randomization and the student-level data collection for the study.
C. THE SCHOOL AND CLASSROOM CONTEXT
This section provides information about both the schools attended by the students in the study and the instruction received by students in the control group. It draws on information provided from several sources:
4. The Principal Survey, which included questions about the demographic characteristics of each school’s enrollment and the students’ reading performance on the 2003 Grade 5 Pennsylvania Student Assessment in reading.
5. The Classroom Teacher Survey, which was described in Chapter II.
6. The National Center for Education Statistic’s Common Core of Data (CCD) for the 2002-2003 school year. CCD data were used to provide demographic information for both the superset of schools in the Allegheny Intermediate Unit (AIU), from which the sample of schools participating in this study were drawn, and to provide demographic data on the nation’s schools as a whole. CCD data were also used to validate the demographic data provided by the school administrators.
7. Pennsylvania’s 2002-2003 assessment data were used to assess the reading proficiency of students in the participating schools for the school year prior to the intervention. The data allow us to compare the reading proficiency levels of schools participating in this study with other schools within the AIU, as well as the schools in the state as a whole. These data also were used to provide validation for the assessment results reported by the school administrators and, in a few cases, to fill in results missing from the Principal Survey.
A-4

1. Student Demographic Comparisons
To determine the similarity of student populations among the 50 schools in this study, we used weighted chi-square tests to compare schools’ demographic composition (as reported in the Principal Surveys), with that of AIU schools and the nation’s public schools overall (drawn from the CCD). Prior to performing the chi-square tests, we weighted the Principal Survey data at the school level using the sum of the student-level weights. To make it possible to test the student demographic data with weighting, the school weights were re-scaled so that their sum was equal to the number of schools with Principal Surveys. The AIU demographic data and the national demographic data were similarly weighted (also at the school level) using scaled K-6 enrollment, so that the sum of the weights for the AIU schools was equal to the number such schools with data, and the sum of the school weights for the national schools was equal to the number with data in the CCD universe of public schools.
As presented in Table A.1, the schools in this study had significantly higher proportions of Black students (20.8 percent) than either the AIU (14.4 percent) or the national schools (16.6 percent). The schools in this study and the AIU schools also had significantly smaller proportions of Hispanic students (0.5 percent vs. 22.2 percent) than the nation’s schools. Finally, participating schools had a significantly smaller proportion of low-socioeconomic status (SES) students (25.6 percent) as determined by eligibility for free or reduced-price lunches than the nation’s schools (41.4 percent).
Table A.1
Demographics of Students in Study Compared to AIU and National Student Demographics
Student Group Schools in Study AIU Schools National Schools% Black 20.8 14.4 16.6 *% Hispanic 0.5 0.5 22.2 *% Low SES 25.6 23.9 41.4 *
* Difference between groups is statistically significant at the 0.05 level.
There were also significant differences in student demographics among the schools assigned to the various instructional programs. These occurred despite the use of a stratified random design to assign schools to programs, but they are not unexpected, given the relatively small numbers of schools that had to be distributed across four conditions. Schools assigned to the Failure Free program had relatively few Black and Hispanic students, while the schools assigned to the Wilson Reading program had relatively few low-SES students and relatively few students with Individualized Education Plans (IEPs).
Table A.2
Demographics for Participant Schools, Overall and by Intervention
A-5
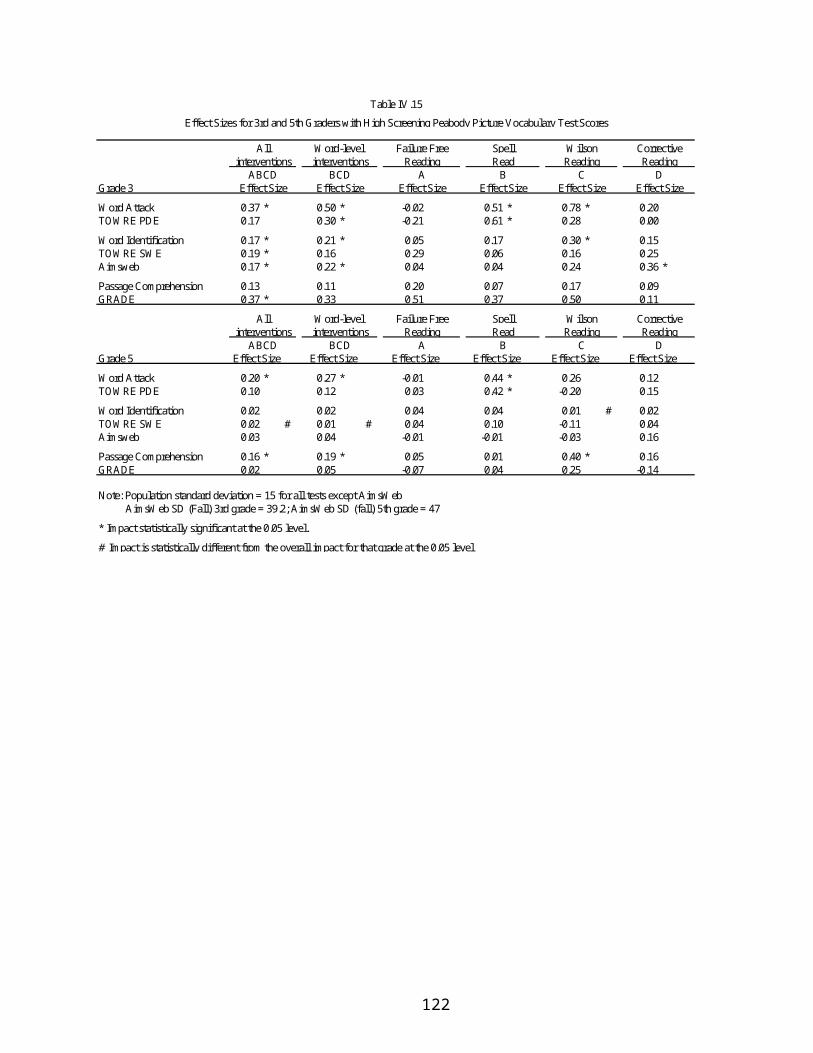
Student Group
Overall Failure Free
Reading Spell ReadWilson Reading
Corrective Reading
Mean Mean Mean Mean MeanBlack 20.8 10.2 27.5 25.6 23.1 *Hispanic 0.5 0.3 0.5 0.5 0.7 *Low SES 25.6 23 22.5 12.8 35.3 *IEP students 11 13.6 9.7 6.7 13.4 *
* Difference between groups statistically significant at the 0.05 level.
2. Reading Achievement Comparisons
In order to assess the similarity of participating schools with the larger universe of Pennsylvania schools, the former’s average performance on the Pennsylvania System of School Assessments (PSSA) fifth-grade reading assessment was compared with the state average level of proficiency. We also examined the levels of proficiency across the groups of schools participating in each intervention. To do so, we summed the 2003 assessment scores for percent proficient and percent advanced, as reported on the Principal Survey, making a cumulated proficiency measure representing the percentage of students performing at or above the proficient level. Once cumulated, the scores for the sample schools were compared with the cumulated scores for the state as a whole, and were compared across the four programs to provide a measure of the schools’ reading proficiency level prior to the implementation of this study.
Table A.3 shows how the students in participating schools compare to all Pennsylvania schools. As can be seen, the difference in the mean percent proficient and above was not significant [F(1,1704)=1.90, p=.1682].
Table A.3
Percent of Fifth Graders Scoring at Proficient or Above on PSSA for Participant Schools: All Intervention Students Combined
(Weighted by K-6 Enrollment)
Program N Mean
State 1667 57.5
Sample 39 61.7
Similarly, as shown in Table A.4, differences in fifth-grade reading proficiency levels among schools assigned to the four interventions were also not significant [F(3,35) = .18, p=.9095].
A-6

Table A.4
Percent of Fifth Graders Scoring at Proficient on PSSA for Participant Schools by Intervention
(Weighted With Baseline School Weights)
Program N Mean
Failure Free Reading 11 63.3
Spell Read P.A.T. 8 56.8
Wilson Reading 11 62.1
Corrective Reading 9 63.0
The data suggest that either the overall reading instructional programs in schools assigned to the different interventions were of roughly similar strength, or that the differences in demographic characteristics across schools noted in the earlier analysis were not sufficiently large to produce differences in reading achievement across schools. In any case, this analysis suggests that differences in instructional effectiveness that might occur across the interventions examined in this study should not be attributed to differences in effectiveness of the general reading instruction available at these schools.
A-7

A-8

A-9

A-10

A-11

A-12

APPENDIX B
DATA COLLECTION


This appendix describes details of the study design as well as key policies and procedures for the Year One data collection. Data collection began with obtaining parental consent and student assent. This was followed by surveys of parents, students, and teachers; extraction of student records data; collection of intervention attendance records; and administration of standardized tests.
A. STUDY MANAGEMENT AND DATA COLLECTION RESPONSIBILITIES
Responsibility for the management and execution of this study was divided among five groups. Dr. Torgesen had overall responsibility for the study and was specifically responsible for recruiting program providers and overseeing the instructional elements of the study. MPR was responsible for developing the experimental design; recruiting schools; implementing random assignment; collecting student-, family-, and school-level assessment data; and estimating instructional impacts. American Institutes for Research was responsible for designing instruments to collect data on classrooms and code the videotapes, and analyzing data to describe the instructional context and all features of the implementation. Ms. Haan was responsible for initiating the evaluation and coordinating the funding and research components. Personnel from the Allegheny Intermediate Unit (AIU) worked with the research team to coordinate all activities within the AIU, including assisting in the recruiting of schools, recruiting teachers, collecting videotapes of teaching sessions, and ongoing problem solving as the study was executed.
B. OBTAINING CONSENT
A two-step process was used to obtain consent. Before administering a brief test to determine student eligibility (discussed in Section E below), we sent letters and passive consent forms to schools for dissemination to parents. The letters described the study, explained how schools identified the children to be tested, noted the voluntary nature of the tests and the confidentiality of the results, and provided a toll-free telephone number for parents to call and ask questions. Parents who did not want their children taking the brief test returned the form denying permission to the school. Parents allowing the test did not have to do anything.
After the brief test was administered, we mailed consent packets to parents of children with eligible test scores. The packet included a question-and-answer (Q&A) brochure, a letter on Power4Kids letterhead, an active consent form, a student assent form, a parent baseline survey, and an informational letter on the fMRI component and a form to request additional information on the functional magnetic resonance imaging (fMRI) study. The letter described the study, explained that a lottery would be held to determine which children would receive the intervention, stated that children not receiving the intervention would still be an important part of the study, noted the confidentiality of the test results, and provided a toll-free telephone number for questions. The active consent form explained that parents were: allowing their child (if randomly selected to be in the treatment group) to receive reading
B-3

instruction through a pullout program and complete reading and language tests; authorizing the child’s school and reading/language arts teacher to provide requested information about their child; and permitting their child to be videotaped while receiving the intervention.
All parents were asked to indicate whether or not their child had permission to participate in the study, sign the consent form, and return it to their child’s school. Following Institutional Review Board guidance, all students whose parents consented were asked to sign an assent form indicating they agreed to participate in the study. Parents mailed the completed consent form, assent form, and parent baseline survey to the evaluation team using the postage-paid, self-addressed envelope provided. Near the end of the consent period, intervention teachers contacted nonresponding parents to prompt them to return their consent forms (teachers did not induce parents to consent, but simply to return the form indicating their decision). Parents returned the consent and assent forms to the schools which then forwarded the forms to the evaluation team. Interviewers called those parents to complete the baseline survey via telephone.
If parents were interested in participating in the study’s fMRI component, they also returned the fMRI form requesting additional information. This form was forwarded to the fMRI study team, who then mailed parents a more detailed information packet on that component.
C. COLLECTING SURVEYS
1. Parent and Student Surveys
Parents, students, and classroom teachers completed surveys for this study. The parent baseline survey (mailed to parents in their consent packet, as noted above) collected demographic information (student’s race, ethnicity, sex, language), socioeconomic information (parents’ education and employment; household size, income, and benefits), and information on the child’s current or recent tutoring, disabilities, and number of school changes. The survey itself is given in Appendix G. The 20-question instrument took about 10 minutes to complete when self-administered and 15 minutes to complete by telephone. Of those parents who completed the baseline survey (all but seven parents), 83 percent returned the baseline survey with their consent materials, and 17 percent completed the survey by telephone.
Near the end of the school year, parents also completed a three-question survey on any after-school tutoring their child received during the 2003-04 school year. Intervention teachers contacted parents to administer the survey. Test administrators asked students the same three questions after finishing the individual test battery for the follow-up session. Students and parents were asked the same questions to determine whether children were reliable respondents for these items.
B-4

2. Teacher Surveys
For each student in the study, reading/language arts teachers completed two surveys—one at the start of the 2003-04 spring semester and one at the end. Both surveys collected information on the student’s reading instruction, including the number of students in the child’s reading group(s), the types of teachers providing reading instruction, and the amount of received; pull-out reading instruction (curriculum areas missed, ways in which the child made up missed content); and tutoring outside of school hours. The second survey also asked teachers to rate the frequency with which the students displayed various behaviors related to maintaining attention, adaptability, and social skills. The second survey is shown in Appendix H.
The teacher surveys were disseminated to the intervention teacher, who distributed them to and collected them from the students’ reading/language arts teachers. For students who had transferred to non-AIU schools, teacher surveys were mailed to the child’s school with a postage-paid, self-addressed return envelope. Telephone prompts were made to those schools to encourage the teachers to complete the survey.
D. EXTRACTING RECORDS DATA
Intervention teachers also abstracted data to complete each student records form. These forms collected information on the student’s enrollment, attendance, and suspensions; characteristics such as limited English proficiency, eligibility for the free or reduced-price lunch program, disabilities, etc.; reading services; Individual Education Plan IEP or Service Agreement specifications; grade promotion and retention; course grades; and reading and math standardized test scores. As with the teacher surveys, student records forms for transfer students were mailed to the child’s school with a postage-paid, self-addressed return envelope. Telephone prompts were made to those schools to encourage completion of the student records form.
E. COLLECTING INTERVENTION ATTENDANCE
Intervention teachers maintained daily attendance records showing which students were grouped together for intervention instruction. For each session, intervention teachers recorded the number of minutes of instruction for each student, the type of teacher (regular intervention teacher or substitute), and the type of session (regularly scheduled instruction or a make-up). Intervention teachers sent their attendance records to the evaluation team on a monthly basis.
F. ADMINISTERING STANDARDIZED TESTS
Retired and substitute teachers were hired and trained to administer the standardized tests to students. Schools and districts identified former teachers
B-5

and/or current substitute teachers to serve as test administrators in their schools, and some of those identified proposed other teachers to cover sites from which we had received no recommendations. Training lasted three days and focused predominantly on test administration. Other topics included an overview of the study, contacting and interacting with schools, scheduling tests, arranging logistics, and administering the student survey. In addition to practice time incorporated in the training, testers were asked to conduct a “dress rehearsal” with a child one evening and bring questions to the next day’s training.
Testers were provided a toll-free telephone number to call if they had any questions once they began administering tests. Each also audiotaped one child’s test administration session in each round of testing (except during the screening tests and “mini-test” administrations). The reading specialist who conducted the test administration training sessions reviewed the tapes and provided feedback. General reminders were e-mailed to all testers, and specific comments were discussed by telephone with individual testers.
Testers administered standardized tests six times during the first year (see Table B.1): two screening tests at the start of the school year to determine eligibility; eight baseline tests after active consent was obtained and before the interventions began; two “mini-tests” at 17 intervention hours;50 three midpoint tests at 50 intervention hours; two “mini-tests” at 75 intervention hours; and five follow-up tests at 100 intervention hours. (Table II.8 lists the specific tests administered at each period.) In consideration of the amount of class time missed to take tests, the mini-tests were administered only to intervention students during their intervention instruction. Since the mini-test sessions lasted merely five minutes,
50 The first mini-test had been planned for 25 hours after the intervention began. Because of end-of-year holidays and the desire to test all the intervention students at the same time (either before or after the break), the first mini-test was administered at 17 hours.
B-6

Table B.1
Year One Tests Administered By Round
Administration Number of tests
Administration point
Approx. administration time
Screening 2 Start of school year 17 minutes
Baseline 8 0 intervention hours 55 minutes, plus a separate 24-minute, group-
administered test
Mini-test 1 2 17 intervention hours 3 minutes
Midpoint 3 50 intervention hours 21 minutes
Mini-test 2 2 75 intervention hours 3 minutes
Follow-up 5 100 intervention hours 29 minutes, plus a separate 24-minute, group-
administered test
they were administered solely to intervention students still at an in-study school. For all other sessions, tests were administered to both intervention and control students, including students who had transferred within a 100-mile radius of their original school.
Test battery administration times varied by student. When scheduling sessions, test administrators allowed for time beyond the actual test time to set up and put away materials for each test; to take students from their classroom to the testing room and then to return them to their classroom; and to calculate raw test scores. During longer test batteries, testers permitted students to take a break between tests as needed.
B-7


APPENDIX C
WEIGHTING ADJUSTMENTS AND MISSING DATA


A. BASIC WEIGHTING ADJUSTMENTS
Weighting adjustments are utilized to ensure that both the treated group and the control group reflect the population of students in the study. The weighting is done within strata (the groups within which the student-level random assignment was done); these are generally defined by school and grade level.
This appendix describes the construction of baseline weights and “base” follow-up weights, including description of how the latter are adjusted to account for missing data. The study weights students within each randomization stratum up to the number of treatment slots that were originally allocated to that stratum. These weights approximately correspond to a situation where schools receive funding proportional to enrollment.
1. Construction of baseline and “base” first follow-up weights
The first step in calculating the weights was to create the set of counts to which we want to weight the data. These counts are the control totals to which the weights within each randomization stratum sum: the number of treatment slots originally allocated to each randomization stratum.
The first set of weights constructed are termed “baseline weights”; these weight all students in the study at baseline (the beginning of the school year), and weight treatment and control students together so that all students within a randomization stratum receive the same weight. The total weight within each stratum equals the control total for that stratum. For example, if the number of treatment slots in a stratum was six and there were nine consenting students (thus nine treatment and control students, combined), each student in that stratum would have a baseline weight of 6/9, or 2/3.
The next set of weights constructed are termed “preliminary base” weights for impact analyses. These are similar to the baseline weights, except that treatment and control students within each randomization stratum are weighted separately to the total for that stratum. With a few exceptions (described below), the weight for each treatment student is the total divided by the number of treatment students, and the weight for each control student is the total divided by the number of control students. Continuing the example from the previous paragraph, if there were six treatment students and three control students in the stratum, then each treatment student would receive a base follow-up weight of 6/6, or 1, and each control student would receive a base follow-up weight of 6/3, or 2. Thus, the sum of the weights in each group within the stratum equals six, the number of treatment slots. This ensures that the treatment and control groups are weighted up to the same totals.
An initial complication in calculating these preliminary base weights is that of siblings where both siblings were in the evaluation sample. Generally, all students within a randomization stratum had the same probability of receiving treatment. However, siblings were randomized together to ensure that both
C-3

siblings received the same assignment, avoiding situations in which one sibling was assigned to be in the treatment group while the other was assigned to be in the control group. This is not a problem if the two siblings were in the same randomization stratum or if the two strata had the same treatment probability. However, if two siblings were from two different randomization strata with different probabilities (because of different ratios of eligible students to treatment slots in the two strata), the treatment probability for the sibling pair was the average of that from the two strata, and thus the siblings had a different probability of treatment assignment than the other students in the two strata. Thus, for 10 of the 79 randomization strata, slight adjustments were made to the weights to account for these differences in the treatment probabilities. These adjustments ensured that the ratio of the weight for a sibling to the weight for a non-sibling equaled the ratio of the inverse treatment probabilities for siblings and non-siblings.
B. WEIGHTING ADJUSTMENTS FOR MISSING DATA
1. Overview of missing data challenges
The preliminary base weights described above were modified slightly to account for missing data on the tests used to assess reading ability and estimate impacts. There are two types of missing data: unit nonresponse, and item nonresponse. A unit nonrespondent is a student who did not take any of the end-of-year tests. An example of a unit nonrespondent is a student who transferred schools and could not be tested at their new school. There are 21 of these students in the study. Item nonresponse on a test occurs when some items at a particular time are observed for a student, but a particular item—for example, a particular test score—is missing. On the tests administered at the beginning of the school year, there are three students missing one test score (each for a different test). In addition, on the tests administered at the end of the school year, three students are missing a score on the GRADE test. Since less than one-half of one percent of data are item-missing and exclusion of such individuals should not substantially affect estimates, item nonrespondents are dropped for item-specific analyses without further adjustment. Weighting adjustments are used to compensate for unit nonresponse, as described below.
More generally, there are three types of unit nonresponse for which we utilize weighting adjustments: school by grade randomization strata in which there were no control students observed, a school unit for which there were no control students observed at all, and student nonresponse on the end of the year tests. The weighting adjustment method used weights up students with observed test scores who look similar to the students whose test scores are missing. Specifically, for unit nonresponse, we reassigned nonrespondent weights to other students in the same grade, blocking stratum (the strata within which the school-level randomization was done, defined by the percentage of students eligible for free or reduced-price lunch), and intervention using matching techniques that weight up other students who look
C-4

similar to the student with missing information. These three types of missing data and the weighting adjustments are described further below.
2. Strata with no control students
Because the study was designed such that no intervention slots would go unfilled if there were enough consenting students to fill out an instructional group, in some randomization strata there were insufficient numbers of consenting students to assign any students to the control group. For example, if there were just three consenting students in a grade level within a school, all three would be assigned to receive the treatment and there would be no students assigned to the control group in that school and grade. There are seven such randomization strata.
For each of these strata, we weight up control students in other strata who look like the missing students. This similarity is defined as being in the same blocking stratum and grade, same race, gender, and income (when possible), and similar baseline test scores.51 Because there is no information available on the missing control students, and because at baseline the treatment and control students within a randomization stratum should be only randomly different from one another, we do this by finding control students who look similar to the treatment students in the strata with missing control students.
Priority is given to close matching on the baseline test scores because they should be highly predictive of the outcome test scores. In addition, the matching is generally done so that exact matches on gender, race, and family income categories are obtained when possible—for example, an African American male student in a family with income over $30,000 is matched to other African American male students with family incomes over $30,000 and similar baseline test scores. In this way, control students with the same race, gender, and income level, and similar baseline test scores are weighted up to account for the missing control students in the strata with no control students. The weighting is done inversely proportional to the Mahalanobis distance, so that students with test scores more similar to those of the target are given greater weight than students with test scores less similar.
For example, suppose a stratum with no control students had three treated students, and that the control total for the weighting is six (so that the sum of the weights in the treatment and control groups in that stratum should each
51 We define “similar” test scores as having a small Mahalanobis distance, where the Mahalanobis distance between the test scores of student i and student j is defined as
, where consists of baseline values of the nine test scores of primary interest (Aimsweb standard score, GRADE standardized score on passage comprehension, TOWRE 45-second phonemic decoding and awareness standard score, TOWRE 45-second sight word efficiency standard score, WRM-R word identification grade-based standard score, WRM-R word attack grade-based standard score, WRM-R passage comprehension grade-based standard score, WJIII calculation standard score, and WJIII spelling standard score), and is the covariance matrix of these nine test scores in the full sample.
C-5

equal six). Each treatment student will get a weight of two. In addition, matches will be found for each treatment student in the stratum. Suppose treatment students one and two each have one match, while treatment student three has two matches, with Mahalanobis distances of two and four, respectively. Each of the matches for treatment students one and two will have
their weights increased by . For treatment student three, the
two matches will have their weights increased by and
, respectively. Note that the sum of these weight increases
is 2+2+4/3+2/3=6, which is the correct control total for that stratum.
3. School unit with no control students
There is one school unit for which there are no control students observed at all, in either third or fifth grade. This case is more complicated than the randomization strata with no control students; it is not possible to estimate school unit parameters in the analysis model when there are no control students observed in an entire school unit. We thus drop this school-unit from the analysis, but weight up other students who look similar to the students in that school unit, to account for their being dropped. This will preserve the balance achieved through randomization; simply dropping the students from that school unit may degrade such balance.
A weighting adjustment similar to that for the strata with no control students was used here, except that in addition to control matches for the missing control students in this school unit, as described above, we also found treatment matches for the dropped treatment students. The method is similar to the procedure described above, except that the potential matches are restricted to treatment students in the same blocking stratum, grade, and intervention.
4. Nonresponse at first follow-up
A final source of missing data is student-level (unit) nonresponse at first follow-up—the 21 students who did not take any of the tests at the end of the first year of the intervention. The nonrespondents represent a small fraction of the total sample size of 772 students. A similar approach as that described above is used to adjust for this nonresponse, where students in the same treatment group, blocking strata, and grade, with the same age, race, family income, and similar baseline test scores, are weighted up to account for the students who did not take the end-of-year tests.
C-6

C. IMPUTATION OF FREE OR REDUCED PRICE LUNCH STATUS
For most variables used in the analyses there was very little item-nonresponse. However, 22 students (3 percent) had a missing value for the variable indicating free or reduced-price lunch status, as reported in the school records. Because this variable was used to define a key subgroup of interest and because we had supplementary information from the parent survey, we used hot-deck imputation (Little and Rubin, 2002) to impute free or reduced-price lunch eligibility for those 22 students. Specifically, for students with missing free or reduced-price lunch eligibility, we imputed their eligibility by randomly selecting one student with the same family income level and family size (as reported in the parent survey) and imputing their observed eligibility status for the student with missing eligibility status. This enables the use of all students in the free or reduced-price lunch eligibility subgroup analyses.
C-7
APPENDIX D
DETAILS OF STATISTICAL METHODS


A. DETAILS ON THE HIERARCHICAL LINEAR MODEL SPECIFICATION
1. Estimation of impacts
The impacts are defined as the regression-adjusted difference in the average achievement scores for the treatment and the control groups. From the hierarchical linear model (HLM), we estimate impacts for each of the four interventions.52 We also estimate the impact of being assigned to any of the interventions, denoted as the pooled intervention impact (ABCD), as the average of these four intervention impacts.53
As discussed in Chapter IV, we can obtain our impact estimates from our model by plugging in the level-two equations (Equations IV.2 in Chapter IV) into the level-one equation (Equation IV.1 in Chapter IV) and considering this combined equation for different profiles of students and school units.54 We assume that each blocking strata contributes equally to the impacts and construct impacts using an equally weighted average blocking effect. 55
In addition to estimating impacts for all third or all fifth graders, we estimate impacts for subgroups of students within each grade. Being able to estimate impacts for subgroups and to test for differences in impacts among them allows
52 We used HLM 5 software published by Scientific Software International, Inc. to obtain the HLM estimates. Parameter estimates are obtained using restricted maximum likelihood (REML), as discussed in Raudenbush and Bryk (2002).
53 Since we assume that each intervention contributes equally to the pooled intervention impact, we use an equally weighted average of the individual interventions.
54 For example, the equation pertaining to fifth graders in the control group from school units assigned to intervention D is
.
And, the equation pertaining to treatments in intervention A is
Similar equations can be obtained for each intervention and each grade level (third or fifth).
55 An estimate of impacts for different profiles of students could include those students in a particular intervention within a particular blocking strata. Since we assume blocking strata contribute equally to the impact estimates, we capture the blocking effect by using an average blocking effect, where each blocking strata contributes equally. This average is an equally weighted average of impacts for interventions and combinations of interventions from each of the four blocking strata. For example, impacts for interventions A in blocking strata 1, 2, 3 and 4 are averaged so that each blocking strata contributes equally to impact of intervention A. Thus, for third graders, the terms
in Equation IV.5 capture the blocking effect in intervention A impacts.
D-3

for potentially better targeting of the interventions to, for example, students with especially low phonemic decoding skills. To estimate subgroup impacts, we modify the model specification found in Equation II.1 of Chapter II to allow for different impacts within each grade for a general subgroup, , as described below.
2. Impacts for general subgroups measured at the individual level
All subgroup impacts are computed separately for third and fifth graders. Therefore, the model specification found in Equation II.1 of Chapter II is further modified to allow for different impacts for a general subgroup, , by grade and is found in Equations and .
Level One: Student (i) within school unit (j)
Level Two: School unit (j) linked to intervention effects and blocking variables
, where are as defined for Equations II.1 and
II.2 of Chapter II, and
The level-one model further relates students’ post-intervention test scores to an indicator identifying whether a student is a subgroup member ( if student and 0 otherwise).
3. Impacts of the Treatment on the Treated (TOT)
As shown in Bloom (1984), an unbiased estimate of the TOT impact is the Intention-to-Treat (ITT) impact—described in Sections 1 and 2—divided by the proportion of students who participate in one of the interventions only when
assigned to the treatment group: , where is the estimated proportion
of students who participate in one of the interventions only when assigned to the treatment group and is the ITT impact, for example, as described in
D-4

Section 2. We use this “Bloom’s correction” to estimate the TOT impacts presented in Chapter II. (See also Angrist, Imbens & Rubin, 1996, or Little & Rubin, 2000 for general background information on computing TOT estimates.)
4. Adjustment for multiple comparisons
When estimating impacts for multiple outcomes and testing multiple interventions, there is a concern that some estimated impacts will be found to be significantly different from zero, even if there is actually no impact of the interventions (a “Type 1” error). In fact, even if there were no differences between the treatment and control groups, 5 percent of test statistics comparing the outcomes of the two groups would be expected to be significant at the 5 percent level. To address these types of concerns, methods have been developed that adjust the significance levels of tests to account for the number of tests being performed.
We implemented two of these methods that adjust significance levels to account for the multiple comparisons being performed. The first is the Bonferroni correction, which is a commonly used method that controls the familywise error rate, ensuring that the probability of making any Type 1 error—rejecting a null hypothesis that is in fact true—is at the designated level (e.g., 0.05). The drawback of the Bonferroni method is that it often has low statistical power. The second method we utilized was developed by Benjamini and Hochberg (BH) in 1995. The BH method controls the “false discovery rate,” or the expected proportion of falsely rejected hypotheses (Type 1 errors). This procedure is more powerful than the Bonferroni method, and is particularly relevant for situations such as this, where interest is in assessing the impact of an intervention on multiple outcomes.
A key consideration in using these procedures is the grouping of tests; the adjustments are done within groups and they depend on the number of tests within each group. We use two groupings: the seven reading tests within each grade level and contrast examined (e.g., ABCD), and the two or three tests within each type of assessment (phonemic decoding and awareness, reading accuracy and fluency, and reading comprehension), grade level, and contrast. We used these groupings because we are generally interested in statements such as “the four interventions, combined, increased phonemic decoding among third graders,” making statements separately for third and fifth graders, and separately for each type of contrast (the four interventions, the three word-level interventions, and each of the four interventions individually).
Tables D.1 through D.20 show the significance levels generated with no adjustment (as presented in Chapter IV), adjusted using the Bonferroni method, and adjusted using the BH method, for the full sample and for each of the subgroups. The odd-numbered tables do the adjustments within tests grouped by type; the even-numbered tables do the adjustments within groups of all seven tests.
D-5

D-6

D-24
Grade 3 Unadj. Bonf. BH Unadj. Bonf. BH Unadj. Bonf. BH Unadj. Bonf. BH Unadj. Bonf. BH Unadj. Bonf. BH
Word Attack * * * * * * * * * * * * * *TOWRE PDE * * * * * * * * * * * *
Word Identification * * * * * * * *TOWRE SWE * * * * * * * * *Aimsweb * * * * * * * * *
Passage ComprehensionGRADE * *
Grade 5 Unadj. Bonf. BH Unadj. Bonf. BH Unadj. Bonf. BH Unadj. Bonf. BH Unadj. Bonf. BH Unadj. Bonf. BH
Word Attack * * * * * * * * * * * *TOWRE PDE * * *
Word IdentificationTOWRE SWE *Aimsweb
Passage ComprehensionGRADE
* Impact is statistically significant at the 0.05 level.
Note: "Unadj." is unadjusted p-values, "Bonf." refers to p-values adjusted using Bonferroni procedure, "BH" refers to p-values adjusted using Benjamini and Hochberg (1995) procedure.
Table D.1
3rd and 5th graders: Comparison of Significance Levels, Tests Grouped by Type
All Interventions Word-level interventions Failure Free Reading Spell Read Wilson Reading Corrective Reading
Wilson Reading Corrective ReadingAll Interventions Word-level interventions Failure Free Reading Spell Read

D-24
Grade 3 Unadj. Bonf. BH Unadj. Bonf. BH Unadj. Bonf. BH Unadj. Bonf. BH Unadj. Bonf. BH Unadj. Bonf. BH
Word Attack * * * * * * * * * * * * *TOWRE PDE * * * * * * * * *
Word Identification * * * * * * *TOWRE SWE * * * * * * *Aimsweb * * * * * *
Passage ComprehensionGRADE *
Grade 5 Unadj. Bonf. BH Unadj. Bonf. BH Unadj. Bonf. BH Unadj. Bonf. BH Unadj. Bonf. BH Unadj. Bonf. BH
Word Attack * * * * * * * * * * *TOWRE PDE * * *
Word IdentificationTOWRE SWE *Aimsweb
Passage ComprehensionGRADE
* Impact is statistically significant at the 0.05 level.
Note: "Unadj." is unadjusted p-values, "Bonf." refers to p-values adjusted using Bonferroni procedure, "BH" refers to p-values adjusted using Benjamini and Hochberg (1995) procedure.
Table D.2
3rd and 5th graders: Comparison of Significance Levels, All Tests Grouped Together
All Interventions Word-level interventions Failure Free Reading Spell Read Wilson Reading Corrective Reading
Wilson Reading Corrective ReadingAll Interventions Word-level interventions Failure Free Reading Spell Read

D-24
Grade 3 Unadj. Bonf. BH Unadj. Bonf. BH Unadj. Bonf. BH Unadj. Bonf. BH Unadj. Bonf. BH Unadj. Bonf. BH
Word Attack * * * * * * *TOWRE PDE * * * * * * * *
Word Identification * * *TOWRE SWEAimsweb
Passage ComprehensionGRADE * * * * * *
Grade 5 Unadj. Bonf. BH Unadj. Bonf. BH Unadj. Bonf. BH Unadj. Bonf. BH Unadj. Bonf. BH Unadj. Bonf. BH
Word Attack * * * * * * * * *TOWRE PDE * * *
Word Identification * * * *TOWRE SWE *Aimsweb
Passage ComprehensionGRADE
* Impact is statistically significant at the 0.05 level.
Note: "Unadj." is unadjusted p-values, "Bonf." refers to p-values adjusted using Bonferroni procedure, "BH" refers to p-values adjusted using Benjamini and Hochberg (1995) procedure.
Wilson Reading Corrective ReadingAll Interventions Word-level interventions Failure Free Reading Spell Read
Table D.3
3rd and 5th graders with Low Word Attack Scores: Comparison of Significance Levels, Tests Grouped by Type
All Interventions Word-level interventions Failure Free Reading Spell Read Wilson Reading Corrective Reading

D-24
Grade 3 Unadj. Bonf. BH Unadj. Bonf. BH Unadj. Bonf. BH Unadj. Bonf. BH Unadj. Bonf. BH Unadj. Bonf. BH
Word Attack * * * * * *TOWRE PDE * * * * * * * *
Word Identification * * * * *TOWRE SWEAimsweb
Passage ComprehensionGRADE * * * *
Grade 5 Unadj. Bonf. BH Unadj. Bonf. BH Unadj. Bonf. BH Unadj. Bonf. BH Unadj. Bonf. BH Unadj. Bonf. BH
Word Attack * * * * * * * * *TOWRE PDE * * *
Word Identification * * *TOWRE SWE *Aimsweb
Passage ComprehensionGRADE
* Impact is statistically significant at the 0.05 level.
Note: "Unadj." is unadjusted p-values, "Bonf." refers to p-values adjusted using Bonferroni procedure, "BH" refers to p-values adjusted using Benjamini and Hochberg (1995) procedure.
Table D.4
3rd and 5th graders with Low Word Attack Scores: Comparison of Significance Levels, All Tests Grouped Together
All Interventions Word-level interventions Failure Free Reading Spell Read Wilson Reading Corrective Reading
Wilson Reading Corrective ReadingAll Interventions Word-level interventions Failure Free Reading Spell Read

D-24
Grade 3 Unadj. Bonf. BH Unadj. Bonf. BH Unadj. Bonf. BH Unadj. Bonf. BH Unadj. Bonf. BH Unadj. Bonf. BH
Word Attack * * * * * * * * * * * *TOWRE PDE * * * * * * * * * * * *
Word Identification * * * * * * *TOWRE SWE * *Aimsweb
Passage Comprehension *GRADE
Grade 5 Unadj. Bonf. BH Unadj. Bonf. BH Unadj. Bonf. BH Unadj. Bonf. BH Unadj. Bonf. BH Unadj. Bonf. BH
Word AttackTOWRE PDE
Word IdentificationTOWRE SWE *Aimsweb * * * * * * *
Passage ComprehensionGRADE
* Impact is statistically significant at the 0.05 level.
Note: "Unadj." is unadjusted p-values, "Bonf." refers to p-values adjusted using Bonferroni procedure, "BH" refers to p-values adjusted using Benjamini and Hochberg (1995) procedure.
Table D.5
3rd and 5th graders with High Word Attack Scores: Comparison of Significance Levels, Tests Grouped by Type
All Interventions Word-level interventions Failure Free Reading Spell Read Wilson Reading Corrective Reading
Wilson Reading Corrective ReadingAll Interventions Word-level interventions Failure Free Reading Spell Read

D-24
Grade 3 Unadj. Bonf. BH Unadj. Bonf. BH Unadj. Bonf. BH Unadj. Bonf. BH Unadj. Bonf. BH Unadj. Bonf. BH
Word Attack * * * * * * * * * *TOWRE PDE * * * * * * *
Word Identification * * * * *TOWRE SWE * *Aimsweb
Passage Comprehension *GRADE
Grade 5 Unadj. Bonf. BH Unadj. Bonf. BH Unadj. Bonf. BH Unadj. Bonf. BH Unadj. Bonf. BH Unadj. Bonf. BH
Word AttackTOWRE PDE
Word IdentificationTOWRE SWE *Aimsweb * * * * *
Passage ComprehensionGRADE
* Impact is statistically significant at the 0.05 level.
Note: "Unadj." is unadjusted p-values, "Bonf." refers to p-values adjusted using Bonferroni procedure, "BH" refers to p-values adjusted using Benjamini and Hochberg (1995) procedure.
Wilson Reading Corrective ReadingAll Interventions Word-level interventions Failure Free Reading Spell Read
Table D.6
3rd and 5th graders with High Word Attack Scores: Comparison of Significance Levels, All Tests Grouped Together
All Interventions Word-level interventions Failure Free Reading Spell Read Wilson Reading Corrective Reading
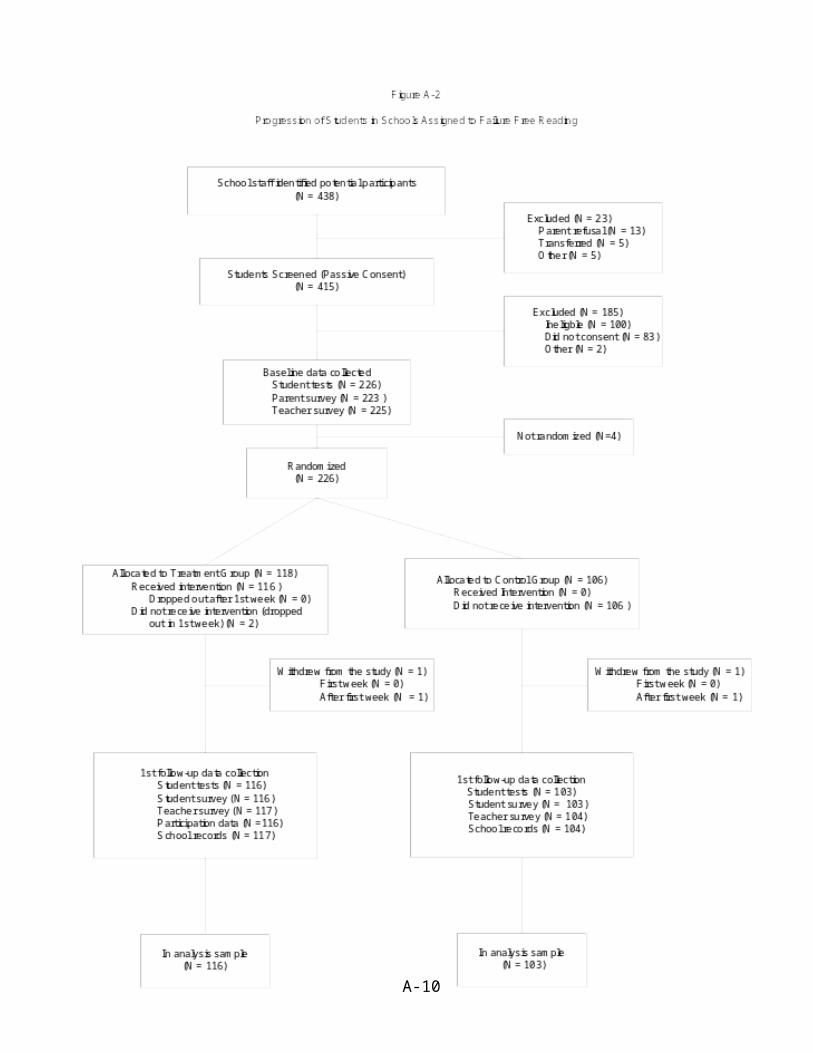
D-24
Grade 3 Unadj. Bonf. BH Unadj. Bonf. BH Unadj. Bonf. BH Unadj. Bonf. BH Unadj. Bonf. BH Unadj. Bonf. BH
Word Attack * * * * * * * * * *TOWRE PDE
Word Identification *TOWRE SWE * * * * * *Aimsweb
Passage ComprehensionGRADE *
Grade 5 Unadj. Bonf. BH Unadj. Bonf. BH Unadj. Bonf. BH Unadj. Bonf. BH Unadj. Bonf. BH Unadj. Bonf. BH
Word Attack * * * * * * * * * * * *TOWRE PDE * * * *
Word Identification * * * *TOWRE SWE * * * * * * *Aimsweb
Passage ComprehensionGRADE
* Impact is statistically significant at the 0.05 level.
Note: "Unadj." is unadjusted p-values, "Bonf." refers to p-values adjusted using Bonferroni procedure, "BH" refers to p-values adjusted using Benjamini and Hochberg (1995) procedure.
Table D.7
3rd and 5th graders with Low Peabody Picture Vocabulary Test Scores: Comparison of Significance Levels, Tests Grouped by Type
All Interventions Word-level interventions Failure Free Reading Spell Read Wilson Reading Corrective Reading
Wilson Reading Corrective ReadingAll Interventions Word-level interventions Failure Free Reading Spell Read

D-24
Grade 3 Unadj. Bonf. BH Unadj. Bonf. BH Unadj. Bonf. BH Unadj. Bonf. BH Unadj. Bonf. BH Unadj. Bonf. BH
Word Attack * * * * * * * *TOWRE PDE
Word Identification *TOWRE SWE * * * *Aimsweb
Passage ComprehensionGRADE *
Grade 5 Unadj. Bonf. BH Unadj. Bonf. BH Unadj. Bonf. BH Unadj. Bonf. BH Unadj. Bonf. BH Unadj. Bonf. BH
Word Attack * * * * * * * *TOWRE PDE * *
Word Identification * * * *TOWRE SWE * * * * * *Aimsweb
Passage ComprehensionGRADE
* Impact is statistically significant at the 0.05 level.
Note: "Unadj." is unadjusted p-values, "Bonf." refers to p-values adjusted using Bonferroni procedure, "BH" refers to p-values adjusted using Benjamini and Hochberg (1995) procedure.
Wilson Reading Corrective ReadingAll Interventions Word-level interventions Failure Free Reading Spell Read
Table D.8
3rd and 5th graders with Low Peabody Picture Vocabulary Test Scores: Comparison of Significance Levels, All Tests Grouped Together
All Interventions Word-level interventions Failure Free Reading Spell Read Wilson Reading Corrective Reading

D-24
Grade 3 Unadj. Bonf. BH Unadj. Bonf. BH Unadj. Bonf. BH Unadj. Bonf. BH Unadj. Bonf. BH Unadj. Bonf. BH
Word Attack * * * * * * * * * * * *TOWRE PDE * * * * *
Word Identification * * * * * * *TOWRE SWE * *Aimsweb * * * * * * * * *
Passage ComprehensionGRADE *
Grade 5 Unadj. Bonf. BH Unadj. Bonf. BH Unadj. Bonf. BH Unadj. Bonf. BH Unadj. Bonf. BH Unadj. Bonf. BH
Word Attack * * * * * * * * *TOWRE PDE * * *
Word IdentificationTOWRE SWEAimsweb
Passage Comprehension * * * * *GRADE
* Impact is statistically significant at the 0.05 level.
Note: "Unadj." is unadjusted p-values, "Bonf." refers to p-values adjusted using Bonferroni procedure, "BH" refers to p-values adjusted using Benjamini and Hochberg (1995) procedure.
Wilson Reading Corrective ReadingAll Interventions Word-level interventions Failure Free Reading Spell Read
Table D.9
3rd and 5th graders with High Peabody Picture Vocabulary Test Scores: Comparison of Significance Levels, Tests Grouped by Type
All Interventions Word-level interventions Failure Free Reading Spell Read Wilson Reading Corrective Reading

D-24
Grade 3 Unadj. Bonf. BH Unadj. Bonf. BH Unadj. Bonf. BH Unadj. Bonf. BH Unadj. Bonf. BH Unadj. Bonf. BH
Word Attack * * * * * * * * * * * *TOWRE PDE * * * *
Word Identification * * * * *TOWRE SWE * *Aimsweb * * * * * * * * *
Passage ComprehensionGRADE *
Grade 5 Unadj. Bonf. BH Unadj. Bonf. BH Unadj. Bonf. BH Unadj. Bonf. BH Unadj. Bonf. BH Unadj. Bonf. BH
Word Attack * * * * * * * * *TOWRE PDE * * *
Word IdentificationTOWRE SWEAimsweb
Passage Comprehension * * *GRADE
* Impact is statistically significant at the 0.05 level.
Note: "Unadj." is unadjusted p-values, "Bonf." refers to p-values adjusted using Bonferroni procedure, "BH" refers to p-values adjusted using Benjamini and Hochberg (1995) procedure.
Table D.10
3rd and 5th graders with High Peabody Picture Vocabulary Test Scores: Comparison of Significance Levels, All Tests Grouped Together
All Interventions Word-level interventions Failure Free Reading Spell Read Wilson Reading Corrective Reading
Wilson Reading Corrective ReadingAll Interventions Word-level interventions Failure Free Reading Spell Read

D-24
Grade 3 Unadj. Bonf. BH Unadj. Bonf. BH Unadj. Bonf. BH Unadj. Bonf. BH Unadj. Bonf. BH Unadj. Bonf. BH
Word Attack * * *TOWRE PDE
Word IdentificationTOWRE SWEAimsweb
Passage ComprehensionGRADE * *
Grade 5 Unadj. Bonf. BH Unadj. Bonf. BH Unadj. Bonf. BH Unadj. Bonf. BH Unadj. Bonf. BH Unadj. Bonf. BH
Word Attack * * * * * *TOWRE PDE * * * * * *
Word IdentificationTOWRE SWE *Aimsweb
Passage ComprehensionGRADE
* Impact is statistically significant at the 0.05 level.
Note: "Unadj." is unadjusted p-values, "Bonf." refers to p-values adjusted using Bonferroni procedure, "BH" refers to p-values adjusted using Benjamini and Hochberg (1995) procedure.
Table D.11
3rd and 5th graders with Low PPVT and Low Word Attack Test Scores: Comparison of Significance Levels, Tests Grouped by Type
All Interventions Word-level interventions Failure Free Reading Spell Read Wilson Reading Corrective Reading
Wilson Reading Corrective ReadingAll Interventions Word-level interventions Failure Free Reading Spell Read

D-24
Grade 3 Unadj. Bonf. BH Unadj. Bonf. BH Unadj. Bonf. BH Unadj. Bonf. BH Unadj. Bonf. BH Unadj. Bonf. BH
Word Attack *TOWRE PDE
Word IdentificationTOWRE SWEAimsweb
Passage ComprehensionGRADE * *
Grade 5 Unadj. Bonf. BH Unadj. Bonf. BH Unadj. Bonf. BH Unadj. Bonf. BH Unadj. Bonf. BH Unadj. Bonf. BH
Word Attack * * * *TOWRE PDE * *
Word IdentificationTOWRE SWE *Aimsweb
Passage ComprehensionGRADE
* Impact is statistically significant at the 0.05 level.
Note: "Unadj." is unadjusted p-values, "Bonf." refers to p-values adjusted using Bonferroni procedure, "BH" refers to p-values adjusted using Benjamini and Hochberg (1995) procedure.
Wilson Reading Corrective ReadingAll Interventions Word-level interventions Failure Free Reading Spell Read
Table D.12
3rd and 5th graders with Low PPVT and Low Word Attack Test Scores: Comparison of Significance Levels, All Tests Grouped Together
All Interventions Word-level interventions Failure Free Reading Spell Read Wilson Reading Corrective Reading

D-24
Grade 3 Unadj. Bonf. BH Unadj. Bonf. BH Unadj. Bonf. BH Unadj. Bonf. BH Unadj. Bonf. BH Unadj. Bonf. BH
Word Attack * * * *TOWRE PDE * * *
Word Identification *TOWRE SWEAimsweb
Passage ComprehensionGRADE * * * * * * * * *
Grade 5 Unadj. Bonf. BH Unadj. Bonf. BH Unadj. Bonf. BH Unadj. Bonf. BH Unadj. Bonf. BH Unadj. Bonf. BH
Word Attack * * * * * * * * *TOWRE PDE * * *
Word IdentificationTOWRE SWEAimsweb
Passage ComprehensionGRADE
* Impact is statistically significant at the 0.05 level.
Note: "Unadj." is unadjusted p-values, "Bonf." refers to p-values adjusted using Bonferroni procedure, "BH" refers to p-values adjusted using Benjamini and Hochberg (1995) procedure.
Wilson Reading Corrective ReadingAll Interventions Word-level interventions Failure Free Reading Spell Read
Table D.13
3rd and 5th graders with High PPVT and Low Word Attack Test Scores: Comparison of Significance Levels, Tests Grouped by Type
All Interventions Word-level interventions Failure Free Reading Spell Read Wilson Reading Corrective Reading

D-24
Grade 3 Unadj. Bonf. BH Unadj. Bonf. BH Unadj. Bonf. BH Unadj. Bonf. BH Unadj. Bonf. BH Unadj. Bonf. BH
Word Attack * * * *TOWRE PDE *
Word Identification *TOWRE SWEAimsweb
Passage ComprehensionGRADE * * * * *
Grade 5 Unadj. Bonf. BH Unadj. Bonf. BH Unadj. Bonf. BH Unadj. Bonf. BH Unadj. Bonf. BH Unadj. Bonf. BH
Word Attack * * * * * * *TOWRE PDE * * *
Word IdentificationTOWRE SWEAimsweb
Passage ComprehensionGRADE
* Impact is statistically significant at the 0.05 level.
Note: "Unadj." is unadjusted p-values, "Bonf." refers to p-values adjusted using Bonferroni procedure, "BH" refers to p-values adjusted using Benjamini and Hochberg (1995) procedure.
Table D.14
3rd and 5th graders with High PPVT and Low Word Attack Test Scores: Comparison of Significance Levels, All Tests Grouped Together
All Interventions Word-level interventions Failure Free Reading Spell Read Wilson Reading Corrective Reading
Wilson Reading Corrective ReadingAll Interventions Word-level interventions Failure Free Reading Spell Read
D-24
Grade 3 Unadj. Bonf. BH Unadj. Bonf. BH Unadj. Bonf. BH Unadj. Bonf. BH Unadj. Bonf. BH Unadj. Bonf. BH
Word Attack * * * * * * * * * * *TOWRE PDE * * *
Word IdentificationTOWRE SWEAimsweb
Passage Comprehension * * * *GRADE
Grade 5 Unadj. Bonf. BH Unadj. Bonf. BH Unadj. Bonf. BH Unadj. Bonf. BH Unadj. Bonf. BH Unadj. Bonf. BH
Word Attack * * * * *TOWRE PDE * * * * * *
Word IdentificationTOWRE SWEAimsweb
Passage ComprehensionGRADE
* Impact is statistically significant at the 0.05 level.
Note: "Unadj." is unadjusted p-values, "Bonf." refers to p-values adjusted using Bonferroni procedure, "BH" refers to p-values adjusted using Benjamini and Hochberg (1995) procedure.
Table D.15
3rd and 5th graders with High PPVT and High Word Attack Test Scores: Comparison of Significance Levels, Tests Grouped by Type
All Interventions Word-level interventions Failure Free Reading Spell Read Wilson Reading Corrective Reading
Wilson Reading Corrective ReadingAll Interventions Word-level interventions Failure Free Reading Spell Read
D-24
Grade 3 Unadj. Bonf. BH Unadj. Bonf. BH Unadj. Bonf. BH Unadj. Bonf. BH Unadj. Bonf. BH Unadj. Bonf. BH
Word Attack * * * * * * * * * * *TOWRE PDE *
Word IdentificationTOWRE SWEAimsweb
Passage Comprehension * * * *GRADE
Grade 5 Unadj. Bonf. BH Unadj. Bonf. BH Unadj. Bonf. BH Unadj. Bonf. BH Unadj. Bonf. BH Unadj. Bonf. BH
Word Attack * * *TOWRE PDE * *
Word IdentificationTOWRE SWEAimsweb
Passage ComprehensionGRADE
* Impact is statistically significant at the 0.05 level.
Note: "Unadj." is unadjusted p-values, "Bonf." refers to p-values adjusted using Bonferroni procedure, "BH" refers to p-values adjusted using Benjamini and Hochberg (1995) procedure.
Wilson Reading Corrective ReadingAll Interventions Word-level interventions Failure Free Reading Spell Read
Table D.16
3rd and 5th graders with High PPVT and High Word Attack Test Scores: Comparison of Significance Levels, All Tests Grouped Together
All Interventions Word-level interventions Failure Free Reading Spell Read Wilson Reading Corrective Reading

D-24
Grade 3 Unadj. Bonf. BH Unadj. Bonf. BH Unadj. Bonf. BH Unadj. Bonf. BH Unadj. Bonf. BH Unadj. Bonf. BH
Word Attack * * * * * * * * * *TOWRE PDE * *
Word IdentificationTOWRE SWEAimsweb
Passage ComprehensionGRADE
Grade 5 Unadj. Bonf. BH Unadj. Bonf. BH Unadj. Bonf. BH Unadj. Bonf. BH Unadj. Bonf. BH Unadj. Bonf. BH
Word AttackTOWRE PDE
Word Identification *TOWRE SWE * * * * * * * * * *Aimsweb *
Passage ComprehensionGRADE * *
* Impact is statistically significant at the 0.05 level.
Note: "Unadj." is unadjusted p-values, "Bonf." refers to p-values adjusted using Bonferroni procedure, "BH" refers to p-values adjusted using Benjamini and Hochberg (1995) procedure.
Wilson Reading Corrective ReadingAll Interventions Word-level interventions Failure Free Reading Spell Read
Table D.17
3rd and 5th graders Eligible for FRPL: Comparison of Significance Levels, Tests Grouped by Type
All Interventions Word-level interventions Failure Free Reading Spell Read Wilson Reading Corrective Reading

D-24
Grade 3 Unadj. Bonf. BH Unadj. Bonf. BH Unadj. Bonf. BH Unadj. Bonf. BH Unadj. Bonf. BH Unadj. Bonf. BH
Word Attack * * * * * * * *TOWRE PDE *
Word IdentificationTOWRE SWEAimsweb
Passage ComprehensionGRADE
Grade 5 Unadj. Bonf. BH Unadj. Bonf. BH Unadj. Bonf. BH Unadj. Bonf. BH Unadj. Bonf. BH Unadj. Bonf. BH
Word AttackTOWRE PDE
Word Identification *TOWRE SWE * * * * * * * *Aimsweb *
Passage ComprehensionGRADE * *
* Impact is statistically significant at the 0.05 level.
Note: "Unadj." is unadjusted p-values, "Bonf." refers to p-values adjusted using Bonferroni procedure, "BH" refers to p-values adjusted using Benjamini and Hochberg (1995) procedure.
Table D.18
3rd and 5th graders Eligible for FRPL: Comparison of Significance Levels, All Tests Grouped Together
All Interventions Word-level interventions Failure Free Reading Spell Read Wilson Reading Corrective Reading
Wilson Reading Corrective ReadingAll Interventions Word-level interventions Failure Free Reading Spell Read

D-24
Grade 3 Unadj. Bonf. BH Unadj. Bonf. BH Unadj. Bonf. BH Unadj. Bonf. BH Unadj. Bonf. BH Unadj. Bonf. BH
Word Attack * * * * * * * * * * * *TOWRE PDE * * * * * * * * * * * *
Word Identification * * * * * *TOWRE SWE * * * * * * * * *Aimsweb * * * * * * *
Passage Comprehension * * * * * * * * *GRADE * * * * * * * * *
Grade 5 Unadj. Bonf. BH Unadj. Bonf. BH Unadj. Bonf. BH Unadj. Bonf. BH Unadj. Bonf. BH Unadj. Bonf. BH
Word Attack * * * * * * * * *TOWRE PDE * * *
Word IdentificationTOWRE SWEAimsweb
Passage Comprehension *GRADE
* Impact is statistically significant at the 0.05 level.
Note: "Unadj." is unadjusted p-values, "Bonf." refers to p-values adjusted using Bonferroni procedure, "BH" refers to p-values adjusted using Benjamini and Hochberg (1995) procedure.
Table D.19
3rd and 5th graders Ineligible for FRPL: Comparison of Significance Levels, Tests Grouped by Type
All Interventions Word-level interventions Failure Free Reading Spell Read Wilson Reading Corrective Reading
Wilson Reading Corrective ReadingAll Interventions Word-level interventions Failure Free Reading Spell Read

D-24
Grade 3 Unadj. Bonf. BH Unadj. Bonf. BH Unadj. Bonf. BH Unadj. Bonf. BH Unadj. Bonf. BH Unadj. Bonf. BH
Word Attack * * * * * * * * * * * *TOWRE PDE * * * * * * * * * * * *
Word Identification * * * *TOWRE SWE * * * * * * *Aimsweb * * * * *
Passage Comprehension * * * * * * * *GRADE * * * * * * * *
Grade 5 Unadj. Bonf. BH Unadj. Bonf. BH Unadj. Bonf. BH Unadj. Bonf. BH Unadj. Bonf. BH Unadj. Bonf. BH
Word Attack * * * * * * * * *TOWRE PDE *
Word IdentificationTOWRE SWEAimsweb
Passage Comprehension *GRADE
* Impact is statistically significant at the 0.05 level.
Note: "Unadj." is unadjusted p-values, "Bonf." refers to p-values adjusted using Bonferroni procedure, "BH" refers to p-values adjusted using Benjamini and Hochberg (1995) procedure.
Wilson Reading Corrective ReadingAll Interventions Word-level interventions Failure Free Reading Spell Read
Table D.20
3rd and 5th graders Ineligible for FRPL: Comparison of Significance Levels, All Tests Grouped Together
All Interventions Word-level interventions Failure Free Reading Spell Read Wilson Reading Corrective Reading


APPENDIX E
INTERVENTION IMPACTS ON SPELLING AND CALCULATION


E-5
Control Control Control Control Control ControlGrade 3 Baseline Gain Gain Gain Gain Gain Gain
WJ-III Spelling 88.6 1.8 1.6 2.4 0.9 0.1 3.8 * 1.1 1.8 2.7 -0.2 3.3 0.9WJ-III Calculation 95.4 0.0 3.4 * 0.8 2.8 -2.4 5.2 1.6 2.3 -0.3 0.7 1.2 5.6
Sample Size 335
Control Control Control Control Control ControlGrade 5 Baseline Gain Gain Gain Gain Gain Gain
WJ-III Spelling 90.8 0.1 1.0 -0.1 1.1 0.5 0.7 -0.6 1.6 -0.1 0.9 0.4 0.7WJ-III Calculation 94.6 5.3 -0.3 # 4.5 0.4 7.7 -2.2 # 4.8 0.6 2.1 1.8 6.5 -1.3
Sample Size 407
* Impact is statistically significant at the 0.05 level.
# Impact is statistically different from the 3rd grade impact at the 0.05 level.
Impact ImpactImpact Impact Impact ImpactC D
All Interventions Word-level interventionsABCD BCD A B
Failure Free Reading Spell Read
C DImpact Impact
Wilson Reading Corrective Reading
Impact Impact Impact ImpactABCD BCD A B
Table E.1
Impacts for 3rd and 5th Graders
All Interventions Word-level interventions Failure Free Reading Spell Read Wilson Reading Corrective Reading

E-5
Control Control Control Control Control ControlGrade 3 Baseline Gain Gain Gain Gain Gain Gain
WJ-III Spelling 83.1 3.9 -0.3 4.5 -1.1 2.0 1.8 # 2.4 1.0 5.3 -2.5 5.9 -1.6WJ-III Calculation 92.0 -0.7 4.3 * -0.3 5.1 * # -1.7 2.1 3.7 0.2 -6.7 8.0 * # 1.9 7.0
Sample Size 173
Control Control Control Control Control ControlGrade 5 Baseline Gain Gain Gain Gain Gain Gain
WJ-III Spelling 85.9 -0.6 2.6 -1.1 3.0 0.9 1.3 -2.6 5.2 0.4 1.4 -1.0 2.4WJ-III Calculation 92.7 4.7 0.5 3.8 1.0 7.2 -1.1 1.7 3.8 1.9 1.7 7.8 -2.4
Sample Size 201
* Impact is statistically significant at the 0.05 level.
# Impact is statistically different from overall impact for that grade at the 0.05 level.
Impact ImpactImpact Impact Impact ImpactC D
All Interventions Word-level interventionsABCD BCD A B
Failure Free Reading Spell Read
C DImpact Impact
Wilson Reading Corrective Reading
Impact Impact Impact ImpactABCD BCD A B
Table E.2
Impacts for 3rd and 5th Graders with Low Baseline Word Attack Scores
All Interventions Word-level interventions Failure Free Reading Spell Read Wilson Reading Corrective Reading
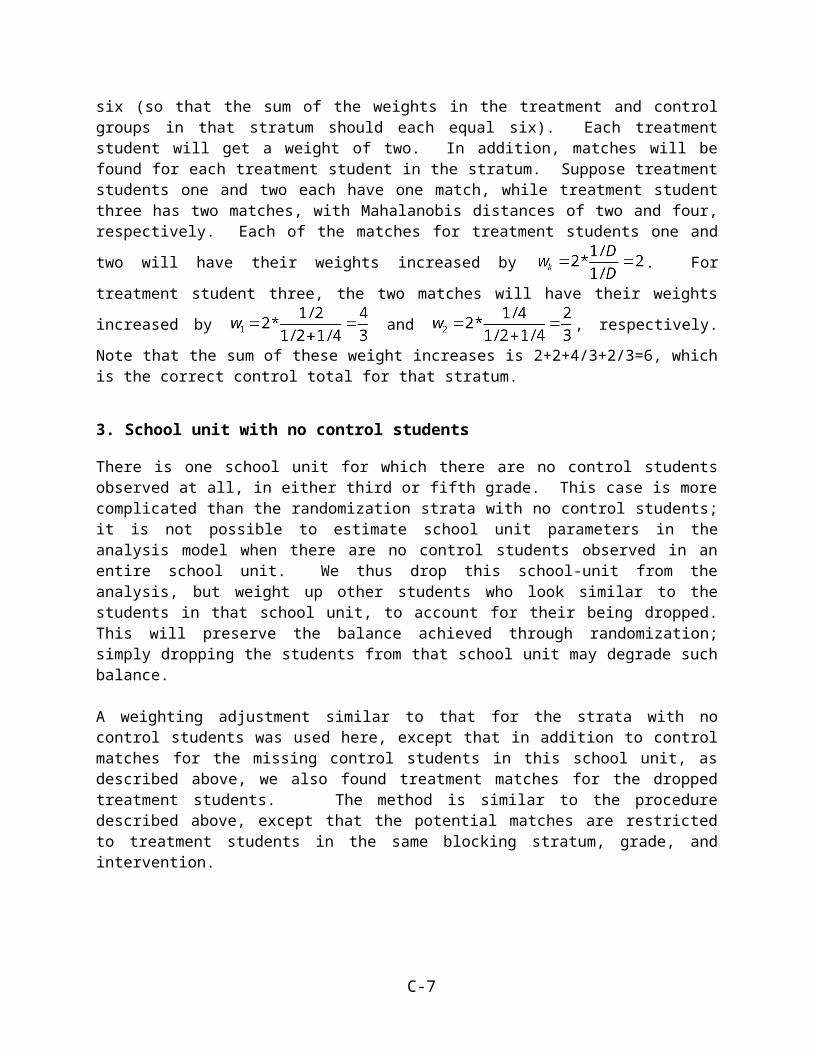
E-5
Control Control Control Control Control ControlGrade 3 Baseline Gain Gain Gain Gain Gain Gain
WJ-III Spelling 94.4 0.5 2.8 2.2 0.2 -4.5 10.7 * # 1.0 0.5 2.0 -0.4 3.6 0.6WJ-III Calculation 98.9 3.7 0.0 4.1 -1.6 # 2.5 4.8 -0.2 4.1 7.7 -8.1 * # 4.8 -0.6
Sample Size 162
Control Control Control Control Control ControlGrade 5 Baseline Gain Gain Gain Gain Gain Gain
WJ-III Spelling 95.6 1.3 -1.1 1.3 -1.4 1.2 -0.2 2.1 -2.3 0.6 -0.4 1.3 -1.5WJ-III Calculation 96.4 5.9 -1.0 5.4 -0.5 7.2 -2.5 8.3 -2.8 3.1 1.2 4.9 0.0
Sample Size 206
* Impact is statistically significant at the 0.05 level.
# Impact is statistically different from overall impact for that grade at the 0.05 level.
Table E.3
Impacts for 3rd and 5th Graders with High Baseline Word Attack Scores
All Interventions Word-level interventions Failure Free Reading Spell Read Wilson Reading Corrective ReadingABCD BCD A B
Wilson Reading Corrective Reading
Impact Impact Impact ImpactC D
Impact Impact
C DAll Interventions Word-level interventions
ABCD BCD A BFailure Free Reading Spell Read
Impact ImpactImpact Impact Impact Impact

E-5
Control Control Control Control Control ControlGrade 3 Baseline Gain Gain Gain Gain Gain Gain
WJ-III Spelling 87.7 2.1 1.4 3.4 0.2 -1.8 5.0 2.7 1.6 4.1 -0.2 3.3 -0.8WJ-III Calculation 93.4 -0.3 3.4 0.3 2.6 -2.1 5.6 4.6 -1.5 -3.5 1.9 -0.3 7.5
Sample Size 148
Control Control Control Control Control ControlGrade 5 Baseline Gain Gain Gain Gain Gain Gain
WJ-III Spelling 89.2 1.6 -0.9 1.2 -0.5 3.0 -2.0 4.3 -2.1 1.8 -1.9 -2.6 2.4WJ-III Calculation 92.8 4.9 0.9 3.8 1.8 8.2 -1.7 4.4 2.7 2.5 2.7 4.7 0.0
Sample Size 200
* Impact is statistically significant at the 0.05 level.
# Impact is statistically different from overall impact for that grade at the 0.05 level.
Impact ImpactImpact Impact Impact ImpactC D
All Interventions Word-level interventionsABCD BCD A B
Failure Free Reading Spell Read
C DImpact Impact
Wilson Reading Corrective Reading
Impact Impact Impact ImpactABCD BCD A B
Table E.4
Impacts for 3rd and 5th Graders with Low Screening Peabody Picture Vocabulary Test Scores
All Interventions Word-level interventions Failure Free Reading Spell Read Wilson Reading Corrective Reading

E-5
Control Control Control Control Control ControlGrade 3 Baseline Gain Gain Gain Gain Gain Gain
WJ-III Spelling 89.3 1.6 1.5 2.0 0.7 0.5 4.0 0.8 1.4 0.7 0.0 4.5 0.7WJ-III Calculation 96.9 1.6 1.2 2.7 0.6 -1.6 3.2 1.0 2.3 1.3 -0.2 5.8 -0.5
Sample Size 187
Control Control Control Control Control ControlGrade 5 Baseline Gain Gain Gain Gain Gain Gain
WJ-III Spelling 92.0 -1.1 1.9 -1.4 2.0 0.0 1.4 -4.1 3.1 -0.9 2.3 0.6 0.6WJ-III Calculation 96.1 5.7 -1.0 5.3 -0.5 7.1 -2.7 6.0 -0.6 2.5 1.9 7.2 -2.6
Sample Size 207
* Impact is statistically significant at the 0.05 level.
# Impact is statistically different from overall impact for that grade at the 0.05 level.
Impact ImpactImpact Impact Impact ImpactC D
All Interventions Word-level interventionsABCD BCD A B
Failure Free Reading Spell Read
C DImpact Impact
Wilson Reading Corrective Reading
Impact Impact Impact ImpactABCD BCD A B
Table E.5
Impacts for 3rd and 5th Graders with High Screening Peabody Picture Vocabulary Test Scores
All Interventions Word-level interventions Failure Free Reading Spell Read Wilson Reading Corrective Reading

E-5
Control Control Control Control Control ControlGrade 3 Baseline Gain Gain Gain Gain Gain Gain
WJ-III Spelling 83.0 5.2 -0.7 5.2 -1.1 5.1 0.5 1.0 4.2 9.4 -3.4 5.3 -4.1WJ-III Calculation 89.8 -0.3 4.5 1.1 3.9 -4.5 6.6 11.1 -8.8 # -6.0 7.2 -1.8 13.2 *
Sample Size 81
Control Control Control Control Control ControlGrade 5 Baseline Gain Gain Gain Gain Gain Gain
WJ-III Spelling 84.3 0.7 0.5 -0.1 1.1 3.2 -1.4 1.6 1.1 1.2 -2.1 -3.0 4.2WJ-III Calculation 90.2 7.0 -2.8 6.6 -3.1 8.1 -2.2 3.8 2.0 5.1 -3.7 11.0 -7.5
Sample Size 111
* Impact is statistically significant at the 0.05 level.
# Impact is statistically different from overall impact for that grade at the 0.05 level.
Impact ImpactImpact Impact Impact ImpactC D
All Interventions Word-level interventionsABCD BCD A B
Failure Free Reading Spell Read
C DImpact Impact
Wilson Reading Corrective Reading
Impact Impact Impact ImpactABCD BCD A B
Table E.6
Impacts for 3rd and 5th Graders with Low Baseline Word Attack and Low Screening Peabody Picture Vocabulary Test Scores
All Interventions Word-level interventions Failure Free Reading Spell Read Wilson Reading Corrective Reading

E-5
Control Control Control Control Control ControlGrade 3 Baseline Gain Gain Gain Gain Gain Gain
WJ-III Spelling 83.2 4.0 -0.3 5.0 -1.1 1.3 2.3 2.6 0.4 2.4 -0.1 9.9 -3.7WJ-III Calculation 93.9 0.9 1.0 0.6 3.0 1.6 -5.0 # 1.2 2.6 -8.9 8.4 9.5 -2.1
Sample Size 92
Control Control Control Control Control ControlGrade 5 Baseline Gain Gain Gain Gain Gain Gain
WJ-III Spelling 87.4 -1.5 3.1 -2.1 3.6 0.2 1.6 -3.6 5.1 -1.4 4.9 -1.3 0.8WJ-III Calculation 95.2 3.9 1.0 3.0 2.1 6.7 -2.2 1.3 5.3 1.1 3.7 6.5 -2.7
Sample Size 90
* Impact is statistically significant at the 0.05 level.
# Impact is statistically different from overall impact for that grade at the 0.05 level.
Impact ImpactImpact Impact Impact ImpactC D
All Interventions Word-level interventionsABCD BCD A B
Failure Free Reading Spell Read
C DImpact Impact
Wilson Reading Corrective Reading
Impact Impact Impact ImpactABCD BCD A B
Table E.7
Impacts for 3rd and 5th Graders with Low Baseline Word Attack and High Screening Peabody Picture Vocabulary Test Scores
All Interventions Word-level interventions Failure Free Reading Spell Read Wilson Reading Corrective Reading

E-5
Control Control Control Control Control ControlGrade 3 Baseline Gain Gain Gain Gain Gain Gain
WJ-III Spelling 95.1 1.2 0.8 1.2 -0.6 1.1 5.2 -0.2 1.0 0.7 -2.5 3.2 -0.5WJ-III Calculation 99.7 4.5 -0.5 5.9 -3.3 # 0.4 7.9 2.4 0.2 13.8 -11.8 # 1.5 1.7
Sample Size 95
Control Control Control Control Control ControlGrade 5 Baseline Gain Gain Gain Gain Gain Gain
WJ-III Spelling 95.9 0.5 0.2 0.5 0.1 0.8 0.4 -2.0 0.0 1.0 1.2 2.5 -0.9WJ-III Calculation 96.8 7.4 -3.0 6.9 -2.4 9.0 -4.7 13.0 -9.4 * # 1.0 3.3 6.6 -1.2
Sample Size 117
* Impact is statistically significant at the 0.05 level.
# Impact is statistically different from overall impact for that grade at the 0.05 level.
Impact ImpactImpact Impact Impact ImpactC D
All Interventions Word-level interventionsABCD BCD A B
Failure Free Reading Spell Read
C DImpact Impact
Wilson Reading Corrective Reading
Impact Impact Impact ImpactABCD BCD A B
Table E.8
Impacts for 3rd and 5th Graders with High Baseline Word Attack and High Screening Peabody Picture Vocabulary Test Scores
All Interventions Word-level interventions Failure Free Reading Spell Read Wilson Reading Corrective Reading

E-5
Control Control Control Control Control ControlGrade 3 Baseline Gain Gain Gain Gain Gain Gain
WJ-III Spelling 88.0 1.5 0.7 3.0 -0.6 -2.8 4.6 2.3 -0.5 2.9 0.2 3.7 -1.3WJ-III Calculation 95.2 -0.3 1.9 1.3 0.4 -5.2 6.4 0.4 0.7 2.0 -4.2 1.4 4.6
Sample Size 193
Control Control Control Control Control ControlGrade 5 Baseline Gain Gain Gain Gain Gain Gain
WJ-III Spelling 89.1 2.2 -1.7 # 2.3 -1.9 1.9 -1.0 4.3 -2.3 # 1.9 -2.4 0.8 -1.0WJ-III Calculation 93.4 8.4 -5.5 * # 7.6 -5.1 * # 10.5 -6.7 * 8.9 -6.1 # 5.1 -3.3 8.9 -6.0
Sample Size 230
* Impact is statistically significant at the 0.05 level.
# Impact is statistically different from overall impact for that grade at the 0.05 level.
Impact ImpactImpact Impact Impact ImpactC D
All Interventions Word-level interventionsABCD BCD A B
Failure Free Reading Spell Read
C DImpact Impact
Wilson Reading Corrective Reading
Impact Impact Impact ImpactABCD BCD A B
Table E.9
Impacts for 3rd and 5th Graders Eligible for FRPL
All Interventions Word-level interventions Failure Free Reading Spell Read Wilson Reading Corrective Reading

E-5
Control Control Control Control Control ControlGrade 3 Baseline Gain Gain Gain Gain Gain Gain
WJ-III Spelling 89.5 2.3 1.0 1.8 0.7 3.6 1.8 1.0 1.5 0.6 -0.4 3.9 0.9WJ-III Calculation 95.6 1.4 3.1 0.8 3.5 3.2 1.8 3.7 1.7 -6.1 6.7 4.8 2.0
Sample Size 142
Control Control Control Control Control ControlGrade 5 Baseline Gain Gain Gain Gain Gain Gain
WJ-III Spelling 92.7 -1.2 2.1 # -1.4 2.1 -0.8 2.1 -4.0 4.4 # -1.4 3.0 1.3 -0.9WJ-III Calculation 95.9 3.0 3.1 # 2.1 4.2 * # 5.5 -0.3 2.5 5.1 # -0.5 6.2 4.3 1.5
Sample Size 177
* Impact is statistically significant at the 0.05 level.
# Impact is statistically different from overall impact for that grade at the 0.05 level.
Impact ImpactImpact Impact Impact ImpactC D
All Interventions Word-level interventionsABCD BCD A B
Failure Free Reading Spell Read
C DImpact Impact
Wilson Reading Corrective Reading
Impact Impact Impact ImpactABCD BCD A B
Table E.10
Impacts for 3rd and 5th Graders Ineligible for FRPL
All Interventions Word-level interventions Failure Free Reading Spell Read Wilson Reading Corrective Reading

E-13
Grade 3 Test p Test p Test p Test p Test p Test p
WJ-III Spelling 3.33 0.06 0.72 0.50 5.51 0.02 1.33 0.25 0.01 0.50 0.27 0.50WJ-III Calculation 4.70 0.03 2.41 0.12 3.26 0.07 0.61 0.50 0.04 0.50 3.00 0.08
Grade 5 Test p Test p Test p Test p Test p Test p
WJ-III Spelling 1.37 0.24 1.21 0.27 0.22 0.50 0.96 0.50 0.31 0.50 0.19 0.50WJ-III Calculation 0.05 0.50 0.06 0.50 0.93 0.50 0.06 0.50 0.54 0.50 0.30 0.50
Note: "Test" refers to the Chi-Square test statistic for a general linear hypothesis test (Wald Test) with 1 degree of freedom."p " is the p -value produced by HLM5 software and is automatically set to 0.5 for values that exceed 0.5.
ABCD BCD A Binterventions interventions Reading Read
C DA BReading Read Reading Reading
Table E.11
Test Statistics and P-values of Impacts for 3rd and 5th Graders
All Word-level Failure Free Spell Wilson Correctiveinterventions interventions
All Word-level
ABCD BCD
Failure Free Spell Wilson CorrectiveReading Reading
C D

E-14
Grade 3 Test p Test p Test p Test p Test p Test p
WJ-III Spelling 0.07 0.50 0.46 0.50 0.61 0.50 0.18 0.50 0.77 0.50 0.36 0.50WJ-III Calculation 5.90 0.01 5.76 0.02 0.54 0.50 0.00 0.50 3.82 0.05 3.40 0.06
Grade 5 Test p Test p Test p Test p Test p Test p
WJ-III Spelling 2.68 0.10 2.73 0.09 0.19 0.50 3.34 0.06 0.19 0.50 0.61 0.50WJ-III Calculation 0.07 0.50 0.22 0.50 0.09 0.50 1.21 0.27 0.19 0.50 0.40 0.50
Note: "Test" refers to the Chi-Square test statistic for a general linear hypothesis test (Wald Test) with 1 degree of freedom."p " is the p -value produced by HLM5 software and is automatically set to 0.5 for values that exceed 0.5.
ABCD BCD A Binterventions interventions Reading Read
C DA BReading Read Reading Reading
Table E.12
Test Statistics and P-values of Impacts for 3rd and 5th Graders with Low Baseline Word Attack Scores
All Word-level Failure Free Spell Wilson Correctiveinterventions interventions
All Word-level
ABCD BCD
Failure Free Spell Wilson CorrectiveReading Reading
C D

E-15
Grade 3 Test p Test p Test p Test p Test p Test p
WJ-III Spelling 2.85 0.09 0.02 0.50 10.99 0.00 0.04 0.50 0.01 0.50 0.03 0.50WJ-III Calculation 0.00 0.50 0.49 0.50 1.62 0.20 1.65 0.20 4.24 0.04 0.03 0.50
Grade 5 Test p Test p Test p Test p Test p Test p
WJ-III Spelling 0.69 0.50 0.84 0.50 0.00 0.50 0.80 0.50 0.02 0.50 0.36 0.50WJ-III Calculation 0.34 0.50 0.07 0.50 0.56 0.50 0.68 0.50 0.11 0.50 0.00 0.50
Note: "Test" refers to the Chi-Square test statistic for a general linear hypothesis test (Wald Test) with 1 degree of freedom."p " is the p -value produced by HLM5 software and is automatically set to 0.5 for values that exceed 0.5.
Table E.13
Test Statistics and P-values of Impacts for 3rd and 5th Graders with High Baseline Word Attack Scores
All Word-level Failure Free Spell Wilson Correctiveinterventions interventions Reading Read
Wilson Corrective
ABCD BCD A BReading Reading
C D
Reading ReadingAll Word-level
interventions interventions Reading ReadFailure Free Spell
C DABCD BCD A B

E-16
Grade 3 Test p Test p Test p Test p Test p Test p
WJ-III Spelling 0.79 0.50 0.02 0.50 3.27 0.07 0.38 0.50 0.01 0.50 0.08 0.50WJ-III Calculation 1.44 0.23 0.70 0.50 1.24 0.26 0.09 0.50 0.12 0.50 2.10 0.14
Grade 5 Test p Test p Test p Test p Test p Test p
WJ-III Spelling 0.17 0.50 0.04 0.50 0.38 0.50 0.44 0.50 0.21 0.50 0.34 0.50WJ-III Calculation 0.16 0.50 0.45 0.50 0.23 0.50 0.69 0.50 0.40 0.50 0.00 0.50
Note: "Test" refers to the Chi-Square test statistic for a general linear hypothesis test (Wald Test) with 1 degree of freedom."p " is the p -value produced by HLM5 software and is automatically set to 0.5 for values that exceed 0.5.
Reading ReadingC D
Failure Free Spell Wilson Corrective
interventions interventions
All Word-level
ABCD BCD
Table E.14
Test Statistics and P-values of Impacts for 3rd and 5th Graders with Low Peabody Picture Vocabular Test Scores
All Word-level Failure Free Spell Wilson CorrectiveReading Read Reading Reading
A B C D
interventions interventions Reading ReadABCD BCD A B

E-17
Grade 3 Test p Test p Test p Test p Test p Test p
WJ-III Spelling 1.62 0.20 0.25 0.50 3.33 0.06 0.42 0.50 0.00 0.50 0.08 0.50WJ-III Calculation 0.27 0.50 0.04 0.50 0.56 0.50 0.33 0.50 0.00 0.50 0.01 0.50
Grade 5 Test p Test p Test p Test p Test p Test p
WJ-III Spelling 2.96 0.08 2.42 0.12 0.54 0.50 1.70 0.19 0.92 0.50 0.10 0.50WJ-III Calculation 0.45 0.50 0.06 0.50 0.97 0.50 0.04 0.50 0.33 0.50 0.85 0.50
Note: "Test" refers to the Chi-Square test statistic for a general linear hypothesis test (Wald Test) with 1 degree of freedom."p " is the p -value produced by HLM5 software and is automatically set to 0.5 for values that exceed 0.5.
ABCD BCD A Binterventions interventions Reading Read
C DA BReading Read Reading Reading
Table E.15
Test Statistics and P -values of Impacts for 3rd and 5th Graders with High Screening Peabody Picture Vocabulary Test Scores
All Word-level Failure Free Spell Wilson Correctiveinterventions interventions
All Word-level
ABCD BCD
Failure Free Spell Wilson CorrectiveReading Reading
C D

E-18
Grade 3 Test p Test p Test p Test p Test p Test p
WJ-III Spelling 0.09 0.50 0.17 0.50 0.01 0.50 1.10 0.29 0.33 0.50 0.88 0.50WJ-III Calculation 2.15 0.14 1.21 0.27 1.65 0.20 2.91 0.08 0.90 0.50 5.18 0.02
Grade 5 Test p Test p Test p Test p Test p Test p
WJ-III Spelling 0.03 0.50 0.11 0.50 0.10 0.50 0.08 0.50 0.19 0.50 0.65 0.50WJ-III Calculation 0.86 0.50 0.69 0.50 0.20 0.50 0.20 0.50 0.45 0.50 1.63 0.20
Note: "Test" refers to the Chi-Square test statistic for a general linear hypothesis test (Wald Test) with 1 degree of freedom."p " is the p -value produced by HLM5 software and is automatically set to 0.5 for values that exceed 0.5.
Reading ReadingC D
Failure Free Spell Wilson Corrective
interventions interventions
All Word-level
ABCD BCD
Table E.16
Test Statistics and P -values of Impacts for 3rd and 5th Graders with Low Baseline Word Attack and Low Screening PPVT Test Scores
All Word-level Failure Free Spell Wilson CorrectiveReading Read Reading Reading
A B C D
interventions interventions Reading ReadABCD BCD A B

E-19
Grade 3 Test p Test p Test p Test p Test p Test p
WJ-III Spelling 0.01 0.50 0.16 0.50 0.33 0.50 0.01 0.50 0.00 0.50 0.50 0.50WJ-III Calculation 0.15 0.50 0.98 0.50 1.47 0.22 0.35 0.50 2.29 0.13 0.14 0.50
Grade 5 Test p Test p Test p Test p Test p Test p
WJ-III Spelling 2.75 0.09 2.76 0.09 0.21 0.50 2.03 0.15 1.44 0.23 0.05 0.50WJ-III Calculation 0.18 0.50 0.59 0.50 0.25 0.50 1.38 0.24 0.52 0.50 0.37 0.50
Note: "Test" refers to the Chi-Square test statistic for a general linear hypothesis test (Wald Test) with 1 degree of freedom."p " is the p -value produced by HLM5 software and is automatically set to 0.5 for values that exceed 0.5.
ABCD BCD A Binterventions interventions Reading Read
C DA BReading Read Reading Reading
Table E.17
Test Statistics and P -values of Impacts for 3rd and 5th Graders with Low Baseline Word Attack and High Screening PVVT Test Scores
All Word-level Failure Free Spell Wilson Correctiveinterventions interventions
All Word-level
ABCD BCD
Failure Free Spell Wilson CorrectiveReading Reading
C D
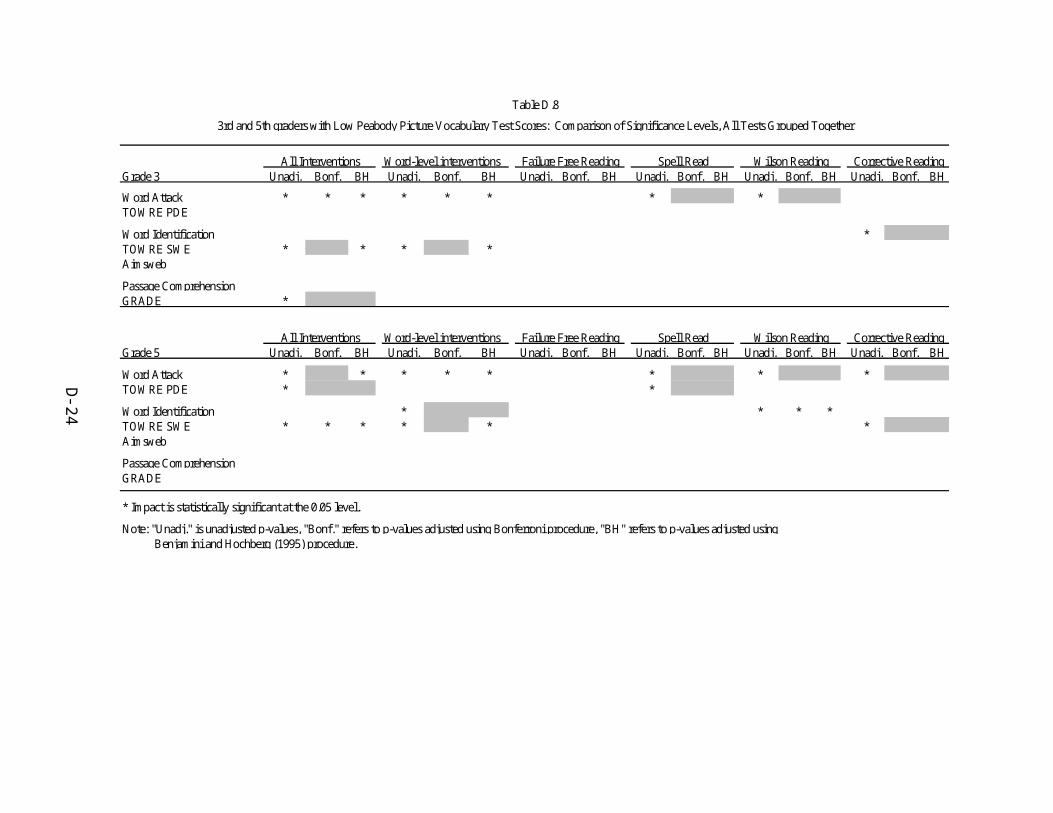
E-20
Grade 3 Test p Test p Test p Test p Test p Test p
WJ-III Spelling 0.20 0.50 0.08 0.50 2.41 0.12 0.12 0.50 0.33 0.50 0.02 0.50WJ-III Calculation 0.04 0.50 1.09 0.30 2.94 0.08 0.00 0.50 3.38 0.06 0.12 0.50
Grade 5 Test p Test p Test p Test p Test p Test p
WJ-III Spelling 0.01 0.50 0.00 0.50 0.02 0.50 0.00 0.50 0.07 0.50 0.07 0.50WJ-III Calculation 2.22 0.13 0.96 0.50 1.76 0.18 4.34 0.03 0.46 0.50 0.15 0.50
Note: "Test" refers to the Chi-Square test statistic for a general linear hypothesis test (Wald Test) with 1 degree of freedom."p " is the p -value produced by HLM5 software and is automatically set to 0.5 for values that exceed 0.5.
Reading ReadingC D
Failure Free Spell Wilson Corrective
interventions interventions
All Word-level
ABCD BCD
Table E.18
Test Statistics and P-values of Impacts for 3rd and 5th Graders with High Baseline Word Attack and High Screening PVVT Test Scores
All Word-level Failure Free Spell Wilson CorrectiveReading Read Reading Reading
A B C D
interventions interventions Reading ReadABCD BCD A B

E-21
Grade 3 Test p Test p Test p Test p Test p Test p
WJ-III Spelling 0.19 0.50 0.09 0.50 3.27 0.07 0.04 0.50 0.00 0.50 0.19 0.50WJ-III Calculation 0.68 0.50 0.02 0.50 3.65 0.05 0.04 0.50 1.64 0.20 1.36 0.24
Grade 5 Test p Test p Test p Test p Test p Test p
WJ-III Spelling 1.22 0.27 1.25 0.26 0.18 0.50 0.87 0.50 0.82 0.50 0.16 0.50WJ-III Calculation 7.89 0.01 5.33 0.02 4.64 0.03 3.50 0.06 0.82 0.50 3.23 0.07
Note: "Test" refers to the Chi-Square test statistic for a general linear hypothesis test (Wald Test) with 1 degree of freedom."p " is the p -value produced by HLM5 software and is automatically set to 0.5 for values that exceed 0.5.
ABCD BCD A Binterventions interventions Reading Read
C DA BReading Read Reading Reading
Table E.19
Test Statistics and P-values of Impacts for 3rd and 5th Graders Eligible for Free or Reduced Price School Lunch
All Word-level Failure Free Spell Wilson Correctiveinterventions interventions
All Word-level
ABCD BCD
Failure Free Spell Wilson CorrectiveReading Reading
C D

E-22
Grade 3 Test p Test p Test p Test p Test p Test p
WJ-III Spelling 0.31 0.50 0.10 0.50 0.55 0.50 0.40 0.50 0.00 0.50 0.13 0.50WJ-III Calculation 1.47 0.22 1.24 0.26 0.23 0.50 0.20 0.50 0.81 0.50 0.21 0.50
Grade 5 Test p Test p Test p Test p Test p Test p
WJ-III Spelling 3.00 0.08 2.20 0.13 0.73 0.50 3.57 0.06 1.15 0.28 0.14 0.50WJ-III Calculation 2.84 0.09 3.91 0.05 0.01 0.50 2.08 0.15 2.25 0.13 0.17 0.50
Note: "Test" refers to the Chi-Square test statistic for a general linear hypothesis test (Wald Test) with 1 degree of freedom."p " is the p -value produced by HLM5 software and is automatically set to 0.5 for values that exceed 0.5.
Reading ReadingC D
Failure Free Spell Wilson Corrective
interventions interventions
All Word-level
ABCD BCD
Table E.20
Test Statistics and P-values of Impacts for 3rd and 5th Graders not Eligible for Free or Reduced Price School Lunch
All Word-level Failure Free Spell Wilson CorrectiveReading Read Reading Reading
A B C D
interventions interventions Reading ReadABCD BCD A B

E-23
Test p Test p Test p Test p Test p Test p
WJ-III Spelling 0.24 0.50 0.02 0.50 1.78 0.18 0.01 0.50 0.20 0.50 0.01 0.50WJ-III Calculation 3.70 0.05 1.23 0.27 4.43 0.03 0.23 0.50 0.09 0.50 3.15 0.07
Note: "Test" refers to the Chi-Square test statistic for a general linear hypothesis test (Wald Test) with 1 degree of freedom."p " is the p -value produced by HLM5 software and is automatically set to 0.5 for values that exceed 0.5.
interventions interventionsABCD BCD
Table E.21
Tests for Differences in Impacts for 3rd and 5th Graders
All Word-level Failure Free Spell Wilson CorrectiveReading Read Reading Reading
C DA B

E-24
Grade 3 Test p Test p Test p Test p Test p Test p
WJ-III Spelling 1.98 0.16 0.24 0.50 4.55 0.03 0.01 0.50 0.20 0.50 0.24 0.50WJ-III Calculation 2.54 0.11 4.41 0.03 0.29 0.50 0.73 0.50 7.78 0.01 1.95 0.16
Grade 5 Test p Test p Test p Test p Test p Test p
WJ-III Spelling 2.29 0.13 2.48 0.11 0.10 0.50 2.72 0.10 0.13 0.50 0.67 0.50WJ-III Calculation 0.31 0.50 0.24 0.50 0.08 0.50 1.66 0.19 0.01 0.50 0.22 0.50
Note: "Test" refers to the Chi-Square test statistic for a general linear hypothesis test (Wald Test) with 1 degree of freedom."p " is the p -value produced by HLM5 software and is automatically set to 0.5 for values that exceed 0.5.
Impacts are compared to the impacts for all students in that grade.
Reading ReadingC D
Failure Free Spell Wilson Corrective
interventions interventions
All Word-level
ABCD BCD
Table E.22
Tests for Differences of Impacts for Students with Low Baseline Word Attack Test Scores
All Word-level Failure Free Spell Wilson CorrectiveReading Read Reading Reading
C DA B
interventions interventions Reading ReadABCD BCD A B

E-25
Grade 3 Test p Test p Test p Test p Test p Test p
WJ-III Spelling 0.00 0.50 0.05 0.50 0.07 0.50 0.01 0.50 0.00 0.50 0.17 0.50WJ-III Calculation 0.30 0.50 0.21 0.50 0.12 0.50 0.29 0.50 0.07 0.50 1.03 0.31
Grade 5 Test p Test p Test p Test p Test p Test p
WJ-III Spelling 1.35 0.24 0.82 0.50 0.84 0.50 1.76 0.18 0.80 0.50 0.15 0.50WJ-III Calculation 0.53 0.50 0.53 0.50 0.06 0.50 0.62 0.50 0.02 0.50 0.28 0.50
Note: "Test" refers to the Chi-Square test statistic for a general linear hypothesis test (Wald Test) with 1 degree of freedom."p " is the p -value produced by HLM5 software and is automatically set to 0.5 for values that exceed 0.5.
Impacts are compared to the impacts for all students in that grade.
ABCD BCD A Binterventions interventions Reading Read
A B C DReading Read Reading Reading
Table E.23
Tests for the Difference in Impacts for Students with Low Screening Peabody Picture Vocabulary Test Scores
All Word-level Failure Free Spell Wilson Correctiveinterventions interventions
All Word-level
ABCD BCD
Failure Free Spell Wilson CorrectiveReading Reading
C D

E-26
Grade 3 Test p Test p Test p Test p Test p Test p
WJ-III Spelling 0.94 0.50 0.40 0.50 0.99 0.50 0.33 0.50 0.27 0.50 1.01 0.31WJ-III Calculation 0.39 0.50 0.26 0.50 0.19 0.50 5.46 0.02 0.88 0.50 3.11 0.07
Grade 5 Test p Test p Test p Test p Test p Test p
WJ-III Spelling 0.07 0.50 0.00 0.50 0.28 0.50 0.00 0.50 0.60 0.50 0.47 0.50WJ-III Calculation 0.65 0.50 0.85 0.50 0.00 0.50 0.03 0.50 0.85 0.50 0.99 0.50
Note: "Test" refers to the Chi-Square test statistic for a general linear hypothesis test (Wald Test) with 1 degree of freedom."p " is the p -value produced by HLM5 software and is automatically set to 0.5 for values that exceed 0.5.
Impacts are compared to the impacts for all students in that grade.
Reading ReadingC D
Failure Free Spell Wilson Corrective
interventions interventions
All Word-level
ABCD BCD
Table E.24
and Low Screening Peabody Picture Vocabulary Test Scores
All Word-level Failure Free Spell Wilson Corrective
Tests for the Difference in Impacts for Students with Low Baseline Word Attack
Reading Read Reading ReadingC DA B
interventions interventions Reading ReadABCD BCD A B

E-27
Grade 3 Test p Test p Test p Test p Test p Test p
WJ-III Spelling 0.64 0.50 0.52 0.50 0.13 0.50 0.04 0.50 0.01 0.50 0.81 0.50WJ-III Calculation 0.30 0.50 0.17 0.50 4.22 0.04 0.07 0.50 2.44 0.11 1.24 0.26
Grade 5 Test p Test p Test p Test p Test p Test p
WJ-III Spelling 2.94 0.08 2.93 0.08 0.25 0.50 2.08 0.15 1.54 0.21 0.09 0.50WJ-III Calculation 0.66 0.50 0.83 0.50 0.00 0.50 2.03 0.15 0.21 0.50 0.10 0.50
Note: "Test" refers to the Chi-Square test statistic for a general linear hypothesis test (Wald Test) with 1 degree of freedom."p " is the p -value produced by HLM5 software and is automatically set to 0.5 for values that exceed 0.5.
Impacts are compared to the impacts for all students in that grade.
ABCD BCD A Binterventions interventions Reading Read
A B C DReading Read Reading Reading
Table E.25
and High Screening Peabody Picture Vocabulary Test Scores
All Word-level Failure Free Spell Wilson Corrective
Tests for the Difference in Impacts for Students with Low Baseline Word Attack
interventions interventions
All Word-level
ABCD BCD
Failure Free Spell Wilson CorrectiveReading Reading
C D

E-28
Grade 3 Test p Test p Test p Test p Test p Test p
WJ-III Spelling 0.00 0.50 0.05 0.50 0.15 0.50 0.00 0.50 0.07 0.50 0.00 0.50WJ-III Calculation 2.12 0.14 4.40 0.03 0.86 0.50 0.30 0.50 4.42 0.03 0.83 0.50
Grade 5 Test p Test p Test p Test p Test p Test p
WJ-III Spelling 0.56 0.50 0.60 0.50 0.02 0.50 0.40 0.50 0.02 0.50 0.37 0.50WJ-III Calculation 2.41 0.12 1.89 0.17 0.52 0.50 6.37 0.01 0.01 0.50 0.00 0.50
Note: "Test" refers to the Chi-Square test statistic for a general linear hypothesis test (Wald Test) with 1 degree of freedom."p " is the p -value produced by HLM5 software and is automatically set to 0.5 for values that exceed 0.5.
Impacts are compared to the impacts for all students in that grade.
Reading ReadingC D
Failure Free Spell Wilson Corrective
interventions interventions
All Word-level
ABCD BCD
Table E.26
and High Screening Peabody Picture Vocabulary Test Scores
All Word-level Failure Free Spell Wilson Corrective
Tests for Differences in Impacts for Students with High Baseline Word Attack
Reading Read Reading ReadingC DA B
interventions interventions Reading ReadABCD BCD A B

E-29
Grade 3 Test p Test p Test p Test p Test p Test p
WJ-III Spelling 0.01 0.50 0.19 0.50 0.71 0.50 0.34 0.50 0.01 0.50 0.33 0.50WJ-III Calculation 0.12 0.50 0.61 0.50 0.88 0.50 0.04 0.50 1.81 0.17 0.21 0.50
Grade 5 Test p Test p Test p Test p Test p Test p
WJ-III Spelling 3.65 0.05 3.14 0.07 0.81 0.50 3.73 0.05 1.90 0.16 0.00 0.50WJ-III Calculation 11.34 0.00 10.19 0.00 1.99 0.15 6.03 0.01 3.24 0.07 2.71 0.10
Note: "Test" refers to the Chi-Square test statistic for a general linear hypothesis test (Wald Test) with 1 degree of freedom."p " is the p -value produced by HLM5 software and is automatically set to 0.5 for values that exceed 0.5.
Impacts are compared to the impacts for all students in that grade.
ABCD BCD A Binterventions interventions Reading Read
A B C DReading Read Reading Reading
Table E.27
Tests for Differences in Impacts for Students Eligible for Free or Reduced Price School Lunch
All Word-level Failure Free Spell Wilson Correctiveinterventions interventions
All Word-level
ABCD BCD
Failure Free Spell Wilson CorrectiveReading Reading
C D


APPENDIX F
INSTRUCTIONAL GROUP CLUSTERING


A. CLUSTERING OF STUDENTS IN INSTRUCTIONAL GROUPS
For treatment students, the interventions were administered in instructional groups of three students each. Control students do not have instructional groups; however, for purposes of the analysis, students in the control group within each school unit and grade level are treated as if they came from a single instructional group. Typically, for treatment students, the instructional group consists of three students in the same grade, although 5 of the 146 treatment instructional groups had a mixture of third and fifth graders, either because of scheduling difficulties or because a student fit better with students from the other grade in terms of reading ability. The 72 control “instructional groups” ranged in size from 1 to 18 students, with a median size of 3 students.
The instructional groups may introduce clustering among students that our two-level model does not account for; such clustering may affect the standard errors of our impact estimates. To assess the effect of this instructional group clustering on the standard errors of our impact estimates, we expanded our two-level model to a three-level model that includes a level for instructional groups. Specifically, the three level-model is:
Level One: Student (i) in Instructional Group (j) and School-unit (k)
Level Two: Instructional Group (j) and School-unit (k)
Level Three: School-unit (k)
To assess the sensitivity of the impact estimates and their standard errors to the incorporation of instructional group clustering, we examine the impact estimates obtained from the two models and the ratio of the variance from the
F-3

three-level-model to the variance from the two-level-model (see Table F.1).56
Comparing the two-level impact estimates with the three-level impact estimates shows similar impacts, with no clear pattern. The ratio of variances is generally slightly less than one (meaning that the two-level model generally yields slightly higher variance than the three-level model), with a few exceptions, including some impacts that are not estimated very precisely and thus have relatively large variances. For such impacts, the ratio of variances is practically unimportant because it corresponds to an impact estimated with high sampling variability—in other words, a large standard error relative to the impact estimate, and thus the impact estimate cannot be statistically distinguished from zero. For example, on the Passage Comprehension test for third graders, the pooled intervention impact (ABCD) is measured with low precision in both the two-level model and the three-level model, thus making the small ratio of variances practically unimportant. Overall, there is a slight gain in precision when using the three-level model, however, the small differences do not change the substantive conclusions, and would change a significance level of an impact only in a case with borderline significance. We therefore base our conclusions on impact estimates derived from the two-level model.
56 In a final sensitivity analysis of the instructional group clustering, for the five instructional groups with both third and fifth graders, we assign to all students in an instructional group the grade indicator observed for the majority (i.e., the grade observed for two of three students) in that instructional group. Then, we refit the two-level model in Chapter II Equations (II.1) and (II.2), and do a similar comparison of the ratio of three-level to two-level standard errors. The results are similar to those described in the text.
F-4

F-5
Diff. In Ratio of Diff. In Ratio of Diff. In Ratio of Diff. In Ratio of Diff. In Ratio of Diff. In Ratio ofGrade 3 Impacts Variances Impacts Variances Impacts Variances Impacts Variances Impacts Variances Impacts VariancesWord Attack -0.08 0.92 -0.19 0.92 0.26 0.89 -0.45 0.87 0.23 0.92 -0.35 0.95TOWRE PDE 0.03 0.80 0.02 0.81 0.08 0.79 -0.03 0.79 -0.19 0.79 0.28 0.82
Word Identification 0.55 0.60 0.60 0.60 0.38 0.55 0.70 0.51 0.38 0.57 0.73 0.64TOWRE SWE 0.10 0.80 0.17 0.80 -0.11 0.78 0.05 0.74 -0.29 0.78 0.75 0.85Aimsweb 0.21 0.81 0.19 0.81 0.27 0.77 -0.14 0.76 -0.07 0.78 0.80 0.84
Passage Comprehension 0.03 0.45 -0.10 0.44 0.40 0.43 0.10 0.39 0.34 0.42 -0.73 0.46GRADE -0.11 0.74 -0.15 0.75 0.03 0.72 -0.37 0.72 0.43 0.72 -0.51 0.77
Diff. In Ratio of Diff. In Ratio of Diff. In Ratio of Diff. In Ratio of Diff. In Ratio of Diff. In Ratio ofGrade 5 Impacts Variances Impacts Variances Impacts Variances Impacts Variances Impacts Variances Impacts VariancesWord Attack 0.23 0.90 0.25 0.90 0.16 0.92 -0.11 0.90 0.81 0.91 0.06 0.87TOWRE PDE -0.12 0.77 -0.13 0.76 -0.08 0.79 -0.04 0.78 -0.11 0.78 -0.23 0.72
Word Identification 0.11 0.72 0.43 0.73 -0.84 0.67 1.06 0.67 0.77 0.67 -0.54 0.75TOWRE SWE 0.04 0.92 0.10 0.93 -0.13 0.92 0.14 0.94 0.42 0.96 -0.25 0.91Aimsweb -0.50 0.82 -0.50 0.82 -0.48 0.84 -0.31 0.84 0.07 0.83 -1.27 0.77
Passage Comprehension 0.42 0.74 0.31 0.76 0.76 0.67 0.22 0.68 1.36 0.75 -0.66 0.74GRADE 0.08 0.91 0.14 0.91 -0.12 0.92 -0.24 0.91 -0.08 0.94 0.75 0.86
All Interventions Word-level interventions Failure Free Reading Spell Read
Table F.1
Comparison of Impacts and Variances from Two- and Three-level Models
All Interventions Word-level interventions Failure Free Reading Spell Read Wilson Reading Corrective Reading
Wilson Reading Corrective Reading


APPENDIX G
PARENT SURVEY


PARENT INFORMATION FORM FOR:O child’s label goes here
Dear Parent:
This form collects information on your child’s education, medical, and family background. Your answers will be combined with other parents’ answers, and no one will know how you answered the questions. You may skip questions you do not want to answer. We hope, however, that you will answer as many as you can. Thank you very much for helping us to learn more about how children learn to read.
Please print your name: Mr. Ms. FIRST NAME LAST NAME
ABOUT THIS CHILD
1. What was the first language this child learned to speak? CHECK ONE ANSWER 1 English2 Spanish3 English and Spanish equally4 English and another language equally: What language? 5 Another language: What language?
2. What language does this child speak most at home? CHECK ONE ANSWER1 English2 Spanish3 English and Spanish equally4 English and another language equally: What language? 5 Another language: What language?
3. Is this child: CHECK ONE ANSWER1 Male?2 Female?
4. How would you describe this child? CHECK ONE ANSWER1 Hispanic or Latino 2 Not Hispanic or Latino
5. How would you describe this child? CHECK ALL THAT APPLY1 White 2 Black or African American3 Asian 4 Native Hawaiian or Other Pacific Islander 5 American Indian or Alaska Native
Prepared by Mathematica Policy Research, Inc. Parent Baseline Form
PPOOWEWERR44KKIIDDSSREADING INITIATIVE

6. What is this child’s date of birth? |__|__| / |__|__| / |__|__|__|__| MONTH DAY YEAR
7. In the past 4 school years, how many times has this child changed schools (other than for grade promotion)? CHECK ONE ANSWER0 None1 Once2 Twice3 Three times4 Four times5 Five or more times
8. DURING THE LAST SCHOOL YEAR (2002-03), did this child receive any tutoring or instruction in reading outside of school? CHECK ONE ANSWER0 No1 Yes: IF YES a. How many weeks of tutoring? weeks
b. How many hours per week? hours
9. DURING THE SUMMER OF 2003, did this child receive any tutoring or instruction in reading? CHECK ONE ANSWER0 No1 Yes: IF YES a. How many weeks of tutoring? weeks
b. How many hours per week? hours
10.THIS SCHOOL YEAR, is this child receiving any tutoring or instruction in reading outside of school? CHECK ONE ANSWER0 No1 Yes: IF YES How many hours per week? hours
11.Has a health professional (or someone from the child’s school) told you that this child has any of the following disabilities? CHECK ONE ANSWER IN EACH LINE Yes No1 0 a. A specific learning disability1 0 b. Autism1 0 c. Attention deficit disorder, ADD, or ADHD1 0 d. Pervasive Development Disorder or PDD1 0 e. Mental retardation1 0 f. A speech impairment1 0 g. A serious emotional disturbance1 0 h. Deafness or another hearing impairment1 0 i. Blindness or another visual impairment1 0 j. Another health impairment (lasting 6 months or more)
Prepared by Mathematica Policy Research, Inc. Parent Baseline Form

ABOUT THE PARENTS (OR GUARDIANS)
12.What is your relationship to this child? CHECK ONE ANSWER 1 Mother 6 Father2 Stepmother 7 Stepfather3 Foster mother 8 Foster father4 Grandmother or other female relative 9 Grandfather or other male relative5 Other adult female (such as girlfriend 10 Other adult male (such as boyfriend
or partner of child’s parent) or partner of child’s parent)
13. Are you married or living with someone in a marriage-like relationship? CHECK ONE ANSWER0 No IF NO Please skip question 14 and answer questions 15-17 for “You” only.1 Yes IF YES Please answer question 14 and in questions 15-17 answers for “You” and
for “Your spouse/partner.”
14. What is your spouse/partner’s relationship to this child? CHECK ONE ANSWER1 Mother 6 Father2 Stepmother 7 Stepfather3 Foster mother 8 Foster father4 Grandmother or other female relative 9 Grandfather or other male relative5 Other adult female (such as girlfriend 10 Other adult male (such as boyfriendor partner of child’s parent) or partner of child’s parent)
15. In what years were you and your spouse/partner born?
You Your spouse/partner19|__|__| WRITE YEAR 19|__|__| WRITE YEAR
16. What is the highest grade or year of school that you and your spouse/partner completed? CHECK ONE ANSWER IN EACH COLUMN
Your spouse/You partner1 1 8th grade or less2 2 Some high school (but did not graduate)3 3 High school equivalency (GED)4 4 High school graduate5 5 Vocational, trade, or business school after completing or leaving high
school6 6 Some college (but did not receive a degree)7 7 Associate degree (AA or other 2-year degree)8 8 Bachelor’s degree or higher
Prepared by Mathematica Policy Research, Inc. Parent Baseline Form

17. Which best describes you and your spouse/partner’s current employment situation right now? CHECK ONE ANSWER IN EACH COLUMN
Your spouse/You partner
1 1 Working part-time (less than 35 hours per week) 2 2 Working full-time (35 hours per week or more)3 3 Has a job but is not at work right now because of temporary illness,
vacation, or strike4 4 Retired5 5 In school (full-time)6 6 Keeping house (full-time)7 7 Not working, but looking for work8 8 Not working and not looking for work9 9 None of the above
ABOUT THE HOUSEHOLD
The last set of questions is about your family’s resources. This information will be kept confidential. It will never be used with your name or to identify you in any way.
18. What was your total family income from all sources before taxes in 2002?(If you are not sure about the amount, please estimate.) CHECK ONE ANSWER1 Less than $10,000 6 $25,000 - $27,499 11 $40,000 - $44,9992 $10,000 - $14,999 7 $27,500 - $29,999 12 $45,000 - $49,9993 $15,000 - $19,999 8 $30,000 - $32,499 13 $50,000 - $59,9994 $20,000 - $22,499 9 $32,500 - $34,999 14 $60,000 - $99,9995 $22,500 - $24,999 10 $35,000 - $39,999 15 $100,000 or more
19. In the past 12 months, that is since September of 2002, has your family received benefits from any of the following programs? CHECK ONE ANSWER IN EACH ROW Yes No1 0 a. Public assistance such as TANF (Temporary Assistance for Needy
Families)1 0 b. WIC (Women, Infants, and Children’s nutrition program)1 0 c. Food Stamps1 0 d. Medicaid1 0 e. Pennsylvania’s Children’s Health Insurance Program (CHIP)1 0 f. Social Security1 0 g. Supplemental Security Income (SSI)1 0 h. Public or subsidized housing, or energy assistance 1 0 i. Federal School Lunch program (program for free or reduced-price lunches)
20. In all, how many people live in the household of this child (named on the cover)? INCLUDE YOURSELF AND THIS CHILD IN YOUR COUNT
|__|__| people
Thank you very much.
Prepared by Mathematica Policy Research, Inc. Parent Baseline Form

APPENDIX H
TEACHER SURVEY AND BEHAVIORAL RATING FORMS


Power4Kids Study: Survey of Student’s Total Reading Program, Reading Achievement, and Behavior
Student: __________________________ School: ____________________ Grade: ____
Name of person completing the survey ____________________________ Date: ______
Part A: Description of Total Reading Program
Please describe the reading program this student is receiving as of the date you complete the survey. 1. Does this student receive any reading instruction in large groups (15 or more
students)?
Yes Go to Question 2
No Skip to Question 4
2. On a weekly basis, approximately how much time and from whom does this student receive reading instruction in large groups? Please fill in one oval on each line.
Hours per week
Instructor None
Less than 1 hour
1-2.9 hours
3-4.9 hours
5-6.9hours
7 or morehours
a. General education teacher teaching all subjects in a self-contained class
b. General education teacher teaching reading in a departmentalized program
c. Special education teacher
d. Title I teacher
e. ESL teacher
f. Reading specialist
g. Other (Specify) ______________________
3. What is the range in size of the large groups in which this student receives reading instruction?
to students
1
A B C D E F
A B C D E F
A B C D E F
A B C D E F
A B C D E F
A B C D E F
A B C D E F
A
B

4. Does this student receive any reading instruction in small groups (2-14 students)? Include instructional groups formed within the classroom as well as instruction provided in pullout programs other than Power4Kids.
Yes Go to Question 5
No Skip to Question 7
5. On a weekly basis, approximately how much time and from whom does this student receive reading instruction in small groups (other than Power4Kids)? Please fill in one oval on each line.
Hours per week
Instructor None
Less than
1 hour1-2.9hours
3-4.9hours
5-6.9hours
7 or morehours
a. General education teacher teaching all subjects in a self-contained class
b. General education teacher teaching reading in a departmentalized program
c. Special education teacher
d. Title I teacher
e. ESL teacher
f. Reading specialist
g. Other (Specify) ___________________
6. What is the range in size of the small groups in which this student receives reading instruction?
to students
7. Does this student receive any one-on-one reading instruction? Do not include Power4Kids make-up sessions or other one-on-one instruction provided by the Power4Kids teacher.
Yes Go to Question 8
No Skip to Question 9
2
A B C D E F
A B C D E F
A B C D E F
A B C D E F
A B C D E F
A B C D E F
A B C D E F
B
A
A
B

8. On a weekly basis, approximately how much time and from whom does this student receive one-on-one reading instruction (other than Power4Kids)? Please fill in one oval on each line.
Hours per week
Instructor None
Less than
1 hour1-2.9hours
3-4.9hours
5-6.9hours
7 or morehours
a. General education teacher teaching all subjects in a self-contained class
b. General education teacher teaching reading in a departmentalized program
c. Special education teacher
d. Title I teacher
e. ESL teacher
f. Reading specialist
g. Other (Specify) ______________________
9. On a weekly basis, approximately how much assistance does this student receive during reading instruction from the following individuals? Include assistance given in the regular classroom and during pullout instruction. Please fill in one oval on each line.
Hours per week
Individual giving assistance None
Less than
1 hour1-2.9hours
3-4.9hours
5-6.9hours
7 or morehours
a. General education instructional aide
b. Special education instructional aide
c. Title I instructional aide
d. ESL instructional aide
e. Peer or cross-age tutor
f. Volunteer
g. Other (Specify) ______________________
3
A B C D E F
A B C D E F
A B C D E F
A B C D E F
A B C D E F
A B C D E F
A B C D E F
A B C D E F
A B C D E F
A B C D E F
A B C D E F
A B C D E F
A B C D E F
A B C D E F

Part B: Impact of Pull-Out Instruction:
10. Does this student receive pull-out instruction in the Power4Kids program?
Yes Go to Question 11
No Skip to Question 13
11. On a weekly basis, approximately how much classroom instruction does this student miss in each of the following curriculum areas because of Power4Kids pullout? Please fill in one oval on each line.
Hours per week
Curriculum Area NoneLess than
1 hour1-2.9hours
3-4.9hours
5-6.9hours
7 or morehours
a. Reading
b. Spelling
c. Writing
d. Mathematics
e. Science
f. Social Studies
g. Other curriculum area(s)
12. How is this student supplied with content missed in each of these curriculum areas because of Power4Kids pullout? Mark all responses that apply.
Reading Spelling Writing Math ScienceSocial
Studies Othera. No content is
missedb. Student makes up
missed assignmentsc. Teacher supplies
additional instruction during school hours
d. Student completes special assignments in place of regular homework
e. Classmates share information
f. Other (Specify) _______________
4
B
A
A B C D E F
A B C D E F
A B C D E F
A B C D E F
A B C D E F
A B C D E F
A B C D E F
A B C D E F G
A B C D E F G
A B C D E F G
A B C D E F G
A B C D E F G
A B C D E F G

13.
5

14. Does this student receive pullout reading instruction other than Power4Kids?
Yes Go to Question 14
No Skip to Question 16
15. On a weekly basis, approximately how much classroom instruction does this student miss in each of the following curriculum areas because of pullout for reading instruction other than Power4Kids? Please fill in one oval on each line.
Hours per week
Curriculum Area NoneLess than
1 hour1-2.9hours
3-4.9hours
5-6.9hours
7 or morehours
a. Reading
b. Spelling
c. Writing
d. Mathematics
e. Science
f. Social Studies
g. Other curriculum area(s)
16. How is this student supplied with content missed in each of these curriculum areas because of pullout other than Power4Kids? Mark all response that apply.
Reading Spelling Writing Math ScienceSocial
Studies Othera. No content is
missedb. Student makes up
missed assignmentsc. Teacher supplies
additional instruction during school hours
d. Student completes special assignments in place of regular homework
e. Classmates share information
f. Other (Specify)
6
B
A
A B C D E F
A B C D E F
A B C D E F
A B C D E F
A B C D E F
A B C D E F
A B C D E F
A B C D E F G
A B C D E F G
A B C D E F G
A B C D E F G
A B C D E F G
A B C D E F G

_______________
7

Part C: Private Tutoring:
17. To your knowledge, does this student currently receive special instruction or tutoring in reading provided privately, and outside of normal school hours?
Yes Go to Question 17
No Skip to Question 18
I don’t know Skip to Question 18
18. On a weekly basis, approximately how much time does this student receive reading instruction from a private program or tutor?
Less than 1 hour per week
1 to 2.9 hours per week
3 to 4.9 hours per week
5 to 6.9 hours per week
7 or more hours per week
I don’t know
8
B
A
C
B
A
D
C
F
E

Part D: Reading Achievement:
19. At this point in the school year, how would you rate this student’s overall reading skills in comparison to the rest of the students in your class?
Above average
Average
Below average
Significantly below average
Among the one or two worst readers in the class
20. How would you categorize this student’s improvement in ability to independently read grade-level materials since the beginning of this school year?
Has made excellent progress
Has made good progress
Has made some progress
Has made limited progress
Has made no progress
21. At this point in the school year, how would you rate the student’s problems in each of the following areas of reading skill as they pertain to reading grade level text?
Significant Moderate Slight NoneNot
observeda. Problems with
accurate reading of textb. Problems with fluent
reading of textc. Problems with reading
comprehension
9
A B C D E
B
A
D
C
E
B
A
D
C
E
A B C D E
A B C D E

Part E: Classroom Behaviors:
22. Please rate the frequency with which this student displays each of the following behaviors. If you are unsure of a response, choose the one that most nearly describes the student.
Never Rarely Sometimes OftenAlmost Always Always
Activity
a. Out of chair when supposed to be doing work: sharpens pencils, walks around
b. In constant motion, always on the go
c. Restless, can’t sit still: taps pencils, taps feet, clicks pen
d. Flits from one activity to another
e. Distractible: notices and is distracted by slightest noise or movement
Attention
a. Needs reminders to listen carefully
b. Gets to work immediately, without hesitation
c. Slow to complete academic tasks: requires extra time
d. Requires constant supervision or reminders to finish a task
e. Loses interest before completing most tasks
f. On a difficult task, will keep trying, persists
g. Doesn’t finish what s/he starts (a book, a worksheet)
h. Needs to have instructions repeated several times
i. Needs individual help (1:1) in order to complete a task
j. Side-tracked from task at hand
k. Disorganized: loses 10
A B C D E F
A B C D E F
A B C D E F
A B C D E F
A B C D E F
A B C D E F
A B C D E F
A B C D E F
A B C D E F
A B C D E F
A B C D E F
A B C D E F
A B C D E F
A B C D E F
A B C D E F
A B C D E F

pencils, papers, work area messy
11

(Question 21 continued)
Adaptability Never Rarely Sometimes OftenAlmost Always Always
a. Gets upset by and can’t tolerate changes in routine/schedule
b. Problems during transitions: waiting, changing classes
c. Takes challenges eagerly, adapts to new tasks
d. Takes a long time to settle down to a new activity
23. For each of the following behaviors, indicate how much you think this student demonstrates this problem at this time:
Not at All Just a Little Pretty Much Very Mucha. Restless (overactive)b. Excitable, impulsivec. Disturbs other studentsd. Fails to finish things s/he starts
(short attention span)e. Fidgetingf. Inattentive, distractibleg. Demands must be met immediately:
frustratedh. Criesi. Mood changes quicklyj. Temper outbursts (explosive and
unpredictable behavior)k. Hums and makes other noises
Thank you for your help!
12
A B C D
A B C D
A B C D
A B C D
A B C D
A B C D
A B C D
A B C D
A B C D
A B C D
A B C D
A B C D E F
A B C D E F
A B C D E F
A B C D E F


APPENDIX I
INSTRUCTIONAL GROUP VIDEOTAPE ANALYSIS


A. DESIGN OF VIDEOTAPE CODING ANALYSIS
Over the course of the intervention period, we made two videotaped observations of each intervention teacher—one of a third-grade instructional group and the other of a fifth-grade instructional group. A total of 38 teachers were taped, nine each from Corrective Reading and Wilson Reading, and ten each from Spell Read P.A.T. and Failure Free. Effort was made to conduct the first taping of each teacher during the first half of the intervention period and the second during the second half, although the logistics of developing a workable video-taping schedule sometimes necessitated a shorter than desirable period of time between the two sessions.
Trained coders then analyzed the videotapes based on the core instructional elements of each of the four interventions and the manner in which the elements might be expected to interact in order to achieve desired outcomes. The output of this analysis—a form of “running record” for each video—served as the basis for the both the ratings of fidelity/general teacher quality and the time-by-activity analysis discussed later in this section.
A total of seven coders, all of whom were educators with experience teaching reading in the primary grades, were hired and trained to assist with the construction of the running records. The coders analyzed each of the 76 recorded sessions, and a sample of 18 sessions, distributed across the four reading programs, was reanalyzed by a second coder who constructed a second running record.
B. CODING PROCEDURES FOR TIME BY ACTIVITY ANALYSIS
Chapter II details our time-by-activity analysis, for which we used the coding structure presented in Table I.1 and discussed below. We then computed the number of minutes devoted to each category of language level, instructional process, and format, and calculated the mean number of minutes per session for each category within each reading program. Because students in Failure Free typically worked independently on different activities, each student was coded as a separate “session” in this analysis.
Description of Language Level/Instructional Process/Format Codes
As shown in Table I.1, language level was divided into three primary categories: 1) subword level, 2) word level, and 3) connected text. Within these broad categories, the subword level was further divided into (S01) isolated sounds or associated letters, and (S02) syllables and word parts; word level was further divided into (W01) words of only one syllable, and (W02) words of one or more syllables. Finally, connected text was further divided into (T01) phrases, (T02) isolated sentences, (T03) paragraphs, and (T04) multiparagraph stories.
I-3
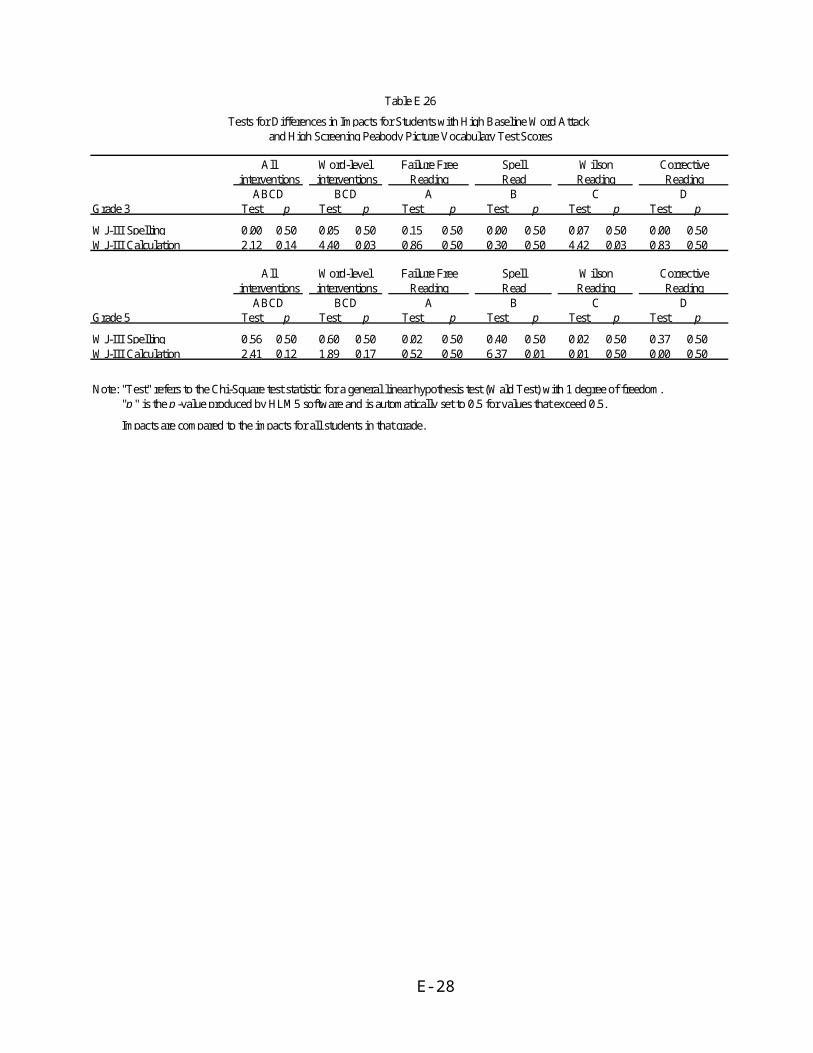
A fourth category, mixed level (ML01) was used in preliminary analysis for activities that included more than one language level. Activities coded as mixed were subsequently subjected to additional analysis by program type in order to allocate time proportionately to other language level codes. Such allocation was possible because each of the programs used a recurring structure and typical exercise types across many lessons.
I-4

Table I.1
Language Level/Instructional Process/Format Codes
Language Level Codes
Subword level S01 Isolated sounds or associated letters
S02 Syllables, word parts
Word level W0 Whole words or nonsense words, one-syllable only
W02 Whole words or nonsense words, one or more syllables
Connected text T01 Phrases
T02 Isolated sentences
T03 Paragraphs
T04 Multi-paragraph stories
Mixed level ML01 Activity with more than one language level (used only in preliminary analysis of data)
Instructional Process Codes
Decoding/Fluency D01 Reading out loud or silently with explicit analysis/synthesis (e.g., tapping sounds, letter substitutions, practicing sounds or word parts before saying words, spelling words, “scooping,” etc.)
D02 Reading stories out loud for fluency
D03 Other reading out loud (i.e., letters, syllables, words, sentences, isolated paragraphs) without explicit analysis/synthesis
D04 Silent reading without explicit analysis/synthesis (e.g., story or passage reading, “hidden” words and other puzzles, etc.)
D05 Listening with explicit analysis/synthesis
D06 Cued silent reading (i.e., visual and auditory computer prompts)
Encoding E01 Demonstrating sound to letter correspondences (e.g., naming letters or matching cards or tiles in response to spoken sounds or syllables, building words using cards or tiles, etc.)
E02 Writing from dictation/copying
E03 Other spelling activities (e.g., analysis/synthesis followed by writing, kinesthetic writing such as air writing or Magna Write, correction procedures, computer spelling lessons, etc.)
E04 Writing activities not focused on vocabulary building or comprehension, including writing with emphasis on punctuation and syntax
I-5

Table I.1 (continued)
Instructional Process Codes (continued)
Vocabulary building V01 Discussing vocabulary
V02 Writing using vocabulary (e.g., marking/copying appropriate word, creating sentences/paragraphs using vocabulary, etc.)
Supporting comprehension C01 Interactive discussions about story (including review/summary)
C02 Listening to teacher read or present review/summary of story
C03 Orally answering comprehension/recall questions
C04 Writing or choosing answers to comprehension/recall questions
C05 Extended writing about story
Mixed process MP01 Activity included more than one process (used only in preliminary analysis of data)
Format
Teacher-directed practice TD01 Teacher-directed instruction/practice—group with group response
TD02 Teacher-directed instruction/practice—individual or group with individual responses
Student-directed practice SD01 Student-directed practice—group (e.g. student-led drill, playing game with minimal direction from teacher)
SD02 Individual, self-directed student work (e.g., silent reading, workbook or writing exercises including checking by teacher, proofreading or self-checking spelling)
Testing TE01 Teacher-directed or student-paired testing/checkouts
Computer work CW01 Computer work (individual or group, student- or teacher-directed)
Mixed format MF01 Activity included more than one format (used only in preliminary analysis of data)
Non-instructional time X01 Transitions, etc.
The instructional process was divided into four primary categories: 1) decoding/fluency, 2) encoding, 3) vocabulary building, and 4) supporting comprehension. As with the language level analysis, activities that included more than one process were initially coded using a mixed-process category (MP01), but subsequently subjected to additional analysis to facilitate proportionate allocation of time to other specific instructional process codes.
Decoding/fluency was divided into six codes: (D01) reading out loud or silently with explicit analysis or synthesis, which included tapping sounds, letter substitutions, practicing sounds or word parts and then incorporating them into words, spelling words, phrase “scooping” to promote fluency, and other decoding strategies; (D02) reading stories out loud for fluency; (D03) other reading out loud, such as reading letters, syllables, words, sentences, or isolated paragraphs, without emphasis on explicit analysis or synthesis as a decoding strategy; (D04) silent reading activities, including passage reading,
I-6

“hidden” words and other word puzzles, etc., without emphasis on explicit analysis or synthesis as a decoding strategy; (D05) listening with explicit analysis and synthesis, which involved listening to sounds, word parts, or words pronounced by the teacher and then analyzing components or synthesizing components into larger language units; and (D06) cued silent reading, which involved visual and auditory computer prompts. The latter code was applicable only to Failure Free instruction.
Encoding was divided into four codes: (E01) demonstrating sound-to-letter correspondence by naming letters after hearing spoken sounds, matching letter cards or tiles to spoken sounds, building words using letter cards and tiles, etc.; (E02) writing letters, words, or sentences from dictation; (E03) other spelling activities, such as workbook activities that involved analyzing and then writing the components of words or synthesizing and then writing words from presented components, kinesthetic writing (e.g., air writing, the use of Magna Write strips in Wilson Reading), various procedures used to correct dictation, computer spelling lessons included in Failure Free, etc.; and (E04) writing activities not focused on vocabulary building or comprehension, including writing with emphasis on punctuation and syntax.
Vocabulary building was divided into two codes: (V01) discussing vocabulary, and (V02) writing using vocabulary. The latter sometimes involved recalling or choosing a specific word in response to a question and in other instances involved creating sentences and/or paragraphs based on specific vocabulary.
Supporting comprehension was divided into five codes: (C01) interactive discussions about a story—including summaries and reviews—with input from students and the teacher; (C02) listening to the teacher read or present a review or summary of a story; (C03) orally answering comprehension/recall questions; (C04) writing open-ended responses or choosing from a given list and then writing appropriate responses to comprehension/recall questions; and (C05) extended writing about a story, either in response to specific prompts or open-ended.
Format was divided into four categories: 1) teacher-directed practice, including (TD01) instruction and practice directed to a group with group response, and (TD02) instruction and practice directed to an individual or to a group, but with individual response; 2) student-directed practice, which included (SD01) student-directed practice involving a group—student-led drills or games, for example—and (SD02) individual and self-directed student work such as silent reading, workbook and writing exercises, and proofreading and correcting written work; 3) testing, which included one code, (TE01) teacher-directed or paired-student testing and checkouts; and 4) computer work, which included (CW06) group or individual computer work. The latter occurred only as part of Failure Free instruction. A fifth category, mixed-format (MF01) was used to designate activities that included more than one format and, like other mixed codes, was used only in preliminary analysis. Additionally, (X01) was appended to this section to account for non-instructional time at the beginning and end of sessions as well as instances of non-instructional periods in excess of one
I-7

minute during the course of the session such as long transitions between activities or off-task discussions.
C. DETAILS OF VIDEOTAPE TIME-BY-ACTIVITY RESULTS
As illustrated in Figure I.1, below, instruction at the subword level had the lowest frequency of the four instructional interventions. However, Spell Read was significantly higher than the other interventions, with an average of 13 minutes per session [F(3, 101) = 51.83, P = .0001]. Of the 13 minutes, 3.4 minutes were devoted to isolated sounds or associated letters (code S01) and 9.2 minutes to syllables and word parts (code S02). Wilson Reading averaged 3.8 minutes of instruction at the subword level, with 2.9 minutes of the total devoted to individual sounds. Corrective Reading averaged only 1 minute of instruction at the subword level, all of it focused on individual sounds, and Failure Free Reading showed no incidence at all of activities at the subword level.
Figure I.1
Average Minutes Per Session Devoted to Each Language Level, by Program
At the word level, the interventions showed no significant differences. Word level was the most frequent language level of activities for Spell Read (18.7 minutes) and Wilson Reading (23.7 minutes) [F(3, 101) = 1.45, P = .2336]. Corrective Reading devoted an average of 20.4 minutes to word-level instruction, and Failure Free Reading 19.7 minutes. In general, word-level instruction focused on a mix of one- and multi-syllable words (code W02). Of
I-8
0
5
10
15
20
25
30
35
FailureFree
SpellRead
WilsonReading
CorrectiveReading
FailureFree
SpellRead
WilsonReading
CorrectiveReading
FailureFree
SpellRead
WilsonReading
CorrectiveReading
Sub-Word Level Word Level Connected Text
Min
utes
Connected Text 04
Connected Text 03
Sub-word Level 02, Word Level 02, andConnected Text 02
Sub-word Level 01, Word Level 01, andConnected Text 01
NOTE: A description of each code category can be found in Table I.1.

the four interventions, only Spell Read devoted the major portion of word-level instruction (14.3 minutes) to words of only one syllable (code W01).
Instruction at the connected-text level was the most frequent language level for Corrective Reading (30.1 minutes) and Failure Free Reading (29.7 minutes). These two programs were significantly higher than Spell Read (19.0 minutes) and Wilson Reading (15.6 minutes) [F(3, 101) = 20.36, P<.001]. Instruction in Corrective Reading dealt mostly with multiparagraph stories (code T04, 26.2 minutes), with the remaining time devoted to isolated sentences. Failure Free Reading showed some time devoted to each of the four connected-text categories, with most time devoted to paragraphs (code T03, 14.2 minutes) and least to multiparagraph stories (code T04, 2.8 minutes). Spell Read instruction at the connected-text level focused exclusively on multiparagraph stories (code T04). Wilson Reading devoted 10.8 minutes to isolated sentences (code T02), 4.7 minutes to multiparagraph stories (code T04), and less than 1 minute to paragraphs (code T03).
Comparison of interventions by instructional process, shown in Figure I.2, indicated that activities focused on decoding were the most frequent for all interventions except Failure Free Reading, which represents a combination of ratings for Failure Free Reading and Verbal Master (Verbal Master accounted for 7 of the 20 sessions videotaped for this treatment condition). However, at 37.9 minutes, Corrective Reading devoted significantly more time to decoding than any of the other programs [F(3, 101) = 97.08, P <.0001]. The differences between Spell Read and Wilson Reading versus Failure Free Reading were also statistically significant [Tukey’s HSD (Alpha: .05, Error: 101) = 39.66].
Figure I.2
Average Minutes Per Session Devoted to Each Instructional Process, by Program
I-9

Breaking this instructional time down into subcategories shows that Corrective Reading devoted 7.9 minutes to reading with explicit analysis or synthesis (code D01), 11.8 minutes to reading stories out loud to practice fluency (code D02), 13.7 minutes to other oral reading activities that did not employ explicit analysis or synthesis as decoding strategies (code D03), 4 minutes to independent silent reading activities (code D04), and less than 1 minute to listening with explicit analysis (code D05). Reading out loud without explicit analysis/synthesis (code D03, 11.4 minutes) was the dominant decoding process for Spell Read, followed by reading that involved explicit analysis/synthesis (code D01, 9.1 minutes). Spell Read also devoted 4.4 minutes to reading stories out loud to practice fluency (code D02), 2.2 minutes to listening with explicit analysis/synthesis (code D05), and less than 1 minute to independent silent reading activities (code D04). Wilson Reading devoted 13.5 minutes to reading with explicit analysis/synthesis (code D01), 8 minutes to oral reading that did not involve explicit analysis/synthesis (code D03), and less than 1 minute to independent silent reading activities (code D04) and to listening with explicit analysis/synthesis (code D05). Failure Free Reading devoted most time to computer-prompted silent reading (code D06, 4.6 minutes) and reading aloud without explicit analysis/synthesis (code D02, 0.2 minutes and code D03, 4.6 minutes), with less than 1 minute devoted to silent reading without computer prompts (code D04).
Failure Free Reading (13.5 minutes), Spell Read (13.9 minutes), and Wilson Reading (18.5 minutes) were all similar with regard to the amount of time devoted to encoding activities [Tukey’s HSD (Alpha: .05, Error: 101) = 60.31].
I-10
0
5
10
15
20
25
30
35
40
FailureFree
SpellReadP.A.T.
WilsonReading
CorrectiveReading
FailureFree
SpellReadP.A.T.
WilsonReading
CorrectiveReading
FailureFree
SpellReadP.A.T.
WilsonReading
CorrectiveReading
FailureFree
SpellReadP.A.T.
WilsonReading
CorrectiveReading
Decoding Encoding Vocabulary Comprehension
Min
utes
Decoding 06
Comprehension 05 & Decoding 05
Comprehension 04, Decoding 04, & Encoding 04
Comprehension 03, Decoding 03, & Encoding 03
Comprehension 02, Decoding 02, Encoding 02, & Vocabulary 02
Comprehension 01, Decoding 01, Encoding 01, & Vocabulary 01
NOTE: A description of each code category can be found in Table I.1.
Encoding also represented the second-most dominant instructional process for the three programs. Corrective Reading, with only 1.2 minutes devoted to encoding, differed significantly from the other three programs [F(3, 101) = 16.76, P<.0001]. Spell Read and Wilson Reading allotted time to activities representing all four of the subcategory codes, with most time devoted to demonstrating sound-to-letter correspondence (code E01), writing from dictation (code E02), and other spelling activities (code E03). Failure Free Reading devoted 3.1 minutes to computer-generated spelling lessons (code E03); 10.3 minutes to writing activities, primarily worksheet activities, that supported decoding skills rather than vocabulary building or comprehension (code E04); and less than 1 minute to writing from dictation (code E02). Corrective Reading devoted 1.2 minutes to writing from dictation (code E02).
Vocabulary building was the most frequent instructional process for Failure Free Reading, which devoted an average 17.2 minutes per session to vocabulary activities and differed significantly on this dimension from the other three programs [F(3, 101) = 60.99, P<.0001.]. The time distribution reflects the influence of Verbal Master, but the regular Failure Free Reading sessions also emphasized discussion of new vocabulary words that would be encountered in the reading text. At the subcategory level, writing using vocabulary words consumed somewhat more time in Failure Free Reading sessions (code V02, 9.5 minutes) than discussing vocabulary words (code V01, 7.7 minutes).
Corrective Reading (11.3 minutes), Spell Read (9 minutes), and Failure Free Reading (8.5 minutes) differed significantly from Wilson Reading (1.8 minutes) in amount of time devoted to activities that directly supported comprehension [Tukey’s HSD Alpha: .05, Error: 101 = 21.54]. Corrective Reading devoted 8 minutes to writing or choosing answers to comprehension/recall questions (code C04), 3 minutes to orally answering comprehension/recall questions (code C03), and less than 1 minute to interactive discussion of the story being read (code C01) and listening to the teacher summarize the story (C02). Failure Free Reading devoted most time to writing or choosing answers to comprehension/recall questions (code C04, 5.2 minutes) and orally answering comprehension/recall questions (code C03, 2.4 minutes) but less than 1 minute to interactive discussions of stories (code C01), listening to the teacher summarize stories (code C02), and extended writing about stories (code C05). Spell Read devoted 3.9 minutes to extended writing about a story (code C05), 2.1 minutes to listening to the teacher read, summarize, or retell a story (code C02), 1.6 minutes to orally answering comprehension/recall questions (code C03), and 1.4 minutes to interactive discussion of stories (code C01). Wilson Reading devoted 1.6 minutes to listening to the teacher summarize or retell a story using visualization (code C02) and less than 1 minute to orally answering comprehension/recall questions (code C03) and writing answers to comprehension/recall questions (code C04).
As seen in Figure I.3, a comparison of instructional format indicates that teacher-directed practice was the most prevalent format for all programs except Failure Free Reading, which, at 15.3 minutes, differed significantly from
I-11

the others [F(3, 101) = 48.33, P<.0001]. Spell Read allocated the greatest amount of time to teacher-directed practice (37.2 minutes) and differed significantly from the other programs [Tukey’s HSD (Alpha: .05, Error: 101) = 59.73]. More specifically, teacher-directed instruction/practice with individual response (code TD02, 30.4 minutes) was the dominant format for the Spell Read intervention. Corrective Reading and Wilson Reading each devoted 30.6 minutes to teacher-directed instruction. For both of these interventions, time devoted to teacher-directed instruction/practice with group response (code TD01) was somewhat greater than time devoted to teacher-directed instruction/practice with individual response (code TD02). Failure Free Reading showed a close balance between group and individual focus.
Failure Free Reading differed significantly from the other three programs in terms of time devoted to student-directed practice, with an average 19.7 minutes per session, mostly in the form of individual and self-directed workbook or writing exercises (code SD02, 17.5 minutes) [Tukey’s HSD (Alpha: .05, Error: 101) = 83.33]. Corrective Reading devoted 12.8 minutes, Wilson Reading 11.0 minutes, and Spell Read 7.0 minutes to student-directed practice, but, of the three, only Wilson Reading allocated time for student-directed group activities (code SD01, 2.6 minutes).
Figure I.3
Average Minutes Per Session Devoted to Each Instructional Format, by Program
0
5
10
15
20
25
30
35
40
FF SR WR CR FF SR WR CR FF SR WR CR FF SR WR CR
Teacher Directed Practice Student Directed Practice Testing Computer Work
Min
utes
Teacher Directed Practice 02, StudentDirected Practice 02
Teacher Directed Practice 01, StudentDirected Practice 01
NOTE: A description of each code category can be found in Table I.1.
Corrective Reading (8.2 minutes) and Spell Read (6.8 minutes) differed significantly from Wilson Reading (1.5 minutes) and Failure Free Reading (0.4 minutes) in time devoted to testing [Tukey’s HSD (Alpha: .05, Error: 101) =
I-12

8.57]. Finally, Failure Free Reading (14.0 minutes) was the only program that used computer instruction, making it significantly different from the other three programs along this dimension.
I-13


APPENDIX J
VIDEOTAPE CODING GUIDELINES FOR EACH READING PROGRAM


Coding Notes for Corrective Reading
Introduction
Terminology
The Corrective Reading (CR) curriculum includes both Decoding and Comprehension strands. The Power4Kids intervention includes only the Decoding program, which is designed to address the needs of “students who have trouble identifying words, who don’t understand how the arrangement of letters in a word relates to its pronunciation, and whose reading rate is inadequate.” There are four levels in the Decoding program, each with its own series of teacher and student books. The levels are called A, B1, B2, and C. A diagnostic test was used to determine the placement level of each instructional group at the beginning of the school year. Most of the groups were placed in one of the B levels—14 of the 20 videotaped Corrective Reading sessions contain lessons from the B1 or B2 books. Each level contains a series of lessons, and each lesson contains four sections (see Table 1). Typically, when CR lessons are delivered to individuals or very small groups, they can be completed in 30-45 minutes.
Each section contains one or more section-specific activities called exercises. For example, there may be up to 6 exercises in the word attack skills section involving activities such as reviewing the sounds of letters and letter combinations, building up words by adding prefixes or suffixes to base words, and converting words by changing one sound within the word. In the teacher’s presentation manual, the exercises are clearly numbered and labeled.
Salient instructional features in Corrective Reading are tightly scripted lesson delivery, brisk pacing, choral responses by students, the teacher’s use of visual and audible signals to coordinate students’ utterances, immediate error correction, and a point system to reward successful completion of each activity block. Students record their points for each lesson in grids printed on the inside covers of their student workbooks.
Relationship between lesson plans and activities seen on the video. Corrective Reading instruction is highly scripted. Theoretically, if the Corrective Reading lesson number associated with an instructional session is known, the observer can accurately predict the sequence of events on the video by reading the relevant lesson script in the teacher’s presentation book. Our preliminary review of Corrective Reading tapes confirmed that most teachers adhered fairly closely to the lesson scripts. Accordingly, the teacher’s presentation book provides a useful advance organizer for coding CR lessons; and for recording the sequence of exercises on the coding form, it will usually be appropriate (and desirable) simply to copy down the exercise numbers and descriptive titles provided in the CR presentation book.
A caveat: the four-section Corrective Reading lessons that appear in the teachers’ presentation books were designed for delivery in 30-45 minutes. However, because the Power4Kids groups met for about an hour each day, the Corrective Reading teachers were instructed to “accelerate” instruction—to cover as many sections as feasible during each session. Thus it is common for CR sessions to begin or end in the middle of a CR lesson and to cover more than four sections in one sitting. When coding the first CR exercise of the day as well as at the transition between one lesson and the next, be sure to include the CR lesson number in addition to the exercise number in the descriptive title on the observation sheet.
Coding Notes for Corrective Reading 1
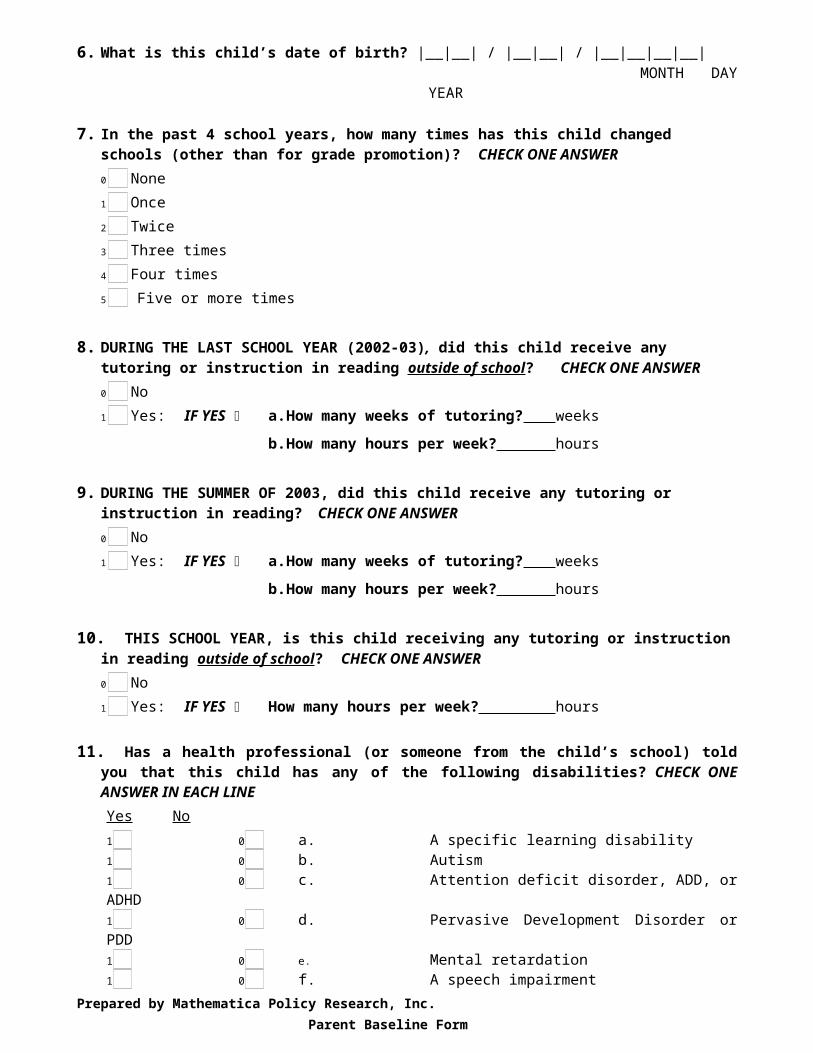
Table 1: Outline of a Standard Corrective Reading Lesson
SectionNumber and
TitleDuration(minutes) Section Activities Materials
Word Attack Skills
~ 10 Pronunciation, sound identification and combinations, reading sound combinations and isolated words. Includes choral responses and individual students taking turns reading rows of sounds/words (points earned)
Teacher presentation book and student book.
Group Reading
~ 15-20 Students take turns reading from student book while other students follow along. If a story “part” is completed within a specified error limit, then comprehension questions follow. Otherwise, the story “part” is reread until the criterion is met.
Teacher presentation book and student book.
Individual Reading Checkouts
~10 Students work in pairs to check out each other’s reading accuracy and fluency. First, each student reads from the passage that was just read as a group while the other notes and counts errors. Second, each student does a timed reading (one minute) of a previous day’s group reading while the other student counts errors and notes total words read. Points are awarded for the first reading if errors are below a specified number. Points are awarded for the second reading if speed and errors fall within specified limits.
In P4K, because instructional groups contain no more than 3 students, the teacher often administers one or both of the checkouts. While waiting to be checked out, students may follow along in the reader or complete workbook exercises.
Teacher presentation book and student book.
WorkbookExercises
~10 Each lesson is accompanied by a one-page exercise in a consumable workbook. Items in the exercise may include some teacher-directed activities (e.g., dictation) as well as items to be completed independently. Students earn points by staying within a given error limit. The teacher may correct the workbooks on the spot or collect them for review outside of the session.
Teacher presentation book, student workbook, and student book.
Coding Notes for Corrective Reading 2

Fidelity Notes for Corrective Reading
The four sections of a CR lesson have different formats and varying levels of fidelity concerns. Accordingly, the coding requirements for the sections also vary. During the Word Attack section, teachers introduce and review concepts/words using a detailed script and prescribed correction procedures. Teachers are expected to coordinate student choral responses using hand signals and audible signals (typically tapping on the table with a pencil or snapping their fingers) that establish a pace and rhythmic question-response pattern. Student errors in reading are immediately corrected: the teacher supplies the correct response, prompts the student to repeat it, prompts the student to spell it while the teacher taps for each letter, and then tells the student to repeat the whole row or column of words he has been reading. During the Group Reading section, students take turns reading passages from their readers, one or two sentences at a time. If any error is made (misreading, skipping, or substituting words), the teacher immediately interrupts the student, supplies the correct word, prompts the student to repeat the word, and then tells the student to reread the entire sentence in which the error was made. The story is divided into parts, each worth a specified number of points if the students can read it with no more than a specified number of errors. If more errors are made, the teacher should have the students read the entire part again. If the error rate is within the criterion, the teacher asks the students a few comprehension (largely recall) questions. During the Individual Checkout and Workbook periods, there are no section-specific fidelity concerns per se (although time management and student behavior management problems may be noted); here, we are primarily interested in capturing the range in variability in how teachers handled these activities.
1. Countable Incidents
This section describes behavior that should be coded as countable incidents (each instance should be noted on the observation with a time-stamp and brief description of what happened). Codes for these events are listed in the text and also in Table 3 at the end of this document.
Teacher diverges from the standard correction script for Word Attack and Group Reading sections: The standard correction routines for errors committed during each of these sections of the Corrective Reading lesson are described in the beginning lessons in each teacher’s presentation book as well as in the teacher guides, and are to be used throughout the Corrective Reading program. The philosophy underlying the correction procedures is that students must practice reading words correctly within the context of larger reading tasks. Therefore, in addition to supplying a correction, the teacher must have the student correct the error “locally” and then repeat the task in which the error was made—i.e., by rereading the row or column of a word list or the sentence in a text in which the problematical word is embedded. See the excerpt from the B1 Teacher’s Guide in the training binder for a complete discussion of other correction issues such as counting self-corrections as errors and the use of comprehension questions after well-read passages, and the re-reading of passages in which more than the specified number of errors have been produced.
Coding Notes for Corrective Reading 3

Codes for divergences from the correction script
Event Code CommentError not responded to EN describe error (wrong sound,
word skipped, word substituted, word misread)
Error detected, standard correction made
CS (none needed)
Error detected, NON-standard correction made
CN describe error and the teacher’s correction (e.g., did not ask student to repeat correct information and/or spelling; did not require student to repeat task, did not require group to reread passage)
Other failures to follow the script:. For example, teacher skips steps described in the presentation book, adds unscripted material, or fails to engage students in the activities specified by the presentation book, with the materials specified in the presentation book. (Note that some deviations from the script may ultimately be interpreted as “value added” rather than a failure to reproduce the program-as-intended. However, we still need to describe and time-stamp the deviation for future consideration.).
Codes for other divergences from the script
Event Code CommentTeacher added material MA describe addition (e.g., teacher
discussed word meaning during a word-attack exercise, reminded students about prior lessons such as the function of the silent-e)
Teacher skipped/dropped material
MS describe what was skipped
Other deviations MX describe
Use of the point system: The lesson script will prompt teachers to implement the point system at various points in the lesson such as during reading checks, group reading, and workbook activities. Teachers may also make unscripted references to the point system.
Codes for use of point system
Event Code CommentTeacher refers to points PD+ scripted/non-scriptedTeacher does not refer to points when prompted to do so by lesson script
PD- describe other evidence of point system being used (e.g., students filling in charts)
Coding Notes for Corrective Reading 4
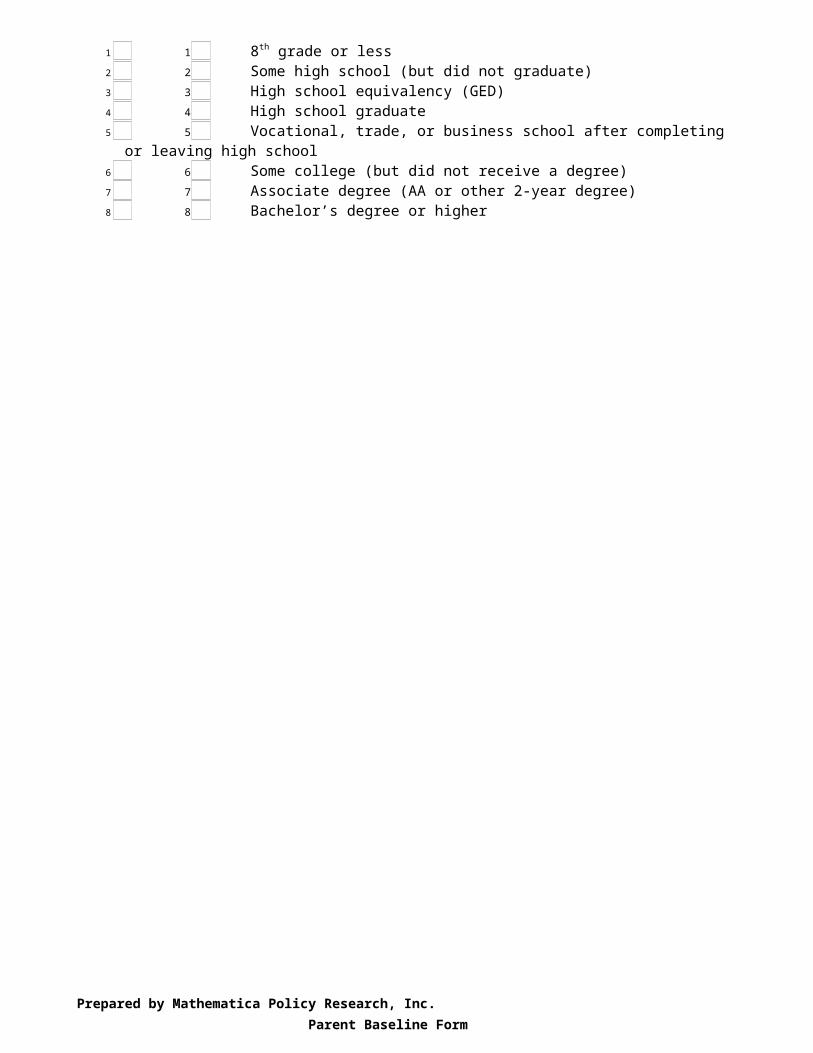
Incorrect modeling of sound or word pronunciation (including failure to draw out vowels and continuant consonants during recitation, mispronunciation of a sound or word, addition of “uh” after a consonant sound pronounced in isolation)
Code for incorrect modeling
Event Code CommentIncorrect pronunciation or modeling
DX describe
Excessive periods of non-instruction. Teacher allows periods of non-instruction for periods of more than one minute in discussions or activities (including transitions) that are not related directly to instruction. Teacher allows herself to be distracted unduly by students’ questions (particularly questions not relevant to the instruction going on).
Codes for excessive periods of non-instruction
Event Code CommentExcessive transition time between activities (more than a minute)
TT describe
Teacher allows excessive student discourse (veering off-topic)
TS describe
Teacher gives extended explanation (in addition to simply adding material)
TX describe
Other lost instructional time TO describe (e.g., intercom announcements, visitors to classroom interrupt teacher for more than a minute)
Coding Notes for Corrective Reading 5

2. General description of the implementation of Individual Checkouts and Workbook Exercise sections of Corrective Reading lessons
Topics to address for the description of the implementation of Individual Checkout and Workbook sections of CR lessons are listed below in Table 2.
Table 2: Section Specific Focus of Coding: Corrective Reading Lesson
SectionNumber and
Title
Section Activities Section-specific Focus of Coding
Word Attack Skills
Pronunciation, sound identification and combinations, reading sound combinations and isolated words. Includes choral responses and individual students taking turns reading rows of sounds/words (implementation of point system at end of individual reading of sounds/words)
Extent to which teacher detects student errors and consistently follows the required correction routine for word attack errors. (Count errors not detected; errors detected and corrected according to required procedure; errors detected and corrected using non-standard procedure. Describe and time stamp the undetected errors and nonstandard corrections.)
Extent to which teacher deviates from the script by adding information (e.g., discussion of word meanings, reminding students of a spelling rule), skipping information. (Describe and time stamp these deviations.)
Extent to which teacher implements point system, other examples of positive reinforcement
Extent to which teacher use signals to maintain a smooth and predictable rhythm of prompt and response
Other details: appropriate modeling, teacher attention to needs of individual students,
Group Reading
Students take turns reading from student book while other students follow along, answer comprehension questions, implementation of point system
Extent to which teacher detects student errors and consistently follows the required correction routine for group reading errors, including the skipping of comprehension questions and re-reading story parts if too many errors are made on the first try.
Extent to which point system is implemented
Extent to which teacher adds additional comprehension questions, discusses word meanings
Coding Notes for Corrective Reading 6

Table 2: Section Specific Focus of Coding: Corrective Reading Lesson (cont.)
SectionNumber and
Title
Section Activities Section-specific Focus of Coding
Individual Reading Checkouts
Students work in pairs to check out each other’s reading accuracy and fluency. First, each student reads from the passage that was just read as a group while the other notes and counts errors. Second, each student does a timed reading (one minute) of a previous day’s group reading while the other student counts errors and notes total words read. Points are awarded for the first reading if errors are below a specified number. Points are awarded for the second reading if speed and errors fall within specified limits.
In P4K, because instructional groups contain no more than 3 students, the teacher often administers one or both of the checkouts. While waiting to be checked out, students may follow along in the reader or complete workbook exercises.
Who does which checkouts (peers or the teacher)?
What do students do while others are being checked (follow along with their fingers? complete their workbook assignment? nothing?)
How is the point system implemented?
WorkbookExercises
Each lesson is accompanied by a one-page exercise in a consumable workbook. Items in the exercise may include some teacher-directed activities (e.g., dictation) as well as items to be completed independently. Students earn points by staying within a given error limit. The teacher may correct the workbooks on the spot or collect them for review outside of the session.
Is the workbook exercise completed by all students at once or combined with the reading checkout section?
Does the teacher monitor the students’ work while they are completing the workbook? Collect the workbooks for checking later?
How is the point system implemented?
Coding Notes for Corrective Reading 7

Table 3: Summary of Codes for Countable Incidents in Corrective Reading Lessons
Event Code CommentError not responded to EN describe error (wrong sound,
word skipped, word substituted, word misread)
Error detected, standard correction made
CS (none needed)
Error detected, NON-standard correction made
CN describe error and the teacher’s correction (e.g., did not ask student to repeat correct information and/or spelling; did not require student to repeat task, did not require group to reread passage)
Teacher added material MA describe addition (e.g., teacher discussed word meaning during a word-attack exercise, reminded students about prior lessons such as the function of the silent-e)
Teacher skipped/dropped material MS describe what was skippedOther script deviations MX describeTeacher refers to points PD+ scripted/non-scriptedTeacher does not refer to points when prompted to do so by lesson script
PD- describe other evidence of point system being used
Incorrect pronunciation or modeling
DX describe
Excessive transition time between activities (more than a minute)
TT describe
Teacher allows excessive student discourse (veering off-topic)
TS describe
Teacher gives extended explanation (in addition to simply adding material)
TX describe
Other lost instructional time TO describe (e.g., intercom announcements, visitors to classroom interrupt teacher for more than a minute)
3. Cover and Comments Sheets
After the entire session has been viewed, the cover sheet should be filled out. The video number, teacher’s name, session date, lesson number (s), students at the beginning and end of the session, coder’s initials, and dates of the coding should be recorded. A brief summary of the types of motivators (stickers, candy, etc.) observed and whether homework was assigned or turned in should be added in the appropriate boxes. “Nothing observed” may be entered as appropriate. A brief description of the instructional space (was it adequate in size, noisy, crowded, etc.?) and the affective environment of the lesson (teacher-student rapport, general supportiveness on the part of the teacher, evidence of frustration by teacher or students, etc.) should also be entered in the appropriate boxes.
Coding Notes for Corrective Reading 8

The “General Comments” sheet should also be filled out. Each of the topics listed below should be addressed in the comments. If a teacher’s actions were “unremarkable” with regard to a particular topic, and if no quantification of data needs to be recorded, please enter “Appropriate” or “OK” into the line. If more comments are needed, please write them succinctly but with enough detail to provide real information about your observations.
Pacing and prompting: How consistently did the teacher use the appropriate signals to orchestrate student responses as described in the teacher’s guide—i.e., hand-drop, point-and-touch, looping motions for spelling, and audible signals (finger snaps, tap of pencil on board) to orchestrate choral responses? In particular, sound tapping is substandard if it is not rhythmic and does not allow sufficient wait time between the verbal prompt (e.g., “what word?”) and the tap. Note: even accomplished CR teachers will slip up once in awhile, but other teachers may consistently fail to orchestrate student responses.
Correction routines: Summarize the number of EN, CS, and CN corrections by lesson number and also by category (whether they occurred during word attack instruction or group reading.) Add any other pertinent comments such as pointing out consistent deviations in error correction (e.g., failed to have student start sentence over or ignored self-corrections.)
Monitoring and enforcing choral responses:Did the teacher re-cue students when they did not respond in unison?
Monitoring and enforcing students’ “touching”: Were students monitored and reminded to follow along with their fingers as they or their peers were reading word lists or passages?
Allocation of time among students: Did the teacher seem not to attend to/call on a particular students for extended periods of time? Did you notice instances in which the teacher adjusted instruction to provide extra support to a student that appeared to have more difficulty than the others? ( The presentation guide suggests that if one student is having more trouble than others during group exercises, the teacher may ask the student to read through a whole exercise individually to firm up performance.)
Positive reinforcement and praise: Corrective Reading encourages teachers to give frequent verbal positive reinforcement and praise. Note as well whether the teacher gave negative feedback during the lesson or used negative language to keep students on task. (Comments on the general affective environment should be noted on the cover sheet.)
Use of point system: Using the PD+ and PD- codings as a guideline, comment on the teacher’s use of the point system as an integral part of instruction. Were students told in advance what the point value of the sections were? Were they cautioned to be careful as they approached the error limit for earning points on a particular activity? Were students given time to fill in points and reading speed graphs during the session?
Coding Notes for Corrective Reading 9

Organization and preparation: Evidence of both good and deficient organization and preparation should be noted. Was the progress of the lesson smooth or was it impeded by the teacher’s need to refer repeatedly to the lesson script? Were necessary materials accessible?
Treatment of reading comprehension: Did the teacher strictly adhere to the script or add questions? How much discussion of vocabulary occurred?
Modeling: Did the teacher pronounce sounds and words correctly? Note specific errors.
Other: You may add other comments that do not fall into the other categories.
Coding Notes for Corrective Reading 10

Coding Session-Level Fidelity for Corrective Reading
The intention of this second-order coding effort is to capture the degree of session level fidelity, using a set of dimensions that are as comparable as possible across programs. Each dimension is coded on a 3 point scale. A code of 3 indicates that performance on that dimension met criterion. A code of 2 indicates minor deviations from the criterion, and a code of 1 indicates moderate deviations. There were no instances of extreme deviations.
The second-order coding is based on the written records created by the video coders (hereafter called video records). When more than one video coder coded the same session, the second-order coding will be done separately on each record. In addition, each record will be coded by two second-order coders. All reliability estimates will be calculated based on the derived, second-order codes.
Second-order coders will work from the video records only (but with reference to the lesson materials as necessary). Because the video coders were instructed to note any deviations from expected performance, it will be assumed that, where no specific documentation is found to the contrary, the teacher was acting with fidelity.
Following Expected Lesson Plan
Coverage criterion is that all lessons, all exercises within lessons, and all sequential activities within exercises, are presented in the order specified by the instructors’ manual.
Code 3 if meets criterion. However, if the only deviation is the failure to mention student points in every instance when these are referenced in the script, the dimension should still be coded as 3 so long that there is some evidence that the teacher is keeping track of points earned and sharing this information with the students.
Code 2 if there are changes in the order of scripted activities or if any portion of a scripted exercise, other than a discussion of points, is omitted. For example, if the scripted comprehension questions are not presented during group reading, even though the group has met the specified criterion for mastery of that story segment (in terms of permissible numbers of errors). Document basis for code.
Code 1 if whole exercises are deleted. Document basis for code.
NOTE: Corrective Reading does not specify durations for lesson parts. Therefore, there is no criterion for duration, other than total session duration.
Proper Use of Program Techniques
Corrective Reading is very prescriptive regarding the expected techniques, all of which are specified in the instructor’s manual. Teachers are expected to read the script as written, to signal students for response so as to maintain choral response and lively pacing, to respond to student errors using a standardized routine, to enforce students following along with their finger whenever anyone is reading, to count points earned, and require students to repeat exercises or story sections until a mastery criterion is met. In addition, the teacher is expected to be accurate in her own pronunciation when dictating or modeling for students.
Coding Session for Corrective Reading 11

Code 3 if meets criterion or misses criterion only because three or four deviations such as the following are observed: a few words are modified in script, choral response is occasionally not enforced, or a few (~1-5) of students’ decoding errors are not corrected. With regard to correction of student errors, technique will be considered at criterion even if the script used in the correction routine is somewhat abridged, so long as the core of the correction routine is preserved. The core correction routine requires that 1) the teacher says the word or sound correctly, 2) the student says the word or sound correctly, and 3) the student goes back and re-reads the full line or sentence in which the error had been made. If the student self-corrects, step 1 may be absent and we will still consider that the core correction routine has been implemented.
Code 2 if the accumulation of deviations is more extensive. For example, there may be a number of uncorrected student errors, particularly during story reading; choral response may be consistently ragged; or the correction routine may be truncated to the extent that the core elements are no longer consistently preserved. Document basis for code.
Code 1 if there are major modifications to the script or if any the specified techniques for pacing, signaling, and/or responding to student errors are routinely ignored.
Management of Instruction
Criterion is that teacher appears well prepared and able to move through the session without having to review the script or lesson plan to determine what to do next. In addition, the teacher and students should have a routine for efficiently bringing out and putting away materials. Information on these points is contained on the general comments sheet prepared by the video coder.
Code 3 if meets criterion
Code 2 if minor problems such as the teacher needing to review instructions in the script or lesson plan during the course of the lesson or materials not being easily or efficiently retrievable. Document basis for code.
Code 1 if major problems such as the teacher showing marked unfamiliarity with instructional methods and materials or materials not being available. Document basis for code.
Positive Reinforcement and Praise
All of the programs instruct the teachers to give frequent praise and reinforcement to students. Information on this dimension is contained on the general comments sheet prepared by the video coder.
Code 3 if meets criterion
Code 2 if minor problems such as the teacher giving inconsistent praise and reinforcement or occasionally using negative language to bring students back on task. Document basis for code.
Code 1 if major problems such as the teacher rarely or never giving praise and reinforcement or consistently using negative language to bring students back on task. Document basis for code.
Coding Session for Corrective Reading 12

Affective Environment
This dimension refers to the rapport between teacher and students and the general level of supportiveness evident is the session. Information on this dimension is contained on the cover sheet prepared by the video coder.
Code 3 if appropriate.
Code 2 if minor problems such as the teacher evidencing impatience or irritation with one or more of the students a few times during the session or the teacher making limited effort to engage students in instructional activities. Document basis for code.
Code 1 if major problems such as the teacher evidencing impatience or irritation with one or more students for most of the session or the teacher routinely not addressing off-task behavior or lack of involvement of the students. Document basis for code.
Total Teaching Time
Criterion is 60 minutes. Compute duration as elapsed time minus any time off task or extended transition time. Video coders were instructed to ignore any time off task or transition time less than 1 minute. Therefore, individual instances of time off task or transition should not be counted for the second order coding unless they exceed 1 minute, even if the video coder did make note of them. (Exception is non-instructional time of any duration at the very beginning or end of the video, which should have been documented consistently by the video coders.) If the video record does not clearly separate out transition time—for example, if the record indicates a 3 minute segment which is described as “students get out their materials, teacher explains task, someone comes into room”—count the time as instructional.
Code 3 if total teaching time is at least 55 minutes.
Code 2 if total teaching time is at least 45 minutes but less than 55 minutes.
Code 1 if total teaching time is less than 45 minutes.
Coding Session for Corrective Reading 13

Description of the Spell Read P.A.T. Program and Conventions for Coding Spell Read Lessons
Overview of the Spell Read Program
Spell Read P.A.T. (Phonological Auditory Training) splits its hour-long sessions into two major periods: phonemic activities, during which students spend a good deal of their time manipulating sound cards and completing dictation exercises (approximately 37 minutes) and comprehension-focused reading and writing activities (23 minutes). The program has three major Phases, but all of the Power4Kids sessions involve lessons from the first two—about 2/3 of the sessions are in Phase A and the rest in Phase B.
In Phase A (60 lessons), students learn the 44 English sounds and their primary spellings, and reach “auditory/visual automaticity” to the first syllable level. In Phase B (40 lessons), students are taught secondary spellings of sounds, the consonant blends, and reach “auditory/visual automaticity” for two-syllable words. All students begin with Lesson 1 in Phase A and move sequentially through all the lessons. Different groups may progress at different rates, but all students within a single group move together.
Table 1: Spell Read Lesson Plan and Time Allocations
ActivityTime Allocation
(minutes)Phonemics (37minutes)
Review and remediation (typically, speed drills) 5-7New material (lesson parts from Instructor’s Manual) 30
Reading/writing (23 minutes)Re-cap of story 1.5Share-reading 15-18Recap of the day’s reading 1.5Writing 5
Phonemic Activities Period
Although this is not described in the Instructors’ Manual, the first few minutes of the Spell Read session is devoted to review and remediation activities. Typically, students have been assigned the task of practicing a pack of cards as homework, and during the first few minutes of the session the teacher times them as they read their cards.
Most of the phonemic activities period is devoted to covering new material from the carefully sequenced curriculum described in the Instructors’ Manual. Each lesson in the Manual consists of four numbered parts—for example, the parts of Lesson 3 are numbered 3.1, 3.2, 3.3, and 3.4. In the Manual, each lesson begins with lists of lesson objectives and the materials that will be needed during the lesson. Then the four parts are described. Each lesson part is a script for an activity, which includes speaking parts for the teacher and students, diagrams of card manipulations, and references to a variety of other resources that come into play during the activity.
Coding Notes for Spell Read Program 14

Typically, teachers cover about 4 lesson parts in a day. Although virtually always presented in sequential order, the lesson parts covered in the session often include the last part(s) of one lesson and the first part(s) of another (e.g., 34.4 through 35.3).
For purposes of coding, we are making a simplifying assumption that the teacher should teach all of the material in the sequence of lesson parts she covers. If the teacher skips some parts or combines them in some way, please code a deviation and describe what was skipped, combined, etc.
Spell Read lessons are scripted, but not to the same degree as Corrective Reading. Spell Read’s detailed scripts do not have to be reproduced word-for-word, but the tasks to be performed are so minutely described that teachers may find it convenient to stick pretty close to the wording in the Instructors’ Manual. There are no scripted routines for correcting student errors, and student responses are not choral. Unlike Corrective Reading, in which every lesson has the same four parts, there does not appear to be a repeating pattern of activity types in the Spell Read lessons described in the Manual.
Spell Read is distinctive for the sheer volume of “stuff” that the teacher and students must manage every day. A major part of the SR method is the manipulation of sound cards. These cards are numbered according to the lesson in which they are first introduced, but may be re-used in later lessons. A variety of other resources are also called into use in the scripts. Table 2 describes them.
Table 2: Spell Read Resources Mentioned in Lessons
Resource Location/UseCard Packs Many batches of small cards rubber-banded together. Each
card is labeled with the lesson number in which it is first introduced. Some of the card sets are used over and over for drills, games, etc. (Phase A Instructors’ Manual, Appendix IV lists the contents of some of the more important card packs, but at least one of these lists differs somewhat from the actual card pack.)
Numbered word/syllable lists Instructors’ Manual, at the end of the lesson part in which it is referenced.
Spelling lists in the teacher’s Spelling Book (the list numbering system is sequential, but otherwise mysterious—first spelling list is numbered S.I-L1)
Activity Book Student workbook. Often the teacher dictates an exercise and students write the answers on the appropriate page of their own books.
Answer Key Teacher hands these out after a dictation so that students can correct their own work. The answer key formatting allows the key page to be set alongside the page in the student’s activity book for easy checking.
Notes: Spell Read uses special orthographic conventions to represent many sounds (particularly vowel sounds). Thus, “oo” represents the vowel sound in “boot” and “o2o” represents the vowel sound in “look.” Much of the phonemic work is done with nonsense words/syllables such as moosh, o2osh, and eef. You should get familiar enough with this orthography to be able to identify student mispronunciations.
Coding Notes for Spell Read Program 15

Reading and Writing Activities
During the second period, the teacher and students take turns reading aloud from a leveled chapter book while the rest of the group follows along. (We don’t have copies of the books, and they are not crucial to our coding.) At the end of the session, the students spend 5 minutes free-writing in response to the reading. During the reading period, minor student errors are not corrected, and when a student has difficulty in decoding a word, the teacher supplies it quickly in order to preserve the flow of reading and the student’s concentration.
Table 3: Where to Find It in the Instructors’ Manual
Item Location in Phase A Instructors’ ManualAuthor’s general description of Spell Read: pages i-xDescriptions of procedures (build, blend, analyze, visualize, etc.)
Glossary beginning page 361; Lesson part where procedure is first
used (see Table 4)Details about review/remediation Material from author appended to this
memoDescriptions of games Appendix II, beginning page 365 (sorry, not
in alphabetical order)Lists of game card packs and study packs Appendix IV, beginning page 394
Table 4: Location of Process Descriptions in Phase A Instructors’ Manual
Process First description:Lesson (pages)
Second description:Lesson (pages)
Third description:Lesson (pages)
Building 3.3 (30-32)--- build/blend 3.3 (30) 5.3 (39)Listening 12.2 (82-84) 14.3 (97) 20.2 (135-136)
20.4 (137)Blending CV blending: 5.3 (39-
40)CV/VC blending: 12.2 (82-83)
Analyzing and synthesizing 14.3 (99) 20.3 (136)--- analyze/blend 32.1 (196)--- synthsize/scan 6.3 (48)Visualizing--- RRVW (recall, read, visualize, write)
2.4 (24-25) 3.1 (28-29)
Reading exercises--- share/shadow reading VSpelling 4.4 (35) 8.4 (52)Writing ViGames Slam (381-383) Secret 7 (384-386) Fish (366-375)
Coding Notes for Spell Read Program 16

Expectations (fidelity issues):
Not skipping pieces in the sequence of lesson parts outlined in the lesson plan Phonemic Activities: Correction of hand motions (i.e., pointing and sweeping) Phonemic Activities: Detection and corrections of errors in spoken sounds Dictation: sounds are supposed to be said twice with a pause in between to give students 2
chances to hear what is said and perhaps watch the teacher enunciate Reading: Interjecting words but not interrupting students as they read (see Instructor’s
Manual for a description) Reading: Enforcement of following along during shadow reading Reading: Should do story recaps at beginning and end of reading selection, as well as
intermittently during longer selections.
Preparing to Code Spell Read Lessons
General Preparation:
Read the overview of the Spell Read program in the Phase A Instructors’ Manual.
Preparation for Coding a Particular Video:
1. Read over the teacher’s lesson plan to see what Phase A/B lesson parts are expected to be covered during the video session.
2. Read over the relevant lesson part descriptions in the Instructors’ Manual to see what the activities cover. Some activities referenced in the lesson parts may actually be described in some detail earlier in the Instructors’ Manual—be sure you have familiarized yourself with these descriptions as well.
3. Identify all word lists, spelling lists (in the Spelling Book), procedures, games, and card packs mentioned in the various parts in the lesson plan, and organize them so they will be readily accessible as you watch the video. (Don’t bother with the student activity book or answer key.)
Coding Instructions
1. Timing and describing the parts of the lesson
Time stamp the beginnings and endings of the following lesson parts:
Review/remediation activities that initiate the lesson Each phonemic activity (lesson part, down to the capital letter level, e.g., 4.3 A, 4.3
B) covered (use the number and descriptive title provided by the Instructor’s Manual) Initial recap of the reading selection Oral reading of the selection Wrap-up discussion of the reading selection End-of-session writing time (please note if writing is given as homework in addition
to or in lieu of in-class writing)
Coding Notes for Spell Read Program 17
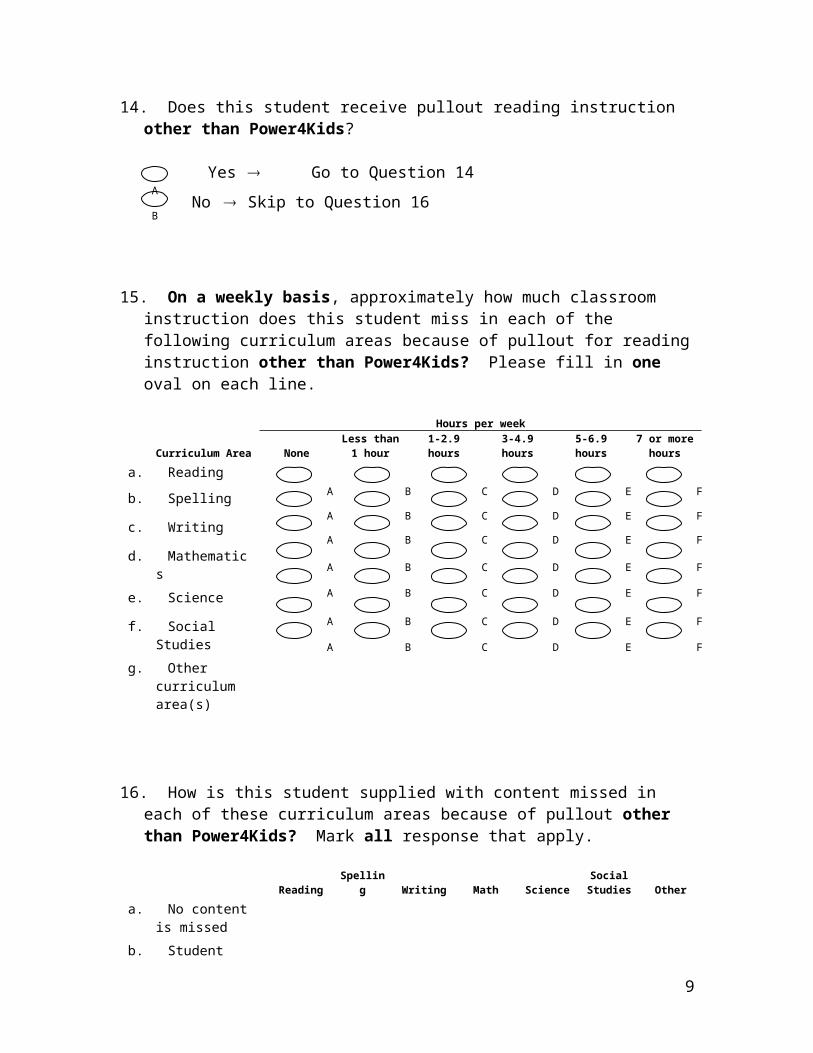
Time stamp beginning and end of each part; if transition time is noticeably long, describe what happens during transition time.
Briefly describe what happens in each part. HOWEVER, if the part follows the Instructors’ Manual as written, no description is necessary. Following are some specific things to note for the less scripted parts of the lesson:
For Review/remediation period: Describe activity. Identify card pack # if the teacher mentions it, but not otherwise (don’t try to figure out from available card packs)
For Initial recap of the reading selection, describe who is doing the talking, how the teacher reacts to student contributions, etc.
For Oral reading, note how much text is read at a single turn (a paragraph, a page, etc.) Also note and time stamp any summarizing/comprehension dialogue that is interspersed during the reading.
For Wrap-up discussion, describe who is doing the talking, how teacher reacts to student contributions, etc.
2. Codes for phonemic lesson parts
Code Description Details (include in the description)
Time stamp*
EN Teacher misses/does not react to an error in encoding or decoding (don’t count errors in hand movements here)
Describe the error that was missed and any relevant circumstances (if there are any) that might explain why no correction was made.
Yes
CS Teacher corrects error in encoding or decoding Describe the error that was made. Describe the correction procedure and/or student outcome only if unusual
Yes
CN Teacher “corrects” an error, but introduces another error by mispronouncing, etc. (unlikely)
Describe the error that was made and the teacher’s actions
Yes
H+ or H-
Specific hand movements are required for most parts of the lesson (except where students are writing) An H+ should be coded if no student errors are made OR if teacher appropriately corrects student errors. An H- should be coded if the teacher fails to correct one or more errors
For H+, note whether the students had no errors or whether the teacher acted to appropriately correct any errors made.For H-, note type and extent of errors not corrected.
Yes
TO Excessive time off-task (more than a minute) Include a brief description YesVC Extended discussion of vocabulary words Include a brief description of
what was saidYes
DV Use this deviation code for 1) errors in modeling by teacher, 2) omissions or additions to scripted sections, 3) anything else that looks like a significant deviation from procedures described in the Instructors’ Manual. (Deviations are not necessarily errors.)
Include a brief description of the deviation and any information you think is needed to put the deviation in context.
Yes
*Codes that are not time stamped should be entered at the end of a lesson part
Coding Notes for Spell Read Program 18

3. Codes for reading/writing lesson parts
Code Description Details (include in the description) Time stamp*
CS Teacher corrects error in encoding or decoding
Describe the correction procedure and/or student outcome only if unusual
Yes
CN Teacher does not act rapidly (delays more than 2-4 seconds) to provide the initial sounds or the whole word that the student is struggling with
Include a brief description Yes
CX Teacher stops student for non-essential corrections; employs an extended error-correction routine
Describe the student’s error and the teacher’s correction procedure.
Yes
CC Comprehension check/discussion within oral reading section
Just note the time. (The goal here is just to keep a tally of the number of CCs, but time stamps will allow us to find them quickly for review.)
Yes
H+ or H-
During reading, all students are expected to follow the text with their finger. An H+ should be coded if no student errors are made OR if teacher appropriately corrects student errors. An H- should be coded if the teacher fails to correct one or more errors
For H+, note whether the students had no errors or whether the teacher acted to appropriately correct any errors made.For H-, note type and extent of errors not corrected.
Yes
TO Excessive time off-task (more than a minute)
Include a brief description Yes
VC Extended discussion of vocabulary words
Include a brief description of what was said Yes
DV Deviation from expected delivery of the lesson part. (Remember, deviations are not necessarily errors.)
Although teachers have substantial latitude in these sections, use this code for anything that looks like a substantial deviation of procedure that has not already been covered by the other types of codes. Include a brief description. Write a brief description of the deviation, including any information you think is needed to put the deviation in context.
Yes
*Codes that are not time stamped should be entered at the end of a lesson part
4. Cover and comments sheets
After the entire session has been viewed, the cover sheet should be filled out. The video number, teacher’s name, session date, lesson number (s), students at the beginning and end of the session, coder’s initials, and dates of the coding should be recorded. A brief summary of the types of motivators (stickers, candy, etc.) observed and whether homework was assigned or turned in should be added in the appropriate boxes. “Nothing observed” may be entered as appropriate. A brief description of the instructional space (was it adequate in size, noisy, crowded, etc.?) and the affective environment of the lesson (teacher-student rapport, general supportiveness on the part of the teacher, evidence of frustration by teacher or students, etc.) should also be entered in the appropriate boxes.
Coding Notes for Spell Read Program 19

The “General Comments” sheet should also be filled out. Each of the topics listed below should be addressed in the comments. If a teacher’s actions were “unremarkable” with regard to a particular topic, and if no quantification of data needs to be recorded, please enter “Appropriate” or “OK” into the line. If more comments are needed, please write them succinctly but with enough detail to provide real information about your observations.
Correction Routines:
Phonemics—Count up the number of instances of EN, CS, and CN errors. Indicate the general pattern of the teacher’s approach if noteworthy. Note if errors are primarily being made by a single student (could be evidence that group is significantly heterogeneous in level). Note if it was difficult to observe ENs. (e.g., because you couldn’t see the cards to know what the student should be saying)
Reading—Count up the number of instances of CS, CN, and CX errors. Indicate the general pattern of teacher’s approach if noteworthy. Note if errors are primarily being made by a single student (could be evidence that group is significantly heterogeneous in level).
Hand motions—Indicate the general pattern of the teacher’s approach if noteworthy. Note if it was difficult to observe hand motions.
Pacing: Did the teacher allocate at least 20 minutes to the reading and writing activity? Did it appear that the teacher had to abbreviate or drop some or all of a part in order to finish the phonemic activities on time? (Note that there is no set expectation for the number of phonemic lesson parts that will be completed on a given day. However, bad pacing could be evident if the teacher appears caught up short when the time allocated to phonemic activities runs out.) Also note whether the teacher uses a timer or some other device to pace the lesson.
Organization and Preparation: The teacher should be familiar with the lesson before presenting it, and should not need to take time to read the instructions to figure out what to do next, should follow the lesson sequence as given, etc. Was the smooth progress of the lesson impeded by the teacher’s need to refer repeatedly to the lesson script?
Materials Management:Did it appear that the teacher and students had a routine for efficiently bringing
out and putting away materials such as card packs and student workbooks?
Allocation of Time Among Students: Did the teacher seem not to attend to/call on particular students for extended periods of time? Did you notice instances in which the teacher adjusted instruction to provide extra support to a student that appeared to have more difficulty than the others?
Positive Reinforcement and Praise: Did the teacher praise students for few or no errors, for effort, for good behavior, etc.? Teachers vary in their demonstrativeness. However, they should engender a positive, supportive atmosphere in their classes. In particular, note instances of negative feedback.
Other Comments: Any other comments worthy of note?
Coding Notes for Spell Read Program 20

AppendixProgram Developer’s Notes on the Initial Drill/Remediation Section of the
Lesson
In regard to the review and remediation, this is taught to the teachers although it is not in the manual. After lesson 10, we find that in order for the students to become not only accurate but automatic, a review is needed each day. This is a regular part of the lesson plan (or should be). These activities are drawn from the previous lessons or speed packs.
Phase A Review & Remediation (from Author)
If a student is not decoding fast enough, it is generally a result of a lack of automaticity at the sound level, either CV/VC or CVC. When this occurs, we need to find the source of the difficulty that is limiting the automaticity. The following chart can be useful for review, and may prove helpful in identifying and helping to remediate specific problems. The student must be able to listen, analyze, analyze/blend, blend, spell, read, and speed-read, automatically at each level.
CV/VC LEVEL CVC LEVELStudy Packs Vowels Spelling S.I Syllable Chart
CV/VCSpelling S.II Syllable
Chart CVC10.3 oo ee aw
oy a_eS.I – L.6
Ans. Key p. 149.3
19.3 oo ee aw oy a_e
S.II – L.3Ans. Key p. 30
Syllable Chart 19.2
a_e _a_ S.I – L.13Ans. Key p. 37
19.2 S.II – L.4Ans. Key p. 39
23.3 _o_ _a_ S.I – L.15Ans. Key p. 43
S.II – L.5Ans. Key p. 44
26.3 _o_ _a_a_e
S.I – L.16Ans. Key p. 46
S.II – L.6Ans. Key p. 48
31.3 _o_ _a__u_
S.I – L.24Ans. Key p. 61
S.II – L.11Ans. Key p. 71
41.3
45.3 _e_ _i_i_e ar
S.I – L.26 &L. 27
Key p. 74& 83
S.II – L.13Ans. Key p. 80
43.3
46.3 _a_ _i__e_
S.I – L.29Ans. Key p. 91
S.II – L.15Ans. Key p. 92
Syllable Chartoo o2o
_o_ _u_
oo o2o_o_ _u_
S.I – L.31Ans. Key p.
103
Syllable Chartoo o2o
_o_ _u_
S.II – L.18Ans. Key p. 105
59.3 All vowelsCV/VC/CVC
S.I – L.32Ans. Key p.
112
S.II – L.20Ans. Key p. 114
58.2
60.3 or er aru_e o2o
Syllable Chartor ar er
S.II – L.19Ans. Key p. 108
Coding Notes for Spell Read Program 21

Coding Session-Level Fidelity for Spell-Read
This second-order coding is based on the written records created by the video coders (hereafter called video records). When more than one video coder coded the same session, the second-order coding will be done separately on each record. In addition, each record will be coded by two second-order coders. All reliability estimates will be calculated based on the derived, second-order codes.
Second-order coders will work from the video records only (but with reference to the lesson materials as necessary). Because the video coders were instructed to note any deviations from expected performance, it will be assumed that, where no specific documentation is found to the contrary, the teacher was acting with fidelity.
Each dimension is coded on a 3 point scale. A code of 3 indicates that performance on that dimension met criterion. A code of 2 indicates minor deviations from the criterion, and a code of 1 indicates major deviations.
Following expected lesson plan—phonics
1. Coverage criterion is that all lessons, and all sequential activities within lessons, are presented in the order specified by the instructors’ manual. Also that a review step is implemented in any session in which the students have moved beyond lesson 10. It is not necessary that the review step be the first activity of the day. Further, if the lesson in the instructor’s manual begins with a review (such as a review of all consonants), then the requirement for a separate review step is relaxed. An exception to the published sequence of lessons is expected during phase B to allow for early introduction of secondary vowel sounds.
Code 3 if meets criterion.
Code 2 if there are changes in the order of scripted activities or if the review step or some scripted scaffolding activities (e.g., analyze before spelling) are deleted. Document basis for code.
Code 1 if whole steps or sub-steps are deleted. Document basis for code.
Code 9 (dimension not applicable) if the session does not include any phonics.
2. Duration criterion is that 35-37 minutes are devoted to phonics. Compute duration as elapsed time minus any time off task or extended transition time. Video coders were instructed to ignore any time off task or transition time less than 1 minute. Therefore, individual instances of time off task or transition should not be counted for the second order coding unless they exceed 1 minute, even if the video coder did make note of them. (Exception is non-instructional time of any duration at the very beginning or end of the video, which should have been documented consistently by the video coders.) If the video record does not clearly separate out transition time—for example, if the record indicates a 3 minute segment which is described as “students get out their materials, teacher explains task, someone comes into room”—count the time as instructional.
Code 3 if duration is within 5 minutes of criterion (between 30 and 42 minutes) Record actual duration.
Coding Notes for Spell Read Program 22

Code 2 if duration is off by more than 5 minutes. Record actual duration.
Code 1 if entire phonics segment is missing.
Following expected lesson plan—reading and writing
1. Coverage criterion is that the lesson includes share reading, recap of story at beginning and end of share reading, and writing. (If the group is starting a new story, we would expect the teacher to begin the reading activity with a preview, such as reading the blurb from the book cover, rather than a recap.) It is permissible to assign writing as homework during the final weeks of the program to allow more time for reading. (We will operationalize “final weeks” as April forward.)
Code 3 if meets criterion
Code 2 if the writing activity is assigned as homework (and session occurs before April). Another reason for coding a “2” would be if the oral recap was omitted (whether or not students were instructed to use their writing time to summarize what they had read).
Code 1 if either share reading or writing is entirely absent. Document basis for code.
Code 9 (dimension not applicable) if the session does not include any reading/writing.
2. Duration criterion is that 23-26 minutes are devoted to reading and writing. Compute duration as elapsed time minus any time off task or extended transition time. (See #2, above, for discussion of how to calculate time off task/transition time.)
Code 3 if duration is within 4 minutes of criterion (between 19 and 30 minutes) Record actual duration.
Code 2 if duration is off by more than 4 minutes. Record actual duration.
Code 1 if entire reading/writing segment is missing.
Proper use of program techniques—phonics
Criterion is following the routines as specified in instructor’s manual, including appropriate correction of students’ decoding/encoding errors and hand gestures. Exception is that teachers do not necessarily have to say the words twice during dictation after lesson 30 if the dictation is part of a review. In addition, the teacher should pronounce all sounds and syllables correctly when modeling or dictating.
Code 3 if meets criterion or misses criterion only because a few (~1-3) of students’ decoding/encoding errors are not corrected or because some errors in hand gestures go uncorrected. Acceptable variations that will still be coded as 3 include rearranging the order of word lists or demonstrating the first instance of a new activity (rather than simply having the students work through the activity).
Code 2 if teacher makes minor modifications to the routines specified in instructor’s manual (e.g., interjects corrections during spelling practice or leaves out scripted explanations
Coding Notes for Spell Read Program 23

of phonemic rules, such as the fact that the “ou” spelling of /ow/ always appears in the medial position). Also code 2 if more than a few of students’ decoding/encoding errors go uncorrected, if hand gestures are routinely not enforced, or if teacher mispronounces one or two sounds or syllables. Document basis for code.
Code 1 if there are major modifications to routines, if student errors are routinely not corrected, or if teacher consistently mispronounces some sounds or syllables. Document basis for code.
Code 9 (dimension not applicable) if the session does not include any phonics.
Proper use of program techniques—reading and writing
1. Criterion is that recaps provide clarity, teacher and students take turns during share reading, student decoding errors are corrected in such a way as to minimize disruption to the flow of reading (this would include allowing minor errors to pass uncorrected if they don’t distort meaning), and that the emphasis in writing is on creating an opportunity for free expression rather than on the mechanics of writing. Teacher is expected to enforce tracking text with finger only if students are having trouble following text.
Code 3 if meets criterion or misses criterion only because a few (~1-5) student decoding errors are corrected inappropriately. With regard to enforcing text tracking, it may be ambiguous as to whether or not the teacher acted appropriately (if we can’t judge whether or not the student needs this aid). When in doubt, credit the teacher with having made the right choice.
Code 2 if there are minor problems with any of these components such as the teacher being inconsistent about reminding students to track or part of writing instruction is devoted to proofreading and mechanics of writing rather than free expression. Document basis for code.
Code 1 if there are major problems with any of these components such as the teacher making an excessive number of unnecessary corrections that interfere with fluency or the entire emphasis in writing instruction is on proofreading and mechanics of writing rather than free expression. Document basis for code.
Code 9 (dimension not applicable) if the session does not include any reading/writing.
Management of instruction
1. Criterion is that teacher appears well prepared and able to move through the session without having to review the script or lesson plan to determine what to do next. In addition, the teacher and students should have a routine for efficiently bringing out and putting away materials. Information on these points is contained on the general comments sheet prepared by the video coder.
Code 3 if meets criterion
Code 2 if minor problems such as the teacher needing to review instructions in the script or lesson plan during the course of the lesson or materials not being easily or efficiently retrievable. Document basis for code.
Coding Notes for Spell Read Program 24

Code 1 if major problems such as the teacher showing marked unfamiliarity with instructional methods and materials or materials not being available. Document basis for code.
Positive reinforcement and praise
1. All of the programs instruct the teachers to give frequent praise and reinforcement to students. Information on this dimension is contained on the general comments sheet prepared by the video coder.
Code 3 if appropriate
Code 2 if minor problems such as the teacher giving inconsistent praise and reinforcement or occasionally using negative language in correcting errors or bringing students back on task. Document basis for code.
Code 1 if major problems such as the teacher rarely or never giving praise and reinforcement or consistently using negative language in correcting errors or bringing students back on task. Document basis for code.
Affective environment
1. This dimension refers to the rapport between teacher and students and the general level of supportiveness evident is the session. Information on this dimension is contained on the cover sheet prepared by the video coder.
Code 3 if appropriate.
Code 2 if minor problems such as the teacher evidencing impatience or irritation with one or more of the students a few times during the session or the teacher making limited effort to engage students in instructional activities. Document basis for code.
Code 1 if major problems such as the teacher evidencing impatience or irritation with one or more students for most of the session or the teacher routinely not addressing off-task behavior or lack of involvement of the students. Document basis for code.
Total teaching time
1. Criterion is 60 minutes. Record sum of Phonics duration and Reading/Writing duration. This should be inclusive of all instructional time on video.
Code 3 if total teaching time is at least 55 minutes.
Code 2 if total teaching time is at least 45 minutes but less than 55 minutes.
Code 1 if total teaching time is less than 45 minutes.
Coding Notes for Spell Read Program 25

Coding Notes for the Wilson Reading Program
Overview of the Wilson Program
The Wilson instructors’ manual provides teachers with a carefully sequenced curriculum and a framework for planning daily instruction. The curriculum is divided into a dozen major steps, each of which is broken down into several sub-steps—however, all of the Power4Kids videos fall between sub-steps 1.4 and 5.5. Typically, each sub-step is worked through in 3-4 days.
Content for each sub-step is described in the Instructors’ Manual. In addition, the teacher uses a Dictation Book, which contains lists of syllables, words, and sentences keyed to each sub-step. She also has a supply of sound, syllable, and word cards for use during the lesson. Students work out of Readers and Workbooks in which material is also organized by sub-step. Students also frequently use a “magnetic journal” (magnetized tiles) and sometimes a Magna Write (magnetic) slate, and they keep personal binders full of notes and completed exercises.
In each Wilson sub-step, some new concepts are introduced and practiced to mastery, and material from previous sub-steps is recycled for review and strengthening. New material is generally introduced on the first day of the sub-step. Initially, practice on the new material focuses on accuracy, using real words. Later in the sequence of lessons for that sub-step, the new concepts are practiced using nonsense words to prepare students to apply the rules to unknown words they will encounter in the future. Finally, the focus turns from accuracy to fluency (more rapid recognition and speeded work). Student progress is charted and, when most of the students in the group have achieved mastery, the group moves on to the next sub-step.
The classical Wilson lesson (i.e., a session conducted on a single day) has 10 parts, each of which is devoted to a particular kind of activity. The parts are numbered 1 through 10, are to be presented in numeric order, and take a specified amount of time to complete. The P4K Wilson lessons never have all 10 parts, but the parts that are given are always presented in numeric order, and, with the exception of steps 9 and 10, can be expected to take the same amount of time as given in the standard lesson outline. To accommodate the Power4Kids research design, Barbara Wilson wrote a 4-day lesson cycle that specifies which lesson parts are to be used for lessons that focus on 1) introducing new material; 2) accuracy practice with real words; 3) accuracy practice with nonsense words, and 4) fluency practice. It was also specified that only 10 minutes of any P4K session would be devoted to step 9 or 10; this is less than the time devoted to these steps in the standard lesson outline.
The program is not scripted word-for-word, but does provide guidelines for several key procedures such as introducing new concepts, tapping out the sounds in syllables, and using questions to help students correct their mistakes. The instructors’ manual specifies the new concepts to be introduced in each sub-step, but teachers are given considerable latitude in selecting materials from prior lessons to review each day.
Activities within some parts of the lesson are very consistent from day to day. For instance, Part 1 always looks much the same, consisting of a warm-up drill on sound-letter correspondences that have been taught to date. On the other hand, Part 3 is an example of a lesson part than can vary from day to day anteacher to teacher because teachers can use a variety of different “games” in this part of the lesson. On some days they may also introduce sight words during Part 3.
Coding Notes for Wilson Reading Program 26

Preparing to Code Wilson Lessons
General Preparation:
Become familiar with the major parts and procedures of the Wilson lesson and the scope and sequence of Steps 1 through 5 (see handouts).
Preparation for coding a particular video:
1. Read over the sub-step description in the instructors’ manual to see what new concepts are covered during the sub-step, what the authors say about how the information should be explained, and what reinforcing questions should be “woven” throughout the sub-step.
2. Read over the teacher’s lesson plan to see what activities are expected during the session. In particular, check to see if the lesson emphasis is introductory, accuracy practice, or fluency practice.
3. Review the appropriate pages from the teachers’ dictation book and the student workbook and reader.
Coding Instructions
1. Naming and timing the parts of the lesson
Code the beginning and ending times of each major part of the lesson using the part numbers and titles in the generic Wilson lesson plan.
In parts with more than one distinct activity, please also mark the beginning and ending of each activity. Here are some examples of lesson parts in which we would want you to mark two separate activities:
1. In Part 3, teacher has students play a game, then teaches a set of sight words
2. In Part 6, teacher has students spell regular words with magnetic tiles, then use Magna Write to spell sight words
3. In Part 9, teacher pre-teaches what will be in the reading by drawing pictures on a blackboard, then has the students read the story
2. Codes with general applicability
Correcting errors (do not code errors/corrections in the drills in Parts 1 and 6).
A principal form of instruction is guiding students to correct their errors by asking questions rather than simply supplying the correct answer. In many cases, simply directing a student to look again at a word is sufficient to produce an error correction. In other cases, the teacher may have to produce a series of “analytic” questions and suggestions to get the student to analyze the word and read or spell it correctly. Each error correction should be time stamped and described:
Coding Notes for Wilson Reading Program 27
Code Code Description Details (include in your description of the event)
EN Teacher misses/does not react to an error. (Teachers are not required to react to self-corrected utterances except in part 4 charting.)
CR Teacher manages to produce the correction simply by redirecting the student’s attention to the misread/misspelled word.
CA Teacher generates one or more analytic questions or suggestions
Examples:Teacher asks student to break the word into syllables and sound it out.Teacher suggests tapping.Teacher refers to the “key word” for the sound a letter makes.Teacher refers to a rule (e.g., about silent e, how to divide words into syllables, etc.).Teacher appeals to student’s own word knowledge (“Does that sound right?”).
CX Teacher simply supplies the correct answer
This might be in lieu of a CA or at the end of several CAs that fail to bring the student to a correction
Weaving Questions for Reinforcement
The sub-step-specific word lists in the Student Readers are keyed to the new concepts that are being practiced. In addition to correcting student errors, the teacher can also reinforce the main ideas of the sub-step by asking analytic questions even when the words have been read correctly. (e.g., What are the digraphs in “check”? Show me how you break “Atlantic” into syllables.) In all parts of the lesson, except in Parts 2 and 7 when new concepts are first being explained, mark an R+ whenever the teacher asks a question relating the concepts being covered in the sub-step. If no reinforcement questions are asked, code an R- at the end of the part. Code Description Details (include in the
description)R+ or R- Teacher does/does not explicitly reference
new concepts
Reinforcing Independence and Self-reliance
One of the Wilson program goals is to help students to become confident and independent readers. Teachers are urged to acknowledge and praise students’ efforts to figure things out for themselves. The program also has the students keep a personal binder that contains information about words, spelling rules, sight words, etc. that they have learned. Students are allowed to use their binders as a reference at any time—e.g., to recall how to spell a sight word. Time stamp instances of teachers reinforcing students’ self-reliance through praise or use of their binders.Code Description Details (include in the
Coding Notes for Wilson Reading Program 28

description)P+ Teacher praises student for self-reliance
or encourages use of binders.(Note that this code is not intended to be used for all forms of praise, only praise for being self-reliant)
Include a brief description of what was said.
Providing Cognitive Rationales for Lesson Activities
The rationale underlying the strategies that Wilson teaches is that the activities help the brain remember how to read, write, etc. Some teachers build such “helping the brain” comments into their teaching.
Code Description Details (include in the description)
B+ Teacher refers to helping the brain, training the hand, etc. as an explanation for activities such as air-writing, magna write tracing, saying words before writing them, etc. Also code other references to learning processes—e.g., prediction that practice will lead to mastery, explanation of being in a practice stage with new material, etc.
Include a brief description of what was said.
Excessive Time Off-task
In order to get through all the material in the lesson plan, teachers must keep students on-track, adhere to the time allocations specified for each part, and manage the Wilson materials efficiently to accomplish quick transitions.
Code Description Details (include in the description)
TO Excessive time off-task (more than a minute)
Include a brief description of the delay (e.g., discussion with students, can’t find materials, checking the Instructor’s Manual, etc.)
Extended Vocabulary Explanations
The Power4Kids modification of the Wilson lesson plan excluded explicit vocabulary-building instruction, though incidental explanation of words was permissible. Please time stamp any instances of vocabulary-related discussions that go on for more than a couple of sentences. In the example video, the teacher asks a student if he has ever played chess and later affirms his response (“no, but I’ve played checkers”) by saying that chess and checkers are both played on the same kind of board. This is a minimal discussion that should not be time stamped.
Coding Notes for Wilson Reading Program 29
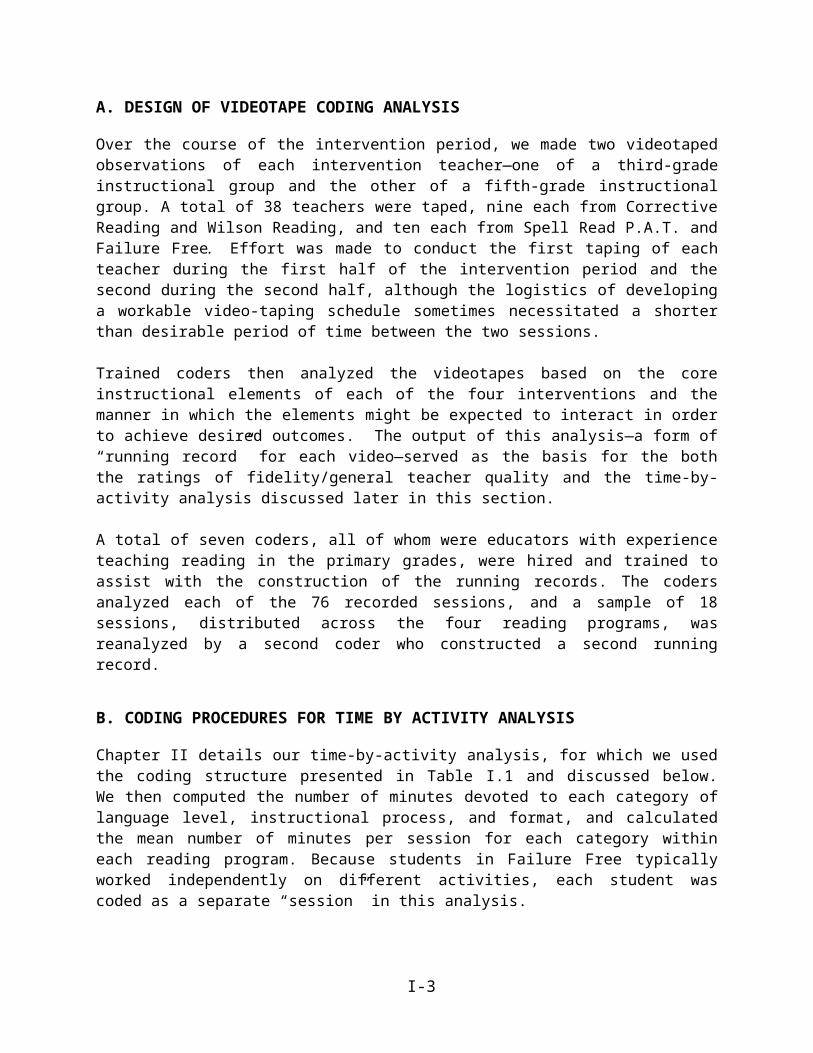
Code Description Details (include in the description)
VC Extended discussion of vocabulary words.
Include a brief description of what was said.
3. Descriptions and deviations to be noted for each lesson part (codes DV and NC)
Table A provides guidance for describing and entering “deviation” (“DV”) codes for each lesson part. Also, in Parts 2, 3, or 7, please mark an “NC” if the teacher introduces new concepts or new sight words.
Descriptions. Please include a brief (even minimal) description of what occurred during each part of the lesson. The table lists specific information we would like to know. Make other comments as needed.
Deviations. Although Wilson lessons are not scripted, teachers are expected to follow general guidelines for each lesson part and procedure, and to present all the scheduled parts of a lesson. When you encounter a deviation from expectations, please time stamp the event, add the code “DV”, and provide a brief explanation. For instance, if the teacher skips a part of the lesson, code DV at the place where you would expect the part to start and add a comment that the part did not occur and the reason if it is known (e.g., “Part 9 omitted—students had to leave for other appointments several minutes before the end of the session.
Table A: Descriptions and Deviations for Lesson Parts
Part Specific descriptive information to include
Expectations (mark and describe deviations including omissions)
1. Quick Drill
Who conducts the drill—teacher, student, or both?
Does the drill work through various categories of sounds that the teacher names (e.g., vowels, then digraphs, then welded…), or are the sounds called essentially at random?
Vowels are always included Vowels are always presented as letter—
keyword—sound. (Later, when students have learned multiple sounds for individual vowels, all of the sounds are enunciated.)
“New” or current sound types are always included (key words are not necessarily used)
A selection of other consonants is included (keywords not necessarily used)
2. Concepts for reading
If new material is introduced, provide a brief description of the presentation. What was introduced? To what extent did the teacher’s presentation cover the ideas and explanations provided in the Instructor’s Manual?
Was the teacher’s presentation organized or chaotic? Did she satisfactorily address students’ questions (if any) during the discussion?
Part 2 always involves the teacher manipulating cards to teach word structure and practice reading. (Teacher having students construct the words would be a deviation, but sometimes students are asked to assist in putting cards back in order.)
Syllables are regularly tapped out through Step 2 and tapping may be resorted to in later steps as needed.
In Steps 3 and above, syllable and suffix cards are used.
Coding Notes for Wilson Reading Program 30

Table A: Descriptions and Deviations for Lesson Parts (cont.)
Part Specific descriptive information to include
Expectations (mark and describe deviations including omissions)
3. Word cards
What activities were done? (e.g., “Go Fish game”, introduction of sight words, sight words and sentences added to notebook)
Note that there should be separate time stamps for substantively different activities within part 3—e.g., playing a game versus learning new sight words
Word card manipulation activities in which students are required to analyze words (tap them, describe features) and read them aloud.
4a. Wordlist reading (group activity)
Words are read out of Student Readers. Teacher uses the word lists as the basis
for further reinforcement of current concepts.
4b.Individual charting (does not happen every day)
How was charting handled? (Ideally, teacher has a special place for this work to be done so that the encounter is semi-private between teacher and student.) What did other students do which charting was going on?
Did student read from Student Reader or Fluency Drill pages? (End-of-step fluency drills are available in our resource bin, but not in the individual video folders.)
NOTE: Please indicate cases where charting was done but was inaudible.
Student is given time to practice with a set of words that are not used during the actual charting.
Student’s first utterance is counted (self corrected words are still counted as errors)
Teacher gives students the result of the drill, discusses student’s trouble spots.
Student marks score on a progress chart (kept in binder)
5. Sentence reading
How many sentences did each student read?
Up to 10 sentences will be read. Students read silently, then orally. Students use pencils to scoop phrases
(teacher models scooping in early substeps)
(Questioning to guide students through difficult words will be registered with a time-stamped R+)
6. Drill in reverse
How were students drilled? (i.e., magnetic journal? Magna Write board? “Wrote” with fingers on the table? Wrote on paper?)
Teacher asks “What says….” Students say the sounds before and
while pointing to or writing the letters representing the sounds.
Coding Notes for Wilson Reading Program 31

Table A: Descriptions and Deviations for Lesson Parts (cont.)
Part Specific descriptive information to include
Expectations (mark and describe deviations including omissions)
7. Spelling Concepts
If new material is introduced, provide a brief description of the presentation. What was introduced? To what extent did the teacher’s presentation cover the ideas and explanations provided in the Instructor’s Manual?
Was the teacher’s presentation organized or chaotic? Did she satisfactorily address students’ questions (if any) during the discussion?
Sound cards or tiles are used in early steps
Syllable cards are used in substep 3.1 and later as multisyllabic words are covered.
Blank cards (colored ivory, orange, and green) may be used in some exercises.
8. Dictation Please note number of each item type presented— Sounds Real words Nonsense words Sight words Sentences
See description on page 22 of Instructor’s Manual (basically, students repeat orally before writing, and while writing sounds and individual words.
Instructor includes 5 sounds, 5 real words, 5 nonsense words, 2-3 sight words as necessary, and 2-3 sentences.
Students are supposed to circle errors and write the correction nearby rather than to erase the errors.
Words are marked up according to teacher instructions. Sentences are proofread according to checklist instructions
9 or 10. (one or the other would be included, never both)
Describe prereading activity/activitiesWhat was read?
Students read silently, tracking with pencil.
Teacher models visualization/retelling process
Students visualize passage (retells, replays)
Students read passage aloud
4. Cover and Comments Sheets
After the entire session has been viewed, the cover sheet should be filled out. The video number, teacher’s name, session date, lesson number (s), students at the beginning and end of the session, coder’s initials, and dates of the coding should be recorded. A brief summary of the types of motivators (stickers, candy, etc.) observed and whether homework was assigned or turned in should be added in the appropriate boxes. “Nothing observed” may be entered as appropriate. A brief description of the instructional space (was it adequate in size, noisy, crowded, etc.?) and the affective environment of the lesson (teacher-student rapport, general supportiveness on the part of the teacher, evidence of frustration by teacher or students, etc.) should also be entered in the appropriate boxes.
The “General Comments” sheet should also be filled out. Each of the topics below should be addressed in the comments. If a teacher’s actions were “unremarkable” with regard to a particular topic, and if no quantification of data needs to be recorded, please enter “Appropriate” or “OK”
Coding Notes for Wilson Reading Program 32

into the line. If more comments are needed, please write them succinctly but with enough detail to provide real information about your observations.
Correction Routines: First, count up the number of instances of EN, CR, and CA, and CX errors. Indicate how teachers were deviating from the correction rountine, if they did.
Pacing: Did the teacher get through all of the parts of the lesson during the hour? Was it necessary to abbreviate or drop some or all of a part in order to finish on time?
Organization and Preparation: The teacher should have familiarized herself with the lesson before presenting it, and should not need to take time to read the instructions to figure out what to do next, should follow the lesson sequence as given, etc. Was the smooth progress of the lesson impeded by the teacher’s need to refer repeatedly to the lesson script?
Materials Management: Did it appear that the teacher and students had a routine for efficiently bringing out and putting away materials such as magnetic journals and personal notebooks?
Classroom Management During Individual Checkouts:If the lesson included charting, how were other students occupied while the teacher worked one-on-one with individual students?
Allocation of Time Among Students: Did the teacher seem not to attend to/call on particular students for extended periods of time? Did you observe instances in which the teacher provided extra support to a student that appeared to have more difficulty than the others?
Positive Reinforcement and Praise: Did the teacher praise students for few or no errors, for effort, for good behavior, etc.?. Teachers vary in their demonstrativeness. However, they should engender a positive, supportive atmosphere in their classes. In particular, note instances of negative feedback.
How Teachers Keep Time: Do they use a timer for each activity and move on to the next activity when the timer sounds? Do they display the 10-part lesson plan chart and comment when they move between parts? Do they have students set the timer? Do they have students move a marker down the lesson plan chart as the lesson progresses?
Other Comments: Any other comments worthy of note?
Coding Notes for Wilson Reading Program 33

Coding Session-Level Fidelity for Wilson Reading
The intention of this second-order coding effort is to capture the degree of session level fidelity, using a set of dimensions that are as comparable as possible across programs. Each dimension is coded on a 3 point scale. A code of 3 indicates that performance on that dimension met criterion. A code of 2 indicates minor deviations from the criterion, and a code of 1 indicates moderate deviations. There were no instances of extreme deviations.
The second-order coding is based on the written records created by the video coders (hereafter called video records). When more than one video coder coded the same session, the second-order coding will be done separately on each record. In addition, each record will be coded by two second-order coders. All reliability estimates will be calculated based on the derived, second-order codes.
Second-order coders will work from the video records only (but with reference to the lesson materials as necessary). Because the video coders were instructed to note any deviations from expected performance, it will be assumed that, where no specific documentation is found to the contrary, the teacher was acting with fidelity.
Wilson Reading provides a lesson template, but teachers are expected to tailor the specific activities to address the particular needs of their students. That is, if students are having difficulty with particular sounds or concepts, these should be emphasized in the review portions of the lessons. The decision of when to move on to the next lesson sub-step is also based upon the teacher’s judgment and student test results. These planning functions are not readily evaluated with the video sampling used in this study. We have coded aspects of fidelity that can be evaluated based on a video sample and in the absence of detailed information about each child’s progress. Following expected lesson plan—decoding
1. Coverage criterion is that all 5 decoding lesson parts are covered in each session. These parts are Sound Cards Quick Drill, Teach and Review Concepts for Reading, Wordcards, Wordlist Reading, and Sentence Reading. On some days, Wordlist Reading practice is replaced by individual student charting for accuracy or for fluency. During each lesson part, the teacher should engage students with a combination of review material and material newly introduced in this sub-step. Since a single sub-step will occupy four or more class sessions, the emphasis on teaching versus re-teaching or reviewing will vary from day to day.
The teachers’ manual includes specific guidelines for presenting and practicing the new material in each sub-step. However, since the teacher has several days to cover one sub-step, it is not possible to know whether material omitted on one day was covered on another. For that reason, the decoding coverage criterion cannot be further specified beyond the 5 lesson parts and the expectation that this portion of the session will cover both new and review content.
Code 3 if meets criterion.
Code 2 if one or more of the 5 lesson parts is omitted. Document basis for code.
Coding Session for Wilson Reading Program 34

Code 1 if, taken in sum, the decoding portion of the session only addresses new material or only addresses review material (i.e., material from earlier sub-steps). Document basis for code.
2. Duration criterion is that 20-23 minutes are devoted to decoding. Duration may be longer on days that include individual student charting. Compute duration as elapsed time minus any time off task or extended transition time. Video coders were instructed to ignore any time off task or transition time less than 1 minute. Therefore, individual instances of time off task or transition should not be counted for the second order coding unless they exceed 1 minute, even if the video coder did make note of them. (Exception is non-instructional time of any duration at the very beginning or end of the video, which should have been documented consistently by the video coders.) If the video record does not clearly separate out transition time—for example, if the record indicates a 3 minute segment which is described as “students get out their materials, teacher explains task, someone comes into room”—count the time as instructional.
Code 3 if duration is within 5 minutes of criterion (between 15 and 28 minutes on a day that does not include charting; 15 minutes or longer on a day that does include charting.) Record actual duration.
Code 2 if duration is off by more than 5 minutes. Record actual duration
Code 1 if entire decoding segment is missing.
Following expected lesson plan—encoding
1. Any session that includes individual student charting during decoding, will omit either the encoding block or the passage reading block. If the encoding block is present at all, however, it should include the following 3 lesson parts: Quick Drill in Reverse, Teach and Review Concepts for Spelling, and Written Work Dictation. On some days, the Dictation practice is replaced with a Spelling “Check-up.” During each lesson part, the teacher should engage students with a combination of review material and material newly introduced in this sub-step. As with decoding, the emphasis on teaching versus re-teaching or reviewing will vary from day to day.
The teachers’ manual includes specific guidelines for presenting and practicing the new material in each sub-step. However, since the teacher has several days to cover one sub-step, it is not possible to know whether material omitted on one day was covered on another. For that reason, the coverage criterion cannot be further specified beyond the 3 lesson parts and the expectation is that this portion of the session will cover both new and review content.
Code 3 if meets criterion
Code 2 if one or more lesson parts is omitted. Document basis for code.
Code 1 if, taken in sum, the encoding portion of the session only addresses new material or only addresses review material (i.e., material from earlier sub-steps). Document basis for code.
Code 9 (dimension not applicable) if the entire encoding segment is missing.
Coding Session for Wilson Reading Program 35

2. If the encoding block is present, duration criterion is that 20-22 minutes are devoted to encoding. Duration may be longer on a day that includes a spelling check-up. Compute duration as elapsed time minus any time off task or extended transition time. (See #2, above, for discussion of how to calculate time off task/transition time.)
Code 3 if duration is within 5 minutes of criterion (between 15 and 27 minutes on a day that does not include a spelling check-up; 15 minutes or longer on a day that does include a spelling check-up.) Record actual duration.
Code 2 if duration is off by more than 5 minutes. Record actual duration.
Code 1 if entire encoding segment is missing unless this is a day that includes both individual student charting and passage reading.
Code 9 (dimension not applicable) if entire encoding segment is legitimately missing.
Following expected lesson plan—passage reading
1. Any session that includes individual student charting during decoding (fluency day) will omit either the encoding block or the passage reading block. On a non-fluency day, the passage reading block should include at least 2 of the following 3 activities using controlled decodable text: silent reading, teacher modeling of the visualization/retelling process, and reading out loud. If the passage reading occurs on a fluency day, the work should include students listening to the teacher read enriched text and students reading matched decodable text.
Code 3 if meets criterion
Code 2 does not apply
Code 1 if only one activity is completed
Code 9 (dimension not applicable) if entire passage reading segment is missing.
2. If the passage reading block is present, duration criterion is that 10 minutes are devoted to passage reading on days that also include encoding. Duration should be longer on a day with no encoding segment. Compute duration as elapsed time minus any time off task or extended transition time. (See #2, above, for discussion of how to calculate time off task/transition time.)
Code 3 if duration is within 5 minutes of criterion (between 5 and 15 minutes on a day that includes an encoding segment; 5 minutes or longer on a day that does not include encoding). Record actual duration.
Code 2 if duration is off by more than 5 minutes. Record actual duration.
Code 1 if entire passage reading segment is missing unless this is a day that includes both individual student charting and encoding.
Code 9 (dimension not applicable) if entire passage reading segment is legitimately missing.
Coding Session for Wilson Reading Program 36

Proper use of program techniques—encoding and decoding
Criterion is following the routines as specified in teacher’s manual, including weaving of new concepts into the practice routines through proper questioning, use of multi-sensory techniques such as tapping and scooping, air writing, etc., and appropriate correction of students’ decoding/encoding errors and hand gestures. Vowels should always be practiced during the quick drill, and keywords should be used for vowels. In addition, the teacher should pronounce all sounds and syllables correctly when modeling or dictating and should be adept at manipulating the sound and syllable cards so that the lesson can flow smoothly.
Code 3 if meets criterion or misses criterion only because a few (~1-3) of students’ decoding/encoding errors are not corrected or because some errors in hand gestures go uncorrected.
Code 2 if more than a few of students’ decoding/encoding errors go uncorrected, if hand gestures are routinely not enforced, if teacher does not handle the sound and syllable cards effectively, or if teacher mispronounces one or two sounds or syllables. Document basis for code.
Code 1 if there are major breakdowns in the use of weaving or multi-sensory techniques, if student errors are routinely not corrected, or if teacher consistently mispronounces some sounds or syllables. Document basis for code.
Proper use of program techniques—passage reading
Criterion is that new vocabulary is defined and discussed; pencil tracking of text is enforced during both silent reading and reading out loud; proper analytical questioning is used to help students read decodable words, while non-decodable words are supplied by the teacher if necessary; that visualization and retelling provide clarity, and that the teacher model appropriate pronunciation, phrasing, and intonation.
Code 3 if meets criterion or misses criterion only because a few (~1-5) student decoding errors are corrected inappropriately.
Code 2 if there are minor problems with any of these components such as inconsistent monitoring of pencil tracking or some lack of clarity in the visualization and retelling step. Document basis for code.
Code 1 if there are major problems with any of these components such as consistently poor modeling of phrasing and mispronunciation of words by the teacher or excessive missed or inappropriate decoding corrections. Document basis for code.
Code 9 (dimension not applicable) if the session does not include any passage reading.
Coding Session for Wilson Reading Program 37

Management of instruction
Criterion is that teacher appears well prepared and able to move through the session without having to review the script or lesson plan to determine what to do next. In addition, the teacher and students should have a routine for efficiently bringing out and putting away materials, and the teacher should have an efficient method for timing the separate parts of the lesson. Information on these points is contained on the general comments sheet prepared by the video coder.
Code 3 if meets criterion
Code 2 if minor problems such as the teacher needing to review instructions in the script or lesson plan during the course of the lesson or materials not being easily or efficiently retrievable. Document basis for code.
Code 1 if major problems such as the teacher showing marked unfamiliarity with instructional methods and materials or materials not being available. Document basis for code.
Positive reinforcement and praise
This dimension refers to the amount of praise and reinforcement (both verbal and non-verbal, such as nods, smiles, “thumbs-up,” etc.) given to students. Information on this dimension is contained on the general comments sheet prepared by the video coder.
Code 3 if appropriate
Code 2 if minor problems such as the teacher giving inconsistent praise and reinforcement or occasionally using negative language or gestures in correcting errors or bringing students back on task. Document basis for code.
Code 1 if major problems such as the teacher rarely or never giving praise and reinforcement or consistently using negative language or gestures in correcting errors or bringing students back on task. Document basis for code.
Affective environment
This dimension refers to the rapport between teacher and students and the general level of supportiveness evident is the session. Information on this dimension is contained on the cover sheet prepared by the video coder.
Code 3 if appropriate.
Code 2 if minor problems such as the teacher evidencing impatience or irritation with one or more of the students a few times during the session or the teacher making limited effort to engage students in instructional activities. Document basis for code.
Code 1 if major problems such as the teacher evidencing impatience or irritation with one or more students for most of the session or the teacher routinely not addressing off-task behavior or lack of involvement of the students. Document basis for code.
Coding Session for Wilson Reading Program 38

Total teaching time
Criterion is 60 minutes. Record sum of decoding duration, encoding duration, and passage reading duration. This should be inclusive of all instructional time on video.
Code 3 if total teaching time is at least 55 minutes.
Code 2 if total teaching time is at least 45 minutes but less than 55 minutes.
Code 1 if total teaching time is less than 45 minutes.
Coding Session for Wilson Reading Program 39

Description of the Failure Free Program and Conventions for Coding Failure Free Lessons
Overview of the Failure Free Program
Failure Free instruction is organized around a series of stories. Each story requires approximately 10 to 13 lessons to complete; however, the pace of the presentation can be adapted to the student, so some students will complete more than one lesson in a single Power4Kids session. The stories are intended to be age appropriate, and there is a separate series designed for use at grade 3 (Orange series) and at grade 5 (Teal series). Within each series, the stories progress in difficulty from one story to the next, and new students are given a diagnostic test (computer and/or teacher administered) to determine where they will begin in the sequence of stories. Because students may begin in different places and may also move forward at different rates, the three students in a Power4Kids session will not necessarily be working on the same lessons. In fact, it occasionally happens that some students in a group are working in the Orange series, while others are working in the Teal series. This is probably due to a large ability spread in the group. Students who graduate from the Teal series move on to a program component called Verbal Master, which focuses on vocabulary building and does not involve reading extended stories.
As they move through the Failure Free materials, students are expected to master the story text in incremental units. Thus, on the first lesson of a story, they read only a few sentences from the beginning of the story. On the next lesson, they re-read these sentences and add a few more. By the last lesson, the student will be reading the entire story.
For each Failure Free/Verbal Master session, students are expected to divide their time equally between computer activities, worksheet activities, and teacher-guided instruction. In many Power4Kids groups, students spend all of their session time working by themselves or working one-on-one with the teacher. However, if two or more students happen to be working on the same lesson, the teacher-guided instruction may be done with the pair/group. For video coding, we will focus on the teacher-guided activities. It will generally not be possible to determine what the students are doing when they are working on the computer or on worksheet exercises. However, we will keep track of the amount of time that each student spends on these latter activities and record those things that can be observed, such as repeated requests for help from the teacher, obvious time off task, etc. To accomplish this, we will use a modified coding sheet that allows us to keep track of each student separately.
In Failure Free, the computer software reads the story to the student and presents a series of exercises based on words from the story. The worksheets provide the same, or similar exercises in paper and pencil format. The teacher-guided instruction is organized into a 5-part sequence: preview, in which the teacher describes what they will be reading about and introduces vocabulary words; listening, in which the teacher models reading the new material; presenting, in which the teacher asks questions to check for comprehension; reading, in which the teacher and student take turns reading both the old and new portions of the story (i.e., material from previous lessons and from the current lesson); and review, in which the student re-reads the new material. The last lesson for each story is a general review and follows a somewhat different format. There is also a separate criterion test for each story which is used for pretesting and post-testing. This testing can be done on the computer, by the teacher, or both. The teacher is expected to encourage the student by pointing out how much improvement has occurred between pretest and post-test.
Coding Notes for Failure Free Program 40

In Verbal Master, student time is divided between computer activities, worksheet activities, writing activities, and teacher-guided activities. Each “Unit” comprises five vocabulary words, and each “lesson” addresses one of those words in a scripted fashion. Specifically, there is a seven part sequence scripted for each vocabulary word: these are intended to introduce the word’s pronunciation, to elicit prior knowledge of the word, to provide a definition of the word, to use the word in sentences (factual application, higher cognitive application—receptive, and higher cognitive application—expressive) and to review the definition. At the end of the unit, there are several review activities that reinforce learning for all five of the words in the unit.
For both Failure Free and Verbal Master, lesson scripts and general guidelines are given in the instructors’ manuals. However, the teacher is not necessarily expected to follow the script word-for-word. In fact, we believe that the teachers were given a fair amount of latitude in adapting the lessons to their students’ needs. Therefore, much of the coding will consist of simply recording what was done, without labeling it as necessarily constituting a “deviation.” However, if the teacher does closely follow the script in the instructors’ manual for some or all of the lesson, this will reduce the amount that you have to write since you can simply note that a portion of the lesson was done “as in script.”
The text of the Failure Free stories is contained in the Instructional Readers for Orange and Teal.
Preparing to Code Failure Free and Verbal Master Lessons
General Preparation:
Read the introduction to the instructors’ manual and skim the set of lessons associated with the first story/first unit in the manual. Each Failure Free lesson in the first story ends with a set of “notes to the instructor” that help to clarify the teaching techniques used throughout. There does not appear to be a parallel source of guidance for Verbal Master.
Review the worksheets (and writing assignments for Verbal Master) associated with the first story/first unit. Although you will not specifically code for these activities in the video, it will be helpful to understand the scope of activities. It is not necessary to review the software, which is similar in scope to the worksheet activities, although it also reads the story to the student and lets the student practice reading.
Preparation for Coding a Particular Video:
Read over the video log and attached lesson plan, if available.
Prepare a folder for each video by copying the appropriate pages from the instructors’ manual and instructional reader.
Refer to the worksheet and/or writing activity pages as needed. It is not necessary (or in most cases possible) to determine the specific activity pages being used in a video. You may also see criterion tests and/or vocabulary flash cards in use as well as teacher-made games or activities. These should be described on the coding sheet to the best of your ability as they occur.
Coding Notes for Failure Free Program 41

Coding Instructions
1. Naming and Timing the Parts of the Lesson
Failure Free: For each student, note the series (Orange or Teal), the story, and the lesson within story. Time stamp the beginnings and endings of the following lesson parts:
Each individual section of teacher-guided instruction, which includes Previewing, Listening, Presenting, Reading, and Reviewing. If this is the final lesson in a story, the teacher-guided instruction will include only Presenting and Reading and Review.
Any other teacher-guided activity, which does not appear to fit into one of these sections
Time spent on independent computer software instruction Time spent on independent student worksheet activities. Time spent checking student worksheets Time spent assigning or discussing homework Transition time greater than one minute in length
Verbal Master: For each student, note the unit and time stamp the beginnings and endings of the following lesson parts:
Each individual lesson of teacher-guided instruction and the review at the end of the unit.
Time spent on independent computer software instruction Time spent on independent student worksheet activities and/or writing activities,
including checking Time spent assigning or discussing homework (if observed) Transition time greater than one minute in length
Although your time coding will be organized by student, you should note if the teacher spends any part of the lesson inactive and simply waiting for students to finish their independent work. The default expectation is that the teacher will always be engaged providing teacher-guided instruction to one student or another. (Note: Correcting student work pages while students are working on the computer or otherwise independently occupied should be considered appropriate engagement.)
2. Describing the Lesson Parts
For each part of the teacher-guided activity, describe what happens. If the teacher simply follows the script, noting this will be sufficient. If, however, the teacher elaborates on the script by, for example, adding additional comprehension questions, this should be described. It is of particular interest to note instances in which the teacher goes beyond the script in questioning the students’ background experience, relating the story to the student’s background experience, or actively engaging the student in portraying word definitions.
If there appear to be major deviations from the expected procedures, use the following codes and describe what happens:
Coding Notes for Failure Free Program 42

Code Code Description ApplicationADD Teacher adds material/activities not
directly implied by the script, but in keeping with the spirit of the script
Teacher-guided activities
SUB Teacher skips over portions of activities implied by the script
Teacher-guided activities
TO Excessive time off task (more than one minute)
General
OC Off-camera. Use this code only if you cannot determine, in broad terms, what a child is doing due to extensive time off camera
General
DV Other deviation from expected procedure General
3. Dealing with Student Errors
In Failure Free and Verbal Master, teachers are generally supposed to be supportive in correcting errors, either by encourage self-correction or by providing students with the correct answer. The only error correction technique which is specifically discouraged is the use of phonetically-based word attack strategies. In addition, teachers are advised not to correct errors during reading which do not affect meaning. Use the following codes to capture the teacher’s responses to errors:
Code Code Description Details (include in your description of the event)
EN Teacher misses/does not react to an error with implications for meaning (teacher is not supposed to correct errors that do not affect meaning)
CR Teacher encourages self correction by asking the student to re-read or to think about what they are reading
Example: “Look at that word again. Please start over with that sentence. Does that sound right ?”
CM Teacher encourages self correction by asking the student to recall features of the story
Examples:“Where was the grandparents’ farm?”
CS Teacher supplies the correct answer. Note if answer was supplied without allowing a pause or a probe to encourage self correction
CN Teacher encourages correct response through word attack procedures.
Examples:Teacher asks student to break the word into syllables, sound it out.
For all error corrections, note if the teacher stops the child to correct an error that does not affect meaning.
4. Cover and Comments Sheets
After the entire session has been viewed, the cover sheet should be filled out. The video number, teacher’s name, session date, lesson number (s), students at the beginning and end of the session,
Coding Notes for Failure Free Program 43

coder’s initials, and dates of the coding should be recorded. A brief summary of the types of motivators (stickers, candy, etc.) observed and whether homework was assigned or turned in should be added in the appropriate boxes. “Nothing observed” may be entered as appropriate. A brief description of the instructional space (was it adequate in size, noisy, crowded, etc.?) and the affective environment of the lesson (teacher-student rapport, general supportiveness on the part of the teacher, evidence of frustration by teacher or students, etc.) should also be entered in the appropriate boxes.
The “General Comments” sheet attached should also be filled out. Each of the topics below should be addressed in the comments. If a teacher’s actions were “unremarkable” with regard to a particular topic, and if no quantification of data needs to be recorded, please enter “Appropriate” or “OK” into the line. If more comments are needed, please write them succinctly but with enough detail to provide real information about your observations.
Scaffolding and Elicitation of Prior Student Knowledge: FFand VM rely heavily on teachers helping students understand the words and concepts in the stories by drawing upon students’ prior knowledge and/or scaffolding new knowledge onto what they already know. Please note the general approach that a teacher takes to these activities.
Positive Reinforcement and Praise: This is a cornerstone of both FF and VM instruction. Describe the teacher’s general approach to providing student feedback. In particular, note any instances of negative feedback.
Correction Routines: Count up the number of instances of EN, CR, CM, CS, CN errors. Indicate general pattern of the teacher’s approach if noteworthy. Note if errors are primarily being made by a single student (could be evidence that group is significantly heterogeneous in level).
Pacing: Did it appear that the teacher had to abbreviate or drop some or all of a lesson part in order to finish the teacher/student instruction on time? (Note whether the teacher uses a timer or some other device to pace the lesson).
Organization and Preparation: The teacher should have familiarized herself with the lesson before presenting it, and should not need to take time to read the instructions to figure out what to do next, should follow the lesson sequence as given, etc. Was the smooth progress of the lesson impeded by the teacher’s need to refer repeatedly to the lesson script?
Materials Management:Did it appear that the teacher and students had a routine for efficiently bringing out and putting away materials such as worksheets and computer software accessories (e.g., headphones, etc.)?
Allocation of Time Among Students: Did the teacher seem not to attend to/call on particular students for extended periods of time? Did you notice instances in which the teacher adjusted her instruction to provide extra support to a student that appeared to have more difficulty than the others?
Monitoring students’ independent activities: Did the teacher monitor students at the computers and/or completing independent student activity worksheets? Briefly characterize the teacher’s attentiveness to these students throughout the
Coding Notes for Failure Free Program 44

lesson. A simple, periodic glance at the student(s) is perfectly sufficient monitoring on the part of the teacher.
Other Comments: Any other comments worthy of note?
Coding Notes for Failure Free Program 45

Coding Session-Level Fidelity for Failure Free
The intention of this second-order coding effort is to capture the degree of session level fidelity, using a set of dimensions that are as comparable as possible across programs. Each dimension is coded on a 3 point scale. A code of 3 indicates that performance on that dimension met criterion. A code of 2 indicates minor deviations from the criterion, and a code of 1 indicates moderate deviations. There were no instances of extreme deviations.
The second-order coding is based on the written records created by the video coders (hereafter called video records). When more than one video coder coded the same session, the second-order coding will be done separately on each record. In addition, each record will be coded by two second-order coders. All reliability estimates will be calculated based on the derived, second-order codes.
Second-order coders will work from the video records only (but with reference to the lesson materials as necessary). Because the video coders were instructed to note any deviations from expected performance, it will be assumed that, where no specific documentation is found to the contrary, the teacher was acting with fidelity.
Failure Free sessions involve teacher-directed work, which is broadly specified in the teacher’s manual; individual student work on the computer; and individual student work based on workbooks or writing assignments. Because of the limits of what can be observed on the video, the fidelity coding primarily focuses on the teacher-directed activity, with exceptions as noted below. Following expected lesson plan
1. Coverage
For Orange or Teal lessons: Each lesson introduces the student to a new set of vocabulary words taken from the story in which they are working and adds incremental paragraphs to the story, which the student is expected to read and comprehend. Coverage criterion is that the teacher guides the student in 1) learning the vocabulary words specified for that session (including an understanding of how the words are defined and how they are used in context) and 2) reading and comprehending the new section of the story text. It is also expected that the student will be given practice in re-reading all of the story sections leading up to that lesson.
Typically this will involve working through the sequence of activities specified in the teacher’s manual, namely: preview, in which new vocabulary is discussed and defined, listening, in which the teacher reads the new part of the story to the student, presenting, in which the teacher asks a variety of comprehension questions about the story, reading, in which the student reads the new part of the story, and review, in which the student rereads old and new parts of the story. There is a somewhat different sequence of activities specified in the manual for the last lesson in a story. In addition, at the end of each story, the teacher is required to administer a post-test for the story just read and a pre-test for the upcoming story.
In any lesson, the teacher may choose to replace or augment these teacher’s manual activities with teacher-led exercises based on the workbook pages or flashcards supplied by the program, or by materials she creates herself. This is considered acceptable so long as the teacher satisfies the basic coverage criterion.
For Verbal Master lessons: Coverage criterion is that the teacher instructs the students in the five vocabulary words associated with each lesson and exposes the students to a combination of vocabulary building and writing activities.
Coding Notes for Failure Free Program 46

Typically, vocabulary building involves first moving through the learning steps for each word specified in the teacher’s manual, namely: pronunciation, prior knowledge, definition, factual application, higher cognitive application, and review, and then progressing through the set of review activities (also given in the teacher’s manual), that address all five words in the lesson. Writing instruction is primarily based on the writing exercises provided by Failure Free, which emphasize such writing skills as developing topic sentences and staying on topic, as well as providing an opportunity to use the newly learned vocabulary and to practice proper grammar and punctuation.
In any lesson, the teacher may choose to replace or augment these teacher’s manual activities with teacher-led exercises based on the workbook pages or flashcards supplied by the program, or by materials she creates herself. This is considered acceptable so long as the teacher satisfies the basic coverage criterion.
Code 3 if meets criterion.
Code 2 for Orange and Teal lessons: if, during the teacher-directed work, the student is not guided to re-read earlier portions of the story. For Verbal Master: if the lesson does not address both vocabulary and writing in some form (not necessarily teacher-directed). Document basis for code.
Code 1 for any other failures to meet of the basic coverage criteria (whether or not the deviations noted under code 2 are also present). Document basis for code.
Code 9 (dimension not applicable) if the session does not include any teacher directed work.
2. Duration by modality: Criterion is that 20 minutes of time for each student be devoted each of three modalities: teacher-directed activities, computer work, and independent work. Duration is based on what the student is doing. Therefore, if the teacher is marking workbook pages while the students work independently or on the computer, the teacher’s time does not count toward any modality.
a. Teacher-directed activities may be delivered to two or three students at once (if the students are all at the same place in the curriculum) or one-on-one. This work is typically based on the teacher’s manual, but may also be constructed around flash cards, workbook pages, writing activity pages, or other materials developed by the teacher. The required paper and pencil pre-testing and post-testing should also be counted as teacher directed time.
b. Independent student activities typically involve the workbook pages or writing activities supplied by the program, but may also involve other materials created by the teacher, such as games. Count any time in which the teacher gives simple feedback on workbook or writing pages as part of the independent activities modality; however, if the teacher conducts an actual interactive lesson based on workbook or writing pages, that would get counted as teacher-directed.
c. Computer activities are defined as time the student spends at the computer, even if the teacher is offering assistance or looking over the student’s shoulder.
Compute duration as elapsed time minus any time off task or extended transition time, as best this can be determined. It may not be possible to accurately determine time off task for students working on the computer or working independently with workbooks or writing activities. When the evidence is unclear, credit the time as instructional. In addition, it is important to note that video coders were instructed to ignore any time off task or transition time less than 1 minute. Therefore, individual instances of time off task or transition should not be counted for the second order coding unless they exceed 1 minute, even if the video coder did make note of them. (Exception is non-instructional time of any duration at the very beginning or end of the video, which should have been documented consistently by the video coders.) If
Coding Notes for Failure Free Program 47

the video record does not clearly separate out transition time—for example, if the record indicates a 3 minute segment which is described as “students get out their materials, teacher explains task, someone comes into room”—count the time as instructional.
Code 3 if duration is within 5 minutes of criterion (between 15 and 25 minutes) for each modality for each student. Record actual duration working in each modality for each student.
Code 2 if duration on any modality is off by more than 5 minutes for one or more students. Record actual duration working in each modality for each student.
Code 1 if an entire modality is missing for one or more students. Record actual duration working in each modality for each student.
Proper use of program techniques
1. Failure Free teachers were given considerable latitude to adapt the materials to the needs of their students. However, they should conduct the session in a manner consistent with underlying Failure Free principles. These center on providing sufficient scaffolding so that students do not experience failure. Specific scaffolding techniques include relating the story and vocabulary to the students’ own experience, modeling reading, and handling student errors in a supportive manner by encouraging self correction, providing students with the correct answer, or ignoring student errors that do not affect meaning. (Exception: The teacher does not correct errors or prompt for self correction during pre-test or post-test.) Other supportive techniques include downplaying student errors at pre-test and focusing on gains at post-test.
One other aspect of proper technique is that teachers are not intended to emphasize phonemic-based word attack skills in teaching the lessons or correcting student errors.
Code 3 if meets criterion.
Code 2 if there are a few instances in which the teacher fails to provide proper scaffolding or encourages phonemic-based word attack skills. Document basis for code.
Code 1 if the teacher routinely fails to provide proper scaffolding or encourages phonemic-based word attack skills, even if this only affects one of the students.
Coding Notes for Failure Free Program 48

Management of instruction
1. Criterion is that teacher appears well prepared and able to move through the session without having to review the script or lesson plan to determine what to do next. In addition, the teacher and students should have a routine for efficiently bringing out and putting away materials. Information on these points is contained on the general comments sheet prepared by the video coder.
Code 3 if meets criterion
Code 2 if minor problems such as the teacher needing to review instructions in the script or lesson plan during the course of the lesson or materials not being easily or efficiently retrievable. Document basis for code.
Code 1 if major problems such as the teacher showing marked unfamiliarity with instructional methods and materials or materials not being available. Document basis for code.
2. Criterion is that teacher monitors activities for all students, even though the primary focus of her attention will often be on student(s) engaged with her in the required teacher-directed activities. Nevertheless, the teacher should be aware of the progress of the other student(s) and intervene as necessary to keep students on task and moving forward. Information on this dimension is contained on the general comments sheet prepared by the video coder.
Code 3 if meets criterion
Code 2 if minor problems such as the teacher sometimes failing to monitor students working independently. Document basis for code.
Code 1 if major problems such as the teacher rarely or never monitoring students working independently. Document basis for code.
Positive reinforcement and praise
All of the programs instruct the teachers to give frequent praise and reinforcement to students. Information on this dimension is contained on the general comments sheet prepared by the video coder.
Code 3 if meets criterion
Code 2 if minor problems such as the teacher giving inconsistent praise and reinforcement or occasionally using negative language in correcting errors or bringing students back on task. Document basis for code.
Code 1 if major problems such as the teacher rarely or never giving praise and reinforcement or consistently using negative language in correcting errors or bringing students back on task. Document basis for code.
Coding Notes for Failure Free Program 49

Affective environment
This dimension refers to the rapport between teacher and students and the general level of supportiveness evident is the session. Information on this dimension is contained on the cover sheet prepared by the video coder.
Code 3 if appropriate.
Code 2 if minor problems such as the teacher evidencing impatience or irritation with one or more of the students a few times during the session or the teacher making limited effort to engage students in instructional activities. Document basis for code.
Code 1 if major problems such as the teacher evidencing impatience or irritation with one or more students for most of the session or the teacher routinely not addressing off-task behavior or lack of involvement of the students. Document basis for code.
Total teaching time
Criterion is 60 minutes for each student. Record sum of durations across 3 modalities for each student. This should be inclusive of all instructional time on video for that student.
Code 3 if total teaching time is at least 55 minutes for each student.
Code 2 if total teaching time is less than 55 minutes for at least one student, but no less than 45 minutes for any student.
Code 1 if total teaching time is less than 45 minutes for any student.
Coding Notes for Failure Free Program 50

APPENDIX K
SUPPORTING TABLES


Table K.1
Approximate Percentile Increases Corresponding to Effect Sizes of 0.2-1.0*
Effect Size Percentile Increase0.2 50.4 120.6 190.8 261.0 34
*Because the percentile increase depends on the baseline test scores, these are only approximations; the percentile increase may be slightly different for students with higher or lower baseline test scores.
K-3
Dependent Variable Test Numerator DF Denominator DF F Value p-ValueHours in groups of 3 students Corrective Reading vs. Failure Free 1 23 0.93 0.3454Hours in groups of 3 Students Spell Read vs. Failure Free 1 23 0.64 0.4323Hours in groups of 3 Students Wilson Reading vs. Failure Free 1 23 0.83 0.3731
Hours in groups of 2 Students Corrective Reading vs. Failure Free 1 23 0.18 0.6711Hours in groups of 2 Students Spell Read vs. Failure Free 1 23 0.85 0.3674Hours in groups of 2 Students Wilson Reading vs. Failure Free 1 23 0.19 0.6639
Hours in group of 1 Student Corrective Reading vs. Failure Free 1 23 2.18 0.1531Hours in group of 1 Student Spell Read vs. Non-Spell Read 1 23 0.41 0.5283Hours in group of 1 Student Wilson Reading vs. Failure Free 1 23 1.55 0.2251
Total Hours Corrective Reading vs. Failure Free 1 23 0.36 0.5524Total Hours Spell Read vs. Failure Free 1 23 0.47 0.4991Total Hours Wilson Reading vs. Failure Free 1 23 0.34 0.5631
Test Statistics for Tests of Instructional Hours Across Interventions
Table K.2
Dependent Variable Effect Numerator DF Denominator DF F Value p-ValueSubstitute Teacher Hours Corrective Reading vs. Failure Free 1 23 1.35 0.2575Substitute Teacher Hours Spell Read vs. Failure Free 1 23 0.41 0.5301Substitute Teacher Hours Wilson Reading vs. Failure Free 1 23 1.49 0.2349
Table K.3
Test Statistics for Tests of Number of Substitute Hours
Dependent Variable Effect Num DF Den DF F Value p-ValueOne-One-One Specialist Hours Corrective Reading vs. Failure Free 1 23 0 0.947One-One-One Specialist Hours Spell Read vs. Failure Free 1 23 0.4 0.5353One-One-One Specialist Hours Wilson Reading vs. Failure Free 1 23 1.71 0.2043
Table K.4
Test Statistics for Tests of Specialist One-on-One Hours


APPENDIX L
SAMPLE TEST ITEMS


This appendix provides sample test items for the main tests used in the analysis.
Woodcock Reading Mastery Test-R, Word Attack Test (sample item)Woodcock Reading Mastery Tests – Revised NU (WRMT-R/NU) Forms G and H. 1998.
American Guidance Services, Inc., Circle Pines, MN.
Tester says, “I want you to read some words that are not real words. I want you to tell me how they sound.” Tester points to “tat” on the subject page. Tester says, “How does that word sound?”
Woodcock Reading Mastery Test-R, Word Identification Test (sample item)Woodcock Reading Mastery Tests – Revised NU (WRMT-R/NU) Forms G and H. 1998.
American Guidance Services, Inc., Circle Pines, MN.
Tester points to the word “is” on the subject page.Tester says, “What is the word?”
Woodcock Reading Mastery Test-R, Passage Comprehension Test (sample item)Woodcock Reading Mastery Tests – Revised NU (WRMT-R/NU) Forms G and H. 1998.
American Guidance Services, Inc., Circle Pines, MN.
Tester points to the sentence on the subject page and says, “This says, ‘The cat is playing with a…(pause).”
Tester points to the blank space in the sentence and says, “What word belongs in the blank space?
The cat is playing with a _______.
Test of Word Reading Efficiency (TOWRE), Sight Word Efficiency Test (practice items)Test of Word Reading Efficiency (TOWRE), Forms A and B. 1999. PRO-ED, Inc, Austin, TX.
Tester says, “I want you to read some lists of words as fast as you can. Let’s start with the practice list. Begin at the top, and read down the list as fast as you can. If you come to a word you cannot read, just skip it and go to the next word.”
Practice Words: on, my, bee, old, warm, bone, most, spell
L-3
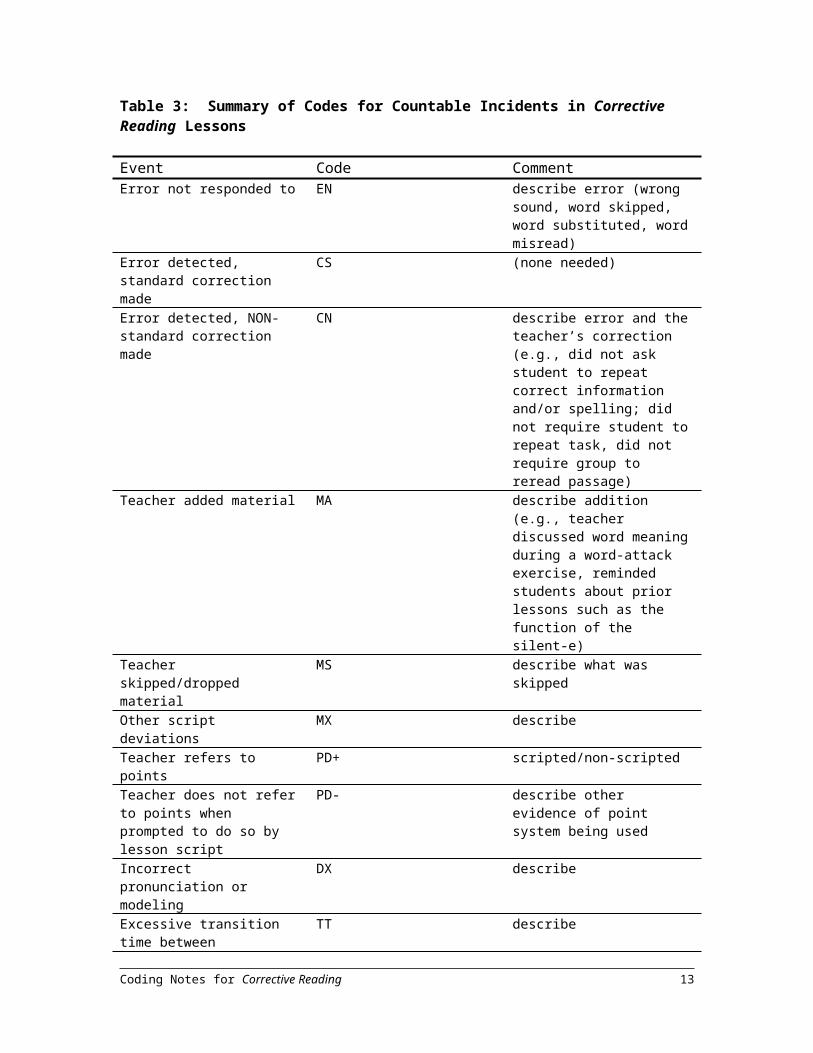
Test of Word Reading Efficiency (TOWRE), Phonemic Decoding Efficiency (practice items)Test of Word Reading Efficiency (TOWRE), Forms A and B. 1999. PRO-ED, Inc, Austin, TX.
Tester says, “Now I want you to read some words that are not real words. Just tell me how they sound. I want you to read them as fast as you can. Let’s start with the practice list. Begin at the top, and read down the list as fast as you can. If you come to a made-up word you cannot read, just skip it and go to the next word.”
Practice Words: ba (bat, fate, pizza), um (umpire), fos (fossil), gan (gander), rup (rupture), masp (clasp), luddy (muddy), dord (ford).
Group Reading Assessment and Diagnostic Evaluation Passage Comprehension (GRADE) (sample item, third grade)Group Reading Assessment and Diagnostic Evaluation (GRADE), Form A. 2001. American
Guidance Services, Inc., Circle Pines, MN. Level 3 used for third grade; Level 5 used for fifth grade.
On hot days, Meg likes to jump in the lake. She stays in the cold water as long as she can. Meg’s dad says, “Come on, little fish. It’s time for lunch.”
1. What does Meg do on hot days?a. She goes for a bike ride.b. She stays in the house.c. She jumps in the lake.d. She goes fishing.
AIMSWeb Oral Reading PassagesAIMSWeb Standard Reading Assessment Passages. 2001. Edformation, Inc. Eden Prairie, MN.
Third grade, Passage 2 (Copyright 2001 Edformation, Inc. All Rights Reserved)
Billy was sitting on the sidewalk curb holding his favorite old baseball glove.
L-4

“Hey, Billy!” he heard. “Weren’t you supposed to meet me half an hour ago at the
park? Why are you sitting here instead of moving?”
“I’m waiting,” Billy replied.
“Waiting for what?” I asked.
“I’m waiting for Mr. Sanchez to leave for work. It shouldn’t be much longer.”
“Billy, your Mom said it was all right for you to play ball with me at the park. I don’t
understand why you’re waiting for Mr. Sanchez.”
Billy signed as he explained, Well, Mr. Sanchez’s car is parked in the driveway, right
across the street. See? And the park is across the street and down the block.”
I shook my head because I didn’t understand what Billy was talking about. This
morning he was excited about playing baseball with the buys. He was a pretty good
shortstop, even though e wasn’t quite five years old.
“I know where the park is and so do you. So explain to me again why you are sitting
here?”
“I already told you. I’m waiting for Mr. Sanchez,” replied Billy. I looked across the
street. There was no sign of Mr. Sanchez coming out of his house.
“Mom said I can’t cross the street if I see any cars,” Billy continued, “and I see Mr.
Sanchez’s car. It’s right there in his driveway!”
“Oh, Billy!” I laughed. “I’m sure your mom meant you should not cross the street if
you see any cars driving on the road! She just wants to make sure that a moving car doesn’t
hit you. She’s not worried about the parked cars! Come on. You can walk with me to the
park!”
“Oh, Sam. You’re so smart. Thanks for being my friend. Let’s go play ball.”
L-5


APPENDIX M
IMPACT ESTIMATE STANDARD ERRORS AND P-VALUES


M-3
All Word-level Failure Free Spell Wilson Correctiveinterventions interventions Reading Read Reading Reading
Standard Standard Standard Standard Standard Standard Grade 3 Error Error Error Error Error Error
Word Attack 1.14 1.31 2.09 2.08 2.30 2.28TOWRE PDE 1.19 1.38 2.22 2.22 2.37 2.43
Word Identification 0.70 0.81 1.30 1.29 1.38 1.43TOWRE SWE 0.88 1.02 1.62 1.62 1.75 1.78Aimsweb 1.90 2.19 3.46 3.46 3.75 3.85
Passage Comprehension 1.63 1.88 3.08 3.05 3.25 3.35GRADE 2.01 2.32 3.70 3.71 3.97 4.13
Sample Size 335 242 93 92 71 79
All Word-level Failure Free Spell Wilson Correctiveinterventions interventions Reading Read Reading Reading
Standard Standard Standard Standard Standard StandardGrade 5 Error Error Error Error Error Error
Word Attack 0.73 0.84 1.37 1.39 1.48 1.40TOWRE PDE 0.76 0.87 1.42 1.43 1.54 1.47
Word Identification 0.60 0.69 1.10 1.11 1.20 1.18TOWRE SWE 0.65 0.75 1.23 1.23 1.31 1.24Aimsweb 1.57 1.79 2.97 2.92 3.16 3.03
Passage Comprehension 0.80 0.92 1.49 1.49 1.65 1.52GRADE 1.20 1.39 2.23 2.26 2.46 2.32
Sample Size 407 281 126 104 91 86
Table M.1
Standard Errors of Impact Estimates for 3rd and 5th Graders

M-4
All Word-level Failure Free Spell Wilson Correctiveinterventions interventions Reading Read Reading Reading
Standard Standard Standard Standard Standard Standard Grade 3 Error Error Error Error Error Error
Word Attack 1.76 2.07 3.09 3.19 3.85 3.75TOWRE PDE 1.54 1.80 2.70 2.80 3.27 3.30
Word Identification 0.78 0.91 1.31 1.42 1.68 1.61TOWRE SWE 1.23 1.44 2.14 2.26 2.59 2.62Aimsweb 2.14 2.51 3.51 3.80 4.60 4.52
Passage Comprehension 2.34 2.73 4.25 4.31 4.88 5.10GRADE 2.70 3.17 4.73 4.93 5.72 5.80
Sample Size 173 115 58 47 31 37
All Word-level Failure Free Spell Wilson Correctiveinterventions interventions Reading Read Reading Reading
Standard Standard Standard Standard Standard StandardGrade 5 Error Error Error Error Error Error
Word Attack 1.06 1.23 2.00 1.87 2.06 2.10TOWRE PDE 1.12 1.29 2.08 2.00 2.24 2.19
Word Identification 0.71 0.82 1.31 1.24 1.40 1.44TOWRE SWE 0.88 1.01 1.66 1.54 1.71 1.74Aimsweb 2.80 3.23 5.26 5.04 5.55 5.66
Passage Comprehension 0.99 1.14 1.86 1.71 1.97 1.92GRADE 1.99 2.29 3.70 3.58 3.99 3.95
Sample Size 201 144 57 62 44 38
Table M.2
Standard Errors of Impact Estimates for 3rd and 5th Graders with Low Baseline Word Attack Scores

M-5
All Word-level Failure Free Spell Wilson Correctiveinterventions interventions Reading Read Reading Reading
Standard Standard Standard Standard Standard Standard Grade 3 Error Error Error Error Error Error
Word Attack 1.32 1.51 2.55 2.30 2.64 2.57TOWRE PDE 1.23 1.42 2.34 2.10 2.53 2.40
Word Identification 1.10 1.28 2.06 1.91 2.27 2.18TOWRE SWE 1.08 1.24 2.09 1.83 2.20 2.09Aimsweb 3.51 4.05 6.62 6.09 7.23 6.93
Passage Comprehension 1.86 2.15 3.41 3.13 3.90 3.62GRADE 2.49 2.88 4.66 4.14 5.21 4.86
Sample Size 162 127 35 45 40 42
All Word-level Failure Free Spell Wilson Correctiveinterventions interventions Reading Read Reading Reading
Standard Standard Standard Standard Standard StandardGrade 5 Error Error Error Error Error Error
Word Attack 1.27 1.46 2.43 2.49 2.62 2.38TOWRE PDE 0.92 1.07 1.73 1.87 1.93 1.68
Word Identification 0.91 1.04 1.71 1.75 1.87 1.69TOWRE SWE 0.95 1.09 1.80 1.90 1.97 1.76Aimsweb 2.07 2.39 3.96 4.17 4.35 3.79
Passage Comprehension 1.08 1.25 2.05 2.11 2.32 1.95GRADE 1.76 2.03 3.35 3.48 3.68 3.30
Sample Size 206 137 69 42 47 48
Table M.3
Standard Errors of Impact Estimates for 3rd and 5th Graders with High Baseline Word Attack Scores

M-6
All Word-level Failure Free Spell Wilson Correctiveinterventions interventions Reading Read Reading Reading
Standard Standard Standard Standard Standard Standard Grade 3 Error Error Error Error Error Error
Word Attack 1.79 2.00 3.18 3.19 3.38 3.28TOWRE PDE 1.43 1.58 2.52 2.50 2.59 2.53
Word Identification 0.95 1.04 1.67 1.64 1.64 1.73TOWRE SWE 1.44 1.62 2.57 2.58 2.67 2.65Aimsweb 3.19 3.55 5.56 5.57 5.73 5.77
Passage Comprehension 2.01 2.27 3.57 3.61 3.90 3.70GRADE 2.48 2.76 4.36 4.34 4.52 4.40
Sample Size 148 110 38 36 43 31
All Word-level Failure Free Spell Wilson Correctiveinterventions interventions Reading Read Reading Reading
Standard Standard Standard Standard Standard StandardGrade 5 Error Error Error Error Error Error
Word Attack 1.52 1.75 2.30 2.09 2.70 2.85TOWRE PDE 1.26 1.45 1.87 1.68 2.15 2.31
Word Identification 1.03 1.19 1.56 1.43 1.86 1.93TOWRE SWE 1.29 1.48 1.99 1.82 2.27 2.43Aimsweb 3.47 3.95 5.42 4.85 6.18 6.50
Passage Comprehension 2.57 2.99 4.20 4.24 5.06 5.00GRADE 2.16 2.48 3.26 2.92 3.70 3.97
Sample Size 200 147 53 57 54 36
Table M.4
Standard Errors of Impact Estimates for 3rd and 5th Graders with Low PPVT Test Scores

M-7
All Word-level Failure Free Spell Wilson Correctiveinterventions interventions Reading Read Reading Reading
Standard Standard Standard Standard Standard Standard Grade 3 Error Error Error Error Error Error
Word Attack 1.41 1.64 2.52 2.46 3.02 2.93TOWRE PDE 1.78 2.07 3.24 3.17 3.76 3.70
Word Identification 1.06 1.23 1.92 1.88 2.22 2.21TOWRE SWE 1.30 1.52 2.34 2.27 2.79 2.75Aimsweb 2.44 2.85 4.44 4.35 5.28 5.05
Passage Comprehension 1.99 2.30 3.66 3.61 4.10 4.15GRADE 2.76 3.21 5.01 4.87 5.85 5.80
Sample Size 187 132 55 56 28 48
All Word-level Failure Free Spell Wilson Correctiveinterventions interventions Reading Read Reading Reading
Standard Standard Standard Standard Standard StandardGrade 5 Error Error Error Error Error Error
Word Attack 1.05 1.24 1.94 2.22 2.31 1.95TOWRE PDE 0.89 1.05 1.65 1.89 1.98 1.66
Word Identification 0.75 0.89 1.36 1.57 1.62 1.43TOWRE SWE 0.95 1.12 1.78 2.00 2.07 1.79Aimsweb 2.18 2.58 3.99 4.61 4.75 4.09
Passage Comprehension 1.18 1.38 2.14 2.37 2.55 2.22GRADE 1.48 1.76 2.69 3.17 3.36 2.73
Sample Size 207 134 73 47 37 50
Table M.5
Standard Errors of Impact Estimates for 3rd and 5th Graders with High PPVT Test Scores
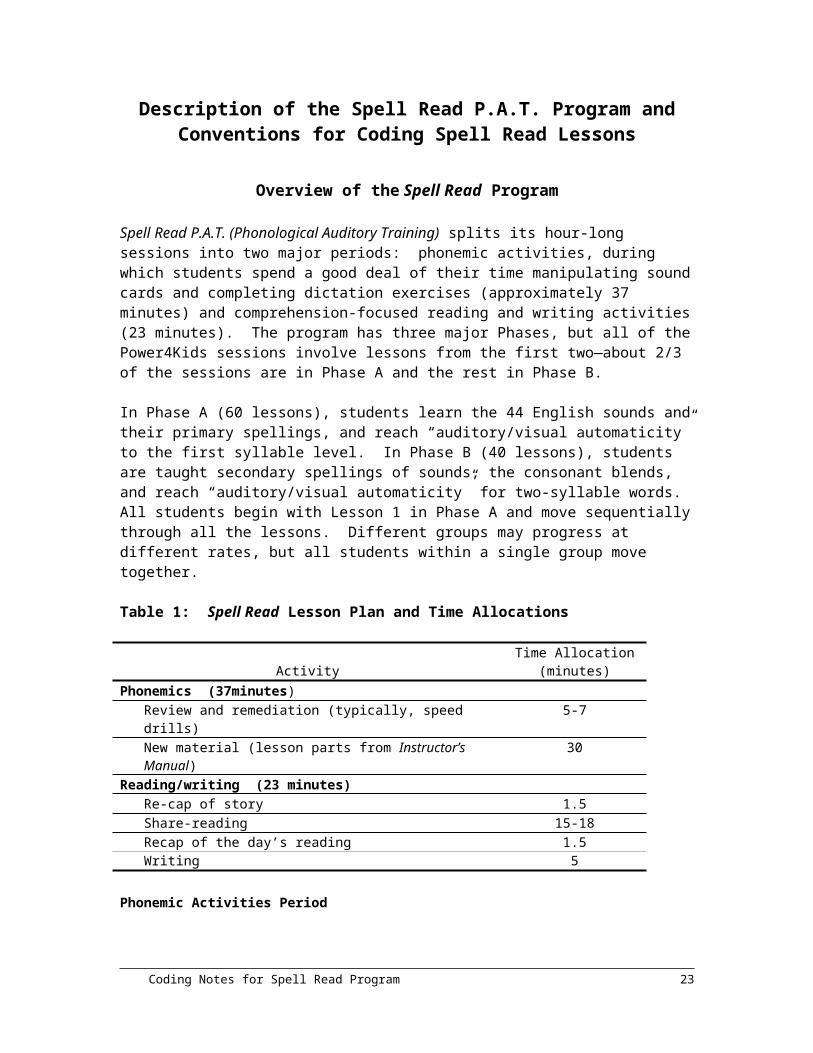
M-8
All Word-level Failure Free Spell Wilson Correctiveinterventions interventions Reading Read Reading Reading
Standard Standard Standard Standard Standard Standard Grade 3 Error Error Error Error Error Error
Word Attack 2.68 3.07 4.66 4.79 6.84 5.20TOWRE PDE 1.75 1.99 2.98 2.99 4.51 3.28
Word Identification 1.25 1.40 2.21 2.23 3.05 2.44TOWRE SWE 1.64 1.81 2.82 2.90 3.93 3.12Aimsweb 3.79 4.23 6.60 6.73 9.15 7.36
Passage Comprehension 1.97 2.23 3.35 3.35 4.83 3.69GRADE 3.24 3.68 5.61 5.75 8.16 6.29
Sample Size 81 55 26 23 15 17
All Word-level Failure Free Spell Wilson Correctiveinterventions interventions Reading Read Reading Reading
Standard Standard Standard Standard Standard StandardGrade 5 Error Error Error Error Error Error
Word Attack 2.10 2.54 3.25 3.04 3.77 4.01TOWRE PDE 1.82 2.19 2.80 2.56 3.24 3.44
Word Identification 1.41 1.70 2.16 2.02 2.63 2.70TOWRE SWE 1.83 2.20 2.84 2.63 3.26 3.51Aimsweb 4.69 5.50 7.34 6.51 8.06 8.75
Passage Comprehension 3.50 4.14 5.97 5.84 6.84 7.08GRADE 3.04 3.66 4.63 4.31 5.40 5.72
Sample Size 111 82 29 37 26 19
Table M.6
Standard Errors of Impact Estimates for 3rd and 5th Graders with Low WA and Low PPVT Scores

M-9
All Word-level Failure Free Spell Wilson Correctiveinterventions interventions Reading Read Reading Reading
Standard Standard Standard Standard Standard Standard Grade 3 Error Error Error Error Error Error
Word Attack 2.20 2.60 3.72 3.95 4.67 4.73TOWRE PDE 2.07 2.44 3.54 3.70 4.41 4.54
Word Identification 1.35 1.59 2.32 2.59 2.80 2.80TOWRE SWE 1.64 1.95 2.79 2.98 3.53 3.61Aimsweb 3.34 3.96 5.55 6.25 7.02 7.11
Passage Comprehension 2.56 3.00 4.53 4.65 5.28 5.58GRADE 2.81 3.36 4.67 5.06 6.01 6.06
Sample Size 92 60 32 24 16 20
All Word-level Failure Free Spell Wilson Correctiveinterventions interventions Reading Read Reading Reading
Standard Standard Standard Standard Standard StandardGrade 5 Error Error Error Error Error Error
Word Attack 1.47 1.68 2.85 2.91 3.05 2.90TOWRE PDE 1.53 1.77 2.87 3.02 3.20 3.00
Word Identification 1.00 1.16 1.90 1.97 2.09 2.01TOWRE SWE 1.64 1.91 3.04 3.18 3.49 3.18Aimsweb 4.07 4.73 7.46 7.95 8.46 8.08
Passage Comprehension 1.41 1.63 2.66 2.70 3.04 2.72GRADE 2.51 2.87 4.77 4.93 5.21 5.02
Sample Size 90 62 28 25 18 19
Table M.7
Standard Errors of Impact Estimates for 3rd and 5th Graders with Low WA and High PPVT Scores

M-10
All Word-level Failure Free Spell Wilson Correctiveinterventions interventions Reading Read Reading Reading
Standard Standard Standard Standard Standard Standard Grade 3 Error Error Error Error Error Error
Word Attack 1.65 1.93 2.89 2.55 3.91 2.96TOWRE PDE 1.99 2.35 3.44 3.20 4.66 3.75
Word Identification 1.65 1.95 2.80 2.60 3.91 3.13TOWRE SWE 1.51 1.77 2.60 2.34 3.53 2.77Aimsweb 4.24 4.94 7.51 6.85 9.53 8.13
Passage Comprehension 2.33 2.76 3.86 3.53 5.63 4.32GRADE 2.66 3.11 4.61 4.11 6.22 4.79
Sample Size 95 72 23 32 12 28
All Word-level Failure Free Spell Wilson Correctiveinterventions interventions Reading Read Reading Reading
Standard Standard Standard Standard Standard StandardGrade 5 Error Error Error Error Error Error
Word Attack 1.55 1.89 2.73 3.41 3.67 2.60TOWRE PDE 1.40 1.71 2.46 3.10 3.32 2.45
Word Identification 1.15 1.40 2.08 2.55 2.67 1.98TOWRE SWE 1.30 1.58 2.32 2.83 3.11 2.22Aimsweb 2.72 3.37 4.72 6.12 6.69 4.42
Passage Comprehension 1.57 1.90 2.81 3.33 3.75 2.74GRADE 2.54 3.08 4.57 5.43 6.03 4.47
Sample Size 117 72 45 22 19 31
Table M.8
Standard Errors of Impact Estimates for 3rd and 5th Graders with High WA and High PPVT Scores

M-11
All Word-level Failure Free Spell Wilson Correctiveinterventions interventions Reading Read Reading Reading
Standard Standard Standard Standard Standard Standard Grade 3 Error Error Error Error Error Error
Word Attack 1.78 1.99 2.83 2.96 3.02 3.24TOWRE PDE 1.79 2.02 2.87 3.13 2.99 3.38
Word Identification 0.94 1.03 1.42 1.45 1.36 1.59TOWRE SWE 1.38 1.53 2.14 2.30 2.15 2.47Aimsweb 3.34 3.72 5.18 5.53 5.43 6.04
Passage Comprehension 1.98 2.24 3.33 3.53 3.48 3.88GRADE 2.58 2.85 3.94 4.21 3.99 4.64
Sample Size 193 144 49 52 47 45
All Word-level Failure Free Spell Wilson Correctiveinterventions interventions Reading Read Reading Reading
Standard Standard Standard Standard Standard StandardGrade 5 Error Error Error Error Error Error
Word Attack 1.38 1.55 2.06 2.20 2.39 2.28TOWRE PDE 1.15 1.29 1.69 1.76 1.96 1.86
Word Identification 0.86 0.97 1.27 1.37 1.51 1.39TOWRE SWE 1.25 1.41 1.86 1.96 2.22 2.08Aimsweb 2.74 3.09 4.17 4.27 4.79 4.66
Passage Comprehension 1.17 1.32 1.82 1.86 2.13 1.92GRADE 1.97 2.22 2.99 3.13 3.46 3.31
Sample Size 230 162 68 56 60 46
Table M.9
Standard Errors of Impact Estimates for 3rd and 5th Graders Eligible for FRPL

M-12
All Word-level Failure Free Spell Wilson Correctiveinterventions interventions Reading Read Reading Reading
Standard Standard Standard Standard Standard Standard Grade 3 Error Error Error Error Error Error
Word Attack 1.67 2.08 2.49 2.55 5.09 2.74TOWRE PDE 1.30 1.60 2.02 2.06 3.76 2.21
Word Identification 1.43 1.76 2.21 2.23 4.18 2.44TOWRE SWE 1.24 1.55 1.77 1.82 3.85 1.94Aimsweb 3.44 4.18 5.67 5.69 9.57 6.04
Passage Comprehension 2.09 2.52 3.47 3.48 5.66 3.78GRADE 2.98 3.65 4.70 4.73 8.48 5.25
Sample Size 142 98 44 40 24 34
All Word-level Failure Free Spell Wilson Correctiveinterventions interventions Reading Read Reading Reading
Standard Standard Standard Standard Standard StandardGrade 5 Error Error Error Error Error Error
Word Attack 1.12 1.32 2.21 2.16 2.51 2.20TOWRE PDE 1.11 1.29 2.21 2.10 2.48 2.16
Word Identification 0.81 0.95 1.58 1.53 1.77 1.65TOWRE SWE 1.02 1.18 2.05 1.93 2.27 1.98Aimsweb 2.42 2.81 4.87 4.62 5.32 4.74
Passage Comprehension 1.19 1.39 2.34 2.22 2.72 2.30GRADE 1.69 1.98 3.35 3.26 3.83 3.27
Sample Size 177 119 58 48 31 40
Table M.10
Standard Errors of Impact Estimates for 3rd and 5th Graders Ineligible for FRPL

M-13
Grade 3 Test p Test p Test p Test p Test p Test p
Word Attack 19.26 0.00 27.07 0.00 0.06 0.50 9.66 0.00 14.66 0.00 5.17 0.02TOWRE PDE 6.27 0.01 10.31 0.00 0.35 0.50 10.22 0.00 5.94 0.01 0.02 0.50
Word Identification 10.55 0.00 10.19 0.00 1.08 0.30 2.38 0.12 3.15 0.07 5.32 0.02TOWRE SWE 9.67 0.00 7.42 0.01 2.62 0.10 0.17 0.50 3.05 0.08 6.61 0.01Aimsweb 6.65 0.01 7.25 0.01 0.29 0.50 0.09 0.50 2.52 0.11 7.73 0.01
Passage Comprehension 0.55 0.50 0.14 0.50 0.79 0.50 0.01 0.50 0.09 0.50 0.07 0.50GRADE 5.33 0.02 3.63 0.05 2.04 0.15 1.74 0.18 1.11 0.29 1.02 0.31
Grade 5 Test p Test p Test p Test p Test p Test p
Word Attack 13.13 0.00 20.83 0.00 0.46 0.50 14.42 0.00 8.84 0.00 1.79 0.18TOWRE PDE 3.50 0.06 3.09 0.07 0.57 0.50 8.30 0.00 0.86 0.50 1.69 0.19
Word Identification 0.69 0.50 1.57 0.21 0.30 0.50 0.01 0.50 3.13 0.07 0.08 0.50TOWRE SWE 4.41 0.03 2.82 0.09 1.92 0.16 2.81 0.09 0.14 0.50 3.10 0.07Aimsweb 1.63 0.20 2.40 0.12 0.01 0.50 1.50 0.22 0.00 0.50 2.59 0.10
Passage Comprehension 2.61 0.10 3.09 0.07 0.04 0.50 0.16 0.50 2.28 0.13 1.35 0.24GRADE 0.02 0.50 0.04 0.50 0.50 0.50 0.10 0.50 0.27 0.50 0.02 0.50
Note: "Test" refers to the Chi-Square test statistic for a general linear hypothesis test (Wald Test) with 1 degree of freedom."p " is the p -value produced by HLM5 software and is automatically set to 0.5 for values that exceed 0.5.
Reading ReadingC D
Failure Free Spell Wilson Corrective
interventions interventions
All Word-level
ABCD BCD
Table M.11
Test Statistics and P-values of Impacts for 3rd and 5th Graders
All Word-level Failure Free Spell Wilson CorrectiveReading Read Reading Reading
C DA B
interventions interventions Reading ReadABCD BCD A B

M-14
Grade 3 Test p Test p Test p Test p Test p Test p
Word Attack 6.65 0.01 10.05 0.00 0.22 0.50 3.53 0.06 4.07 0.04 2.46 0.11TOWRE PDE 4.73 0.03 8.87 0.00 1.00 0.32 7.81 0.01 3.08 0.08 0.58 0.50
Word Identification 4.83 0.03 5.21 0.02 0.19 0.50 0.17 0.50 4.60 0.03 1.64 0.20TOWRE SWE 2.81 0.09 2.73 0.09 0.26 0.50 0.12 0.50 2.75 0.09 1.92 0.16Aimsweb 0.59 0.50 0.66 0.50 0.02 0.50 1.93 0.16 2.48 0.11 0.86 0.50
Passage Comprehension 0.33 0.50 0.23 0.50 0.12 0.50 0.16 0.50 0.41 0.50 0.03 0.50GRADE 6.15 0.01 5.02 0.02 1.36 0.24 2.17 0.14 0.64 0.50 2.64 0.10
Grade 5 Test p Test p Test p Test p Test p Test p
Word Attack 9.83 0.00 14.78 0.00 0.15 0.50 18.42 0.00 2.04 0.15 2.26 0.13TOWRE PDE 2.08 0.14 2.00 0.15 0.22 0.50 10.86 0.00 1.82 0.17 0.76 0.50
Word Identification 5.93 0.01 3.94 0.04 2.37 0.12 0.01 0.50 2.24 0.13 3.51 0.06TOWRE SWE 2.09 0.14 2.06 0.15 0.20 0.50 3.16 0.07 1.68 0.19 4.81 0.03Aimsweb 0.26 0.50 0.10 0.50 0.26 0.50 1.32 0.25 0.09 0.50 0.62 0.50
Passage Comprehension 0.98 0.50 1.92 0.16 0.20 0.50 0.35 0.50 0.22 0.50 2.15 0.14GRADE 0.38 0.50 0.17 0.50 0.31 0.50 0.00 0.50 1.04 0.31 0.12 0.50
Note: "Test" refers to the Chi-Square test statistic for a general linear hypothesis test (Wald Test) with 1 degree of freedom."p " is the p -value produced by HLM5 software and is automatically set to 0.5 for values that exceed 0.5.
Reading ReadingC D
Failure Free Spell Wilson Corrective
interventions interventions
All Word-level
ABCD BCD
Table M.12
Test Statistics and P-values of Impacts for 3rd and 5th Graders with Low Baseline Word Attack scores
All Word-level Failure Free Spell Wilson CorrectiveReading Read Reading Reading
C DA B
interventions interventions Reading ReadABCD BCD A B

M-15
Grade 3 Test p Test p Test p Test p Test p Test p
Word Attack 10.75 0.00 15.02 0.00 0.01 0.50 7.27 0.01 6.55 0.01 3.24 0.07TOWRE PDE 5.10 0.02 6.97 0.01 0.00 0.50 8.00 0.00 5.16 0.02 0.03 0.50
Word Identification 7.20 0.01 6.22 0.01 1.24 0.26 0.72 0.50 1.64 0.20 5.33 0.02TOWRE SWE 3.95 0.04 1.27 0.26 4.40 0.03 0.23 0.50 0.02 0.50 2.05 0.15Aimsweb 1.24 0.27 1.71 0.19 0.00 0.50 0.15 0.50 0.70 0.50 1.17 0.28
Passage Comprehension 0.45 0.50 1.61 0.20 0.89 0.50 0.09 0.50 4.58 0.03 0.10 0.50GRADE 0.08 0.50 0.00 0.50 0.32 0.50 0.07 0.50 0.01 0.50 0.01 0.50
Grade 5 Test p Test p Test p Test p Test p Test p
Word Attack 1.61 0.20 2.93 0.08 0.18 0.50 1.30 0.25 1.10 0.29 0.65 0.50TOWRE PDE 2.13 0.14 1.14 0.29 1.29 0.26 1.06 0.30 0.03 0.50 0.49 0.50
Word Identification 0.43 0.50 0.00 0.50 1.98 0.16 0.02 0.50 0.32 0.50 0.56 0.50TOWRE SWE 3.33 0.06 1.06 0.30 3.87 0.05 1.28 0.26 0.11 0.50 0.10 0.50Aimsweb 6.53 0.01 5.32 0.02 1.38 0.24 8.66 0.00 0.02 0.50 1.66 0.19
Passage Comprehension 0.10 0.50 0.04 0.50 0.08 0.50 0.02 0.50 0.50 0.50 0.35 0.50GRADE 0.91 0.50 0.02 0.50 2.98 0.08 0.14 0.50 0.50 0.50 0.01 0.50
Note: "Test" refers to the Chi-Square test statistic for a general linear hypothesis test (Wald Test) with 1 degree of freedom."p " is the p -value produced by HLM5 software and is automatically set to 0.5 for values that exceed 0.5.
Table M.13
Test Statistics and P-values of Impacts for 3rd and 5th Graders with High Baseline Word Attack Scores
All Word-level Failure Free Spell Wilson Correctiveinterventions interventions Reading Read
Wilson Corrective
ABCD BCD A BReading Reading
C D
Reading ReadingAll Word-level
interventions interventions Reading ReadFailure Free Spell
C DABCD BCD A B

M-16
Grade 3 Test p Test p Test p Test p Test p Test p
Word Attack 7.52 0.01 9.31 0.00 0.15 0.50 5.45 0.02 3.87 0.05 1.68 0.19TOWRE PDE 2.51 0.11 2.54 0.11 0.34 0.50 2.70 0.10 1.33 0.25 0.03 0.50
Word Identification 1.87 0.17 1.66 0.19 0.47 0.50 0.00 0.50 0.12 0.50 4.01 0.04TOWRE SWE 6.19 0.01 6.28 0.01 0.73 0.50 0.73 0.50 3.37 0.06 3.65 0.05Aimsweb 0.02 0.50 0.00 0.50 0.15 0.50 0.18 0.50 0.03 0.50 0.05 0.50
Passage Comprehension 0.49 0.50 0.10 0.50 0.92 0.50 0.03 0.50 0.16 0.50 1.40 0.23GRADE 4.31 0.04 3.62 0.05 1.24 0.26 0.88 0.50 0.65 0.50 3.33 0.06
Grade 5 Test p Test p Test p Test p Test p Test p
Word Attack 6.99 0.01 10.14 0.00 0.09 0.50 4.66 0.03 5.85 0.01 3.99 0.04TOWRE PDE 4.21 0.04 2.87 0.09 2.52 0.11 3.89 0.05 0.84 0.50 0.84 0.50
Word Identification 2.16 0.14 4.19 0.04 0.64 0.50 0.28 0.50 7.62 0.01 2.25 0.13TOWRE SWE 9.18 0.00 7.10 0.01 3.51 0.06 3.46 0.06 1.55 0.21 5.42 0.02Aimsweb 0.08 0.50 0.12 0.50 0.00 0.50 1.53 0.21 0.09 0.50 0.34 0.50
Passage Comprehension 0.57 0.50 0.61 0.50 0.04 0.50 0.10 0.50 0.07 0.50 0.72 0.50GRADE 0.31 0.50 0.44 0.50 0.00 0.50 0.02 0.50 0.23 0.50 2.52 0.11
Note: "Test" refers to the Chi-Square test statistic for a general linear hypothesis test (Wald Test) with 1 degree of freedom."p " is the p -value produced by HLM5 software and is automatically set to 0.5 for values that exceed 0.5.
ABCD BCD A Binterventions interventions Reading Read
A B C DReading Read Reading Reading
Table M.14
Test Statistics and Pp -values of Impacts for 3rd and 5th Graders with Low Peabody Picture Vocabular Test Scores
All Word-level Failure Free Spell Wilson Correctiveinterventions interventions
All Word-level
ABCD BCD
Failure Free Spell Wilson CorrectiveReading Reading
C D

M-17
Grade 3 Test p Test p Test p Test p Test p Test p
Word Attack 15.43 0.00 20.59 0.00 0.01 0.50 9.59 0.00 14.82 0.00 1.09 0.30TOWRE PDE 2.10 0.14 4.66 0.03 0.90 0.50 8.36 0.00 1.23 0.27 0.00 0.50
Word Identification 5.65 0.02 6.38 0.01 0.14 0.50 1.86 0.17 4.11 0.04 1.03 0.31TOWRE SWE 4.74 0.03 2.36 0.12 3.46 0.06 0.14 0.50 0.73 0.50 1.85 0.17Aimsweb 7.55 0.01 8.81 0.00 0.11 0.50 0.15 0.50 3.20 0.07 7.93 0.01
Passage Comprehension 1.01 0.31 0.52 0.50 0.69 0.50 0.09 0.50 0.40 0.50 0.10 0.50GRADE 4.07 0.04 2.32 0.12 2.31 0.12 1.30 0.25 1.61 0.20 0.09 0.50
Grade 5 Test p Test p Test p Test p Test p Test p
Word Attack 8.34 0.00 11.01 0.00 0.01 0.50 8.73 0.00 2.89 0.08 0.87 0.50TOWRE PDE 2.87 0.09 3.17 0.07 0.06 0.50 11.14 0.00 2.30 0.13 1.92 0.16
Word Identification 0.21 0.50 0.10 0.50 0.16 0.50 0.12 0.50 0.00 0.50 0.03 0.50TOWRE SWE 0.09 0.50 0.02 0.50 0.13 0.50 0.55 0.50 0.62 0.50 0.13 0.50Aimsweb 0.31 0.50 0.50 0.50 0.02 0.50 0.01 0.50 0.11 0.50 3.36 0.06
Passage Comprehension 3.99 0.04 4.35 0.03 0.12 0.50 0.01 0.50 5.53 0.02 1.19 0.28GRADE 0.04 0.50 0.18 0.50 0.16 0.50 0.04 0.50 1.23 0.27 0.59 0.50
Note: "Test" refers to the Chi-Square test statistic for a general linear hypothesis test (Wald Test) with 1 degree of freedom."p " is the p -value produced by HLM5 software and is automatically set to 0.5 for values that exceed 0.5.
Reading ReadingC D
Failure Free Spell Wilson Corrective
interventions interventions
All Word-level
ABCD BCD
Table M.15
Test Statistics and P-values of Impacts for 3rd and 5th Graders with High Screening Peabody Picture Vocabulary Test Scores
All Word-level Failure Free Spell Wilson CorrectiveReading Read Reading Reading
C DA B
interventions interventions Reading ReadABCD BCD A B

M-18
Grade 3 Test p Test p Test p Test p Test p Test p
Word Attack 1.67 0.19 2.64 0.10 0.06 0.50 5.80 0.02 0.15 0.50 1.35 0.24TOWRE PDE 2.43 0.12 3.20 0.07 0.01 0.50 2.12 0.14 0.55 0.50 0.83 0.50
Word Identification 0.10 0.50 0.05 0.50 0.09 0.50 0.50 0.50 0.10 0.50 1.98 0.16TOWRE SWE 1.67 0.19 1.01 0.32 1.12 0.29 0.01 0.50 0.03 0.50 2.64 0.10Aimsweb 0.06 0.50 0.00 0.50 0.27 0.50 0.35 0.50 0.37 0.50 1.60 0.20
Passage Comprehension 0.52 0.50 0.00 0.50 2.70 0.10 0.33 0.50 0.27 0.50 1.55 0.21GRADE 3.87 0.05 2.39 0.12 2.25 0.13 0.50 0.50 0.01 0.50 3.78 0.05
Grade 5 Test p Test p Test p Test p Test p Test p
Word Attack 3.21 0.07 5.37 0.02 0.63 0.50 7.48 0.01 1.06 0.30 1.85 0.17TOWRE PDE 5.08 0.02 3.66 0.05 1.82 0.17 5.71 0.02 0.33 0.50 1.82 0.17
Word Identification 0.41 0.50 0.10 0.50 0.88 0.50 0.26 0.50 0.12 0.50 0.41 0.50TOWRE SWE 3.92 0.04 2.53 0.11 1.97 0.16 2.28 0.13 0.68 0.50 1.20 0.27Aimsweb 2.72 0.09 1.79 0.18 1.47 0.22 0.58 0.50 0.32 0.50 2.05 0.15
Passage Comprehension 2.53 0.11 3.47 0.06 0.02 0.50 0.57 0.50 1.18 0.28 2.54 0.11GRADE 1.04 0.31 1.30 0.25 0.00 0.50 0.92 0.50 0.00 0.50 2.21 0.13
Note: "Test" refers to the Chi-Square test statistic for a general linear hypothesis test (Wald Test) with 1 degree of freedom."p " is the p -value produced by HLM5 software and is automatically set to 0.5 for values that exceed 0.5.
ABCD BCD A Binterventions interventions Reading Read
A B C DReading Read Reading Reading
Table M.16
Test Statistics and P-values of Impacts for 3rd and 5th Graders with Low Baseline Word Attack and Low Screening PPVT Test Scores
All Word-level Failure Free Spell Wilson Correctiveinterventions interventions
All Word-level
ABCD BCD
Failure Free Spell Wilson CorrectiveReading Reading
C D

M-19
Grade 3 Test p Test p Test p Test p Test p Test p
Word Attack 3.32 0.06 4.13 0.04 0.00 0.50 1.26 0.26 7.93 0.01 0.14 0.50TOWRE PDE 1.22 0.27 3.26 0.07 1.35 0.24 5.40 0.02 1.17 0.28 0.00 0.50
Word Identification 1.58 0.21 2.29 0.13 0.04 0.50 0.04 0.50 4.19 0.04 0.11 0.50TOWRE SWE 2.10 0.14 1.78 0.18 0.38 0.50 0.00 0.50 3.24 0.07 0.15 0.50Aimsweb 0.16 0.50 0.24 0.50 0.00 0.50 1.49 0.22 2.20 0.13 0.18 0.50
Passage Comprehension 0.95 0.50 0.99 0.50 0.05 0.50 0.31 0.50 2.60 0.10 0.15 0.50GRADE 6.90 0.01 5.03 0.02 2.17 0.14 1.11 0.29 7.26 0.01 0.03 0.50
Grade 5 Test p Test p Test p Test p Test p Test p
Word Attack 5.76 0.02 7.76 0.01 0.00 0.50 7.86 0.01 1.32 0.25 0.68 0.50TOWRE PDE 0.15 0.50 0.51 0.50 0.23 0.50 7.38 0.01 2.22 0.13 0.01 0.50
Word Identification 1.98 0.16 1.03 0.31 1.24 0.26 0.00 0.50 0.17 0.50 1.65 0.20TOWRE SWE 0.00 0.50 0.01 0.50 0.10 0.50 1.13 0.29 2.04 0.15 0.46 0.50Aimsweb 0.02 0.50 0.18 0.50 0.27 0.50 0.15 0.50 0.00 0.50 1.36 0.24
Passage Comprehension 0.48 0.50 0.63 0.50 0.00 0.50 0.01 0.50 1.35 0.24 0.04 0.50GRADE 1.00 0.50 0.31 0.50 1.20 0.27 0.02 0.50 3.05 0.08 0.53 0.50
Note: "Test" refers to the Chi-Square test statistic for a general linear hypothesis test (Wald Test) with 1 degree of freedom."p " is the p -value produced by HLM5 software and is automatically set to 0.5 for values that exceed 0.5.
Reading ReadingC D
Failure Free Spell Wilson Corrective
interventions interventions
All Word-level
ABCD BCD
Table M.17
Test Statistics and P-values of Impacts for 3rd and 5th Graders with Low Baseline Word Attack and High Screening PVVT Test Scores
All Word-level Failure Free Spell Wilson CorrectiveReading Read Reading Reading
C DA B
interventions interventions Reading ReadABCD BCD A B
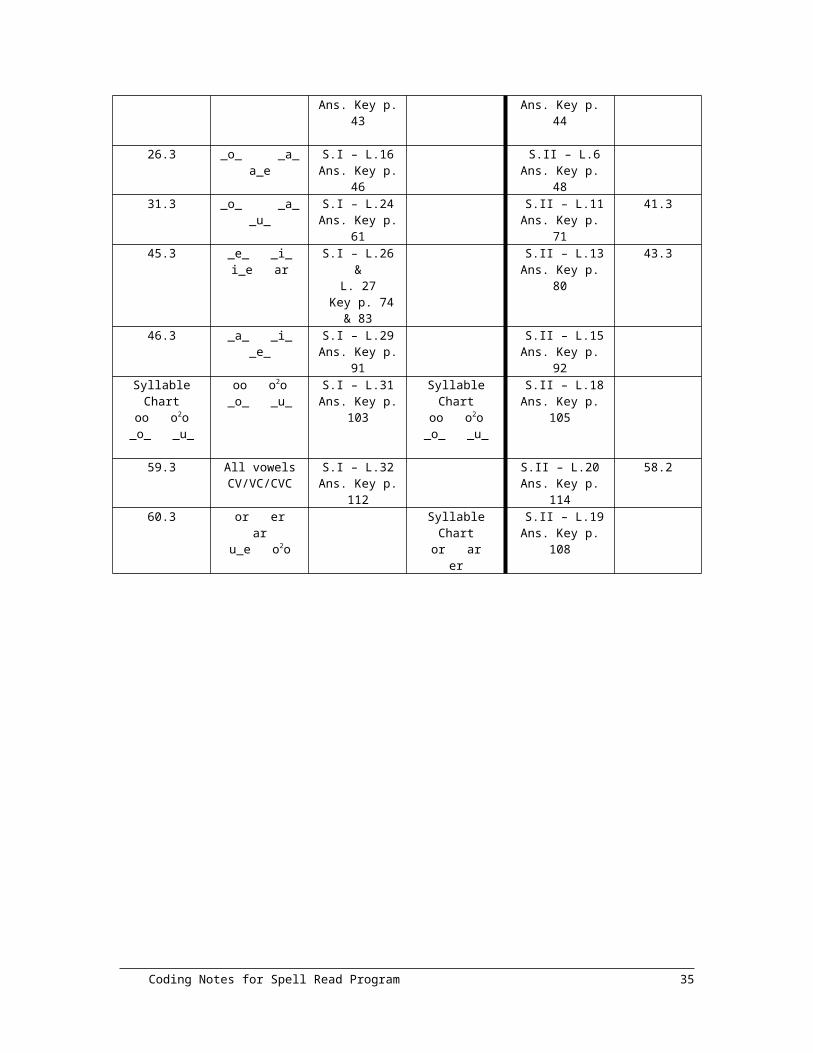
M-20
Grade 3 Test p Test p Test p Test p Test p Test p
Word Attack 15.10 0.00 21.43 0.00 0.18 0.50 24.52 0.00 4.20 0.04 4.40 0.03TOWRE PDE 1.62 0.20 2.95 0.08 0.32 0.50 5.26 0.02 1.69 0.19 0.11 0.50
Word Identification 2.85 0.09 2.79 0.09 0.24 0.50 0.26 0.50 0.77 0.50 2.57 0.10TOWRE SWE 0.11 0.50 0.31 0.50 3.54 0.06 0.79 0.50 1.00 0.50 0.93 0.50Aimsweb 2.67 0.10 3.24 0.07 0.02 0.50 0.13 0.50 1.60 0.20 2.25 0.13
Passage Comprehension 2.29 0.13 4.48 0.03 0.80 0.50 0.08 0.50 11.09 0.00 0.27 0.50GRADE 0.47 0.50 1.23 0.27 0.46 0.50 1.06 0.30 0.43 0.50 0.18 0.50
Grade 5 Test p Test p Test p Test p Test p Test p
Word Attack 3.91 0.05 4.59 0.03 0.00 0.50 3.98 0.04 0.75 0.50 0.71 0.50TOWRE PDE 6.14 0.01 4.97 0.02 0.94 0.50 3.46 0.06 0.61 0.50 1.61 0.20
Word Identification 0.43 0.50 0.29 0.50 0.13 0.50 0.07 0.50 0.08 0.50 1.23 0.27TOWRE SWE 2.18 0.14 0.74 0.50 2.40 0.12 0.94 0.50 0.55 0.50 0.19 0.50Aimsweb 2.30 0.13 1.30 0.25 1.11 0.29 1.35 0.24 0.02 0.50 1.52 0.22
Passage Comprehension 2.42 0.12 1.81 0.18 0.55 0.50 0.83 0.50 0.48 0.50 0.55 0.50GRADE 0.20 0.50 0.09 0.50 2.54 0.11 0.75 0.50 0.06 0.50 0.02 0.50
Note: "Test" refers to the Chi-Square test statistic for a general linear hypothesis test (Wald Test) with 1 degree of freedom."p " is the p -value produced by HLM5 software and is automatically set to 0.5 for values that exceed 0.5.
ABCD BCD A Binterventions interventions Reading Read
A B C DReading Read Reading Reading
Table M.18
Test Statistics and P-values of Impacts for 3rd and 5th Graders with High Baseline Word Attack and High Screening PVVT Test Scores
All Word-level Failure Free Spell Wilson Correctiveinterventions interventions
All Word-level
ABCD BCD
Failure Free Spell Wilson CorrectiveReading Reading
C D

M-21
Grade 3 Test p Test p Test p Test p Test p Test p
Word Attack 7.04 0.01 8.76 0.00 0.21 0.50 8.04 0.00 3.95 0.04 1.01 0.32TOWRE PDE 0.97 0.50 1.66 0.19 0.07 0.50 3.95 0.04 1.42 0.23 0.35 0.50
Word Identification 1.37 0.24 1.23 0.27 0.49 0.50 0.18 0.50 0.79 0.50 3.17 0.07TOWRE SWE 0.84 0.50 0.21 0.50 1.91 0.16 0.12 0.50 1.39 0.24 0.02 0.50Aimsweb 0.37 0.50 0.68 0.50 0.04 0.50 0.12 0.50 1.37 0.24 0.61 0.50
Passage Comprehension 0.16 0.50 0.28 0.50 0.02 0.50 0.02 0.50 0.54 0.50 0.16 0.50GRADE 0.00 0.50 0.07 0.50 0.41 0.50 0.15 0.50 0.29 0.50 0.14 0.50
Grade 5 Test p Test p Test p Test p Test p Test p
Word Attack 0.18 0.50 0.99 0.50 1.21 0.27 0.13 0.50 1.61 0.20 0.12 0.50TOWRE PDE 0.30 0.50 0.62 0.50 0.09 0.50 2.74 0.09 0.37 0.50 0.49 0.50
Word Identification 0.21 0.50 0.47 0.50 0.10 0.50 0.75 0.50 3.85 0.05 0.02 0.50TOWRE SWE 8.56 0.00 7.21 0.01 3.02 0.08 3.92 0.04 0.19 0.50 9.80 0.00Aimsweb 1.31 0.25 2.16 0.14 0.07 0.50 4.05 0.04 0.02 0.50 0.88 0.50
Passage Comprehension 0.07 0.50 0.01 0.50 0.22 0.50 0.19 0.50 0.15 0.50 0.46 0.50GRADE 4.40 0.03 2.79 0.09 3.28 0.07 3.80 0.05 1.44 0.23 0.06 0.50
Note: "Test" refers to the Chi-Square test statistic for a general linear hypothesis test (Wald Test) with 1 degree of freedom."p " is the p -value produced by HLM5 software and is automatically set to 0.5 for values that exceed 0.5.
Reading ReadingC D
Failure Free Spell Wilson Corrective
interventions interventions
All Word-level
ABCD BCD
Table M.19
Test Statistics and P-values of Impacts for 3rd and 5th Graders Eligible for Free or Reduced Price School Lunch
All Word-level Failure Free Spell Wilson CorrectiveReading Read Reading Reading
C DA B
interventions interventions Reading ReadABCD BCD A B

M-22
Grade 3 Test p Test p Test p Test p Test p Test p
Word Attack 21.56 0.00 27.66 0.00 0.48 0.50 10.50 0.00 14.77 0.00 3.36 0.06TOWRE PDE 16.48 0.00 25.31 0.00 2.29 0.13 9.18 0.00 21.88 0.00 0.02 0.50
Word Identification 6.25 0.01 6.89 0.01 0.05 0.50 1.20 0.27 3.45 0.06 2.20 0.13TOWRE SWE 5.73 0.02 6.26 0.01 0.02 0.50 0.07 0.50 1.79 0.18 12.76 0.00Aimsweb 4.87 0.03 4.04 0.04 0.81 0.50 0.04 0.50 1.01 0.32 5.76 0.02
Passage Comprehension 8.56 0.00 7.15 0.01 1.47 0.22 0.65 0.50 11.85 0.00 0.89 0.50GRADE 10.24 0.00 8.39 0.00 1.85 0.17 1.59 0.20 5.10 0.02 1.58 0.21
Grade 5 Test p Test p Test p Test p Test p Test p
Word Attack 10.86 0.00 14.91 0.00 0.04 0.50 17.01 0.00 2.66 0.10 1.03 0.31TOWRE PDE 1.13 0.29 0.66 0.50 0.49 0.50 5.21 0.02 0.74 0.50 0.05 0.50
Word Identification 0.00 0.50 0.25 0.50 1.04 0.31 0.35 0.50 0.07 0.50 0.00 0.50TOWRE SWE 0.00 0.50 0.32 0.50 0.94 0.50 0.33 0.50 0.03 0.50 1.93 0.16Aimsweb 0.02 0.50 0.01 0.50 0.01 0.50 0.02 0.50 0.00 0.50 0.09 0.50
Passage Comprehension 3.25 0.07 2.96 0.08 0.37 0.50 0.34 0.50 3.85 0.05 0.06 0.50GRADE 0.51 0.50 0.88 0.50 0.05 0.50 0.30 0.50 0.53 0.50 0.09 0.50
Note: "Test" refers to the Chi-Square test statistic for a general linear hypothesis test (Wald Test) with 1 degree of freedom."p " is the p -value produced by HLM5 software and is automatically set to 0.5 for values that exceed 0.5.
ABCD BCD A Binterventions interventions Reading Read
A B C DReading Read Reading Reading
Table M.20
Test Statistics and P-values of Impacts for 3rd and 5th Graders not Eligible for Free or Reduced price School Lunch
All Word-level Failure Free Spell Wilson Correctiveinterventions interventions
All Word-level
ABCD BCD
Failure Free Spell Wilson CorrectiveReading Reading
C D

M-23
Test p Test p Test p Test p Test p Test p
Word Attack 2.77 0.09 3.38 0.06 0.02 0.50 0.21 0.50 2.40 0.12 1.44 0.23TOWRE PDE 1.04 0.31 2.64 0.10 0.69 0.50 1.06 0.30 5.50 0.02 0.24 0.50
Word Identification 3.43 0.06 2.39 0.12 1.23 0.27 1.10 0.29 0.03 0.50 2.31 0.12TOWRE SWE 1.25 0.26 1.16 0.28 0.16 0.50 0.37 0.50 2.11 0.14 0.96 0.50Aimsweb 1.27 0.26 1.12 0.29 0.22 0.50 0.30 0.50 1.41 0.23 1.30 0.25
Passage Comprehension 0.00 0.50 0.16 0.50 0.42 0.50 0.01 0.50 0.14 0.50 0.05 0.50GRADE 3.58 0.06 1.97 0.16 2.14 0.14 1.41 0.23 0.33 0.50 0.56 0.50
Note: "Test" refers to the Chi-Square test statistic for a general linear hypothesis test (Wald Test) with 1 degree of freedom."p " is the p -value produced by HLM5 software and is automatically set to 0.5 for values that exceed 0.5.
C DA BReading Read Reading Reading
Table M.21
Tests for Differences in Impacts for 3rd and 5th Graders
All Word-level Failure Free Spell Wilson Correctiveinterventions interventions
ABCD BCD

M-24
Grade 3 Test p Test p Test p Test p Test p Test p
Word Attack 0.01 0.50 0.08 0.50 0.09 0.50 0.00 0.50 0.05 0.50 0.08 0.50TOWRE PDE 0.10 0.50 0.58 0.50 0.65 0.50 0.38 0.50 0.00 0.50 0.62 0.50
Word Identification 0.83 0.50 0.47 0.50 0.48 0.50 0.19 0.50 0.06 0.50 1.14 0.29TOWRE SWE 0.00 0.50 0.28 0.50 1.26 0.26 0.34 0.50 1.41 0.23 0.04 0.50Aimsweb 0.31 0.50 0.48 0.50 0.01 0.50 1.18 0.28 0.02 0.50 0.17 0.50
Passage Comprehension 0.68 0.50 1.23 0.27 0.09 0.50 0.22 0.50 3.21 0.07 0.10 0.50GRADE 3.02 0.08 3.03 0.08 0.22 0.50 1.07 0.30 0.47 0.50 1.96 0.16
Grade 5 Test p Test p Test p Test p Test p Test p
Word Attack 0.95 0.50 1.18 0.28 0.01 0.50 2.45 0.11 0.00 0.50 0.13 0.50TOWRE PDE 0.03 0.50 0.15 0.50 0.12 0.50 2.65 0.10 1.19 0.28 0.06 0.50
Word Identification 4.06 0.04 1.49 0.22 4.16 0.04 0.00 0.50 0.20 0.50 3.25 0.07TOWRE SWE 0.12 0.50 0.04 0.50 1.20 0.27 0.05 0.50 1.10 0.29 1.53 0.21Aimsweb 4.31 0.04 3.05 0.08 1.44 0.23 8.69 0.00 0.03 0.50 0.00 0.50
Passage Comprehension 0.21 0.50 0.66 0.50 0.28 0.50 0.07 0.50 0.06 0.50 2.32 0.12GRADE 0.98 0.50 0.14 0.50 2.04 0.15 0.05 0.50 1.27 0.26 0.09 0.50
Note: "Test" refers to the Chi-Square test statistic for a general linear hypothesis test (Wald Test) with 1 degree of freedom."p " is the p -value produced by HLM5 software and is automatically set to 0.5 for values that exceed 0.5.
Impacts are compared to the impacts for all students in that grade.
ABCD BCD A Binterventions interventions Reading Read
C DA BReading Read Reading Reading
Table M.22
Tests for Differences of Impacts for Students with Low Baseline Word Attack Test Scores
All Word-level Failure Free Spell Wilson Correctiveinterventions interventions
All Word-level
ABCD BCD
Failure Free Spell Wilson CorrectiveReading Reading
C D

M-25
Grade 3 Test p Test p Test p Test p Test p Test p
Word Attack 0.08 0.50 0.27 0.50 0.14 0.50 0.00 0.50 1.28 0.26 0.08 0.50TOWRE PDE 0.02 0.50 0.53 0.50 1.14 0.29 1.44 0.23 0.07 0.50 0.01 0.50
Word Identification 0.68 0.50 1.10 0.30 0.02 0.50 0.97 0.50 1.85 0.17 0.17 0.50TOWRE SWE 0.16 0.50 0.64 0.50 0.40 0.50 0.17 0.50 0.44 0.50 0.13 0.50Aimsweb 2.41 0.12 3.50 0.06 0.01 0.50 0.33 0.50 1.20 0.27 2.81 0.09
Passage Comprehension 0.07 0.50 0.13 0.50 0.01 0.50 0.19 0.50 0.83 0.50 0.53 0.50GRADE 0.01 0.50 0.01 0.50 0.20 0.50 0.06 0.50 0.30 0.50 0.90 0.50
Grade 5 Test p Test p Test p Test p Test p Test p
Word Attack 0.27 0.50 0.44 0.50 0.02 0.50 0.40 0.50 0.50 0.50 1.17 0.28TOWRE PDE 0.49 0.50 0.11 0.50 1.05 0.31 1.40 0.23 2.89 0.09 0.00 0.50
Word Identification 0.77 0.50 1.94 0.16 0.69 0.50 0.34 0.50 3.90 0.05 1.18 0.28TOWRE SWE 4.78 0.03 3.88 0.05 1.26 0.26 0.45 0.50 1.96 0.16 2.60 0.10Aimsweb 0.00 0.50 0.01 0.50 0.01 0.50 0.91 0.50 0.19 0.50 2.24 0.13
Passage Comprehension 0.02 0.50 0.02 0.50 0.00 0.50 0.04 0.50 0.55 0.50 0.09 0.50GRADE 0.12 0.50 0.09 0.50 0.05 0.50 0.00 0.50 1.16 0.28 3.05 0.08
Note: "Test" refers to the Chi-Square test statistic for a general linear hypothesis test (Wald Test) with 1 degree of freedom."p " is the p -value produced by HLM5 software and is automatically set to 0.5 for values that exceed 0.5.
Impacts are compared to the impacts for all students in that grade.
Reading ReadingC D
Failure Free Spell Wilson Corrective
interventions interventions
All Word-level
ABCD BCD
Table M.23
Tests for the Difference in Impacts for Students with Low Screening Peabody Picture Vocabulary Test Scores
All Word-level Failure Free Spell Wilson CorrectiveReading Read Reading Reading
A B C D
interventions interventions Reading ReadABCD BCD A B

M-26
Grade 3 Test p Test p Test p Test p Test p Test p
Word Attack 0.27 0.50 0.21 0.50 0.08 0.50 1.27 0.26 3.36 0.06 0.26 0.50TOWRE PDE 0.07 0.50 0.00 0.50 0.41 0.50 0.57 0.50 0.06 0.50 0.89 0.50
Word Identification 1.68 0.19 1.99 0.15 0.05 0.50 2.33 0.12 0.88 0.50 0.00 0.50TOWRE SWE 0.05 0.50 0.02 0.50 0.06 0.50 0.20 0.50 0.20 0.50 0.49 0.50Aimsweb 2.48 0.11 2.22 0.13 0.52 0.50 0.69 0.50 1.80 0.18 0.05 0.50
Passage Comprehension 0.03 0.50 0.01 0.50 0.26 0.50 0.22 0.50 0.32 0.50 0.85 0.50GRADE 0.18 0.50 0.10 0.50 0.12 0.50 0.08 0.50 0.37 0.50 2.34 0.12
Grade 5 Test p Test p Test p Test p Test p Test p
Word Attack 0.27 0.50 0.72 0.50 0.33 0.50 1.16 0.28 0.01 0.50 0.62 0.50TOWRE PDE 1.83 0.17 1.30 0.25 0.65 0.50 0.31 0.50 0.77 0.50 0.74 0.50
Word Identification 0.15 0.50 0.02 0.50 1.69 0.19 0.54 0.50 0.08 0.50 0.36 0.50TOWRE SWE 1.69 0.19 1.23 0.27 0.57 0.50 0.37 0.50 1.20 0.27 0.31 0.50Aimsweb 5.09 0.02 3.93 0.04 1.64 0.20 1.83 0.17 0.31 0.50 4.50 0.03
Passage Comprehension 1.29 0.26 1.94 0.16 0.05 0.50 0.56 0.50 0.12 0.50 2.15 0.14GRADE 0.82 0.50 0.84 0.50 0.04 0.50 0.77 0.50 0.15 0.50 2.03 0.15
Note: "Test" refers to the Chi-Square test statistic for a general linear hypothesis test (Wald Test) with 1 degree of freedom."p " is the p -value produced by HLM5 software and is automatically set to 0.5 for values that exceed 0.5.
Impacts are compared to the impacts for all students in that grade.
ABCD BCD A Binterventions interventions Reading Read
C DA BReading Read Reading Reading
Table M.24
Tests for the Difference in Impacts for Students with Low Baseline Word Attack and Low Screening Peabody Picture Vocabulary Test Scores
All Word-level Failure Free Spell Wilson Correctiveinterventions interventions
All Word-level
ABCD BCD
Failure Free Spell Wilson CorrectiveReading Reading
C D

M-27
Grade 3 Test p Test p Test p Test p Test p Test p
Word Attack 0.04 0.50 0.18 0.50 0.17 0.50 0.53 0.50 1.94 0.16 2.34 0.12TOWRE PDE 0.20 0.50 0.01 0.50 1.63 0.20 0.52 0.50 0.05 0.50 0.04 0.50
Word Identification 0.03 0.50 0.02 0.50 0.42 0.50 0.03 0.50 1.42 0.23 0.59 0.50TOWRE SWE 0.00 0.50 0.03 0.50 0.11 0.50 0.01 0.50 1.90 0.16 1.03 0.31Aimsweb 0.27 0.50 0.26 0.50 0.02 0.50 1.33 0.25 0.47 0.50 0.28 0.50
Passage Comprehension 0.75 0.50 1.49 0.22 0.21 0.50 0.52 0.50 4.96 0.02 0.62 0.50GRADE 2.81 0.09 2.33 0.12 0.55 0.50 0.57 0.50 5.33 0.02 0.19 0.50
Grade 5 Test p Test p Test p Test p Test p Test p
Word Attack 0.44 0.50 0.34 0.50 0.11 0.50 0.87 0.50 0.00 0.50 0.01 0.50TOWRE PDE 0.53 0.50 0.07 0.50 1.19 0.28 2.63 0.10 2.35 0.12 0.20 0.50
Word Identification 1.34 0.25 0.34 0.50 1.91 0.16 0.09 0.50 0.26 0.50 1.63 0.20TOWRE SWE 0.80 0.50 0.25 0.50 1.01 0.32 0.12 0.50 2.12 0.14 0.12 0.50Aimsweb 0.26 0.50 0.05 0.50 0.47 0.50 1.25 0.26 0.01 0.50 0.66 0.50
Passage Comprehension 0.01 0.50 0.02 0.50 0.01 0.50 0.05 0.50 0.39 0.50 0.04 0.50GRADE 1.81 0.18 0.29 0.50 3.47 0.06 0.02 0.50 3.41 0.06 0.78 0.50
Note: "Test" refers to the Chi-Square test statistic for a general linear hypothesis test (Wald Test) with 1 degree of freedom."p " is the p -value produced by HLM5 software and is automatically set to 0.5 for values that exceed 0.5.
Impacts are compared to the impacts for all students in that grade.
Reading ReadingC D
Failure Free Spell Wilson Corrective
interventions interventions
All Word-level
ABCD BCD
Table M.25
Tests for the Difference in Impacts for Students with Low baseline Word Attack and High Screening Peabody Picture Vocabulary Test Scores
All Word-level Failure Free Spell Wilson CorrectiveReading Read Reading Reading
A B C D
interventions interventions Reading ReadABCD BCD A B

M-28
Grade 3 Test p Test p Test p Test p Test p Test p
Word Attack 1.12 0.29 1.66 0.19 0.02 0.50 4.65 0.03 0.01 0.50 0.16 0.50TOWRE PDE 0.02 0.50 0.01 0.50 0.03 0.50 0.05 0.50 0.02 0.50 0.29 0.50
Word Identification 0.32 0.50 0.30 0.50 0.04 0.50 0.01 0.50 0.14 0.50 0.23 0.50TOWRE SWE 1.32 0.25 3.38 0.06 1.07 0.30 0.92 0.50 3.89 0.05 0.07 0.50Aimsweb 1.09 0.30 1.57 0.21 0.02 0.50 0.39 0.50 0.61 0.50 0.70 0.50
Passage Comprehension 2.43 0.11 3.59 0.05 0.06 0.50 0.09 0.50 10.63 0.00 0.35 0.50GRADE 5.76 0.02 6.55 0.01 0.13 0.50 4.04 0.04 1.61 0.20 2.20 0.13
Grade 5 Test p Test p Test p Test p Test p Test p
Word Attack 0.07 0.50 0.14 0.50 0.03 0.50 0.04 0.50 0.23 0.50 0.15 0.50TOWRE PDE 1.32 0.25 1.14 0.29 0.17 0.50 0.07 0.50 1.09 0.30 0.28 0.50
Word Identification 2.60 0.10 2.87 0.09 0.04 0.50 0.10 0.50 2.36 0.12 3.59 0.05TOWRE SWE 0.00 0.50 0.13 0.50 0.49 0.50 0.00 0.50 0.98 0.50 3.88 0.05Aimsweb 0.27 0.50 0.03 0.50 0.64 0.50 0.46 0.50 0.17 0.50 0.01 0.50
Passage Comprehension 1.53 0.21 0.90 0.50 0.75 0.50 0.65 0.50 0.06 0.50 0.46 0.50GRADE 0.32 0.50 0.02 0.50 2.28 0.13 0.53 0.50 0.22 0.50 0.00 0.50
Note: "Test" refers to the Chi-Square test statistic for a general linear hypothesis test (Wald Test) with 1 degree of freedom."p " is the p -value produced by HLM5 software and is automatically set to 0.5 for values that exceed 0.5.
Impacts are compared to the impacts for all students in that grade.
ABCD BCD A Binterventions interventions Reading Read
C DA BReading Read Reading Reading
Table M.26
Tests for Differences in Impacts for Students with High Baseline Word Attack and High Screening Peabody Picture Vocabulary Test Scores
All Word-level Failure Free Spell Wilson Correctiveinterventions interventions
All Word-level
ABCD BCD
Failure Free Spell Wilson CorrectiveReading Reading
C D
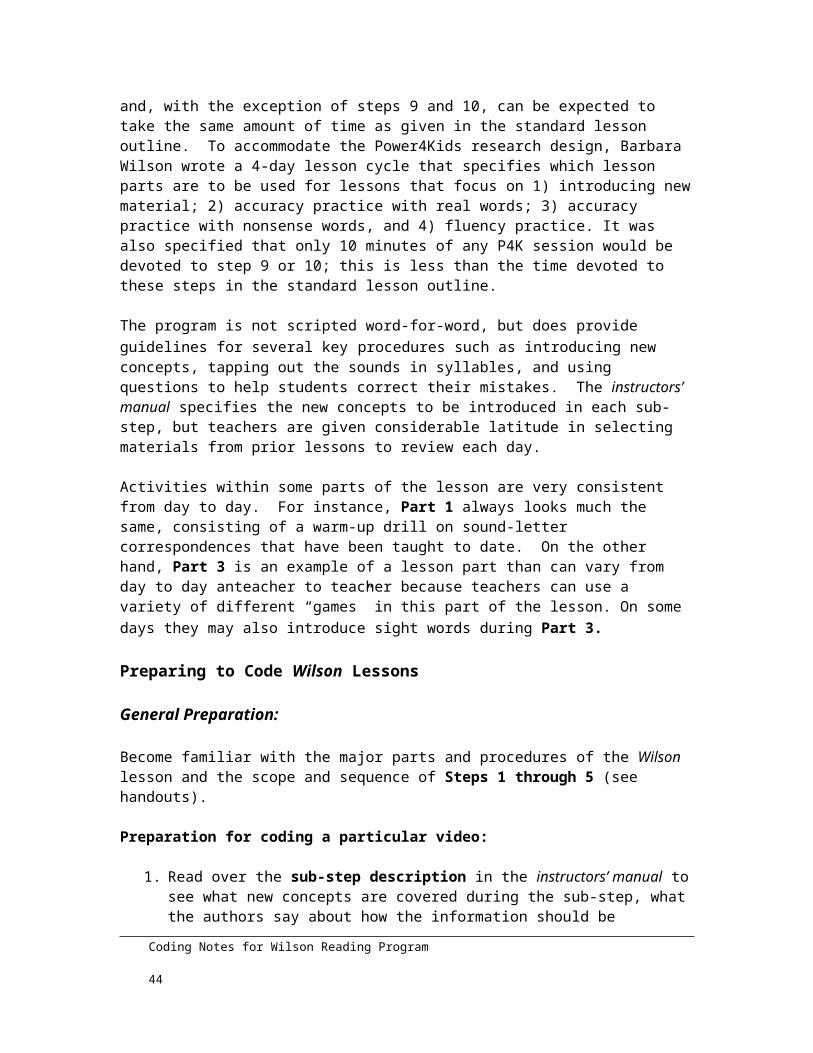
M-29
Grade 3 Test p Test p Test p Test p Test p Test p
Word Attack 1.35 0.24 2.74 0.09 0.52 0.50 0.00 0.50 5.07 0.02 0.14 0.50TOWRE PDE 3.10 0.07 5.44 0.02 0.60 0.50 0.00 0.50 9.83 0.00 0.42 0.50
Word Identification 2.03 0.15 2.82 0.09 0.03 0.50 1.27 0.26 2.20 0.13 0.07 0.50TOWRE SWE 0.83 0.50 2.10 0.14 0.98 0.50 0.01 0.50 0.34 0.50 4.39 0.03Aimsweb 1.28 0.26 0.87 0.50 0.60 0.50 0.13 0.50 0.09 0.50 1.20 0.27
Passage Comprehension 6.63 0.01 6.30 0.01 0.79 0.50 0.56 0.50 11.86 0.00 1.10 0.29GRADE 5.97 0.01 6.16 0.01 0.43 0.50 0.50 0.50 5.32 0.02 1.48 0.22
Grade 5 Test p Test p Test p Test p Test p Test p
Word Attack 2.98 0.08 2.93 0.08 0.36 0.50 6.68 0.01 0.09 0.50 0.20 0.50TOWRE PDE 0.11 0.50 0.00 0.50 0.53 0.50 0.46 0.50 0.09 0.50 0.08 0.50
Word Identification 0.15 0.50 0.02 0.50 0.38 0.50 1.11 0.29 1.20 0.27 0.01 0.50TOWRE SWE 4.55 0.03 5.22 0.02 0.18 0.50 0.88 0.50 0.17 0.50 9.12 0.00Aimsweb 0.60 0.50 1.06 0.30 0.06 0.50 2.13 0.14 0.01 0.50 0.20 0.50
Passage Comprehension 2.04 0.15 1.64 0.20 0.56 0.50 0.51 0.50 3.00 0.08 0.06 0.50GRADE 4.17 0.04 3.45 0.06 1.08 0.30 2.95 0.08 1.75 0.18 0.16 0.50
Note: "Test" refers to the Chi-Square test statistic for a general linear hypothesis test (Wald Test) with 1 degree of freedom."p " is the p -value produced by HLM5 software and is automatically set to 0.5 for values that exceed 0.5.
Impacts are compared to the impacts for all students in that grade.
Reading ReadingC D
Failure Free Spell Wilson Corrective
interventions interventions
All Word-level
ABCD BCD
Table M.27
Tests for Differences in Impacts for Students Eligible for Free or Reduced Price School Lunch
All Word-level Failure Free Spell Wilson CorrectiveReading Read Reading Reading
A B C D
interventions interventions Reading ReadABCD BCD A B


APPENDIX N
ASSOCIATION BETWEEN INSTRUCTIONAL GROUP HETEROGENEITY AND THE OUTCOME
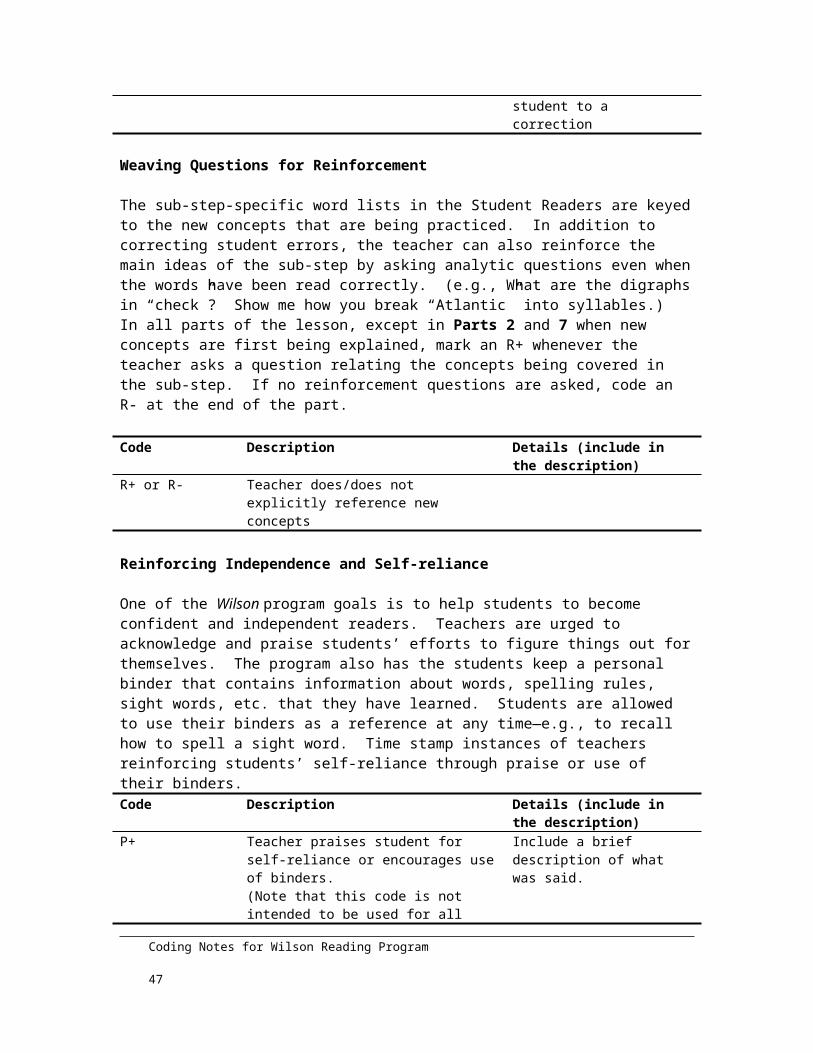

A. DETAILS ON THE HIERARCHICAL LINEAR MODEL SPECIFICATION
This section describes the model that assesses the association between instructional group heterogeneity and the outcome. We define our measure of heterogeneity, , as the range of instructional group baseline Work Attack scores within each treatment instructional group. This range is assigned to each treatment student within an instructional group. We model the treatment gain score, , which is the follow-up test score minus the baseline test score . The level-one model in Equation (IV.1) is then modified as follows:
The level-two equations are similar to Equation (IV.2) and include the intervention and blocking strata terms:
In this modification, we allow the heterogeneity to interact with intervention since as mentioned previously, appropriate grouping of students for instruction was of concern to three of the study’s four program providers.
We examine the difference of treatment gains for a one-unit increase in the heterogeneity measure. Positive differences indicate that as heterogeneity increases, so does the “impact” of receiving an intervention as measured by the treatment gain. We examined this analysis for the seven main tests. Estimates are provided in Table N.1.
N-3

N-4
Grade 3
Word Attack 0.05 0.04 0.10 -0.18 0.44 -0.15TOWRE PDE -0.29 * -0.29 -0.29 -0.38 0.06 -0.56 *
Word Identification -0.12 -0.19 0.09 -0.55 * -0.11 0.10TOWRE SWE 0.17 0.08 0.44 * -0.02 0.10 0.15Aimsweb 0.28 0.43 -0.15 0.53 0.15 0.60
Passage Comprehension 0.02 0.02 0.01 -0.35 0.30 0.10GRADE 0.03 0.09 -0.15 0.68 -0.81 0.39
Grade 5
Word Attack 0.33 * 0.29 0.47 * 0.10 0.34 0.43TOWRE PDE 0.08 0.14 -0.08 0.21 0.21 -0.01
Word Identification -0.03 -0.03 -0.03 -0.16 0.26 -0.20TOWRE SWE 0.03 0.04 -0.01 -0.14 0.19 0.07Aimsweb -0.44 -0.40 -0.56 -0.23 -0.07 -0.90
Passage Comprehension -0.01 0.00 -0.03 -0.08 0.04 0.03GRADE 0.17 0.21 0.08 -0.05 0.45 0.21
Note: Heterogeneity is measured as the range in baseline word attack scores within a treatment instructional group."Diff" refers to the difference in impacts for a one-unit increase in instructional group heterogeneity
* Difference is statistically significant at the 0.05 level.
Diff Diff Diff Diff
Reading Read
Diff Diff
Reading Reading
Diff
Corrective
C Dinterventions interventions
ABCD BCD A B
All Word-level Failure Free Spell
Diff Diff
Wilson
interventions
Diff Diff Diff
WilsonReading Reading
ABCD BCD A B C Dinterventions
CorrectiveReading Read
Table N.1
Change of Gain Scores for a One-unit Increase in Heterogeneity for Treatment Students with Low Baseline Word Attack
All Word-level Failure Free Spell

APPENDIX O
TEACHER RATING FORM


Power4Kids Teacher Rating Form
Teacher__________________________________ Rater ______________________________
Program _________________________________ Date ______________________________
A. Dimensional ratings of reading instruction delivery
Please rate this teacher on each of the following dimensions of her delivery of reading instruction:
Dimension
Unsatisfactory Performance
1
Satisfactory Performance
4
Expert Performance
7
1. Daily lessons include all prescribed elements of the specific program, presented in appropriate sequence and time frame
1 2 3 4 5 6 72. Gives evidence of mastery of delivery
techniques, materials, and technology of the specific program
1 2 3 4 5 6 73. Uses prompting, correction, and questioning
strategies appropriate to the specific program 1 2 3 4 5 6 74. Delivers lessons effectively, with attention to
pacing and smooth transitions between activities and parts of activities
1 2 3 4 5 6 75. Completes lesson plans and other records
required by the specific program 1 2 3 4 5 6 76. Effectively monitors each student’s performance
and divides attention equally among students 1 2 3 4 5 6 77. Intervenes as necessary to focus students’
attention and to elicit appropriate social behaviors 1 2 3 4 5 6 78. Has good rapport with students and uses
positive reinforcement to maintain a supportive classroom atmosphere
1 2 3 4 5 6 7
B. Global rating of teacher’s performance
Please indicate how this teacher’s performance in implementing the program so far compares to that of all teachers with similar amounts of training and teaching experience with this program whom you have observed. This teacher’s performance falls in the following percentage range: (fill in 1)
Lowest 10 percent
Lowest quarter but not lowest 10
percentLower half but not
lowest quarterTop half but not
top quarterTop quarter but
not top 10 percent Top 10 percent
1 2 3 4 5 6
(continued on next page)
Teacher Rating Form 093003

C. Comments
1. Please describe aspects of this teacher’s delivery of the reading intervention that are particularly strong.
2. Please indicate aspects of this teacher’s delivery of the reading intervention that are in need of additional work.
3. If you feel that any of the ratings you gave on the front of this form require explanations or elaborations, please write them below.
Teacher Rating Form 093003

APPENDIX P
SCHOOL SURVEY


Power4Kids StudySchool Survey
School: Date:
Person completing the survey:
Part A: Characteristics of Students Served
1. What grades are offered in this school? (Mark all that apply.)
Prekindergarten
Kindergarten
1st
2nd
3rd
4th
5th
6th
7th
8th
Other, specify_____________________
2. Around the first of October 2003, what was the total number of students enrolled in this school in grades K-8? (Do not include prekindergarten students.)
Students
1
B
A
D
C
F
E
H
G
J
I
K

3. Around the first of October 2003, how many students enrolled in grades K-8 and were-- (Do not include prekindergarten students.)
a. Hispanic, regardless of race (Mexican, Puerto Rican, Cuban, Central or South American, or other Hispanic culture or origin)?
b. White, not of Hispanic origin (European, Middle Eastern, or North African)?
c. Black, not of Hispanic origin?
d. American Indian or Alaska Native (Aleut, Alaska Indian, Yupik, Inupiat)?
e. Asian or Pacific Islander (Japanese, Chinese, Filipino, Korean, Asian Indian, Vietnamese, Hawaiian, Guamanian, Samoan, or other Asian)?
f. Total students (sum of entries in 4a-e)
Total students
NOTE: Sum of entries in questions 3a-e should be equal to entry in question 2.
2
0
Students
None
0
Students
None
0
Students
None
0
Students
None
0
Students
None

4. During the last school year (2002-2003), what is your best estimate of the percent of students in this school who were absent for the following number of days?
% 0-9 days
% 10-20 days
% 21+ days
(Percentage entries should sum to 100%.)
5. Around the first of October 2003, how many students at this school were ELIGIBLE for free or reduced-price lunches? (Report a separate count for prekindergarten students.)
6. Around the first of October 2003, how many students at this school were identified as limited-English proficient? (Do not include prekindergarten students.)
Please indicate the home languages spoken by the largest group(s) of limited-English proficient students at your school_______________________________ ________________________________________________________________
3
0
Prekindergarten students eligible
None
0
Students
None
0
Other students eligible (Kindergarten and higher)
None

7. Since the beginning of the current school year, how many students have transferred in or out of this school?
8. How many students currently in grades 3 and 5 were retained? (That is, how many students currently in grades 3 and 5 were in the same grade last year?)
4
0
Students enrolled since beginning of school year
No students in grade 3
0
Students withdrawn since beginning of school year
None
0
Students retained in grade 3 from last year
None
0None
0
Students retained in grade 5 from last year
No students in grade 5
0None

9. If your school includes grade 5, indicate your school’s fifth-grade performance on the 2003 PSSA reading assessment:
Part B: Title 1 and Special Education
10. Around the first of October 2003, did any students enrolled in this school receive Title I services at this school, or at any other location?
Yes Go to Question 11
No Skip to Question 15
11. Is this school operating a school-wide Title I program?
Yes Go to Question 15
No Skip to Question 12
12. If this school is designated as a targeted assistance school, how many students are served by the Title I program?
Students
5
Average scaled score for grade 5Number of grade 5 students tested
Percent Below Basic in grade 5
Percent Advanced in grade 5
Percent Proficient in grade 5
Percent Basic in grade 5
B
A
B
A
0 No students in grade 5
13. At which grade levels are students receiving Title I services? (Mark all that apply.)
Prekindergarten
Kindergarten
1st
2nd
3rd
4th
5th
6th
7th
8th
14. Are students receiving Title I services inYes No
a. Reading/Language arts?b. Mathematics?
15. Of the students enrolled in this school, how many currently have an Individualized Education Plan (IEP) because they have disabilities or are special education students? (Do not include prekindergarten students.)
Students
None Skip to Question 17 16. How many of these IEP students are in each of the following instructional settings?
(The sum of the entries in question 16 should equal the entry in question 15, above.)
All day in a regular classroom
Most of the day in a regular classroom (1-20 percent of the school day receiving special education and related services outside the regular classroom)
Some of the day in a regular classroom (21-60 percent of the school day receiving special education and related services outside the regular classroom)
Little or none of the day in a regular classroom (61-100 percent of the school day receiving special education and related services outside the regular classroom)
6
B
A
D
C
F
E
H
G
J
I
0
A
A B
B

Part C: Instructional Policies
17. How long is the school day (instructional time) for students in this school? (Report BOTH hours and minutes, e.g., 6 hours and 0 minutes, 5 hours and 45 minutes, etc. If the length of the school day varies by grade level, record the longest day.)
Hours AND
Minutes
18. How are students organized for reading/language arts instruction in this school?
Students are grouped with others of similar ability level within their home classroomStudents are grouped with others of similar ability level across classroomsStudents are not grouped by ability
19. Has this school implemented the following?Yes No
a. Before-school or after-school enrichment programsb. Before-school or after-school programs for students needing
extra assistance to meet academic expectationsc. Summer school activities for students seeking academic
advancement or accelerationd. Summer school activities for students needing extra assistance
to meet academic expectations
7
B
C
A
A
A
A
A
B
B
B
B

Part D: Teacher Background and Experience
20. What is the distribution of teachers in your school in terms of the amount of time they have worked at your school?
Years worked at Percent of Teachersthis school None 1-10% 11-25% 26-50% 51-75% 76%+Less than 2 years2 to 5 years6 to 10 years11 or more years
21. What is the distribution of teachers in your school in terms of the amount of time they have taught elementary school (grades K-8)?
Years taught Percent of Teacherselementary school None 1-10% 11-25% 26-50% 51-75% 76%+Less than 2 years2 to 5 years6 to 10 years11 or more years
22. What is the distribution of teachers in your school in terms of their highest degrees?
Percent of TeachersHighest degree None 1-10% 11-25% 26-50% 51-75% 76%+Bachelor’s DegreeMasters’ Degree/ EquivalencyMore than Master’s Degree
23. How many teachers in your school have earned certification from the National Board of Professional Teaching Standards?
None
1
2
3 or more
Thank you for your help!
8
C D E FBA
C D E FBA
C D E FBA
C D E FBA
C D E FBA
C D E FBA
C D E FBA
C D E FBA
C D E FBA
C D E FBA
C D E FBA
B
A
D
C

APPENDIX Q
SCIENTIFIC ADVISORY BOARD


The following individuals served on the Scientific Board of Directors of the Haan Foundation for Children, which coordinated the selection of the four chosen interventions and the funding of the interventions and evaluation.
Scientific Advisory BoardDr. Rebecca FeltonDr. Jack FletcherDr. Barbara FoormanDr. Ed Kame’enuiDr. Maureen LovettDr. G. Reid LyonDr. Frank ManisDr. Gil NoamDr. Richard OlsonDr. Stephen RaudenbushDr. Sally ShaywitzDr. Joseph Torgesen—chairDr. Maryanne Wolf
Q - 3