national advisory committee for aeronautics/67531/metadc56201/m... · national advisory committee...
TRANSCRIPT
TECHNICAL NOTE 3816
NATIONAL ADVISORY COMMITTEE FOR AERONAUTICS
STATIC STRJ3NGTH O F A L U m U M - A L L O Y SPEClMENS
CONTAINING FATIGUE CRACK3
By Arthur J. McEvily , Jr., Walter Illg, and Herber t F. Hardra th
Langle y Aeronautical Laboratory Langley Field, Va.
Washington
October 1956

NATIONAL ADVISORY COMMI'IPITEE FOR AEXONAUTICS
TECHKtCAL NOTE 3816
STATIC STRENGTH. OF ALUMINUM-ALLOY SPEC lMENS
CONTAINING FATIGUE CRACKS'
By Arthur J. McEvily, Jr., Walter Illg, and Herbert F, Hardrath
SUMMARY
Seven configurations of specimens made of 2024 and 7075 aluminum alloys i n both ro l led and extruded form were subjected t o repeated a x i a l loads u n t i l fa t igue cracks of various lengths were formed. The specimens were then subjected t o s t a t i c t e s t s t o determine the residual s t a t i c strength. S m a l l cracks resulted i n disproportionately large reductions of s t a t i c strength, the reduction being greater f o r 7075 than f o r 2024 aluminum alloy. A simple method of analysis which predicts the observed r e su l t s i s developed and described.
INTRODUCTION i
The high effect ive s t resses occurring i n modern a i r c r a f t s t ructures and the nonexistence of the endurance l i m i t f o r the aluminum al loys from which the structures a re b u i l t preclude any hope f o r i n f i n i t e l i f e . Since fat igue cracks a re prac t ica l ly inevitable, the designer and the operator require information regarding the remaining strength of par t s containing such cracks. The l i t e r a t u r e contains very l i t t l e information on of a i r c r a f t s t ruc tura l par t s containing fat igue cracks. I n general, the available information indicates t h a t a very large loss of s t a t i c strength may be expected i n some cases.
I n order t o supply more of such information, the Langley Laboratory of the NACA has begun a systematic study of the e f fec ts of fat igue cracks on the s t a t i c strength of simple specimens. Tests have been conducted on several configurations of specimens made of 2024 and 7075 aluminum alloys i n both rol led and extruded forms.
'supersedes NACA Re search Memorandum L55Dl5a by Walter I l l g and Herbert I?. Hardrath, 1955.

The f irst part of t h i s paper presents the r e su l t s of the experimen- t a l investigation, Comparisons between character is t ics of the materials
u_. A-b .' and specimen configurations a re made. The second part of the paper pre- sents a simple method of analysis which was developed t o predict the s t a t i c strength of specimens containing fat igue cracks, The method i s based upon calculation of the maximum loca l s t r e s s i n the specimen, The e l a s t i c s t r e s s concentration fac tor f o r the configuration i s computed according t o the theory of e l a s t i c i t y , The e l a s t i c fac tor i s then modi- f i e d f o r s i ze and p l a s t i c i t y effects according t o methods proposed by Neuber ( r e f , 1 ) and Stowell (ref. 2). The required material constants were determined experimentally or adjusted empirically.
Appendix A outlines the de ta i l s of computing s t r e s s concentration fac tors f o r configurations f o r which no straightforward solution exis ts . Appendix B discusses the appearance of the f a i lu re surfaces of the specimens.
SYMBOLS
a half -width of net section, in ,
A area of net section, s q in ,
A. minimum cross-sectional area of specimen without fat igue cracks or saw cuts, sq in.
e eccentricity, in.
E Young" modulus, k s i
E sec secant modulus, k s i
( Es ), secant modulus f o r material remote from hole, k s i
Ell secant modulus corresponding t o point of maximum s t r e s s on s t ress -s t ra in curve, k s i
En secant modulus f o r nominal s t r e s s on net section, k s i
I mment of iner t ia , in , 4
K~ e l a s t i c s t r e s s concentration fac tor f o r a deep notch
Ks e l a s t i c s t r e s s concentration fac tor f o r a shallow notch

NACA TM 3816 3
EZr e l a s t i c s t r e s s concentration fac tor f o r a notch of a rb i t ra ry depth
% Neuber "engineering" s t r e s s concentrat ion f a c t or
K~ p l a s t i c s t r e s s concentrat ion fac tor
KU s t r e s s concentration fac tor f o r ultimate t ens i l e strength
moment, in-lb
ax ia l load, l b
load ra t io , Minimum load Maximum load
nominal s t r e s s on net section, k s i
maximum load divided by Ao, k s i
ultimate t e n s i l e strength of material, k s i
depth of notch or crack, or half-length of in te rna l notch, in.
radius of curvature, in.
f' e effect ive radius of curvature, in ,
P ' Neuber material constant, in ,
Neuber material constant f o r ultimate t ens i l e strength, in ,
maximum l oca l s t ress , k s i
w included angle i n notch, radians

NACA TN 3816
Description of Specimens
.- Seven configurations of specimens made from two aluminum alloys were tested i n t h i s investigation and are as follows:
I n a l l cases, the faces of the specimens were l e f t a s received. The notches were cut by normal machining techniques with no special e f for t t o minimize work hardening. The longitudinal axis of each specimen was p a r a l l e l t o the grain direction.
Material. - Tensile specimens were prepared according t o the standards presented i n reference 3 from each of the sheets and bars used i n t h i s investigation. Tensile t e s t s were performed i n the usual manner using autographic s t ress-s train recording equipment. Dial-gage extensometers were used t o measure s t ra ins larger than those accommodated by the auto- graphic equipment. The t ens i l e properties thus obtained are summarized i n t ab le I. Typical s t ress-s train curves f o r each m t e r i a l are given i n f igure 4. The properties measured indicate tha t the materials were a t l e a s t as strong as the minimum values l i s t e d i n reference 4,
Size
2' inches wide F
12 inches wide
12 inches wide
35 inches wide
3/4 thick by 2 inches wide
314 inch thick by 4 inches wide
314 inch thick by 4 inches wide
The photomicrographs shown i n figure 5 were made of the material used f o r the small specimens shown i n figure 1. The photomicrographs
Specimen
Type of notch
Edge notch
Edge notch
l-inch hole
1-inch hole
l/&-inch hole
118-inch tangs with 114-inch holes
114-inch tangs with 114-inch holes
Material
Size
0.081 and 0 .09 inch thick 0.125 inch thick 0 .09 inch thick
0.102 and 0.125 inch thick
0.081 inch thick 0.075 and 0.081 inch thick
0.081 inch t h k k 0.075 inch thick
0.102 inch thick 0.102 inch thick
314 inch thick by 6 inches wide 314 inch thick by 6 inches wide
314 inch thick by 6 inches wide 314 inch thick by 6 inches wide
314 inch thick by 6 inches wide 314 inch thick by 6 inches wlde
3
3
al loy
2024-Tj 2024-~4 7075-6 7075-~6
2024-8 7075-~6
2024-T3 70a-'P6
2024-T3 7 0 7 5 ~ 6
2024-T4 7075-T6
2024-T4 7075-T6
2024-Th 7075-~6
Sheet Extruded H
meet Extruded Z
Sheet Sheet
Sheet Sheet
Sheet Sheet
Rolled bar Extruded bar
Rolled bar Extruded bar
Rolled bar Extruded bar

indicate a normal and uniform grain structure f o r the sheet materials, '
The 2024-~4 extruded material shows considerably larger grain s i ze with some tendency f o r grains t o be very long i n the longitudinal direction. Mo indication of grain boundaries was found f o r the 7075-~6 extruded material even though it was subjected t o several different etching agents,
Testing Procedure
inch-wide specimens.- The small specimens (fig. 1 ) were subjected $ - t o repeated tension loads i n 20,000-pound-capacity subresonant fat igue t e s t ing machines, (see r e f , 5,) The speed of load application was 1,800 cpm and the i n i t i a l nominal s t r e s s varied between approximately 5 and 30 ks i , Fatigue-crack detector wires (ref . 6) were applied across the c r i t i c a l sect ion of the specimen a t intervals of approximately 0.1 inch. The wires nearest the bases of the notches were connected i n se r i e s with the c o i l of a re lay which stopped the machine when one of the wires fa i led . Whenever cracks of greater length were desired; the next wire was connected t o the stopping c i r cu i t and the machine was res ta r ted with the load amplitude a r b i t r a r i l y reduced by one-halT i n order t o control t he r a t e of crack growth and t o prevent f a i lu res due t o fat igue action alone. This process was repeated with the load amplitude reduced each time u n t i l a crack of the desired length had formed. I n most cases, approximately 100,000 cycles of load were required t o i n i t i a t e the fat igue crack. I n nearly a l l cases, only one crack was formed,
The specimens containing fat igue cracks were removed f romthe fat igue machines and placed under a toolmaker's microscope t o measure the length of crack v is ib le on each face, The area of the crack w a s determined by multiplying the average length by the thickness of the specimen. Each
i 3 , specimen was then subjected t o s teadi ly increasing tension load u n t i l . * ,
f a i l u r e occurred. This t e s t was performed i n a 120,000-pound-capacity tc, c .- ,?
hydraulic t e s t ing machine (ref . 7) equipped with gr ips similar t o those used i n the fat igue tes t ing machines (ref . 5 ) . The f ree length between grips during both the fat igue loading and the s t a t i c t e s t was l l A inches.
2
Since most of the 2L - inch-wide specimens contained only one fat igue 4
crack, the s t a t i c load was applied eccentrically with respect t o the remaining net section. I n order t o study the e f fec t of the eccentr ic i ty on t h e strength, some of the specimens were modified pr ior t o s t a t i c t e s t ing t o reduce the eccentricity, The modifications were accomplished i n two ways: I n the first method, a longitudinal s t r i p of material was removed (f ig . 6) such tha t t he depth of the crack, measured from the new edge, equaled the depth of the notch on the other side, I n the second method, a jeweler" saw was used t o make a cut equal i n depth t o tha t of the fat igue crack i n the opposite notch.

A few spedimens were tes ted with jeweler's saw cuts of equal s ize on both sides of the specimen. These specimens were tes ted with no repeated loads applied i n order t o determine whether s a w cuts could be used t o simulate fat igue cracks,
.- The 12-Inch-wide sheet spechens shown i n f igure 2 were subjected t o repeated ax ia l loads varying between 0 and 43 k s i i n the hydraulic t e s t ing machine described i n reference 7.
t The loads were cycled autamatically by an a i r servomechanism which was actuated by lhit switches attached t o the lower gr ip of t h e machine. The average speed of cycling was 8 cpm,
The gr ips used f o r these t e s t s were f l a t plates securely fastened t o the head and loading ram of t h e tes t ing machine. Five 1-inch bo l t s were used t o clamp the specimens i n each grip. The portions of the faces of the specimen tha t were clamped inside the grips were roughened with a multiple-point chisel driven by a small r ive t gun, The clamping pressure i n the gr ips forced the roughened surfaces of the specimen t o embed in to p la s t i c l i ne r s placed between the specimen and the grips. This procedure gave uniformly secure clamping over the en t i r e width of the specbnen,
A s i n the case of the smaller specimens, fatigue-crack detector wires stopped the machine automatically a t intervals during the t e s t , The loaawas reduced i n increments as the crack grew t o the desired depth. Whenever deep cracks were desired, the time required t o produce the crack was reduced by making a jeweler" saw cut before the repeated loads were applied, In these cases, the crack was always extended a t l eas t 114 inch by repeated loading,
After the crack had grown t o the desired length, the specimens were subjected t o s t a t i c t ens i l e t e s t s without removing them from the grips, The exact length of the fatigue crack was measured a f t e r s t a t i c f a i lu re , In each case, the par t of the f rac ture surface produced by fat igue had a l i gh te r color and a smoother texture than the part which was produced by s t a t i c fa i lure .
In order t o establ ish the behavior of specimens with very sharp, but known, radius of curvature, four auxi l iary t e s t s were performed, The specimens f o r these t e s t s were made from 2- inch by 36-inch sheets l i k e those shown i n f igure 2 , except f o r the notches, One specimen of each material had 60' V-notches 2 inches deep on each edge, The root radius was 0.005 inch which gave a theore t ica l s t r e s s concentration fac- t o r of 27. (see r e f , 1.) Another specimen of each material had notches with pa ra l l e l sides, A jeweler's saw was used t o produce a cut l$ inches
deep, A f ine thread coated with valve grinding compound was then used t o extend t h i s cut t o a depth of 2 inches, The thread and grinding compound produced a reasonably round notch root with a 0,005-inch radius, Because ,

of the gentle aetion of t h i s procedure, the material surrounding the root of the notch was expected t o be f a i r l y f r e e of residual s t r e s s ,
.- The 35-inch-wide specimens were subjected t o repeated and s t a t i c loads i n the hng ley 1,200,000-pound-capacity -',, .k,i4A,A t e s t ing machine. The cycling was done manually and varied between zero and the maximum s t r e s s tha t could be applied without danger of premature f a i lu re , The cycling speed was approximately 3 cpm, Because of the greater amount of time required t o produce cracks i n these specimens, saw cuts were made i n most specimens before cyclic loads were applied. However, t he crack was always extended at l eas t 1/4 inch by repeated loading, Cracks shorter than 114 inch were, of course, made without saw cuts,
The gr ips f o r these t e s t s were f l a t plates clamped t o the specimens with 31 bo l t s i n each end, Each gr ip was fastened t o the t e s t ing machine by a clevis and pin, Since the cracks grew from a central hole and were usually approximately symmetrical, the pin-ended grips should have acted essent ia l ly the same a s grips restrained against rotation. A s i n the case of the 12-inch-wide specimens, the gripped ends of the specimens were roughened and p la s t i c l i n e r s were used i n the grips.
.- Specimens made from 314-inch-thick bar s t oe the same grips and machine used f o r t e s t s - - of 12-inch-wide sheet specimens, These specimens were subjected t o repeated loads varying between 40-ksf tension and 30-ksi compression, Reversed loads were applied t o these specimens t o make the cracks grow f a s t e r , The column strength of the specimens was great enough t o sup- port the compression load without guides,
The maximum tension l imi t was reduced periodically as the crack grew i n order t o lessen the chances of premature fai lure; the compres- sion l i m i t was not reduced. The campression loads tended t o produce f r e t t i n g corrosion products on the surfaces of the fat igue cracks which helped t o ident i fy the crack boundary a f t e r fa i lure . The contour of the fat igue crack was usually i r regular and the area was measured with a planimeter a f t e r f a i lu re ,
A s described previously f o r the l2-inch-wide specimens, saw cuts were made t o reduce the time required t o make deep cracks. Again, i n these cases the cracks were always extended a t leas t 114 inch by the cyclic loading.
Results and Discussion
General observations,- The t e s t r e su l t s a re presented i n tab les I1 t o V I and are plotted i n f igures 6 t o 14. I n the presentation of the

NACA TN 3816
data, the strength of the cracked specimen was defined as the maximum load divided by the area of the or iginal net section. This s t r e s s i s expressed as a percent of the ultimate t ens i l e strength of the material (as deter- mined i n t e s t s of standard t ens i l e specimens) and plotted a s the ordinate i n these figures. The abscissa i s the percentage of the or iginal net area which was l o s t a s a r e su l t of fatigue cracks and saw cuts, The diagonal dashed l i n e i n each figure represents the strength which would be obtained i f no s t r e s s concentration were present i n a cracked specimen, The theo- r e t i c a l curves i n each of the f igures a re explained i n the analysis section.
The r e su l t s of s t a t i c t e s t s of specimens with notches or holes but without cracks are plot ted as so l id t e s t points i n each figure. For a given configuration, the strength of these 2024 aluminum-alloy specimens was a smaller percentage of the ultimate t ens i l e strength of the material than was the case f o r the 7075 aluminum-alloy specimens. The strength of specimens with notches or holes sometimes exceeded the s t a t i c strength of the material. I n these cases, t he increase i n strength of 7075 specimens was generally greater than tha t of 2024 specimens,
Smal l fa t igue cracks produced rather large decreases i n s t a t i c strength, Generally, the percentage reduction i n strength of the 7075 specimens is more than tha t of 2024 specimens f o r a l l lengths of fat igue cracks.
2 i - inch-wide specimens.- Examination of data i n f igures 6 t o 9
reveals tha t fo r small specimens of a given alloy, there was no s ignif icant difference between the behaviors of sheet and extruded material, even though the grain structure was quite different ( f ig . 5).
Efforts t o remove the e f fec ts of eccentr ic i ty resul ted i n improved strength i n nearly a l l cases. The effect was, of course, more pronounced f o r spechens containing large cracks where the eccentr ic i ty was greatest . In each of the materials, the two methods of reducing the eccentr ic i ty ( tha t is, removal of materia3 from the cracked side or making a s a w cut on the opposite s ide) produced similar resul ts .
Tests of specimens with double saw cuts resulted i n strengths s l igh t ly higher than t e s t s of fatigue-cracked specimens with eccentr ic i ty removed. The number of t e s t s may be too small t o jus t i fy a def in i te conclusion, but the resu l t was consistent f o r the cases investigated.
12-inch-wide specimens.- The resu l t s of t e s t s on sheet specimens 12 inches wide ( f ig . 10) indicated a s ignif icant ly greater reduction i n s t a t i c strength f o r a given percentage of net area los t by fatigue cracking than did resu l t s of t e s t s on smaller specimens, For 7075-~6 aluminum alloy, the strength of specimens with edge notches was affected more by cracks than

was the strength of specimens with central holes. The eccent r ic i ty intro- duced by two cracks of unequal length was evidently more important i n speci- mens with edge notches, This same eccentr ic i ty a l so affected the r a t e s of propagation of the fat igue cracks with the r e su l t t h a t the two cracks i n a given specimen with edge notches were not l i k e l y t o be equal i n length.
.- For the configurations tested, t he reduc- t i o n i n s t a t i c strength due t o fat igue cracks penetrating a given per- centage of the or iginal net area was greatest f o r the 35-inch-wide sheet specimens ( f ig , ll) . I n the worst case, a 7075-~6 specimen with 23.3 per- cent of i t s cross section f a i l ed experienced a loss of 81.4 percent of the s t a t i c strength of the material. This loss i s equivalent t o a s t r e s s con- centration fac tor of 5.4 based on or iginal net area or 4.2 based on remaining net area.
When specimens with large fat igue cracks were tes ted s t a t i ca l ly , t he middle of the specimen tended t o buckle out of the plane of the sheet. This buckling was presumably due t o the transverse compression forces com- monly found near holes a t the ends of the diameter p a r a l l e l t o the applied force, I n an e f fo r t t o investigate the importance of t h i s buckling, guides made of wood were applied t o one specimen of each of the two materials, This resulted i n approximately 25 percent increase i n strength i n each case, (see f i g , 11,)
.- Among the configurations tested, t he 3/4-inch-thick specimens with cent ra l holes experienced the smallest reduction i n s t a t i c strength due t o a given percentage los s of net area. (see f i g , 12, ) The superior strength can probably be a t t r ibuted t o two factors: F i r s t , these specimens were the narrowest specimens tes ted and, second, the cracks usually grew prac t ica l ly symmetrically from the center. Eccentr ic i t ies which caused greater reductions i n strengths f o r other con- figurations were not present t o any s ignif icant extent i n these specimens.
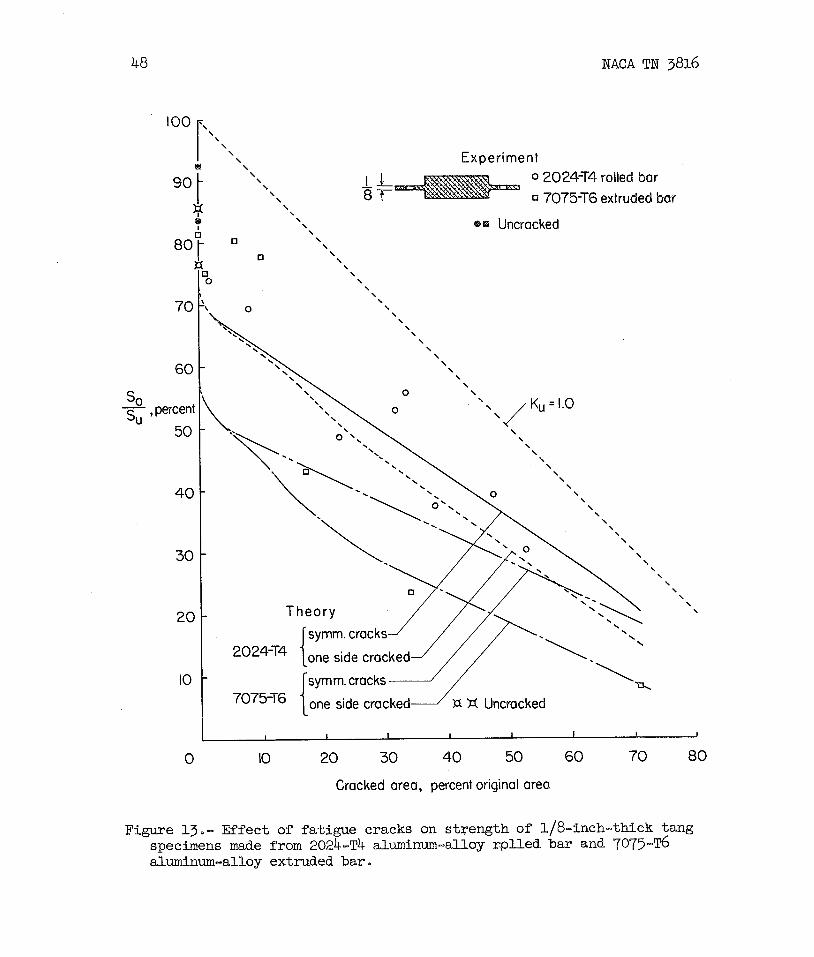
The l eas t consistent s e t of data was obtained from t e s t s of specimens with tangs, (see tab le V and f igs . 13 and 14.) I n these specimens, cracks grew i n two directions from each of two holes with the r e su l t t h a t t he amount of eccentr ic i ty present varied e r r a t i c a l l y from specimen t o speci- men, I n some cases, the crack was encouraged by saw cuts t o grow on one side only i n an attempt t o produce the most eccentric csse possible f o r t h i s configuration. The two different thicknesses of tangs contributed two different percentage losses i n net area f o r a given crack length.
S ta t i c f a i lu re i n a l l cases but three was sudden when the maximum load w a s reached, The three specimens not conforming t o t h e normal behav- i o r f a i l e d i n two stages. One of the tangs f a i l ed suddenly at a load somewhat lower than tha t which f i n a l l y caused f a i l u r e of the en t i r e speci- men. Both loads were recorded and are indicated i n tab le ~ ( d ) . The higher

of the two loads was greater than appeared consistent with the t e s t r e s u l t s f o r other specimens of t h i s ty-pe and was not plot ted i n f igures 13 and 14,
ANALYSIS
A s shown by the experimental resu l t s , the residual s t a t i c strength of a specimen containing a fat igue crack may vary considerably, depending upon the ty-pe of specimen, the extent of the crack, and the material, The purpose of t h i s section i s t o establ ish an analyt ical procedure'for the determination of the residual strength of specimens containing fat igue cracks and thereby t o eliminate the need f o r much of the tes t ing which would be required t o obtain the information experimentally.
A vast amount of research on f a i l u r e of structures containing cracks has been conducted i n connection with f a i lu res i n ships and other s t e e l structures. Most of t h i s work indicates tha t the phenomenon of the t r ans i t ion temperature i s involved i n the s t e e l problem. Since the aluminum al loys do not exhibit a t r ans i t ion temperature, l i t t l e of the work on s t e e l s can be extended t o the study of s t a t i c strength of aluminum-alloy specimens containing cracks. Irwin (ref . 8) has developed an analysis method involving computation of the e l a s t i c energy available t o extend a crack and has suggested i t s application t o "b r i t t l e " f a i lu re i n aluminum i n addition t o s tee ls . Irwin's analysis was developed t o predict t he load required t o cause a sudden fa i lu re i n a p la te containing a slow-running crack.
The r e su l t s of the present work could not be compared readi ly with Irwin's theory because suf f ic ien t ly accurate solutions f o r the s t r e s s d is t r ibut ions i n many of the configurations were not available, Further- more, i n the present t e s t s , only the maximum load carried by a given specimen and the length of the crack pr ior t o s t a t i c loading were recorded. Any extension of the crack during s t a t i c loading was, therefore, not observed and d i rec t comparison with Irwinvs anal'ysis i s not possible, The applied load i n many t e s t s produced p la s t i c s t resses throughout the specimen; thus, e l a s t i c analyses a re probably not d i r ec t ly applicable,
The point of view adopted i n t h e present paper i s tha t t he determina- t i o n of the residual s t a t i c strength of a specimen containing a fat igue crack hinges on the determination of the maximum s t r e s s _ I - - . - i n the specimen,- The residual s t a t i c strength of the spechen can then be determined i f it i s assumed tha t f a i lu re occurs whenever the maximum s t r e s s equals the ultimate t e n s i l e strength of the material. In view of other work on fracture, the maximum-stress c r i t e r ion of f a i lu re appears t o be reason- able ( re f . 9) f o r duct i le metals, For t e s t s of sheet specimens, the e f f ec t s of t r i a x i a l i t y are small and are therefore neglected i n t h i s analysis. A procedure f o r the determination of the s t r e s s concentration f ac to r a t f a i l u r e I(, has been developed within t h i s general framework.

Method of Determination of K,
The general plan which has been chosen t o compute & i s made up of three steps, F i r s t , t he e l a s t i c s t r e s s concentration f ac to r KT f o r the configuration i s computed. Then a correction i s made f o r the abso- l u t e s ize of the notch by a method developed by Neuber. (see re f . 1.) Finally, a correction i s made t o account f o r a large decrease i n s t r e s s concentration brought about by p la s t i c action. A s shown subsequently, each of these steps involves an empirical adjustment of one of t h e parrun- e t e r s used i n tha t step. I n order t o simplify the presentation and t o demonstrate the general appl icabi l i ty of the method, the proposed method i s developed first f o r specimens requiring only the p l a s t i c i t y correction. The method i s then extended t o s i tuat ions requiring s i ze and p l a s t i c i t y corrections, and f i n a l l y the case of the specimen containing fa t igue cracks is discussed.
.- Previous work a t the Langley Laboratory has l ed t o methods of predicting s t r e s s concentration fac tors i n the p l a s t i c range. Gr i f f i th ( re f . 10) t e s t ed 2024-T3 sheet specimens with cen t ra l holes t o study the p la s t i c s t r e s s concentration fac tor .for t h i s configu- ration. Stowell ( ref . 2) developed the following expression which agreed well with Gr i f f i th ' s resu l t s :
where Kp is the s t r e s s concentration fac tor i n the p l a s t i c range,
Esec is the secant modulus f o r t h e material a t the point of maximum s t ress , and ( E , ) ~ i s the secant modulus f o r the material remote from
the hole,
More recent ly Budiansky and Vidensek ( re f . 11) have analyzed t h i s same problem i n a more rigorous manner and have found good agreement between t h e i r r e su l t s and Stowellf s, a t l eas t f o r materials l i k e the aluminum alloys.
In an extension of t h i s work, Hardrath and Ohman (ref . 12) t e s t ed other configurations of specimens and found t h a t the following generalized form of StowellPs equation yielded sa t i s fac tory resu l t s :
Although t h i s equation has not been checked by rigorous mathematical analysis nor f o r large s t rains , it was t r i e d i n the present analysis

because of i t s simplicity, For calculation of the s t r e s s concen t ra t io~ f ac to r a t f racture, Esec was replaced by K, the secant modulus cor- responding t o the point of maximum s t r e s s on the stress-str 'ain curve, (see f i g , 4.) The following expression was thereby obtained:
The complete s t ress-s t rain curve f o r t h e material i s needed t o solve equation (3) f o r those cases where t h e applied s t r e s s is p las t ic . I n order t o simplify the calculations, t he secant modulus corresponding t o the nominal s t r e s s on the net section has been substi tuted f o r the secant modulus f o r material remote from the hole as used by Stowell i n reference 2. (This causes no discrepancy with St owellB s analysis because he worked with a hole i n an i n f i n i t e sheet where gross-section s t resses and net-section s t resses a re equal.) Calculations based on equation (3) require a trial-and-error procedure unless the equation i s rewritten i n t h e form
In order t o use t h i s equation, a se r i e s of a rb i t ra ry values of the f a i l i n g s t r e s s S is assumed. The corresponding values of En are found from the s t ress -s t ra in curve and, since S, and EU are constants f o r the material, a s e r i e s of KT values i s computed, When these values
of K~J a r e plot ted against S or K&, the resul t ing curve may be used t o obtain the solution of equation (3) f o r a l l values of KT,
Size ef fec t .- Many investigators working with s t r e s s concentration f ac to r s have encountered a lack of agreement between values of KII determined by the theory of e l a s t i c i t y and values determined experimen- t a l l y . The observed values a r e always below the theore t ica l values, t he difference increasing with decreasing radius of curvature i n the notch, The ef fec t is found most frequently i n analysis of fat igue t e s t resu l t s ,
A r e l a t ion or iginal ly developed by Neuber ( re f . 1 ) has been used by Kuhn and Hardrath ( r e f , 13) t o predict the endurance l imi t s i n fat igue t e s t s of s t e e l specimens having notches, The Neuber "engineering" f ac to r
@ i s based on the concept tha t materials a re composed of small "building 044 :" blocks" of l inear dimension p "cross which the s t r e s s i s constant,
The elimination of the steep s t r e s s gradient leads t o a reduction i n s t r e s s concentration fac tor according t o the relation:

where i s the e l a s t i c s t r e s s concentration factor, o, i s the included
angle i n the notch, and p i s the radius of curvature a t the base of the notch, Since the reductf on i n s t r e s s concentrat ion factor i s dependent upon the absolute s ize of the notch, the expression "size effect tg has been used i n discussion of the phenomenon, &,.-a' c '.: -
1 - . ,I%.,
Other forms f o r reduced s t r e s s concentration factors t o account f o r I ,p sf ze have been suggested (refs , 14 and l5) , but there appears t o be no conclusive method f o r choosing between them, The Neuber fac tor was chosen t o maintain consistency with previous NACA publfcations.
The combination of s ize and p las t i c i ty effects can be accounted f o r by merely substituting the Neuber fac tor KN (eq. (5) ) f o r the e l a s t i c s t r e s s concentration factor i n equation (3) :
Equations (5) and (6) were used t o determine values of p ' needed t o predict the resul t s of the four auxiliary t e s t s described i n the experimental part of t h i s paper, Table V I summarized these resul t s , From a knowledge of the specimen configuration, the values of I$ were computed; the values of IC, were found experimentally; and p P was
adjusted t o sa t i s fy equations ( 5 ) and (6). Examination of the values of p' i n tab le VI: indicates some variabi l i ty , but inasmuch as the square root of t h i s quantity i s used i n equation ( 5 ) , l i t t l e accuracy i s l o s t if the average value (p" 0~0036 inch) i s used t o predict s t a t i c f a i lu re i n the aluminum alloys tes ted i n t h i s investigation, In the in teres t of simplifying the computations, t h i s value of p D has been adopted f o r the analysis which follows,
In the analysis of th& long-life fatigue properties of aluminum-alloy spechens containing notches, Kuhn ( ref , 16) has reported t h a t a value of p e = 0,02 inch gives best agreement. The reason f o r the disagreement between the two values of p B is not known, but it is probably reason- able t o expect different values t o apply f o r the different modes of f a i l - ure. The symbol pU w i l l be used i n the subsequent discussion f o r the
special value of p B which i s used fo r s t a t i c fai lure.
For specimens having large r a d i i of curvature at the base of the notch, the s ize correction is, of course, s m a l l and KN approaches I$.

.- The problem of predicting the s t a t i c strength of specimens containing fatigue cracks according t o the system outlined i n the previous sections depends upon the calculatf on of K~J f o r the con-
4 f igurat ion, The value Q depends cr i - t ica l ly upon the radius of curva- h
; t u re a t the root of the crack, a dhension not readily measurable by : ordinary means. In t h i s analysis, the f o l l o d n g approach was adopted: The effect ive radius of curvature pe was assumed t o be a constant
independent of the pr ior his tory of the specimen and independent of the depth of the crack, Several values of p, were then computed from the
f" *\
r e su l t s of t e s t s on several types of specimens f o r which KT could be computed readily, These computations showed tha t values of pe of the
same magnitude as pU were obtained, The assumption tha t
pe = pu = 0,0036 inch made possible a fur ther simplification:
and
Since the s t r e s s concentration fac tors f o r some of the configura- t ions involved i n t h i s investigation were not available i n the l i t e r a - ture , semiempirical solutions were used, The detailed methods of com- puting KT and KN f o r the several configurations tes ted are summarized i n appendix A. The values of K, were then taken f r m f igure 15 which shows i n graphical form the solutions of equation (6) f o r a l l configma- t ions and each of the materials tes ted,
Comparison Between Calculati ons and Experiments
The method described was used t o predict the strengths of a l l of the configurations tested, The r e su l t s of the computations are pre- sented a s the theore t ica l curves i n f igures 6 t o 14,
For the unmodified 2' - inch-wide specimens made of each of the four 4: materials ( f igs . 6 t o g ) , the agreement between theory and experiment was very good. I n the cases of specimens made s p m e t r i c a l b y removal of material or by making a saw cut on the side opposite the fat igue crack, t he analysis again gave good predictions or was conser-vative,
Figure 10 i l l u s t r a t e s tha t f o r the 12-inch-wide specimens the pre- dict ions were good or conservative, The largest discrepancy on the

NACA TN 3816
conservative side i s f o r the strength of 2024-T3 specimen 20, tab le 111. Examination of t h i s specimen revealed tha t whereas most cracks grew a t r ight angles t o the direction of applied load, the fat igue crack i n t h i s specimen grew a t 70' t o the direction of the applied load. For crack growth of t h i s type, the analysis used would be expected t o give con- servative r e su l t s ,
The theore t ica l curves i n f igure 10 f o r specfmens with cent ra l holes were computed on the assumption tha t the cracks were symmetrical, I n those t e s t s where the cracks were not symmetrical, the e f fec t of eccen- t r i c i t y was small, Hence, the agreement between t e s t s and predictions was good, On the other hand, theore t ica l curves f o r specimens with edge notches were computed on the assumption tha t only one crack occurred. The prediction i s , therefore, very conservative when compared with the strength of specimen 21 i n tab le 111 i n which symmetrical cracks were formed.
The predictions f o r 33-inch-wide specimens ( f ig , 11) were i n excel- l en t agreement with the t e s t s , For large cracks, the analysis predicted accurately the strength of specimens restrained against buckling, Speci- mens which were unrestrained and which buckled probably developed addi- t i o n a l secondary s t resses which decreased t h e i r s t a t i c strength. This buckling may have been present t o some extent i n specimens having cracks through 25 percent or 30 percent of the or iginal net area,
For 314-inch-thick specimens ( f ig , 12) with central holes, the pre- dict ion i s conservative f o r 2024-~4 material and unconservative f o r 7075-.~6 material. The assumption tha t pU was a constant f o r a l l the
materials used i n t h i s inves t iga t i on may be responsible f o r t h i s dis- crepancy, Sheet specimens predominated i n t h i s investigation and had a strong influence on the choice of p,. Other values of pU would
undoubtedly improve the predictions, but the existing data are probably not suff ic ient t o jus t i fy the choice of such new values,
Analysis of the specimens with tangs presents more d i f f i c u l t i e s than any other case tested, The holes i n the tangs tend t o produce four cracks, two of which eventually reach the edge of the specimen; thus, t he specimen ac ts thereaf ter as though it had edge notches. The change i n thickness across the width adds additional complications regarding eccent r ic f t ies and computation of s t r e s s concentration factors , There- fore, each specimen should be t rea ted as a separate problem. The curves i n f igures 13 and 14 were computed according t o two simple se t s of assump- t ions t o indicate tha t reasonable estimates can be obtained by the pro- posed method. In the symmetrical case cracks were considered t o grow from both holes, and i n the unsymmetrical case cracks were considered t o grow from one hole only. These curves are intended t o cover the extremes of crack behavior. The de ta i l s of these computations are outlined i n appendix A, Since the actual cracks i n many of the specimens did not

conform exactly t o e i ther one of these schemes, individual values of the percent material strength were computed and are presented i n tab les ~ ( b ) and ~ ( d ) together with the sketches of the corresponding cracked cross sections. When the complexity of the specimen and the assumptions made a re considered, the agreement i s probably be t t e r than would be expected,
In general, the procedure developed herein gives good resul ts , especially f o r small cracks, which probably are the only ones of r e a l concern, The f a c t t ha t the method is able t o predict differences between behaviors of a l loys and types of specimens i s considered t o be noteworthy.
I n addftfon t o simplifying the computation of &, f igure 15 compares
s t a t i c notch sens i t iv i t i e s of these aluminum alloys, It i s seen tha t t he notch sens i t iv i ty i s a function of KN, When KN i s large (greater than about 5 ) , t he 7035 aluminum a l loy i s more sensit ive t o notches than 2024 aluminum a l loy because it has a higher ultimate t e n s i l e strength and a lower corresponding elongation than does the 2024 material, Therefore, the resul t ing value f o r EU/En i s greater i n the 7075 material than i n
the 2024 material ,
The curves I n f igure 15 are l inear whenever KU i s suE'ficiently high t o cause the net-section s t r e s s t o be i n the e l a s t i c range, Then, En i s E, and Eu/E is a constant. This s i tua t ion ex i s t s f o r deep
cracks or very sharp machined notches &n both alloys and, i n the 7075 materials, f o r milder notches ,
For lower values of KN, the 2024 material is more sensi t ive than
the 7075 material, The primary reason f o r t h i s s ens i t iv i ty i s t ha t f o r 2024 material the proportional l i m i t i s a smaller percentage of the ultimate t ens i l e strength than it i s f o r 7075 material, The r e su l t Is t h a t the net-section s t r e s s is usually well i n to the p la s t i c range, the value of En i s l e s s than E, and the value of Eu/En f o r the
\ 2024 materfal i s greater than the value f o r the 7075 material, Thus, t he value of Ku i s greater f o r the $024 material than f o r the 7075 material, This f a c t explains qual i ta t ively why the 2024 specimens exhibit a greater reduction i n s t a t i c strength due t o machined notches than do specimens made of 7075 aluminum alloy, The authors know of no other theory which has predicted greater strength reductions f o r 2024 specimens than f o r 7075 specimens with l i k e configuration,
Quantitatively, predict ions by t h i s analysis method a re consemat ive when applied t o t e s t s of specimens with holes or notches but without cracks. The reason f o r t h i s i s not known, The beneficial e f fec ts of t r i a x i a l i t y , which have been neglected i n t h i s analysis, should be l e s s fo r large notches than f o r sharp cracks, Specimens with large notches would therefore be expected t o have lower strength, S t a t i s t i c a l

NACA TN 3816 17
sampling ef fec ts should a lso produce lower strength i n specimens with larger volumes of material subjected t o high s tress . Reasonable changes i n pu w i l l probably not suff ice t o improve the predictions s ignif icant ly since the s ize correction (eq. (5) ) i s not very important f o r the s izes involved,
The ef fec ts of specimen width and of eccentr ici ty noted i n the experimental part of the paper a re a lso predicted by the analysis method. Figures 16 and 17 show comparisons between predicted curves f o r the four configurations of specimens t e s t ed i n each of the two sheet materials, The tendency f o r wide specimens t o be more sensitive t o cracks than nar- row specimens i s apparent. The curves f o r l2-inch-wide and 35-inch-wide specimens with cent ra l holes tend t o be pa ra l l e l f o r cracks penetrating more than 10 percent of the or iginal net area. The curves f o r specimens with edge notches ( 2 i and l2 inches wide are a lso pa ra l l e l f o r cracks 1 penetrating more than 10 percent of the or iginal net area but show con- siderably more reduction i n strength f o r deep cracks as a resul t of the eccent r ic i t ies present than do the curves f o r specimens with cent ra l holes .
The general agreement between theory and experiment tends t o jus t i fy the assumptions made, a t l eas t f o r the aluminum alloys tested. A s yet the method has not been t r i e d f o r other materials, and the proposed method of determining should not be extended without fur ther checking.
However, it i s expected tha t many of the prac t ica l problems associated with crack growth i n a i r c ra f t w i l l concern aluminum s t ruc tu ra l alloys, f o r which the present method appears applicable.
CONCLUSIONS
Sta t ic t e s t s of 2024 and 7075 aluminumdalloy specimens containing mild machined notches but without cracks revealed tha t the s'trength of the 2024 specimens i s lower, percentagewise, than i s the strength of the 7075 specimens.
S ta t ic t e s t s of 2024 and 7075 aluminum-alloy specimens containing fat igue cracks support the following conclusions:
1, S m a l l cracks caused large decreases i n s t a t i c strength.
2. The s t a t i c strength of specimens made of 7075 aluminum al loy was signif icant ly more sensitive t o the ef fec ts of cracks than the s t a t i c strength of similar specimens made of 2024 aluminum alloy.

3. On the basis of percentage of net area l o s t by fat igue cracking, wide specimens experienced greater lo s s of strength than narrow specimens with similar configurations.
4. Specimens tes ted with the f i n a l net area eccentric with respect t o the load had lower s t a t i c strengths than similar specimens which were loaded along a l i n e passing through the center of the remaining area.
5 . There was l i t t l e , i f any, difference between s t a t i c strengths of similar specimens made of sheet and extruded material f o r the same alloy.
A method of analysis based on calculation of an e l a s t i c s t r e s s con- centration fac tor f o r the configuration and on corrections f o r s ize and p l a s t i c i t y according t o the Neuber "engineering" factor and the Stowell formula, respectively, was reasonably successful i n predicting the observed t e s t resu l t s . Empirical evaluation of the effect ive radius of curvature at t h e root of a fat igue crack i n the materials tes ted and of the Neuber constant showed tha t good agreement was obtained when both quantit ies were assigned the value 0.0036 inch.
Langley Aeronautical Laboratory, National Advisory Committee f o r Aeronautics,
Langley Field, Va., Ju ly 6, 1956.
APPENDIX A
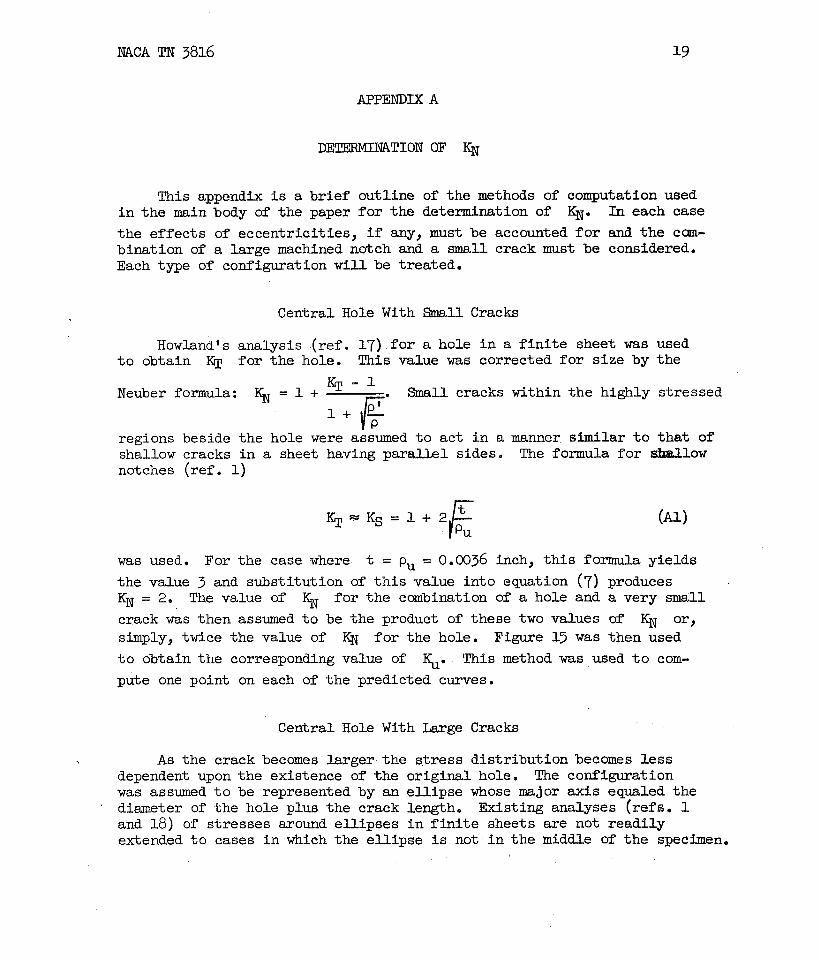
This appendix is a br ief outline of the methods of computation used i n the main body of the paper f o r the determination of Q. In each case
the ef fec ts of eccentr ici t ies , i f any, must be accounted f o r and the cam- bination of a large machined notch and a small crack must be considered. Each type of configuration w i l l be treated.
Central Hole With Small Cracks
Howland's analysis ( re f . 17) f o r a hole i n a f i n i t e sheet was used t o obtain KT f o r the hole. This value was corrected f o r s ize by the
Neuber formula: $ = 1 + - . Small cracks within the highly stressed
regions beside the hole were assumed t o act i n a manner similar t o tha t of shallow cracks i n a sheet having pa ra l l e l sides. The formula f o r low notches ( ref . 1 )
was used. For the case where t = p, = 0.0036 inch, t h i s formula yields ..
the value 3 and substitution of t h i s value in to equation (7) produces I(N = 2. The value of fo r the combination of a hole and a very small crack was then assumed t o be the product of these two values of KN or, simply, twice the value of f o r the hole. Figure l5 w a s then used
t o obtain the corresponding value of This method was used t o com-
pute one point on each of the predicted curves.
Central Hole With Large Cracks
, A s the crack becomes Larger the s t r e s s dis tr ibut ion becomes l e s s dependent upon the existence of the osiginal hole. The configuration was assumed t o be represented by an e l l ipse whose major axis equaled the diameter of the hole plus the crack length. Existing analyses (refs . 1 and 18) of s t resses around e l l ipses i n f i n i t e sheets are not readi ly extended t o cases i n which the e l l ipse i s not i n the middle of the specimen,

The following semiempirical method was therefore used t o estimate the s t r e s ses a t cracks originating from a cent ra l hole. Neuber ( r e f . 1) and others have suggested the form
fo-4: a small e l l i p s e i n a wide sheet. This formula yields the appropriate value of 3 f o r the circular .hole . I f it i s assumed tha t the f i r s t term accounts f o r the s t r e s s present without a notch and tha t the f ac to r w p
accounts f o r the f la tness of t h e e l l ipse , appropriate modification of the fac tor 2 might account f o r the f i n i t e width of the sheet. The Howland and Sjostri4m analyses (refs . 17 and 19) were used t o make t h i s modifica- t i o n as follows :
where (%Aole i s the s t r e s s concentration fac tor f o r a hole with a
diameter equal t o the major ax is of the e l l i p se and located at the appropriate posi t ion i n a sheet of f i n i t e width (values from f i g . 18). This analysis yields values somewhat greater than those predicted by Westergaard (ref . 18), but was used because of the poss ib i l i t y of applying it t o eccentric cases.
Values of K, f o r cracks with t i p > 10 were obtained by computing
I(;r according t o the method Just described, KN according t o formula (7), and f i n a l l y KU from f igure 15. I n the narrow region 1 < tip < 10, the predicted strength curve was a r b i t r a r i l y faired.
Symmetrical Edge Notch With Cracks
The same type of analysis as described i n the preceding section was used f o r small cracks ( t /p = 1 ) . The value of % f o r the edge notch was determined by Neuberls equations f o r deep and shallow notches, h i s t r a n s i t ion formula
and f i n a l l y h i s engineering fac tor (eq. (7) ) . This value of $ ms
multiplied by 2 which is the value of Kjy f o r a crack with t / p = 1.

NACA TN 3816 21
Stress concentration factors fo r cracks deeper than t / p = 10 were again assumed t o be independent of the or iginal notch. The configuration was then assumed t o be represented by symmetrical edge notches whose depth equaled the sum of notch depth and crack depth. Neuberls relat ions were used as before. Since in each of the cases under consideration the r a t ios t / p and a l p are large, the Neuber relat ions may be simplified by taking the l imiting form of each re la t ion as p+O. This procedure r e su l t s i n
( ~ 4 )
and
Edge Notches With Unsymmetrical Cracks
I n nearly a l l cases, the cracks i n specimens having edge notches were e i the r on one side only or s ignif icant ly longer on one side than on the other. T r i a l computations showed tha t , i n each case, the best pre- dictions were obtained when the side of the speciuien opposite the longest crack was assumed t o have a s t ra ight boundary. For example,
L-A;umed bovnda
Short crack
Neuber has two solutions which are useful t o t r e a t unsymmetrical cracks. The f irst is the solution f o r loca l s t r e s s due t o tension load applied along the axis passing through the center of the net section and is shown by the following i l lu s t r a t ion and equat ions :

22 NACA TN 3816
The second i s f o r loca l s t r e s s due t o bending and i s a s follows:
Both s e t s of equations (eqs. ( ~ 6 ) and ( ~ 7 ) ) were used, and KT and KN fo r the ax ia l load and bending cases were obtained from the
usual Neuber relat ions (eqs. ( ~ 3 ) and ( 5 ) ) . The loca l s t r e s s was f i n a l l y obtained from the following relat ion:
Based upon some additional t e s t s designed t o determine the end f i x i t y of the specimens i n the tes t ing machine, the moment M i n the above re la t ion
3 w a s taken t o be -Pe where e i s the eccentr ici ty of the load with 4
respect t o the remaining net section. For rectangular cross sections, equation ( ~ 8 ) reduces t o
Equation (Ag) was used t o compute KN f o r a l l cases of cracks growing from edge notches except f o r the cases where the specimens were made symmetrical by removal of material or by saw cuts. I n these cases, no bending was present and o n l y (I(N) was needed.
ax ia l
Specbens With Tangs
The theoret ical curves f o r specFmens with tangs, f igures 13 and 14, were computed f o r two assumed modes of crack growth: symmetrically cracked and cracked on one side only.

For the symmetrical case, cracks of equal length were assumed t o grow a s shown:
Case A Case B
The analysis f o r case A was similar t o tha t used fo r holes with cracks i n sheet specimens. Case B was analyzed by using the procedure f o r sym- metrical edge notches.
For the case of cracks on one s ide only, cracks were assumed t o grow from one hole instead of both. The analysis was similar t o tha t f o r t h e symmetrical case except t h a t the eccentr ic i ty of loading was a lso taken in to account.
Since two different thicknesses of tang contributed different per- centages of area f o r a given crack depth, a separate strength curve was found f o r each. Individual percent material strengths computed f o r each of the actual crack configurations a re presented i n tab les ~ ( b ) and ~ ( d ) .

APPENDIX B
APPEKRANCE OF FAILURE SURFACES
One interest ing aspect of the investigation was the appearance of the f a i lu re surfaces. I n every case the boundary between the fat igue crack and the s t a t i c f a i l u r e was c lear ly vis ible . The contrast was par t icu lar ly s t r ik ing i n the cases of the 3/4-inch-thick specimens. Fig- ure 19 shows photographs of typ ica l specimens.
The "herringbone" patterns v is ib le i n figure 19(a) were found only i n the 2024-~4 specimens with tangs. The s t a t i c f a i lu re of th ick speci- mens without tangs i n each of the materials was characterized by a granu- lar surface on a plane normal t o the axis of the specimen except f o r the outer 1/8 inch of material, where the familiar shear f a i l u r e was present. Fai lures i n 7'075-~6 specimens with tangs (f ig . lg (c) ) were extremely jagged and had l i t t l e tendency t o occur along a plane normal t o the axis of the specimen. Some evidence of lamination i n the material was found fo r these l a t t e r specimens although specimens without tangs cut from t h e same bars showed no such character is t ics .
Fatigue cracks i n the sheet specimens and t h i n extrusions were usually i n a plane nomnal t o t h e surface. The s t a t i c a l l y f a i l ed portion of the surface was usually of the shear type. However, i n 7075-~6 speci- mens there was a consistent tendency f o r the material near the middle of the thickness t o f a i l along a surface normal t o the face of the sheet. The usual shear f a i lu re was present near both faces.

NACA TN 3816
1. Neuber, Heinz: Theory of Notch Stresses: Principles f o r Exact Stress Calculation. J. W e Edwards ( ~ n n Arbor, ~ i c h . ) , 1946.
2. Stowell, Elbridge Z.: Stress and St ra in Concentration a t a Circular Hole i n an Inf ini te Plate. NACA TN 2073, 1950.
3. Anon. : 1955 Book of ASTPI Standards Including Tentatives. Part 2 - Non-Ferrous Metals. Tentative Methods of Tension Testing of Metallic Materials (ASTM Designation: ~ 8 - 5 4 ~ ) . A .S .T.M. ( ~ h i l a d e l ~ h i a ) , 1B5, pp . 1246-1260.
4. ~ n d n . : Strength of Metal Aircraft Elements. ANC-5, Munitions Board Aircraf t Committee, Dept. of Defense. Revised ed., June 1951.
5. Grover, H. J., Hyler, W. S., Kuhn, Paul, Landers, Charles B., and Howell, F. M. : Axial-Load Fatigue Properties of 2 4 ~ - ~ and 75s-T Aluminum Alloy As Determined i n Several Laboratories. NACA Rep. 1190, 1 ~ 4 . (super- sedes NACA TN 2928.)
6. McGuigan, M. J., Jr., Bryan, D. F., and Whaley, R. E.: Fatigue Investi- gation of Full-Scale Transport-Airplane Wings - Summary of Constant- Amplitude Tests Through 1953. NACA TN 3190, 1954.
7. Hardrath, Herbert F., and I l l g , Walter: Fatigue Tests a t Stresses Producing Failure i n 2 t o 10,000 Cycles - 24S-~3 and 7 5 ~ - ~ 6 Aluminum- Alloy Sheet Specimens With a Theoretical Stress-Concentration Factor of 4.0 Subjected t o Completely Reversed Axial Load. NACA TN 3132, 1954 8
8. Irwin, George : Fracture Dynamics. Fracturing of Metals. A.S .M. ( levela and) , c .1948, pp . 147-166.
9. Gensamer, Maxwell: Strength of Metals Under Combined Stresses. American Soc . Metals levelan and) , c .1941.
10. Griff i th , George E.: Experimental Investigation of the Effects of P las t ic Flow i n a Tension Panel With a Circular Hole. NACA TN 1705, 1948.
a l l . Budiansky, Bernard, and Vidensek, Robert J.: Analysis of Stresses i n the P las t ic Range Around a Circular Hole i n a P la te Subjected t o Uniaxial Tension. NACA TN 3542, 1955.
12. Hardrath, Herbert F., and Ohman, Lachlan: A Study of Elas t ic and Plas t ic Stress Concentration Factors Due t o Notches and F i l l e t s i n F la t Plates. Rep. 1117, 1953. (supersedes NACA TN 2566. )

26 NACA TN 3816
13. Kuhn, Paul, and Hardrath, Herbert F.: An Engineering Method f o r Estimating Notch-Size Effect i n Fatigue Tests on Steel. NACA TN 2805, 1952.
14. Heywood, R . B . : Stress Concentrat ion Factors - Relating Theoretical and Prac t ica l Factors i n Fatigue Loading. Engineering, vol. 179, no. 4645, Feb. 4, 1955, pp. 146-148.
15. Siebel, E . , and St ieler , M e : Ungleichformige Spannwsverteilung b e i schwingender Beanspruchung. Z.V.D.I., Bd. 97, N r , 5, Feb, 11, l s 5 , pp. 121-126.
16. Kuhn, P. : Effect of Geometric Size on Notch Fatigue. In t . Union of Theor. and Appl. Mech. Colloquium on Fatigue (~tockholm, May 1955), Springer ( ~ e r l i n ) , 1 ~ 6 , pp . 131-140.
17. Howland, R. C. J.: On the Stresses i n the Neighbourhood of a Circular Hole i n a S t r ip Under Tension. Phil. Trans. Roy. Soc. ho on don), ser. A, vol. 229, no. 671, Jan. 6, 1930, pp. 49-86.
18. Westergaard, H. M.: Bearing Pressures and Cracks, Jour. Appl. Mech., vol. 6 , no. 2, June 1939, pp. A-49 - A-33.
19. Sjb'strom, S.: On the Stresses a t the Edge of an Eccentrically Located Circular Hole i n a S t r ip Under Tension. Rep. No. 36, Aero. Res. Inst . of Sweden (~tockholm), 1950.

TABU I
TENSII;E PROPERTBS OF MATERIALS TESTED
2024-T4 extrusion
2024-T4 rolled bar
7073-~6 extrusion
7 0 7 5 ~ 6 extruded bar

NACA TN 3816

TABU 11,- Concluded
RESUETS OF W I C TESTS OF 2l INCH-!LTlX SPEClMENS 6-
(b) Modified specimens
7075-T6 extrusion 2024-T3 sheet 2024-T4 extrusion 7075-T6 sheet
Eccentricity reduced (material removed)
Specimen
1 2 3 4 5
Crached ma,
percent original
area .
15.7 26.2 32.3 40.0 58.4
42.3 58.1 58-9 51.8 45 .o 45.5 35.3
76.8 59.1 50.2 30.8
Eccentricity reduced (saw cut)
Static strength,
lrsi
46.0 42.0 38.3 34.4 22.9
i 9
10
Static strength, So/S, percent
68.3 67.5 52.1 50.0 47.0 40.2
Static stmngth,
percent
64.0 58.5 53.3 48.0 31.0
7.5 17.1 35.6 43.0 58.5
Spretrical saw cuts (no fatigue crack)
Specimen
16 17 18
Specimen
49 50 51
Static strength,
hi
52.0 43.6 9 . 9
Cracked area,
percent original
area
11.8 19.9 39.7
50.6 46.8 35.6 32.5 24.1
.u l2 13 - 14 15
Static strength,
' O / ~ U percent
60.0 50.3 44.9
Cracked
percent original
area
5.3 30.5 56.9
70.5 65.0 49.6 45.2 33.6
19 20 u 22
6.9 8.3
33.8 65.5 66.0
53.7 53.9 40.2 22.9 21.1
Static strength,
ksi
5 0 ~ 6 33.8 23+6
74.9 75.0 56.0 31.9 29.4
36.7 50.4 51.0 44.9 g . 9 39.4 30.6
4.7 19.7 63.8 65.6
Static strength,
percent
75.4 50.3 35.1
66.5 51.1 43.5 26.7
-
Specimen
26 27 28 29 P 31
54.6 46.5 U,O 20.5
32
37 38 39 40 41 42 43
81.3 69.2 1 2 P . 5
23 24 25
Cracked area,
percent original
area
3.6 10.5 p . 6 38.2 46.7 57.5
Static strength,
ksi
55.0 54.4 42.0 40.2 37-8 32.4
7.2 1 . 2 2.0 23.0 26.0 34.5 39.5 39.8 42.0 44.7 56.4 59.0
8.9 32.7 3
-
56.1 52.0 49.5 56.4 43.0 41.0 42.6 43.6 42.1 40.8 32.7 29.6
52.4 40.0 40.3
Tf.9 59.5 60.0
14.5 17.7 1 8 29.2 3 5 . 40.4 58.0
69.8 64.6 61.5 70.0 53.5 51.0 53.0 54.2 52.4 50.6 40.6 36.8
52
55 56 57 58
44 45 46
2
8.6 15.4 34.6 55.5 66.4
65.7 52.7 48.0 34.1 27.8
81.6 65.5 59.6 42.4 34.6
59 60 61 62
10.0 39.5 40.0 65.9

TABU I11
RESULTS OF STATIC TESTS OF 12-INCE-WIDE SPECIMENS
TABU IV
RESULTS OF STATIC TESTS OF 35-INCH-WIDE SPECIMENS
11 707>-T6 sheet 1
L
2024-Tg sheet
%ith guides.
70754% sheet
With central hole With central hole With edge notch With edge notch
Static strength,
percent
86.5 81.9 70.8 72.0 60.2 54.8 43.2 56.0 55.3 37.3 38.9 38.8 38.4
Static strength'
2 i z ~ ~ 97.2 79.5 61.7 51.8 50.6 29.1
Specimen
14 15 16 17 18 19 20 21
Static strength,
bi
62.1 58.8 50.9 51.7 43.2 43.1 41.4 44.3 39.7 26.8 27.9 28.8 27.6
Specimen
1 2 3 4 5 6 7 8 9
10 11 12 13
Specimen
28 29 30 31 32 33 34 35
Static strength,
bi
78.2 64.0 49.6 41.6 40.7 23.9
Specimen
22 23 24 25 26 27
Static strength,
hi
69.8 56.7 45.4 41.5 44.3 36.4 28.3 31.3
Cracked area,
percent original
area
0.0 1.1
11.7 12.0 12.6 23.4 41.0 41.9
Cracked area,
percent original
area
0.0 0.0 2.5 3.0
3 . 0 17.4 17.8 18.0 19.8 j4.0 34.7 9.8 35.9
Static strength,
-1
83.4 65.3 42.9 35.0 39.7 32.5 31.6 25.5
Cracked area,
percent original
area
0.0 0.1 1.3 2.2 3.9 5.8
13.6 23.7
Cracked area,
percent original
area
0.0 0.1 2.1 9.3
18.0 29.8
Static strength,
::!zit 97.1 79.0 63.1 57.8 61.6 50.7 39.4 43.5
Static strength, SoISU9 percent
103.5 81.1 53.3 43.5 49.3 40.4 39.3 31.7

NACA TN 3816
TABU V
R E ~ S w =TIC TESTS OF ;J /~-IM~-TBICK m~cmzis
(a) 2024-~4 rolled bar 2 inches wide
Spechen
1
2 3.8 48.0 74.1
Cracked area, percent original area
o
Crack profi le
Em
Static strength,
ksi -
58.3
Sta t ic strength,
percent SO/%,
9.0

NACA TN 3816
TABLE V.- Continued
REsUIlrS CIF STATIC IIIESTS (IF 314-INCH-!CHICK SPECIMENS
(b) 2024-~4 rolled bar Kith tangs
Crack profile

NACA TM 3816
TABLE Td , - Cont inued
RESULTS OF STATIC TESTS OF 3/4-INCH-TRICK SPECIMENS
(c ) 7075-~6 extrusion 2 inches wide

TAB= V.- Concluded
NACA TN 3816
(d) 7075-6 extrusion with tangs
o or specimens 2, 3 , and 10, the first numbers indicate the conditions under which the crack advanced completely through one tang. The num- bers in parentheses are conditions at final failure of the specimenj
Crack profile

NACA TN 3816
TABLE VI
RESULTS OF AUXILIARY TESTS
[p = 0.005 in.; % = 27-41
Type of notch

NACA TM 3816
Figure 1,- Configuration of small specimens.


Tang I I
SECTION A-A
Figure 3.- Configuration of specimens made from g/k-inch-thick bar stock.

NACA TN 3816
r 7075-T6 extruded bar
60
S, ksi
40
7075-T6 extruded, Q thick I I 1
I -7075-T6 sheet
S t rain, percent
Figure 4.- Stress-strain curves for materials tested.

Face Transverse Longftudiml
(a) 2024-~3 sheet.
(b) 2024-~4 extrusion,
( c ) 7075-T6 sheet,
(d) 7075-T6 extrusf on
LC-93582
Figure 5 . - Macrostructure of materials used f o r small specimens ( X 1-0)


NACA TN 3816
Cracked area, percent original area
Figure 7.- Effect of fatigue cracks on strength of 2024-~4 aluminm-alloy- extrusion specimens 2L inches wide.
4

NACA TN 3816
Cracked area, percent original area
Figure 8. - Effect of fatigue cracks on strength of 7075-6 aluminum-alloy- 1 sheet specimens 2- inches wide. 4

NACA TN 3816
100 $ Experiment
\ 0 A \
0 \
\. 0 Uncracked
2, percent
\ # Uncracked
Cracked area, percent original area
Figure 9.- Effect of fatigue cracks on strength of 7075-6 aluminum-alloy- extrusion specimens 2L inches wide.
4

Experiment
0 2024-T3 o A 7075-T6 0
me.+ Uncracked
mA@QCracked one side only
0 10 2 0 3 0 40 5 0 60 70 80
Cracked area, percent original area
Figure 10.- Effect of fatigue cracks on strength of 2024-~3 and 7075-'I6 aluminum-alloy-sheet specimens 12 inches wide. (~ymmetric.al cracks were assumed in computing curves for specimens with central holes; cracks on one side only were assumed in computing curves for speci- mens with edge notches.)

MACA TN 3816
100 r, I \ \ \ \ \
90 \
\
T 80 .C' 'a \ \
\ \ \ \ \ \ \ \ \ \ \ \ \ \ \ \ \ \ \ \ \ \ \ \ \ \ \ \ \ \ \
\ \ \ \ \ \ \ \ \ \ \
20 - \\
#a Uncracked I I I I I I I I
Experiment
o 2024-T3 0 7075-T6
ssuncracked @@With guides
0 10 20 30 40 50 60 70 80
Cracked area, percent original area
Figure 11.- Effect of fatigue cracks on strength of 2024-T3 and 707546 . aluminum-alloy-sheet specimens 35 inches wide.

NACA TN 3816
Experiment
0 2024-T4 rolled bar
0 7075-T6 extruded bar
@ + Uncracked
Figure 12.- H f e c t of fatigue cracks on strength of 314-inch-thick speci- mens made from 2024-~4 aluminum-alloy rol led bar and 7075-6 aluminum- al loy extruded bar. (symmetrical cracks were assumed i n computing curves. )
NACA TN 3816
Experiment
I L 0 2024T4 rolled bar 87~- 7075-T6 extruded bar
Uncracked
Cracked area, percent original area
Figure 13,- Effect of fatigue cracks on strength of 118-inch-thfek tang specimens made from 2024-~4 aluminum-alloy rplled bar and 7075-~6 aluminum-alloy extruded bar.

NACA TN 3816
Experiment
90 t \ \ \ I A-. o 2024-T4 rolled bar * \
\ A
TT- \ A 7075-T6 extruded bar
I \ \
* A Uncracked
0 10 20 30 40 50 60 70 80
Cracked area, percent original area
Figure 14.- Effect of fatigue cracks on strength of 1/4-inch-thick tang specimens made from 2024-~4 aluminum-alloy rolled bar and 7075-~6 aluminum-alloy extruded bar.

NACA TN 3816
Figure 15,- Relation between stress concentration factor a t fai lure and the Neuber factor.

NACA TN 3816
\ \ \ \ \ \ \ \
\ \ \ \ \ \ \ \ \ \ \ \ \ \ \ \ \ \ \ \ \ \ \
12 wide, central hole
12 wide, edge notch
\ 35 wide, central hole
0 10 20 30 40 50 60 70 80
Cracked area, percent original area
Figure 16. - Predicted strengths of 2024-~3 aluminum-alloy-sheet specimens . (symmetrical cracks were assumed in computing curves for specimens with central holes; cracks on one side only were assumed in computing curves for specimens with edge notches,)

4 percent 'u' 5 0
Cracked area, percent original area
Figure 17. - Predicted strengths of '7075-6 aluminum-alloy-sheet specimens. (Symmetrical cracks were assumed in computing curves for specimens with central holes; cracks on one side only were assumed in computing curves for specimens with edge notches.)

NACA TN 3816
4.0
3.5
3.0
K~
2.5
2 .o 0 .2 .4 .6
P G
Figure 18.- Stress concentration factor for an axially loaded sheet con- taining an eccentric hole.

NACA 'Dl 3816
2024-T4
dolled bar
Extruded bar
L-93581 Figure 19. - Photographs of f a i l ed surf ace of 314-inch-thick specimens.
NACA - Langley Field, Vd.