nation building and economic growth - usna · zdepartment of economics, 589 mcnair rd., annapolis...
TRANSCRIPT
Does Nation Building Spur Economic Growth? ∗
Ellyn Creasey†
Ensign, U.S. Navy
Ahmed S. Rahman ‡
U.S. Naval Academy
Katherine A. Smith§
U.S. Naval Academy
July 2011
Abstract
Nation building, the simultaneous allocation of economic and military aid in con-
�ict environments, has cost the world trillions of dollars over the last half century. Yet
few attempts have been made to quantify the potential growth e�ects for the recip-
ient country from the provision of this aid. Using a forty-�ve year panel dataset, we
construct a measure of nation building using a three-way interaction term between
military assistance, economic aid, and con�ict regime. We �nd that spending on na-
tion building has a positive e�ect on economic growth. Once con�ict ceases, however,
continued military operations coupled with economic aid harms growth.
JEL Codes:F3,F4,O4
Key Words: Nation Building, Economic Growth, Foreign Aid
∗The views expressed in this paper are solely those of the authors and should not be interpreted asre�ecting the views of the U.S. Department of Defense.†Email: [email protected].‡Department of Economics, 589 McNair RD., Annapolis MD, USA. Email: [email protected].§Contact author. Department of Economics, 589 McNair RD., Annapolis MD, USA. Email:
1
1 Introduction
Nation building has been an important element of foreign policy for at least a century. His-
torians date the �rst nation building operation conducted by the United States back to 1901,
when the USS Thomas brought �ve hundred teachers to Manila Bay with naval escorts to
�rebuild� the Philippines.1 While nation building operations have varied with time, they
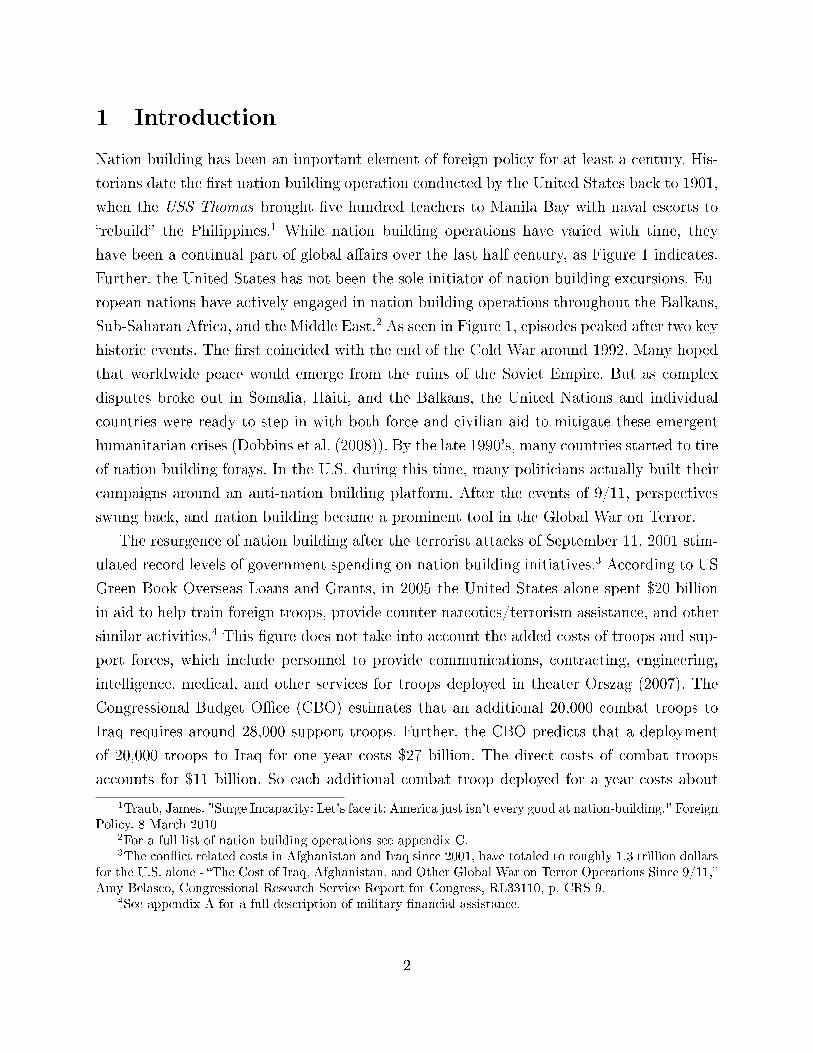
have been a continual part of global a�airs over the last half century, as Figure 1 indicates.
Further, the United States has not been the sole initiator of nation building excursions. Eu-
ropean nations have actively engaged in nation building operations throughout the Balkans,
Sub-Saharan Africa, and the Middle East.2 As seen in Figure 1, episodes peaked after two key
historic events. The �rst coincided with the end of the Cold War around 1992. Many hoped
that worldwide peace would emerge from the ruins of the Soviet Empire. But as complex
disputes broke out in Somalia, Haiti, and the Balkans, the United Nations and individual
countries were ready to step in with both force and civilian aid to mitigate these emergent
humanitarian crises (Dobbins et al. (2008)). By the late 1990's, many countries started to tire
of nation building forays. In the U.S. during this time, many politicians actually built their
campaigns around an anti-nation building platform. After the events of 9/11, perspectives
swung back, and nation building became a prominent tool in the Global War on Terror.
The resurgence of nation building after the terrorist attacks of September 11, 2001 stim-
ulated record levels of government spending on nation building initiatives.3 According to US
Green Book Overseas Loans and Grants, in 2005 the United States alone spent $20 billion
in aid to help train foreign troops, provide counter narcotics/terrorism assistance, and other
similar activities.4 This �gure does not take into account the added costs of troops and sup-
port forces, which include personnel to provide communications, contracting, engineering,
intelligence, medical, and other services for troops deployed in theater Orszag (2007). The
Congressional Budget O�ce (CBO) estimates that an additional 20,000 combat troops to
Iraq requires around 28,000 support troops. Further, the CBO predicts that a deployment
of 20,000 troops to Iraq for one year costs $27 billion. The direct costs of combat troops
accounts for $11 billion. So each additional combat troop deployed for a year costs about
1Traub, James. "Surge Incapacity: Let's face it: America just isn't every good at nation-building." ForeignPolicy. 8 March 2010
2For a full list of nation building operations see appendix C.3The con�ict related costs in Afghanistan and Iraq since 2001, have totaled to roughly 1.3 trillion dollars
for the U.S. alone - �The Cost of Iraq, Afghanistan, and Other Global War on Terror Operations Since 9/11,�Amy Belasco, Congressional Research Service Report for Congress, RL33110, p. CRS 9.
4See appendix A for a full description of military �nancial assistance.
2

Figure 1: Nation Building over time
Source: OECD Creditor Reporting System, International Military Intervention Data Set, UCDP-
PRIO Armed Con�ict Data
3

$550 billion. One can use this statistic to roughly estimate the total troop costs incurred
by the United States during its nation building operations - including troop costs, the U.S.
spent roughly $100 billion in nation building costs just in 2005.
Despite the huge costs involved, the growth e�ects of nation building remain under-
explored. This paper attempts to empirically measure the direct bene�ts for the recipient
country's development from nation building operations. Foreign aid of any sort has the
potential to spur economic growth by increasing capital and/or productivity. During times
of con�ict, however, growth can be severely impeded by violence and uncertainty. On the
one hand, nation building (the joint provision of economic and military aid in con�ict or
post-con�ict areas) may raise the e�ectiveness of aid by complementing economic assistance
with military security. If military aid reduces uncertainty, a boost to capital or productivity
from the simultaneous provision of economic aid may encourage private investment. On the
other hand such robust foreign involvements may potentially crowd out private provisions
or generate a crippling dependency which hinders growth prospects. The net growth e�ect
of nation building e�orts is thus an empirical question, one that surprisingly has not been
addressed in prior literature.
Studies have analyzed the growth e�ects of economic aid, military aid, or con�ict in iso-
lation, but have yet to explore the con�uence of all three.5 Yamarik et al. (2010) shows that
con�ict negatively a�ects economic growth and the negative impact increases as a function
of con�ict intensity. Imai and Weinstein (2000) delineates the speci�c ways in which civil
war negatively a�ects growth. Caplan (2002) adds that con�ict harms less developed nations
more than highly developed ones. Additionally, the magnitude of damage depends on the
type of war being fought. Caplan (2002) �nds that internal con�icts, typically between a
government and a rebel faction, cause greater damage than interstate con�icts. Considering
the negative impacts of con�ict on economic development, several economists have consid-
ered the potential bene�ts of introducing foreign aid in post-con�ict environments. Collier
and Hoe�er (2002) create a model for analyzing foreign aid in post civil war situations.
Building upon the classic foreign aid model �rst described by Burnside and Dollar (1997),
they show that aid impacts growth by the greatest amount during the four to seven year
period following an internal war. Kang and Meernik (2004) show that a donor nation tends
to provide long-lasting post con�ict economic assistance to nations to whom they previously
provided military assistance.
5See the recent meta-analysis of Mekasha and Tarp (2011) that suggests aid has generally been good forgrowth.
4

These studies underscore the need to look at economic aid, military aid, con�ict and
post-con�ict environments simultaneously. Speci�cally, it remains unclear if joint economic
and military assistance helps countries grow, either during war or directly afterwards. Of
course the likelihood that economic and military aid are themselves endogenous to growth
complicates inference. But the implications from a careful study of nation building should
be of interest to both policy makers and academics.
In this paper we estimate the growth e�ects of nation building using a forty-�ve year
cross-country dataset. We measure nation building using a three-way interaction term of
economic aid, military support and con�ict regime. The estimation of these potential com-
plementarities requires instrumentation because slow growing countries tend to su�er more
violence and thereby require more aid. This reverse causality is corrected by a two stage esti-
mation process. We �rst estimate aid �ows, and then use those estimated values to measure
the impact of nation building on growth. What we �nd is that spending on nation building
does have a slightly positive e�ect on economic growth. Once con�ict ends, however, we pre-
dict that continued military operations coupled with economic aid harms the economy. The
results hold whether a single country or a multilateral group performs the nation building
operation. Thus while there appear to be complementarities between money and military
assistance during the thick of con�ict, joint assistance harms economic development once
con�icts are resolved.
2 Con�ict, Economic Aid, and Military Assistance in
the Context of Solow Growth
To tackle the question of potential complementarities between military and economic aid
during or after war, we explore the impacts of nation building within the context of the
neoclassical growth model. In Solow (1956), output per capita growth is a function of the
current stock of capital per e�ective labor, savings rate, population growth rate, capital
depreciation, and labor productivity. In each period, the economy invests a portion of its
output towards new capital. Simultaneously, per capita capital shrinks due to depreciation
and population growth. The model's dynamics imply that that each country converges to its
own steady-state according to its unique long-term fundamentals.
In the context of this framework, con�ict can potentially a�ect growth in several di�er-
ent ways. First, con�ict can outright destroy the current capital stock as evidenced by Imai
and Weinstein (2000). Additionally, the instability of con�ict can dissuade private invest-
5
ment, lowering new capital formation. The destructive nature of con�ict may also raise the
depreciation of physical and/or human capital. Finally, con�ict can foster mismanagement
and ine�ciency, cutting into the productivity of the economy. For these reasons, con�ict in
general is likely to have a negative e�ect on economic growth.
Neoclassical theory further suggests that con�ict should be temporarily disruptive to
growth (see Easterly et al. (1993)). That is, wars waged domestically can disrupt production
and depress investments. Once the con�ict ends however, the fundamentals of the economy
are restored, and the recovery phase should bolster growth as productive activities recom-
mence and infrastructure is rebuilt. We thus consider con�ict and post-con�ict treatments
as variables that in�uence the speed of convergence of an economy to its steady-state, but
not the steady state itself.
We wish to explore the interactions between di�erent con�ict scenarios and di�erent
types of aid. These interactions can either speed up or slow down a nation's convergence
to its own steady state. As in Mankiw et al. (1992) and Islam (1995), one can log-linearize
and �rst di�erence the steady state equation from the Solow model in order to empirically
construct a panel growth regression. In addition to including the fundamental variables of
growth, one may include other auxiliary explanatory factors (Durlauf and Quah (1998)). Our
empirical strategy is to include measures of con�ict and post-con�ict periods, economic aid
and military assistance along with the fundamental variables that are standard in neoclassical
growth theory.
Military intervention alone can help foster a secure environment, potentially encouraging
higher savings rates and lowering both physical and human capital depreciation (Jones and
Kane (2007)). Such intervention could however cause further disruption to the local economy
and thus slow down growth. Similarly, di�erent types of aid during con�ict or post-con�ict
may help or hinder a country's transitory dynamics. This aid may help replenish a war-torn
nation's stock of capital, or it may crowd out local private investments. Finally, economic aid
and military assistance together may act as compliments that provide both funding for local
projects and security to allow those projects to succeed. On the other hand, joint assistance
may simply crowd out each type of aid or other forms of investments, or foster a dependency
that further stagnates the economy. In summary, the net e�ects of joint aid projects during
or after con�ict is an empirical question, to which we now turn.
6
3 Empirical Estimation
To gauge the growth e�ects of nation building, we augment the neoclassical growth model
to incorporate con�ict, military assistance, and economic aid variables.
Following Durlauf and Quah (1998), a standard Solow model augmented with human
capital can be estimated with panel data using the following equation:
lnyj(t+ T )− ln(yj(t)) = b0 + b1lnyj(t) + b2ln(skj,t) + b3ln(shj,t
) + b4ln(nj,t) + εj,t. (3.1)
where b0 = µj + κt represents country and time speci�c e�ects in country j during time
period t.6
Consistent with the Solow model, we include initial GDP levels (lnyj)to capture the idea
that growth depends on a country's distance from its steady state. Considering that each
country may have a unique steady state, we include the determinants of steady state: savings
rates for physical capital (sk), savings rates for human capital (sh), and population growth
rates (n). The growth span, T , is set to 3 year increments in order to isolate the long run
growth e�ects versus annual business cycle e�ects, suggested by Islam (1995) and Collier
and Dollar (2002).
The impacts of nation building are captured in the following framework:
∆yj,t = µj + κt + α ∗ lnyj(t) +3∑
i=1
φixj,t,i +11∑i=1
θizj,t,i + εj,t (3.2)
where:
∆yj,t = lnyj(t+ T )− ln(yj(t)
xj,t,1 = ln(investmentj,t
GDPj,t)
xj,t,2 = ln(educationj,t
GDPj,t)
xj,t,3 = ln(
populationj(t+T )−populationj(t)
populationj(t)
)zj,t,1 =con�ict indicatorj,t
zj,t,2 =post con�ict indicatorj,t
zj,t,3 = ln(economic aidj,t)
zj,t,4 = ln(economic aidj,t∗con�ict indicatorj,t)zj,t,5 = ln(economic aidj,t∗post con�ict indicatorj,t)6Here we are assuming capital depreciation and total factor productivity are similar across nations and
therefore absorbed into the time speci�c e�ects, κt.
7
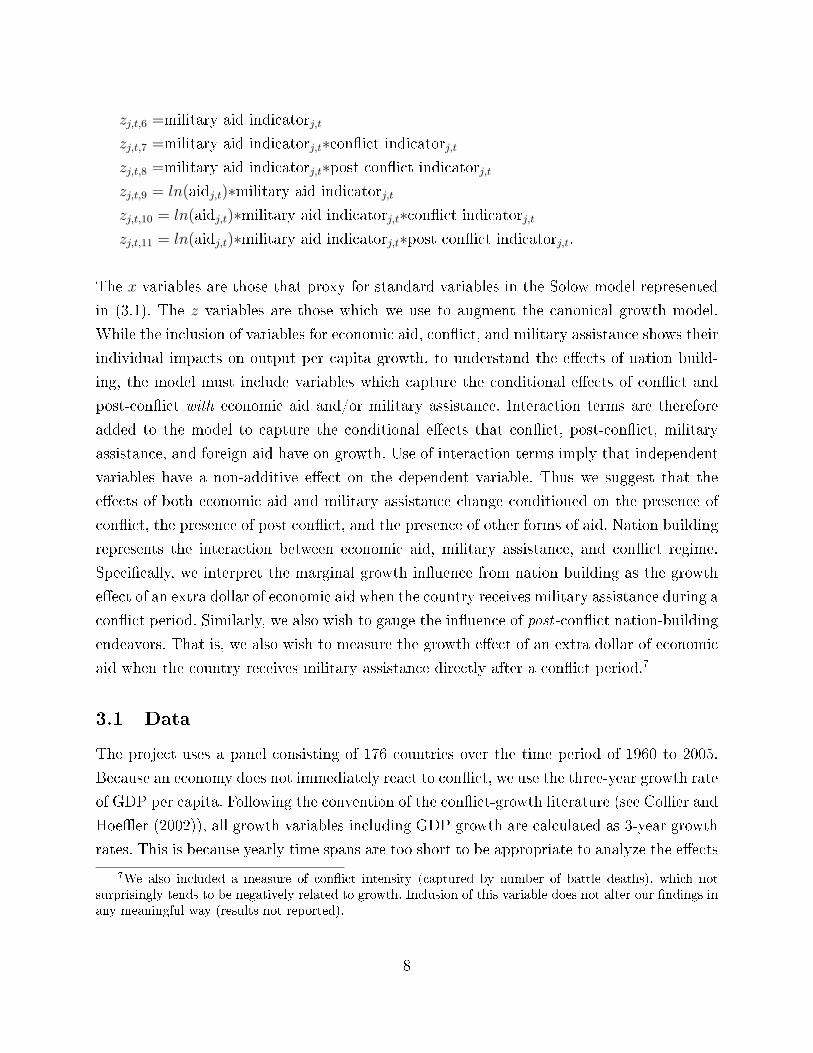
zj,t,6 =military aid indicatorj,t
zj,t,7 =military aid indicatorj,t∗con�ict indicatorj,tzj,t,8 =military aid indicatorj,t∗post con�ict indicatorj,tzj,t,9 = ln(aidj,t)∗military aid indicatorj,t
zj,t,10 = ln(aidj,t)∗military aid indicatorj,t∗con�ict indicatorj,tzj,t,11 = ln(aidj,t)∗military aid indicatorj,t∗post con�ict indicatorj,t.
The x variables are those that proxy for standard variables in the Solow model represented
in (3.1). The z variables are those which we use to augment the canonical growth model.
While the inclusion of variables for economic aid, con�ict, and military assistance shows their
individual impacts on output per capita growth, to understand the e�ects of nation build-
ing, the model must include variables which capture the conditional e�ects of con�ict and
post-con�ict with economic aid and/or military assistance. Interaction terms are therefore
added to the model to capture the conditional e�ects that con�ict, post-con�ict, military
assistance, and foreign aid have on growth. Use of interaction terms imply that independent
variables have a non-additive e�ect on the dependent variable. Thus we suggest that the
e�ects of both economic aid and military assistance change conditioned on the presence of
con�ict, the presence of post con�ict, and the presence of other forms of aid. Nation building
represents the interaction between economic aid, military assistance, and con�ict regime.
Speci�cally, we interpret the marginal growth in�uence from nation building as the growth
e�ect of an extra dollar of economic aid when the country receives military assistance during a
con�ict period. Similarly, we also wish to gauge the in�uence of post-con�ict nation-building
endeavors. That is, we also wish to measure the growth e�ect of an extra dollar of economic
aid when the country receives military assistance directly after a con�ict period.7
3.1 Data
The project uses a panel consisting of 176 countries over the time period of 1960 to 2005.
Because an economy does not immediately react to con�ict, we use the three-year growth rate
of GDP per capita. Following the convention of the con�ict-growth literature (see Collier and
Hoe�er (2002)), all growth variables including GDP growth are calculated as 3-year growth
rates. This is because yearly time spans are too short to be appropriate to analyze the e�ects
7We also included a measure of con�ict intensity (captured by number of battle deaths), which notsurprisingly tends to be negatively related to growth. Inclusion of this variable does not alter our �ndings inany meaningful way (results not reported).
8
of con�ict on growth, or to study growth convergence in general (Islam (1995)). Further, any
variable that has a level-value is calculated as a three-year average. Finally, dummy variables
take on a value of one if the event occurs within any time within the three-year period. The
regression is constructed as a 3-year rolling model.
The amount of total investment as a fraction of GDP represents the savings rate. Likewise,
the fraction of GDP allocated towards educational expenditure acts as a proxy for human
capital investments. GDP and investment data come from the Penn World Tables (2009).
Education expenditure shares of GDP and population growth rates come from the World
Bank Development Indicators (2009).
The joint Uppsala Con�ict Data Program and International Peace Research Institute
(UCDP-PRIO) Armed Con�ict Dataset (2009) provides all con�ict-related data including
the presence of con�ict, the number of battle deaths in a con�ict, and the duration of a
con�ict. In the model, the variable conflictj,t codes as a 1 if the con�ict occurs within
nation j and incurs at least 25 battle related deaths within year t. This de�nition of con�ict
originates from the UCDP-PRIO Armed Con�ict Dataset. The post con�ict variable postj,t
codes as a 1 if a con�ict took place in country j anywhere from one to seven years after time
t.8
Economic aid data come from the Organization for Economic Cooperation and Develop-
ment's Creditor Reporting System (OECD CRS, 2007). These data record all grants by the
Donor Assistance Countries. The twenty-two DAC nations are Australia, Austria, Belgium,
Canada, Denmark, Finland, France, Germany, Greece, Ireland, Italy, Japan, Luxembourg,
Netherlands, New Zealand, Norway, Portugal, Spain, Sweden, Switzerland, the United King-
dom, and the United States. We also use data on multilateral foreign aid from the World
Bank Projects Database (2008). This data set records every World Bank grant and its recipi-
ent country. Because some major powers, like China and Russia, do not publicly release their
foreign aid data, we can not include these countries. Therefore, the analysis has a somewhat
western bias.
The military assistance data come from the International Military Intervention Dataset
(2008). This data set records all instances of military interventions over international bound-
aries by regular armed forces of independent states. The military assistance variable, an in-
dicator variable, records any instance when one or more of the twenty-two OECD nations
acts as a third party intervener. This includes military interventions to assist a nation during
a domestic dispute, to protect a socio-ethnic minority or faction, to help combat terrorists
8This is a convention used by Collier and Hoe�er (2002).
9

or rebels, to protect economic interests during a con�ict, to provide humanitarian aid, to
further an ideological issue, or to promote diplomatic goals. Therefore this variable encom-
passes a broad spectrum of types of military aid. Essentially it captures any military action
performed by one country within another country's territorial borders for reasons other than
waging war. This de�nition indicates that the host nation does not necessarily have to re-
quest or accept the military assistance. An intervention that involves multiple OECD nations
codes as a single intervention. Additionally and separately, we also record instances when
the United Nations acts as a third party intervener.
A data set including every nation building operation from 1960 to 2005 does not exist.
Here we combine data from the sources mentioned above to construct measures of nation
building activities for a wide range of country participants.9 For our measures three criteria
determine the incidence of nation building. First, nation building can only occur during a con-
�ict or post-con�ict period as we have de�ned. Second, the country must receive economic aid
from a foreign public source. Finally, some external military assistance must simultaneously
be provided. The speci�city of this de�nition causes the omission of certain observations
that some may consider to be de facto nation building. For example, from 1952 to 1977
the United States provided most of Brazil's military training and weaponry as discussed in
Tollefson (1995). This military alliance coincided with the economic �Alliance for Progress,�
which increased U.S. aid to South American nations in order to strengthen ties between the
two continents. Yet these years of joint U.S. military assistance and economic aid to Brazil
do not involve nation building because Brazil was not in con�ict. Rather we consider this
an example of a politico-military alliance with the U.S. Such alliances were indeed common
throughout much of South America. While many nations have received economic aid with
military assistance, if at least 25 battle related deaths do not occur within a year, the episode
is not a nation building episode.
Similarly, a nation in con�ict that receives only economic aid does not join the group of
nation building observations. For example, during the Sudanese Civil War severe droughts
caused food shortages throughout the country. This prompted the United Nations and other
donor countries to conduct Operation Lifeline Sudan, which brought 100,000 tons of food
into Sudan (United Nations,1990). But since UN peacekeeping forces were not involved in
9Due to data restrictions, the nation building includes only observations in which the Organization forEconomic Cooperation and Development's (OECD) twenty-two Donor Assistance Countries (DAC), theUnited Nations, the Organization for African Unity (OAU), the North-Atlantic Treaty Organization, or theOrganization of American States(OAS) execute the construction. For a full list of nation building operationssee appendix C.
10
the operation, this scenario does not �t our de�nition of nation building.
Finally, there are many instances when a country sends troops to a con�ict-torn nation
to mediate a war or to protect their interests abroad. For example, the multinational force in
Lebanon, consisting of U.S. Marines and Navy SEALS, French paratroopers, Italian soldiers
and British soldiers, entered Lebanon in 1982 to oversee the withdrawal of the Palestine
Liberation Organization and facilitate the restoration of the Lebanese government. While
this operation resembles an attempt at nation building, the countries involved did not provide
economic aid to Lebanon, so this episode is also not considered a nation building initiative.
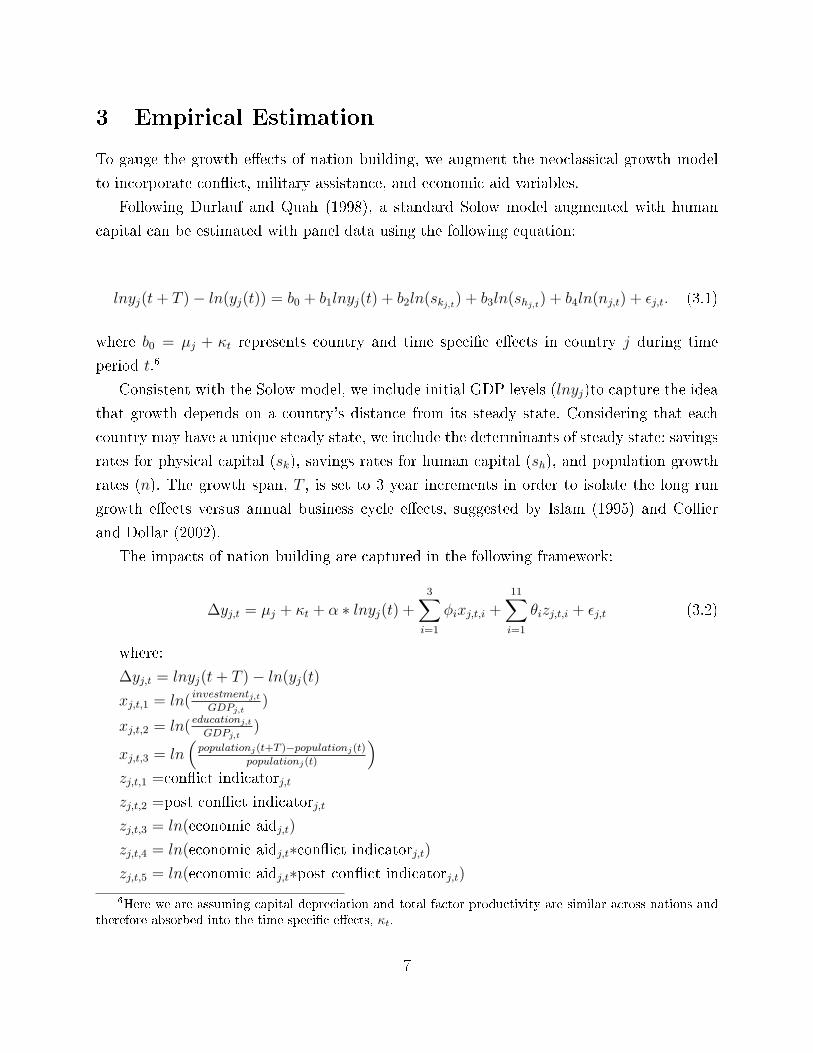
While this de�nition of nation building is fairly strict, our data document over 200 separate
episodes during con�ict periods. Figure 2 identi�es the locations of initiatives that satisfy
our de�nition of nation building.
3.2 Estimating aid �ows
Inherently, economic aid data has a potential selection bias that is likely to cause an endo-
geneity issue. That is, countries that experience major economic di�culties, and therefore
anemic growth, are more or less likely to receive economic aid in the �rst place. An instru-
mental variables approach can help solve this endogeneity problem, where bilateral aid �ows
are �rst estimated and then used as instruments in the main regression. Following Alesina
and Dollar (2000), we regress the total aid given by a donor country to a recipient country
in a particular year on both political a�nity and colonial ties. Political a�nity captures the
notion that countries are more likely to donate to countries that are like-minded 10. This po-
litical ally variable is proxied using UN voting-similarilty in a given year between the donor
and potential aid recipient (Voeten and Merdzanovic 2008)11. For the colonial linkages, an
indicator variable is used to capture current and passed colonies and the number of years of
this colonization history. We extract this colonial history from the CIA Factbook. Predicted
aid amounts are then aggregated and logged to produce a measure of predicted aid, which
is then used as an instrument in the growth regressions.
10Also see Barro and Lee (2005) for discussion of IMF loan provision.11Erik Voeten and Adis Merdzanovic, "United Nations General Assembly Voting Data",
http://hdl.handle.net/1902.1/12379 UNF:3:Hpf6qOkDdzzvXF9m66yLTg== V1 [Version]
11

Figure 2: Cases of Worldwide Nation Building
Cases of Nation Building
Multilateral Non‐US Unilateral US Unilateral UN‐mandated
12

4 Results
4.1 Baseline Model
Table 1 reports three di�erent estimations of the baseline model. The �rst column repre-
sents estimation of the neoclassical growth model using a pooled cross section. In the second
column we control for random e�ects. And in the �nal column we control for �xed e�ects.
Consistent with Mankiw et al. (1992), investment and education relative to GDP are strongly
associated with per capital growth, while initial GDP levels and population measures ap-
pear to have negligible e�ects. While our estimates do not change dramatically across the
three di�erent estimations, Hausman tests suggest the �xed e�ects model is preferred to the
random e�ects model. This makes sense as this parsimonious model leaves many country-
speci�c characteristics unobserved that may a�ect the growth rate of GDP per capita. We
thus include country-�xed and year e�ects in all subsequent growth regressions.
Table 1: Panel Estimation of the Textbook Solow Growth ModelDependent variable is lnyj(t+ T )− ln(yj(t))
Pooled Random E�ects Fixed E�ectsln(yj(t)) 0.02 -0.1 -0.59
(0.2) (0.22) (0.52)
ln( investmentGDP ) 3.02*** 3.64*** 4.75***
(0.31) (0.33) (0.47)
ln( educationGDP ) 1.15*** 1.41*** 1.68***
(0.30) (0.30) (0.34)
ln(population) -0.11 -0.03 0.05(0.12) (0.05) (0.06)
No. of Obs. 6566 6566 6566Groups 177 177 177R2 0.08 0.08 0.07
Notes: Standard errors in parenthesis. Signi�cant at 1% ∗ ∗∗, signi�cant at 5% ∗ ∗, and signi�cant at 10%∗.T = three-year span data. Year e�ects not reported.
4.2 Con�ict, Aid, and the E�ects of Nation Building
We augment the baseline models with measures of con�ict and post-con�ict periods, economic
aid, military assistance, and their interactions. The results are reported in Table 2 in columns
13
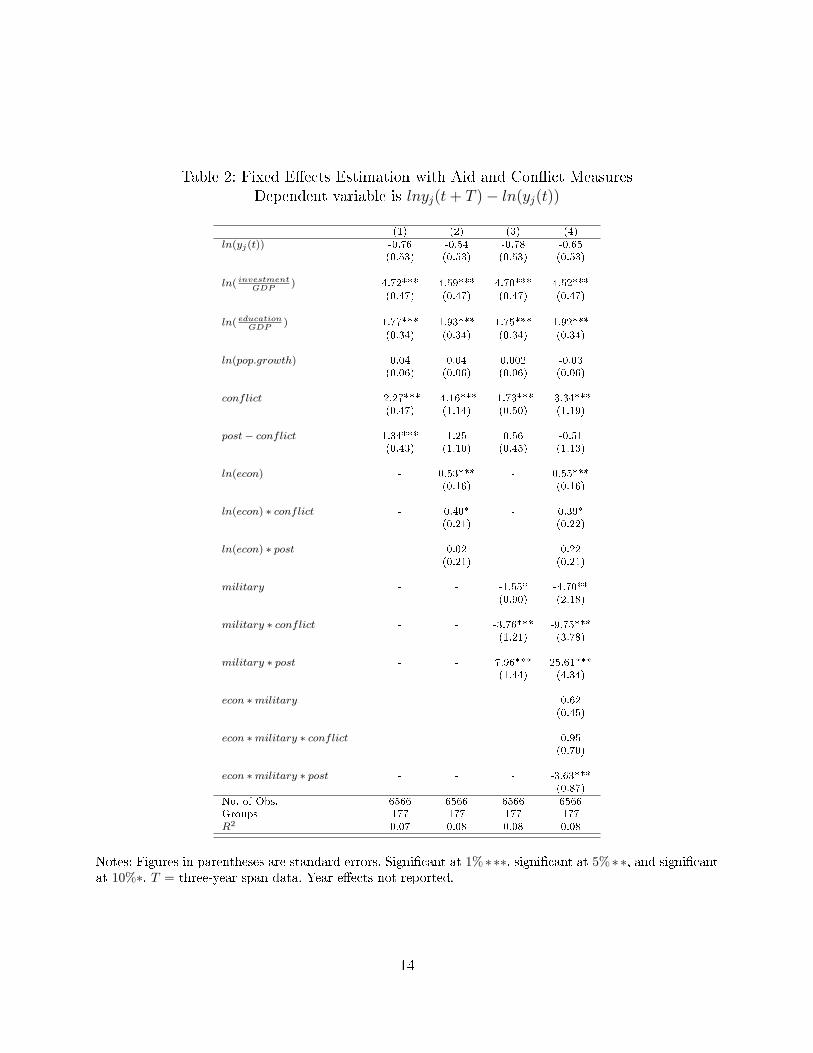
Table 2: Fixed E�ects Estimation with Aid and Con�ict MeasuresDependent variable is lnyj(t+ T )− ln(yj(t))
(1) (2) (3) (4)ln(yj(t)) -0.76 -0.54 -0.78 -0.65
(0.53) (0.53) (0.53) (0.53)
ln( investmentGDP
) 4.72*** 4.59*** 4.70*** 4.52***(0.47) (0.47) (0.47) (0.47)
ln( educationGDP
) 1.77*** 1.93*** 1.75*** 1.92***(0.34) (0.34) (0.34) (0.34)
ln(pop.growth) 0.04 0.04 0.002 -0.03(0.06) (0.06) (0.06) (0.06)
conflict -2.27*** -4.16*** -1.73*** -3.34***(0.47) (1.14) (0.50) (1.19)
post− conflict 1.34*** 1.25 0.56 -0.51(0.43) (1.10) (0.45) (1.13)
ln(econ) - 0.53*** - 0.55***(0.16) (0.16)
ln(econ) ∗ conflict - 0.40* - 0.39*(0.21) (0.22)
ln(econ) ∗ post - 0.02 - 0.22(0.21) (0.21)
military - - -1.55* -4.70**(0.90) (2.18)
military ∗ conflict - - -3.76*** -9.75***(1.21) (3.78)
military ∗ post - - 7.96*** 25.61***(1.44) (4.34)
econ ∗military - - - 0.62(0.45)
econ ∗military ∗ conflict - - - 0.95(0.70)
econ ∗military ∗ post - - - -3.63***(0.87)
No. of Obs. 6566 6566 6566 6566Groups 177 177 177 177R2 0.07 0.08 0.08 0.08
Notes: Figures in parentheses are standard errors. Signi�cant at 1%∗∗∗, signi�cant at 5%∗∗, and signi�cantat 10%∗. T = three-year span data. Year e�ects not reported.
14
2-4. First note that as expected, con�ict acts as a detriment to economic growth. Countries
which experience con�ict are associated with anywhere between 2% and 4% lower per capita
growth. Of course it is impossible to tell here whether con�icts disrupt economic activities, or
whether lower growth rates spur �ghting. Also, not accounting for economic or military aid,
post-con�ict periods are associated with robust growth. Again this makes sense, as stability
returns to a country, allowing it to rebuild its war-damaged economy.
Given that con�ict tends to impede growth, we are interested in the e�ects of giving
foreign aid to these nations embroiled in con�ict. Outside nations many choose to do nothing,
or provide just military support in the form of troops, training, or weaponry, or provide
just economic aid, or provide a combination of things. Including economic and military aid
variables yield some interesting results. First, not surprisingly, economic aid is ceteris paribus
associated with stronger growth. Military assistance on the other hand appears to be ceteris
paribus negatively associated with growth. The endogeneity of these variables however need
to be addressed, and we do so below. The interactions between military assistance and
con�ict regimes also yield some interesting insights. Periods when the country is in con�ict
and is receiving military assistance appear to be particulary low growth periods. On the
other hand, the presence of military assistance during those times just following the con�ict
are strongly associated with more rapid growth.
We are also interested in combinations of these interaction terms. Speci�cally, we wish to
gauge the marginal growth e�ects of nation building. That is, what is the marginal impact
of an extra dollar of economic aid (economic aid jt) when there is also military assistance
(military aid jt = 1) and the presence of con�ict (con�ict jt = 1)? Going back to the notation
from equation (3.2), this requires testing the simple linear restriction θ3 + θ4 + θ9 + θ10 = 0.
Using parallel logic, assessing the marginal impact of post-con�ict nation building, we test
the linear restriction θ3 + θ5 + θ9 + θ11 = 0.
Results of interaction tests are reported in Table 5. We can con�dently reject the null on
both counts. More speci�cally, using our estimated nation-building measure during con�ict,
a 1% increase in economic aid during times of con�ict and military assistance translates into
a roughly 2.5% increase in growth. On the other hand, using our estimated nation-building
measure during post-con�ict, a 1% increase in economic aid with military assistance after
con�ict translates into a roughly 2.2% decrease in growth. This suggests that nation building
endeavors do help with economic growth, but that once the con�ict is over persisting in nation
building activity harms growth.
The analysis above raises a number of questions. The primary issue of course is endo-
15
geneity. All the variables used to construct our nation building measures are potentially
endogenous with economic growth. Perhaps the thorniest relationship is that between eco-
nomic aid and growth, as many studies suggest that aid tends not to be doled out in low
growth environments, and these are perhaps more prone to con�icts. Are nation building
activities primarily conducted in high-growth countries or regimes, or conducted mainly in
those regions already most likely to succeed? If so, we are potentially giving too much credit
to economic and military aid in bolstering growth during times of con�ict. Similarly, do
these types of assistance measures tend to persist in more troubled countries or regimes once
the con�ict is over? If so, we are potentially not giving enough credit to nation building
endeavors in post-con�ict scenarios. Our use of country �xed-e�ects can help address some
but not all of these concerns.
4.2.1 Instrumenting Economic Aid
To address the endogeneity of economic aid, we perform a two step procedure. Since aid may
be provided in part for geopolitical considerations (as opposed to strictly economic consider-
ations) one might use such geopolitical factors as instruments for aid �ows. Instrumenting aid
�ows using cultural or political variables was �rst developed by Alesina and Dollar (2000),
who use colonial histories and political alliances to determine foreign aid.
In a similar spirit, we estimate bilateral aid �ows using two types of geopolitical vari-
ables. The �rst measures the extent to which two countries are politically alligned. The data
captures roll-call votes in the United Nations General Assembly from 1946-2008 Voeten and
Merdzanovic 2008)12. From this Gartzke 2010 13 creates an �a�nity� index which provides a
metric re�ecting the similarity on voting positions of pairs of countries. We use this index as
an explanatory variable in estimating aid �ows. This is intended to capture the idea that aid
donors may generally prefer to contribute resources to like-minded regimes, or that aid may
be used to punish or reward regimes for voting in particular ways Carter and Stone (2010).
The second type of variable measures the colonial relationships between country pairs,
capturing the number of years the aid giver has or had been a colonizer of the aid receiver.
Alesina and Dollar (2000) and others suggest that past colonial relations can be a strong
motivator for current aid giving. We construct this colonial history using data from the CIA
World Factbook.
12Erik Voeten and Adis Merdzanovic, "United Nations General Assembly Voting Data",http://hdl.handle.net/1902.1/12379 UNF:3:Hpf6qOkDdzzvXF9m66yLTg== V1 [Version]
13Erik Gartzke, "The A�nity of Nations: Similarity of State Voting Positions in the UNGA"
16
Note that this approach will produce many observations with a zero observed for the
dependent variable (most country-pair year observations will not have any aid �ows). Con-
sequently we estimate a Tobit model to address the censored nature of aid measures.
4.2.2 An IV approach to Nation Building
Given the discussion above, our �rst step is to estimate the following:
ln(aidhjt)∗ = βh +
5∑i=1
βixi,hjt + εhjt (4.1)
ln(aidhjt) =
ln(aidhjt)∗ if aid∗hjt > 1,
0 if aid∗hjt ≤ 1(4.2)
where:
aidhjt = aid amount from OECD member h to recipient country j.
x1,hjt = political a�nity measure between countries h and j.
x2,hjt = former colonizer indicator between aid giver h and receiver j.
x3,hjt = current colonizer indicator between aid giver h and receiver j.
x4,hjt = number of years former colonizer h had colonized j (since 1900).
x5,hjt = number of years current colonizer h has colonized j (since 1900).
Note that we include βh to show our control for OECD-donor �xed e�ects.
Results from this estimation are presented in Table 3. Echoing the �ndings of Alesina and
Dollar (2000), the similarity of voting behavior between two nations is a positive prediction
of aid giving and/or receiving. Colonial legacy also can help predict aid patterns, although
this relationship appears to slightly deteriorate over time.
Using the results from regression (4) in Table 3, we sum the estimated aid �ows across
potential OECD donors for each recipient nation. We can then replace our original aid
measures with the sum of our estimated measures.
A comparison of results when we instrument for aid �ows and when we do not is presented
in Table 4. First note that the coe�cient on our instrumented aid variable dramatically falls
to insigni�cance, validating the concerns of some researchers that aid may �ow to already
relatively successful regions. However, note that during periods of con�ict, our instrumented
measure of aid is positively associated with growth. This gives us a fortiori evidence that
17
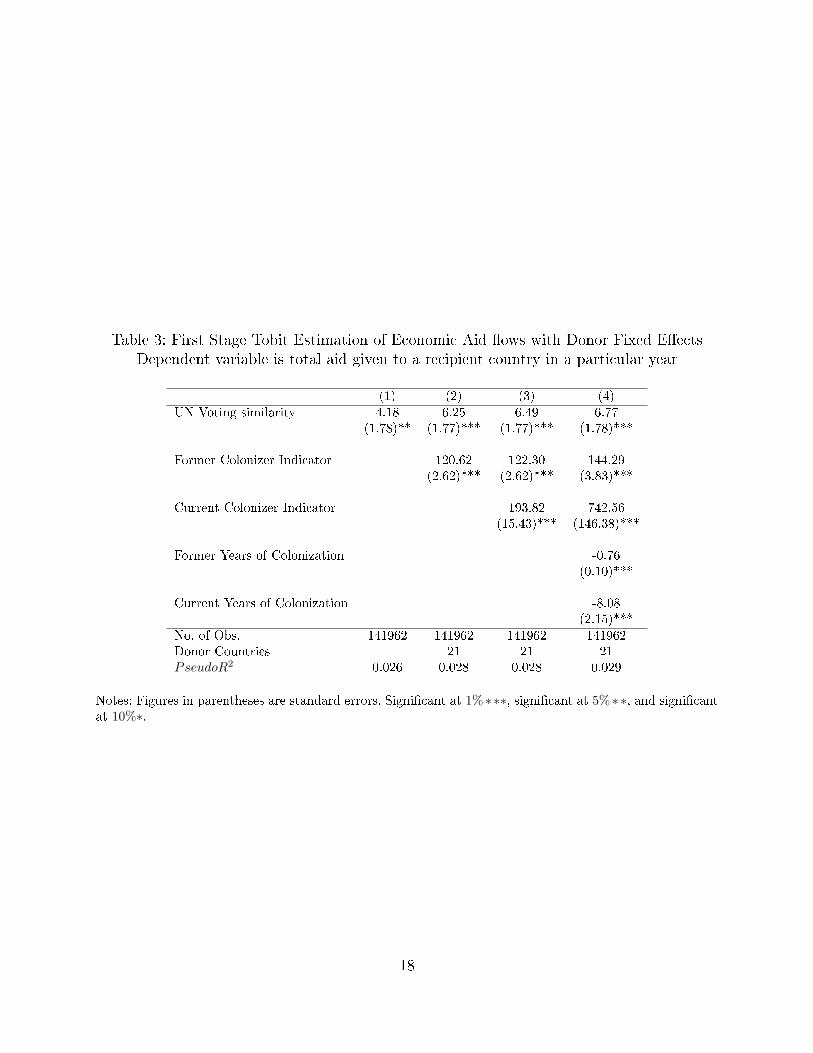
Table 3: First Stage Tobit Estimation of Economic Aid �ows with Donor Fixed E�ectsDependent variable is total aid given to a recipient country in a particular year
(1) (2) (3) (4)UN Voting similarity 4.18 6.25 6.49 6.77
(1.78)** (1.77)*** (1.77)*** (1.78)***
Former Colonizer Indicator 120.62 122.30 144.29(2.62)*** (2.62)*** (3.83)***
Current Colonizer Indicator 193.82 742.56(15.43)*** (146.38)***
Former Years of Colonization -0.76(0.10)***
Current Years of Colonization -8.08(2.15)***
No. of Obs. 141962 141962 141962 141962Donor Countries 21 21 21PseudoR2 0.026 0.028 0.028 0.029
Notes: Figures in parentheses are standard errors. Signi�cant at 1%∗∗∗, signi�cant at 5%∗∗, and signi�cantat 10%∗.
18
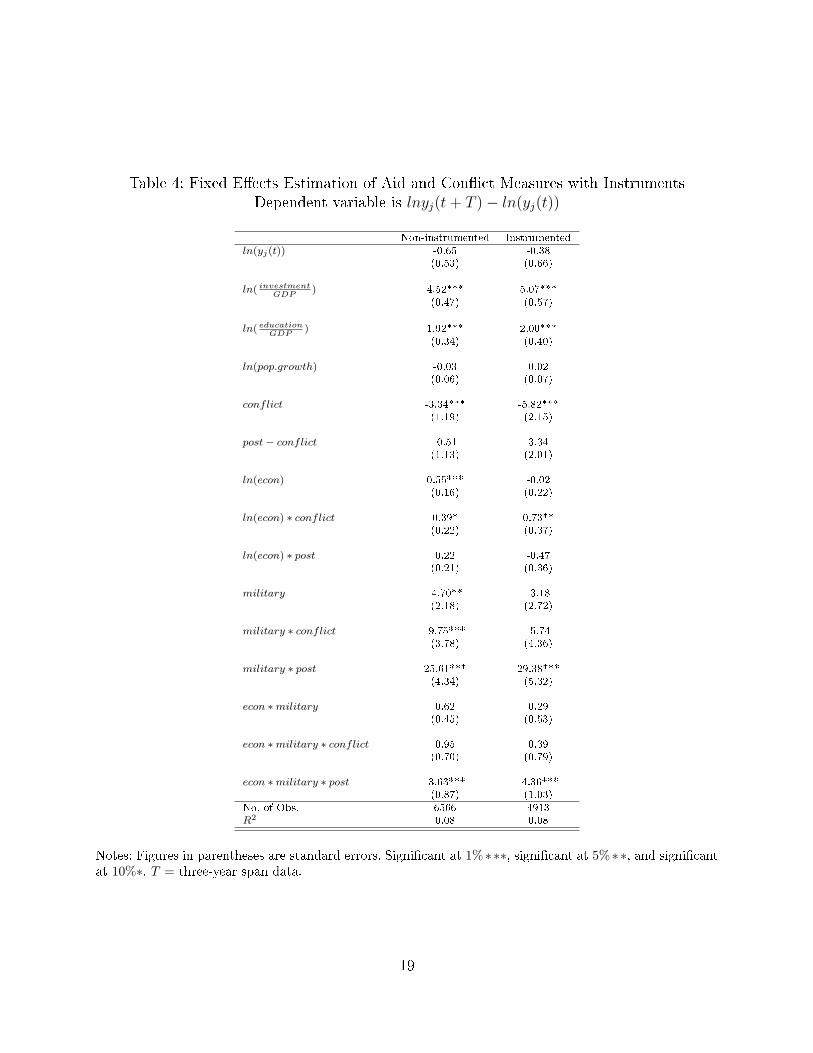
Table 4: Fixed E�ects Estimation of Aid and Con�ict Measures with InstrumentsDependent variable is lnyj(t+ T )− ln(yj(t))
Non-instrumented Instrumentedln(yj(t)) -0.65 -0.38
(0.53) (0.66)
ln( investmentGDP
) 4.52*** 5.07***(0.47) (0.57)
ln( educationGDP
) 1.92*** 2.00***(0.34) (0.40)
ln(pop.growth) -0.03 0.02(0.06) (0.07)
conflict -3.34*** -5.82***(1.19) (2.15)
post− conflict -0.51 3.34(1.13) (2.01)
ln(econ) 0.55*** -0.02(0.16) (0.22)
ln(econ) ∗ conflict 0.39* 0.73**(0.22) (0.37)
ln(econ) ∗ post 0.22 -0.47(0.21) (0.36)
military -4.70** -3.18(2.18) (2.72)
military ∗ conflict -9.75*** -5.74(3.78) (4.36)
military ∗ post 25.61*** 29.38***(4.34) (5.32)
econ ∗military 0.62 0.29(0.45) (0.53)
econ ∗military ∗ conflict 0.95 0.39(0.70) (0.79)
econ ∗military ∗ post -3.63*** -4.36***(0.87) (1.03)
No. of Obs. 6566 4913R2 0.08 0.08
Notes: Figures in parentheses are standard errors. Signi�cant at 1%∗∗∗, signi�cant at 5%∗∗, and signi�cantat 10%∗. T = three-year span data.
19
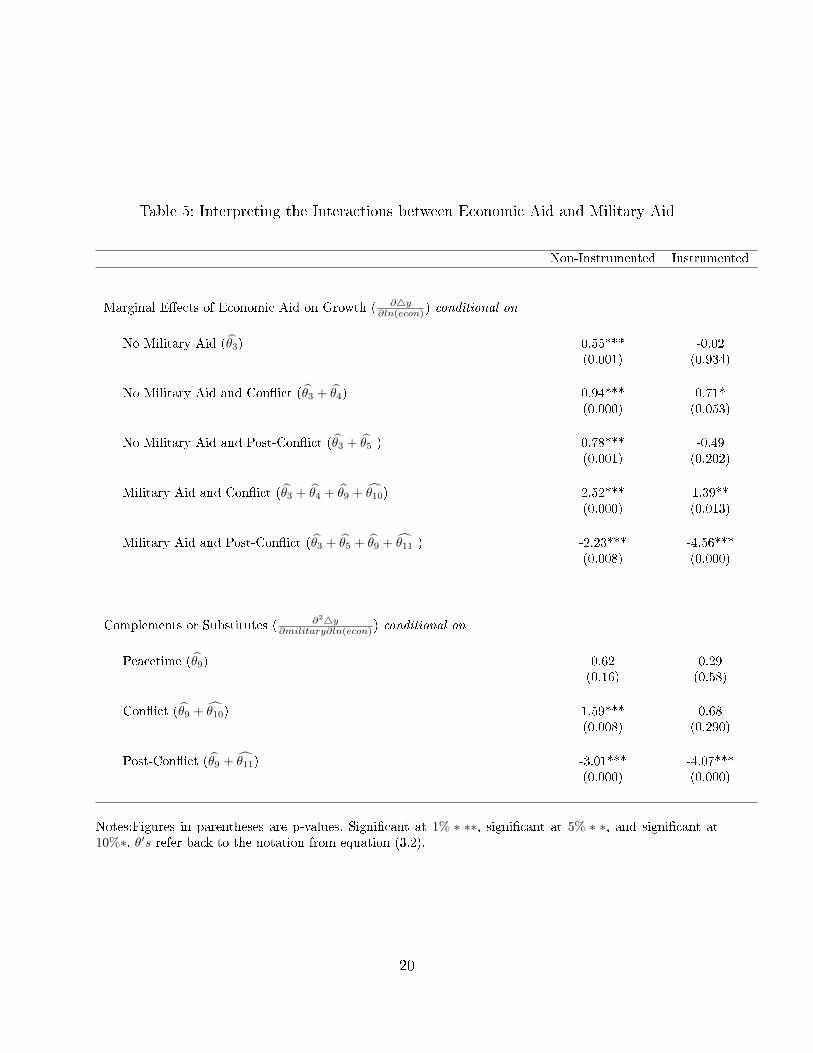
Table 5: Interpreting the Interactions between Economic Aid and Military Aid
Non-Instrumented Instrumented
Marginal E�ects of Economic Aid on Growth ( ∂4y∂ln(econ) ) conditional on
No Military Aid (θ̂3) 0.55*** -0.02(0.001) (0.934)
No Military Aid and Con�ict (θ̂3 + θ̂4) 0.94*** 0.71*(0.000) (0.053)
No Military Aid and Post-Con�ict (θ̂3 + θ̂5 ) 0.78*** -0.49(0.001) (0.202)
Military Aid and Con�ict (θ̂3 + θ̂4 + θ̂9 + θ̂10) 2.52*** 1.39**(0.000) (0.013)
Military Aid and Post-Con�ict (θ̂3 + θ̂5 + θ̂9 + θ̂11 ) -2.23*** -4.56***(0.008) (0.000)
Complements or Substitutes ( ∂24y∂military∂ln(econ) ) conditional on
Peacetime (θ̂9) 0.62 0.29(0.16) (0.58)
Con�ict (θ̂9 + θ̂10) 1.59*** 0.68(0.008) (0.290)
Post-Con�ict (θ̂9 + θ̂11) -3.01*** -4.07***(0.000) (0.000)
Notes:Figures in parentheses are p-values. Signi�cant at 1% ∗ ∗∗, signi�cant at 5% ∗ ∗, and signi�cant at10%∗. θ′s refer back to the notation from equation (3.2).
20
economic assistance has indeed helped war torn regions grow faster than they otherwise
would.
Again, we are interested in the potential growth e�ects of nation building both during
periods of con�ict (testing if θ3 + θ4 + θ9 + θ10 = 0 from (3.2)) and during periods after
con�ict (testing if θ3 + θ5 + θ9 + θ11 = 0 also from (3.2)). Results from these exercises are
provided in Table 5. Qualitatively, they echo the results from the non-instrumented version.
Speci�cally, using our instrumented measure of aid, a 1% increase in aid during times of
con�ict and military assistance is associated with a 1.39% increase in growth. This is a
weaker but arguably a more accurate measure of the positive e�ects of nation-building aid
compared to our non-instrumented results. On the other hand, a 1% increase in aid with
military assistance after con�ict translates into roughly a 4.6% decrease in per capita income
growth. This negative result is in fact much stronger than in the non-instrumented case. Our
conclusions thus remain consistent. Joint assistance during times of con�ict helps economies
grow; the same kind of assistance when the con�ict is over hinders recovery.
Given that we do not instrument for con�ict regimes and military assistance, can we
hang our hats on these results? We argue yes. First, as noted above, con�ict itself is strongly
negatively related to growth; if anything this potentially biases our estimated e�ect of nation
building during con�ict periods downward. As for military assistance, it is possible that such
help only comes to countries already with strong growth potential. However, our results
in Table 2 suggest that this is unlikely - military assistance during con�ict periods also
is strongly negatively related to growth. Thus we would argue that our estimated positive
growth e�ects of nation building funds during con�ict periods are fairly conservative.
We can use similar logic to argue over the negative in�uence of nation building funds in
post-con�ict regimes. Both post-con�ict periods and military assistance during these periods
are associated with faster growth. Going back to Table 4, we observe strong positive growth
e�ects. The fact that economic aid (instrumented or not) coupled with these factors seems to
produce lower growth would suggest that nation-building funds themselves thwart growth.
An interesting question is whether economic and military aid tend to complement each
other, or if they tend to crowd each other out. In the context of this study, this is tantamount
to inquiring over the sign of ∂24y∂ln(econ)∂military
. During times of peace (conflictjt = 0 and
post − conflictjt = 0), there seems to be no relationship between combined economic and
military aid and per capita growth (θ̂9 is insigni�cant). However, the con�ict environment
does seem to matter here. F-tests of θ̂9 + θ̂10 suggest that the simultaneous allocation of
economic and military assistance during con�ict has positive e�ects on growth (although this
21
result is insigni�cant in the instrumented case). This may indicate some complementarities
in assistance - economic aid works better in con�ict environments when it is buttressed with
military assistance that can provide security. On the other hand, tests of θ̂9 + θ̂11 imply that
such joint assistance after con�icts harms economic growth. This may indicate a type of
crowding out - economic support may thwart the natural forces of post-con�ict growth.
There are important normative implications in this. Naturally there are many reasons
why one nation may wish to provide assistance of some form to another nation. In matters of
per capita growth, however, the argument seems to be that a con�ict-riddled nation is best
served by a combination of military and economic support. After the con�ict, a persisting
military presence helps growth further; economic aid however should pull out and allow
private growth forces to reemerge on their own.
4.3 Unilateral v. Multilateral Nation Building
Finally, we wish to explore a bit further the e�ects of di�erent types of military interventions.
As we suggested earlier, di�erent groups conduct nation building for di�erent reasons, and
these di�erences may translate into di�erent e�ects on economic development. Are there
di�erent growth e�ects from military aid provided by a single player compared with joint
assistance from a multitude of countries?
Dobbins et al. (2008) argue that multilateral organizations, especially the United Nations,
may have a di�erent approach to nation building than single country actors, and consequently
may have di�erent growth e�ects. On the one hand, interventions by individual countries
may be quite weak, particularly since domestic pressures may preclude anything but a tiny
military force to be sent abroad. As such the growth e�ects of nation building considering
these interventions may appear quite modest. On the other hand, risk averse countries may
wish to execute multilateral military excursions in particularly di�cult environments, where
the probability of success is already low. In this case multilateral nation building operations
would likely have worse growth e�ects than unilateral operations.
So far we have considered military aid provided by either a single country or a multi-
tude of countries as the same. Now we separately consider military interventions by only
one of the twenty-two DAC nations (`unilateral') and joint interventions by two or more
nations ('multilateral'). We will also consider UN mandated peacekeeping operations, which
are altogether separate cases and may de�nitionally be considered an alternative measure of
multilateral intervention. Treating di�erent kinds of military interventions separately also al-
lows us to further explore endogeneity issues, as each type of military force may be motivated
22

by di�erent considerations.
Table 6 displays the results of estimating (3.2) when we treat the military aid indicator
separately for unilateral interventions, multilateral interventions and U.N. peacekeeping in-
terventions. Table 7 shows results from the same exercise when we also use the instrumented
economic aid measures described in section 4.2.2. Results generally echo those produced in
the baseline case. Speci�cally, military interventions during times of con�ict tend to have a
negative association with growth (θ̂7), while military interventions during post-con�ict peri-
ods tend to have a positive association with growth (θ̂8). And the interaction term between
economic aid, military intervention, and post con�ict scenarios (θ̂11) is negatively associated
with growth, no matter how military intervention is measured.
Finally, we can consider the conditional marginal e�ects of economic and military aid
using these di�erent measures of military interventions the same way we do in Table 5.
Results of these exercises using the estimates displayed in Table 7 are shown in Table 8.
Again considering our measures of the e�ects of nation building, we see that economic aid in
the presence of military aid and con�ict (θ̂3 + θ̂4 + θ̂9 + θ̂10) suggests higher economic growth
(although the results are fairly weak). On the other hand, economic aid in the presence
of military aid after con�ict (θ̂3 + θ̂5 + θ̂9 + θ̂11) unambiguously suggests lower growth. In
fact multilateral post-con�ict nation building appears worse for growth, and economic aid
during U.N. intervention seems particularly bad for growth in post-con�ict scenarios. Yet the
marginal growth e�ect of military involvement when economic aid is present in post-con�ict
environments (θ̂6 + θ̂8 + θ̂9 + θ̂11) is positive, and these results are stronger for multilateral
interventions.
What to make of these estimates? We submit that these results echo our earlier sug-
gestions. Nation building operations during con�ict can bolster economic growth. Following
con�ict however, such robust foreign intervention can be damaging to recovery. A strong
multilateral peacekeeping force should maintain security to allow growth to recover. At the
same time economic aid should be curtailed to allow domestic investment to reemerge. This
is particularly true in the presence of a multilateral peacekeeping force, as such military aid
may substitute for economic aid.
5 Conclusions
Nation building operations occur for many varied reasons, including attempting to pro-
mote security and stability of strategic regions, thwarting the spread of terrorism or nu-
23

Table 6: Multilateral vs. Unilateral E�ects of Aid and Con�ictDependent variable is lnyj(t+ T )− ln(yj(t))
Unilateral Multilateral United Nations
ln(yj(t)) -0.60 -0.71 -0.70(0.53) (0.53) (0.54)
ln( investmentGDP
) 4.50*** 4.51*** 4.53***(0.47) (0.47) (0.47)
ln( educationGDP
) 1.94*** 1.96*** 2.03***(0.34) (0.34) (0.34)
ln(pop.growth) 0.010 -0.005 0.042(0.06) (0.06) (0.06)
conflict -3.56*** -4.18*** -2.97***(1.17) (1.16) (1.16)
post− conflict 0.34 0.42 -0.08(1.18) (1.10) (1.12)
ln(econ) 0.55*** 0.55*** 0.58***(0.16) (0.16) (0.16)
ln(econ) ∗ conflict 0.38* 0.49** 0.28(0.21) (0.22) (0.22)
ln(econ) ∗ post 0.10 0.14 0.14(0.21) (0.21) (0.22)
military -4.30* -7.90 4.95(2.27) (7.33) (3.40)
military ∗ conflict -7.45* -5.81 -20.44***(4.27) (8.03) (4.66)
military ∗ post 17.91*** 35.23*** 31.65***(4.83) (8.40) (5.04)
econ ∗military 0.58 1.73 -1.32**(0.47) (1.41) (0.61)
econ ∗military ∗ conflict 0.69 -0.78 3.09***(0.79) (1.53) (0.82)
econ ∗military ∗ post -2.28*** -5.01*** -4.41***(0.95) (1.73) (0.87)
No. of Obs. 6559 6559 6559R2 0.07 0.07 0.08
Notes: Figures in parentheses are standard errors. Signi�cant at 1%∗∗∗, signi�cant at 5%∗∗, and signi�cantat 10%∗. T = three-year span data.
24

Table 7: Multilateral vs. Unilateral E�ects of Aid and Con�ict(Instrumenting for Economic Aid)
Dependent variable is lnyj(t+ T )− ln(yj(t))
Unilateral Multilateral United Nations
ln(yj(t)) -0.33 -0.48 -0.38(0.66) (0.66) (0.66)
ln( investmentGDP
) 5.12*** 5.04*** 5.17***(0.57) (0.57) (0.56)
ln( educationGDP
) 2.02*** 2.07*** 2.13***(0.40) (0.40) (0.40)
ln(pop.growth) 0.05 0.04 0.09(0.07) (0.07) (0.07)
conflict -5.68*** -7.28*** -5.01***(2.02) (1.96) (1.95)
post− conflict 5.72*** 5.53*** 5.26***(1.95) (1.92) (1.97)
ln(econ) -0.017 -0.011 0.10(0.22) (0.22) (0.22)
ln(econ) ∗ conflict 0.65* 0.95*** 0.57*(0.35) (0.34) (0.34)
ln(econ) ∗ post -0.86** -0.76** -0.82**(0.35) (0.034) (0.36)
military -2.28 -6.42 8.92**(2.87) (7.57) (4.48)
military ∗ conflict -5.29 -1.71 -16.60***(4.74) (8.67) (5.80)
military ∗ post 20.87*** 38.85*** 27.74***(6.32) (9.17) (5.96)
econ ∗military 0.12 1.56 -2.08***(0.56) (1.44) (0.79)
econ ∗military ∗ conflict 0.50 -1.48 2.45**(0.87) (1.61) (1.0)
econ ∗military ∗ post -2.81** -5.90*** -3.59***(1.21) (1.83) (1.01)
No. of Obs. 4908 4908 4908R2 0.07 0.08 0.08
Notes: Figures in parentheses are standard errors. Signi�cant at 1%∗∗∗, signi�cant at 5%∗∗, and signi�cantat 10%∗. T = three-year span data.
25

Table 8: Marginal E�ects From Unilateral vs. Multilateral Military Operation
Unilateral Multilateral United Nations
Marginal E�ects of Economic Aid on Growth ( ∂4y∂ln(econ) ) conditional on
No Military Aid (θ̂3) -0.02 -0.01 0.096(0.941) (0.960) (0.670)
No Military Aid and Con�ict (θ̂3 + θ̂4) 0.63* 0.94*** 0.66*(0.071) (0.006) (0.051)
No Military Aid and Post-Con�ict (θ̂3 + θ̂5 ) -0.87** -0.78** -0.72*(0.020) (0.037) (0.061)
Military Aid and Con�ict (θ̂3 + θ̂4 + θ̂9 + θ̂10) 1.25* 1.02 1.03(0.060) (0.317) (0.202)
Military Aid and Post-Con�ict (θ̂3 + θ̂5 + θ̂9 + θ̂11 ) -3.56*** -5.12*** -6.40***(0.003) (0.005) (0.000)
Complements or Substitutes ( ∂24y∂military∂ln(econ) ) conditional on
Peacetime (θ̂9) 0.12 1.56 -2.08***(0.826) (0.280) (0.009)
Con�ict (θ̂9 + θ̂10) 0.62 0.079 0.37(0.379) (0.941) (0.663)
Post-Con�ict (θ̂9 + θ̂11) -2.69** -4.34** -5.67***(0.026) (0.019) (0.000)
Notes:Figures in parentheses are p-values. θ′s refer back to the notation from equation (3.2). Estimates fromTable 6 are used.
26
clear weapons or abhorrent ideologies, protecting natural resource stockpiles, and promoting
democracy. This paper suggests that policy makers should consider the in�uence on economic
growth and development as an important by-product of these endeavors.
Overall this analysis has shown that during con�ict nation building can help to increase
the economic growth rate of a host nation. The e�ects are not terribly strong, and not
statistically signi�cant in all speci�cations. Still, they suggest that a robust intervention of
economic and military support may help an economy in the grips of war. Once the con�ict
concludes, the analysis suggests that growth prospects are strongest with continued military
support and receding economic aid. Excessive aid can in fact hinder the natural rebuilding
phase of a post-con�ict nation. Studies which �nd no evidence that aid helps countries
grow suggest that policy makers need to rethink the entire apparatus of aid (Rajan and
Subramanian (2008)). We suggest that an approach that simultaneously considers con�ict
and military aid is a fruitful part of such a rethink.
27

6 References
Alesina, Alberto, and David Dollar. 2000. �Who Gives Aid To Whom And Why?� Journal
of Economic Growth 5(1), pp. 33�63.
Barro, Robert, and Jong-Wha Lee. 2005. �IMF Programs: Who is Chosen and What Are
the E�ects?� Journal of Monetary Economics 52(7), pp. 1245�1269.
Burnside, Craig A., and David Dollar. 1997. �Aid, Policies, and Growth.� Working Paper
569252, World Bank Policy Research Working Paper.
Caplan, B. 2002. �How does war shock the economy?� Journal of International Money and
Finance 21(2).
Carter, David B., and Randall W. Stone. 2010. �Sincere or Strategic? U.S. Aid Disbursements
and Voting in the United Nations General Assembly.� wp.
Collier, P., and D. Dollar. 2002. �Aid Allocation and Poverty Reduction.� European Economic
Review 46(8).
Collier, Paul, and Anke Hoe�er. 2002. �Aid, Policy, and Growth in Post Con�ict Societies.�
Working Paper 2927, The World Bank.
Dobbins, James, Seth G. Jones, Keith Crane, Christopher S. Chivvis, Andrew Radin,
F. Stephen Larrabee, Nora Bensahel, Brooke K. Stearns, and Benjamin W. Goldsmith.
2008. Europe's Role in Nation Building: From the Balkans to the Congo. Santa Monica:
RAND.
Durlauf, Steven, and Danny T. Quah. 1998. �The New Empirics of Economic Growth.�
Working paper, National Bureau of Economic Research.
Easterly, William, Lant Pritchett Michael Kremer, and Lawrence Summers. 1993. �Good
Policy or Good Luck? Country Growth Performance and Temporary Shocks.� Journal of
Monetary Economics 32.
Imai, Kosuke, and Jeremy Weinstein. 2000. �Measuring the Economic Impact of Civil War.�
Working paper, Center for International Development.
Islam, Nazrul. 1995. �Growth Empirics: A Panel Data Approach.� The Quarterly Journal
of Economics 110(4).
28
Jones, Garett, and Tim Kane. 2007. �US Troops and Economic Growth.� Working paper,
Social Science Research Network.
Kang, Seonjou, and James Meernik. 2004. �Determinants of Post-Con�ict Economic Assis-
tance.� Journal of Peace Research 41(2).
Mankiw, N. Gregory, David Romer, and David N. Weil. 1992. �A Contribution to the
Empirics of Economic Growth.� The Quarterly Journal of Economics 107(2).
Mekasha, Tseday Jemaneh, and Finn Tarp. 2011. �Aid and Growth What Meta-Analysis
Reveals.� Working paper, World Institute for Development Economic Research.
Orszag, Peter. 2007. �Estimated Costs of US Operations in Iraq and Afghanistan and of
Other Activities Related to the War on Terrorism.� Statement before the committee on
the budget, United States House of Representatives.
Rajan, Raghuram G., and Arvind Subramanian. 2008. �Aid and Growth: What Does the
Cross-Country Evidence Really Show?� The Review of Economics and Statistics 90(4).
Solow, Robert M. 1956. �A Contribution to Theory of Economic Growth.� The Quarterly
Journal of Economics 70.
Tollefson, Scott D. 1995. �Civil-Military Relations in Brazil: The Myth of Tutelary Democ-
racy.� Speech, 1995 Latin American Studies Association.
Yamarik, Steven J., Noel D. Johnson, and Ryan A. Compton. 2010. �War! What Is It Good
For? A Deep Determinants Analysis of the Cost of Interstate Con�ict.� Peace Economics,
Peace Science and Public Policy 16(1).
A Data Sources
This project included a huge data collection e�ort. While most of the variables have been
modi�ed from their original form, all of the data comes from publicly available sources
1. Penn World Tables: provides data on GDP per capita and investment share of GDP
for 188 countries from 1950 to 2005
2. World Bank World Development Indicators: provides data on population growth and
education expenditure for 210 regions from 1960 to present
29

3. Organization for Economic Co-operation and Development Creditor Reporting System:
provides aid data for all 22 Donor Assistance countries which include Australia, Austria,
Belgium, Canada, Denmark, Finland, France, Germany, Greece, Ireland, Italy, Japan, Lux-
embourg, Netherlands, New Zealand, Norway, Portugal, Spain, Sweden, Switzerland, United
Kingdom, United States
4. Uppsala Con�ict Data Program-Institute for Peace Research (UCDP-PRIO) Armed
Con�icts Data set: includes presence of con�ict within a country's territorial borders and
number of battle deaths in a year during a certain con�ict. The data set de�nes a con�ict
as an armed dispute between at least two parties that results in at least 25 battle related
deaths in a year. One of the parties must be a government.
5. World Bank Project's Database: provides all grants by the World Bank, their recipient
and their target sector from 1948 to present. The dataset includes 10 sectors which were
aggregated into 7 sectors.
6. United Nations Peacekeeping Operations Database: records every location and year of
a United Nations peacekeeping operation since 1948
7. International Military Intervention Dataset: records every instance when one nation
intervenes over the international borders of another nation from 1946 to 2005. Categorizes
the interventions by level of military involvement and purpose for military operation.
8. US Overseas Loans and Grants: provides data on US foreign military assistance and
economic assistance from 1946 to 2005
B Nations in Sample
Country Years
Afghanistan 1960-2005
Albania 1960-2005
Algeria 1962-2005
Andorra 1993-2005
Angola 1982-2005
Antigua and Barbuda 1981-2005
Argentina 1960-2005
Armenia 1991-2005
Australia 1960-2005
Azerbaijan 1991-2005
Continued on Next Page. . .
30

Table 9 � Continued
Country Years
Bahamas 1973-2005
Bahrain 1971-2005
Bangladesh 1971-2005
Barbados 1966-2005
Belarus 1991-2005
Belgium 1960-2005
Belize 1981-2005
Benin 1960-2005
Bhutan 1971-2005
Bolivia 1960-2005
Botswana 1966-2005
Brazil 1960-2005
Brunei 1984-2005
Bulgaria 1972-2005
Burkina Faso 1960-2005
Burundi 1962-2005
Cambodia 1960-2005
Cameroon 1960-2005
Canada 1960-2005
Cape Verde 1975-2005
Central African Republic 1960-2005
Chad 1960-2005
Chile 1960-2005
China 1960-2005
Colombia 1960-2005
Comoros 1975-2005
Republic of the Congo 1960-2005
Costa Rica 1960-2005
Cote d'Ivoire 1960-2005
Croatia 1992-2005
Cuba 1960-2005
Cyprus 1960-2005
Czechoslovakia 1960-1993
Czech Republic 1993-2005
Democratic Republic of Congo 1963-2005
Denmark 1960-2005
Djibouti 1977-2005
Continued on Next Page. . .
31

Table 9 � Continued
Country Years
Dominica 1978-2005
Dominican Republic 1960-2005
Ecuador 1987-2005
Egypt 1960-2005
El Salvador 1960-2005
Equatorial Guinea 1968-2005
Eritrea 1993-2005
Estonia 1991-2005
Ethiopia 1968-2005
Federated States of Micronesia 1991-2005
Fiji 1970-2005
Finland 1960-2005
France 1960-2005
Gabon 1960-2005
Gambia 1965-2005
Georgia 1991-2005
Germany 1960-2005
Ghana 1960-2005
Greece 1960-2005
Grenada 1974-2005
Guatemala 1960-2005
Guinea-Bissau 1980-2005
Guinea 1960-2005
Guyana 1966-2005
Haiti 1960-2005
Honduras 1960-2005
Hungary 1960-2005
Iceland 1960-2005
India 1960-2005
Indonesia 1960-2005
Iran 1960-2005
Iraq 1960-2005
Ireland 1960-2005
Israel 1960-2005
Italy 1960-2005
Jamaica 1962-2005
Japan 1960-2005
Continued on Next Page. . .
32

Table 9 � Continued
Country Years
Jordan 1960-2005
Kazakhstan 1991-2005
Kenya 1963-2005
Kiribati 1999-2005
Kuwait 1961-2005
Kyrgyzstan 1991-2005
Laos 1981-2005
Latvia 1991-2005
Lebanon 1986-2005
Lesotho 1963-2005
Liberia 1960-2005
Libya 1960-2005
Lithuania 1991-2005
Luxembourg 1960-2005
Macedonia 1993-2005
Madagascar 1967-2005
Malawi 1964-2005
Malaysia 1960-2005
Maldives 1973-2005
Mali 1960-2005
Malta 1963-2005
Marshall Islands 1991-2005
Mauritania 1960-2005
Mauritius 1968-2005
Mexico 1960-2005
Moldova 1991-2005
Mongolia 1960-2005
Morocco 1960-2005
Mozambique 1975-2005
Myanmar (Burma) 1960-2005
Namibia 1990-2005
Nepal 1965-2005
Netherlands 1960-2005
New Zealand 1960-2005
Nicaragua 1960-2005
Niger 1964-2005
Nigeria 1960-2005
Continued on Next Page. . .
33
Table 9 � Continued
Country Years
Norway 1960-2005
Oman 1963-2005
Pakistan 1960-2005
Palau 1994-2005
Panama 1960-2005
Papua Ne Guinea 1963-2005
Paraguay 1960-2005
Peru 1960-2005
Philippines 1960-2005
Poland 1960-2005
Portugal 1965-2005
Qatar 1971-2005
Romania 1960-2005
Russia 1981-2005
Rwanda 1962-2005
Samoa 1976-2005
Sao Tome and Principe 1975-2005
Saudi Arabia 1966-2005
Senegal 1960-2005
Seychelles 1976-2005
Sierra Leone 1961-2005
Singapore 1965-2005
Slovakia 1993-2005
Slovenia 1992-2005
Solomon Islands 1963-2005
Somalia 1963-2005
South Africa 1960-2005
South Korea 1960-2005
Spain 1960-2005
Sri Lanka 1960-2005
St Kitts and Nevis 1983-2005
St Lucia 1979-2005
St Vincent and the Grenadines 1979-2005
Sudan 1960-2005
Suriname 1975-1994
Swaziland 1968-2005
Sweden 1960-2005
Continued on Next Page. . .
34
Table 9 � Continued
Country Years
Switzerland 1960-2005
Syria 1961-2005
Taiwan 1963-2005
Tajikistan 1991-2005
Tanzania 1961-2005
Thailand 1960-2005
Togo 1960-2005
Tonga 1999-2005
Trinidad and Tobago 1962-2005
Tunisia 1960-2005
Turkey 1960-2005
Uganda 1962-2005
Ukraine 1991-2005
United Arab Emirates 1971-2005
United Kingdom 1960-2005
United States of America 1960-2005
Uruguay 1960-2005
Uzbekistan 1991-2005
Vanatua 1981-2005
Venezuela 1960-2005
Vietnam 1960-2005
Yemen 1960-2005
Yugoslavia 1963-2005
Zambia 1964-2005
Zimbabwe 1965-2005
C Cases of Nation Building
35
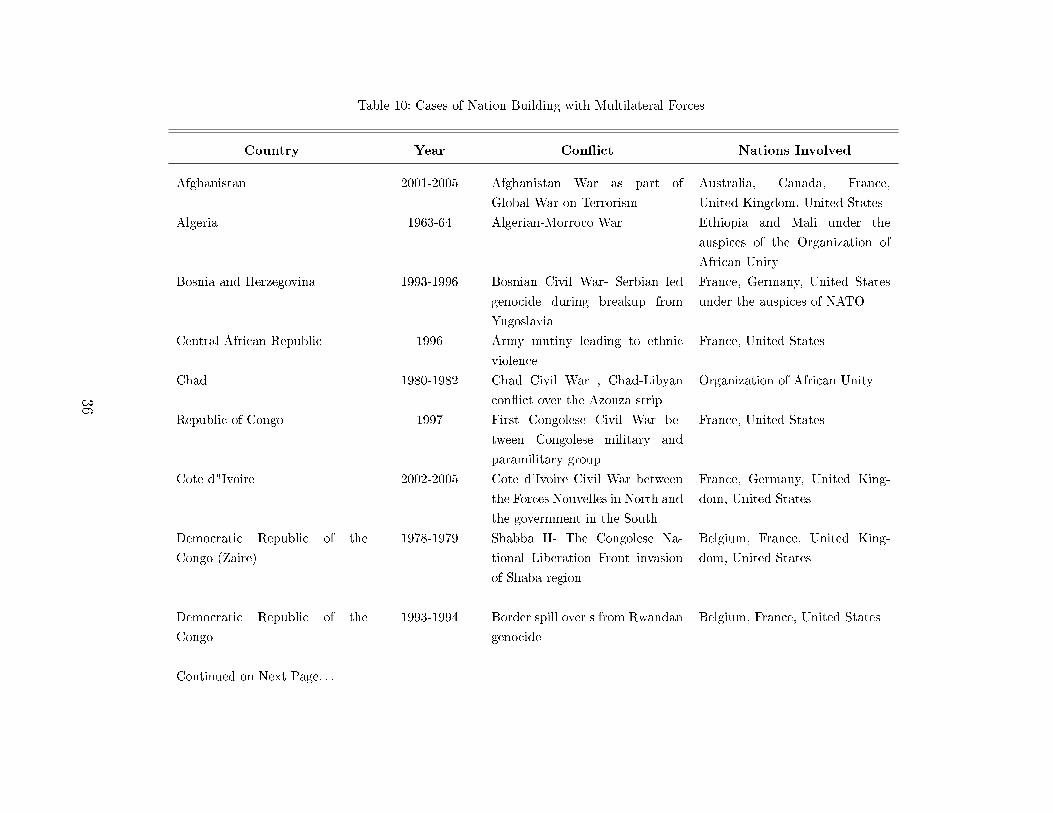
Table 10: Cases of Nation Building with Multilateral Forces
Country Year Con�ict Nations Involved
Afghanistan 2001-2005 Afghanistan War as part of
Global War on Terrorism
Australia, Canada, France,
United Kingdom, United States
Algeria 1963-64 Algerian-Morroco War Ethiopia and Mali under the
auspices of the Organization of
African Unity
Bosnia and Herzegovina 1993-1996 Bosnian Civil War- Serbian led
genocide during breakup from
Yugoslavia
France, Germany, United States
under the auspices of NATO
Central African Republic 1996 Army mutiny leading to ethnic
violence
France, United States
Chad 1980-1982 Chad Civil War , Chad-Libyan
con�ict over the Azouza strip
Organization of African Unity
Republic of Congo 1997 First Congolese Civil War be-
tween Congolese military and
paramilitary group
France, United States
Cote d"Ivoire 2002-2005 Cote d'Ivoire Civil War between
the Forces Nouvelles in North and
the government in the South
France, Germany, United King-
dom, United States
Democratic Republic of the
Congo (Zaire)
1978-1979 Shabba II- The Congolese Na-
tional Liberation Front invasion
of Shaba region
Belgium, France, United King-
dom, United States
Democratic Republic of the
Congo
1993-1994 Border spill over s from Rwandan
genocide
Belgium, France, United States
Continued on Next Page. . .
36
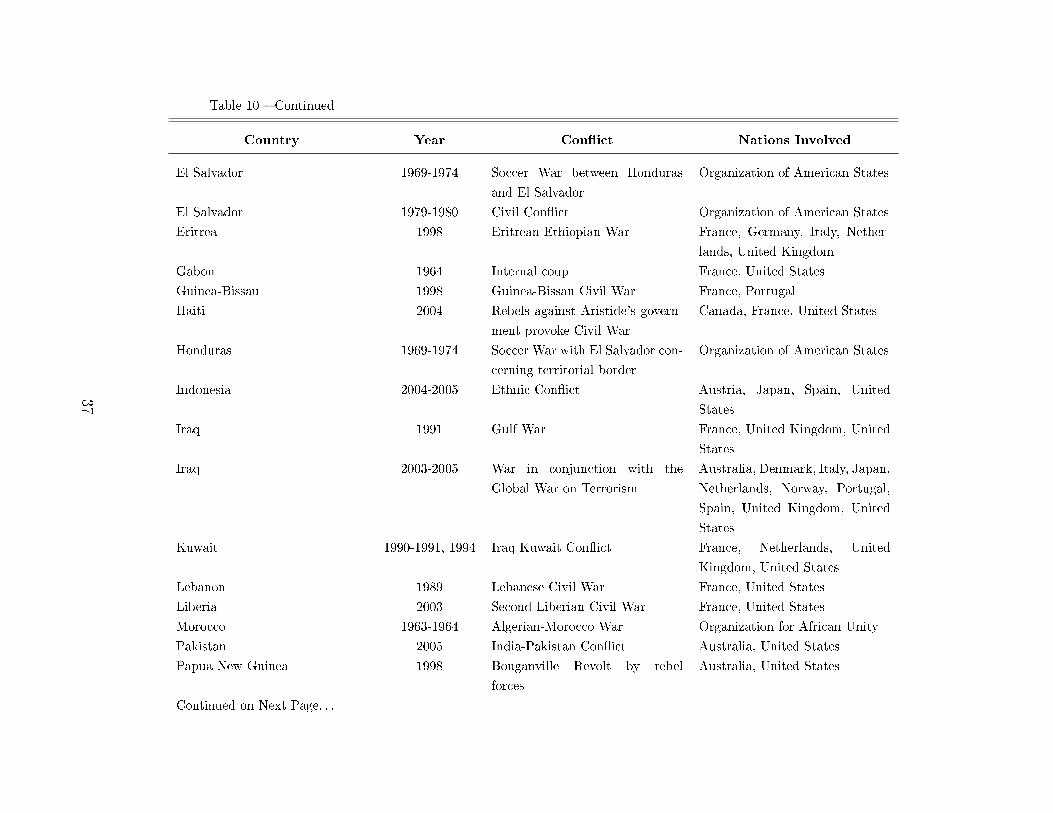
Table 10 � Continued
Country Year Con�ict Nations Involved
El Salvador 1969-1974 Soccer War between Honduras
and El Salvador
Organization of American States
El Salvador 1979-1980 Civil Con�ict Organization of American States
Eritrea 1998 Eritrean-Ethiopian War France, Germany, Italy, Nether-
lands, United Kingdom
Gabon 1964 Internal coup France, United States
Guinea-Bissau 1998 Guinea-Bissau Civil War France, Portugal
Haiti 2004 Rebels against Aristide's govern-
ment provoke Civil War
Canada, France, United States
Honduras 1969-1974 Soccer War with El Salvador con-
cerning territorial border
Organization of American States
Indonesia 2004-2005 Ethnic Con�ict Austria, Japan, Spain, United
States
Iraq 1991 Gulf War France, United Kingdom, United
States
Iraq 2003-2005 War in conjunction with the
Global War on Terrorism
Australia, Denmark, Italy, Japan,
Netherlands, Norway, Portugal,
Spain, United Kingdom, United
States
Kuwait 1990-1991, 1994 Iraq Kuwait Con�ict France, Netherlands, United
Kingdom, United States
Lebanon 1989 Lebanese Civil War France, United States
Liberia 2003 Second Liberian Civil War France, United States
Morocco 1963-1964 Algerian-Morocco War Organization for African Unity
Pakistan 2005 India-Pakistan Con�ict Australia, United States
Papua New Guinea 1998 Bouganville Revolt by rebel
forces
Australia, United States
Continued on Next Page. . .
37

Table 10 � Continued
Country Year Con�ict Nations Involved
Rwanda 1990, 1994 Rwandan Genocide Belgium, Canada, France, United
States
Sierra Leone 1997 Sierra Leone Civil War France, United Kingdom, United
States
Somalia 1992-1993 Somali Civil War Canada, France, Italy, United
States
Sri Lanka 2005 Sri Lankan Civil War United Kingdom, United States
Thailand 1962 Thai/Burmese border con�icts Australia, United Kingdom,
United States
Vietnam 1965-1972 Vietnam War Australia, United States
Note:All con�ict data and descriptions come from: Uppsala Con�ict Program, Encyclopedia of Con�icts since World War II, and the Armed
Con�icts Database All Military intervention data comes from: International Military Intervention Dataset.
38
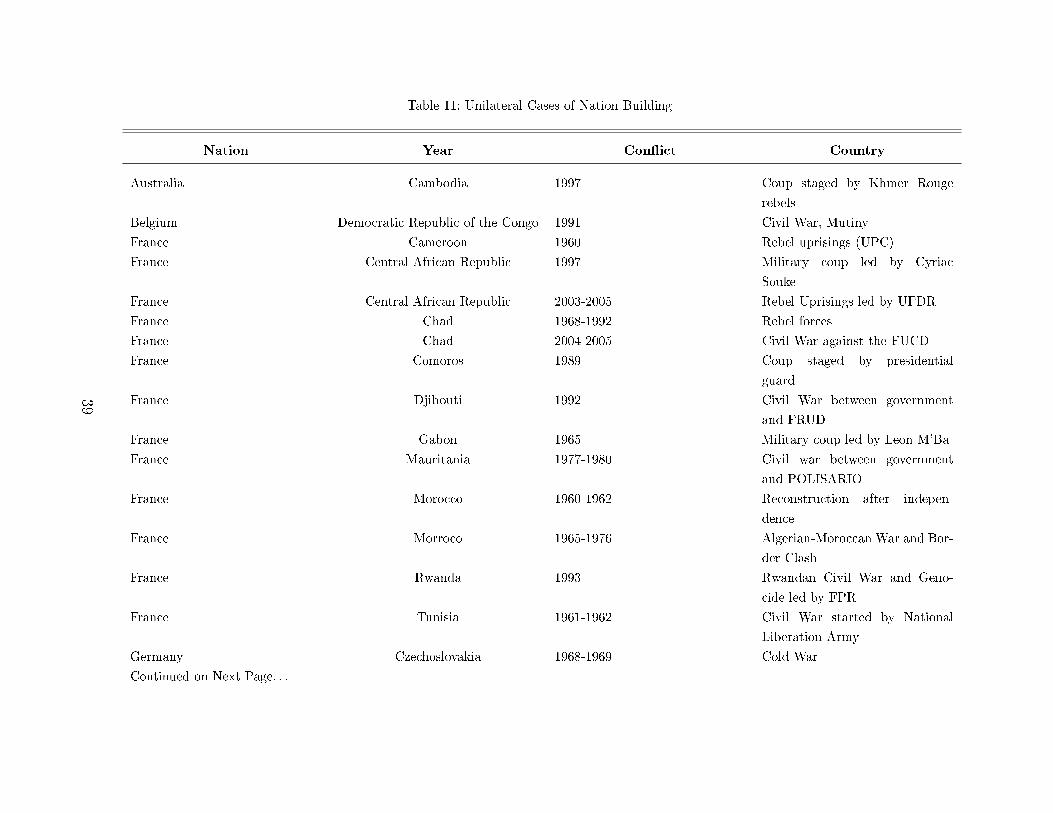
Table 11: Unilateral Cases of Nation Building
Nation Year Con�ict Country
Australia Cambodia 1997 Coup staged by Khmer Rouge
rebels
Belgium Democratic Republic of the Congo 1991 Civil War, Mutiny
France Cameroon 1960 Rebel uprisings (UPC)
France Central African Republic 1997 Military coup led by Cyriac
Souke
France Central African Republic 2003-2005 Rebel Uprisings led by UFDR
France Chad 1968-1992 Rebel forces
France Chad 2004-2005 Civil War against the FUCD
France Comoros 1989 Coup staged by presidential
guard
France Djibouti 1992 Civil War between government
and FRUD
France Gabon 1965 Military coup led by Leon M'Ba
France Mauritania 1977-1980 Civil war between government
and POLISARIO
France Morocco 1960-1962 Reconstruction after indepen-
dence
France Morroco 1965-1976 Algerian-Moroccan War and Bor-
der Clash
France Rwanda 1993 Rwandan Civil War and Geno-
cide led by FPR
France Tunisia 1961-1962 Civil War started by National
Liberation Army
Germany Czechoslovakia 1968-1969 Cold War
Continued on Next Page. . .
39

Table 11 � Continued
Nation Providing Aid Country Year Con�ict
Germany Iran 1991 Civil War staged by People's Mu-
jahedin of Iran (MEK)
Germany Sudan 2004 Civil War rebel factions include
JEM, SLM/A, NDA
Spain Morocco 2002 Territorial Dispute over island of
Ceuta
United Kingdom Kenya 1982 Civil War started by Mau Mau
United Kingdom Oman 1972-1977 Civil War between government
and PFLO with help from Peo-
ple's Republic of Yemen
United Kingdom Sierra Leone 1998-2002 Civil War, rebel factions include
AFRC, Kamajros, and RUF
United Kingdom Yemen 1965-66 Civil War over Southern Areas by
FLOSSY
United States Cambodia 1975 Civil War Khmer Rouge, Cold
War
United States Cambodia 1997 Civil War rebel factions in-
clude FUNCINPEC and Khmer
Rougue
United States Democratic Republic of Congo 1965,1967
United States Dominican Republic 1961, 1965-1966 Civil War after 1962 elections
negated by civilian junta
United States El Salvador 1983-1988 Civil War between government
and CNL
United States Guatemala 1987 Rebel Factions URNG
United States Haiti 1994-1995 Operation Uphold Democracy
Continued on Next Page. . .
40

Table 11 � Continued
Nation Providing Aid Country Year Con�ict
United States Haiti 2005 Urban warfare between Haitian
Police, former Hatian military,
urban gangs, and armed political
groups
United States Kenya 1982 Military coup led by Hezekiah
Ochuka
United States Kuwait 1996 Iraq-Kuqait Con�ict
United States Laos 1961-1970 Civil War between Laos govern-
ment and Pathet Lao, Cold War
United States Liberia 1990-1991 Civil War rebel factions include
INPFL and NPFL
United States Liberia 1996, 1998 Civil War rebel factions include
INPFL and NPFL
United States Morocco 1976-1978 Civil War led by POLISARIO
United States Nicaragua 1979 Civil War by rebel faction FSLN
United States Pakistan 2004 Rebel Factions in Baluchistan led
by the BLA
United States Panama 1989-1990 Military Coup led by Moises
Giroldi
United States Philippines 1989 Civil War initiated by CPP and
Military coup led by Honasan,
Abenina, and Zumel
United States Sierra Leone 1992 Civil War between government
and RUF
United States Sierra Leone 2001-2002 Civil War rebel factions include
RUF and WSB
Continued on Next Page. . .
41
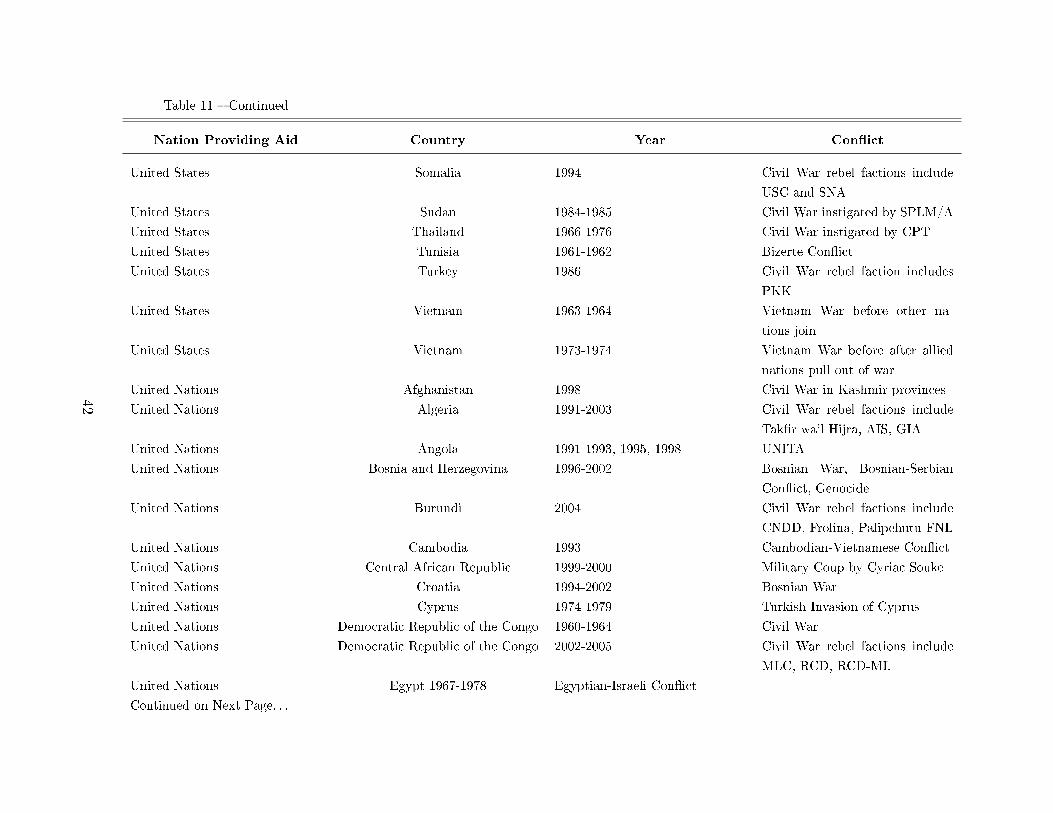
Table 11 � Continued
Nation Providing Aid Country Year Con�ict
United States Somalia 1994 Civil War rebel factions include
USC and SNA
United States Sudan 1984-1985 Civil War instigated by SPLM/A
United States Thailand 1966-1976 Civil War instigated by CPT
United States Tunisia 1961-1962 Bizerte Con�ict
United States Turkey 1986 Civil War rebel faction includes
PKK
United States Vietnam 1963-1964 Vietnam War before other na-
tions join
United States Vietnam 1973-1974 Vietnam War before after allied
nations pull out of war
United Nations Afghanistan 1998 Civil War in Kashmir provinces
United Nations Algeria 1991-2003 Civil War rebel factions include
Tak�r wa'l Hijra, AIS, GIA
United Nations Angola 1991-1993, 1995, 1998 UNITA
United Nations Bosnia and Herzegovina 1996-2002 Bosnian War, Bosnian-Serbian
Con�ict, Genocide
United Nations Burundi 2004 Civil War rebel factions include
CNDD, Frolina, Palipehutu-FNL
United Nations Cambodia 1993 Cambodian-Vietnamese Con�ict
United Nations Central African Republic 1999-2000 Military Coup by Cyriac Souke
United Nations Croatia 1994-2002 Bosnian War
United Nations Cyprus 1974-1979 Turkish Invasion of Cyprus
United Nations Democratic Republic of the Congo 1960-1964 Civil War
United Nations Democratic Republic of the Congo 2002-2005 Civil War rebel factions include
MLC, RCD, RCD-ML
United Nations Egypt 1967-1978 Egyptian-Israeli Con�ict
Continued on Next Page. . .
42

Table 11 � Continued
Nation Providing Aid Country Year Con�ict
United Nations El Salvador 71991, 1993, 1995 Civil War led by the FMLN
United Nations Ethiopia 2000-2004 Eritrean-Ethiopian War
United Nations Georgia 1994-1998 War in Abkhazia, "Frozen Con-
�ict"
United Nations Guatemala 1992, 1997 URNG
United Nations Haiti 1994-1996, 2005 Civil War
United Nations India 1961-1981 Indio-Pakistani Wars
United Nations Iran 1988 Iran-Iraq War
United Nations Iraq 1988 Iran-Iraq War
United Nations Israel 1960-1975 Egyptian-Israeli Con�ict, Israeli-
Syrian Con�ict, Israeli-Jordan
Con�ict, Israeli-Lebanon Con�ict
United Nations Jordan 1967 Israeli-Jordan Con�ict
United Nations Jordan 1972 Israeli-Jordan Con�ict
United Nations Lebanon 1977, 1978 Israeli-Lebanon Con�ict
United Nations Lebanon 1993-1995 Israeli-Lebanon Con�ict
United Nations Liberia 2004-2005 Second Liberian Civil War led by
LURD andMovement for Democ-
racy in Liberia
United Nations Morocco 1991-1994 Territorial dispute with Polisario
Front over Saharawi Arab Demo-
cratic Republic
United Nations Mozambique 1992-1994 Civil War against Renamo Fac-
tion
United Nations Nicaragua 1991-1992 Civil War with FLAA
United Nations Pakistan 1964-1982, 1984-1985 Indio-Pakistani Wars
United Nations Sierra Leone 1998-2000 Civil War
Continued on Next Page. . .
43
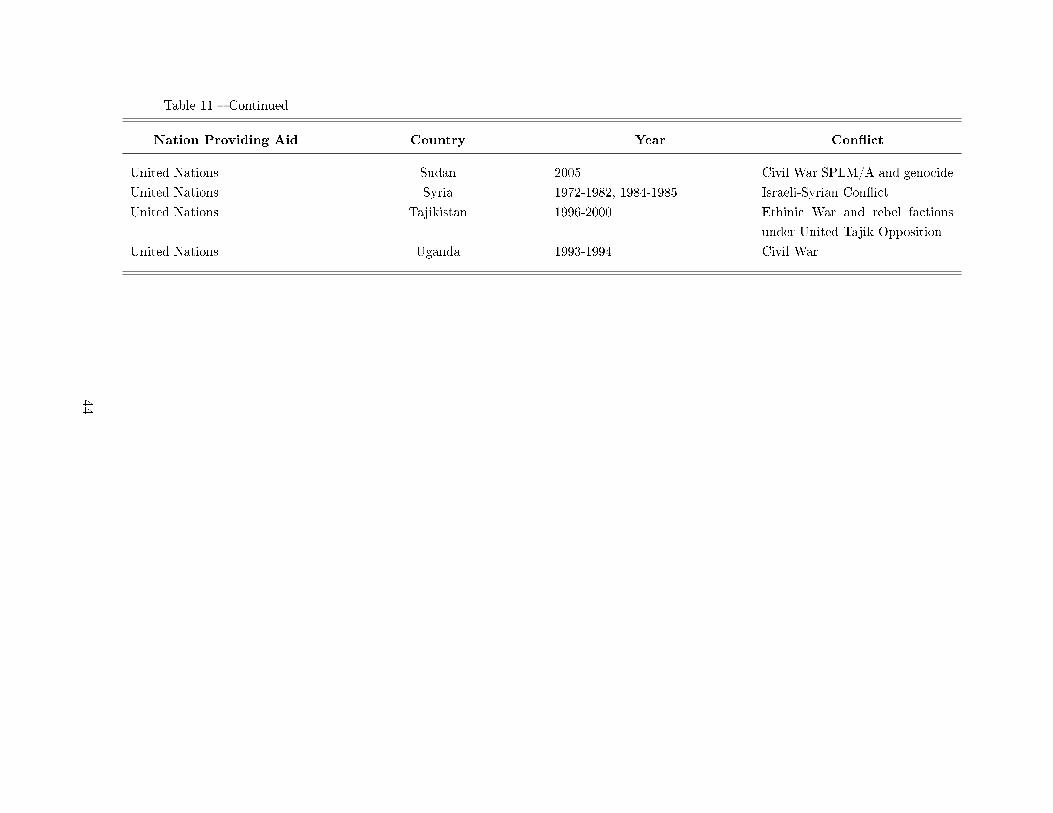
Table 11 � Continued
Nation Providing Aid Country Year Con�ict
United Nations Sudan 2005 Civil War SPLM/A and genocide
United Nations Syria 1972-1982, 1984-1985 Israeli-Syrian Con�ict
United Nations Tajikistan 1996-2000 Ethinic War and rebel factions
under United Tajik Opposition
United Nations Uganda 1993-1994 Civil War
44