nat. biotechnol. 29, 59–63 (2011) filenature biotechnology: doi:10.1038/nbt.1740. 3 supplementary...
TRANSCRIPT

nature biotechnology
Nat. Biotechnol. 29, 59–63 (2011)
Haplotype-resolved genome sequencing of a Gujarati Indian individualJacob O Kitzman, Alexandra P MacKenzie, Andrew Adey, Joseph B Hiatt, Rupali P Patwardhan, Peter H Sudmant, Sarah B Ng, Can Alkan, Ruolan Qiu, Evan E Eichler & Jay Shendure
In the version of this supplementary file originally posted online, Supplementary Figure 4a was not properly drawn. The error has been corrected in this file as of 12 April 2011.
correct ion not ice
Nature Biotechnology: doi:10.1038/nbt.1740

1
Supplementary Information for: Haplotype resolved genome sequencing of a Gujarati Indian individual
Jacob O. Kitzman1, Alexandra P. MacKenzie1, Andrew Adey1, Joseph B. Hiatt1, Rupali P.
Patwardhan1, Peter H. Sudmant1, Sarah B. Ng1, Can Alkan1,2, Ruolan Qiu1, Evan E. Eichler1,2, Jay
Shendure1,3
1Department of Genome Sciences, University of Washington School of Medicine, Seattle, WA, USA
2Howard Hughes Medical Institute, Seattle, WA, USA
3Correspondance should be addressed to J.S. ([email protected]) and J.O.K. ([email protected])
Supplementary Tables 1-5 Supplementary Figures 1-7 Supplementary Methods (Experimental) Supplementary Methods (Computational) Note: Supplementary Table 4 is provided as a separate file.
Nature Biotechnology: doi:10.1038/nbt.1740

2
SUPPLEMENTARY TABLES Supplementary Table 1. Shotgun, whole-genome sequencing of NA20847
Read Pairs Percentage Total raw read pairs 868,606,620 100
Both reads in pair map 718,764,108 82.7
After removal of duplicates 442,923,497 51.0
Mapping quality >0 421,119,836 48.5 Supplementary Table 2. Variant discovery in whole-genome sequencing of NA20847. Single nucleotide substitutions and short indels called in NA20847. Genotype concordance refers to concordance with Hapmap Phase 3 genotyping calls (obtained from the International Hapmap Project website), and novel is defined as not being in dbSNP130 unless otherwise specified.
Pre Filter Variants Post Filter Variants Single Nucleotide Variants
Total 4,044,893 3,281,721 Homozygous 1,436,212 1,377,822 Heterozygous 2,608,681 1,903,899 In dbSNP 129 3,351,758 (82.8%) 2,862,064 (87.2%) In dbSNP 130 3,465,817 (85.7%) 2,895,827 (88.2%) Genotype Concordance 99.21% 99.21% Non-reference Sensitivity 94.05% 90.50% Ti/Tv Ratio
Overall 1.927 2.102 Known 2.086 2.156 Novel 1.372 1.817
Coding variants (novel) 16,549 (1,757) Synonymous 8,394 (572) Missense 8,009 (1,139) Nonsense 97 (25) Splice-site 49 (21)
Short Indels
Total 338,069 In dbSNP 129 56,613 (16.7%) In dbSNP 130 85,407 (25.3%) Coding indels (novel) 261 (79)
Homozygous 49 (21) Single-base indel 147 (91) Other frameshift 40 (33)
Nature Biotechnology: doi:10.1038/nbt.1740

3
Supplementary Table 3. Deletions detected by read depth, discordant read-end mapping, published SNP array data, and fosmid clone pool sequences, with inferred genotype (Hom=homozygous, Het=hemizygous).
Supporting evidence
Chr Start End Genotype call
Read depth
Read pairing
Hapmap SNP array
Overlaps segmental
duplication?
Fosmid clone
support?
chr1 1625868 1674085 Hom yes yes no yes yes chr1 25589146 25662212 Hom yes no yes yes yes chr1 72765976 72811148 Hom yes yes yes no yes chr1 152555259 152587964 Hom yes yes yes no yes chr1 196735662 196815791 Hom yes no yes yes yes chr2 4213378 4223167 Het no yes yes no yes chr2 52749447 52784660 Hom yes yes yes no yes chr2 89160586 89450660 Het yes yes no yes no chr2 146863365 146877179 Het yes yes yes no yes chr3 37979882 37986928 Het no yes yes no yes chr3 114660592 114668934 Het no yes yes no no chr3 192875014 192885615 Het yes yes yes no no chr4 10211029 10234948 Het yes yes yes no yes chr4 10392354 10400668 Het no yes yes no yes chr4 34786500 34824725 Het yes no yes no yes chr4 63669575 63675109 Het no yes yes no yes chr4 115175323 115182290 Hom no yes yes no yes chr5 12810725 12820859 Het yes yes no no yes chr5 57326027 57333533 Hom no yes yes no yes chr5 103854163 103860686 Hom no yes yes no yes chr6 29837188 29849267 Hom yes no yes yes yes chr6 32454275 32571961 Het yes no yes yes no chr6 32609298 32632000 Hom yes no yes no no chr6 74592225 74601410 Het no yes yes no yes chr6 78966856 79035185 Het yes yes yes no yes chr6 81285114 81293850 Het yes yes no no yes chr6 103737976 103763227 Hom yes yes yes no yes chr7 26137366 26145883 Het yes yes yes no yes chr7 109436373 109454147 Hom no yes yes no yes chr7 141765688 141794686 Het yes yes yes yes yes chr8 594069 599513 Hom yes yes no no yes chr8 32679648 32691559 Hom yes yes yes no yes chr8 39231711 39387472 Hom yes yes yes no yes chr8 130136286 130144429 Het yes yes no no yes chr8 144700992 144709274 Het no yes yes no yes chr9 23362799 23377724 Het yes yes yes no yes chr9 29092301 29098333 Het yes yes no no yes chr9 69679261 69786952 Hom yes yes no no no chr10 67307923 67314446 Hom no yes yes no yes chr11 3238460 3244451 Het yes yes no no yes chr11 5784261 5809477 Het yes yes yes no yes chr11 40952109 40970919 Het yes yes no no yes chr11 54968666 55027029 Het no yes yes no no chr11 55031341 55036472 Het no yes yes yes yes chr12 9633870 9728297 Het yes no yes yes yes chr12 33299791 33307374 Het no yes yes no yes chr14 106329131 106781629 Het yes yes no yes yes chr15 23644124 23670984 Het yes no yes yes no chr16 32257509 32714406 Het no yes yes yes no chr17 39421462 39432441 Hom yes yes yes no yes chr18 38260420 38265448 Het no yes yes no yes chr18 63723504 63732704 Hom yes yes no no yes chr18 67207852 67217271 Het no yes yes no yes chr19 20595504 20718165 Het yes yes yes yes yes chr19 52141162 52148804 Het yes no yes yes yes chr20 60290492 60316402 Het yes yes yes no yes chr22 23154916 23163273 Het yes yes no no no chr22 24344422 24390903 Het yes no yes yes yes
Nature Biotechnology: doi:10.1038/nbt.1740

4
Supplementary Table 4. Pan-genome and novel sequence anchoring. Provided as standalone spreadsheet file. Supplementary Table 5. Time and cost considerations for sample preparation of clone libraries. Time used, and labor and reagent costs are shown for each step, beginning with high molecular weight DNA and ending with clone pool-derived sequencing libraries. Size selection during fosmid library production, though labor-intensive, is feasible for 4-6 samples in parallel. Subsequent steps, including bacterial outgrowth and clone pool DNA isolation, are amenable to scaling and can be carried out in 96-well format using commercially available kits and reagents. Library construction based on fragmentation by in vitro transposition is highly efficient relative to conventional library preparation1, and was carried out in a 48-well format. Following PCR, the clone pool-derived sequencing libraries are barcode-tagged1 and can be pooled prior to a single size selection. Labor costs for a single technician are estimated at $200 per day, and adjusted by conservative estimates of hands-on time. Reagent costs fosmid and shotgun library construction are based on list prices for items used.
Step Time Hands-on
time Cost
(labor) Cost (reagent list price)
Fosmid library construction and host cell infection
4 days <50% $400 $61 ($610 for 10 libraries, Epicentre item #CCFOS110)
Library splitting & outgrowth
1 day 50% $100 < $50 for LB+Cm and plasticware
Pool clone DNA purification
1 day 50% $100 < $50 for alkaline lysis reagents & plasticware
Barcoded sequencing library preparation, amplification, and size-selection
2 days 75% $300 $2,617 (Epicentre items GA091120 and EM0911-96, BioRad item 172-5302)
Subtotals $900 $2778
Grand totals 8 days, $3678
Nature Biotechnology: doi:10.1038/nbt.1740

5
SUPPLEMENTARY FIGURES
Supplementary Figure 1. Fosmid clone sequencing and deconvolution. (a) Individual barcoded pools were aligned to the reference (hg19) and clone boundaries were inferred from read depth. (b) Distribution of clone insert sizes from inferred boundaries. (c) Percentage of inferred clones for each barcoded pool that fall within one log of coverage in the pool (y-axis) with respect to the total number of bases sequenced per barcoded fosmid pool (x-axis). Notably, the pools prepared using a plateless outgrowth method generally have a more uniform distribution of coverage between clones within the pool, though the total number of bases sequenced for these pools was lower overall.
Inferred clone insert size (kbp)
count
0
2000
4000
6000
8000
10000
12000
25 30 35 40 45
a. b. R
ead d
epth
in
clo
ne p
ools
In
ferr
ed c
lone
boundaries
50 kbp
c.
!"#$%&'$()(&()*+),-).&/)0&/""%1&-%",)(2/""%&34#54,&6&%"7&-"8)0$7)
9:
9;
<:
<;
=:
=;
O;
JA
J>
H<J;HN
O6:
M<H9KAMNL9
G=
M6:
G<G;JB
J9KB
FN
OBH>
HB
H66
GN
O6>
K;
H;
F9
O<
M;
L=LBFA
OA
O66F;FBO9
MB
KN
H6
M66
F>J6:
M9L<
GB
G6>
M6>
J<
J=
L66H=
F6>LA
O>
L6:
K>
L6>
J6>G>
G6:
M>F66J66
O=
G66K6:
K6
F6K66
K6>L;K=
H6>
M6
F<
F=J6
M=
L>GA
K9
K<
F6:
MAON
H6:JN HA
/%IGA/%IJA/%IJ>/%IHA/%IMA/%IH>/%IO>/%IM>/%IOA/%IG>/%IFN/%IFA/%IHN/%ILA/%IK>/%IL>/%IF>/%IGN/%IKA/%ILN/%IJN
/%IKN/%ION/%IMN
>?:)@:< A?:)@:< B?:)@:< <?:)@:< 6?:)@:= 6?>)@:= 6?A)@:=
C+#70"3#5
D)#5".
E%$#)%)((E%$#)(
Nature Biotechnology: doi:10.1038/nbt.1740

6
Supplementary Figure 2. Coverage distribution of whole genome shotgun sequencing depth for reads meeting filter criteria (properly-paired, insert-size >=50, and duplicates removed).
Shotgun sequencing depth
# b
asepairs
0.0e+00
5.0e+07
1.0e+08
1.5e+08
0 10 20 30 40
Nature Biotechnology: doi:10.1038/nbt.1740
7
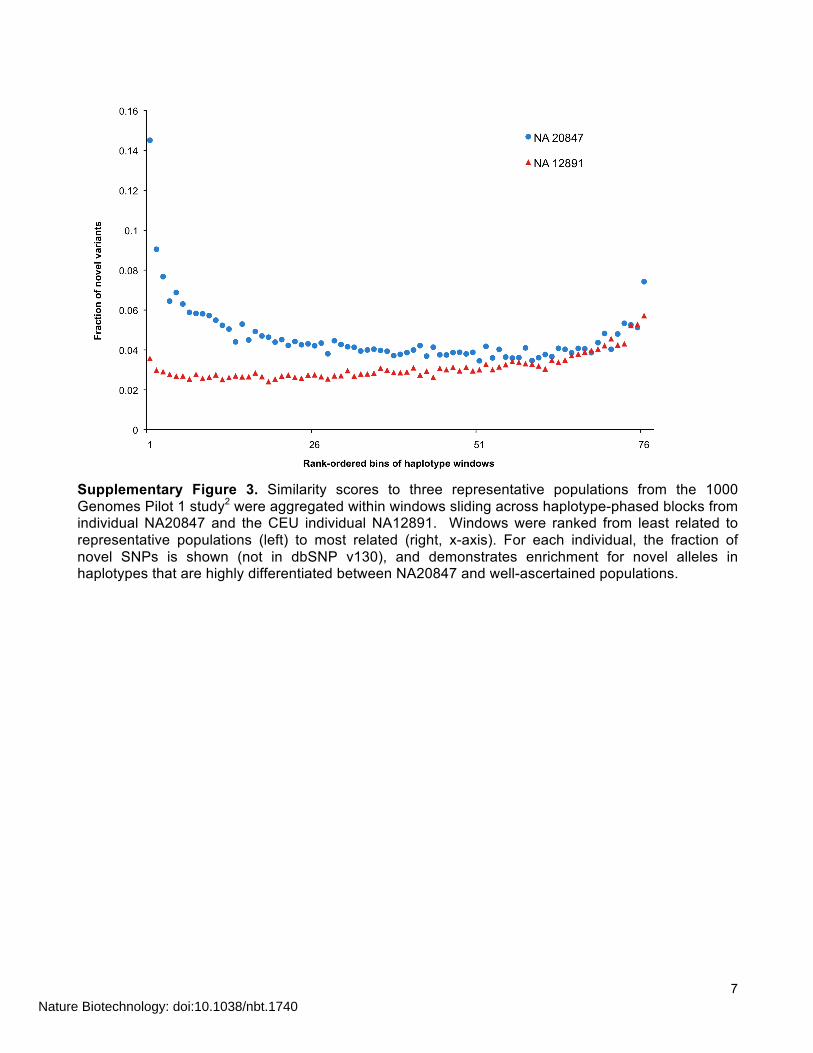
Supplementary Figure 3. Similarity scores to three representative populations from the 1000 Genomes Pilot 1 study2 were aggregated within windows sliding across haplotype-phased blocks from individual NA20847 and the CEU individual NA12891. Windows were ranked from least related to representative populations (left) to most related (right, x-axis). For each individual, the fraction of novel SNPs is shown (not in dbSNP v130), and demonstrates enrichment for novel alleles in haplotypes that are highly differentiated between NA20847 and well-ascertained populations.
Nature Biotechnology: doi:10.1038/nbt.1740
8
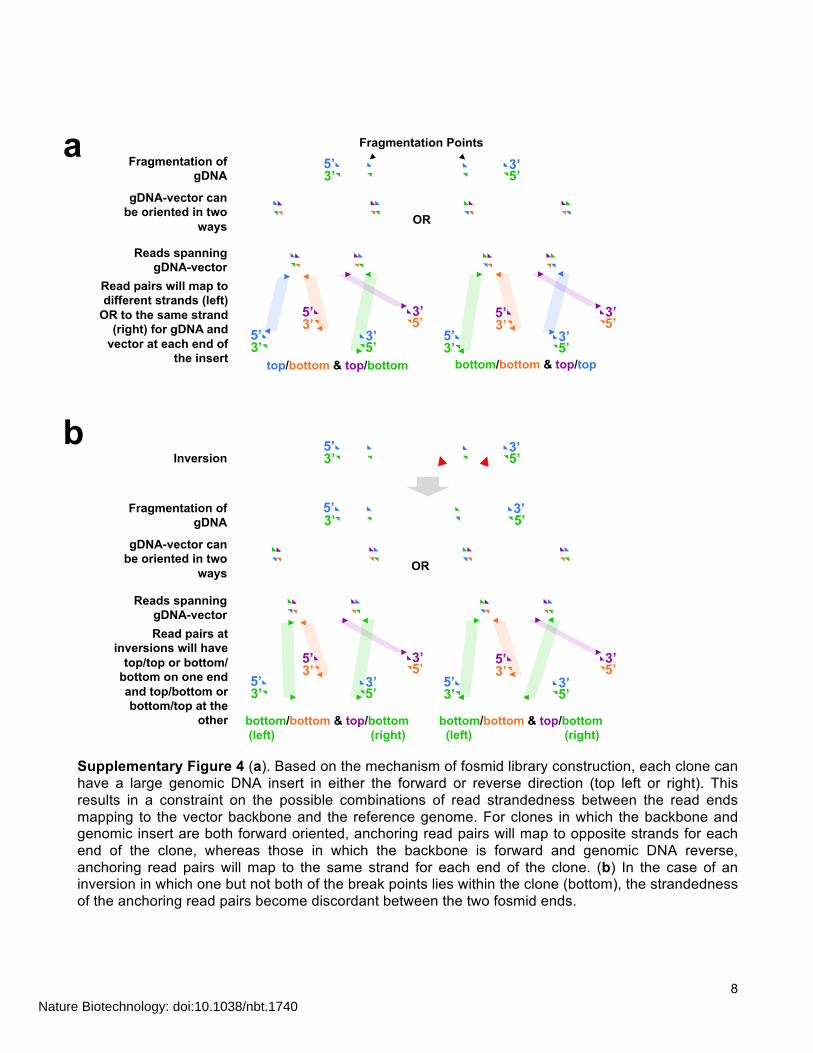
Supplementary Figure 4 (a). Based on the mechanism of fosmid library construction, each clone can have a large genomic DNA insert in either the forward or reverse direction (top left or right). This results in a constraint on the possible combinations of read strandedness between the read ends mapping to the vector backbone and the reference genome. For clones in which the backbone and genomic insert are both forward oriented, anchoring read pairs will map to opposite strands for each end of the clone, whereas those in which the backbone is forward and genomic DNA reverse, anchoring read pairs will map to the same strand for each end of the clone. (b) In the case of an inversion in which one but not both of the break points lies within the clone (bottom), the strandedness of the anchoring read pairs become discordant between the two fosmid ends.
5’ 3’ 5’ 3’
Fragmentation Points
OR
5’ 3’ 5’ 3’
5’ 3’
3’ 5’
5’ 3’ 5’ 3’
5’ 3’
3’ 5’
Fragmentation of
gDNA
gDNA-vector can
be oriented in two
ways
Reads spanning
gDNA-vector
Read pairs will map to
different strands (left)
OR to the same strand
(right) for gDNA and
vector at each end of
the insert top/bottom & top/bottom
5’ 3’ 5’ 3’
5’ 3’
3’ 5’
OR
Fragmentation of
gDNA
gDNA-vector can
be oriented in two
ways
Inversion
Reads spanning
gDNA-vector
Read pairs at
inversions will have
top/top or bottom/
bottom on one end
and top/bottom or
bottom/top at the
other
5’ 3’ 5’ 3’
5’ 3’
3’ 5’
5’ 3’ 5’ 3’
5’ 3’
3’ 5’
bottom/bottom & top/top
bottom/bottom & top/bottom
(left) (right)
bottom/bottom & top/bottom
(left) (right)
a
b
Nature Biotechnology: doi:10.1038/nbt.1740

9
Supplementary Figure 5. (a) Previously identified inversions3 supported by fosmid clones spanning a break point. Light Blue – fosmid clone pool coverage tracks, Dark Blue – whole genome shotgun coverage track. Purple connections indicate the additional support of strand discordance of read pairs spanning genomic DNA and the vector backbone. (b) Example of filtering likely false positive inversion (purple) called by discordant paired-end reads mapping to segmental duplications (orange) but not supported by fosmid clone pool coverage.
chr12:17,924,099-18,011,706
chrX:46,810,806-46,830,688
chr16:75,240,100-75,256,658
chrX:149,571,522-149,585,292
chr9:34,244,810-34,275,143
a
b
Nature Biotechnology: doi:10.1038/nbt.1740

10
Supplementary Figure 6. (a) A copy number heatmap across the highly population-stratified 17q21 locus for 160 individuals of diverse ancestry from the 1000 Genomes Project2 and other published genome studies. A 75-kb duplication is specifically found in Europeans and individual NA20847. (b) PCR typing using a deletion polymorphism in intron 9 of the MAPT gene distinguishes the reference H1 haplotype from the inverted H2 haplotype, and indicates NA20847 is heterozygous (H1/H2). (c) Close-up of the European-specific duplication shows NA20847 has a similar duplication architecture to European H1/H2 individuals.
Nature Biotechnology: doi:10.1038/nbt.1740

11
a.
b.
!"#$%&&'(#)*#+,#'-#./0'*(#-'123345
6%.&7/8.#'9&7,:';<3'19.5
2#=3<
>#=3<
?#=3<
@#=3<
>3 @3 A3 B3 233
!"#$%&'("()*+$',
234
>34
@34
A34
B34
2334
!"-'),",'+./
(01()*+$',
234'
>34'
@34'
A34'
B34'
2334
!"#$%&&'(#)*#+,#'-#./0'*(#-'123345
4'.0%(#'%6$##7#+/'"('8%.7%.9
:;<('=>/0'.%>$=>(#''?@'AB'3CD'
DE
DF
DG
DH
DD
233
I3 J3 F3 H3 233
!"#$%&'("()*+$',
234
I34
J34
F34
H34
2334
!"-'),",'+./
(01()*+$',
234'
I34'
J34'
F34'
H34'
2334
Nature Biotechnology: doi:10.1038/nbt.1740

12
c.
Supplementary Figure 7. Downsampling analysis of haplotype phase assembly size and accuracy as a function of reduced sequence coverage. Point shape indicates percent of clones randomly sampled; point color indicates percentage of read depth sampled within each clone. (a) N50 phased haplotype block size in bp, (b) percent agreement with HapMap phase predictions for SNPs in high LD (pairwise D’ >= 0.9), and (c) percentage of total ascertained heterozygous SNPs phased, all with respect to percentage of overall sequence depth (product of subsampled percentages of clones and reads within each clone).
!"#$%&&'(#)*#+,#'-#./0'*(#-'123345
4'%(,#$/%6+#-'789('.0%(#-
:3
;3
<3
=3
:3 ;3 <3 =3 233
!"#$%&'("()*+$',
234
:34
;34
<34
=34
2334
!"-'),",'+./
(01()*+$',
234'
:34'
;34'
<34'
=34'
2334
Nature Biotechnology: doi:10.1038/nbt.1740

13
Experimental methods Fosmid library construction Fosmid libraries were constructed as previously described4, with minor modifications as follows. A lymphoblastoid cell line for the individual of interest (GM20847, Coriell) was cultured according to standard techniques. High molecular weight genomic DNA (HMW gDNA) was isolated from ~1.4e7 cells using the Gentra Puregene Cell Kit (QIAGEN, 158388). 8 ug of HMW gDNA was sheared using a Bioruptor sonicator (Diagenode) in 60 uL of TE8 for 20 seconds on the “medium” setting. The sheared DNA was electrophoresed in a 1% Ultrapure agarose gel (Invitrogen, 16500100) and using a Bio-Rad CHEF-DR II Pulsed Field Gel Electrophoresis apparatus at 160V with an initial switching time (“Initial A time”) of 1 second, a final switching time (“Final A time”) of 6 seconds, and a run-time of 20 hours. The gel was run for ~16 hours, stained with Ethidium Bromide according to standard practice, the lanes containing ladder were removed and imaged, and the gel was reconstructed so as to avoid exposure of the sample DNA to UV light. A band corresponding to ~35-45 kb was excised from the gel, DNA was electroeluted from the gel as previously described5, and purified by ethanol precipitation. Size-selected DNA was end-repaired using the End-IT kit (Epicentre, ER0720), purified by phenol-chloroform extraction and ethanol precipitation, and blunt-end ligated to prelinearized pCC1FOS (Epicentre, Cat. No. CCFOS110) according to manufacturer’s specifications (using ~125 ng of input DNA and a 10:1 vector:insert molar ratio). Packaging reaction using MaxPlax Lambda packaging extract was performed according to manufacturer’s instructions except that chloroform was not added after diluting using the Phage Dilution Buffer. TransforMax EPI300 T1R Chemically Competent E. coli (Epicentre, Cat. No. C300C105) were expanded for bulk infection in 22ml LB with 10mM MgSO4 and 0.2% maltose in a shaking incubator for 14 hours at 37°C. 16ml LB with 10mM MgSO4 and 0.2% Maltose was inoculated with 1ml of the expanded culture and grown with shaking at 250rpm and 37°C until OD600 ~ 0.7. Cells were then pelleted by centrifugation at 2000rpm and 4°C for 10 minutes. Pellet was resuspended in 9.6ml 10mM MgSO4 and infected by room temperature incubation with 240ul packaged phage. After 30 min, 9.6 ml LB was added and cells were incubated for 30 min at 37C with shaking at 175rpm. Total library complexity of ~2.5x10⁶ clones was estimated by plating. Fosmid pool collection (plate & scrape) The bulk library infection was split into 96 fractions which were plated on LB+Cm agar plates and grown overnight at 37C. Cells were collected from each plate by administering 5ml of LB+Cm to the surface of each plate and swirling gently. Collected cells were used to inoculate 9ml of LB+Cm for 30 min liquid outgrowth at 37°C with shaking at 300 rpm. Clones were induced to high copy by adding CopyControl induction solution as directed by the manufacturer (Epicentre, Cat. No. CCIS125). After induction, shaking incubation was continued for 2.5 hours. Cultures were then pelleted by centrifugation for 15min at 3000rpm and 4°C. Fosmid clone DNA was isolated by a modified alkaline lysis miniprep procedure as follows: cell pellet was resuspended in 250 uL Qiagen buffer P1 with RNAse and lysed with 250uL of 0.2M NaOH/1%SDS solution for five minutes. Lysis was neutralized with 250uL 3M NaOAc, pH 4.8. Neutralized lysate was incubated on ice for 40 minutes, collected by centrifugation for 15 minutes at 13000rpm and 4°C, concentrated by standard ethanol precipitation, and resuspended in 50 uL 10 mM Tris-Cl pH 8.5.
Nature Biotechnology: doi:10.1038/nbt.1740

14
As a gross indicator of clone pool DNA integrity and yield, approximately 500ng fosmid DNA was digested with BamHI for 60 minutes at 37°C. Product was run on a 0.7% agarose gel with ethidium bromide alongside Invitrogen 1kb extension ladder (shown above). The distinct band at 8 kb corresponds to the excised fosmid backbone and the smear extending to ~35kb corresponds to digestion of the complex pool of inserts with varying counts of BamHI sites. Fosmid pool collection (plate-free) A streamlined protocol was developed to prepare clone pools without plating and scraping: a single bulk infection from the original packaged phase mix was prepared as above, split into 24 fractions, and used to inoculate 24 individual 5ml aliquots of LB-Cm media. These were grown with shaking at 300rpm and 37°C to density OD600 ~ 0.3. These cultures were then induced with CopyControl induction solution and grown shaking at 300rpm and 37°C for 60 minutes. DNA was isolated by miniprep as above. Fosmid pool sequencing library construction Libraries were prepared from fosmid clone DNA using Illumina-compatible Nextera DNA sample prep kits (Epicentre, Cat. No. GA09115). The manufacturer’s protocol was followed with modifications including a set of 96 barcoded oligos as described previously1. Barcoded PCR products were purified with 1.8 volumes AMPure XP beads according to manufacturer’s specifications (Beckman Genomics, Cat. No. A63880). Groups of 12 libraries were combined to form “super pools” for size selection in 6% pre-cast polyacrylamide gels (Invitrogen, Cat. No. EC6265BOX). For each super-pool, the band spanning 500-650bp was excised, diced, incubated in 10 mM Tris-Cl pH 8.5 at 65°C for 2 hours, purified through a Nanosep MF 0.2 um centrifugal filter (Pall, Cat. No. ODM02C33), cleaned with 0.7 volumes AMPureXP beads and amplified via limited-cycle PCR with iProof High-Fidelity polymerase (Bio-Rad) with the following program: initial denaturation at 98°C for 30 sec, followed by a 6-12 cycles of denaturation at 98°C for 10 sec, annealing at 64°C for 30 sec, and extension at 72°C for 40 sec. Amplified, size-selected libraries were then purified with 1.8x volumes Ampure XP beads, quantified on an Invitrogen Qubit fluorometer, pooled, and subjected to paired-end sequencing (76-bp or 101-bp reads) on an Illumina Genome Analyzer IIx. Shotgun sequencing library construction 200ng of HMW gDNA from individual GM20847 was subjected to simultaneous fragmentation and adaptor ligation followed by PCR amplification with the Nextera DNA sample prep kit as directed by the manufacturer. The resulting product was purified with 1.8 volumes AMPure XP beads, electrophoresed, size selected, cleaned up, and reamplified by limited-cycle PCR as for fosmid pool-derived libraries. The resulting library was sequenced using an Illumina HiSeq instrument (50-bp paired end reads).
Nature Biotechnology: doi:10.1038/nbt.1740

15
Primer sequences used in this study Oligo name Sequence Purpose nxPri1 AATGATACGGCGACCACCGA Post-size selection library amplification nxPri2 CAAGCAGAAGACGGCATACGA Post-size selection library amplification 17q21_F GGAAGACGTTCTCACTGATCTG 17q21 H1/H2 genotyping 17q21_R AAGAGTCTGGCTTCAGTCTCTC 17q21 H1/H2 genotyping Computational Methods Whole genome shotgun read processing and alignment Whole genome shotgun reads (PE-50) were extracted with Illumina RTA v1.8 basecalling software. The first position of both read ends contained an excess of mismatches to the reference (not shown) and was discarded from all further analyses. SNP and short indel discovery and genotyping Reads were next aligned to the reference assembly (NCBI assembly release GRCh37 obtained from the UCSC Genome Browser) using BWA v0.5.8a6. Base quality scores were recalibrated as a function of raw quality score, position within each read, and flanking dinucleotide using the Genome Analysis Toolkit (GATK)7. Reads extending into the flanking amplification primer sites (inferred insert size<49 bp, <2% of reads), reads with unmapped mates (17.3%) and pairs with redundant mapping coordinates (31.8%) were discarded to avoid spurious SNP calls. Reads in regions with high SNP densities or known indels were locally realigned using GATK to further avoid false positive SNP calls and accommodate indel detection. UnifiedGenotyper and IndelGenotyperV2 modules of GATK were used to call SNPs and short indels (Supplementary Table 2). Variants were filtered by phred-scaled quality score, read mapping quality, and allelic and strand bias using suggested parameters. CNV discovery and genotyping Read depth based deletion calls were identified by mapping reads to the reference assembly (hg18) using the mrsFAST aligner8. Read depths were then counted, corrected for G+C biases and used to estimate copy number by linear regression in 1kb unmasked windows across the genome as previously described9. Deletions of were identified as regions where at least 4 consecutive windows were estimated as copy 1 or 0. Deletion intervals were translated to hg19 coordinates using the UCSC Genome Browser LiftOver utility (http://genome.ucsc.edu/util.html). Deletions from discordantly mapping paired-ends were identified using the software package VariationHunter10. Deletions called from SNP array signals were obtained from the International HapMap Project webpage (http://hapmap.ncbi.nlm.nih.gov) and converted to hg19 coordinates. After filtering deletion calls by size (>= 8 kbp), a high confidence set of deletions was obtained by taking the intersection of those calls predicted by at least two of these three methods. Fosmid End Anchoring Read pairs from the fosmid clone pools, in which one was aligned to the human genome reference (GRCh37/hg19) and the second read unmapped, were examined for vector backbone anchoring. The unmapped reads were aligned using bowtie11 to both E. coli genome (K12) and the fosmid vector backbone. Reads mapping solely to the vector or to both but with a higher mapping score to the vector were then used to generate fosmid end anchors to the genome. Mapped reads were filtered for those mapping within 300 bp of the backbone cut site and a mapping quality score of at least 20. These were then linked up with their hg19 counterparts providing tentative anchors at the fosmid ends to the human genome. Based on the mechanism of fosmid library construction, each clone can have a large genomic DNA insert in either the forward or reverse direction. This results in a constraint on the backbone/hg19 read strandedness combination possibilities (Supplementary Fig. 4). For clones in which the backbone and genomic insert are both forward oriented, anchoring read pairs will map to opposite strands for each
Nature Biotechnology: doi:10.1038/nbt.1740
16
end of the clone, whereas those in which the backbone is forward and genomic DNA reverse, anchoring read pairs will map to the same strand for each end of the clone. In the case of an inversion in which one but not both of the break points lies within the clone, the strandedness of the anchoring read pairs become discordant between the two fosmid ends (Supplementary Fig. 5). Clone identification Barcode index reads (9 bp) were used to deconvolve individual clone pools from the combined clone-derived reads, allowing for edit distance <=2 between the index read and closest barcode sequence, and requiring that the next closest barcode be >= 2 edits distant. Candidate clone inserts were identified by computing read depth genome-wide in 1-kbp windows for each clone pool and selecting runs of 25 to 45-kbp for which at least two-thirds of the constituent windows had read depth above the predicted background level (the theoretical 95th percentile of read depths if the read positions been randomly drawn from the genome rather than concentrated in clone inserts). Overlapping, independent clones were excluded by requiring at least 2 of 5 windows on each side to have below-background depth. Candidate insert positions were refined by greedily trimming up to 9 windows with below-background read depth, and up to one window with above-background read depth from each side. Overlapping candidates were then resolved by selecting the one maximizing (% of windows inside candidate above background read depth less % of windows above background in the flanking 10 kb). Finally, the resulting clones were trimmed greedily at 1-bp increments until reaching the first mapped read on each side. The resulting 538,009 clone insert positions generally agreed well with vector-genome paired reads, and encompassed 81.6% of the mapping reads across all clone pools. To evaluate uniformity of representation among clones in each pool, the mean read depth within each clone was determined. For pools prepared by scraping plates, 77.9% +/- 5.35% of clones had read depth within one order of magnitude; by the same measure, pools subjected to selection in liquid media without plating were more uniform (94.8% +/- 1.7%, Supplementary Fig. 1). Haploid genotype calling Each clone pool was separately genotyped at all overlapping heterozygous SNPs previously ascertained by shotgun sequencing using GATK UnifiedGenotyper. Clones covering only one heterozygous SNP (n=97846, 18.2%) were not useful for phasing and were excluded. In a small number of cases, SNP positions within a clone were genotyped as heterozygous (n=10079, 1.83%), likely representing clones drawn from different haplotypes and having sufficient overlap to escape detection by read depth. After excluding these clones, the percentage of heterozygous positions matching the genotype of one homologous chromosome or the other (but not both) rose from 99.1% to 99.6%. Haplotype assembly We created a streamlined implementation of HapCUT, an accurate and efficient haplotype assembly algorithm described by Bansal and Bafna12. Briefly, the algorithm constructs graphs having nodes corresponding to variants to be phased and edges corresponding to fragments covering those variants (in our cases, haploid clones), weighted inversely by the strength of evidence supporting the phase of the corresponding variants. After initialization to a random phasing, max-cuts are computed on the graph to find pairs of variants for which the given phasing is incorrect; these are then inverted and the process repeated until a combinatorial objective score is no longer improved. Downsampling To simulate the effects of lower coverage upon phasing accuracy and extent, we down-sampled these data at the clone and read level. To simulate sequencing a smaller number of pools, we randomly selected 10%, 20%, 40%, 60%, and 80% subsets of clones, discarding all reads outside of these subsets of clones. To simulate sequencing a given number of clones to lower total coverage, we randomly selected 10%, 20%, 40%, 60%, and 80% of reads from each of the resulting sets. The simulated reduction in sequencing was compound: for instance, sequencing 40% of clones to 80% depth would consume only
Nature Biotechnology: doi:10.1038/nbt.1740

17
40%*80%=32% the sequencing capacity. For each combination of clone and read down-sampling, four replicate simulations were performed, and heterozygous variants were genotyped within all clones. After assembling haplotypes for each simulation run, we assessed phase block N50, percentage of ascertained variants phased, and phasing accuracy (Supplementary Fig. 7). Assembly block size (as measured by N50) was closely correlated with the overall amount of sequencing, though for an equal overall amount of sequencing, additional clones at lower depth produced longer assemblies than did deeper sequencing of fewer clones. However, accuracy remained high as indicated by agreement with HapMap phase predictions for pairs of SNPs in LD (D’ >= 0.9, >99% agreement for all down-sampled simluations). The proportion of ascertained variants phased declined only modestly for overall down-sampled sequence depth >= 30%. Pan-genome and novel insertion anchoring Whole-genome and clone pool-derived reads from NA20847 that did not align to the human genome reference (GRCh37/hg19) were mapped to so-called “pan genome” contigs13, 14, i.e., novel sequences missing from the human reference genome assembly. For each contig with at least 50 bp covered by reads aligned with phred-scaled mapping qualiy scores >= 20, mean and standard deviation of read depth, percent coverage, and coverage gaps were computed. Of the 16,904 novel sequences, 8,993 were found in NA20847 (Kidd et al..: 1,193/2,363; Li et al..: 7,800/14,330). Two approaches were used to anchor pan-genome contigs to the reference assembly (Supplementary Table 4). First, “one-end anchor” (OEA) read pairs with only one end mapping to the reference and the other to a novel contig were identified among the whole-genome shotgun and clone-derived reads. OEA-based placements were obtained for 1,042 contigs (11.6% overall, 99/1,193 from Kidd et al.., and 943/7,800 from Li et al..), requiring support from at least two reads with anchoring positions within +/- 50kbp. Anchoring accuracy was evaluated by comparing the OEA-based call for the 89 contigs with positions previously determined by Kidd et al.. Among these, the OEA-based anchoring agreed with the known anchoring position (+/- 50-kbp) in 82% of contigs (73/89). OEA-based anchoring is not expected to be effective for contigs located in even modestly duplicated or repetitive sequences given the short insert size of paired-end reads from the Illumina platform (≤ 500-bp). As a second approach, we searched for regions in the reference assembly shared among all pools hitting a novel contig of interest but found in as few as possible of the remaining pools. Specifically, depth of coverage across 500-bp windows tiling the reference genome was determined for each of the 115 clone pools. For each contig, the region(s) in the genome with maximal coverage from all pools hitting that contig was identified, under the constraint of minimizing coverage from the remaining pools (i.e., those not hitting the contig). Contigs present at copy number 2 are expected to be hit on average by ~6 clone pools. Contigs with hits from many more pools (>10) likely represent highly amplified sequences and were discarded, leaving 3,151 contigs. Among these, the following cutoff was applied to find candidate anchoring locations within the reference assembly: F=4 and B≤2, or F=5 and B≤5, or F=6 and B≤10, or 10≥F≥7 and B≤15, where F and B are defined at each window as the number clone pools hitting the reference at that window among those pools that do and do not hit contig being anchored, respectively. After applying this cutoff, 1,733 contigs were anchored (431 from Kidd et al., 1,302 from Li et al.); among the 316 also previously anchored by Kidd et al., these positions were in agreement 72.5% of the time (+/- 50-kbp). To demonstrate that the chosen cutoffs distinguish true anchoring positions from chance overlaps among clone pools, we randomly permuted the read depths among the 115 pools. Shuffling the pools significantly elevated the background scores for the 1,733 anchored contigs (median B=8 compared to median B=3 pre-shuffling, P<2.2x10⁻¹⁶, Wilcoxon rank sum test), with none of the resulting anchoring calls passing the score cutoffs, and none agreeing with Kidd et al. anchoring locations. Combining the clone pool overlap and OEA approaches, a total of 2,744 contigs were anchored (30.5% of total). To define potential novel insertions in NA20847, reads with either end not mapping in hg19 (and neither mapping to E. coli or the pCCFos1 vector backbone) were selected for de novo assembly using Velvet15. Assembled contigs >= 250 bp were again screened for contamination, by BLAT16 alignment to the cloning vector and genomes of E. coli and Epstein-Barr virus (used to immortalize the cells used in this study).
Nature Biotechnology: doi:10.1038/nbt.1740

18
The 14,686 remaining contigs were then aligned to the human reference (hg19), pan-genome contigs of Li et al.. and Kidd et al.., and the NCBI sequence database “htgs”. A majority of these contigs (9,619/14,686) had a high-quality hit to the reference (alignment bit score >= 90% of that for the best hit to htgs or pan-genome contigs) and were excluded from further analysis; these may have resulted from assembly of reads fully anchored in the reference but unmappable on one or both ends due to polymorphism or low-quality bases. Of the remaining contigs, 4,096 had hits (blastn E-value < 10-10, identity > 80%) to contigs in Kidd et al. and Li et al. and/or htgs, while 971 lacked homology to either dataset. Of the 2,241 contigs with hits to htgs or without homology, we obtained clone pool overlap-based anchoring coordinates for 397, including 72 novel contigs (no hits to HTGS) totaling ~31 kbp. To simulate novel insertions in NA20847, clone pool-derived reads were remapped against a reference genome from which 600 randomly-placed regions (250 bp to 25 kbp) had been deleted in silico. Reads were remapped against this reference, and unmapped reads were screened for contamination and de novo assembled as above. The resulting contigs were mapped to hg19 by blastn, and compared to the intervals deleted in the simulation reference. Nearly 75% (440/600) deletions showed partial coverage (>10% of bases per deletion), with overall (per-base) coverage of 60.9% by 5,435 assembled contigs. Anchoring estimates were obtained for 2,184 simulated insertion contigs (40.2%) by clone pool overlap, with locations agreeing with the simulated deletion loci for 1,906 contigs (87.3%). Enrichment of novel variants in GIH-like haplotype blocks Phased blocks in the genome were partitioned into sliding windows of 20 HapMap3 variants, offset by five variants, and the similarity to GIH and CEU allele frequencies was calculated for each haplotype independently. This resulted in 86,993 windows across the genome. A “similarity score” was measured as the sum of the log10 allele frequencies of the ascertained genotypes in each population, respectively. Similarity score S for a given window and haplotype H compared to a given population k, was calculated as the sum of the log10 allele frequency f of allele j in population k, across 20 HapMap3 variants (i=1..20).
In each window, the total number of phased variants as well as the number of novel phased variants (i.e. those not in dbSNP130) was tallied. The similarity scoring was only performed for NA20847, but as a control the variant counts were also calculated in the same ordering of windows for the NA12891 genome, a haplotype-resolved CEU individual (phasing by trio analysis). We then filtered the windows so as to consider only those phased in both datasets (N=37,943), and performed two separate analyses. In the first, we considered the two haplotypes in the same window completely independently, and rank-ordered all haplotype windows (N=173,986) by the difference between the similarity score to GIH HapMap3 frequencies and the similarity score to CEU HapMap3 frequencies. We then summed the number of novel variants and the total number of variants in groups of 1000 windows (N=174 groups). This resulted in a substantial enrichment of novel variants in windows that displayed the largest difference between GIH and CEU similarity scores (Fig. 3a). This strategy allowed us to capture regions of the genome that might be homozygous divergent from CEU, but did not allow us to rule out that we had merely captured regional variation across the genome in similarity to CEU allele frequencies, without actually detecting differences that were maintained on haplotypes. To establish that we were also detecting differences between haplotypes and in effect regions of phased heterozygosity for similarity to CEU, we carried out a similar calculation to the one described above, except that for each haplotype window, we took the absolute value of the difference between differences in similarity scores. We then rank-ordered window-pairs (N=86,993) by the difference of differences of similarity scores, i.e.
and tallied the number of novel variants in the haplotype containing a larger number of novel variants:
as well as the total number of novel variants across both haplotypes, i.e.
Nature Biotechnology: doi:10.1038/nbt.1740

19
After rank-ordering, we summed
and
for groups of 1000 windows (N=87 groups), and then took the ratio. As above, the same tally was performed for NA12891 using the windows from NA20847. There was a clear enrichment of novel SNPs in the homologue of haplotype pairs that were most differentiated with respect to their similarity scores in NA20847 (Fig. 3b), suggesting that we were able to detect regions of heterozygosity with respect to ancestry, with one haplotype similar to CEU allele frequencies, and the haplotype similar to GIH allele frequencies and also enriched for novel variants. Enrichment of novel variants in haplotype blocks that are highly differentiated between NA20847 and 1000 Genomes Pilot 1 populations We calculated the degree of relatedness of the Gujarati-Indian genome (NA20847) to three representative populations (CEU, YRI, CHB+JPT) sampled in the 1000 Genomes Project Pilot 1. As above, we computed a similarity score between each haplotype within phased blocks of NA20847 and each of the three representative populations. The local relatedness score was computed as a sum of log-scaled allele frequencies in each of the representative populations, as above, except that denser SNP markers from the 1000 Genomes Pilot 1 project were used. To focus on markers for which allele frequencies sufficiently differentiate the three populations, we imposed a cutoff based on Fst. We calculated Fst for each population against the other two, and used only SNPs with an Fst of 0.02 or greater in at least one of these pairwise comparisons. Local relatedness scores were computed in sliding windows across each phased block (width=200 SNPs and overlap=100 SNPs). For any given window, if the individual’s alleles match high frequency alleles in a given population at a large number of SNP positions, that window will have a higher (i.e., less negative) score for that population as compared to windows in which the individual’s alleles are rarer in the population under consideration. We used these scores to identify portions of haplotype blocks showing high divergence from the three 1000 Genomes populations, by finding windows where the sum of similarity scores to all three populations was highly negative. We hypothesized that these blocks would be enriched for novel SNPs (not present in dbSNP v130) as compared to windows that are more similar to at least one of the three well-ascertained populations (CEU, YRI and CHB_JPT). Ranking windows by the sum of the three population scores and binning groups of adjacent windows (N=1000) revealed a strong enrichment for novel SNPs from NA20847 among windows highly diverged from CEU+YRI+CHB/JPT (Supplementary Fig. 3). As a control, we repeated the same analysis for the phase-resolved genome of CEU individual NA12891. Only windows which were phase-resolved in NA20847 as well as NA12891 were included in this analysis.
Nature Biotechnology: doi:10.1038/nbt.1740
20
Supplementary references 1. Adey, A. et al. Rapid construction of complex, low-input, low-bias fragment libraries for massively
parallel DNA sequencing by transposase-catalyzed adaptor insertion. Genome Biol (in press). 2. 1000_Genomes_Project_Consortium. A map of human genome variation from population-scale
sequencing. Nature 467, 1061-1073. 3. Lam, H.Y. et al. Nucleotide-resolution analysis of structural variants using BreakSeq and a breakpoint
library. Nat Biotechnol 28, 47-55 (2010). 4. Raymond, C.K. et al. Targeted, haplotype-resolved resequencing of long segments of the human
genome. Genomics 86, 759-766 (2005). 5. Strong, S.J., Ohta, Y., Litman, G.W. & Amemiya, C.T. Marked improvement of PAC and BAC cloning is
achieved using electroelution of pulsed-field gel-separated partial digests of genomic DNA. Nucleic Acids Res 25, 3959-3961 (1997).
6. Li, H. & Durbin, R. Fast and accurate short read alignment with Burrows-Wheeler transform. Bioinformatics 25, 1754-1760 (2009).
7. McKenna, A. et al. The Genome Analysis Toolkit: a MapReduce framework for analyzing next-generation DNA sequencing data. Genome Res 20, 1297-1303 (2010).
8. Hach, F. et al. mrsFAST: a cache-oblivious algorithm for short-read mapping. Nat Methods 7, 576-577 (2010).
9. Sudmant, P.H. et al. Diversity of human copy number variation and multicopy genes. Science 330, 641-646.
10. Hormozdiari, F. et al. Next-generation VariationHunter: combinatorial algorithms for transposon insertion discovery. Bioinformatics 26, i350-357 (2010).
11. Langmead, B., Trapnell, C., Pop, M. & Salzberg, S.L. Ultrafast and memory-efficient alignment of short DNA sequences to the human genome. Genome Biol 10, R25 (2009).
12. Bansal, V. & Bafna, V. HapCUT: an efficient and accurate algorithm for the haplotype assembly problem. Bioinformatics 24, i153-159 (2008).
13. Li, R. et al. Building the sequence map of the human pan-genome. Nat Biotechnol 28, 57-63. 14. Kidd, J.M. et al. Characterization of missing human genome sequences and copy-number polymorphic
insertions. Nat Methods 7, 365-371. 15. Zerbino, D.R. & Birney, E. Velvet: algorithms for de novo short read assembly using de Bruijn graphs.
Genome Res 18, 821-829 (2008). 16. Kent, W.J. BLAT--the BLAST-like alignment tool. Genome Res 12, 656-664 (2002).
Nature Biotechnology: doi:10.1038/nbt.1740