nashington and earth resources - wa
TRANSCRIPT

Ill
u
0
by William S. Lingley, Jr.
NASHINGTON DIVISION OF GEOLOGY
AND EARTH RESOURCES
August 22, 1995
WASHINGTON STATE DEPARTMENTOF
Natural Resources Jennifer M. Belcher- Commissioner of Public Lands Kaleen Cottingham - Supervisor
PETROLEUM POTENTIAL AND PROBABILITY OF RENEWED MINERAL-RIGHTS LEASING IN THE COLUMBIA BASIN, WASHINGTON
William S. Lingley, Jr.
August 1995
1

EXPLANATORY NOTE
During 1994, the U.S. Army condemned various lands in the northwestern Columbia Basin in order to expand the Yakima Firing Range. The Army has offered Washington State $120 dollars per acre for approximately 11,400 acres of surface and mineral estate. (The Army now appraises the mineral rights as having zero value.) The State of Washington rejected the Army's offer and will challenge it in Federal District Court, .Eastern Washington District, later this year (Cause No. CY-94-3113-AAM).
The fo1lowing report was written to satisfy some rules of evidence for federal court. Compilation and interpretation of data and the written report were completed during a two week period in August 1995.
The writer was asked to provide information that would cover the breadth of possible testimony. Consequently, this report was not written as a scientific treatise and no particular effort made to achieve structurally coherent writing nor to explain standard petroleum industry jargon.
This report is included in the Division of Geology and Earth Resources library because it contains data and interpretations that may be of use to some readers. ·
ERRATA
Figures 2, 5, and 7 erroneously show the Bissa 1-29 well as the Bissa 1-22. The reference to Meridian should be as follows:
Meridian Oil, Inc., 1987-1994, 23-35 BN: Washington Division of Geology and Earth Resources Oil and Gas Permit 4~4, 1 file.
August 24, 1995

CONTENTS
Introduction Elements of Conventional Petroleum Accumulations Unconventional Gas Accumulations Historical Perspectives on Cycles of Exploration The Columbia Basin
Impetus for Continued Exploration and Leasing Giant Petroleum Fields Current Low Level of Interest
Source Rocks Columbia Basin Shows and Production Geochemistry of Source Intervals
Thermal History Reservoirs Traps Potential Reserves and Income
Other Assessments Conclusion Acknowledgement
LIST OF FIGURES
Figure 1. Index map showing locations of important Columbia Basin wildcat wells. Figure 2. Topographic map showing northern Columbia Basin landforms. Figure 3. Isopach maps of Paleogene nonmarine strata in the Columbia Basin. Figure 4. A pseudo van Krevelen diagram for Paleogene nonmarine strata. Figure 5. A summary of some maturation and organic fades data. Figure 6. A porosity - depth plot of some Columbia Basin sandstones. Figure 7. An isopach map showing the aggregate thickness of sandstone units. Figure 8. Comparison of areas that would be condemned and Rocky Mtn. gas fields. Figure 9. Major folds and faults in the central and northern Columbia Basin.
LIST OF TABLES
Table 1. Formation and unit tops for northwest Columbia Basin wells. Table 2. Significant shows of petroleum from northern Columbia Basin wells. Table 3. Source-rock analyses of Columbia Basin wells and outcrops. Table 4. Some reservoir properties. Table 5. Comparison of Rocky Mountain oil and gas fields. Table 6. Columbia Basin possible gas-in-place data and assumptions.
2

INTRODUCTION
This rep·ort assesses the probability that petroleum reserves underlie the northwestern Columbia Basin adjacent to the U.S. Armys Yakima Firing Range (Figure 1). Existing data and the history of petroleum exploration in similar "frontier" basins are used to provide information relating to the potential for commercial petroleum accumulations in the Columbia Basin that would, in tum, encourage petroleum companies and others to lease mineral rights. ·
Elements of Conventional Petroleum Accumulations
Conventional petroleum reserves are found in oil and/or gas fields that have the following elements:
(1) A Basin filled with sedimentary rocks. As a general rule, only sedimentary -rocks contain significant sources of gas and oil. Most sedimentary basins produce at least some oil and/ or gas; the larger and deeper the basin, the higher the probability of significant petroleum discoveries.
(2).A Petroleum Source Rock consisting of gas- or oil-prone organic material dispersed throughout the sedimentary rocks. Fossil marine or lacustrine plankton are the most common oil sources, whereas fossil plant fragments in claystones and siltstones are the most common source of non-associated gas.
(3) A Thermal History conducive to generation of petroleum. Normally this means minimum sustained geothermal heat of at least 100 degrees centigrade as measured at the depth of the source rock intervals.
(4) A Reservoir, typically consisting of pores between grains of sand in sandstone. World-class reservoirs generally average about 30 percent porosity. However, gas can be produced at great depth from sandstones having as little as 6 percent porosity.
(5) A Trap consisting of folds and/ or faults together with impermeable strata that limit migration of low-density petroleum from the source to the surface. Petroleum migrates vertically because oil and gas float on the water that fills most porous ·sedimentary rocks.
Each of these five elements and other information relating to the potential for lease and royalty income on State School Trust Lands is discussed in the following sections:
Unconventional Gas Accumulations
There also significant potential for unconventional "basin-centered deep gas" accumulations in the Columbia Basin (Law, 1994). This type of accumulation, which has led to prolific · production in Canada, is more likely to occur in areas with relatively poor reservoir characteristics, such as the deepest parts of the Columbia Basin. Although the elements of this type of gas accumulation are not reviewed in this report, many agree that Law is correct in his assertion that a basin-centered deep gas play is present in the Columbia Basin.
3

121 °
Wenatchee • r0 ~. NORCO N0.1 V
~ BISSA 1-29 -q-
\ 23 .. 35 BN-¢= r- ......
YAKIMA 1-33 MINERALS
.-·- - - -· ,,. ·- -· /
i
-Q- KIRKPATRICK
119° 118°
Columbia R.
'I 117-:, I
I I I
I I
I 48°1
I Spoka~e I
-Q- BASALT EXPLORER : _ 1 I -Q- MOSES LAKE-lA
-Q- QUINCY N0.1
Pendleton•
1-10 DARCaL
Washington
Oregon
. a. Io [ j~ I
47°J
YAKAMA INDIAN RESERVATION
YAKIMA FIRING RANGE
HANFORD RESERVE Scale
50 km
i l I
l i
4S0 J I
! 0 · N o~...J..-,--L-...L.,....--'-3-.-JO mi
Figure 1. Index map showing locations of important northern Columbia Basin wildcat wells and major geographic features. RSH = Rattlesnake Hills. ·
4

ON FOLLOWING PAGE
Figure 2. A topographic map showing landfonns of the northern Columbia Basin and State Trust Lands (orange) located within the Yakima Firing Range Expansion Area (dashed white line). West-northwest trending ridges in the southern portion of the map are coincident with Miocene to Holocene anticlinal and/ or faulted uplifts. Note that most of the State lands lie on top of a major north-trending topographic culmination in Townships 21 and 22 east (Hog Ranch - Naneum Ridge, Campbell, 1989).
5


Historical Perspectives on Cycles of Exploration
Minerals-rights leasing activity is generally proportional to exploration effort. Exploration effort cycles as a function of supply and demand, as well as enthusiasm among oil companies for the prospects of any given basin. Lease values in the Columbia Basin mimic those in other frontier areas; these values fluctuate as a function of time and location and vary between zero and more than $120 per acre. Following an important discovery, or even enticing results from a drillstem test, lease bonuses skyrocket.
The following examples are typical of the relation between elimination of technological obstacles and renewed cycles of exploration.
Prior to 1930, common-depth-point reflection seismic technology had not been invented, and oil fields were discovered by mapping geology at the surface. Leases in areas with unfavorable surficial geology thus had zero value. Following in"".ention of seismic technology, many giant fields were discovered worldwide, including dozens in formerly unproductive basins. For example, offshore Louisiana became a key exploration area as a result of seismic technology. In 1992, the average tract leased there for $472 per acre (Francois, 1993). In the most recent federal auction, mineral rights were leased for between $177 and $365 per acre, reflecting the depressed gas market (Oil and Gas Journal, 1994).
Prior to 1975, ninety-seven dryholes were drilled -in the Idaho-Wyoming Thrust Belt and none had excellent shows. (Drilling down-dip from an oil seep that had been used to lubricate wagons on the Oregon trail yielded nothing.) Reservoir quality was assumed to be poor, and seismic data could not be used to "see" through complex folds and faults. Following improvements in the science of structural geology, seismic data were reinterpreted, and several giant fields were discovered. This area became a focus of onshore exploration in the United States. During the current depressed market, mineral rights in Idaho, a less prospective part of this frontier, have leased for $10 to $25 per acre with $1.00 annual lease rentals (Bill Van Bebber, independent landman, Denver, oral commun., 1995). The lease period is typically five. years.
Prior to 1983, Papua-New Guinea had not produced any oil because seismic data could not "see" through complex folds and faults and the dense hard limestone at the surface. About 20 dryholes had been drilled looking for oil, but no discoveries were made until geologists understood Papua's structure and petroleum geochemistry sufficiently to map potential oil traps. Following improvements in structural geology and seismic data acquisition, several large or giant fields. were discovered and new exploration provinces were "leased" for the first time.
Prior to 1994, more than 1,000 wells had been drilled through the Lodgepole Formation of the Dakotas and Montana without observing significant shows of petroleum. An accidental drillstem test in the Lodgepole Formation led to a major new exploration play. Approximate average lease values in that area are now $200/ acre, and can be as much as $3,000 per acre (Larry Stavert, Team Leader, Rocky Mountain Exploration, Chevron USA, Houston, oral commun., 1995).
7

The current Gulf of Mexico sub-salt play, the San Juan Basin coalbed-methane play, and the Canadian basin-centered-gas play followed similar histories of new technology and/ or good luck leading tp aggressive exploration, leasing, and royalty income.
THE ·co LUMB IA BASIN
The Columbia Basin of central Washington and northern Oregon appears to be among the largest unexplored onshore sedimentary basin in the continental United States (Figures 1, 2, 3). It is larger than most of the petroleum productive basins in the Rocky Mountain states.
In the past, the Columbia Basin received little industry attention owing to a basalt cover ranging from a feather edge to about 15,000 feet in thickness. Deleterious acoustical effects of basalt can render conventional reflection seismic data, the chief tool of explorationists, uninterpretable. However, basalt cover is not an insurmountable obstacle. Similar plateau basalt terrains in Algeria and in the Western Siberian Basin produce petroleum from underlying reservoirs (Benelmouloud and Zhuralev, 1989).
The Columbia River Basalt Group is now known to overlie a thick section of sandstone and shale that contains some good reservoirs and has produced natural gas (Lingley and Walsh, 1986; Walsh and Lingley, 1991; Campbell and Reidel, 1994; Tennyson and Parrish, 1987). The section is composed of the Miocene Columbia River Basalt Group overlying Paleogene nonmarine siliciclastic rocks, which in tum, overlie Mesozoic rocks (Table 1). The last is mostly crystalline basement, but Mesozoic. silidclastic rocks and low-grade metamorphic lithologies crop out adjacent to the northern margin of the basin and could be locally present in the subsurface.
Columbia Basin wells flowed gas at rates that could yield as much as $3,740 per day as calculated using present-day depressed gas values ($0.68 at the Mist Field in August 1995; value from Dick Bowen, Northwest Oil Report, oral commun., 1995). Zones that yielded gas
. on tests of the Yakima Minerals 1-33 and BN 1-9 wells had lower porosity than adjacent zones. It is likely that this gas was trapped by the poor quality of these reservoirs (stratigraphic entrapment). Gas that flowed from the source into adjacent, better-quality reservoirs may have continued to migrate up dip. In that case, larger accumulations may be trapped in higher structural areas nearby.
Drilling data (Shell Oil Co., 1980-1988, 1980-1988, 1980-1991; Shell Western E & P, Inc., 1987-1992; Meridian Oil Co., 1989-1991) and various geophysical studies indicate that a thick sedimentary basin underlies parts of the Columbia River Basalt Group. Campbell (1989) estimates sedimentary strata (Paleogene nonmarine rocks) are about 31,824 feet thick in the Roslyn basin northwest of the Yakima Firing Range.
Figure 3 shows the possible extent and thickness of the Columbia Basin. Gravity and magnetic data suggest the basin is limited on the northwest by an extension of the Ross Lake fault. (This interpretation was suggested to the author by Shell Western E & P, Inc., oral commun., 1987.) The southeastern basin margin may be controlled near the 1-10 Darcell well by a northeast-trending fault that. parallels the Hite fault. Seismic refraction data suggest the deeper part of the basin trends northwest and may be in the form of a graben or rift basin (Catchings and Mooney, 1988).
8

ON FOLLOWING PAGE
Figure 3. Isopach maps showing the possible thicknesses and distributions of Paleogene nonmarine rocks in the Columbia Basin and basins of western Washington (unpublished mapping by W. S. Lingley, Jr. and T.J. Walsh, 1993). Figure 3a shows mostly Eocene strata, and Figure 3b shows upper-most Eocene to Oligocene strata. The Columbia Basin is the area of thicker sediment preservation in the south-central part of the state.
9

I-' 0
\,_
~ ~ c=:.·
C)
% ::a
\ 4-n
~
........
-I'.,
British ColumbiJ
'Tl ..... ()Q C l"1 Cl)
w Q)
\ ,, ' ' ' ' I I
I I
,,l ,'
/' ~u I
I I
I I I
CJ
WASHINGTON DEPARTMENT OF NATURAL RESOURCES Jennifer M. Belcher, Commluloner of Publlc Landi
Olvblon of Geoloay and Earth ltHourcH Raymond LHm&nll, State Oeoloallt
lsochore of Ulatlslan and Narizlan Basin-Fill Stratigraphic Sequences
(Including Volcanogenlc Rocks)
overlying the Crescent Formation
~ II,
~
W. S. Lingley and
T. J. Walsh
1993
EXPI.ANATION
,-S,111- l1uh•nt c•MIMN' UM, la fHt
~ OU o"4 po -a. 14,y hl .. l
TMcli.A•U nlt.l•t•41 fr•• ,eo,.plcal ,tvdl••
...-" ........... , .. u, .. ,
,.,.uae co"'"' ktt.N'nl • s,ooa PHt
Oregon A ~
0 40 MILES

I-' I-'
~ ~. ~
~ ::i
~,. >Tj ....
()Q C I"! Cl)
w c::r
Brit/sf, Columbia
~ ..
WASHINGTON DEPARTMENT OF NATURAL RESOURCES Jennifer M. Belcher, Commluloner of Public Landt
OreKon
Division of Geolo1Y and Earth luourcH Raymond l11man1,, State Ceolo1ht
lsochore of Refuglan and Zemorrlan Basin-Fill Stratigraphic Sequences
(Including Volcanogenic Rocks)
~ ~ ~
W. S. Lingley and
T. J. Walsh
, 1993
fXl'lANATION
_, .... ____ ..._ ...... ~ OM u4 1u wol t ltiry ~•1•11
• Thld11•H etd•ate4 tr.a 1tophy,ilcel ttrH1et
,....... ...... ..,., .. , .....
,.,., •• , c .... ur IIKlfnl • J,SOO Plot
0
A ~
MILES -40
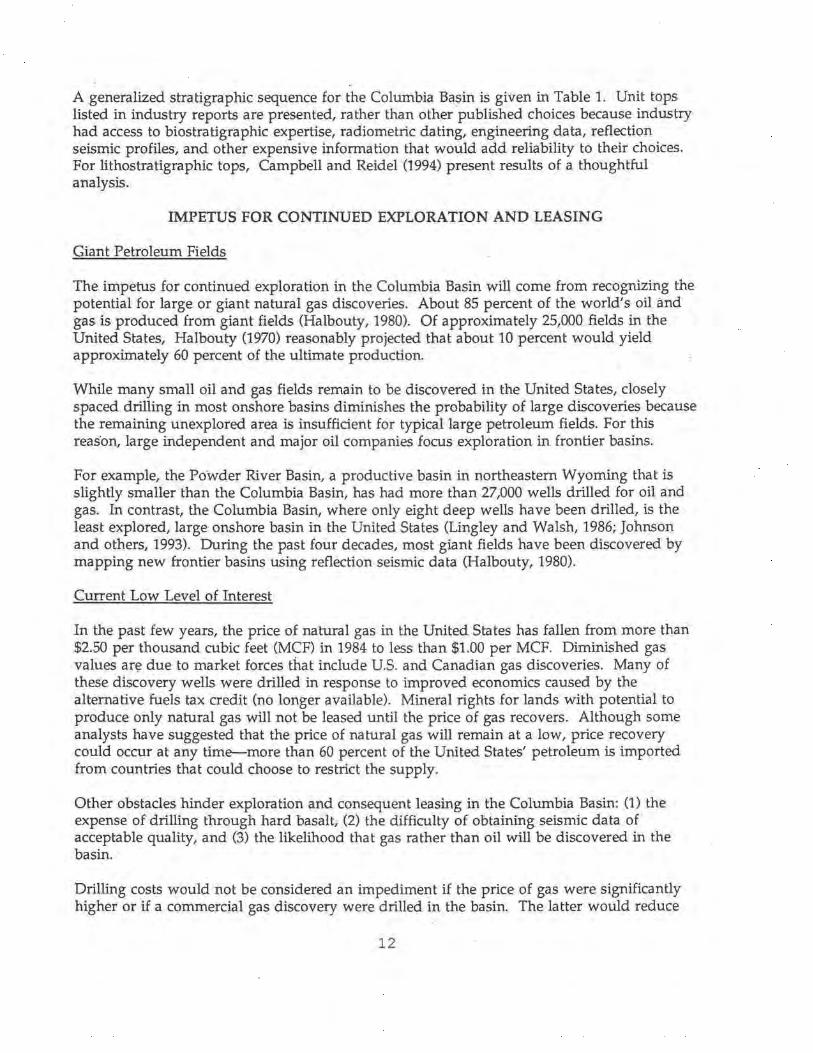
A generalized stratigraphic sequence for the Columbia Ba~in is given in Table 1. Unit tops listed in industry reports are presented, rather than other published choices because industry had access to biostratigraphic expertise, radiometric dating, engineering data, reflection seismic profiles, and other expensive info~ation that would add reliability to their choices. For lithostratigraphic tops, Campbell and Reidel (1994) present results of a thoughtful analysis.
IMPETUS FOR CONTINUED EXPLORATION AND LEASING
Giant Petroleum Fields
The impetus for continued exploration in the Columbia Basin will come from recognizing the potential for large or giant natural gas discoveries. About 85 percent of the world's oil and gas is produced from giant fields (Halbouty, 1980). Of approximately 25,000 fields in the United States, Halbouty (1970) reasonably projected that about 10 percent would yield approximately 60 percent of the ultimate production.
While many small oil and gas fields remain to be discovered in the United States, closely spaced drilling in most onshore basins diminishes the probability of large discoveries because the remaining unexplored area is insufficient for typical large petroleum fields. For this reas·on, large independent and major oil companies focus exploration in frontier basins.
For example, the Po'wder River Basin, a productive basin in northeastern Wyoming that is slightly smaller than the Columbia Basin, has had more than 27,000 wells drilled for oil and gas. In contrast, the Columbia Basin, where only eight deep wells have been drilled, is the least explored, large onshore basin in the United States (Lingley and Walsh, 1986; Johnson and others, 1993). During the past four decades, most giant fields have been discovered by mapping new frontier basins using reflection seismic data (Halbouty, 1980).
Current Low Level of Interest
In the past few years, the price of natural gas in the United States has fallen from more than $2.50 per thousand cubic feet (MCF) in 1984 to less than $1.00 per MCF. Diminished gas values ar~ due to market forces that include U.S. and Canadian gas discoveries. Many of these discovery wells were drilled in response to improved economics caused by the alternative fuels tax credit (no longer available). Mineral rights for lands with potential to produce only natural gas will not be leased until the price of gas recovers. Although some analysts have suggested that the price of natural gas will remain at a low, price recovery could occur at any time-more than 60 percent of the United States' petroleum is imported from countries that could choose to restrict the supply.
Other obstacles hinder exploration and consequent leasing in the Columbia Basin: (1) the expense of drilling through hard basalt; (2) the difficulty of obtaining seismic data of acceptable quality, and (3) the likelihood that gas rather than oil will be discovered in the basin.
Drilling costs would not be considered an impediment if the price of gas were significantly higher or if a commercial gas discovery were drilled in the basin. The latter would reduce
12

TABLE 1. Formation and unit tops for northwestern Columbia Basin wells that penetrated Paleogene nonmarine rocks underlying the Columbia River Basalt Group.
WELL GEOLOGIC UNIT
Quincy No. 1 (Shell Western E & P, Inc., 1987-1992)
Wanapum Basalt Grande Ronde Basalt Paleogene nonmarine
Eocene (Swauk Fm.)1
coal-bearing interval Basement (schist) Total depth ·
23-35 BN [Boylston Mountain well] (Meridian Oil, Inc., 1989-1991)
Columbia River Basalt Group Paleogene nonmarine
Oligocene Eocene (Roslyn Fm.) coal-bearing interval Teanaway Basalt
Total depth
BN 1-9 [Saddle Mountains well) (Shell Western E & P, Inc., 1980-1991)
Saddle Mountains Basalt Wanapum Basalt Grande Ronde Basalt Paleogene nonmarine
Oligocene Eocene (Chumstick Fm.) coal-bearing interval 2nd coal interval
Total depth
Bissa 1-29 [Whiskey Dick well] (Shell Oil Co., 1980-1988)
Columbia River Basalt Group Paleogene nonmarine
Eocene coal-bearing interval
Basement ? (granitic mega-conglomerate?) Total depth
TOP (feet)
144 940 7,547 7,547 10,017 12,781 13,200
0 6,658 6,658 8,970 9,110 12,347 12,584
0 210 1,087 12,800 12,800 12,800 11,994 15,114 17,518
0 4,512 4,512 4,626 14,900, 14,965
THICKNESS (feet)
796 6,607 5,234 5,234 533
6,658 >5,926 2,312 3,614 436 ?
210 877 11,713 4,718 2,000 4,718 276 694
4,512 10,388 ? 2,2682
?
Yakima Minerals 1-33 [Rosa Dam well] (Campbell and Reidel, 1994 !approximate depths))
Columbia River Basalt Group Paleogene nonmarine
Oligocene Eocene
Total depth
0 4,926 4,926 9,700 16,199
1. Campbell and Reidel (1994) report a thick Oligocene section in this well.
4,926 11,273 4,774 6,499
2. Coal thicknesses in Bissa 1-29 suspect owing to severe cavings that contaminated the ditch cuttings.
13

the uncertainty of prospects in the bas!n and thereby improve the economics of wildcat drilling. The normal pattern of basin development is cyclical leasing that peaks each time a new idea or technological breakthrough occurs.
Acquisition of interpretable seismic data in basalt has been particularly difficult because of low signal-to-noise ratios and because of poor coupling between the seismic signal receivers and basalt outcrops. Complex faulting in the vicinity of the Yakima Firing Range (Tolan and Reidel, 1989; Price and Watkinson, 1989; Reidel, 1984; Reidel and Campbell, 1989; Campbell, 1989) also diminishes the quality of seismic records. (However, this complexity may be an advantage because complex faulting generally results in numerous potential petroleum traps.)
It may now be possible to acquire seismic data of reasonable quality in the Columbia Basin. A technological innovation (Jarchow and others, 1991, 1994) now allows geophysicists to locate the base of the basalt accurately and at low cost. Such seismic data could be used to produce a regional map of the base of the Columbia River Basalt Group. This map could be integrated electronically with data from other geophysical tools in order to produce prospectscale mapping. Withers and others (1994) used a similar integration technique to produce accurate prospect-scale maps below the basalt in the southern part of the Columbia Basin.
In the past, the high probability of gas (as opposed to oil) discoveries in the basin also discouraged exploration. Traditionally gas has a soft market because of high transportation costs. Gas pipeline construction can cost $40 per linear foot. However, environmental emphasis on gas as a non-polluting fuel, together with a shortage of domestic oil will strengthen gas markets in the near future. Even if other fuel sources are developed, gas will continue to be an important petrochemical feedstock. For example, production of some fertilizers requires large amounts of natural gas.
SOURCE ROCKS
Columbia Basin Shows and Production
The clearest indications that petroleum source rocks are present in any given sedimentary . basin is oil or gas seeps at the ground surface and petroleum tested or produced from wells.
The Columbia Basin has both (Table 2).
Gas-prone source rocks are evidently present in abundance in the basin. Gas shows are so common that almost all of the sandstone reservoirs in the Paleogene nonmarine section have at least some gas saturation.
A small gas field, located in a subsidiary fold on the north flank of the Rattlesnake Hills anticline, lies south of the Yakima Firing Range (Figure 1). It produced 1.3 billion cubic feet of natural gas before it was abandoned in 1941 (Hammer, 1934; McFarland, 1983). Thi? field is unique in that gas was produced from the Columbia River Basalt Group. A similar but non-commercial gas accumulation appears to be trapped in part by the Cold Creek fault (Johnson and others, 1993). Johnson and others' delta 13C isotopic ratios, together with the projected thickness of basalt (estimated from Grande Ronde data given in Reidel and others, 1989) suggest that both gas accumulations were generated from a deep source. The source may have been a basin-centered-gas system, coals between basalt flows, or the Paleogene. nonmarine section. If the latter is correct, part of the gas may have migrated upward along faults through at least 13,000 feet of basalt.
14

The Yakima Minerals 1-33 well tested 500 thousand cubic feet of gas per day (MCFGPD) and the BN 1-9 well tested 5,500 MCFGPD (Table 2). If these rates could have been sustained, both may have been completed as discovery wells. Southeast and southwest dips recorded on dipmeter log interpretations from the BN 1-9 and Yakima Minerals 1-33 wells, respectively, suggest that neither well was drilled on a structural apex. (See notes on Table 4.) Therefore, it is possible that gas accumulations are trapped updip from these wells.
Completion of discovery wells drilled in close proximity to dryholes is a common occurrence in the petroleum industry. The Anoa field in Indonesia, for example, produced oil within a few hundred feet of a down-dip dryhole. Gulf Oil Companies discovery well 1.5 miles updip from an abandoned AGIP Oil Company dryhole and to drill the SO-million barrel discovery. Another example is the Mist Gas Field of northwestern Oregon, which has produced more than 50 billion cubic feet of gas (BCF) from a 100-acre fault trap within a . larger anticline (Olmstead, 1985). A dryhole had been drilled on the anticline prior to the discovery well. The discovery well was initially abandoned, but it was re-entered and whipstocked to reach the updip gas pool located only a few linear feet from the vertical portion of the hole.
Geochemistry of Source Intervals
Table 3 and Figure 4 summarize some geochemical characteristics of these rocks as determined from analyses of samples from four wells (Core Laboratories, Inc., 1987a,b; Lingley and Walsh, 1986; Lingley and von der Dick, 1991; Walsh and Lingley, 1991). (Also see Brown and Ruth Laboratories, Inc., 1984; Sidle and Richers, 1985; U.S. Dept. of Energy, 1985.)
New geochemical data (Core Laboratories, Inc., 1987a, b) summarized in Table 3 confirm that both the Yakima Minerals 1-33 and the Bissa 1-29 penetrated thick sections of good-quality gas-prone source rocks. In the Bissa well, a continuous 1,980-foot-thick section averages 4.2 percent total organic carbon (TOC). Pyrolysis data for this section indicate that these rocks are thermally mature and have moderate to good gas-generative potential (Table 3). The Yakima Minerals 1-33 well has a continuous 1,230-foot-thick section favorable for gas generation; TOC averages 2.63 percent with some favorable~ and S2 values. Although the source interval in the Yakima Minerals well is not as rich or thick as in the Bissa well, it is at slightly greater depth, and consequently it has generated more gas (mean ~ = 0.69). A pseudo van Krevelen diagram (Figure 4) shows that these proven source rocks are gas prone and that traces of exinitic and/ or liptinitic macerals are also present (hydrogen indices [HI] >200). These Type II kerogens probably generated the paraffinic condensate (37 to 52 degrees AF'.I gravity) tested in the BN 1-9 well. These rocks have mostly woody and amorphous material that would reach peak generative potential at vitrinite reflectance values of about 0.8 (Peters, 1986).
No information is available to link shows with corresponding source rocks. Hydrous pyrolysis of Type II coals and adjacent shales penetrated in a well drilled in western Washington indicates that both shales and coals have potential to generate light hydrocarbons.
Graben-fill sequences along the margins of the Columbia Basin (Table 3; Gaylord, 1986) also have limited gas-generative potential. However, these rocks are mostly super-mature and impoverished.
15

TABLE 2. Significant shows of petroleum from northern Columbia Basin wells. ·
Quincy No. 1 (Shell Western E & P, Inc., 1987-1992)
Perforations from 8,765 to 8,915 ft and 8,779 to 8,886 ft produced gas TSTM and 500 BW.
23-35 BN [Boylston Mountain well) (Meridian Oil, Inc., 1989-1991)
Drillstem test from 11,919 to 12,584 ft. No data reported. Abundant cutting gas shows throughout the Paleogene nonmarine section.
BN 1-9 [Saddle Mountains well) (Shell Western E & P, Inc., 1980-1991)
12 gas zones reported. 4 production tests. Acidized and fraced perforations from 12,694 to 12,699 ft produced 2.4 MMCFGPD and 134 BWPD with 985 psi FTP on 20/64-inch choke. A test through casing from 13,372 to 13,388 ft. produced 3.1 MMCFGPD and 6 BCPD with 3,965 FTP on 10/64-inch choke.
Bissa 1-29 [Whiskey Dick well] (Shell Oil Co., 1980-1988)
Acidized perforations from 10,314 to 10,898 ft, 9,436 to 9,830 ft, and 8,486 to 8,800 ft flowed gas TSTM.
Yakima Minerals 1-33 (Rosa Dam well) (Shell Oil Co., 1980-1988)
Acidized perforations from 15,466 to 15,540 ft recovered small amounts of gas. Perforations from 12,976 to 13,568 flowed 570 MCFGPD and 5,400 BWPD with 3,250 psi FTP on 24/64-inch choke. Fractured and acidized perforations from 12,450 to 12,460 ft and 12,350 to 12,360 ft flowed 500 MCFGPD. Acidized perforations from 11,676 to 11,686 ft, 11,564 to 11,574 ft, and 11,598 to 11,652 ft flowed gas at 85 MCFGPD. Perforations from 10,604 to 10,930 flowed 10 MCFGPD. Perforations from 7,535 to 8,040 ft flowed 1,700 BWPD and 27 MCFGPD.
Norco No. 1 (Wenatchee well] (McFarland, 1983)
Gas shows reported.
Rattlesnake Hi1ls Gas Field (Hammer, 1934)
Produced 1.3 BCF gas from 16 wells producing between 700 and 1,200 ft at 7 psi FTP. Gas was piped to Yakima for sales.
Water wells (Johnson and others, 1993)
19 water wells located between Yakima and Pasco have tested thermogenic gas and several have had degassing equipment installed.
16

I 700
II 600
•
• • 200
• 100 • • • • • m • • •
0 50 100 150 200 250 300 350
Oxygen indices
Figure 4. A pseudo val) I<revelen diagram for Paleogene nonmarine strata penetrated in the Yakima Minerals 1-33 and Bissa 1-29 wells (Core Laboratories, Inc., 1987a, b). Both wells have an abundance of gas-prone source rocks (fype III kerogen) with traces of Type II kerogen (light-liquids- and gas-prone).
Although gas and· gas-condensate shows have been recorded throughout the Paleogene nonmarine seqion, no oil shows have been observed. Much of the sedimentary section in the basin lies within the oil-generative thermal window (Table 3, Figure 5). Therefore, it can be inferred that if areally extensive oil-prone source rocks were present in the basin, oil shows should have been observed. However, the possibility of an oil discovery cannot be ruled out at this time because so few holes have penetrated the Paleogene nonmarine section.
In summary, the area of the Firing Range Expansion overlies a thick section of proven gasprone source rocks that are of moderate to good quality. Data from the Bissa and Yakima Minerals wells indicate that the area of State Trust Lands north of the Firing Range may have thicker source intervals than areas located farther south. Gas tested in the BN 1-9 confirms that this well is also located over a good gas source.
THERMAL HISTORY
Blackwell and others (1985) show that Columbia Basin geothermal gradients range from 28 to 58 degrees centigrade per kilometer (Figure 5). Lingley and Walsh (1986) used wireline log and drillstem test data from the northwestern. Columbia basin wells to show that typical geothermal gradients are + /-40°C/kilometer. Such gradients are optimally conducive to generation and preservation 9fpetroleum. They suggest that the onset of gas generation should occur at about 7,000 feet.
Vitrinite reflectance (Ro) values from all of the Columbia Basin wells range from 0.5 to 1.3 demonstrating that the entire sub-basalt section drilled to date is.thermally mature for gas generation. Figure 5 shows depths to Ro = 0.5, the value corresponding to the onset of peak gas generation from woody amorphous kerogen.
17

ON FOLLOWING PAGE
Figure 5. A summary of some northwestern Columbia Basin maturation and organic facies data. Green contours shows approximate depths to vitrinite reflectance = 0.5 (after Walsh and Lingley, 1991). Red contours show approximate geothermal gradients in degrees centigrade per kilometer (from Blackwell and others, 1985). The numbers in parentheses give the thicknesses of sections with some bedded coal and are indicative of reducing environments favorable to carbon preservation. Numbers beside the Yakima Minerals 1-33 and Bissa _1-29 indicate sections having continuous TOC values greater than 0.80 (Core Laboratories, Inc., 1987a,b).
18

24N
q-< 23N
\\J
22N
21N
20N
18N
17N
16N
15N
' \.
. .
20E
35
23E 24E
r ~~ -<>- ':' . -
/ Qui cy No.1 '. (533) /fr
25E
--- .
' 26E

:lble 3. Source-rock analyses of Columbia Basin wells and outcrops (Core Laboratories, Inc., 1987a,b; Lingley and von der Dick, 1991).
from to TOC HI 01 Sl S2 S3 Tmax Ro Depth Depth
ierren Fm-1 4.80 0.70
Jissa 1-29
4800 4830 0.00 97 432
4900 4910 0.52 108 426
5250 5280 1.15 143 434
5410 5430 0.60 80 435
5580 5610 0.63 130 430
5700 5730 0.57 61 441
5790 5820 0.58 45 454
5880 5910 0.59 47 441
5970 6000 1.00 99 . 431
6060 6090 1.20 159 433
6150 6180 5.15 226 425
6240 6270 9.67 181 424
6330 6360 3.94 193 426 0.66
6420 6450 5.87 175 428
6510 6540 4.14 153 430
6600 6630 4.96 159 428
6690 6720 3.44 87 434
6780 6810 16.08 193 425
6870 6900 17.17 215 421
6960 6990 0.96 88 431
7050 7080 1.44 115 430
7140 7170 2.57 143 431
7230 7260 1.96 157 432 0.61
7320 7350 0.98 123 432
7590 7620 1.61 145 432
7680 7710 0.85 91 86 0.10 0.77 0.73 435 0.65
7770 7800 0.98 144 72 0.12 1.41 0.71 434
7860 7890 1.09 144 39 0.10 1.57 0.43 435
7920 7950 3.26 284 38 0.29 9.25 1.25 433
7950 7980 0.52 90 106 0.05 0.47 0.55 435
8040 8070 0.53 106 98 0.07 0.56 0.52 434
20 ·

Depth Depth TOC HI OI Sl S2 S3 Tmax Ro
8130 8160 0.90 124 84 0.11 1.12 0.76 433 0.68
8310 8340 0.50 102 100 0.07 0.51 0.50 435
8410 8430 0.63 111 92 0.11 0.70 0.58 433
8460 8490 2.71 259 69 0.28 7.01 1.88 434
8580 8610 1.56 134 64 0.14 2.09 1.00 434 0.63
8970 9000 3.30 . 25 19 0.19 0.84 0.63 438
9540 9570 0.79 66 68 0.10 0.52 ·0.54 437
11370 11400 0.56 114 46 0.09 0.64 0.26 448
11940 11970 0.58 447 55 0.48 2.59 0.32 456
13080 13110 0.83 99 39 0.28 0.82 0.32 463
13140 13170 3.71 85 35 0.71 3.14 1.31 455
13530 13560 0.55 85 36 0.20 0.47 0.20 468
13680 13710 1.72 84 26 0.55 1.45 0.45 455
13710 13740 1.10 64 184 0.29 0.70 2.02 458
13800 13830 1.15 41 82 0.16 0.47 0.94
13890 13920 1.40 50 98 0.21 0.70 1.37 459
13980 14010 1.55 59 62 0.31 0.91 0.96 467 1.12
14070 14100 1.44 30 58 0.20 0.43 0.84
14160 14190 1.15 56 53 0.25 0.64 0.61 ~62
14250 14280 0.93 54 15 0.22 0.50 0.14 465
14340 14370 0.81 44 46 0.21 0.36 0.37 472
14430 14460 1.12 83 109 0.29 0.93 1.22 448 1.16
14520 14550 0.79 41 15 0.14 0.32 0.12
14610 14640 1.00 59 48 0.22 0.59 0.48 470
14700 14730 1.24 46 65 0.24 0.57. 0.80 486
14790 14820 1.18 54 75 0.26 0.64 0.88 471
14890 14910 1.16 60 79 0.33 0.70 0.92 469
14110 14111 1.20 59 0.30 0.70 453
14360 14361 0.50 53 0.10 0.30 466
14860 14861 1.40 45 0.30 0.60 459
13610 13611 0.80 64 0.10 0.50 459
14360 14361 0.90 74 0.30 0.70 453
13760 13761 1.30 64 0.20 0.80 464
21

Depth Depth TOC HI 01 Sl S2 S3 Tmax Ro
13610 13611 0.80 60 0.10 0.50 457
13760 13761 1.30 65 0.20 0.80 458
14860 14861 · 1.30 40 0.30 0.50 464
14110 14111 1.10 63 0.20 0.70 455
(akima Minerals
4980 5010 0.58 55 229 0.06 0.32 1.33 432
6600 6630 0.61 164 551 1.05 1.00 3.36 . 432
8670 8700 0.62 53 284 0.22 0.33 1.76 432
9840 9870 1.02 67 110 0.15 0.68 1.12 467
10020 10050 1.06 99 91 0.32 1.05 0.96 460
10110 10140 1.37 137 78 0.48 1.88 1.07 455 1.02
10200 10230 3.26 148 180 2.20 4.84 5.86 451
10290 10320 7.47 134 28 1.88 10.00 2.11 459
10380 10410 7.50 138 18 1.86 10.33 1.32 461
10470 10500 2.02 85 72 0.36 1.72 1.46 461
10560 10590 1.65 79 126 0.34 1.31 2.08 463 1.19
10650 10680 0.89 74 85 0.20 0.66 0.76 475
10750 10770 0.81 78 110 0.18 0.63 0.89 472
10920 10950 1.22 57 65 0.20 0.70 0.79 490
11010 11040 3.51 60 27 0.40 2.12 0.94 474 1.33
11040 11070 2.47 68 28 0.38 1.67 0.70 477
11100 11130 0.63 51 148 0.15 0.32 0.93 485
11190 11220 0.69 59 80 0.16 0.41 0.55 485
11310 11340 2.05 72 21 0.38 1.48 0.44 474
11370 11400 0.82 66 43 0.17 0.54 0.35 480
11460 11490 0.81 80 119 0.23 0.65 0.96 459 1.22
11650 11670 0.56 86 138 0.21 0.48 0.77 476
11730 11760 0.53 136 775 0.27 0.72 4.11 476
11820 11850 1.22 44 130 0.11 0.54 1.58 501
11910 11940 1.32 67 89 0.27 0.89 1.18 492 1.43
12000 12030 1.28 59 51 0.24 0.76 0.65 483
12100 12120 0.74 76 309 0.38 0.56 2.29 482
12270 12300 0.73 52 125 0.15 0.38 0.91 482
22

Depth Depth TOC HI OI Sl S2 S3 Tmax Ro
13260 13290 0.71 104 207 050 0.74 1.47 482
13980 14010 1.42 23 58 0.41 0.32 0.83 482
14040 14070 0.61 23 100 0.23 0.14 0.61 482
14340 14370 0.53 28 74 0.25 0.15 0.39 482
14430 14'460 0.74 35 91 0.33 0.26 0.67 482
14520 14550 0.89 78 663 0.21 0.69 5.90 482
14610 14640 0.99 26 249 0.21 0.26 2.47 482
14700 14730 0.90 70 173 0.38 0.63 1.56 482
14790 14820 1.23 63 185 0.26 0.77 2.28 482
15390 15420 0.69 20 122 0.20 0.14 0.84 482
15420 15450 0.77 36 151 0.28 0.28 1.16 482 ·
15540 15570 0.83 25 119 0.21 0.21 0.99 482
15690 15720 1.38 49 195 0.34 0.67 2.69 482
16140 16170 0.85 13 38 0.36 0.11 0.32 482
~EANS 9255 116 0 1.21 1.17
/irginia Ridge Fm2 0
0.05 0.00 0.00 0
0.11 0.00 0.00 0
0.18 0.00 0.00 0
0.05 0.00 0.00 0
0.13 0.30 0.00 0
0.10 0.00 0.00 0
0.05 0.00 0.00 0
0.12 0.01 0.02 277
0.08 0.28 0.08 294
0.18 0.02 0.05 277
0.06 0.00 0.01 257
0.13 0.28 0.01 252
0.19 0.01 O.Q3 270
0.00 0.02 0.04 486
0.00 0.02 0.03 481
0.16 O.Dl 0.02 296
0.17 0.01 0.00 0
23

Depth Depth TOC HI OI Sl S2 S3
0.19 O.Ql 0.01
0.22 0.02 0.10
0.19 0.03 0.08
0.13 0.04 0.02
:farts Pass Fm2
0.12 0.00 0.00
0.17 0.00 0.00
0.12 0.00 0.00
0.02 0.00 0.00
0.13 0.00 0.00
0.23 0.00 0.00
0.13 0.00 0.00
0.14 0.01 0.02
0.11 0.00 O.Ql
A sample from the Herren Fm. of northern Oregon, which is equivalent to the Paleogene nonmarine :etion (Fritts and Fisk, 1985) is included for comparison. Characteristics of some Mesozoic siliciclastic rocks are included because these rocks could subcrop in
uts of the basin.
24
Tmax Ro
323
479
296
332
0
0
0
0
0
0
0
277
277

RESERVOIRS
Reservoir data for wells drilled near the Yakima Firing Range are summarized on Figures 6 and 7 and Table 4. This table lists only moderate to good quality reservoirs, those reservoirs with 10 percent or greater porosity and that are thicker than 10 feet. Comparison with porosity data from several large Rocky Mountain oil fields (Table 5, Figure 8) confirms that such reservoirs are adequate to contain large to giant petroleum reserves. Note, however, that natural gas production can be achieved from lower quality reservoirs, especially if those reservoirs are at great depth. (Deeper reservoirs store more gas per unit volume and generally produce the gas at faster rates.) The BN 1-9, for ·example, produced a remarkable 3,100 MCF of gas from a zone with only 7 percent average porosity (Shell Western E & P, Inc., 1984-1991).
Lingley and Walsh (1986) determined that mean sandstone porosity in the Columbia Basin, expressed as a percentage of the bulk volume of the rock, is 18 percent at 6,000 feet drilled-depth. Mean sandstone porosity is reduced to 8 percent at 14,000 feet, regardless of the age or composition of the sandstone present at this depth. New data from the 23-35 BN and Quincy No. 1 wells support their findings (Fig. 6).
Both the average porosity and average thickness of reservoir sandstones in the Columbia Basin are good, and comparable to typical Rocky Mountain sandstone reservoirs. The average porosity of thick Paleogene nonmarine sandstones penetrated above 11,000 feet in. the Columbia Basin is about 15 percent (Fig. 6). Table 4 s~ows that the average thickness of sandstone reservoirs logged in the northwestern Columbia Basin wells with greater than 10 percent porosity is 25 feet. Sandstones having continuous porosity in excess of 30 feet are common.
The aggregate thickness of moderate- to good-quality reservoirs is shown on Figure 7. Net porous sandstone in the Yakima Firing Range Expansion Area ranges from 250 to 400 feet. Farther east and southeast, the sandstones are at greater depth owing to greater thickness of overlying basalt. If the Quincy No. 1 results are representative, then there is less sandstone northeast of the Expansion Area.
Clay volume (Vclay) and the percentage of volcanogenic detritus affect reservoir quality in the Columbia Basin. Studies of outcrop data and ditch samples (Campbell, 1989) suggest areas southwest of the Firing Range are dominated by clay-rich vokaniclastic rocks of the Naches subbasin. Sandstones deposited farther north and east are dominated by more favorable quartz- and feldspathic-arenites.
Therefore, State School Trust Lands appear to be in an optimal position between reservoirs of .higher average porosity, greater total reservoir thickness, and less detrimental clay or volcanogenic rock.
25
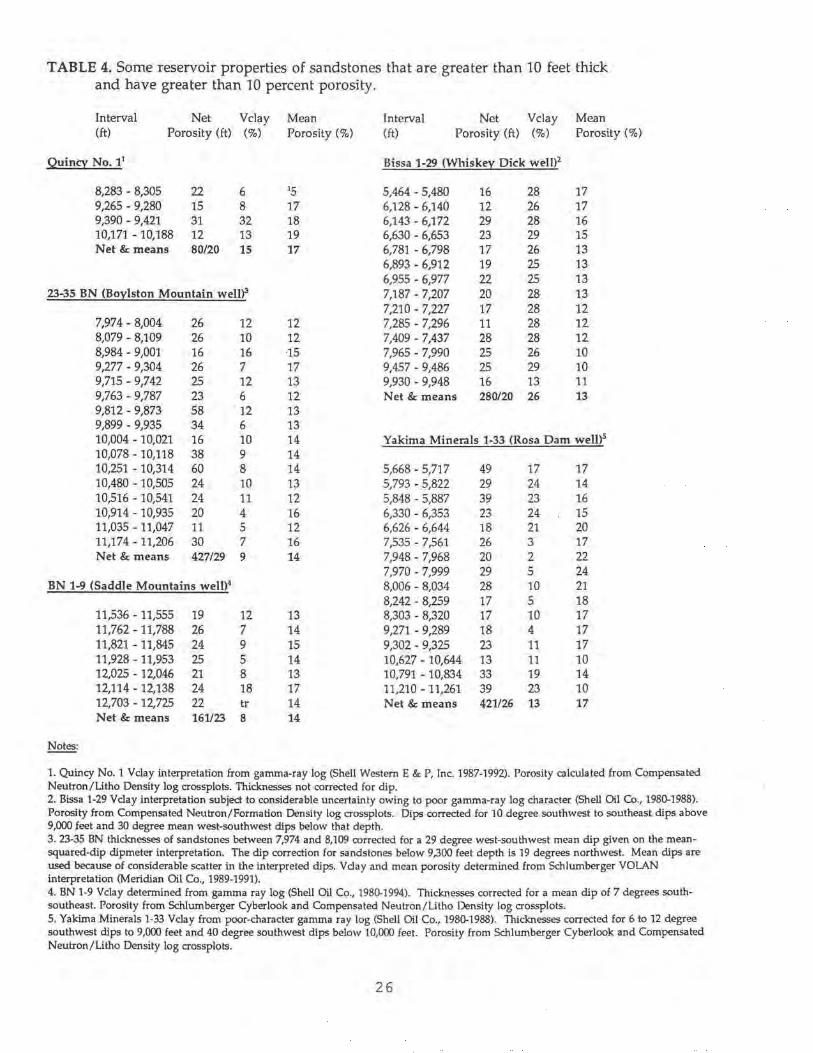
TABLE 4. Some reservoir properties of sandstones that are greater than 10 feet thick and have greater than 10 percent porosity.
Net Vclay Interval (ft) Porosity (ft) (%)
Quin9'. No. 11
8,283 - 8,305 22 6 9,265 - 9,280 15 8 9,390 - 9,421 31 32 10,171 - 10,188 12 13 Net & means 80/20 15
23-35 BN (Boylston Mountain well>3
7,974 - 8,004 26 12 8,079 - 8,109 26 10 8,984 - 9,001 16 16 9,277 - 9,304 26 7 9,715 - 9,742 25 12 9,763 - 9,787 23 6 9,812 - 9,873 58 12 9,899 - 9,935 34 6 10,004 - 10,021 16 10 10,078 - 10,118 38 9 10,251 - 10,314 60 8 10,480 - 10,505 24 10 10,516 - 10,541 24 11 10,914 - 10,935 20 4 11,035 - 11,047 11 5 11,174 -11,206 30 7 Net & means 427/29 9
BN 1-9 (Saddle Mountains well)4
11,536 - 11,555 19 12 11,762 - 11,788 26 7 11,821 - 11,845 24 9 11,928 - 11,953 25 5 12,025 - 12,046 21 8 12,114 - 12,138 24 18 12,703 - 12,725 22 tr Net & means 161/23 8
Notes:
Mean Porosity (%)
15 17 18 19 17
12 12 ·15 17 13 12 13 13 14 14 14 13 12 16 12 16 14
13 14 15 14 13 17 14 14
Net Vclay Interval (ft) Porosity (ft) (%)
Bissa 1-29 (Whiskey Dick well)2
5,464 - 5,480 16 28 6,128 - 6,140 12 26 6,143 - 6,172 29 28 6,630 - 6,653 23 29 6,781 - 6,798 17 26 6,893 - 6,912 19 25 6,955 - 6,977 22 25 7,187 - 7,207 20 28 7,210 - 7,227 17 28 7,285 - 7,296 11 28 7,409 - 7,437 28 28 7,965 - 7,990 25 26 9,457 - 9,486 25 29 9,930 - 9,948 16 13 Net & means 280/20 26
Mean Porosity (%)
17 17 16 15 13 13 13 13 12 12 12 10 10 11 13
Yakima Minerals 1-33 (Rosa Dam well)5
5,668 - 5,717 49 17 17 5,793 - 5,822 29 24 14 5,848 - 5,887 39 23 16 6,330 - 6,353 23 24 15 6,626 - 6,644 18 21 20 7,535 - 7,561 26 3 17 7,948 - 7,968 20 2 22 7,970 - 7,999 29 5 24 8,006 - 8,034 28 10 21 8,242 - 8,259 17 5 18 8,303 - 8,320 17 10 17 9,271 - 9,289 18 4 17 9,302 - 9,325 23 11 17 10,627 - 10,644 13 11 10 10,791 - 10,834 33 19 14 11,210 - 11,261 39 23 10 Net & means 421/26 13 17
1. Quincy No. 1 Vclay interpretation from g;imma-ray log (Shell Western E & P, Inc. 1987-1992). Porosity calculated from Compensated Neutron/Lltho De.nsity log crossplots. Thicknesses not corrected for dip. 2. Bissa 1-29 Vclay interpretation subject to considerable uncertainty owing to poor gamma-ray log character (Shell Oil Co., 1980-1988). Porosity from Compensated Neutron/Formation Density log crossplots. Dips corrected for 10 degree southwest to southeast dips above 9,000 feet and 30 degree mean west-southwest dips below that depth. 3. 23-35 BN thicknesses of sandstones between 7,974 and 8,109 corrected for a 29 degree west-southwest mean dip given on the meansquared-dip dipmeter interpretation. The dip correction for sandstones below 9,300 feet depth is 19 degrees northwest. Mean dips are used because of considerable scatter in the interpreted dips. Vday and mean porosity determined from Schlumberger VOLAN interpretation (Meridian Oil Co., 1989-1991). 4. BN 1-9 Vclay determined from gamma ray log (Shell Oil Co., 1980-1994). Thicknesses corrected for a mean dip of 7 degrees southsoutheast. Porosity from Schlumberger Cyberlook and Compensated Neutron/Lithe Density log crossplots. 5. Yakima .Minerals 1-33 Vclay from poor-character gamma ray log (Shell Oil Co., 1980-1988). Thicknesses corrected for 6 to 12 degree southwest dips to 9,000 feet and 40 degree southwest dips below 10,000 feet. Porosity from Schlumberger Cyberlook and Compensated Neutron/Lithe Density log crossplots.
26

0 BISSA 0 0 1-29
X BN 1-9 0
• YAKIMA MINERALS 1-33 6,000 • QUINCY NO.l
A BN 23-35 0
0 0
E-< 8,000 o.t.
~ ..
-~ ~
z ..... • • ;:::: E-4
10,000 c.. • ~ • A
• 4
• •
X 4
12,000 X 0 J. 0 g
• XX •
x. ~ • •
14,000
16,000
30 20 10 0
POROSITY %
Figure 6. A porosity-depth plot of some Columbia Basin sandstones that are more than 10 feet thick (methods and references given on Tab.le 4). All depths are referenced to kelly bushings. Only those sandstones having uniform and continuous porosity are included; the presence of claystones or other impermeable interbeds that can be resolved with wireline logging tools is considered to segregate a unit into multiple sandstone reservoirs for the purposes of this report. The line is a best fit to these data and depicts porosity degradation as a function of depth.
27

ON FOLLOWING PAGE:
Figure 7. An isopach map showing the aggregate thickness of sandstone units that have porosity greater than 10 percent and individual unit thicknesses in excess of 10 feet as measured perpendicular to bedding (except for the Quincy No. 1, which is not dip corrected and may have less sandstone than depicted). The red and brown colors delineate the most favorable area for reservoir development. Contour interval = SO feet. Data and interpretations methods summarized on Table 4. Fonnline contours are used except in the southeastern comer of the map where contours parallel the thickness of the Columbia River Basalt Group as extrapolated from thicknesses of the Grande Ronde Basalt (Reidel and others, 1989).
28

18N
~ El,ensburg ~
17N
16N
15N
14N
13N Yakim
18E I.. <i 19E 20E 21E 22E 23E 24E
--
25E
.-,.1
' 26E

TABLE 5. Comparison of typical large Rocky Mountain oil and gas fields (Wyoming Geological Association, 1957) and Columbia Basin reservoir data.
OIL AND GAS FIELDS DAT A
Glenrock, South Oil Field
Production1 = 74.8 million barrels Productive area= 6,600 acres Sandstone 1 Thickness = 12 feet Sandstone 2 Thickness = 7 feet Sandstone 3 Thickness = 25 feet
Clareton - Mush Creek Oil Field
Production = 44.8 million barrels Productive area = 70,000 acres Sandstone 1 Thickness= 14 feet Sandstone 2 Thickness = 8 feet
Beaver Creek Gas Field
Production = 877 billion cubic feet Production depths 7,700 - 8,300 Productive area = 5,370 acres
Porosity = 20% Porosity = 14% Porosity= 14%
Porosity= 12% Porosity= 17%
Sandstone 1 Thickness = 40 feet Porosity = 13% Sandstone 2 Thickness = 15 feet Porosity = 6% Sandstone 3 Thickness = 45 feet Porosity = <25%
Baxter Basin Gas Field
Production = 273 billion cubic feet Production depths 2,400 - 2,800 feet Productive area= 5,000 acres Sandstone 1 Thickness = 25 feet Porosity = 25% Sandstone 2 Thickness = 35 feet Porosity = <25%
Worland Gas Field
Production = 419 billion cubic feet Production depths= 7,000 - 10;000 feet Productive area = 6,000 acres Sandstone 1 Thickness = 47 feet Porosity = 17% Sandstone 2 Thickness= 51 feet Porosity= 14% Sandstone 3 Thickness = 18 feet Porosity = 13% Average permeability= 10 md
Note: Production data are from the Wyoming Geologic Suivey and current as of April 1995.
COLUMBIA BASIN DAT A
Yakima Minerals 1-33 Well
Depth = 10,000 feet Sandstone 1 Thickness = 38 feet Porosity = 14% Sandstone 2 Thickness = 60 feet Porosity = 14% Sandstone 3 Thickness = 24 feet Porosity = 13%
23-35 BN Well
Depth = 9,800 feet Sandstone 1 Thickness = 23 feet Porosity = 14% Sandstone 2 Thickness = 58 feet Porosity = 13% Sandstone 3 Thickness = 34 feet Porosity = 13%
30

TRAP
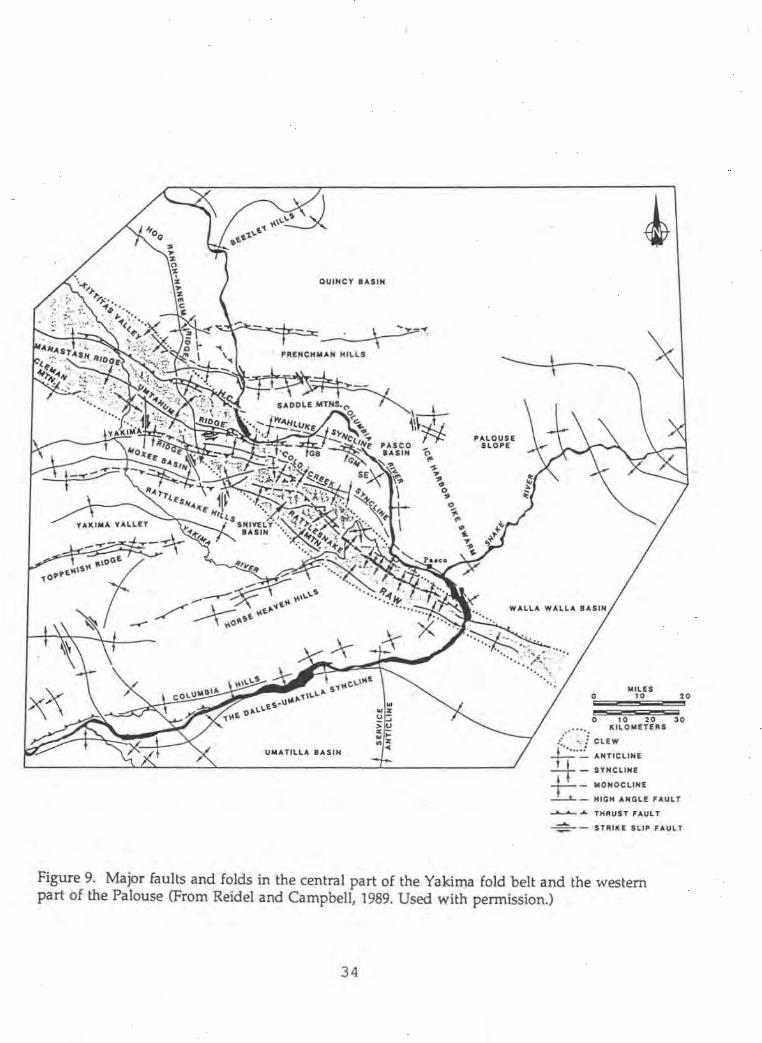
The Columbia Basin is structurally complex and poorly understood relative to most other basins. The complexity of folds and faults (Figures 2, 3, 9) is certain to result in an abundance of potential traps within the basin.
The proposed Yakima Firing Range Expansion Area lies within the Yakima fold belt where large anticlines, including the Manastash, Saddle Mountains, and Umtanum anticlines, are exposed at the surface (Fig. 2). These complex folds are mostly asymmetric, verge north except for a few south-verging fold segments, range from 3 to 6 miles across strike, and are from 75 to more than 100 miles long as measured along trend. The surface expression of these folds is similar in size and morphology to folds that entrap the.giant oil and gas fields of Iran, Romania, western Alberta, and Wyoming. (See Figure 8.)
Contrary to published remarks, dipmeter interpretation indicates that structure in the Paleogene nonmarine sections penetrated in the BN 1-9 and Yakima Minerals 1-33 wells _are disconformable with the overlying basalt. (See Notes on Table 4). The same may be true of the 23-35 BN. Therefore, surface structure may mimic the subsurface. Mapping by Bentley (1980) and Swanson and others (1979) suggests that trap areas within the fold belt could range from 3,000 to 25,000 acres if sub-basalt structure mimics basalt structure everywhere in the central portion of the basin. This relation is observed on reflection seismic data from some other Washington basins.
There are several competing theories for the origin of Yakima fold belt anticlines. Two major models are decollement thrusting and oblique or strikeslip faulting.
Many geologists have observed the dominant north vergence, fold spacing, and thrust displacement of faults at the surface and conclude the Yakima fold belt is a decollement thrust belt. (See Campbell, 1989.) The decoUement surface is thought to be the base of the basalt. Therefore, it is possible that these anticlines fold only the basalt and not older strata. Basalt at Cleman Mountain is clearly detached from underlying Paleogene strata (Campbell and Reidel, 1991).
Similarly, it is likely that other, potentially productive anticlines and faults deform the Paleogene nonmarine rocks and have no manifestation in the basalt or at the surface. While the decollement thrust model is yet to be tested, some lines of evidence suggest this model may not be valid for all of the Yakima fold-belt strucfures:
(1) Detailed basalt chemistry shows with some certainty that no repeated section is present in the Rattlesnake Hills No. 1, BN 1-9, Bissa 1-19, 23-35 BN, or Quincy No. 1, wells, indicating that these wells did not c.ut thrust faults (S. P. Reidel, Westinghouse Hanford, oral commun., 1995). Reidel observes that the 1-10 Dareen well did cut a fault in the Grande Ronde Basalt.
(2) The folds and faults have various vergence.
(3) Campbell (1989) outlines a history of sedimentation across the Hog Ranch-Naneum Ridge (Figure 2) wherein the ridge crest is a pre-Paleogene highland, a stratigraphically thickened area in the middle to upper Eocene, a thin during the Oligocene, and, finally, a highland during the middle Miocene. This pattern of stratigraphic/topographic reversal is typical of oblique or strikeslip terrains, but not of decollement thrust belts.
31

ON FOLLOWING PAGE
Figure 8. A comparison of the areas that would be condemned for the Yakima Firing Range Expansion Area with some large Rocky Mountain oil and gas fields (overlay). Glenrock South [black] is a stratigraphic trap located directly north of a major reverse · fault; Beaver Creek [green] is a typical structural dome; and Baxter Basin [blue] is trapped by a series of faults (Wyoming Geological Association, 1957). These fields are good analogues of the types of accumulations anticipated in the Yakirrta fold belt. The field outlines have been arranged to overlay the map of condemned lands in a pattern that is concordant with known aspects of the geology of the Manastash and Saddle Mountains anticlines. ·
32

TI7N
TI6N
I '- I_,
~ _~)1_ -r --/,. I I I
.1
I
- - ~ ~r
't-1. -+ -I '-•
- -/ ' I
I f I
t:·J_ - ~ '"
I :::::S ' - I I I I 4
' I : . -I,' - - - ~ I I ~ J I 1:/ ~ ~ --
1'- - -l
R19E I R20E
,- - -1-
I I
- - -1.
Legend I~ .. · I Condemned DNR Land
+ '-
R20E
[2SZI Approximate Boundary of Expansion Area
l2SZI South Glenrock Oil Field outline
l2SZI Beaver Creek Gas Field outline
[2SZI Baxter Basin Gas Field outline
- - - ,-
J_
I I I I I I r -,-""'--·..L
I
R21E
- - ..., -;- - - - t - - r ·,
I
I_
I I I ( I I
l' I -., ' I
T
t- -
R21E R22E
I L
·, I
I
J_ I
f-
r-" - -f ~ -
I- - -
_I I
I
~ -
-I
R22E I R23E
' I ..I.
I
_, I
Elrtrem, cw, wH uHd during th• complle11on of thl• map to ln•ur• •c::curaoy. How,wr. due to ChangH In ownenhlp and th• newd to rely on outeld• lnform•t1on. th• D•P•r1ment of N1t1ut11I RHourc:H c•nnot accept rtspon,lblKtlo, for error·• or oml11ion,. and., therefor•. th•r• .,, no warrantlH which accompany thl, mat1rl1t.
•• W/\SlltN()IONSIJ\11 OLWllflMlNl 01
Natural Resources ~ knnihtM. Srir:htr , ComrmnJ1onl't of Pvt,lic lendl
K, tew, CoufnshMn • Suprl\'11-or RruourcePlanning,ndAssc« Mgmt Div.
August, 1995
QUINCY 8ASIN
UMAYILLA BASIN
----+--PALOUSE
SLOPE
0
0
·······
MILES 10
10 20 KILOMEYERS
,:' • • • : CLEW
-P."'.:_ ANTICLINE
20
30
7t - SYNCLINE r- MONOCLINE
-'--'- - HIGH ANGLE FAULT
............ .&. THRUST FAULT
....::!:::.... - STRIKE $LIP FAULT
Figure 9. Major faults and folds in the central part of the Yakima fold belt and the western part of the Palouse (From Reidel and Campbell, 1989. Used with permission.)
3 4
(4) Seismic data (Jarchow, 1991) and well data (Campbell and Reidel, 1994) do not show the regional wedge of strata that thins away from a thrusted hinterland toward a thrusted foreland. These wedges characterize thrust belts.
(5) The regional "fan pattern" of folds in the northwestern Columbia Basin (Reidel and Campbell, 1989) has not been observed in other thrust belts.
Several lines of evidence are consistent with oblique-slip (see Lingley and others, 1994) or strikeslip faulting in the basin. These include lacustrine rocks, the rhombochasm morphology of the Entiat graben, the aforementioned uplift-down drop stratigraphic relations, some strikeslip focal mechanisms for recent Columbia Basin earthquakes, and the fact that many of the faults steepen with depth (Reidel and Campbell, 1989).
However, Reidel and Tolan (1994) make an equally strong argument that the OlympicWallowa lineament, which includes part of the Yakima fold belt, has not had significant strikeslip movement dqring the last 16 M.Y., the time period during which the folds grew (Reidel, 1984). However, it stands to reason that the Olympic-Wallowa lineament may not share a cogenetic relation with other Yakima fold belt .structures because it cuts across a much larger region.
These arguments could easily be resolved with high-quality seismic data, but prior to 1992, there was no definitive, yet inexpensive means of mapping deeper structure in the basin. Relatively inexpensive prospecting techniques, including interpretation of gravity, magnetic, and electromagnetic data, failed to yield prospect-scale information owing to limited resolution of these tools.
However, recent experimental seismic work described above using very large energy sources and special refraction/reflection processing, has allowed Jarchow and others (1991, 1994) to map the base of the basalt and crystalline· basement with precision. This technique could be used to produce maps of the entire basin, and it is likely that these products could be used interactively with conventional or 3-D seismic reflection surveys.
POTENTIAL RESERVES, LEASING, AND ROYALTIES
The most recent National Resource Assessment, undertaken by staff of the U.S. Geological Survey (Gautier and others, 1994), suggests that the Columbia Basin holds sufficient promise to encourage aggressive exploration and leasing in the future.
The U.S. Geological Survey estimated that a median of 10 and a maximum of 100 gas accumulations remain undiscovered in the Columbia Basin (Tennyson, 1994). They calculate that a very large accumulation (500 BCF) could be discovered in the basin. This analysis was performed without access to detailed reservoir data .contained in Table 4. These data would have led to a conclusion that much larger accumulations could exist (M.E. Tennyson, U.S. Geological Survey, Denver, oral commun., 1995).
Reserve estimates published in 1986 by Lingley and Walsh continue to provide a reasonable picture of the basin's potential. The probability of a commercial discovery of 40 billion to 1 trillion cubic feet of gas remains comparable to that for other frontier basins worldwide. Data and assumptions used in the 1986 estimate are given in Table 6.
35

During the initial phases of exploration of frontier basins, mineral rights leases are let for minimal amounts and large acreage positions are developed by individual companies. Following encouragement in the form of good shows or aggressive wildcat drilling, lease bonuses typically range from $25 to $120 per acre. As the basin matures, leases in prospective areas can exceed $500 per acre.
The current depressed gas market will not last. In the United States, demand for energy is rising and about half of our domestic petroleum has already been consumed. We are currently importing a record amount of oil. Even if alternate sources of fuel energy are developed, natural gas will continue to have value as an important petrochemical feedstock used mainly in hydrogen, methanol, and ammonia synthesis (Kroschwitz and Howe-Grant, 1991).
In the event of a natural gas discovery, the income generated for the mineral rights owner would be significant. The probability of a commercial discovery appears to be similar to that in other frontier basins (about 1 in 16), if not higher. (The probability is non-zero because gas has ~lready been produced at the Rattlesnake Hills Field.) In the case of commercial production, the mineral rights owner would earn a 1 /8th royalty income on all production from that land. For example, three wells producing from a hypothetical Columbia Basin gas field might generate more than $1,500,000 during the first ten years of production. (It is assumed that each well would flow 2,500 MCFGPO-because gas fields developed in the Columbia Basin would have to be highly productive in order to recoup drilling costs. Other assumptions include annual decline of 0.30, a gas price of $1.50/MCF, 640-acre spacing, and transportation charges paid by the operator.
The mineral rights owner would also benefit from other new technology. For example, direct gas detection or basin-centered-gas development methods may allow explorationists to target much smaller accumulations and realize greater profit. In addition to conventional gas fields, the basin-centered deep gas play has potential to hold 11 billion cubic feet of gas per section (Law, 1994). Such reserves could provide significant impetus for continued exploration and leasing long after conventional gas accumulations or the potential to discover conventional gas accumulations have been exhausted.
Other Assessments
The following are published comments by petroleum professionals and scientists who have studied aspects of the petroleum potential of the Columbia Basin.
"Shell has paid millions of dollars in leasing bonuses and annual lease rentals to a large number of Washington landowners covering approximately two million acres of land. This exploration activity has taken place and these benefits have been enjoyed at a time when the oil and gas industry has been experiencing, and continues to suffer from, one of the worst economic periods in its history, a time when major and independent oil and gas companies are drastically reducing or suspending exploration commitments in other wildcat and producing regions across the county." {Shell Western Exploration and Production, Inc.: Official statement read into the record of the Washington Oil and Gas Conservation Committee, April 30, 1987)
"The second half of 1986 and the first half of 1987 have seen a relatively high level of exploration and leasing activity in the Columbia Basin." " .... most of the basin has been already leased." (Faley, 1987)
Arco characterizes shows from wells adjacent to the Firing Range as "excellent" (Withers and others, 1994)
36

"We do not currently have an estimate for amounts [of natural gas] in only the area being condemned, although it appears that the condemnation area lies in a particularly promising part of the pla·y based on the locations of exploratory wells drilled in the 1980's." (M. E. Tennyson, USGS, Denver, Colorado, letter to John Holm and Sheldon Shuff dated October 17, 1994) .
"If Shell's vibroseismic surveys can "see through" the basalt and determine the geometry of pre-basalt structure, hydrocarbons could be discovered in vast quantities in the Columbia Basin". (Bentley, 1987)
"The potential for oil and gas and coalbed methane is rated high (H/B high potential based on indirect evidence)." "Under the mineral resources most likely to be developed in the proposed· Expansion area in the foreseeable future are leasable natural gas and coalbed methane. These are leasable resources and not included in the withdrawal application." (Ketrenos, 1993)
"The play [northwest Columbia Basin] is considered to have a very high probability of at least a few and possibly many, small gas .accumulations, and a lower probability of large gas accumulations." (Tennyson, 1994)
"Based on preceding analysis of past and current oil and gas activities and trends, the following is a description of the reasonably foreseeable oil and gas exploration and development activity anticipated in the Spokane RMP area over the next 10 to 15 years. [:] Future exploration will most probably occur, as in the past, throughout the Columbia Basin and east-central Cascade Range with wells depths probably continuing in the 10-20,000 ft. range. These exploratory wells will better delineate the boundarie.s of gas occurrences and may possibly result in the discovery of a new field over the next fifteen years." (U.S. Bureau of Land Management, 1992)
37

Table 6. Columbia Basin possible gas-in-place data and assumptions.
Reservoir at 5,000 ft 10,000 ft 14,000 ft
Temperature (@ 40°C/km)(degrees R) 628 738 826 z 0.75 0.85 1.00 Pressure (psi) 2,100 4,500 8,680 Bs (scf / cu ft) 150 240 370 Porosity (%) 18 12 8 Thickness (ft) 28 27 25 Number of pay zones 3 3 3
Mean areal extents (from Bentley, 1980)
Mean fault traps (ac) 11,000 11,000 11,000 Mean largest 25% fault traps (ac) 25,000 25,000 25,000
Mean domes (ac) 6,000 4,000 3,000 Mean largest 25% domes (ac) 8,000 5,000 3,000
SW(%) 65 65 65 Net-to-gross pay (%) 80 80 80 Fill-to-spill (%) 80 80 80
Conclusion
In the reasonably foreseeable future, the writer believes that aggressive exploration will take place in the northwestern Columbia Basin. Exploration is likely to be centered along favorable trends of structural geology, proven gas-generative source rocks, good geothermal gradients, excellent shows during production tests, and thick reservoir development on and near the Yakima Firing Range Expansion Area. The probability of a giant gas discovery on these lands is comparable with that of other frontier basins, and exceeds that of most mature provinces. -
Acknowledgement
The writer wishes to acknowledge the assistance of-T. J. Walsh, Matthew J. Brunengo, and Katherine M. Reed in reviewing and editing this report. Carl Harris, Kieth Ikerd, and Kristin Jamison drafted the figures and produced the GIS products. Connie Manson prepared an exhaustive bibliography of the petroleum potential of the basin and checked the citations.
3 8

REFERENCES CITED
Benelmouloud, Mahmoud; Zhuralev, Evgueni, 1989 Problems of petroleum exploration under plateau basalts. In Price, R. A., editor, Origin and evolution of sedimentary basins and their energy and mineral resources: American Geophysical Union Geophysical Monograph 48/International Union of Geodesy and geophysics, v. 3, p. 197-202.
Bentley, R. D., 1980, Structure contour maps on the top of the Grand Ronde, eastern Washington and northern Idaho: [Privately published by the author), 1 sheet, scale 1:250,000.
Bentley, R. D., 1987, Oil and gas potential of the Columbia Basin, Washington, U.S.A. [abstract]: International Symposium on Tectonic Evolution and Dynamics of Continental Lithosphere--The 3rd All-China Conference of Tectonics, Abstracts, v. 1,p. 106-107.
Blackwell, D. D.; Steele, J. L.; Kelley; s. A., 1985, Heat flow and geothermal studies in the State of Washington: Washington Division of Geology and Earth Resources Open File Report 85-6, 68 p., 2 appendices.
Brown and Ruth Laboratories, Inc., 1984, Regional petroleum geochemistry of Washington and Oregon: Brown-and Ruth Laboratories, Inc., 1 v., looseleaf.
Campbell, N. P., 1989, Structural and stratigraphic interpretation of rocks under the Yakima fold belt, Columbia Basin, based on resent surface mapping and well data. In Reidel, S. P.; Hooper, P. R., editors, Volcanism and tectonism in the Columbia River flood-basalt province: Geological Society of America Special Paper 239, p. 209-222.
Campbell, N. P.; Reidel, S. P., 1991, Geologic guide for State Routes 240 and 243 in south-central Washington: Washington Geology, v. 19, no. 3, p. 3-17.
Campbell, N. P.; Reidel, S. P., 1994, Further exploration for gas warranted in Columbia Basin: Oil and Gas Journal, v. 92, no. 18, p. 127-132.
Catchings, R. D.; Mooney, W. D., 1988, Crustal structure of the Columbia Plateau--Evidence for continental rifting: Journal of Geophysical Research, v. 93, no. Bl, p. 459-474.
Core Laboratories, Inc., 1987a, Geochemical study of Shell Bissa #1-29, Kittitas County, Washington: Core Laboratories, Inc. [under contract to Amoco Production Company], 79 p.
Core Laboratories, Inc., 1987b, Geochemical study of Shell Yakima Minerals #1-33, Kittitas County, Washington: Core Laboratories, Inc. [under contract to Amoco Production Company], 57 p.
Faley, D.R., 1987, Oil and gas exploration in the Northwest--1986/1987 [abstract]. In Northwest Petroleum Association, Symposium, program and abstracts: Northwest Petroleum Association, 2 p.
Fischer, J. F., 1987, Petrographic report on selected samples from the Shell 1- 29 Bissa well, Kittitas Co., Washington: J. Fritz Fischer [Golden, Colo., under contract to Amoco Production Company], 86 p.
39

Francois, D. K., 1993, Federal offshore statistics-1992; Leasing, exploration, production, and revenues as of December 31, 1992: U.S. Minerals Management Service OCS Report MMS 93-·0066, 155 p.
Fritts, S. G.; Fisk, L. H., 1985, The Columbia Basin, 2-Structural evolution of the south margin; relation to hydrocarbon generation: Oil and Gas Journal, v. 83, no. 35, p. 85-90.
Gautier, D. L.; Dolton, G. L.; Takahashi, K. I.; Varnes, K. L., editors, 1995, 1995 National assessment of United States oil and gas resources-Results, methodology, and supporting data: U.S. Geological Survey Digital Data Series DDS-30, 1 CD-ROM disk.
Gaylord, D. R., 1986, Cenozoic sedimentation in the Republic graben, north-central Washington--Economic implications [abstract]: Society of Economic Paleontologists and Mineralogists Annual Midyear Meeting Abstracts, v. 3, p. 42.
Ham mer, A. A., 1934, Rattlesnake Hills gas field, Benton County, Washington: American Association of Petroleum Geologists Bulletin; v. 18, no. 7, p. 847-859.
Halbouty, M. T., editor, 1970, Geology· of giant petroleum fields: American Association of Petroleum Geologists Memoir 14, 575 p.
Halbouty, M. T., editor, 1980, Giant oil and gas fields of the decade 1968-1978: American Association of Petroleum Geologists Memoir 30, 596 p.
Jarchow, C. M., 1991, Investigations of magmatic underplating beneath the northwestern Basin and Range Province, Nevada, seismic data acquisition and tectonic problems of the Columbia Plateau, Washington and the nature of the Mohorovicic discontinuity worldwide: Stanford University Doctor of Philosophy thesis, 258 p.
Jarchow, C. M.; Catchings, R. D.; Lutter, W. J., 1991, How Washington crew got good, thrifty seismic in bad da~ area: Oil and Gas Journal, v. 89, no. 24, p. 54-55.
Jarchow, C. M.; Catchings, R. D.; Lutter, W. J., 1994, Large-explosive source, wide-recording aperture, seismic profiling on the Columbia Plateau, Washington: Geophysics, v. 59, no. 2, p. 259-271.
Johnson, V. G.; Graham, D. L.; Reidel, R P., 1993, Methane in Columbia River basalt aquifers-Isotopic and geohydrologic evidence for a deep coal-bed gas source in the Columbia Basin, Washington: American Association of Petroleum Geologists Bulletin, v. 77, no. 7, p. 1192-1207.
Ketrenos, Nancy, 1993, Mineral report-Mineral potential of the proposed Yakima Firing Center expansion area, Washington: U.S. Bureau of Land management [Portland, Ore.], 1 v.
Kroschwitz, J. I.; Howe-Grant, Mary, editors, 1991, Kirk-Othmer encyclopedia of chemical technology; 4th ed.: John Wiley & Sons, v. 12, p. 332-337.
Law, B. E., 1995, Unconventional play. IN Gautier, D. L.; Dolton, G. L.; Takahashi, K. I.; Varnes, K. L., editors, 1995 National assessment of United States oil and gas resources--Results, methodology, and supporting data: U.S. Geological Survey Digital Data Series DDS-30, Part II, Region 2, Regional report 05, p. 11- 16.
40

Lingley, W. S., Jr.; von der Dick, Hans, 1991, Petroleum geochemistry of Washington--A summary: Washington Geology, v. 19, no. 4, p. 23-27.
Lingley, W. S., Jr.; Walsh, T. J., 1986, Some comments on the petroleum potential of the proposed Hanford, Washington, high-level nuclear waste repository [abstract): Northwest Petroleum Association Symposium May 16, 1986, 1 p.
Lingley, W. S., Jr.; Walsh, T. J.; Boyer, S. E., 1993, Distribution of some Paleogene sedimentary rocks and implications for oblique-slip faulting iri western Washington [abstract). In University of Washington Quaternary Research Center, Large earthquakes and active faults in the Puget Sound region: University of Washington Quaternary Research Center, [1 p., unpaginated).
McFarland, C.R., 1983, Oil and gas exploration in Washington, 1900-1982: Washington Division of Geoldgy and Earth Resources Information Circular 75, 119 p.
Meridian Oil, Inc., 1989-1991, 42-14 State [Cedar Green): Washington Division of Geology and Earth Resources Oil and Gas Permit 425, 1 file.
Montgomery, S. L., editor, 1985, Investigating the potential of the Pacific Northwest: Petroleum Frontiers, v. 2, no. 4, 83 p.
Oil and Gas Journal, 1994, OCS sale 150 draws conservative bidding: Oil and Gas Journal, v 92, no. 34, p. 32.
Olmstead, D. L., 1985, Mist gas field -- Exploration and development, 1979-1984; [with a) Chapter on geology by M./P. Alger: Oregon Department of Geology and Mineral Industries Oil and Gas Investigation 10, 36 P:
Peters, K. E., 1986, Guidelines for evaluating petroleum source rock using programmed pyrolysis: American Association of Petroleum Geologists Bulletin, v. 70, no. 3, p. 318-329.
Price, E. H.; Watkinson, A. J., 1989, Structural geometry and strain-distribution within eastern Umtanum fold ridge, south-central Washington. In Reidel, S. P.; Hooper, P.R., editors, Volcanism and tectonism in.the Columbia River flood-basalt province: Geological Society of America Special Paper 239, p. 265-281.
Reidel, S. P., 1984, The Saddle Mountains-The evolution of an anticline in the Yakima fold belt: American Journal of Science, v. 284, no. 8, p. 942-978.
Reidel, S. P.; Campbell, N. P., 1989, Structure of the Yakima Fold Belt, central Washington. In Joseph, N. L.; and others, editors, Geologic guidebook for Washington and adjacent areas: Washington Division of Geology and Earth Resources Information Circular 86, p. 275-303.
Reidel, S. P.; Tolan, T. L., 1994, Late Cenozoic structure and correlation to seismicity along the Olympic-Wallowa lineament, northwest United States--Discussion and reply; Discussion: Geological Society of America Bulletin, v. 106, no. 12, p. 1634-1638.
Schlumberger, 1988, Log interpretation charts: Schlumberger Educational Services [Houston, Tx.), 150 p.
41
Shell Oil Company, 1980-1988, Bissa 1-29: Washington Division of Geology and Earth Resources Oil and Gas Permit 338, 1 file.
Shell Oil Company, 1980-1988, Yakima Minerals 1-33: Washington Division of Geology and Earth Resources Oil and Gas Permit 334, 1 file.
Shell Oil Company, 1980-1994, Burlington Northern 1-9: Washington Division of Geology and Earth Resources Oil and Gas Permit 340, 1 file.
Shell Western E&P, Inc., 1987-1992, Quincy number 1: Washington Division of Geology and Earth Reso':lrces Oil and Gas Permit 422, 1 file.
Sidle, W. C.; Richers, D. M., 1985, Geochemical reconnaissance of Cretaceous inliers in north-central Oregon: American Association of Petroleum Geologists Bulletin, v. 69, no. 3, p. 412-421.
Swanson, D. A.; Brown, J. C.; Anderson, J. L.; Bentley, R. D.; Byerly, G. R.; Gardner, J. N.; Wright, T. L., 1979, Preliminary structure contour maps on the top of the Grande Ronde and Wanapum basalts, eastern Washington and northern Idaho: U.S. Geological Survey Open-File Report 79-1364, 3 sheets, scale 1:80,000.
Tennyson, Marilyn E., 1995, Eastern Oregon-Washington province (005). IN Gautier, D. L.; Dolton, G. L.; Takahashi, K. I.; Varnes, K. L., editors, 1995 National assessment of United States oil and gas resources--Results, methodology, and supporting data: U.S. Geological Survey Digital Data Series DDS-30, Part II, Region 2, Regional report 05, p. 1-11.
Tennyson, M. E.; Parrish, J. T., 1987, Review of geologic framework and hydrocarbon potential of eastern Oregon and Washington: U.S. Geological Survey Open-File Report 87-450-0, 41 p. .
Tolan, T. L.; Reidel, S. P., compilers, 1989, Structure map of a portion of the Columbia River flood-basalt province. In Reidel, S. P.; Hooper, P. R., editors, Volcanism and tectonism in the ·columbia River flood-basalt province: Geological Society of America Spe.cial Paper 239, plate, scale 1:580,000.
U.S. Bureau of Land Management, 1992, Proposed Spokane resource management plan amendment final environmental impact statement: U.S. Bureau of Land Management, 181 p., 2 plates.
U.S. Department of Energy Morgantown Energy Technology Center, 1985, Deep source gas project, METC-Use of geochemical and paleobasin reconstruction studies of the Methow Basin, Washington, to investigate the hydrocarbon generating potential of deep sedimentary basins in the Pacific Northwest-FY 85 status report; draft: U.S. Department of Energy Morgantown Energy Technology Center, 1 v.
Walsh, T. J.; Lingley, W. S., Jr., 1991, Coal maturation and the natural gas potential of western and central Washington: Washington Division of Geology and Earth Resources Open File Report 91-2, 26 p.
Withers, Robert; Eggers, Dwight; Fox, Thomas; Crebs, Terry, 1994, A case study of integrated hydrocarbon exploration through basalt: Geophysics, v. 59, no. 11, p. 1666-1679.
42

Wyoming Geological Association Symposium Committee, 1957, Wyoming oil and gas fields symposium: Wyoming Geological Association, 484 p., 18 pl.
43