nasa technical note nasa tn d-7307 · 2013-08-31 · nasa technical note r^. co nasa tn d-7307 fii...
TRANSCRIPT
NASA TECHNICAL NOTE
r̂ .CO
NASA TN D-7307
FI iCOPyL
COLD CATHODES FORSEALED-OFF CO2 LASERS
by Urs E. Hochuli, Thomas P. Sciacca,
and Charles R. Hurt
Goddard Space Flight Center
Greenhelt, Md. 20771
NATIONAL AERONAUTICS AND SPACE ADMINISTRATION • WASHINGTON, D. C. • AUGUST 1973
https://ntrs.nasa.gov/search.jsp?R=19730020748 2020-03-13T01:03:23+00:00Z

1. Report No. 2. Government Accession No.
MSA TW ru73074. Title and Subtitle
Cold Cathodes For Sealed-OffiCC"., -Lasers. >,, . .• • • • • ' • . - • * . • ,.;>.; •. |jj.,i ,; ;;•; • - • . . • - . -
7. Author(s)U. Hochuli, T. Sciacca, and C. Hurt
9. Performing Organizat ion Name and Address
Goddard Space Flight CenterGreenbelt, Maryland 20771
12. Sponsoring Agency Name and Address
National Aeronautics and Space AdministrationWashington, D. C. 20546
3. Recipient 's Catalog No.
5. Report Date
August 19736. Performing Organization Code
7338. Performing Organization Report No.
G-733210. Work Uni t No.
604-42-01-0111. Contract or Grant No.
13. Type of Report and Period Covered
Technical Note
14. Sponsoring Agency Code
15. Supplementary Notes
16. Abstract
Experimental results of a group of theoretically selected cold cathode materials arepresented. These tests indicate Ag-CuO, Cu, and Pt-Cu as three new cold cathodematerials for sealed-off CO2 lasers. The power output of a test laser with an Ag-CuOcathode and a gas volume of only 50 cm3 varied from 0.72 W to 1.1 W at 3000 hoursand still yields 0.88 W after 8000 hours. Gas discharge tubes with Cu cathodes and avolume of 25 cm3 yield lifetimes in excess of 10,000 hours. Gas analysis results,obtained from a similar tube over a period of 3000 hours, look most promising. APt-Cu alloy cathode shows an extremely promising V-I characteristic over a periodof 2800 hours.
17. Key Words (Selected by Author(s)) 18. Dis t r ibut ion Statement
Communications, CO2 Laser, ColdCathodes, 104 Hour Life, 1-W Sealed-off Unclassified - UnlimitedCO 2 Laser; Gas Mixture Optimization
19. Security C lass i f . (of th is report) 20. Security Class i f . (of th is page)
Unclassified Unclassified21. No. of Poges 22. Price*
60. $3.00
For sale by the National Technical Information Service, Springfield, Virginia 22151

CONTENTS
Page
ABSTRACT i
INTRODUCTION 1
CATHODE PARAMETERS INVOLVED 1
EXPERIMENTAL APPROACH 3
Gas Analysis 3Experimental Techniques 4
EXPERIMENTAL RESULTS 4
Gold Cathodes 4Silver Cathodes 4Silver Matrix Cathodes 5
Ag-CdO Cathodes 5Ag-CuO Cathodes 5Ag-MnO2 Cathodes 5Ag-NiO Cathodes 5Ag-ZnO Cathodes 6
Copper Cathodes 6Oxide Layer Cathodes 6Platinum Cathodes 6Palladium Cathodes 7Nickel Cathodes 7
CATHODE ALLOYS TESTED 7
LASERS 9
CONCLUSION 10
ACKNOWLEDGMENTS 10
111

(Contents continued)
Page
REFERENCES 11
APPENDIX-LASER V-I CHARACTERISTICSFOR DIFFERENT GAS MIXTURES 47
IV
COLD CATHODES FOR SEALED-OFF CO2 LASERS
Urs E. HochuliUniversity of Maryland
Thomas P. Sciacca and Charles R. HurtGoddard Space Flight Center
INTRODUCTION
Most of the gas discharge tubes used for CO2 lasers are high-impedance devices requiringonly small currents; cold cathodes are suitable electron emitting sources to furnish thesecurrents. Gas removal due to cathode sputtering usually limits the life of discharge tubesfilled with noble gases. Moreover, dissociation of CO2 into CO and O2 with successiveoxygen removal due to oxide layer formation is a consideration for the CO2 laser. Thedegree of dissociation is very much influenced by the cathode surface chosen. It is adifficult problem to find the proper cathode materials that do not remove gas by sputteringand avoid consumption of any gas mixture constituent through scale formation.
The CO2 laser was discovered in 1964.* Its high efficiency and power capability make itideal for communication purposes as well as for energy sources. Despite the recognitionof its importance we have so far had no entirely satisfactory cold cathode for the CO2
laser. It is true that the state-of-the-art has been much advanced in the last two years,but we are still looking for a cathode that is noise free, does not produce sputteringdeposits, and lasts for 10,000 hours or more with small gas volumes. The nickel cathodeinvented by Dr. Carbone,2 the platinum cathode discovered by Dr. Whittemann,3 and theNiO cathode developed by Honeywell depend on a relatively large gas volume and canyield lifetimes of several thousand hours under this condition. Used in a 1-W CO2 laserwith a typical gas volume of the order of 50 to 100 cm3 they usually last less than 1000hours. The demand for a space-qualified laser tube with a life expectancy of at least 2000hours has justified the need for CO2 laser cold-cathode research. These facts also indicatethat we are dealing with a difficult and important unsolved problem.
CATHODE PARAMETERS INVOLVED
Sealed-off CO2 lasers are relatively tolerant of the composition of the gas mixture used.One of the most efficient mixtures uses He-CO2-N2-Xe. It has been shown by severalresearchers4 that CO can be substituted for N2. We have optimized one of our own 1-Wlasers with respect to gas composition, and the results are shown by Figures 1 to 22. Fromthese measurements we must conclude that the substitution of CO for N2 has little effecton power output. For example, we measure a power output of 1.3 W at 6 mA and 5100 Vacross the laser tube for a gas mixture containing 9.1 Torr He, 4.25 Torr CO2, 5.45 Torr

CO, and 1.2 Torr Xe. This result must be compared with a power output of 1.2 W obtainedat 6 mA and 4980 V across the laser tube for a mixture consisting of 10 Torr He, 4.65 TorrCO2, 4.65 Torr N2, and 0.7 Torr Xe. For these two cases the substitution of CO for N2
gave a slightly larger power output and also a slightly higher efficiency. We have to mentionthat our results have been measured during the first ten minutes the laser was turned on anddo not reflect long-term changes in the composition of the gas mixture. The laser tube forour measurements originally gave an output of 1.7 W, and successive cathode tests pro-duced a slight, visible layer of deposits on the internal gold-coated mirror. These depositsreduced the power output from 1.7 to 1.3 W under otherwise identical conditions.
It has also been shown that a small amount of H2 or H2O can be added, and this mayfurther increase power output and efficiency.5 Our own incomplete measurements for H2
addition are shown in Figures 23 to 26. These variations in the gas composition are notonly important for the achievement of maximum power output or efficiency, they alsoprofoundly affect the cathode chemistry and therefore the life of the laser tube. The otherparameters of the cathode are the current density, the temperature, and the compositionof the cathode surface. The current density can, to a certain extent, be controlled by thechoice of the cathode geometry. We have normalized the cathodes, which were designedfor a current of 6 mA, to four diameters to conform to available or easily modified ceramicsputter shields. These normalized cathode configurations are shown in Figure 27.
The operating temperature of these cathodes depends, of course, on the current, and thetemperature can be raised by using thermal insulation outside of the cathode sleeve. Typi-cal temperatures for one cathode configuration are shown in Figure 28. The last parameter,the composition of the cathode surface, is dealt within the next paragraph.
We would like to find cathode materials that are chemically inert in the presence of theparticular gas mixture used. We also require a very low sputtering rate of the materialsused for the cold-cathode surface, and the last requirement asks for a minimum of negativeion formation in the sputtering products. This is necessary to prevent material depositsat the anode end due to the attraction of such negative ions by the positive anode.
Of particular interest are the metal-oxides with a larger oxygen dissociation pressure thanthe one of the reaction
2 CO + 02 ^ 2 C02
Some of these oxides are shown in the standard free-energy diagram in Figure 29 locatedabove the reaction mentioned. The dissociation O2 pressure can be read from thisdiagram or from Figure 30. In the presence of a mixture of equal parts CO and CO2
these oxides are reduced to their lower oxidation state under condition of thermal equili-brium and in the absence of the electrical discharge current. (It is noteworthy that mostof these metals and oxides also act as catalysts for the CO oxidation reaction. The factthat the degree of CO2 dissociation is indeed affected by the cathode surface chosen is

also documented in the literature.6) The use of one of these materials as a cold cathodeexposes it to additional processes such as ion bombardment, photo-, field-, and thermal-emission, with the result that the surface has a tendency to stay in the higher oxidationstate. Oxidation at the cathode end of discharge tube is unexpected but has been observedand described.7
The discharge conditions of most of the small CO2 lasers result in cathode current densitiesabove 2 mA/cm2. Experience shows that insulating oxide layers can usually not supportsuch current densities over prolonged periods of time. This difficulty can be avoided byusing semiconducting oxide layers. Most of the oxides under consideration are of thistype and their electrical conductivity as well as their catalytic activity increase withtemperature. Unfortunately, reliable data of electrical conductivity of oxides versustemperature is rather scarce in the recent literature.
EXPERIMENTAL APPROACH
It was obvious from the beginning of the research that a large number of different cathodematerials had to be tested. To build a laser for each different cathode would have beenprohibitively expensive in terms of manpower, materials expenses, and testing facilities. Afaster and far cheaper approach was to test gas discharge tubes alone. This was done and thestandard geometry chosen for the discharge tubes is shown in Figure 31. Discharge voltagemeasured at constant current and color of the discharge versus time are coarse and not al-ways sufficient indicators of the condition of the tubes. We felt that at least a partial gasanalysis was necessary to verify the composition of the gas mixture over the life-span ofthe most promising discharge tubes. This can be achieved either by periodically analyzinggas samples in the mass-spectrometer or by infrared absorption spectroscopy. We havechosen infrared absorption spectroscopy to obtain an indication of the CO2 and CO con-tent of the tubes. This required the attachment of an absorption cell with infrared trans-mitting windows to each discharge tube. The cell geometry chosen increased the gas volumeof the discharge tube from roughly 25 cm3 to 50 cm3. The most successful cathodes werethen tested in actual lasers.
Gas Analysis
As previously mentioned, the CO and CO2 content was monitored with infrared absorptionspectroscopy. The absorption cells had a path length of 7.8 cm and 1-mm thick Irtran-2windows; their geometry is shown in Figure 32. The absorption spectrum between 2000and 2500 cm"1 was measured with a DigiLab model FTS 14 double-beam spectrometer.The resolution of this instrument is insufficient to display the true line shape of a singlerotational CO2 or CO line. For this reason we chose an equivalent slit width that wouldenable us to sample over two or more rotational lines. A slit width of 8 cm"1 achieves thisobjectively, saves time, and was chosen for all measurements. Figure 33 shows a samplespectrum of the reference mixture of 20 Torr He CO2 CO Xfi in the pressure ratios
3

15:7:7:1 and indicates maximum absorption of roughly 10 percent for CO2 and 1.2 per-cent for CO. Further measurements were made with expanded scales, Figure 34, and theresults for other gas compositions are shown in Figures 35 to 40.
Experimental Techniques
All the discharge tubes and lasers were made from Pyrex and had tungsten electrode feed-throughs. Gallium arsenide and Irtran-2 windows as well as the internal gold-coated quartzmirrors were attached with indium film seals developed for this purpose in our laboratory.8
All these seals are of the ultrahigh vacuum type and no Epoxy resin was used anywhere.The tubes were evacuated with an oil diffusion pump and the electrodes outgassed with RFgenerator and torch. The first discharge was usually in pure oxygen followed by a burn-inperiod of one to two days in the final mixture. Subsequently, the tubes were refilled,sealed off, and run on the test stand. Practically all the cathode alloys were fabricated inour own laboratory and then cast and machined or rolled and formed into the final shape.Internal oxidation of the silver alloys was performed in a temperature-controlled furnacewith a quartz tube flushed with O2 as a working chamber.
EXPERIMENTAL RESULTS
From the oxygen dissociation curves in Figure 30 we see that gold forms the most unstableoxides, followed by silver, MnO2, PtO, PdO, and CuO.
Gold Cathodes
We would expect that gold, the most noble metal with respect to oxidation, would be arather inert cathode surface. Unfortunately, gold sputters very badly and we have so farnot been able to get reasonable life with such cathodes in He-CO2-N2-Xe mixtures.
Silver Cathodes
The next noble metal, silver, does not work successfully in the He-CO2-N2-he mixturesprobably because the volatile Ag NO3 can be formed. In He-CO2-CO-Xe mixtures we seean entirely different picture. Here we can observe how the discharge oxidizes the spot ofimpact at the cathode. This area becomes dark due to silver oxide formation, with aresulting local decrease in the electrical conductivity. This lowered electrical conductivitythen forces the cathode spot to move to an unoxidized area. If the cathode has a tempera-ture of 200° to 300° C we can later observe how the original, oxidized area returns againto pure silver by dissociation. Such cathodes can have quite a long life and some of themare surprisingly sputter-free. Their drawback is the electrical instability caused by themoving cathode spot. Typical characterisitcs are shown in Figure 41.
We have also tried to reduce the surface resistivity of the oxide layer by increasing thetemperature. This attempt was unsuccessful and usually resulted in increased sputtering.

Another method is to alloy the silver with a metal that forms oxides with a higherelectrical conductivity. The additional metal in the alloy has to be oxidized in orderto prevent oxygen depletion in the final gas mixture. This process then leads to:
Silver Matrix Cathodes
Silver at high temperatures is quite transparent to oxygen and for this reason silver alloyscan be internally oxidized. The best known examples are probably the Ag-CdO alloysused for electrical contacts. This compound can be formed by sintering compressedAg-CdO powder slugs or by exposing the Ag-Cd alloy to an oxidizing atmosphere at hightemperatures for extended periods of time. We have formed Ag-CdO, Ag-CuO, Ag-MnO2,and Ag-ZnO cathodes and used sintered Ag-CdO and Ag-NiO cathodes. These cathodesconsist essentially of a silver matrix holding the oxide particles. Curves from reference9
for the Ag-CuO internal oxidation process are shown in Figure 42. Silver matrix cathodesshould be relatively inert to surface damage and free of electrical instabilities once suffi-ciently low surface resistivity has been achieved.
Ag-CdO Cathodes
Results for these cathodes are shown in Figures 43 to 46. The main sputtering deposits stayclose to the cathode; slight anode deposits do occur.
Ag-CuO Cathodes
These cathodes work quite well, as illustrated in Figures 47 to 49, but still show movingcathode spots. Anodes stay very clean and surprisingly low cathode deposits occur withthe 2L 4.5 type cathodes. Notice the CO decrease and the CO2 increase with time forcathodes with 10 percent or more Cu. In these cathodes sputtered CuO is reduced toCu2O, giving off oxygen. The partial pressures of CO and CO2 stayed fairly well balancedfor the cathode with 5 percent Cu, while pure Ag cathodes show an excess of CO inFigure 41. Ag-CuO cathodes are not successful in the presence of N2.
Ag-MnO2 Cathodes
The cathodes were first oxidized at 750° C and then at 500° C to achieve conversion toMnO2, known to be an excellent catalyst.10 Results are shown in Figure 50. Anode de-posits do occur with these discharge tubes but the cathode spots are relatively quiet. Thecathodes are unsuccessful in the presence of N2.
Ag-NiO Cathodes
Results are shown in Figure 51. The anodes stay relatively clean and the cathodes arequiet in these discharge tubes.

Ag-ZnO Cathodes
Results are shown in Figure 52. Quiet cathode sport, very light anode deposits. Thecathode with 10 percent Zn shows some cathode deposits. These cathodes are unsuccessfulin the presence of N2.
Copper Cathodes
Oxide layers can be formed in an oxygen discharge and such cathodes live surprisingly longwith quite large current densities. It is a known fact that thin oxide layers on Cu grow veryslowly at room temperature.11 Anodes stay very clean; cathodes are unsuccessful in thepresence of N2. Cathode spots move when large current densities are used, but practicallyno sputtering occurs. Cathode spots are quiet with lower current densities but thesputtering rate is higher. Results are shown in Figure 53.
Oxide Layer Cathodes
Such cathodes can be formed by oxidizing alloys in an oxygen atmosphere for a prolongedperiod of time at elevated temperatures. The scaling layers so formed usually containthe oxide of the less noble component of the alloy. Suitable layers have to adhere verywell, for example, CuO on Au,12 and are only allowed to continue growing at an infinite-simal rate at the operating temperature of the cathode. Such cathodes are of course muchmore delicate than matrix cathodes formed by internal oxidation. For this reason we havenot stressed their development and only a few were tried.
Platinum Cathodes
Pure platinum cathodes dissociate very little CO2 6 but sputter badly and are not successful.
We have tried to reduce the sputtering by alloying Pt with Ag, Au, Cu, and Ni. The resultsshow that sputtering can indeed be reduced drastically but the life of the discharge tubestested was generally less than 1000 hours. The addition of hydrogen or water vapor does,however, change the situation. It is well known that platinum oxides can be reduced byatomic hydrogen at room temperature in a cycle similar to the water vapor cycle in incan-descent lamps13. Langmuir described this cycle as follows:
A lamp made up with a side tube containing a little water which is kept cooledby a freezing mixture of solid carbon dioxide and acetone (-78.5° C) will blackenvery rapidly when running at normal efficiency, although the vapor pressure ofwater at this temperature is only about 4 X 10~4 mm.
The explanation [Langmuir states] of the behavior of water vapor seems to be asfollows:
The water vapor coming into contact with the filament is decomposed, the oxygencombining with the tungsten and the hydrogen being evolved. The oxide distils to

.the bulb, where it is subsequently reduced to metallic tungsten by atomic hydro-gen given off by the filament, water vapor being simultaneously produced. Theaction can thus repeat itself indefinitely with a limited quantity of water vapor.
Several experiments indicated that the amount of tungsten that was carried fromthe filament to the bulb was often many times greater than the chemical equiva-lent of the hydrogen produced, so the deposit on the bulb could not well be formedby the simple attack of the filament by water vapor.
Another experiment demonstrated that even the yellow oxide, WO3, could bereduced at room temperature by atomic hydrogen. A filament was heated in aa well-exhausted bulb containing a low pressure of oxygen; this gave an invisibledeposit of the yellow oxide on the bulb. The remaining oxygen was pumpedout and dry hydrogen was admitted. The filament was lighted to a tempera-ture (2000 K) so low that it could not possibly produce blackening under or-dinary conditions. In a short time the bulb became distinctly dark, thus indicat-ing a reduction of the oxide by the active hydrogen. Further treatment in hydro-gen failed to produce any further darkening, showing that the oxide could onlybe reduced superficially.
Platinum alloy cathodes working with gas mixtures containing hydrogen or water vaporare essentially mass transport cathodes with transport rates controlled by the impurityused. In this case we need far larger impurity concentrations to reduce sputtering, andpreliminary results are seen in Figures 54 and 55.
Palladium Cathodes
Just as with Pt, these cathodes seem to be good catalysts but sputter far too much. Wehave not yet had time to check their behavior with gas mixtures containing H2 or H2O.
Nickel Cathodes
The life of discharge tubes using nickel with oxidized or unoxidized surfaces has alwaysbeen restricted to less than 1000 hours by our test conditions. The substitution of COfor N2 in the gas mixture did not improve this result.
CATHODE ALLOYS TESTED
These are shown in Tables 1 and 2.

Table 1Impurity Percent by Weight of Cathode Alloys Tested in He-CO2-N2-Xe.
15/7/7/1 Gas Mixtures.
Main ElementImpurity \
Ag
Au
Cd
Co
Cu
Mn
Ni
Pd
Pt
Re
Zn
Ag
100
0.8,25,10,20
20
0.5,35,10
15
3,10
10
Au
100
Co
0.5,210
Cu
3
100
Mn
38
Ni
10
Pd
1,3,10
10
3,710,14
3
100
Pt
1,3
3,10
0.3,1,3,10,
30
0.2,0.5,1,1.5,2,2.5,3,6,10
100
Re
100

Table 2Impurity Percent by Weight of Cathode Alloys Tested in He-CO2-CO-Xe.
15/7/7/1 Gas Mixtures.
Main ElementImpurity \
Ag
Au
Cd
Co
Cu
Mn
Ni
Pd
Pt
Re
Zn
Ag
100
18
1,10
5,10,20
1.253,10
15
10,18
3,26
1,3,10
Au
10
100
5
Co
100
40
Cu
100
2,10
Mn
38
Ni
10
100
Pd Pt
1,3
1,10
0.51,2
100
Re
100
LASERS
A typical result for a laser with a nickel cathode is shown in Figure 56. Far more encourag-ing is the power output versus time of the laser with a 1 L 4.5 Ag 20 Cu/O cathode shownin Figure 57. This cathode is actually somewhat too small and has worked with a largerthan optimum current density. As a result of this sputtering has taken place, but thedeposits are nicely confined to the cathode area. The most impressive fact is the lack ofvisible deposits in the bore, on the anode, or on the gold-coated internal mirror at theanode end after 8000 hours of continuous service. The sputtering in the cathode area isalmost completely eliminated with the next larger 2 L 4.5 type cathode. Comparison

of the last two results shows that indeed much progress has been made during the pastyear.
CONCLUSION
From the many test results available we see that careful selection of gas mixture composi-tion, cathode material, and geometry promise CO2 laser life of 10,000 hours or more. Sofar Ag-CuO and pure Cu cathodes are the most successful ones in combination with theHe-CO2-CO-Xe mixture. Both of these cathodes show a minimum of sputtering depositsin the bore and on the anode. To date we have not been able to completely suppress theflickering of the cathode spot in the Ag-CuO cathodes. Pure Cu cathodes show the sameeffect for current densities above 18 mA/cm2. Lowering the current density to 12 mA/cm2
stabilizes these cathodes at the expense of increased sputtering. The sputtering productsare still confined to the cathode area, and if the results of the gas analysis continue toconfirm the excellent appearance of the 10,000 hour-old discharge tubes, we may verywell have the best overall results with the pure Cu cathode. This solution would also bevery attractive from the point of view of simplicity: namely a simple cathode working withthe least complicated efficient gas mixture available.
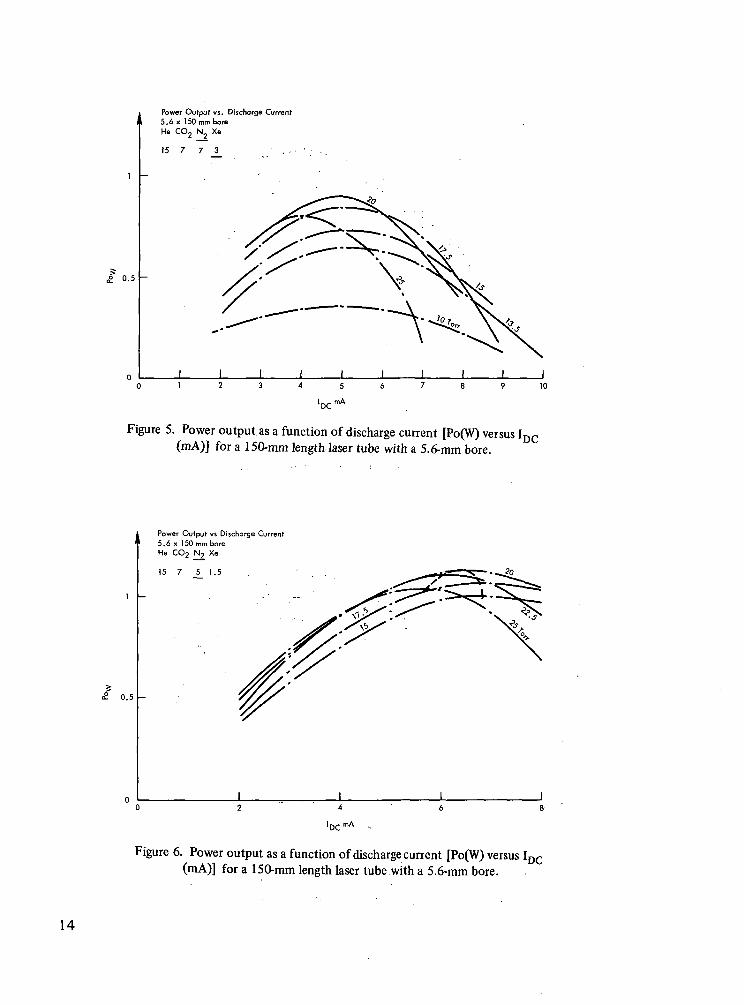
Surprisingly good discharge characteristics are shown in Figure 55 for a Pt cathode alloycontaining 30 percent Cu in combination with a He-CO2-N2-Xe gs mixture. This resulthas to be reproduced and confirmed by gas analysis. The cathode itself seems to beelectrically quiet but produces anode deposits. Much more experience is needed withthis cathode type and we are exploring the influence of the composition of the Pt-Cu alloy.However, from an engineering point of view we have some reservations. The addition of asmall amount of H2 or H2 O very much increases the complexity of the cathode problem.New chemical compounds can be formed and it is of course very well known that thecontrol of the hydrogen pressure depends to a certain extent on the surface propertiesof the materials used for the fabrication of the laser tube.
ACKNOWLEDGMENTS
This work was initiated at the University of Maryland by fundings from ONR, ARPA, andcontinued by NASA. Some of the CO and CO2 absorption measurements are from part ofCarvel Holton's master's thesis which is in preparation.
Goddard Space Flight CenterNational Aeronautics and Space Administration
Greenbelt, Maryland, February 9, 1973604-42-01-01-51
10

REFERENCES
1. C. K. N. Patel, W. L. Faust, and R. A. McFarlane. "CW Laser Action on RotationalTransitions of the E+ - S+ Vibrational Band of CO2." Bull. Am. Phys. Soc.,9. April 27, 1964. p. 500.
2. R. J. Carbone. "Long-term Operation of a Sealed CO2 Laser." IEEE/. Q. E., Vol. QE-3.September 1967. pp. 373-375.
3. W. J. Witteman. "Increasing Continuous Laser Action on CO2 Rotational VibrationalTransitions through Selective Depopulation of the Lower Laser Level by Means ofWater Vapor." Phys. Letters, 18. August 15, 1965. p. 125.
4. Norio Karube and Eiso Hamaka. "Decomposition of CO2 Molecules in a Sealed CO2
Laser." /. Appl. Phys., 9. 1969. p. 3883.
5. W. J. Witteman and H. W. Werner. "The Effect of Water Vapor and Hydrogen on theGas Composition of a Sealed-Off CO2 Laser." Phys. Letters, 26A. April 1968. p. 454.
6. E. N. Lotkova, V. N. Ochkin, and N. N. Sobolev. "Dissociation of Carbon Dioxide andInversion in CO2 Laser." IEEE/ Q. E., 1. 1971. p. 396.
7. D. V. Ignatov. "Recherches Electronographiques sur les Pellicules d'Oxydes Apparais-sant sur 1'Aluminium et le Nickel dans une De charge Electriqueen Millieu Gazeuxd'Oxygene." /. Chim. Phys., 54. 1957. p. 96.
8. U. Hochuli and P. Haldemann. "Indium Sealing Techniques." Rev. Sci. Instr., 43.1972. p. 1088.
9. Ernst Raub and Max Engel. "Zundern Kupferhaltiger Legierungen der Edelmetalle."Z. f. Metallkunde, 38. 1938. p. 83.
10. M. Katz. Advances in Catalysis. Academic Press, Inc., New York, 1953.
11. Jacques Benard. L'Oxidation des Metaux, Vol. 1. Gauthier-Villars and Co., Paris,1962. p. 126.
12. O. Kubachewski. "Das Verhalten von Platin-und Goldlegierungen mit Kupter."Z. Elektrochem., 49. 1943. p. 451.
13. S. Dushman and J. M. Lafferty. Scientific Foundations of Vacuum Technique, 2nd ed.,John Wiley and Sons, Inc., New York, 1967. p. 647.
11

0.5
Power Output vs Discharge Current5.6 x 150mm boreHe C0
15
2
7 7
Xe
0.5
4
IDC mA
Figure 1. Power output as a function of discharge current [Po(W) versus IDC
(mA)] for a 150-mm length laser tube with a 5.6-mm bore.
0.5
Power Output vs Discharge Current5.6 x 150 mm boreHe CO2 N2 Xe
15 7 7 1
'DC'
Figure 2. Power output as a function of discharge current [Po(W) versus IDC
(mA)] for a 150-mm length laser tube with a 5.6-mm bore.
12

Power Output vs Discharge Current5.6 x 150 mm boreHe CO2 Nj Xe
15 7 7 1.5
!DcmA
Figure 3. Power output as a function of discharge current [Po(W) versus IDC
(mA)] for a 150-mm length laser tube with a 5.6-mm bore.
0.5
Power Output vs. Discharge Current5.6 x 150 mm boreHe COj N Xe
15 7 7 2
Figure 4. Power output as a function of discharge current [Po(W) versus IDC
(mA)] for a 150-mm length laser tube with a 5.6-mm bore.
13
£ 0.5
Power Output vs. Discharge Current5.6 x 150 mm boreHe CO2 N Xe
\5 7 7 3
'DC
5
mA
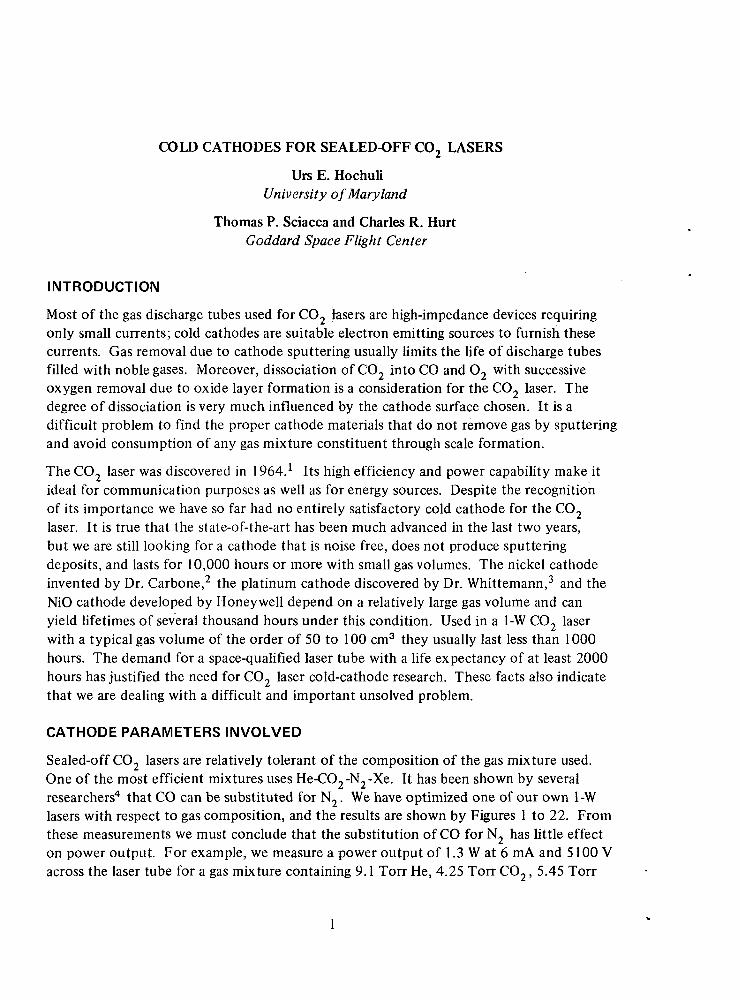
Figure 5. Power output, as a function of discharge current [Po(W) versus IDC
(mA)] for a 150-mm length laser tube with a 5.6-mm bore.
0.5
Power Output vs Discharge Current5.6 x 150 mm boreHe COj N2 Xe
15 5 1.5
'DC'
Figure 6. Power output as a function of discharge current [Po(W) versus IDC
(mA)] for a 150-mm length laser tube .with a 5.6-mm bore.
14

0.5
Power Output vs Discharge Current5.6 x 150 mm boreHe CO2 N2 Xe
15 7 7 1.5 _—-*^S ""fSL
4
IDC mA
Figure 7. Power output as a function of discharge current [Po(W) versus IDC
(mA)] for a 150-mm laser tube with a 5.6-mm bore.
0.5
Power Output vs Discharge Current5.6 x 150 mm boreHe CO2 N2 Xe
15 7 9 1.5 .'. • '
Figure 8. Power output as a function of discharge .current [Po(W) versus IDC
(mA)] for a 150-mm length laser tube with a 5.6-mm bore.
15

0.5
Power Output vs Discharge Current5.6 x 150 mm bore
15 5 7 1.5
25 I
Figure 9. Power output as a function of discharge current [Po(W) versus IDC
(mA)] for a 150-mm length laser tube with a 5.6-mm bore.
0.5
Power Output vs Discharge Current5.6 x 150 mm boreHe CO N Xe
15 7 7 1.5
'DC'
Figure 10. Power output as a function of discharge current [Po(W) versus IDC
(mA)] for a 150-mm length laser tube with a 5.6-mm bore.
16

0.5
Power Output vs Di schorge Current5.6 x 150 mm boreHe CO N Xe
15
2 2
9 7 1.5
!DC mA
Figure 11. Power output as a function of discharge current [Po(W) versus Ij}^(mA)] for a 150-mm length laser tube with a 5.6-mm bore.
1.3
0.8
0.3
Power Output vs Discharge Current5.6 x 150 mm bore
15 7 7 1
10
Figure 12. Power output as a function of discharge current [Po(W) versus Ij(mA)] for a 150-mm length laser tube with a 5.6-mm bore.
17

1.3
0.8
0.3
Power Output vs Discharge Current5,6 x 150 mm boreHe C02 CO Xe
15 7 2
10
'DC mA
Figure 13. Power output as a function of discharge current [Po(W) versus IDC
(mA)] for a 150-mm length laser tube with a 5.6-mm bore.
1.3
0.3
Power Output vs Discharge Current5.6 x 150 mm boreHe CO CO Xe
15 7 7 3
17.5
5
'DC mA
Figure 14. Power output as a function of discharge current [Po(W) versus IDC
(mA)] for a 150-mm length laser tube with a 5.6-mm bore.
18

1.3
0.8
0.3
Power Output vs Discharge Current5.6 x 150 mm boreHe C02 CO Xe
1 5 7 5 2
!DCmA
Figure 15. Power output as a function of discharge current [Po(W) versus IDC
(mA)] for a 150-mm length laser tube with a 5.6-mm bore.
1.3
0.8
0.3
Power Output vs Discharge Current5.6 x 150 mm boreHe CO2 CO Xe
1 5 7 7 2
10
Figure 16. Power output as a function of discharge current [Po(W) versus IDC
(mA)] for a 150-mm length laser tube with a 5.6-mm bore.
19

1.3
0.8
0.3
Power Output vs. Discharge Current56 x 150 mm boreHe CO2 CO Xe
17.5
15 9 .2
10
(DC mA.
Figure 17. Power output as a function of discharge current [Po(W) versus IDC
(mA)] for a 150-mm length laser tube with a 5.6-mm bore.
0.5
Power Output vs. Discharge Current56 x 150 mm boreHe CO2 CO Xe15 7 11 2
I5
IDC
10
Figure 18. Power output as a function of discharge current [Po(W) versus IDC
(mA)] for a 150-mm length laser tube with a 5.6-mm bore.
20

1.3
0.8
0.3
Power Output vs Discharge56 x 150 mm boreHe CO2 CO Xe
15 3 7 2
22.5
10
Figure 19. Power output as a function of discharge current [Po(W) versus IDC
(mA)] for a 150-mm length laser tube with a 5.6-mm bore.
1.3
0.8
0.3
Power Output vs. Discharge Current56 x 150 mm bore
He CO2 CO Xe
15 5 7 2
10
Figure 20. Power output as a function of discharge current [Po0V) versus IDC
(mA)] for a 150-mm length laser tube with a 5.6-mm bore.
21

1.3
<£ 0.8
0.3
Power Output vs Discharge Current5.6 x 150 mm boreHe CO2 CO Xe1 5 7 7 2
10
Figure 21. Power output as a function of discharge current [Po(W) versus IDC
(mA)] for a 150-mm length laser tube with a 5.6-mm bore.
0.5
Power Output5.6 x 150 mmHe CO2 CO
vs Discharge CurrentboreXe
15 9 7 2
5
IDC mA
10
Figure 22. Power output as a function of discharge current [Po(W) versus IDC
(mA)] for a 150-mm length laser tube with a 5.6-mm bore.
22

0.5
Power Output vs. Discharge Current5.6 x 150 mm boreHe COj N2 Xe H2
15 7 2 0
10
Figure 23. Power output as a function of discharge current [Po(W) versus IDC
(mA)] for a 150-mm length laser tube with a 5.6-mm bore.
0.5
Power Output vs Discharge Current5.6 x 150 mm boreHe CO2 N2 Xe H2
.15 7 7 2 0.1
IDC mA
Figure 24. Power output as a function of discharge current'[Po(W) versus(mA)] for a 150-mm length laser tube with a 5.6-mm bore.
23

0.5
Power Output vs Discharge Current5.6 x 150 mm boreHe CO, N, Xe H
15
10
Figure 25. Power output as a function of discharge current [Po(W) versus IDC
(mA)] for a 150-mm length laser tube with a 5.6-mm bore.
0.5
Power Output vs Discharge Current5.6 x T50 mm boreHe CO2 N2 Xe H2
15 7
I5
I[)C mA
Figure 26. Power output as a function of discharge current [Po(W) versus IDC
(mA)] for a 150-mm length laser, tube with a 5.6-mm bore.
24

e-8I*IB
Irfe c3 g| 32 •»J3 3•£ "CQ kH
u g00fN<u
a
uj e
t!
aI
r-CN<D
25

log [CO/CO2 ratio]
/H5O ratio] 7 7. n -8 -7
l°910 [Po2 atm]
S"-4
H
C
20
r 0
-20
-40
-60
-80
-100
b -120
CN-140o
x"
-160
-180
-200
-220
-240
-260
-280
absolute
500
/ / S S S S-8 -7 -6 -5 -4. -3 -2
1000 1500 2000 T°C
1000 1500 200014 13
N. V
13 12
-2
-
T°C
-2
-3
-6
10
-10
-12
-14
-16
-18
-20
12 11
10 10 -22
zero -200 -150-100-90-80-70 -60 -50 -42 -38 -34 -30 -28 -26i i \ \ \ \ \ \ \ \ \ \ \ \
-24\
Figure 29. Standard free energy of formation of oxides as a functionof temperature.
26

1000 700 600 500 400 350 300 °K
-40
K \
Figure 30. Dissociation pressure of oxides as a function of temperature.
27

CATHODE (TYPE 1 LX OR 2 LX)
\Pt ANODE
PYREX ENVELOPE WITH25cm3 GAS VOLUME
1"I 1
Figure 31. Discharge tube.
PYREX ENVELOPE
IRTRAN 2 WINDOW
INDIUM SEAL
1"
Figure 32. Infrared absorption cell.
28

100
90
80
70
60
L1JU
E 505LOZ
i—
40
30
20
10
2500
WAVENUMBER, cm-12000
Figure 33. Infrared spectrum of CO2 and CO in a gas mix of 20.1 ton totalpressure (4.7 CO2; 4.7 CO; 0.7 Xe; and 10 torr He) in a 7.8 cm path length cellemploying a Digilab FTS-14 with equivalent slit width of 8 cm"7.
29

u
It/j
1
2500 2000 cm"1
Figure 34. Infrared absorption spectrum of C02 and CO (expanded scale).
30

L. IO
2:04
1.92
1.80
1.68
1.56
1.44
'g 1.32c
4» 1.20o
-- 1.08.*"0£ .96o" -84o
1 -72tn
^ .60OU
.48
.36
.24
.12
n
.
/
/
/
/f
j
/
/
'
/
>
/
y^
/^/^
/
y/
3 4 5 6 7 8 9 1 0 1 1 1 2
COn Pressure, torr
Figure 35. Hot of absorption coefficient, a, of pure CO2 versus C02 pressurefor a = [ln(Io/I])/x measured at V =2355 cm"1, x = 8 cm and 75° F temperature,and 8 cm"1 equivalent slit width.
31

0.0
3.4
3.2
3.0
2.8
2.6
r- 2.4i
I 2.2'o
"Z 2.0
I 1-8
"o
1 1.6u
I I-4
"Q.8 i ?
_Q 1 ,t-
8 i.o.8
.6
.4
.2
n /
>
/
/
'
,
/
/
/
/f
'j
/
/
/
/
/
/
/
'
j
/
2 3 4 5 6 7 8 9
CO Pressure, torr
10 11 12
Figure 36. Plot of absorption coefficient, a, of pure CO versus CO pressure fora = [ln(Io/I)] /x measured at V = 2175 cm'1, x = 8 cm and 75° F temperature, and8 cm"1 equivalent slit width.
32

CMO
<uOU
O
CN
OU
2.16
2.04
1.92
1.80
1.68
1.56
1.44
1.32
1.20
1.08
.96
.84
.48
.36
.24
.12
10 11 12
CO2 Partial Pressure, torr
Figure 37. Plot of absorption coefficient, a, of C02 versus partial pressure, P,for a gas mixture of 20 torr total pressure (P torr C02, 10-P torr CO, 9.4 torr He,0.6 torr Xe) and a = [ln(Io/I>] /x measured at V = 2355 cm"1 , x = 8 cm and 75° F,andi 8 cm"1 equivalent slit width.
33

o_c
a
cQ)
Q>
6c
^o^zB-S
-Q
O
3.6
3.4
3.2
3.0
2.8
2.6
2.4
2.2
2.0
1.8
?.6
1.4
1.2
1.0
.8
.6
.4
CO Partial Pressure, torr
10 11 12
Figure 38. Plot of absorption coefficient, a, of CO versus CO partial pressure, P,for a gas mixture of 20 torr total pressure (P torr CO, 10-P torr CO2, 9.4 torr He,0.6 torr Xe) and a = [ln(Io/I)] /x measured at V = 2175 cm"1, x = 8 cm and 75° F,and 8 cm"1 equivalent slit width.
34

1 .44
1.36
1.28
1.20
1.12
1.04
.96
.88i
I .80
0 .72
23- .64
.*
<3 .48.0
t .40
J
o"U .24
.16
.08
n
XX
Xx/
X/
xx
X
8 12 16
HeXe Partial Pressure, torr
20 24
Figure 39. Plot of absorption coefficient, a, of 4.65 torr C02 versus HeXepartial pressure, P, for a gas mixture of P + 4.65 torr total pressure anda = [ln(Io/I)]/x measured at V = 2355 cm'1, x = 8 and 75° F and 8 cm"1
equivalent slit width.
35

i. 10
^2.04
1.92
1.80
1.68
1.56
1.44
\ 1.32
% 1.20
I L08
°o1 -96
6§ -84
I .72_Q<
O .60O
.48
.36
.24
.12
n
XX
xsJlf
XX/
xX
XX/
^
8 12 16
HeXe Partial Pressure, torr
20 24
Figure 40. Hot of absorption coefficient, a, of 4.65 torr CO versus HeXepartial pressure, P, for a gas mixture of P + 4.65 torr total pressure anda = [ln(Io/I)]/x measured at V = 2175 cm'1, x = 8 and 75° F and 8 cm'1
equivalent slit width.
36

<
•o
6uCM
O(Jv
5
.O
TORR
CO *O "̂ CM O
COe i10 'CM ;
i i r
2 O3:
8
ooCO
8CM
8
CMOo•o
-
2 S
s•a "«S §
opU-
t'/A
37

Du
CM
OD)
10 20
r (HOURS)(A)
30 40
0 10 20 30 40 50 60 70
SILVER % BY WEIGHT
(B)
80 90 100
Figure 42. Silver-copper alloys: (A) internal oxidation of alloys versus time at750° C in 1 atm of oxygen; (B) oxidation of alloys versus percent compositionwith curves 1 through 6 for oxidation times of 0.5, 3,10, 20, 30, and 40 hoursrespectively at 750° C in 1 atm of oxygen (from E. Raub and U. Engel, Z. F.Metalkunde, 30, 1938, p. 83.
38

I I IHe-CO2-N2-Xe 15:7:7:1, 20 TORR TOTAL, 6mA
2L4.5, 50 at.
_L
103
t (HOURS)
Figure 43. Silver-cadmium oxide cathode (Ag 0.8 Cd/0): voltage versus operatingtime (upper curve); CO2 partial pressure versus operating time (lower curve).
I I
I I
THe-CO2-N2-Xe 15:7:7:1, 20 Torr total, 6mA
2L4.5, 50cm3
CO
6
4 1
2
0
100 200 I03
Figure 44. Silver-cadmium oxide cathode (Ag 5 Cd/0):. voltage versus operating time(upper curve); CO2 and CO partial pressures versus operating time {lower curves).
39

1 IHe-CO2-N2-Xe J5:7:7:l,- 20 Ton- total, 6mA
2U.5, 50cm
\
103
t(HOURS)
to"
Figure 45. Silver-cadmium oxide cathode (Ag 10 Cd/0): voltage versusoperating time (upper curve); C02 and CO partial pressures versus operatingtime (lower curves).
I T 1He-CO2-N2- Xe 15:7:7:1, 20 TORR TOTAL, 6mA
100
2L4.5, 50 cm0
'\
\
_L
io3
t (HOURS)
4 _
O
10*
Figure 46. Silver-cadmium oxide cathode (Ag 20 Cd/0): voltage versus operat-ing time (upper curve); C02 and CO partial pressures versus operating time(lower curves).
40

\ I
\
He-CO2-CO-Xe 15:7:7:1, 20 Torr total, 4mA
2L4.5, 50cm3
I I I
0 100 200 103
t(HOURS)
Figure 47. Silver-copper oxide insulated cathode (Ag 5 Cu/0): voltage versusoperating time (upper curve); C02 and CO partial pressures versus operatingtime (lower curves).
I I
He-CO2-CO-Xe 15:7:7:1, 20 Torr total, 6mA
2U.5, 50 cm3
C02
100
103
t(HOURS)
Figure 48. Silver-copper oxide insulated cathode (Ag 10 Cu/0): voltage versusoperating time (upper curve); C02 and CO partial pressures versus operatingtime (lower curves).
41

400
300
I I
J I
IHe-CO2-CO-Xe 15:7:7:1, 20 TORR TOTAL, 6mA
2L 4.5, 50 on3
C02
I
100 200 103
I (HOURS)
Figure 49. Silver-copper oxide insulated cathode (Ag 20Cu/0): voltage versusoperating time (upper curve); C02 and CO partial pressures versus operating time(lower curves).
I I
300
I
He-CO2-CO-Xe 15:7:7:1, 20 TORR TOTAL, 6mA, 25cm3
, 2L4.5 Ag 3Mn/O
2L4.5Ag lOMivAD
2L4.5Ag 1.25Mn/O
0 100 200 10°
I (HOURS)
10"
Figure 50. Silver-manganese dioxide cathodes (Ag-Mn/0): voltage versus
operating time.
42

i r rHe-CO2-N2-X« 15:7:7:1, 20 TORR TOTAL, 6mA
300
IL4 .5 , 50cm3
200
\
co2
CO
100 200 103
t (HOURS)
104
Figure 51. Silver-nickel oxide cathode (AG 15 Ni/0): voltage versus operatingtime (upper curve); C02 and CO partial pressures versus operating time (lowercurves).
n—r 1He-CO2-CO-Xe 15:7:7:1, 20 TORR TOTAL, 6mA
C02
J L100 200 103
t (HOURS)
10*
Figure 52. Silver-zinc oxide cathode (Ag 10 Zn/O):. voltage versus operating time(upper curve); C02 and CO partial pressures versus operating time (lower curves).
43

400 n rX 25 cm3 He-CO2-CO-Xe 15:7:7:1, 20 TORR TOTAL
A 50 cm3 He-CO2-CO-Xe 15:7:7:1, 20 TORR TOTAL
200
Figure 53. Copper cathodes (1L 4.5 Cu): voltage versus operating time (uppercurves); C02 and CO partial pressures versus operating time (lower curves).
I I IO 25cm3H«-CO2-N2-Xe-H2 15:7:7:1:0.3, 20 TORR TOTAL, 6mA
£ 50 cm3 Ha-CO2-N2-Xe-H2 15:7:7:1:0.3, 20 TORR TOTAL, 6mA
-X X-
20% Au
100 200 10°
t (HOURS)
Figure 54. Platinum-gold cathodes (3L 10 Pt-Au): voltage versus operating time.
44
!i Cu, 25 cmj
He-CO2-N2-Xe-Hj 15:7:7:1:0.3, 20 TORR TOTAL, 6mA
1911 Cu, 50 em3
J L I
103
t (HOURS)
Figure 55. Platinum-copper cathodes (3L 10 Pt-Cu): voltage versus operating time.
N.
5.6 X 150n™ BORE, H4.5 NI270 CATHODE53 cm3 GAS VOLUME, 20 TORR He-COj'CO'Xe 15:7:7:15KV,7mA
_!_ L103
t (HOURS)
10*
Figure 56. C02 laser power output versus time.
45

W
5.5 X 150mm BORE, lU.SAg 20 Cu/0 CATHODE53 cm3 GAS VOLUME20 TORR He- CO2- CO-Xe 15:7:7:1
5100V 5.5mA
0.5
100 200 10°
t (HOURS)
104
Figure 57. CC>2 laser power output versus time.
46

APPENDIX
LASER V-I CHARACTERISTICS AND LASER POWER OUTPUT
LASER V-I CHARACTERISTICS FOR DIFFERENT GAS MIXTURES
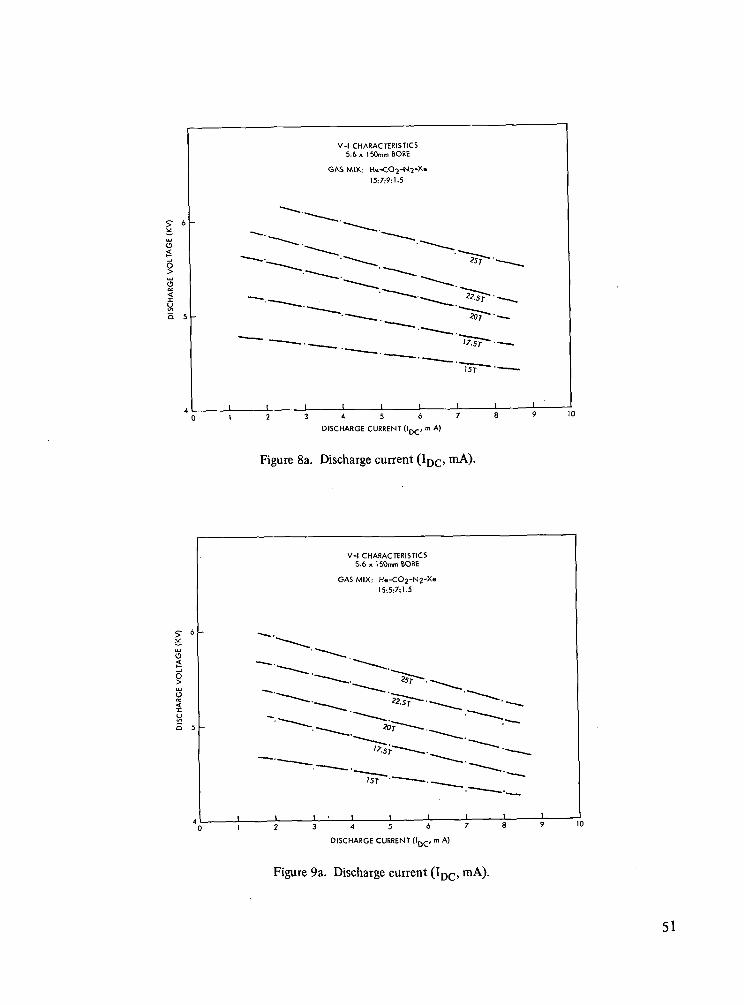
These characteristics are shown in Figures la to 26a. The voltages shown represent the valuesdirectly across the laser tube and do not include series resistance drop. Figure 27a shows thedesign of the laser tube. In numbering the figures in this appendix, some numbers have beenomitted, in order to maintain a direct correspondence with previous figures.
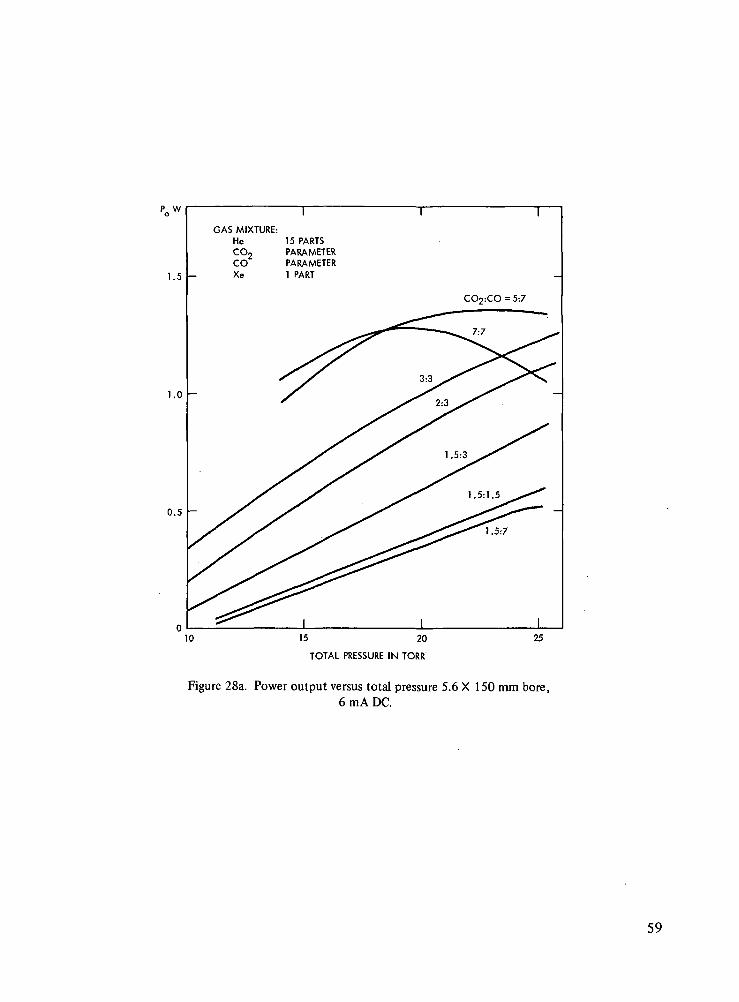
LASER POWER OUTPUT FOR MIXTURES WITH LOW CO and CO2 CONTENT
This information is shown in Figures 28a and 29a and is useful in determining the laser out-put near the end of the life, when the CO2 and CO concentrations have fallen off from theirinitial values.
47

V-l CHARACTERISTICS5.6 x 150mm BORE
GAS MIX: He-CO2-N2-Xe15:7:7:0.5
SOGC
DISCHARGE CURRENT dDC, m A)
Figure la. Discharge current (Ijx:>
V-l CHARACTERISTICS5.6 x 150mm BORE
GAS MIX: He-CO2-N2-Xe15:7:7:1
ooc
2 3 4 5 6 7
DISCHARGE CURRENT dDC, m A)
Figure 2a. Discharge current (IDc,
48

V-l CHARACTERISTICS5.6 x 150mm BORE
GAS MIX: He-CO2-N2-Xe
15:7:7:1.5
o
DISCHARGE CURRENT (lpc, m A)
Figure 3a. Discharge current (IDC, mA).
V-l CHARACTERISTICS5.6 x 150mm BORE
GAS MIX: He-CO2-N2-Xe
15:7:7:2
§
tI 0 4 5 6
DISCHARGE CURRENT (lnr, m A)
Figure 4a. Discharge current (IDC> mA).
49

! 3 4 5 6 7
DISCHARGE CURRENT (IDC, m A)
Figure 5a. Discharge current (IDC, mA).
V-l CHARACTERISTICS5.6 x 150mm BORE
GAS MIX: He-CO2-N2-Xe15:7:5:1.5
,O>
O
3 4 5 6 7' " 8
DISCHARGE CURRENT (IDC, m A)
Figure 6a. Discharge current (IDC, mA).
50
V-l CHARACTERISTICS5.6 x 150mm BORE
GAS MIX: He-CO2-N2-Xe
15:7:9:1.5
O
3 4 5 6 7
DISCHARGE CURRENT (loc/ m A)
Figure 8a. Discharge current
V-l CHARACTERISTICS5.6 x 150mm BORE
GAS MIX: He-CO2-N2-Xe15:5:7:1.5
O
IO<x
DISCHARGE CURRENT (loc/ m A)
Figure 9a. Discharge current (IDc> mA).
51
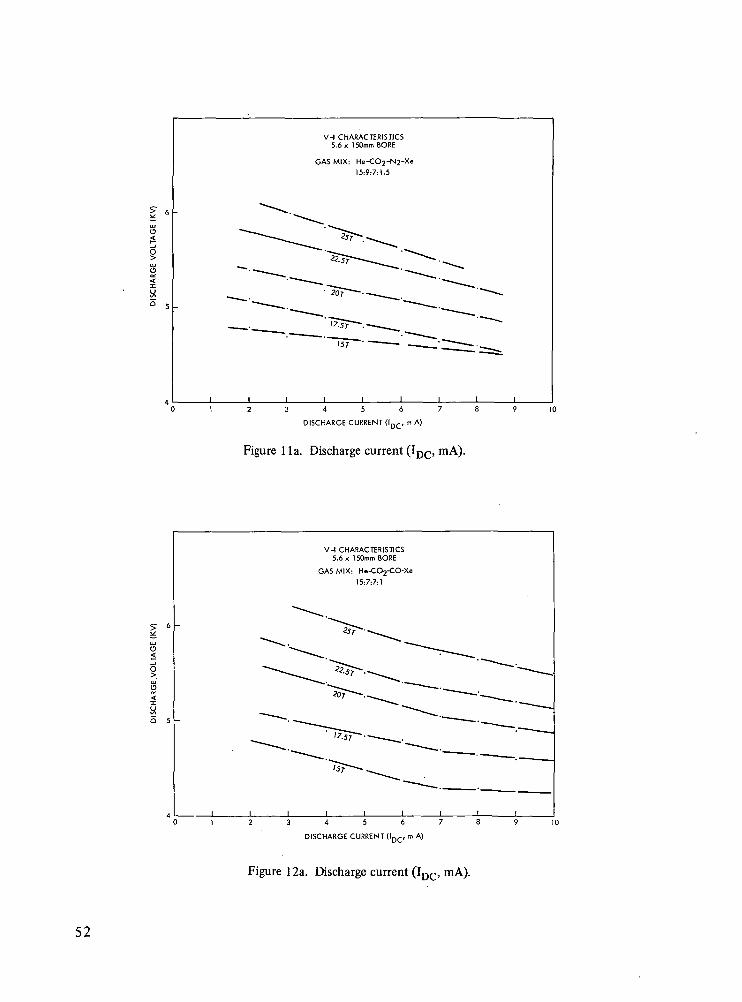
VH CHARACTERISTICS5.6 x 150mm BORE
GAS MIX: He-COj-Nj-Xe
15:9:7:1.5
2 3 4 5 6 7
DISCHARGE CURRENT (ID(-, m A)
Figure 1 la. Discharge current (IDC, mA).
V-l CHARACTERISTICS5.6 x 150mm BORE
GAS MIX: He-CO2-CO-Xe
15:7:7:1
§.
XQ 5
2 3 4 5 6 7
DISCHARGE CURRENT (IDC/ m A)
Figure 12a. Discharge current (IDc>
52
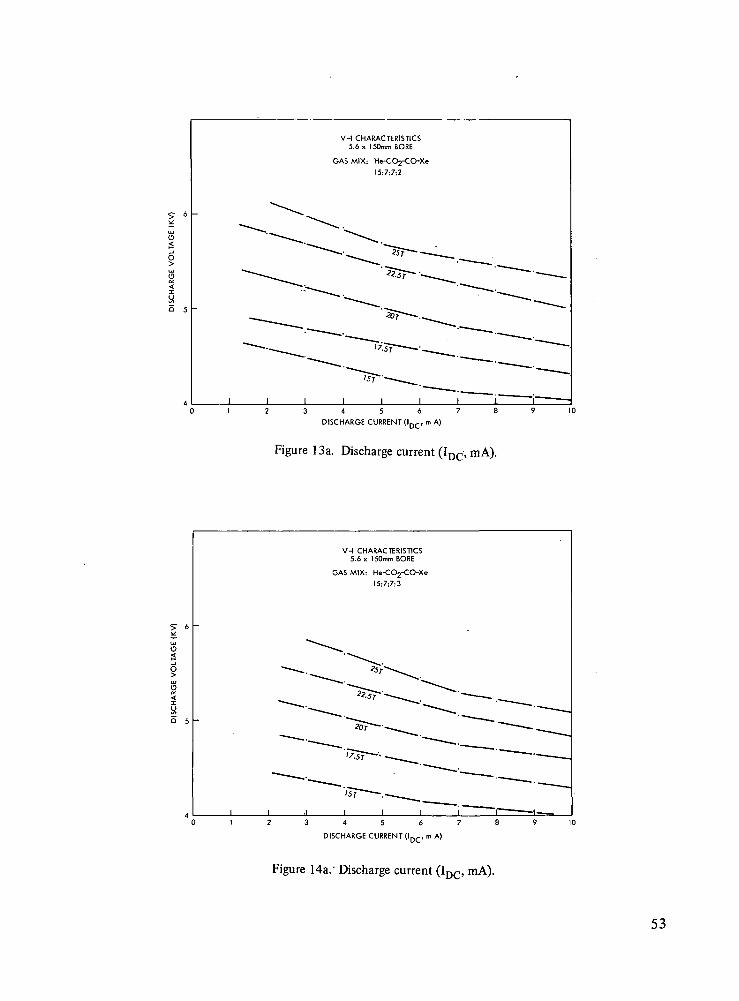
V-l CHARACTERISTICS5.6 x 150mm BORE
GAS MIX: He-CO2-CO-Xe
15:7:7:2
3 4 5 6 7 8
DISCHARGE CURRENT (ID(-, m A)
Figure 13a. Discharge current (IDC, mA).
DISCHARGE CURRENT (IDC, m A)
Figure 14a.' Discharge current (IDC, mA).
53

3 4 5 6 7
DISCHARGE CURRENT (IDC, m A)
Figure 15a. Discharge current (IDC> mA).
9 10
3 . 4 5 6 7
DISCHARGE CURRENT (lnr, m A)
Figure 17a. Discharge current 0rx:>
54

V-l CHARACTERISTICS5.6 x.l 50mm BORE
GAS MIX: He-COz-CO-Xe
15:7:11:2
O
3 4 5 6 7
DISCHARGE CURRENT (IDC, m A)
Figure 18a. Discharge current (Ijx;>
3 4 5 6 7
DISCHARGE CURRENT (ID(;, m A)
Figure 19a. Discharge current (Ijx:>
55

2 3 4 5 6 7
DISCHARGE CURRENT (lpc, en A)
Figure 20a. Discharge current (IDC, mA).
2 3 4 5 6 7
DISCHARGE CURRENT (lDC,m A)
Figure 22a. Discharge current (IDC, mA).
56

GAS MIX: He-CO2-N2"Xe"H215:7:7:2:0.1
3 4 5 6 7
DISCHARGE CURRENT (IDC, m A)
Figure 24a. Discharge current (IDC>
•> 6 -
V-l CHARACTERISTICS5.6 x 150mm BORE
GAS MIX: He-CO2-N2-Xe-H2
15:7:7:2:0.2
3 4 5 6 7
DISCHARGE CURRENT (I-.-, m A)
Figure 25a. Discharge current (Ij)c>
57

O>
O
V-l CHARACTERISTICS5.6 x 150mm BORE
GAS MIX: He-CO2-N2-Xe-H2
15:7:7:2:0.3
i3 , . 4. .5 6 7
DISCHARGE CURRENT (IDO m A)
Figure 26a. Discharge current (Irjc>
CO2 LASER
5.6 X 150mm BORE
2cm
Figure 27a. C02 laser; 5.6 X 150 mm bore.
58
P W
1.5
1.0
0.5
GAS MIXTURE:He 15 PARTSCO2 PARAMETERCOXe
PARAMETER1 PART
CO2:CO = 5:7
10 15 20
TOTAL PRESSURE IN TORR
25
Figure 28a. Power output versus total pressure 5.6 X 150 mm bore,6 mA DC.
59

P0 W
1.5
I
GAS MIXTURE:He 15 PARTSCO2 PARAMETERCO PARAMETER.Xe 2 PARTS
7:9
1.0
0.5
CO2:CO = 5:7
10 15 20
TOTAL PRESSURE IN TORR
25
Figure 29a. Power output versus total pressure 5.6 X 150 mm bore, 6 mA DC.
60 NASA-Langley, 1973 16

NATIONAL AERONAUTICS AND SPACE ADMINISTRATION
WASHINGTON, D.C. 2O546
OFFICIAU BUSINESS
PENALTY FOR PRIVATE USE S3OO SPECIAL FOURTH-CLASSBOOK
RATE
POSTAGE AND FEES PAIDNATIONAL AERONAUTICS AND
SPACE ADMINISTRATION4SI
POSTMASTER : If Undeliverable (Section 158Postal Manual) Do Not Return
"The aeronautical and space activities of the United States shall beconducted so as to contribute . . . to the expansion of human knowl-edge of phenomena in the atmosphere and space. The Administrationshall provide for the widest practicable and appropriate disseminationof information concerning its activities and the results thereof."
—NATIONAL AERONAUTICS AND SPACE ACT OF 1958
NASA SCIENTIFIC AND TECHNICAL PUBLICATIONSTECHNICAL REPORTS: Scientific andtechnical information considered important,complete, and a lasting contribution to existingknowledge.
TECHNICAL NOTES: Information less broadin scope but nevertheless of importance as acontribution to existing knowledge.
TECHNICAL MEMORANDUMS:Information receiving limited distributionbecause of preliminary data, security classifica-tion, or other reasons. Also includes conferenceproceedings with either limited or unlimiteddistribution.
CONTRACTOR REPORTS: Scientific andtechnical information generated under a NASAcontract or grant and considered an importantcontribution to existing knowledge.
TECHNICAL TRANSLATIONS: Informationpublished in a foreign language consideredto merit NASA distribution in English.
SPECIAL PUBLICATIONS: Informationderived from or of value to NASA activities.Publications include final reports of majorprojects, monographs, data compilations,handbooks, sourcebooks, and specialbibliographies.
TECHNOLOGY UTILIZATIONPUBLICATIONS: Information on technologyused by NASA that may be of particularinterest in commercial and other non-aerospaceapplications. Publications include Tech Briefs,Technology Utilization Reports andTechnology Surveys.
Details on fhe availability of these publications may be obtained from:
SCIENTIFIC AND TECHNICAL INFORMATION OFFICE
N A T I O N A L A E R O N A U T I C S A N D S P A C E A D M I N I S T R A T I O N
Washington, D.C. 20546