nasa technical memorandum · 2013-08-31 · nasa technical memorandum nasa tm x-64578 igw altitude...
TRANSCRIPT

NASA TECHNICAL MEMORANDUM
NASA TM X-64578
IGW ALTITUDE METEOROLOG JCAL ROCKET W IND MEASURING SYSTEMS
ESULTS TAKEN AT C PE KE~NEDY, FLORIDA
By R. E. Turner, D. L. Johnson, andL. P. Gilchrist Aero- As trodynamic s Laboratory
March 30, 119711
AS A
HSFC ., Form 3190 (September 1968)
https://ntrs.nasa.gov/search.jsp?R=19710014563 2020-03-13T05:40:27+00:00Z

NASA TM X-64578 I I OR1 D %farch?%, 1971 1. TITLE AND SUBTITLE
HIGH ALTITUDE METEOROLOGICAL ROCRET SYSTEMS AND RESULTS TAREN AT CAPE 6. PERFORMING ORGANIZATION CC@E
TECHNICAL MEMORANDUM
15. SUPPLEMENTARY NOTES
Prepared by Aero-Astrodynamics Laboratory, Science and Engineering
16. ABSTRACT
Mesospheric wind d a t a between 65-85 kilometer a l t i t u d e s a t Cape Kennedy, F lor ida , as determined from the Cajun D a r t , Super Loki D a r t , and Hopi D a r t rocket systems from February 1964 through Apr i l 1970 are presented. th ree vehic le systems are indiv idua l ly described i n d e t a i l . systems d e l i v e r wind-sensit ive a lumhized mylar chaf f , which is e jec ted above 90 kilometers. Wind f l aw d a t a are obtained by radar t racking of the chaf f , which is f r e e t o . d r i f t with the wind 88 it falls. Wind data measurements made once d a i l y from March 19 t o Apri l 21, 1970, were analyzed and an e r r o r ana lys i s of the measuring system made.
The These rocket
The da ta reduction methods are a l s o described.
17. KEY WORDS
Meteorological Rockets, Chaff, Wind, High A l t i t u d e Mesosphere
18. Dl STR i BUT ION STATEMENT
Unclassified - unlimited
(T -$& $E. D. Geiss le r
Director , Aero-Astrodynamics Laboratory
21. NO. OF PAGES 22. PRICE ;IF. (of this page)


TABLE OF CONTENTS
I . .RODUCTION ........................................... I
11. VEHICLE DESCRIPTION .................................... A . C a j u n - D a r t System .................................. B . Super L o k i - D a r t System ............................. C . H o p i - D a r t System ...................................
I11 . TEST RESULTS ........................................... A. Special M o n t h Long Series .......................... B . P r e l i m i n a r y A n a l y s i s ...............................
I V . BATA ACCURACY ..........................................
V .
A . B . C .
Radar Tracking E r r o r s .............................. E r r o r s i n R e s p o n s e of Chaff to the Wind ............ D a t a R e d u c t i o n E r r o r s .............................. 1 . D a t a R e d u c t i o n Procedure ....................... 2 . E r r o r s i n D a t a R e d u c t i o n .......................
CONCLUSIONS ............................................
1
2
2 4 5
6
9 10
11
11 12 13 13 16
16
iii

LIST OF ILLUSTRATIONS
T i t l e . Figure
1 Cajun-Dart Vehicle ........................... ..-... 2 C a j u n - D a r t I g n i t e r Syst. ........................... 3 Cajun-Dart Vehicle and Launcher ..................... 4 Super Loki-Dart Vehicle ............................. 5 Super Loki-Dart Launcher ............................ 6 Hopi-Dart Vehicle ................................... 7 Hopi-Dart Vehicle and Lallllcher ...................... 8 Hopi-Dart Measured Wind Prof i les . Cape Kennedy. : I 1 . .Rlorbda. . Febkuary 1964 .............................. 9
10
11
12
13
14
15
16
17
Cajun-Dart Measured Wind Prof i les . Cape Kennedy. Florida. February 1965 .............................. Cajun-Dart Measured Wind P r o f i l e s . Cape Kennedy. Florida. March 1965 ................................. Cajun-Dart Measured Wind Prof i les . Cape Kennedy. Flor ida. Apr i l 1965 ................................. Cajun-Dart Measured Wind P ro f i l e s . Cape Kennedy. Florida. May 1965 ................................... Cajun-Dart Measured Wind Prof i les . Cape .Kennedy. Flor ida. June 1965 .................................. Cajun-Dart Measured Wind P ro f i l e s . Cape Kennedy. Florida. J u l y 1965 .................................. Cajun-Dart Measured Wind Prof i les . Cape Kennedy. Florida. August 1965 ................................ Cajun-Dart Measured Wind Prof i le . Cape Kennedy. Florida. September 1965 ............................. Cajun-Dart Measured Wind Prof i les . Cape Kennedy. Flor ida. October 1965 ...............................
Page
18
19
20
21
22
23
24
25
26
27
28
29
30
31
32
33
34
iv
LIST OF ILLaSTRkTIOWS (Continued)
T i t l e
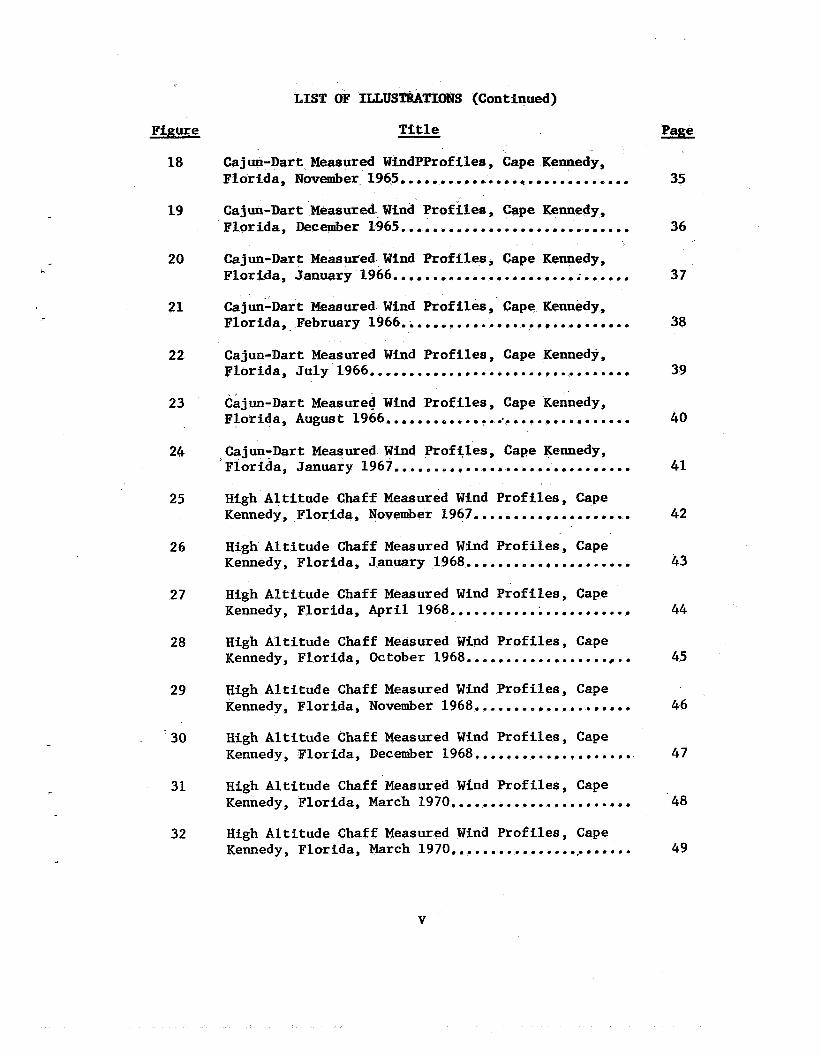
Cajun-Dart Measured WindPProfiles, Cape Kennedy, Florida, November 1965.............~.~.........,,..
Cajun-Dart Measured Wind P r o f i l e s , Cape Kennedy, Florida, December 1965.......................,.......
Cajun-Dart Measured Wind P ro f i l e s , Cape Kewedy, F lor ida , January 1966.........~...............,..,
Cajun-Dart Measured Wind P r o f i l e s , Cape Kennedy, Florida, February 1966............................0
Cajun-Dart Measured Wind P r o f i l e s , Cape Kennedy, Florida, J u l y 1966.................................
Finure
18
19
20
21
22
23
24
25
26
27
28
29
30
31
32
Cajun-Dart Measured Wind P r o f i l e s , Cape Kennedy, Florida, August 1966...............-................
Cajun-Dart Measured Wind P ro f i l e s , Cape Kennedy, Florida, January 1967..............................
High Altitude Chaff Measured Wind P ro f i l e s , Cape Kennedy, Florida, November 1967....................
High Al t i t ude Chaff Measured Wind P r o f i l e s , Cape Kennedy, Florida, January 1968.....................
High Al t i t ude Chaff Measured Wind P ro f i l e s , Cape Kennedy, F lor ida , Apr i l 1968. . . . . . . . . . . ; . . . . . . . . . . .
High Al t i t ude Chaff Measured Wind P ro f i l e s , Cape Kennedy, Florida, October 1968.................. ,.. High Al t i t ude Chaff Measured Wind P ro f i l e s , Cape Kennedy, F lor ida , November 1968....................
High Al t i t ude Chaff Measured Wind P r o f i l e s , Cape Kennedy, Florida, December 1968....................
High Al t i t ude Chaff Measured Wind P ro f i l e s , Cape Kennedy, Florida, March 1970.......................
High Al t i t ude Chaff Measured Wind P ro f i l e s , Cape Kennedy, Florida, March 1970... .....................
V
Page
35
36
37
38
39
40
41
42
43
44
45
46
47
48
49

LIST OF ILLUSTRATIONS (Continued)
Finur e
33
34
35
36
37
38
39
40
41
42
T i t l e . High Al t i t ude Chaf f Measured Wind P r o f i l e s , Cape Kennedy, Florida. Apr i l 1970 ........................ High Al t i t ude Chaff Measured . Wind Pro f i l e s . Cape Kennedy. Florida. Apr i l 1970 ........................ High Al t i t ude Chaff Measured Wind P ro f i l e s . Cape Kennedy. Florida. Apr i l 1970 ........................ Vertical Time Analyses . Wind Direction over Cape Kennedy. F lor ida .................................... Vertical Time Analyses . Wind Speed over Cape Kennedy. F lor ida .................................... RMS Error i n X.Coordinate ........................... RMS Error i n Y.Coordinate ........................... RMS Error i n Z.Coordinate ........................... Typical Chaff Dispersion ............................ Rates of F a l l f o r Various Meteorological Sensors ....
Page
50
51
52
53
54
55
56
57
58
59
.
vi

HIGH ALTITUDE METEOROLOGICAL ROCKET WIND MEASURING SYSTEMS
AND RESULTS TAKEN AT CAPE KENNEDY, FLORIDA
SUMMARY
Mesospheric wind d a t a between 65-85 kilometer a l t i t u d e s a t Cape Kennedy, Flor ida, as determined from the Cajun D a r t , Super Loki D a r t , and Hopi D a r t rocket sys.tems from February 1964 through A p r i l 1970 are presented. The three vehicle systems are indiv idua l ly described i n de ta i l . chaff, which is ejected above 90 kilometers, Wind flow d a t a are obtained by radar tracking of the chaff , which is f r e e t o d r i f t w i t h the wind as it f a l l s . Wind da ta measurements made once d a i l y fromMarch 19 t o A p r i l 21 , 1970, were analyzed and an e r r o r ana lys i s of the measuring system made. The d a t a reduction methods are also described.
These rocket systems de l ive r wind-sensitive aluminized mylar
I. INTRODUCTION
The launching of la rge space vehicles and s tud ie s of new aerpspace vehicle systems has increased the need f o r more accurate and de ta i led wind information i n the upper atmosphere e spec ia l ly above 60 km a l t i t u d e . Wind measurements a r e needed f o r (1) vehicle design, and re-evaluation of cur ren t design c r i t e r i a , (2) mission planning, and (3) mission evaluat ion s tudies . The need t o e s t a b l i s h the degree of accuracy f o r the wind m e a s - uring system, and t o provide a bas is f o r the confidence a user may place on the da t a is obvious. Also, s tud ies of wind flow c h a r a c t e r i s t i c s from a meteorological viewpoint are dependent upon addi t iona l d a t a i n t h i s region, where da ta a r e sparse.
Before 1964, there had been few high a l t i t u d e wind soundings taken over Cape Kennedy, Florida. J, W. Smith *, Ipr€p&%Q@€% rctil -Ba%kRl~s l t i~ img . with ana lys i s , on a r e l a t i v e l y few high a l t i t u d e soundings obtained over the Cape Kennedy area during the late 1950's and ea r ly 1960's. 1964, high a l t i t u d e winds have been measured a t Cape Kennedy, Flor ida, by means of the Hopi-Dart, Cajun-Dart, Super Loki-Dart and other rocket systems. This repor t provides information on three of these vehic le measuring systems, the d a t a reduction methods used, and an analysis of e r ro r s i n the system based on tracking response and d a t a reduction tech- niques. The MSFC Hopi-Dart, and Cajun-Dart systems have been phased out. Only the Super Loki-Dart wind system is cu r ren t ly ac t ive i n MSFC programs
*MSFC Report MTB-AERO-62-3, "Cape Canaveral Wind Summary - Surface t o
Since
84 Kilometers, January 1 7 , 1962."

a t KSC. pheric parameters o the r than winds w i t h a change i n payload instrumenta- tion. Also presented are a l l NASA-MSPC high a l t i t u d e chaff-wind measurements between 65-85 Ita .ttaken during the period February 1964 through Apr i l 1970 a t Cape Kennedy, Florida, thereby extending the scope of our previous r epor t [XI. A brief ana lys i s of measurements made once d a i l y fromMarch 19 to Apr i l 21, 1970 is described. a l t i t u d e soundings presented he re w e r e obtained i n support of NASA space vehic le launches .
The th ree rocke t systems could a l s o be used to measure atmos-
Many of t h e h igh
Reference 2 gives a good d iscuss ion of t h e chaff-wind measuring sys- The bibliography of re ference 6 lists d n y chaff-wind r epor t s that tem.
have been pub1 ished ,
Acknowledgement is given t o Mr. Archie L. Jackson of t he MSFC Computational Laboratory f o r h i s programming ass i s tance ,
11. VEHICLE DESCRIPTION
A. C a j un-Dar t Sys t e m -
The Cajun-Dart chaff .rocket [6] is a two-stage sounding vehic le with a s o l i d propel lan t motor as the f i r s t s t a g e and a nkpropu l s ive D a r t as the second s tage , The f i r s t s t age of. the vehic le cons i s t s of the Cajun Mod 1 I rocket motor, an i g n i t e r , a booster f i n s e t , an in t e r s t age , and a forward launch lug (Figure 1). The Cajun motor is 259.1 centimeters long, and has a p r inc ipa l diameter of 16.5 centimeters. without t he f l i g h t hardware, weighs 77.566 kg wi th 53,752 kg of propel- l a n t , The normal burning t i m e of 2.8 seconds, with a t o t a l impulse of 11,450 kg-sec, y i e lds a vehic le burnout ve loc i ty of s l i g h t l y over 1,525 m/sec a t an a l t i t u d e of 2,140 meters.
T The motor,
The booster f i n s , which are screwed onto the rocket motor a t the launch s i te , are used t o s t a b z l i z e the vehic le during propulsive f l i g h t . The f i r s t f i n set contains t h e a f t launch lug as an i n t e g r a l s t ruc tu re . The forward launch lug is i n t e g r a l with i t s mounting r ing , which is mated t o the forward end of the rocket motor. This mounting r ing is retained by the in t e r s t age assembly which is screwed onto the forward end of the motor. and Dart, t he in t e r s t age provides e l e c t r i c a l leads and a connector t o energize the D a r t delay a t launch.
I n add i t ion t o providing s t r u c t u r a l coupling begween the booster
The motor i g n i t e r (Figure 2) cons i s t s of a combustible p las t ic tube containing two Flare Northern Model.209 squibs, 7.5 grams of i gn i t i on powder and 90 grams of USF-2A i g n i t i o n granules. The two squibs, which have a 1 ampere/l w a t t r a t i ng , are w i r e d i n p a r a l l e l t o each other. The leads i n t o the i g n i t e r , which are twisted and shielded, terminate i n a s e l f -shor t i n g connector.
2

The c h a r a c t e r i s t i c s of the booster squib a r e as follows:
Resistance (Squib) 0.95 t o 1.25 ohm
Maximum No F i r e 1.8 ampere
Minimum A l l F i r e 2.4 ampere
F i r ing C i rcu i t 4.5 ampere
I g n i t e r Resistance 0.45 t o 1.00 ohm
The second-stage D a r t is 4.45 centimeters i n diameter, is 131.0 centimeters long, and weighs 7.82 kilograms. which functions only as a low drag payload housing f o r obtaining high coasting efficiency. wave drag, and the a f t end of t he Dart has been boa t t a i l ed t o minimize base drag. The forward end of t he D a r t cons i s t s of a s t e e l ogive with a lead b a l l a s t i n s e r t t o insure aerodynamic s t a b i l i t y and provide a high b a l l i s t i c coe f f i c i en t . tained within two s p l i t s t e e l staves. the payload staves and forward of the hot gas separa t ion charge. When t h i s charge is igni ted , t he p is ton forces the s t e e l payload staves aga ins t the ogive, causing the shear screws which connect t he ogive t o the D a r t body t o y i e ld , and the continued generation of gas pressure by the separa t ion charge forces the p is ton t o e j e c t the payload staves from the forward end of the D a r t body. The separa t ion charge is igni ted by an e l e c t r i c a l l y i n i t i a t e d 145-second pyrotechnic t i m e delay, which is incorporated i n the D a r t t a i l s ec t ion j u s t a f t of the separa t ion charge. The pyrotechnic t i m e delay is connected in p a r a l l e l with the ketket motor i g n i t e r and is i n i t i a t e d a t launch. Leads f o r the t i m e delay terminate i n a male connector a t the a f t end of the Dart. This connector m a t e s with the matching female connector i n the boos te r ' s i n t e r s t age during assembly of the Dart t o the booster a t the launch s i t e .
It is a nonthrusting s t age
The nose of the D a r t has been designed t o minimize
The D a r t body houses the payload, which is con- A small p is ton is located a f t of
The c h a r a c t e r i s t i c s of the D a r t Squib are as follows:
Res is tance 1.0 k 0.3 ohm
Maximum N o F i r e 0,5 ampere
Minimum A l l F i r e 1.0 ampere
Firing C i rcu i t 2.0 ampere
Delay (bridgewire i n i t i a - t i on t o f l a s h ) 145 2 15 seconds
3

The payload of the Cajun-Dart is aluminized Mylar"!%" band chaff packed i n t o the s p l i t s taves . The volume ava i l ab le f o r t he chaff payload is 490 cubic centimeters, Upon e j e c t i o n of the staves from the D a r t body a t apogee, the staves separa te and the chaff bundles are f r e e t o d isperse and follow the wind flow. A radar (PPS-16) s k i n t racks the D a r t and the chaff a f t e r e j ec t ion , obtaining d a t a between 85 and 65 km a l t i t u d e .
The chaff has a thickness of 0.0127 nun.
The Cajun-Dart is launched from a simple r a i l i n an underslung launch configurat ion (Figure 3). This launch rail can be attached t o any s u i t a b l e l a k c h e r framework s t r u c t u r e which is capable of support- ing the weight of the launch rail and vehic le and which provides f o r the s e t t i n g and locking of launch e leva t ion and azimuth angles. ences 4 and 5 contain addi t iona l information on the Cajun-Dart system.
Refer-
B. Super .Loki-Dart System
The Super-Loki-Dart chaff rocket [5] is a two-stage sounding vehic le cons is t ing of a so l id-propel lan t Super Loki rocket motor as the first s t age and a nonpropulsive D a r t containing the payload as the second s t age (Figure 4). The f i r s t s tage of the Super Loki-Dart i s e s s e n t i a l l y a scaled-up vers ion of the standard Loki-Dart vehicle motor cons is t ing of an aluminum cast with an i n t e r n a l burning case-in- the-case s o l i d propel lant . The Super Loki motor has a length of 188.12 c m and a p r inc ipa l diameter of 10.16 cm. The motor, without the f l i g h t hardware, weighs 5.26 kg and carries 16.87 kg of propel- l an t . The nominal burning t i m e of 2.1 seconds produces a t o t a l impu l se of 19,580 kg-sec, and y i e lds a burnout ve loc i ty of s l i g h t l y over 1797 m/sec a t an a l t i t u d e of-1577,6 m. When the booster burns out , the aerodynamic d i f f e r e n t i a l drag causes the booster t o separa te from the D a r t . Af te r separat ion, the D a r t coasts t o payload e jec t ion .
The i g n i t e r cons i s ts of two paral le l ;Bnia~pet$/ l~w~t$OR~ifQr~ecaauj;bs and an appropriate i g n i t i o n charge. from the motor, i s i n s t a l l ed a t the launch s i t e .
The i g n i t e r , which is separable
The second-stage D a r t is 4.13 c a - i n diameter, is 122.33 cm long and weighs 6.12 kg. ,The Dart body, made of s t e e l , has a s t e e l ogive and an aluminum ta i lp i ece . The cy l ind r i ca l body contains the chaff payload which is packaged i n t o s p l i t s t e e i s taves . re ta ined a t the forward end of the body with shear-screws, which are sheared during payload expulsion from the forward end of the Dart. The t a i l p i e c e contains an e l e c t r i c a l l y ac t iva ted pyrotechnic time delay and a s m a l l payload e j ec t ion charge. pdnned i n t o the D a r t t a i l f o r f l i g h t s t a b i l i t y . D a r t t a i l is boa t ta i led f o r reduction of aerodynamic drag and fo r mating the Dart t o the booster.
The ogive is
Four s t e e l f i n s a re r o l l - The a f t end of the
4

The D a r t i g n i t e r contains an e l e c t r i c a l l y ac t iva ted 145-second pyrotechnic t i m e delay which is i n i t i a t e d a t launch, istics of the squib i n the delay i n i t i a t o r are the s a m e as those of the C a j un-Dar t .
The character-
The payload cons is t s of t e n bundles of "S" band aluminized mylar chaff with a thickness of 0.0127 mm. The payload volume is 491.6 cm3,
The Super Loki-Dart launcher cons is t s of four helical rails, which complete approximately one-third of a revolut ion throughout the launch r a i l length. cast aluminum sect ions bolted together t o form a continuous ra i l assembly, 4 .39 m long, The four in t e rna l rails, which are equal ly s p a c e d , form four continuous he l i c s throughout the assembly length. The edges of the ra i ls a r e stepped t o support the vehic le by the D a r t f i n s and the rocket motor nozzle ring. The outs ide diameter of the launch rail assembly is 26.04 cm.
The launch ra i l assembly (see Figure 5) cons is t s of s i x
The purpose of the launch ra i l is t o impart a 8.5 r p s sp in t o the vehicle by constraining the Dart's f i n s t o a h e l i c a l path during t h e i r travel along the launch rails. The a f t end of the motor t r ave l s f o r 4 .39 meters before i t s r e l ease from the launcher. The Super Loki- Dart Launcher R a i l Assembly can be mounted t o any s u i t a b l e launcher base by means of forward and a f t mounting brackets. A pull-away umbilical harness is provided with the launch ra i l assembly to r e t r a c t the D a r t f i r i n g l i n e during f i r s t motion of the vehicle. See r e f e r - ences 3 and 5 f o r addi t ional d e t a i l s on the Super Loki-Dart System.
C. Hopi-Dart System
The object ive of t h i s program w a s t o develop a high a l t i t u d e wind measuring system i n support of launches a t Cape Kennedy, Flor ida, and t o acquire da ta fo r use i n vehicle development a t a l t i t u d e s between 70 and 85 kilometers. The Hopi-Dart [6] is a two-stage f l i g h t vehicle (Figure 6 ) consis t ing of a booster as f i r s t s tage, and an unpowered Dart as second s tage. The f i r s t s tage uses a Hopi I11 so l id propel lant rocket motor, 0,114 meters i n diameter, and 2.014 meters long. The second s tage is an i n e r t D a r t , 0.035 meters i n diameter and 1.128 meters long. The D a r t contains aluminized Mylar chaff and the payload e jec t ion system. A t f i r s t - s t a g e burnout (2.4 sec), d i f f e r e n t i a l drag causes separat ion of the f i r s t s tage from the D a r t . The D a r t then coasts t o apogee, The payload is designed t o e j e c t from the D a r t a t approximately T + 135 sec. The Hopi-Dart is launched from a r a i l attached t o an I-beam s t r u c t u r e (Figure 7).
5

The Hopi-Dart vehicle i g n i t e r cons i s t s of two S-90 squibs fo r f i r i n g the. motor. one-amp/one-watt type. as follows:
The t w o squibs are wired i n p a r a l l e l , and a r e the The characteristics of the motor & n i t e r are
I g n i t e r Res is tance 1.1 L- 0.4 ohm
Maximum Safe Tes t Current 0.02 ampere
Recommended Fi r ing Current 4.0 ampere
The D a r t i g n i t e r used t o eject the payload is a small propel lant charge i n i t i a t e d by a pyrotechnic t i m e delay. p a r a l l e l w i t h the motor ign i t e r . are as follows:
It is connected i n The characteristics of the i g n i t e r
I g n i t e r R e s is tance 1.0 k 0.3 ohm
Maximum Safe Test Current 0.02 ampere
Recommended Fi r ing Current 4.0 ampere
A radar (FPS-16) sk in t racks the D a r t and then t racks the chaff payload. 65 km or loss of s igna l . e leva t ion and azimuth angles, and s l a n t range posi t ion. Another method is by reducing the radar p lo t t i ng board which is a graphical loca t ion of the chaff by a l t i t u d e , time, and posi t ion.
The radar t racks the chaff from apogee t o an a l t i t u d e of Data are obtained by radar pr in t ing of t i m e ,
111. TEST RESULTS
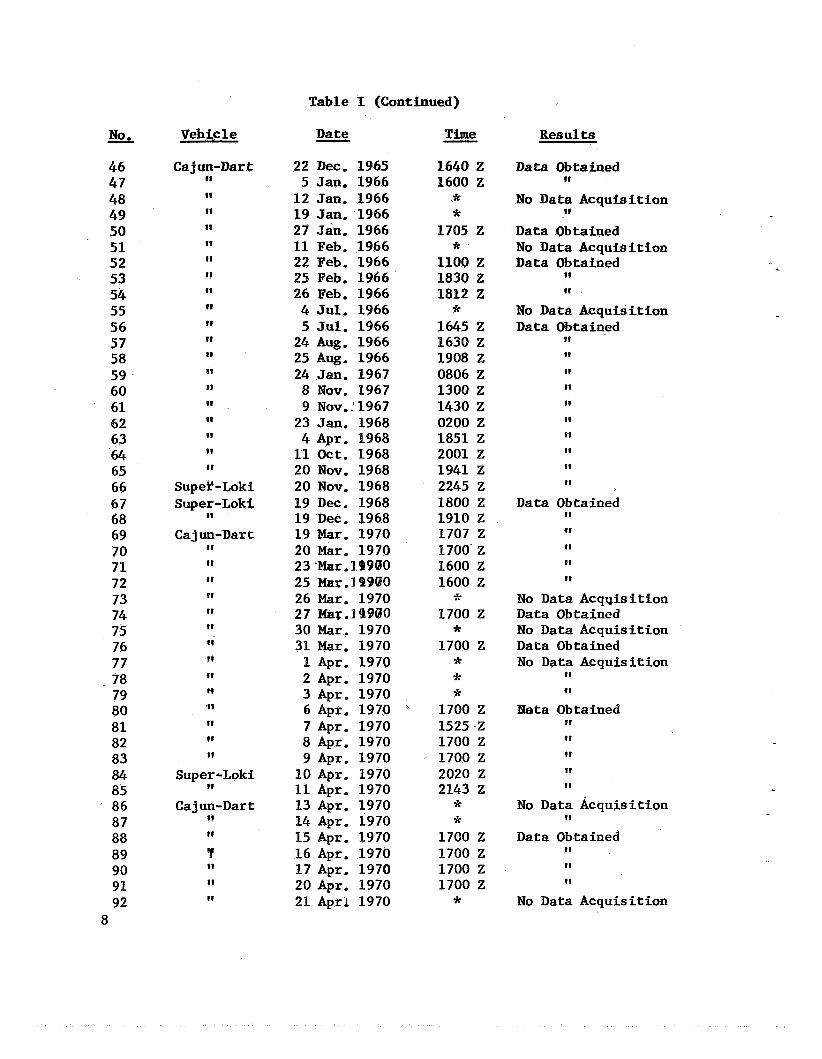
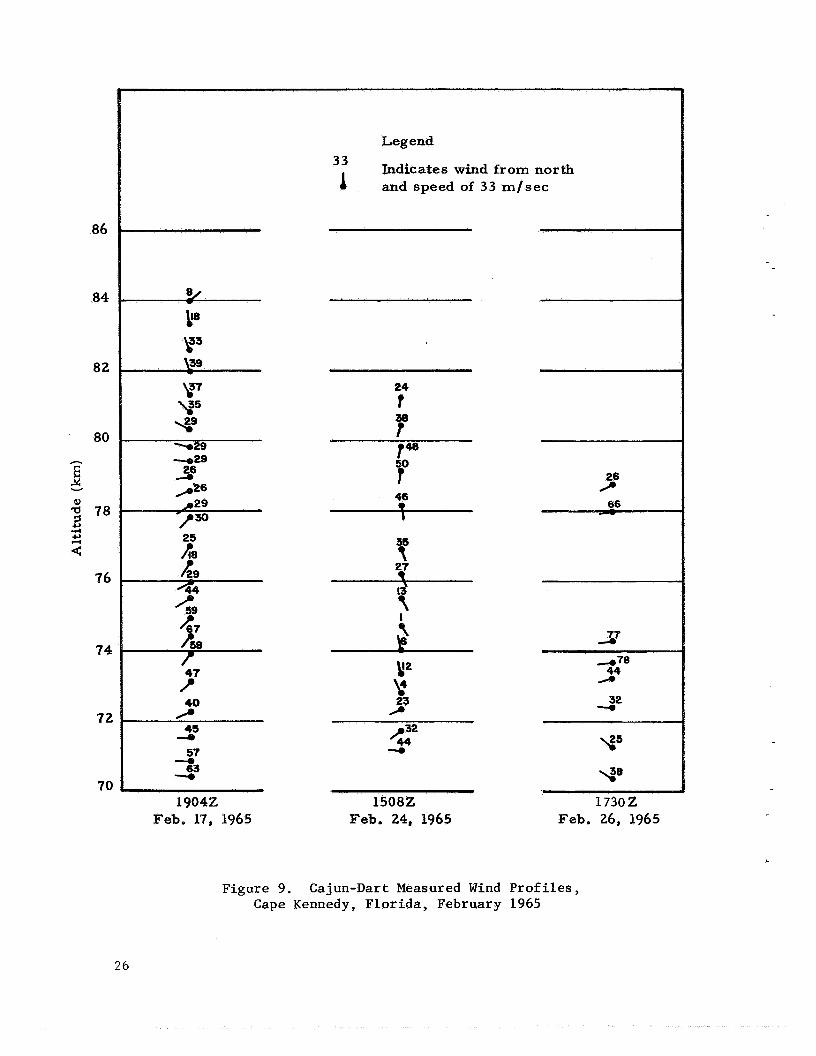
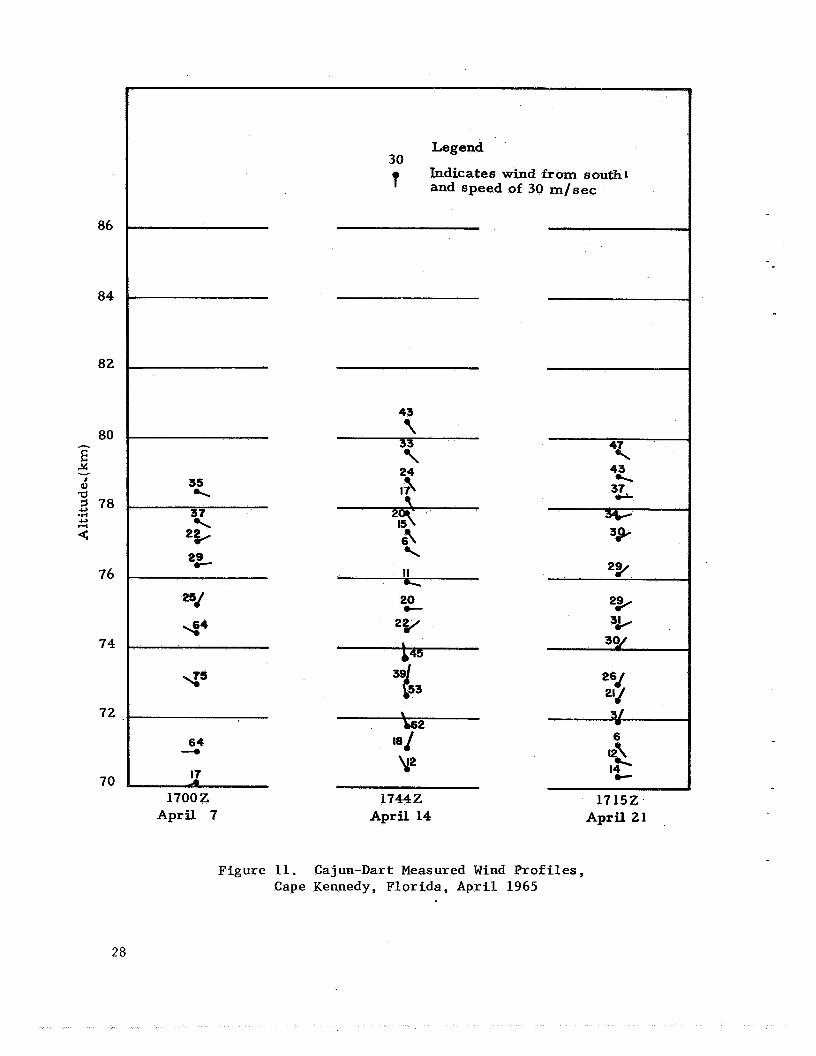
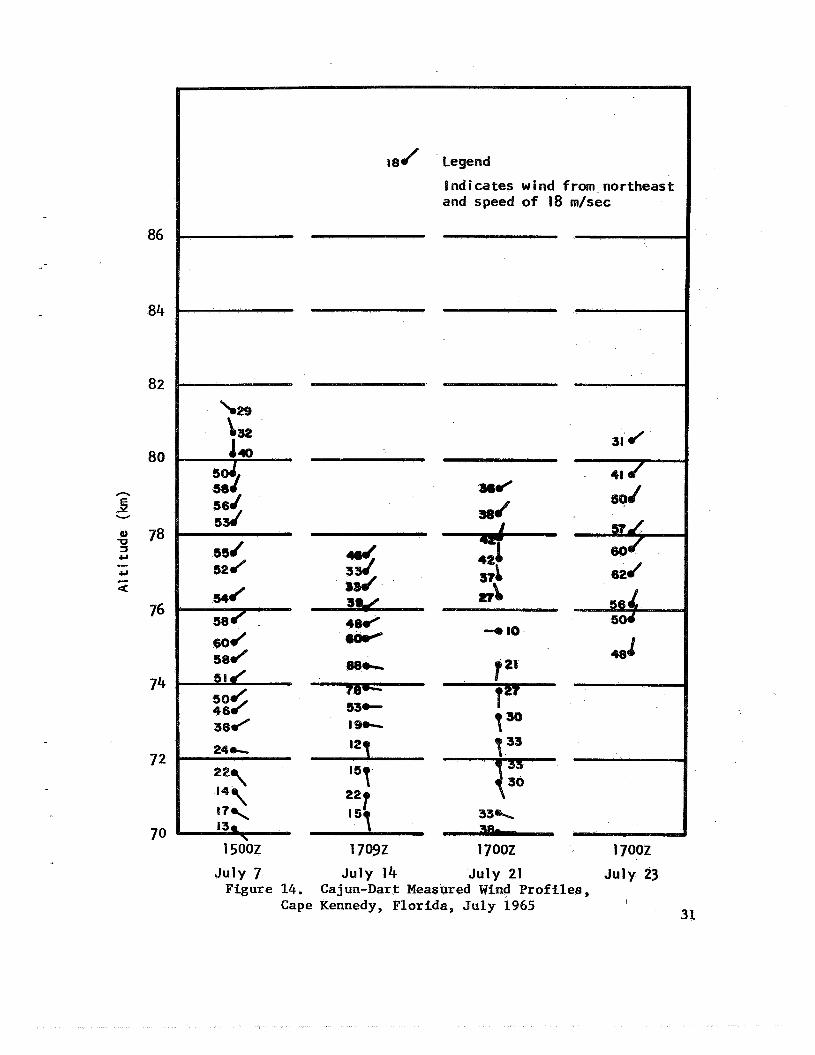
From February 13, 1964, through Apr i l 21, 1970, a t o t a l of 92 Hopi- D a r t , Cajun-Dart, and Super Loki-Dart vehicles were launched a t Cape Kennedy, Florida. Of t h i s t o t a l 75 launches produced wind d a t a . The 17 d a t a f a i l u r e s were due t o e i t h e r (1) e jec t ion mechanism f a i l u r e s or (2) radar not acquiring t rack of the chaff . The 75 usable da t a sound- ings resu l ted f r o m three Hopi-Dart, 67 Cajun-Dart, and f i v e Super Loki- D a r t wind p ro f i l e s (see Table 1). The 75 soundings obtained have been reduced t o tabular form a t 30-sec in t e rva l s and are plot ted as arrowgrams i n figures 8 through 35 (see paragraph c of sec t ion I V on Data Reduction Procedure). Note t h a t not a l l 75 soundings are p lo t ted i n t h i s report . Five soundings gave r e s u l t s a t a l t i t u d e s below those l i s t e d on the f i g - ures, and were therefore not plot ted. The wind flow d a t a shown i n f ig- ures 8 through 35 indica te a westerly wind flow trend a t most high a l t i t u d e s (above 65 km) from November through March; ea s t e r ly winds preva i l from May through September. October and A p r i l appear t o be
6

Table I. Summary of MSFC High Al t i tude Chaff-Wind Measurement
1 2 3 4 5 6 7 8 9
10 11 12 13 14 15 16 17 1 8 19 20 2 1 22 23 24 25 26 27 28 29 30 31 32 33 34 35 36 37 38 39 40 41 42 43 44 45
Vehicle
Hopi-Dar t II
81
Cajun-Dart II
I1
I1
I 1
I1
(1
II
11
II
11
II
I t
I 1
II
I1
I t
I1
II
I t
11
11
II
I1
II
I t
II
II
11
11
I I
11
I1
11
11
I 1
11
11
I 1
I 1
I 1
11
Fl ights a t Cape Kennedy, F lor ida
D a t e - 13 Feb. 1964 13 Feb. 1964 14 Feb. 1964 17 Feb. 1965 24 Feb. 1965 26 Feb. 1965
10 Mar. 1965 17 Mar. 1965 24 Mar. 1965 31 Mar. 1965
7 Apr. 1965 14 Apr. 1965 21 Apr. 1965 28 Apr. 1965 12 May 1965 26 May 1965 2 Jun. 1965
11 Jun. 1965 16 gun. 1965 23 Jun. 1965 30 Jun. 1965
7 Ju l . 1965 l,4 Ju l . 1965 2 1 Ju l . 1965 23 Ju l . 1965 28 J u l . 1965 13 Aug. 1965 18 Aug. 1965 25 Aug. 1965 1 Sept. 1965
1 7 Sept, 1965 22 Sept. 1965 29 Sept. 1965
6 O c t . 1965 13 O c t . 1965 20 O c t . 1965 27 O c t . 1965 1 Nov. 1965 8 Nov. 1965
1 7 Nov. 1965 24 Nov. 1965 29 Nov. 1965 8 Dec. 1965
1 7 Dec. 1965
5 Marc 1965
Time
1828 z 2145 Z 2103 Z 1904 z 1508 Z 1730 Z
1942 Z 1710 Z 1745 Z 1700 Z 1700 Z 1744 Z 1315 Z
1900 z 1700 Z 1700 Z 1700 Z 1800 Z 1725 Z 1503 Z 1500 Z 1709 Z 1700 Z 1700 Z 1400 Z 1722 Z 1700 Z 1700 Z 1700 Z 1700 Z 1700 Z 1600 Z 1718 Z
1700 Z
1700 Z
1700 Z 1700 Z 1700 Z 1700 Z 1700 Z
-
*
*
* * *
Results
D a t a Obtained I1
I1
I 1
I1
I1
No D a t a Acquisit ion D a t a Obtained
ff
II
f l
II
I1
II
No Data Acquisit ion D a t a Obtained
II
I I
I t
11
I I
II
!I
I1
II
I1
I1
I1
I I
I1
I 1
II
11
II
I 1
No Data Acquisit ion Data Obtained No Data Acquisit ion Data Obtained No Data Acquisit ion Data Obtained
I1
11
11
11
7
- No.
46 47 48 49 50 51 52 53 54 55 56 57 58 59 60 61 62 63 64 65 66 67 68 69 70 71 72 73 74 75 76 77
. 78 79 80 81 82 83 84 85 86 87 88 89 90 91 92
8
Vehicle
Ca j un-Dar t I t
I t
I t
tt
11
tt
11
tt
1s
I t
I t
I t
I t
I1
It
tt
I t
(1
I t
Supeff-Loki Super-Loki
Ca j un-Dar t I t
I t
tt
I t
(t
t f
t t
I t
I t
I I
tt
rt
I t
tt
t t
Super-Loki
Ca j un-Dar t tt
I t
11
r tt
I t
I t
Table I (Continued)
22 Dec. 1965 5 Jan. 1966 12 Jan. 1966 19 Jan. 1966 27 Jan. 1966 11 Peb, 1966 22 Peb. 1966 25 Peb. 1966 26 Peb. 1966 4 Jul. 1966 5 Jul. 1966 24 Aug. 1966 25 Aug. 1966 24 Jan. 1967 8 Nov. 1967 9 Nov.. 1967 23 Jan. 1968 4 Apr. 1968 1'1 Oct. 1968 20 Nov. 1968 20 Nov. 1968 19 Dec. 1968 19 Dec. 1968 19 Mar. 1970 20 Mar. 1970 23 -&r. 19900 25 Mar.19900 26 Mar. 1970 27 Mar.19900 30 Mar. 1970 31 Mar. 1970 1 Apr. 1970 2 Apr. 1970 3 Apr. 1970 6 Apr. 1970 7 Apr. 1970 8 Apr. 1970 9 Apr. 1970 10 Apr, 1970 11 Apr. 1970 13 Apr. 1970 14 Apr. 1970 15 Apr. 1970 16 Apr. 1970 17 Apr. 1970 20 Apr. 1970 21 Apri 1970
Time
1640 Z 1600 Z
7
* *
1705 Z
1100 z 1830 Z 1812 Z
1645 Z 1630 Z 1908 Z 0806 Z 1300 Z 1430 Z 0200 z 1851 Z 2001 z 1941 Z 2245 Z 1800 Z 1910 z 1707 Z 1700 Z 1600 Z 1600 Z
1700 Z
1700 Z
*
*
* * * * *
1700 Z
1700 Z 1700 Z 2020 z 2143 Z
1525 .Z
* *
1700 2 1700 Z 1700 Z 1700 Z *
Results
Data Obtained
N o Data Acquisition
Data Obtained N o Data Acquisition Data Obtained
It
1f
I t
I t
N o Data Acquisition Data Obtained
I t
tI
I t
I t
t t
I t
11
11
It
I t
Data Obtained I t
tt
I I
I?
I t
No Data Acquisition Data Obtained N o Data Acquisition Data Obtained N o Data Acquisition
t I
11
Eeta Obtained It
t t
I t
I I
I t
No Data Acquisition
Data Obtained I t
st
I t
t I
No Data Acquisition

the t r a n s i t i o n a l wind s h i f t months. See references P,and P9 wBich deal w i t h seasonal s h i f t i n g of the winds a t high a l t i t u d e s . ings a l s o ind ica te wind speeds t o be genera l ly higher i n winter than i n summer, taken from a l l soundings between 66-80 km a l t i t u d e .
The sound-
Table I1 summarizes the highest wind speeds by month as
Table 11. Cape Kennedy, F lor ida Measured Peak Wind Speeds by Month
Month
January
February
March
A p r i l
May June
J u l y
August
September
October
November
December
129
105
74
88
75
82
96
49
54
66
105
117
74 71
69
80
78
66
71
77
74
72
72
71
A. Special Month Long Ser ies
4 9 10
14 2
5
5
5
4 3
8
5
The last s e r i e s of meteorological rocket launches a t Cape Kennedy, Flor ida, consisted of 24 vehicles f i r e d a t the rate of one per day. These f i r i n g s occurred a t or near l oca l noon during a one-month period from March 19, 1970, through A p r i l 21, 1970. Of the 24 vehicles used, 22 w e r e Cajun-Darts and 2 were Super-Loki Darts. There were 16 success- f u l shots which gave wind d a t a , along with 8 f a i l u r e s (6 e jec t ion mechanism f a i l u r e s and 2 w i t h radar not acquiring chaff cloud). For more d e t a i l s , see Table 1. Each chaff r e l ease w a s simultaneously tracked by two radars: the FPSA16 and the MOD 11.
9

The 24 vehicles w e r e launched i n la te March and throughout most of Apr i l 1970 i n an attempt t o sound the iapper;.a&nesphere (65 t o 85 km a l t i t u d e region), on a d a i l y bas i s , during t h e wind regime change from the winter to the summer season. Webb [.SI and Mi tche l l [SI have d i s - cussed these wind regime changes that occur i n the spr ing and f a l l i n some d e t a i l ; therefore , no major ana lys i s of t he de t a i l ed wind s t ruc - t u r e o r c i r c u l a t i o n is presented i n t h i s repor t . a t the genera l wind change pa t t e rns a t these high a l t i t u d e s is given. Lov i l l and R e i t e r ['BO] conducted a similar pro jec t , using chaff (gun launched) as the wind sensor, t o s tudy t h e autumn wind reversal between 60-70 km-al t i tude , over the Colorado Rockies, during September 1969.
Only a quick look
The 16 wind-direction and wind-speed p r o f i l e s obtained from t h i s test are p lo t t ed from approximately 60 t o 80 km a l t i t u d e i n vertical- time analyses shown i n f igures 36 and 37, respectively. Also shown i n these f igu res are Loki-Dart meteorological rocket wind soundings which extend the primary d a t a t o lower a l t i t u d e ' l e v e l s .
The Loki-Darts w e r e launched within two hours of t he Cajun-Darts. The two wind f igures presented here were p lo t t ed from t h e tabular wind da ta which have been in te rpola ted t o the whole kilometer a l t i t u d e leve ls .
D a t a are in te rpola ted i n f igu res 36 and 37 where there is no measured data. The wind d i r ec t ions shown i n f igu re 36 w e r e c l a s s i f i e d as follows: E a s t winds are defined as a l l winds from 34" e a s t of north through 146"; south winds from 147" through 213"; w e s t winds from 214" through 326", and nor th winds from 327" through t r u e north t o 34".
B. Preliminary Analysis
Webb [a ind ica tes t h a t the s t r a tosphe r i c c i r c u l a t i o n index (SCI) a t Cape Kennedy, F lor ida , s h i f t s from a westerly winter component t o an e a s t e r l y summer wind component around the end of A p r i l a t the 50 km a l t i t u d e leve l . Figure 36 ind ica tes a breakdown of the dominant winter westerly flow s t a r t i n g around A p r i l 15, 1970. I n the 45 t o 50 km region, fo r t h a t day, the wind shows a souther ly d i r ec t ion with fu tu re days exhib i t ing an e a s t e r l y flow pa t te rn . begins t o dominate by the end of May 1970. wind d i r ec t ions given i n f igu re 36 show a general clockwise s h i f t i n g of the wind with a l t i t u d e while i n the l a t e winter regime. Eas te r ly flow prevails below 35 km and s h i f t s through the south t o the west throughout the 50 t o 70 km region. From here i t s h i f t s through north t o another e a s t e r l y regime above 70 km. Unfortunately, no high a l t i - tude wind d a t a were taken a f t e r A p r i l 20, 1970, thereby leaving a void i n the high a l t i t u d e wind pa t t e rn during t h i s t r a n s i t i o n period. Wind speeds during the winter regime, shown i n f igu re 37, i nd ica t e a band of
The summer e a s t e r l y regime The e n t i r e 25 through 80 km
10

st rong winds from 65 t o 70 km a l t i t u d e enveloped by weaker winds below and above, although s t rong winds did e x i s t between 70 and 80 km a l t i t u d e j u s t before and a f t e r A p r i l 15, 1970. below 70 km a l t i t u d e i n f i g u r e 37 are questionable, s ince wind d a t a measured i n t h i s region by radar t racking of the chaff cloud are usual ly unre l iab le because of chaff dispersion. on A p r i l 10, 1970, with wind speeds of 102 m / s e c observed a t 68 km a l t i t ude . However, the e n t i r e chaff wind p r o f i l e s were presented i n f igures 36 and 37 i n order t o provide a Eecord of the d a t a as recorded from the radar tracks.
The high wind speeds observed
Such a case occurred
IV. DATA ACCURACY
Although the evaluat ion of e r ro r s i n rocket wind measuring systems a t high a l t i t u d e s has been the subjec t of considerable study, it cannot yet be considered as complete. r e s u l t i n estimates of the system accuracy which are d i f f i c u l t t o e s t a b l i s h i n every case from an objec t ive and quan t i t a t ive viewpoint.
Some conclusions appear reasonable and
Three types of e r ro r s e x i s t i n the d a t a obtained by the Cajun-Dart e r ro r s i n radar tracking, e r r o r s i n measurement of response of System:
the t a r g e t t o the winds, and e r ro r s introduced by t h e d a t a reduction process. It is helpful t o d i s c u s s these e r ro r s separa te ly , examining the va r i a t ion i n one e r ro r while holding the others fixed. The e r ro r s i n t e r a c t on each other r e l a t i v e t o the t o t a l system e r ro r . However, the maximum RMS e r r o r should not be g rea t e r than the t o t a l of a l l the e r ro r s obtained i n the three types (9.8 mps). Likewise, the minimum RMS e r r o r should not be smaller than the smallest e r r o r (1.8 mps). The following sect ions present these e r r o r estimates.
A. Radar Tracking Eerors
Radar information is obtained i n the form of time, s l a n t range, and elevat ion and azimuth angles from tracking the chaff from e j ec t ion near 90 km a l t i t u d e . f i l t e r i n g due t o the radar system tracking procedures.
The only smoothing of the r a w tracking d a t a is the
The accuracy of the measured wind flow data is dependent upon the accuracy of the radar angular measurements. angular measurements a re quoted f o r the AN/FPS-16 radar as follows: s l a n t range 4.5 meters; e leva t ion and azimuth angles 0.005 degrees.
The RMS e r r o r s i n the
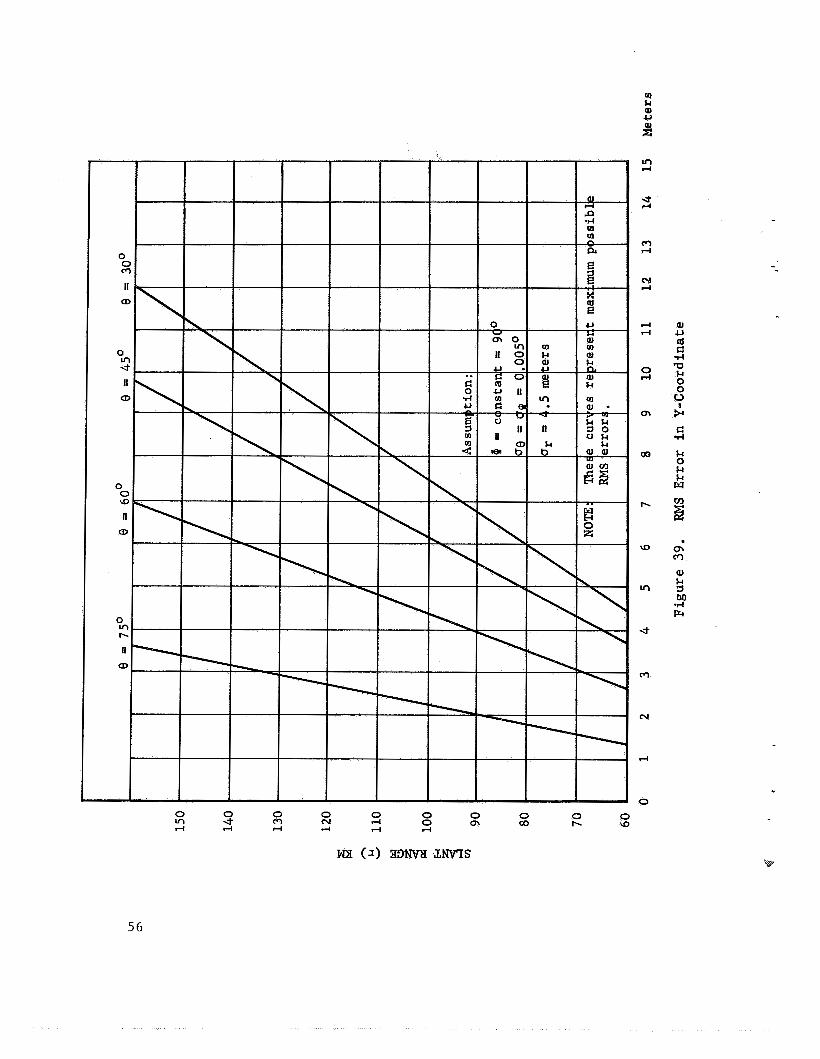
The RMS e r rors i n the computed X, Y, Z, pos i t ion coordinates are presented graphical ly i n Figures 1 through 3. It w a s assumed t h a t Q! = 90" (azimuth), csr = 4.5 meters ( s l a n t range RMS), ae and cs degrees (e levat ion and azimuth RMS, respec t ive ly) . urement values between 30 and 75 degrees were used.
= 0.005 Elevation ?e) meas-
11

The above assumptions are realistic because the wind a t hfgh a f t i - tude blows from w e s t t o east during the winter when the wind speeds are highest. the e leva t ion angle decreases, while the error i n X increases as the e leva t ion angle increases. by Scoggins [&D]. t h e accuracy of the pos i t i on coordinates, the averaging in t e rva l At, and the l aye r oh also.
Figures 38 through 40 show the errors i n Z..and Y increase as
These curves are p lo t ted from equations used Accuracy of the measured wind f l o w is determined by
The RM!3 accuracy i n wind speeds, cjm, is given by
where At is the t i m e i n t e rva l between the two
2- e r ro r s of one pos i t i on t o the next, axl and ax
measurements wi th RMS
The accuracy of the measured wind speeds as a funct ion of a l t i t u d e is determined by the mean wind speed ( th i s e s s e n t i a l l y cont ro ls the s l a n t range and e leva t ion angles), and the d i r e c t i o n of the wind rela- t ive t o t h e radar. Therefore, successively measured wind speeds a t a given a l t i t u d e may o r may not have the same accuracy [ lo] .
While holding a13 o ther e r ro r s f ixed, t he RMS error i n the wind due t o e r r o r s i n the radar pos i t ion coordinates was estimated t o be 1.8 mps and 2 degrees.
B. Errors i n Response of C h a f f t o the Wind
When chaff is used as a sensor of high a l t i t u d e winds, the question arises as t o how accura te ly the chaff responds t o the wind.
Radar observations obtained from 10.0127-mm aluminized mylar chaff i nd ica t e t h a t the chaff disperses over regions of about 0.1 sq. km within one minute after chaff deployment a t an a l t i t u d e of approximately 80 km (see,Figure 41). I n addi t ion, t he radar usual ly shows more than one p a r t i c u l a r area within the chaff cloud t h a t r e f l e c t s subs t an t i a l ly more energy than any o ther area. these high energy areas vary wi th t i m e . Therefore, the chaff t racking e r r o r depends t o a la rge ex ten t upon the ambient wind conditions. To arrive a t an RMS e r r o r from an examination of the q u a l i t y of da ta , w e may compute the sample variance:
Because of the changing wind flow,

where S R ~ is the sample standard devia t ion of t he "resultant" X and Y coordinate d is tances , R i is the r e s u l t a n t dist'ance, and N the sample s ize . To obta in t h e X and Y posit ions, the d a t a on the radar p l o t t i n g cha r t s are reduced manually. This reduction shows the standard devia- t i o n (from the cen te r of t he chaff cloud) to be 118.6 m e t e r s . fo re , t he chaff cloud's highest energy areas can be wi th in approximately 118 m of t h e cloud center.
There-
While holding a l l the o ther e r ro r s f ixed , t h e RMS e r r o r i n t h e wind due t o the response ( sh i f t i ng of primary energy of r e f l e c t i o n areas) of the chaff was estimated t o be 5 mps and 10 degrees.
C, Data Reduction Errors
D a t a reduction e r ro r s may be introduced i n t o the computed winds by approximations i n the equations o r by the method se l ec t ed f o r smoothing the t a r g e t pos i t ion data. obtain a representa t ive value of the va r i ab le over some At and/or ah. The optimum smoothing technique is one t h a t f i l t e r s the noise from the d a t a while r e t a in ing as much de ta i l ed information as possible. Unfortunately, the wind flow va r i ab le can behave i n a random manner, and therefore some real wind flow information w i l l always be f i l t e r e d out along with the noise (or t he noise w i l l be l e f t i n with the r e a l wind information). The appropriate amount of f i l t e r i n g t o be done is a m a t t e r of judgement based on experience, assumed instrumented capabil- i t i e s , and the requirement of the users.
The purpose of smoothing the d a t a is t o
1. Data Reduction Procedure
The Cajun-Dart d a t a were computed by both the manual and the com- puter technique, and compared f o r l ikeness. The comparison of the r e s u l t s showed the two methods t o be very nearly the same. The method cur ren t ly being used (computer technique) decreases the p o s s i b i l i t y of human e r r o r i n d a t a handling. The radar output (Ele, Az, SR) d a t a fo r each 15 seconds is a r i thme t i ca l ly averaged t o obta in the midpoint value. This midpoint value is tabulated a t 30-second in t e rva l s with two 15-sec- ond d a t a points on each s i d e of the midpoint. This produces a va r i ab le
13

&i (aaeraging-) as a funct ion of height due t o the va r i a t ion of chaff f a l l rate. See f igu re 42 regarding various fa l l rates.
The da ta reduction technique used is based on the assumption that the hor izodta l motion of the chaff is completely responsive t o the wind flow f o r f a l l rates below 70 m/sec, Tracking da ta from the chaff with a f a l l rate of more than 70 m / s e c w e r e disregarded (see reference 12). The following equations were used f o r reduction Ff the Cajun-Dart chaff measurements. The a l t i t u d e above the sur face (Ys) is
The a l t i t u d e above mean sea level (Ys) is computed by the following equation:
Y s = Y; +'YSG,
where
(4)
R === s l a n t range i n meters,
Rg
'SG
e
= mean radius of the ea r th i n meters,
= s t a t i o n height. i n meters,
= elevat ion angle i n degrees.
The r a t e of f a l l of the chaff (ROF) is computed over a 60-second i n t e r - val by the following equation:
YS ( i- 2) - ys(i+2) - t ROFi = 9
(i+2) (1-2)
where Ys is the a l t i t u d e above mean sea leve l i n meters and t is t i m e i n seconds. Rectangular posi t ion coordinates (h, Zc, and Yc) are determined by
Xc = R cos 0 s i n @
Zc = R cos 0 cos @
Yc = R s i n 0 ,
14

where
e = elevation angle,
cp = azimuth angle,
R = slant range in meters.
Spherical position coordinates (Z, and x,) are determined by the follow- ing equations :
xc
% + ys xS = (% + yS) sin-’
zC = (5 + yS) sin-’
+ ys . zS E
Wind speed components % and Ws~) are then determined by the follow- ing equations :
Xs(i+2) - Xs( i -2)
(i+2) (1-2) -
- t wwE- t
zs(i+2) - Zs(i-2) - - t (i+2) (1-2) ‘SN - t
Component wind speeds are then resolved into wind speed (W) for time (ti) by the equation
*ti = (W& + WgN)’/2. (9 )
Wind direction (WD) is determined by the following equation. Let
‘WE
‘SN Q = tan-’ 1-1 ,
when neither the numerator nor the denominator is zero. Therefore,
15

the following quadrant cor rec t ion is applied t o Q:
If Wm + and W + : WD = 180" + Q SN
I f Wm + and WSN - : WD = 360" - Q
If Wm - and WsN - : WD = Q
I f Wm - and WSN + : WD = 180" - Q
If WwE + and WSN = 0: WD = 270"
I f Wm - and WSN = 0: WD = 90"
I f Wm = 0 and WSN +: WD = 180"
I f WwE = 0 and W SN -: WD = 360"
I f Wm = 0 and WSN=Ot WD = 360".
2. Errors i n Data Reduction
Using the above equations and the smoothing technique (computer handling of the s ine , cosine, and arc tangent functions) the RMS e r ro r i n the wind is estimated t o be 3 mps and 5 degrees while holding a l l other errors fixed.
7. CONCLUSIONS
The following r e s u l t s were obtained i n t h i s study:
1. The chaff wind flow d a t a obtained over Cape Kennedy, Florida, subs t an t i a t e s the fact of winter westerlies and summer easterlies up ,to a l t i t u d e s of approximately 75 km. Wind d i rec t ions a t a l t i t u d e s grea te r than 75 km appear somewhat e r r a t i c a t t i m e s .
16

2. The maximum winds between 65-80 km a l t i t u d e occur during the winter months over Cape Kennedy, Florida.
3. Mid-April 1970 appeared t o be the s t a r t i n g of the winter westerly wind breakdown over Cape Kennedy, Florida, between 50 and 70 km a l t i t u d e . Eas te r ly winds prevailed t h e r e a f t e r i n t o the summer months.
4. The winds s h i f t e d (clockwise) with increasing a l t i t u d e from 25 t o 80 km a l t i t u d e j u s t before the breakdown of the winter westerly flow i n Apr i l 1970 over Cape Kennedy.
5. The RMS error i n the wind due t o e r r o r s i n the radar pos i t ion coordinates is estimated t o be-1.8 mps and 2 degrees.
6. The RMS e r r o r i n the wind due t o t h e response of the chaff is estimated t o be 5 mps and 10 degrees.
7. The RMS e r r o r i n the wind due t o data. reduction techniques is estimated t o be 3 mps and 5 degrees.
8. Although each of the e r r o r s i n t e r a c t t o some exten t with each o ther , the maximum RMS e r r o r should not be g r e a t e r than the t o t a l of a l l the e r r o r s obtained i n the three types (9.8 mps) .
9. The minimum RMS e r r o r should not be smali ?r than the smallest e r r o r (1.8 mps) .
10. The following equation can be used t o compute a quick estimate f o r t he accuracy of wind speeds i n the 70-85 km a l t i t u d e region based on chaff measurements:
Wc = W rt WR(0.59 - O.O07Z), R
where WR is the measured wind speed (mps), Z is the a l t i t u d e (km), and Wc is the co r rec t speed (mps).
17

STATION
0
0.361 m
-
1.034 m 1.151 m
1.389 m
3.810 m
4.064 m -
-0.165 m in D i a .
Case ogive T a i l Ass'y Chaff, Staves, etc. TOTAL
Inters tage Fins Motor Hardware Propellant Total a t Burnout
Total Vehicleat Launch
PERFORMANCE
(80° Q.E. Sea Level Launch)
Sumit Altitude (km)
2.245 3.175 1.161 1.257 7.838
1.814 3.320
21.909 54.205 34.882 89.086
92.964 Max Velocity (m/sec) 1554.500 Burnout Time (sec) 3.100 Altitude a t Burnout (km) 2.134
Ejection System Pyrotechnic
Time Delay (T+sec) Adjustable to Requirement
Developer: Space-Data, Inc. Phoenix, Arizona
Figure 1. Cajun-Dart Vehicle
18

UNuryNAMIcS
S-167-145 I I I
u. s, FLARE 209 SQUIBS
I 1 I
I I I
I --
- 10 FEET SHIELDED CABLE
MS 3106 A 20 - 135 SELF SHORTING CONNECTOR - FIRING LINE CONNECTED TO PINS C It n
Figure 2. Cajun-Dart Igniter S y s t e m
19

Figure 3. Cajun-Dart Vehicle and Launcher
20

112.8 CD
31212 20.3 CI
WEIGHT (kilqmms)
DART
Cas0 o&?. Toil AssodIy Chaff, Skv08 de.
} 4.12
SUPER LOKI MOTOR
lmtorskso Fias } 5.32 Motor Hadwan P+.pIl.nt 16.87 letel Vohicle at Lomnch 22.19
PERF O R W C a
l t l A
2.1 1797
1.577
Pyrotechnic
Adiustohb to Ryriromoni
Doveloport S ~ . e ~ - D o v o l o p r , Inc. Phooniz, A r I x e n
F i g u r e 4. Super Loki-Dart Vehicle
21

Figure 5 . Super Loki-Dart Launcher
22
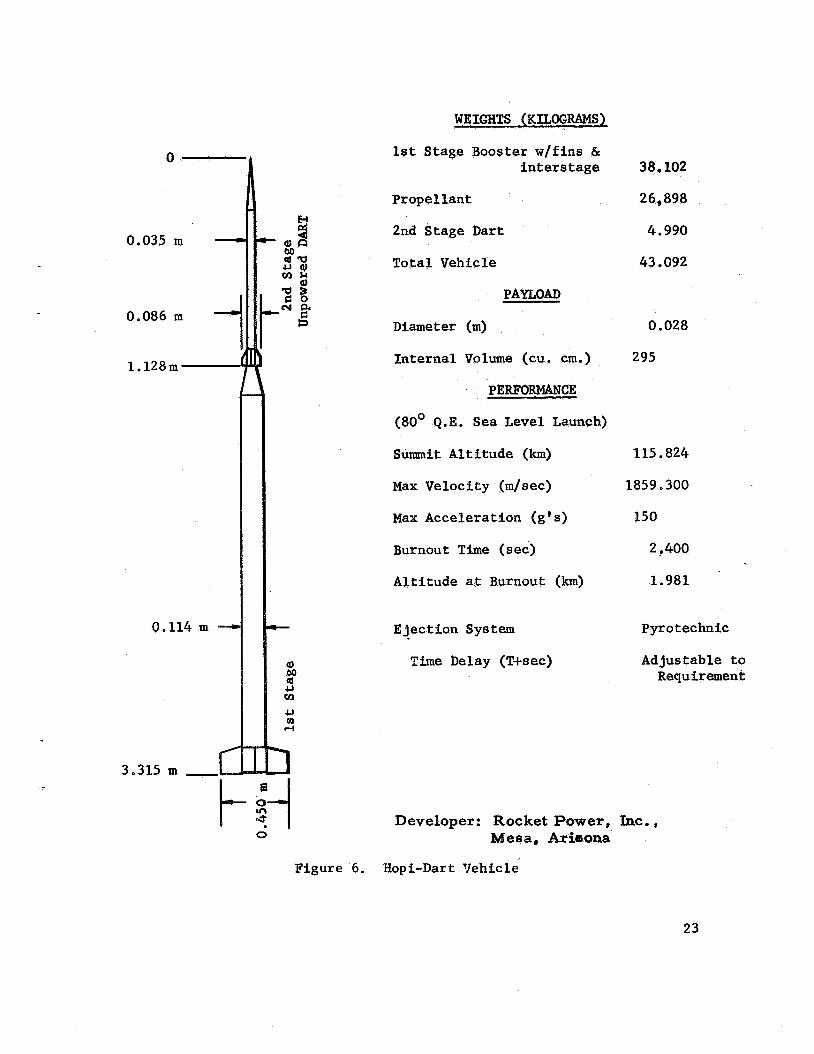
WEIGHTS (KILOGRAMS1
1st Stage Booster w/fins & interstage 38.102
0.035 m -
0.086 m -.I
1.128m
0.114 m -
3.315 m - c
Propellant
2nd Stage Dart
26,898
4.990
Total Vehicle 43.092
PAYLOAD
Diameter (m) 0.028
Internal Volume (cu. cm.) 295
PERE'ORMANCE
(80' Q.E. Sea Level Launch)
Summit Altitude (km) 115.824
Max Velocity (m/sec) 1859.300
Max Acceleration (g's) 150
Burnout Time (sec) 2 .. 400 Altitude at Burnout (km) 1.981
Ejection System Pyrotechnic
Time Delay (T+sec) Adjustable to Requirement
Developer: Rocket Power, Inc., Mesa, Ariaona
Figure 6. Hopi-Dar t Vehicle
23
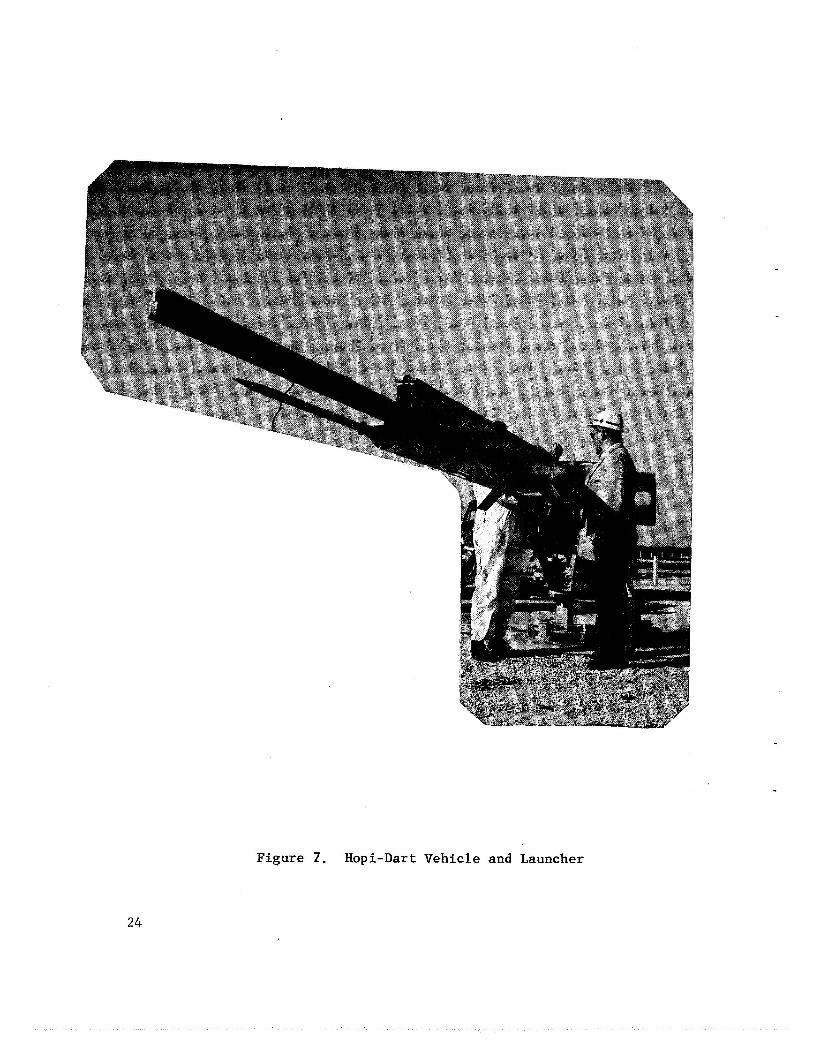
Figure 1. Hopi-Dart Vehicle and Launcher
24

86
84
82
80
78
76
74
72
70
22 3
Legend
Indicates wind from west and speed of 22 m/sec
24 E
30 t 30
P
28 P= ?
34 't" {38
19
18 34 f
P $4
9 1 9 /
27 E 30 -4
4 3 3
P34 17
-a
37 0@
-is -3'
-25 4
<' 28 28
4
33 L
39 9 36 /.
18282 21452 21032
Figure 8. Feb- 13, 1964 Feb. 13, 1964 Feb. 14, 1964
Hopi-Dart Measured Wind Prof i les , Cape Kennedy, Florida, February 1964
25
86
84
82
80
78
76
74
72
7c
v7 \j5
%g
-29 -.29
26 2
40 ,, 45
57 63
4
3
'-.
19042 Feb. 17, 1965
Legend
33 Indicates wind from north 1 and speed of 33 m/sec
24 t 38 t t- Y
38 t t- Y
35
27 t
IS t
3
15082 Feb. 24, 1965
77 -a
32 - 1730 Z
Feb. 26, 1965
Figure 9 . Cajun-Dart Measured Wind Profiles, Cape Kennedy, Florida, February 1965
26

86
84
82
80
78
76
74
72
70
t47 43 t I
l942Z March 10 Figure 10.
Cape
18 Legwd d Indicates wind from northeast
and speed of 18 m / s e c
3'
7" tiO 22 t 12 --.
&7
17 1OZ March 17
36 t39 t t35
17452 March 24
22
Cajun-Dart Measured Wind ProEiles, Kennedy, Florida. March 1965
1700 Z March 31
27
86
84
82
80 A
E d c, zi 78
-4
A
a v
.r(
c, 4
76
74
72
70
Legend
Indicates wind from south1 and speed of 30 m/sec
30
7
64 --a
17 - 1700 2
April 7
43
33 t t I7 t 24
* . 2 "
1% st - 2v
4
20 c
47 z 43 --. 3_1.
34, 3 9
3/
17442 April 14
17 152 April 21
F i g u r e 11. Cajun-Dart Measured Wind P r o f i l e s , Cape Kennedy, F l o r i d a , A p r i l 1965
28

86
84
82
80
78
76
74
72
70
Legend 17 p Indicates wind from south-
west and speed of 17 m/sec
32 P
3 . 33- 39 L
3s! 32 % *
47
40 t t 39
I7 *
?3
62
59 Y
** T.. 17002
May 12 May 26 Cajun-Dart Measured Wind Profi les ,
19002
Figure 12. Cape Kennedy, Florida, May 1965
29

30
86
84
82
80
78
76
74
72
70
420 )13
\c9 7
4. 3
A
1700 Z June 2
Figure
-10
1700 Z June 11
25 e--
+ P F7
1800 Z June 16
Legend
ihdikates wind f :and speed of 25
17252 June 23
13. Cajun-Dart Measured Wind Profiles, Cape Kennedy, Florida, June 1965
June 30
86
84
82
80
n E 3 v
74
72
70
18 / Legend
I nd i cates wind from northeast and speed o f 18 m/sec
129
2 4 k
22 14
17.; 33-
1500Z 17WZ i700z 1 'looz \ L 13a
July 7 July 14 July 21 July 23 Figure 14. Cajun-Dart Measbred Wind Profiles,
I
31 Cape Kennedy, Florida, July 1965

h
E A
Q) W J c,
w
W
.- c a
86
84
82
80
78
76
74
72
70
I2f 18
\
17222
August 13
18 / Legend
Indicates wind from northeast and speed of 18 m/sec
9%
20-
18-
17001
August 18
46t 4 ' z 39 \
* 8 2
29 t 447
491
4'.\ 33 \
38 1 I 6J
Figure 15. Cajun-Dart Measured Wind Profi les , Cape Kennedy, Florida, August 1965
32
1700Z
August 25

86
84
82
80
78
76
74
72
70
I9\
20\ 23 @-
2 3 H
28 /
2 2 J
2 2 4 21e-
24-
2 6 H
17002
September 1 Figure 16.
4egend
Indicates wind from n o r ~ h e a s ~ and speed o f 18 m/sec
3 2 k
4
31 J
18 26
39
23
I
-428
12- 8
12
17OOZ
September 17 17002
September 22
43q
32
Cajun-Dart Measured Wind Profile, Cape Kennedy, Florida, September 1965
14
7
12
1dooz September 29
33

86
84
82
80
n E Y W z 78 s c, .- c,
U c
76
74
72
70
34
I 8 / Legend
Indicates wind from northeast and speed of 18 rn/sec
J37 I
-35
”.. 38
43 / 43 P 45
32 e-- 30-
25 &
2 6 0
P53
17182
October 6
1700Z October 20
Figure 17. Cajun-Dart Measured Wind Profiles, Cape Kennedy, Florida, October 1965

1
-gend Indicates w i n d from northeast and speed of 18 m/sec
74 3
3-
17002 November 1 November 17
Figure 18. Cajun-Dart Measured Wind Profiles, Cape Kennedy, Florida, November 1965
35

86
84
82
36
74
72
l700Z December 8
70
Legend
Indicates wind from nortLeast and speed of 18 m/sec
I 27
30
I
b34
17002 December 17
Figure 19. Cajun-Dart Measured Wind Profiles, Cape Kennedy, Florida, December 1965

86
- 8 4
82 n E! Y W
91 ‘II
rl U
U ’ 80 4
74
72
18 Legend ’Indicates wind from northeast and speed of 18 m/sec
51/
54 /
20 1
17052 January 27
Figure 20. Cajun-Dart Measured Wind Profiles, Cape Kennedy, Florida, January 1966
37
I

86
82
aJ 71 3 U rl
t: 76 e
74
72
7.0
Indicates w i n d from nor tkas t and speed of 18 m/see
2 9 k
23-
\ 80
\98
\93 \.SI
4 3 0
/ 5 0 .
/45
52
A 7 7
ll0OZ February 22
1830z Februarj 25
Figure 21. Cajun-Dart Measured Wind
/33
ri9 t " e 24 \
'7 194 \
12.\
le\
*Ot
lG12Z Februar; 26
Profiles . - Cape Kennedy, Florida, February 1966
38

Indicates wind from north- east and speed of 18 m / s e c
Figure 22.
16452 July 5
Cajun-Dart Measured Wind Profiles. Cape Kennedy, Florida, July 1966
39

86
84
82
80
7 8
Z 6 -5
9 76
d 5
7 4
7 2
7 0 16 302
Alrgus t 24
Indicates wind from northeast and speed of 18 m / s e c
t" -19
4 4 \
21 4 2
1908Z ATgira t 25
Figure 23. Cajun-Dart Measured Wind Prof i les , Cape Kennedy, Florida, August 1966
40

86
84
82
Q 80 a ZJ U .I4 JJ 4 4
78
76
74
. 72
70
18 / Legend'
Indicates wind from north- east and speed of 18 m/sec
-124 126
- 4 2 4 --e.
4 1 3 0
=I29
08062 January 24
Ti!
Figure 24. Cajun-Dart Measured Wind Profiles, Cape Kennedy, Florida, January 1967
41

82
80
78
76
74
72
70
68
66
22 ‘. 2 0 -a
-2 3
m 7
LEGEND I -0 22 INDICATES WIND FROM WEST
AND SPEED OF 22m/sec.
I
13002 NOV 8, 1967
CAJUN-DART
14302 NOV 9, 1967
Figure 25. High Altitude Chaff Measured Wind Profiles, Cape Kennedy, Florida, November 1967
42

LEGEND 3 INDICATES MIND FROM WEST
AND SPEED OF 22m sec.
82
-69 -66
80
'53 -0 70 *
78
-e 72 76
74
#@ m 3
72
83
70
A 8 2 73 *
68
66 QZQQZ
JAN 23, 1968
CAJUN-DART
F i g u r e 26. High A l t i t u d e Chaff Measured Wind P r o f i l e s , Gape Kennedy, F l o r i d a , January 1968
43

h
E Y
w 3
I- J U
U
n t
LEGEND
INDICATES WIND FROM WEST AND SPEED OF 22m/sec.
82
00
78
74
74
72
70
68
64 18512
APRIL 4, 1968
CAJUN-DART
44
.- 71
12 e A
m a a 439
w1 33
a 3 b 6 b 16 b 17 *22
Y Z 6 4 20 A
F i g u r e 27. High A l t i t u d e Chaff Measured Wind P r o f i l e s , Cape Kennedy, F l o r i d a , A p r i l 1968

82
80
78
76
74
72
70
68
66
LEGEND
2 INDICATES WIND FROM WEST AND SPEED OF 22m/sec,
45 ? YLd a45
*33
8 @- 28
2001 z OCT 11, 1968
CAJUN-DART
Figure 28. High Altitude Chaff Measured Wind Profiles, Cape Kennedy, Florida, October 1968
45

h
E Y
W
3
v
n
E J 4
82
80
78
76
74
72
70
68
66
49 9
P 30 t q33' q 2 2
?A
-46 -456 Y s 3
19412 NOV 20, 1968
C AJ U N-D ART
LEGEND 22 INDICATES WIND FROM WEST -a
AND SPEED OF 22m/scc.
?57
9
t
47
-5 1
40
45 1" 33 9.
P'7 a 4 5 A 4 5
-70
22452 NOV 20, 1968
SUPER LOKI-DART
Figure 29. High Al t i tude Chaff Measured Wind P ro f i l e s , Cape Kennedy, Flor ida, November 1968
46

h
E Y
w 3
I- J 4
u
n I=
82
80
78
76
74
72
70
68
ti6
M 63 ct e 5 5
t4 t 3 3
7 2 7
t 2 3 ;z 27 25
i 2 ’ ;:: t 9
LEGEND $ INDICATES WIND FROM WEST
AND SPEED OF 22dsec.
18002 DEC 19, 1968
SUPER LOKI-DART
6 2 9 5 7 ?
9 5 ’
t 4 1
+ e 3 7
?3 5
9 3 0
9 30
b 24
b88 -1 03
19102 DEC 19, 1968
Figure 30. High Altitude Chaff Measured Wind Profiles, Cape Kennedy, Florida, December 1968
4-7

I
82
80
78
h
E
W a 3
I- 4
tS 76
t -I 74
72
70
68
66
48
25 a.
6 13
*I 5 19 a
z 3 6
- 3 9
+41
-46 4 4 5 -51 - 0 5 1 4 6 5
B 3 9
17072 MAR 19, 1970
LEGEND 2 INDICATES WIND FROM WEST
AND SPEED OF 22m/sec.
38 a
j 3 6
40 * -42
-048 -6 1 -52 *51 -57
4 5 0
47 3 B B S 5
17002 MAR 20,1970
CAJUN-DART
m 5
A 2 2
0 1 3 19 **
49 -47 -58
- 0 7 9 -60 -. 74
16002 MAR 23, 1970
Figure 31. High Altitude C h a f f Measured Wind Prof i les , Cape Kennedy, Florida, March 1970

82
80
76
74
I 22 -a
70
4 3 0 3
68 1- a 3 4 I ::: 4 4 3
66 16002
MAR 25, 1970
LEGEND 2 INDICATES WIND FROM WEST
AND SPEED OF 22m/sec.
U a4
13 a
3 3 A 5 0
A 4 5 -034 -36 A 4 4 )3 8
17002 MAR 27, 1970
CAJ U N-D ART
21 (I
t
-51 -47 Y 4 1 '. 38 -38
36
17002 MAR 31, 1970
Figure 32. High Altitude Chaff Measured Wind Profiles, Cape Kennedy, Florida, March 1970
49

82
80
78
76
74
I a 1 5
27 e.
A 3 9 4 3 7
4 5 3 68
66 L -% 17002
APR 6,1970
LEGEND ** INDICATES WlWD FROM WEST -.. AND SPEED OF 22m/sec.
35 a
dl 5
Y 13 -. A1 7
A 2 3 A 2 2 18 A
17
3 7 a 2 2
a 24
-24 22 w
e 1 0 9 8
4 7 15 t. 15 -. 3:: -18 -11
-16
15252 APR 7,1970
CAJ UN-DART
36
25 0- 19 a Y l 6
&17
b 2 7 b 3 3
b 3 5
b 2 9 -28 -25 -32
9 2 8 25 9 ?21
?21
?I7 v3
18 20
7 5 -1 2 -1 7 All
20
17002 APR 8, 1970
F i g u r e 33. High A l t i t u d e C h a f f Measured Wind P r o f i l e s , Cape Kennedy, F l o r i d a , A p r i l 1970
50

82
80
78
h
Y E 76
5 74
Y
W
3 i-
n
U
72
7c
6t
57 4
a 4 7 29 * 1 2 2
8' &3 8
b 4 1
0 3 8 b 3 5
s2
-27
k64 b 2 0 L 2 0
-32 35 B
r 3 4 9 3 1 - 2 33 -0 *33 a 4 3
17002 APR 9, 1970
CAJUN-DART
LEGEND INDICATES WIND FROM WEST AND SPEED OF 22m/sec.
6 0 9 60 * 0 5 2 47 4 42 * c 3 3
0 -3 0
* 30 a 2 2 .'28
a 26 25 * *18
dl 2
so
4 3 9 53
57 * 5 5 4 49 a a 4 3
a 3 9 3 4 a 33 a
' 2 6
20202 21432 APR 10, 1970 APR 11, 1970
SUPER LOKI-DART SUPER LOKI-DART
F i g u r e 34. High A l t i t u d e Chaff Measured Wind P r o f i l e s , Cape Kennedy, F l o r i d a , A p r i l 1970
5 1

82
80
78
76
74
72
70
68
66
52
LEGEND
38 (L
33 + 634 d 3 1 r 3 1
d 3 0 6 3 1 #3 1 w 3 3 41 U 47 U d5 1
24 a 20 * 48
c 4 -e &6
01 2
t:: )40
- 0 1 4
9'9
17002 APR 16,1970
a24
84 c 73 e
'c?. 58 e- 50 W
13 !z e l 3 c
17002 APR 17, 1970 APR 20,1970
CAJUN-DART
Figure 35. High Altitude Chaff Measured Wind Profi!t-. Cape Kennedy, Florida, April 1970

1 I I I I I I I I I I I
I I I I I I I I I I I B s E s B s E3 e. B 0 z :: :: I
S11323WOllW - 3OnllllV
53

aJ 5 4 M 0 4 F
W a aJ V
5 W W a m 5 G 4 3
m I
M rl k
54

55
0 0 0 0 0 0 m co b * rl
2 rl
3 2 $4 rl
0 0 m
0 v) rl
(u U (d G 4 -0 $4 0 0 u 6 G 4
$4 0 $4 $4
3 m m (u $4 5 M 4 Fr
56

0 0 0 0 0 0 0 0 0 Q m (v d 0 m 00 h \o 2 d rl rl d m rl
a, U (d c 4 -0 &I 0 0 V I N
c 4
57

KM
80-82
78-80
74-72
72-7d
70-71
58 Figure 41. Typical Chaff Dispersion

e
90
85
80
7 5
70
65
60
55
n 5 50 W
w E 45 n w I 4 4
40
35
30
25
20
15
0 0
I
Curves A and B are least-squares f i t to Johnston Island summertime observations and Tonopah Test range wintertime measurements, respectively. Suchy (nylon bristles) data was provided by Mr. Kenneth Jenkins, White Sands Missile Range. Curves C and D are least- squares f i t to Cape Kennedy observations from February to June.
0 5 10 15 20 25 30 35 40 4 5 50 55 60
FALL RATE (m/sec)
Figure 42. Rates of F a l l f o r Various Meteorological Sensors
59
REFEXENCES
1. Turner,R, E. and L. P. Gilchrist, "Hopi-Dart and Cajuq-Dart Rocket Wind Measuring Systems," NASA "M X-53303, MSFC, J u l y 26, 1965 .
2. Bollermann, Bruce, "A Study of 30 km t o 90 km Meteorological Rocket Sounding Systems,"Volume 1, L i t e r a t u r e and D a t a Review, P a r t 1," NASA CR-1529, May 1970.
3, Bollermann, Bruce, "A Study of 30 km t o 90 km Meteorological Rocket Sounding Systems, Volume 1, L i t e r a t u r e and Data Review, P a r t 2," NASA CR-1529.
&, Bollermann, Bruce and Robert L. Walker, "Cajun-Dart 95 Kilometer Sounding Rocket," NASA CR-61175, August 29, 1967.
6, Bollermann, Bruce and Robert L. Walker, "Super Loki-Dart Meteoro- l og ica l Rocket System,"" NASA CR-61238, June 30, 1968.
Spear , Robert C. , "Bppi-Dart High Al t i t ude Wind Measuring System,'' F ina l Report No. 7999, Contract NAS8-5175, Rocket Power, Inc,, Mesa, Arizona, December 1964.
6 .
7. Webb, W. L., "Stratospheric Solar Response," Journal of the Atmospheric Sciences, Vol. 21, No. 6, pp. 582-591, 1964.
%. Mitchel l , L. V., "Var iab i l i ty of the Monthly Mean Zonal Wind, 30-60 km," AWS TR-195, A p r i l 1970.
9. Lov i l l , J a m e i E., "Dynamics of the S t ruc ture of the Atmosphere over Mountainous Terrain from 4-70 km as Inr'erred from High-Alti- tude Chaff, Ozone Sensors and Super-pressure Balloons ,'I Atmospheric Science Paper No. 160, COO-1340-20, January 1970.
10. Scoggins, J. R., "An Evaluation of Deta i l Wind D a t a as Measured by the FPS-16 Radar/Spherical Balloon Technique,'' NASA TN D-1572, May 1963.
11. Leviton, Robert and Vincent E. Lal ly , "Accuracy of Wind Determina- t i o n from the Track of a Fa l l ing Object," AE'CRC-TN-58-213, A i r Force Cambridge Research Center, March 1958.
d
60
APPROVAL
HIGH ALTITUDE METEOROLOGICAL ROCKET WIND MEASURING SYSTEMS
AND RESULTS TAKEN AT CAPE RENNeDY, FLORIDA
by R. E. Turner, D, L, Johnson and L, P. G i l c h r i s t
The information i n t h i s r epor t has been reviewed f o r s e c u r i t y c l a s s i f i c a t i o n . R e v i e w of any information concerning Department of Defense or Atomic Energy Commission programs has been made by the MSFC Securi ty C l a s s i f i c a t i o n Off icer . This report-, i n i ts e n t i r e t y , has been determined t o be unclassif ied.
This document has a l s o been reviewed and approved f o r technica l accuracy .
Chief , Aeros&a.de Environment Division
y - Director , Aero-As trodynamics Laboratory
MSFC-RSA. Ala 61