nasa research model wind jaxa
TRANSCRIPT
80% Scaled NASA Common Research Model Wind Tunnel Test of JAXA at Relatively Low Reynolds
Number
Makoto Ueno∗, Takamasa Kohzai†, Seigo Koga‡
Hiroyuki Kato§, Kazuyuki Nakakita¶and Norikazu Sudanil
Japan Aerospace Exploration Agency, Chofu, Tokyo, 182-8522, Japan
A wind tunnel test of a 80% scaled copy of the NASA Common Research Model (CRM) was performed in the 2m × 2m transonic wind tunnel of Japan Aerospace Exploration Agency (JAXA). The wind tunnel model was fabricated by JAXA consulting NASA Lan-gley Research Center and the Drag Prediction Workshop committee members. The test was conducted at relatively low Reynolds number of 2.27 × 10⁶ due to the limitation of the tunnel capability and boundary layer transition was simulated with optimized roughness.
In the test campaign, static pressure distribution and aerodynamic forces were suc-cessfully acquired while the model main wings were deformed during the test due to the dynamic pressure. To make a fair comparison with the data from other sources in different circumstances, data normalization techniques were applied. Then, the data was compared with the data of the National Transonic Facility of NASA and CFD. The data normal-ization successfully realized fair comparisons for pressure distribution and lift coefficients while the tests were performed at the different circumstances such as the different Reynolds numbers.
Nomenclature
α Angle of attack η Span-wise section location normalized by the half span length b/2 Λm Sweep of the maximum-thickness line (x/c)m Chordwise location of the airfoil maximum thickness point Amax Maximum cross sectional area of the body b Reference span length c Chord length cref Reference chord ca 2-dimensional axial force coefficient at a wing section cd 2-dimensional drag coefficient at a wing section Cf Skin friction coefficient cl 2-dimensional lift coefficient at a wing section cn 2-dimensional normal force coefficient at a wing section cp Static pressure coefficient d Reference diameter of the body
(4/π)Amax
Fx, Fy, Fz , Mx, My and Mz 6-component force/moment F F Form factor
∗Associate Senior Researcher, Institute of Aerospace Technology, [email protected], Senior Member AIAA. †Researcher, Institute of Aerospace Technology, [email protected], Member AIAA. ‡Researcher, Institute of Aerospace Technology, [email protected], Non-member §Associate Senior Researcher, Institute of Aerospace Technology, [email protected], Senior Member AIAA. ¶Senior Researcher, Institute of Aerospace Technology, [email protected], Senior Member AIAA. ISenior Researcher, Institute of Aerospace Technology, [email protected], Senior Member AIAA.
1 of 28
American Institute of Aeronautics and Astronautics
51st AIAA Aerospace Sciences Meeting including the New Horizons Forum and Aerospace Exposition 07 - 10 January 2013, Grapevine (Dallas/Ft. Worth Region), Texas
AIAA 2013-0493
Copyright © 2013 by the American Institute of Aeronautics and Astronautics, Inc. All rights reserved.
Dow
nloa
ded
by N
ASA
Lan
gley
Res
earc
h C
tr o
n Fe
brua
ry 7
, 201
4 | h
ttp://
arc.
aiaa
.org
| D
OI:
10.
2514
/6.2
013-
493

l Length of the body M Mach number Mpc Mach number calculated using plenum chamber static pressure Ppc Plenum chamber static pressure P0 Total pressure Q Component interference factor Re Reynolds number Rec Reynolds number based on the reference chord length cref
Sref Reference area t Thickness of the wing x x-component coordinate of body axis z z-component coordinate of body axis
I. Introduction
Drag prediction is a kind of the most important aspect of aerodynamics concerning commercial airplane development. Recently, there are some efforts to utilize computational fluid dynamics (CFD) to estimate
drag and the AIAA have been holding the AIAA drag prediction workshops (DPW) since 2001.1, 2, 3, 4 The information about the workshop can be acquired from the web page (http://aaac.larc.nasa.gov/tsab/cfdlarc/aiaadpw/). To ensure reliability of CFD drag prediction, assurance with wind tunnel test results are crucial. However, consistency of the results among wind tunnels might not be expected all the time, while wind tunnel testing has been conducted since very old days.
In the DPW-4 and the DPW-5, the NASA Common Research Model (CRM) is designed5 and has been used as the target shape of the workshop. As the experimental reference, the NASA Langley Research Center (LaRC) fabricated the wind tunnel model and did the tests of it6, 7, 8, 9 and have been continuing further analyses.10, 11 Japan Aerospace Exploration Agency (JAXA) is also making an effort to predict aerodynamic characteristics consistently both by CFD and wind tunnel testing. JAXA is now attending the DPW12 and fabricated a 80% scaled CRM. The wind tunnel model of JAXA was designed for its wind tunnel facility, JAXA 2m × 2m transonic wind tunnel (JTWT). Thus, a set of wind tunnel campaign has been planned and conducted.
The objectives of the wind tunnel test is to acquire stable experimental data and clarify correlation between CFD and test results of other facilities. Additionally, because the wind tunnel cannot achieve sufficiently high Reynolds number, its availability and limit to actual high Reynolds number target should be assessed. To achieve these objectives, a fair comparison of the data with that from other sources, such as other wind tunnels and CFD, should be prepared. In this article, data normalization techniques are introduced. Then, application of it and the actual comparison of the data among wind tunnels and CFD are shown.
II. Facility and Equipments
II.A. Wind Tunnel
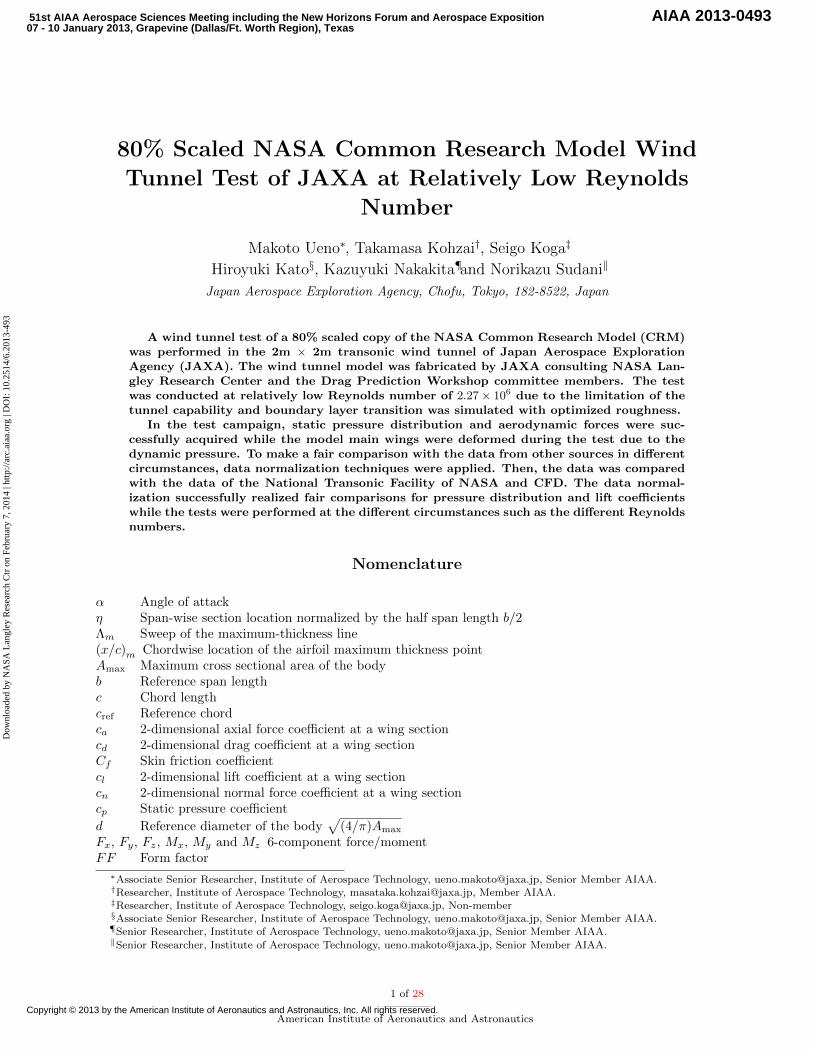
The 2m × 2m transonic wind tunnel of Japan Aerospace Exploration Agency (JTWT) was used for the tests. It has 4 exchangeable rectangle test sections with the reference height and the reference width of 2 m. A test section with porous walls were used for this test campaign. The perforation holes are perpendicular to the walls and the opening ration of the wall is 20%. The total pressure and the Mach number can be controlled from 50 to 150 kPa and from 0.1 to 1.4, respectively. The wind tunnel is equipped with a 22,500 kW blower, and supersonic operation is achieved using a 8,000kW auxiliary blower. A bird’s eye view of the wind tunnel is shown in Fig. 1. The Mach number is controlled with the total pressure (P0) and the static pressure of the plenum chamber (Ppc). The Mach number calculated by the P0 and the Ppc is called the plenum chamber Mach number (Mpc).
II.B. Wind Tunnel Model
The wind tunnel model in use is a 80% scaled copy of the NASA Common Research Model of NASA National Transonic Facility.6 It was scaled to 80% of the NTF’s NASA CRM because of the test section size of the
2 of 28
American Institute of Aeronautics and Astronautics
Dow
nloa
ded
by N
ASA
Lan
gley
Res
earc
h C
tr o
n Fe
brua
ry 7
, 201
4 | h
ttp://
arc.
aiaa
.org
| D
OI:
10.
2514
/6.2
013-
493
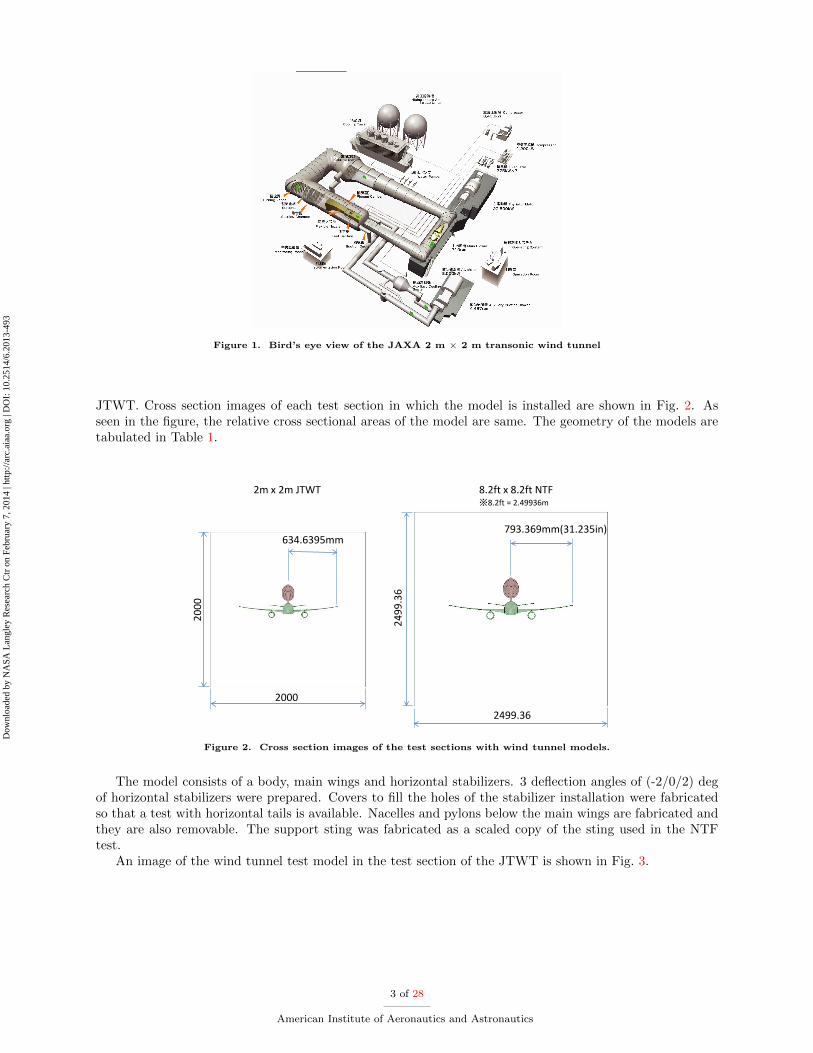
Figure 1. Bird’s eye view of the JAXA 2 m × 2 m transonic wind tunnel
JTWT. Cross section images of each test section in which the model is installed are shown in Fig. 2. As seen in the figure, the relative cross sectional areas of the model are same. The geometry of the models are tabulated in Table 1.
634.6395mm 793.369mm(31.235in)
2m x 2m JTWT 8.2ft x 8.2ft NTF ※8.2ft = 2.49936m
2000
2000
2499
.36
2499.36
Figure 2. Cross section images of the test sections with wind tunnel models.
The model consists of a body, main wings and horizontal stabilizers. 3 deflection angles of (-2/0/2) deg of horizontal stabilizers were prepared. Covers to fill the holes of the stabilizer installation were fabricated so that a test with horizontal tails is available. Nacelles and pylons below the main wings are fabricated and they are also removable. The support sting was fabricated as a scaled copy of the sting used in the NTF test.
An image of the wind tunnel test model in the test section of the JTWT is shown in Fig. 3.
3 of 28
American Institute of Aeronautics and Astronautics
Dow
nloa
ded
by N
ASA
Lan
gley
Res
earc
h C
tr o
n Fe
brua
ry 7
, 201
4 | h
ttp://
arc.
aiaa
.org
| D
OI:
10.
2514
/6.2
013-
493

NTF’s model JAXA’s 80% scaled model
Reference Area (Sref) 279709.7 mm2 179014.2 mm2
Reference Chord (cref) 189.1 mm 151.31 mm
Reference Span (b) 1586.6 mm 1269.3 mm
Table 1. Geometry of the model.
Figure 3. Wind tunnel model in the test section of the JTWT.
II.C. Measurement Equipments
II.C.1. Force and Pressure Measurements
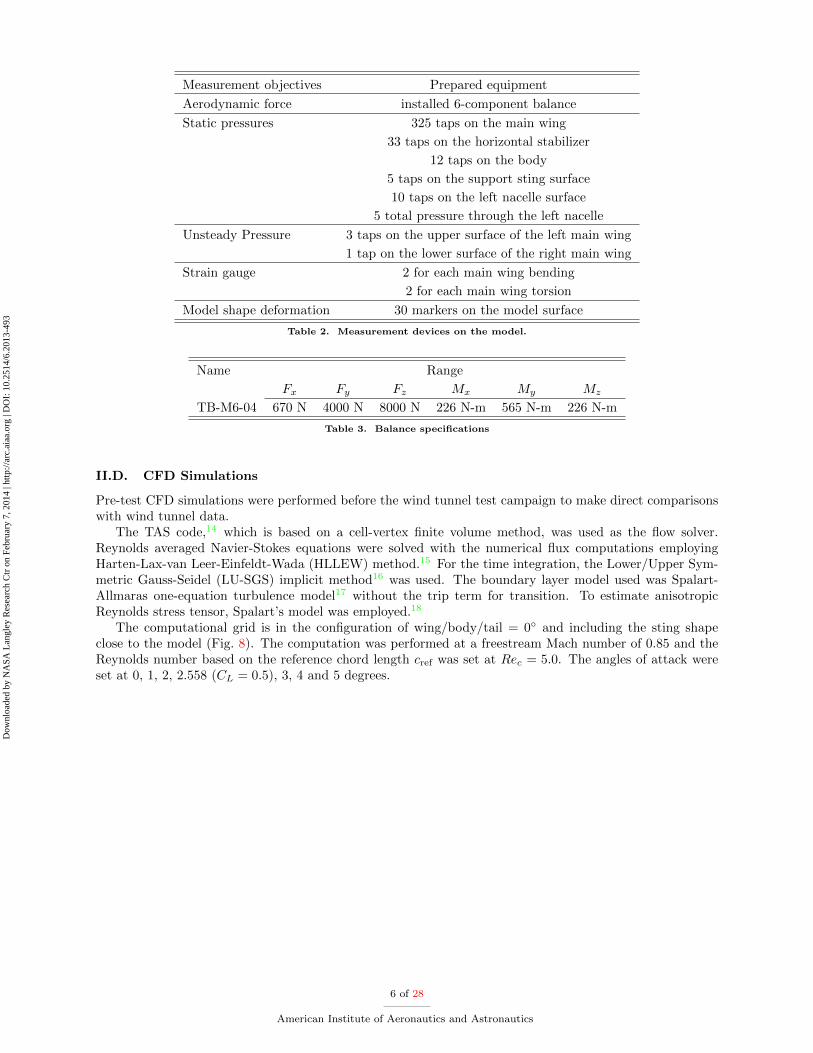
A block diagram of the measurement system is shown in Fig. 4. All the transmission line, however, could not pass the support sting because of those thickness. Thus, the test campaign was divided in two parts such as static and unsteady measurement.
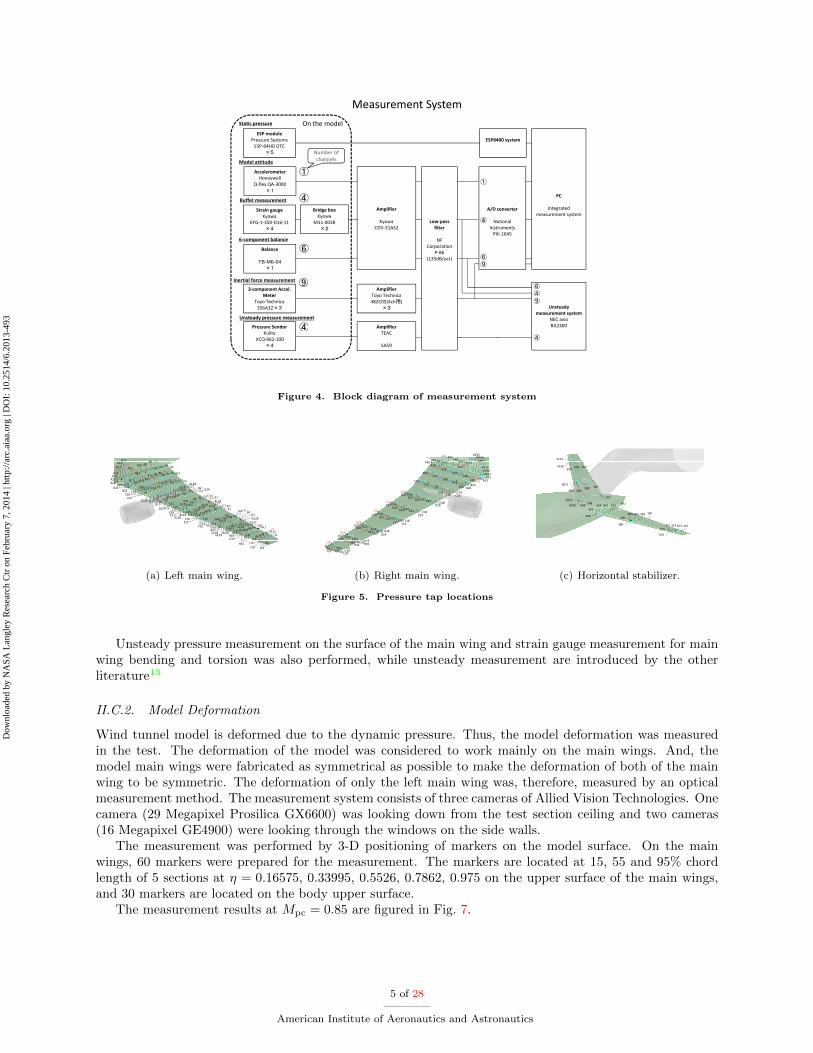
Measurement equipment prepared are tabulated in Table 2. Most of the measurement items are designed to follow the NTF’s model.6 The model has 370 pressure taps, which consists of 325 taps on the main wings, 12 taps on the fuselage and 33 taps on the horizontal tails. The taps on the wings are located in 9 span-wise wing sections (η = 0.131, 0.201, 0.283, 0.397, 0.502, 0.603, 0.727, 0.846, and 0.950) as the same location of the NTF’s model and 1 location at η = 0.312 originally on the lower surface of the main wing. The pressures are led to the installed electronically scanned pressure sensor (ESP) modules by stainless tubes with the inner diameter of 0.8 mm. The ESP system used is the System 8400 of Pressure System Inc. The pressure taps of one wing section is basically apportioned to the left and right main wings to pack tubes, the left main wing holds upper surface pressure taps and the right main wing covers the lower surface, while the trench to install the pressure tubes are curved symmetrically to keep the bending characteristics of both wings to be same. Pressure tap arrangement images are illustrated in Fig. 5. The locations indicated by black texts were used for this campaign and other taps were not used because of ESP capability limitation.
The model was installed in the test section supported by the sting through the 6-component force balance. The balance specifications are listed in Table 3. The support sting was fabricated to simulate the original sting of the NTF while the test section of the JTWT is shorter and the aft-end of the sting shape was trimmed off to place the model in the proper location of the test section.
Static measurement consists of aerodynamic force, surface pressure distribution and main wing deformation measurement. The surface pressure distribution measurement includes wind tunnel wall surface pressure measurement for wall interference correction. The aerodynamic force measurement was performed using a 6-component force balance which is installed in the wind tunnel model.
4 of 28
American Institute of Aeronautics and Astronautics
Dow
nloa
ded
by N
ASA
Lan
gley
Res
earc
h C
tr o
n Fe
brua
ry 7
, 201
4 | h
ttp://
arc.
aiaa
.org
| D
OI:
10.
2514
/6.2
013-
493
Measurement SystemOn the model
ESP modulePressure SystemsESP‐64HD DTC
×5
Static pressure
ESP8400 system
Number of
AccelerometerHoneywell
Q‐flex QA‐3000×1
Model attitude
①
channels
①
Strain gaugeKyowa
KFG‐1‐350‐D16‐11
Bridge boxKyowa
M11‐0038
Amplifier
Kyowa Low‐pass
A/D converter
National
PC
Integrated measurement system
Buffet measurement
×1
④
④
×4 ×2 CDV‐31AS2 filter
NF Corporation
P‐86(135dB/oct)
InstrumentsPXI‐1045
Balance
TB M6 04
6‐component balance
⑥⑥(135dB/oct)
3‐component Accel. Meter
AmplifierToyo Technica
Inertial force measurement
TB-M6-04×1
④⑥
⑨
⑨
Pressure Sendor Amplifier
Unsteady pressure measurement
MeterToyo Technica356A32×3
Toyo Technica482C05(4ch用)
×3 Unsteady measurement system
NEC avioRA2300④
⑨④
KuliteXCQ‐062‐10D
×4
TEAC
SA59
④④
Figure 4. Block diagram of measurement system
左翼静圧孔Aランクが黒、Bランクが青、Cランクが赤
A4A6A156
A1A2A3
A4
A5
A6
A7
A8
A9
A10
A11A12
A13A14A16
A17A18A19A20
B1B2B3B4
B5B6B7B8
B9B10B12B140
A22A21
ZL28C1
D6D24
D5D4 D1
B9B11B12B13
B14B15
C16
B17B18B19B20
B21B22
C2C3C4C5C6
C7C8C9C10
C11C12C13
C14C15C17C18
C19
ZL27ZL26ZL25ZL24
ZL23
D2D3
D9D7D6
D5D8
E1
E15
E6
E12E11
E8E9
F1F3 F2
C19C20C21
ZL23ZL22ZL20
ZL21
ZL19ZL18D10
D11D12
D13D14D15
D16D17
E2E3E4E5
E7E10E13
E14EL23
EL24EL25 EL26
EL27EL28
F4F5F6F7
EL19
E15F10
F1
F12F13F14
G1
D14D15E16E17
EL18
EL20EL21
EL22EL23 F6F7F8F9F11
F16F17
G2G3G4
G5G6
G7G8G9
G10G11
G12G13G14G15 GL23 GL25GL26
GL27GL28
H2H3F14H1
I1
F15GG15G16G17GL18
GL19GL20GL21GL22
GL23GL24GL25GL26 H2H3
H4H5
H6
H7H8
H9
H10
H11
H12
H13
H14H16H17
I2I3
I4I5I6
I7I8I9I10I11H13
H15 I12I13
I14
I15I16
(a) Left main wing.
右翼静圧孔Aランクが黒、Bランクが青、Cランクが赤
AR1AR2AR3
AR4
AR5
AR6AR8AR10AR13
AR14AR15
AR16AR17AR1 AR3AR5AR7AR9
AR10
AR11AR12
AR13 AR17AR18AR19AR20
AR22AR21
A34A33
A32A31 A30A29A28A27B34B33
B32B31 AR22A23A24
A25A26A27
B23
B31B30B29B28B27B24
B25B26
C23C27 C25
C32C31C30C29C28
C34C33
D28 C23C24C26
C28
D18D19
D20D21D22D23D24D25
D26D27
E2223E24E25
E26E27E28
E18E19
E20E21E22E23
F18F19
F20F21F22F23
F24F25F26F27
F28
G27G28 F19
G18G19
G20G21
G22G23G24
G25G27G26
H18H22H24H25H27
H28
H26H18H19H20
H21H23H24
I18I19
I20I21I22I23I24I25
I27I28
I26
(b) Right main wing.
SC11
SC7SC10SC9
SC8
SB11SB7
SB10 SB9SB8
SA1
SA5SA4 SA3 SA2
SA11SA7
SA10 SA9SA8
SA6
SA5
SB6
SB1SB5
SB4 SB3 SB2
SC4 SC3SB6
SC6
SC1SC5
SC4 SC3 SC2
(c) Horizontal stabilizer.
Figure 5. Pressure tap locations
Unsteady pressure measurement on the surface of the main wing and strain gauge measurement for main wing bending and torsion was also performed, while unsteady measurement are introduced by the other literature13
II.C.2. Model Deformation
Wind tunnel model is deformed due to the dynamic pressure. Thus, the model deformation was measured in the test. The deformation of the model was considered to work mainly on the main wings. And, the model main wings were fabricated as symmetrical as possible to make the deformation of both of the main wing to be symmetric. The deformation of only the left main wing was, therefore, measured by an optical measurement method. The measurement system consists of three cameras of Allied Vision Technologies. One camera (29 Megapixel Prosilica GX6600) was looking down from the test section ceiling and two cameras (16 Megapixel GE4900) were looking through the windows on the side walls.
The measurement was performed by 3-D positioning of markers on the model surface. On the main wings, 60 markers were prepared for the measurement. The markers are located at 15, 55 and 95% chord length of 5 sections at η = 0.16575, 0.33995, 0.5526, 0.7862, 0.975 on the upper surface of the main wings, and 30 markers are located on the body upper surface.
The measurement results at Mpc = 0.85 are figured in Fig. 7.
5 of 28
American Institute of Aeronautics and Astronautics
Dow
nloa
ded
by N
ASA
Lan
gley
Res
earc
h C
tr o
n Fe
brua
ry 7
, 201
4 | h
ttp://
arc.
aiaa
.org
| D
OI:
10.
2514
/6.2
013-
493
Measurement objectives Prepared equipment
Aerodynamic force installed 6-component balance
Static pressures 325 taps on the main wing
33 taps on the horizontal stabilizer
12 taps on the body
5 taps on the support sting surface
10 taps on the left nacelle surface
5 total pressure through the left nacelle
Unsteady Pressure 3 taps on the upper surface of the left main wing
1 tap on the lower surface of the right main wing
Strain gauge 2 for each main wing bending
2 for each main wing torsion
Model shape deformation 30 markers on the model surface
Table 2. Measurement devices on the model.
Name Range
Fx Fy Fz Mx My Mz
TB-M6-04 670 N 4000 N 8000 N 226 N-m 565 N-m 226 N-m
Table 3. Balance specifications
II.D. CFD Simulations
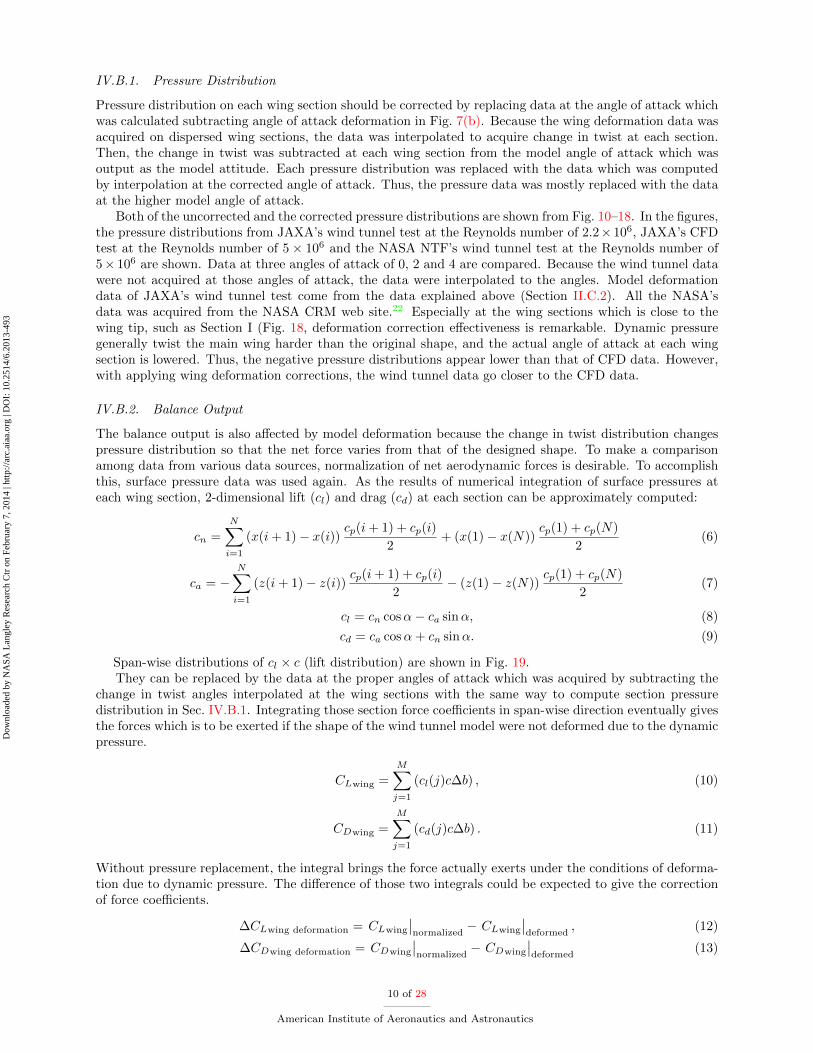
Pre-test CFD simulations were performed before the wind tunnel test campaign to make direct comparisons with wind tunnel data.
The TAS code,14 which is based on a cell-vertex finite volume method, was used as the flow solver. Reynolds averaged Navier-Stokes equations were solved with the numerical flux computations employing Harten-Lax-van Leer-Einfeldt-Wada (HLLEW) method.15 For the time integration, the Lower/Upper Symmetric Gauss-Seidel (LU-SGS) implicit method16 was used. The boundary layer model used was Spalart-Allmaras one-equation turbulence model17 without the trip term for transition. To estimate anisotropic Reynolds stress tensor, Spalart’s model was employed.18
The computational grid is in the configuration of wing/body/tail = 0◦ and including the sting shape close to the model (Fig. 8). The computation was performed at a freestream Mach number of 0.85 and the Reynolds number based on the reference chord length cref was set at Rec = 5.0. The angles of attack were set at 0, 1, 2, 2.558 (CL = 0.5), 3, 4 and 5 degrees.
6 of 28
American Institute of Aeronautics and Astronautics
Dow
nloa
ded
by N
ASA
Lan
gley
Res
earc
h C
tr o
n Fe
brua
ry 7
, 201
4 | h
ttp://
arc.
aiaa
.org
| D
OI:
10.
2514
/6.2
013-
493
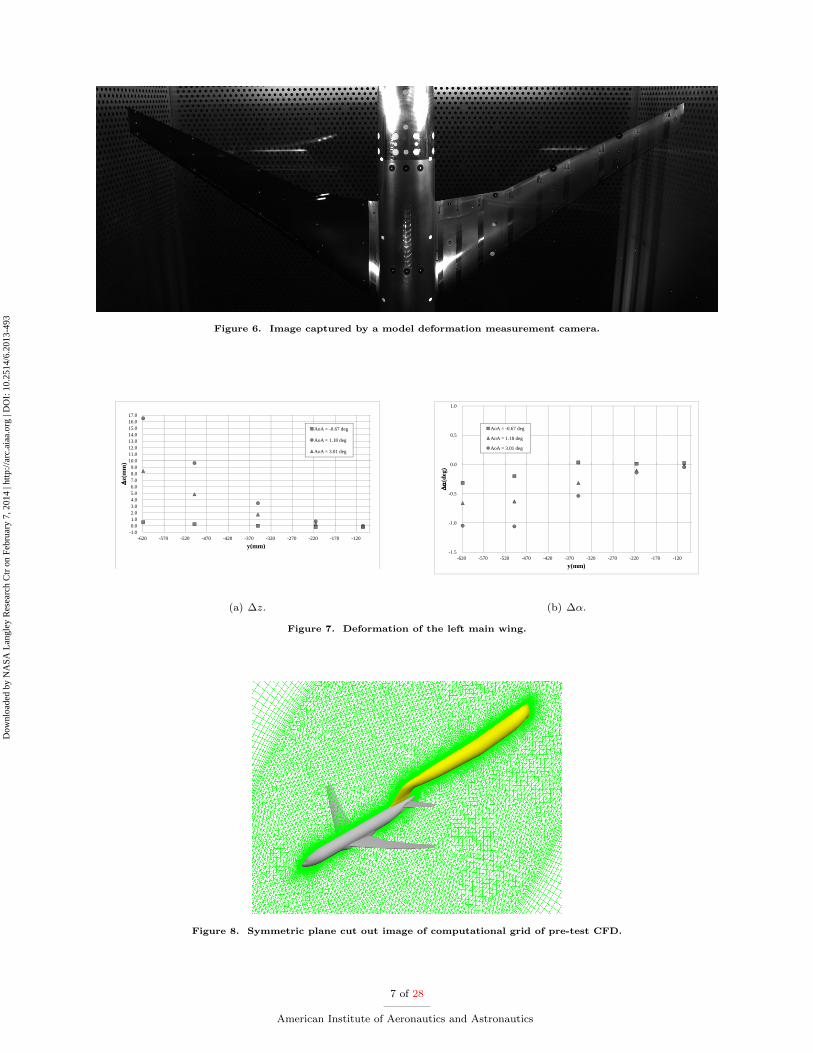
Figure 6. Image captured by a model deformation measurement camera.
16.0 17.0
12 013.0 14.0 15.0 AoA = -0.67 deg
AoA = 1.18 deg
8 09.0
10.0 11.0 12.0
mm
)
AoA = 3.01 deg
5.0 6.0 7.0 8.0
z(
m
1.02.0 3.0 4.0
-1.0 0.0 1.0
-620 -570 -520 -470 -420 -370 -320 -270 -220 -170 -120 ( )y(mm)
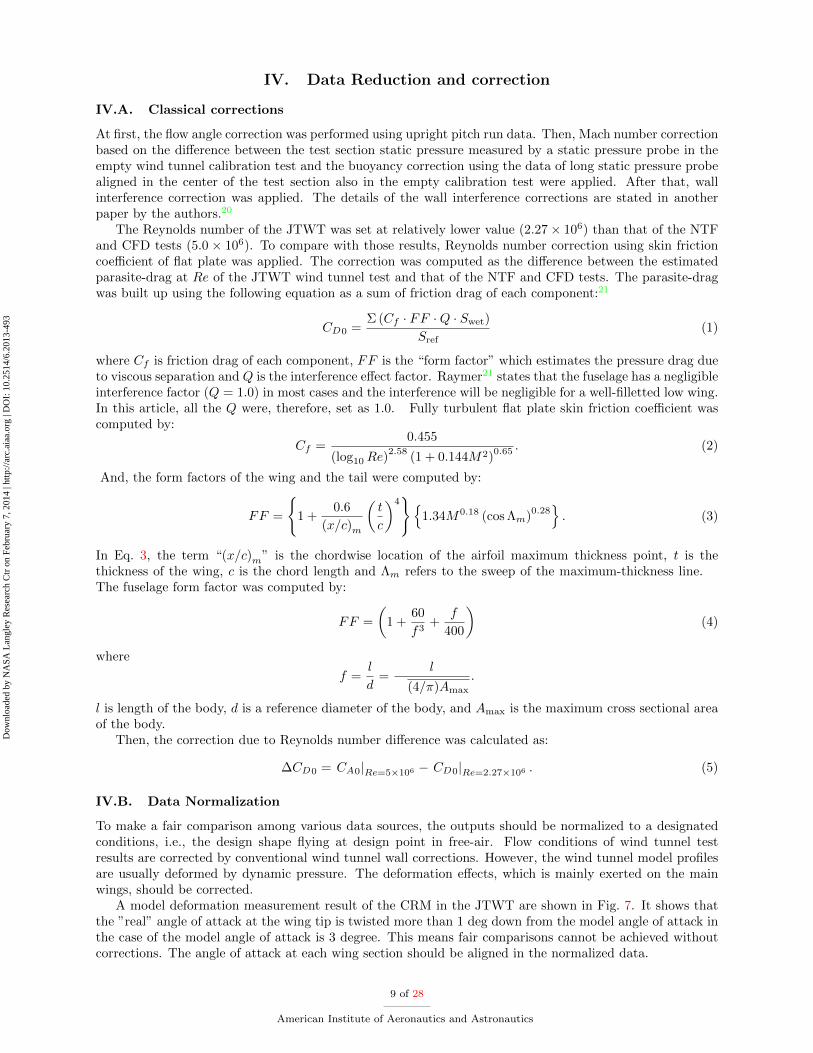
(a) Δz.
-1.5
-1.0
-0.5
0.0
0.5
1.0
-620 -570 -520 -470 -420 -370 -320 -270 -220 -170 -120
(deg
)
y(mm)
AoA = -0.67 deg
AoA = 1.18 deg
AoA = 3.01 deg
(b) Δα.
Figure 7. Deformation of the left main wing.
Figure 8. Symmetric plane cut out image of computational grid of pre-test CFD.
7 of 28
American Institute of Aeronautics and Astronautics
Dow
nloa
ded
by N
ASA
Lan
gley
Res
earc
h C
tr o
n Fe
brua
ry 7
, 201
4 | h
ttp://
arc.
aiaa
.org
| D
OI:
10.
2514
/6.2
013-
493

III. Test Conditions
III.A. Wind Tunnel Test
The static measurement items are aerodynamic force and moment, pressure distribution on the model surface, model deformation and wind tunnel wall pressure distribution.
The Reynolds number was set at 2.27 ×10⁶, and the total pressure (P0 was set at 120 kPa to achieve it. The Reynolds number was selected because of the total pressure limit of the wind tunnel. To force boundary layer around the wind tunnel model to be turbulent, trip dots are stuck on the main wings, the horizontal stabilizers and the nose of the body. The trip dots which have a diameter of 1.27 mm and spaced 2.54 mm were located at 10% of chord of the wings and 1.5% station of the body. The heights of the trip dots were optimized following Braslow and Knox19 and they are tabulated in Table 4.
Part Height [mm]
From the side of body to the yehudi break 0.089
From the yehudi break to the midwing 0.079
From the midwing to the wing tip 0.079
Horizontal stabilizers 0.079
Nose 0.064
Table 4. Height of trip dots
The horizontal stabilizers were attached and the deflection angle of them was fixed at 0 deg. The sideslip angle was fixed at 0 deg. Mach number calculated using plenum chamber static pressure was set at Mpc = 0.7, 0.83, 0.85, 0.86 and 0.87. However, the results only at the Mpc = 0.85 is discussed in this article. The pitch angle of the model support system was varied approximately from -2 to 5 deg.
8 of 28
American Institute of Aeronautics and Astronautics
Dow
nloa
ded
by N
ASA
Lan
gley
Res
earc
h C
tr o
n Fe
brua
ry 7
, 201
4 | h
ttp://
arc.
aiaa
.org
| D
OI:
10.
2514
/6.2
013-
493
IV. Data Reduction and correction
IV.A. Classical corrections
At first, the flow angle correction was performed using upright pitch run data. Then, Mach number correction based on the difference between the test section static pressure measured by a static pressure probe in the empty wind tunnel calibration test and the buoyancy correction using the data of long static pressure probe aligned in the center of the test section also in the empty calibration test were applied. After that, wall interference correction was applied. The details of the wall interference corrections are stated in another paper by the authors.20
The Reynolds number of the JTWT was set at relatively lower value (2.27 × 10⁶) than that of the NTF and CFD tests (5.0 × 10⁶). To compare with those results, Reynolds number correction using skin friction coefficient of flat plate was applied. The correction was computed as the difference between the estimated parasite-drag at Re of the JTWT wind tunnel test and that of the NTF and CFD tests. The parasite-drag was built up using the following equation as a sum of friction drag of each component:21
CD0 = Σ (Cf · F F · Q · Swet)
Sref (1)
where Cf is friction drag of each component, F F is the “form factor” which estimates the pressure drag due to viscous separation and Q is the interference effect factor. Raymer21 states that the fuselage has a negligible interference factor (Q = 1.0) in most cases and the interference will be negligible for a well-filletted low wing. In this article, all the Q were, therefore, set as 1.0. Fully turbulent flat plate skin friction coefficient was computed by:
Cf = 0.455
(log10 Re)2.58
(1 + 0.144M2)0.65 . (2)
And, the form factors of the wing and the tail were computed by:
F F =
1 +
0.6 (x/c)m
t c
4
1.34M0.18 (cos Λm)0.28
. (3)
In Eq. 3, the term “(x/c)m ” is the chordwise location of the airfoil maximum thickness point, t is the thickness of the wing, c is the chord length and Λm refers to the sweep of the maximum-thickness line. The fuselage form factor was computed by:
F F =
1 +
60 f3
+ f
400
(4)
where
f = l d
= l
(4/π)Amax .
l is length of the body, d is a reference diameter of the body, and Amax is the maximum cross sectional area of the body.
Then, the correction due to Reynolds number difference was calculated as:
ΔCD0 = CA0|Re=5×10⁶ − CD0|Re=2.27×10⁶ . (5)
IV.B. Data Normalization
To make a fair comparison among various data sources, the outputs should be normalized to a designated conditions, i.e., the design shape flying at design point in free-air. Flow conditions of wind tunnel test results are corrected by conventional wind tunnel wall corrections. However, the wind tunnel model profiles are usually deformed by dynamic pressure. The deformation effects, which is mainly exerted on the main wings, should be corrected.
A model deformation measurement result of the CRM in the JTWT are shown in Fig. 7. It shows that the ”real” angle of attack at the wing tip is twisted more than 1 deg down from the model angle of attack in the case of the model angle of attack is 3 degree. This means fair comparisons cannot be achieved without corrections. The angle of attack at each wing section should be aligned in the normalized data.
9 of 28
American Institute of Aeronautics and Astronautics
Dow
nloa
ded
by N
ASA
Lan
gley
Res
earc
h C
tr o
n Fe
brua
ry 7
, 201
4 | h
ttp://
arc.
aiaa
.org
| D
OI:
10.
2514
/6.2
013-
493
IV.B.1. Pressure Distribution
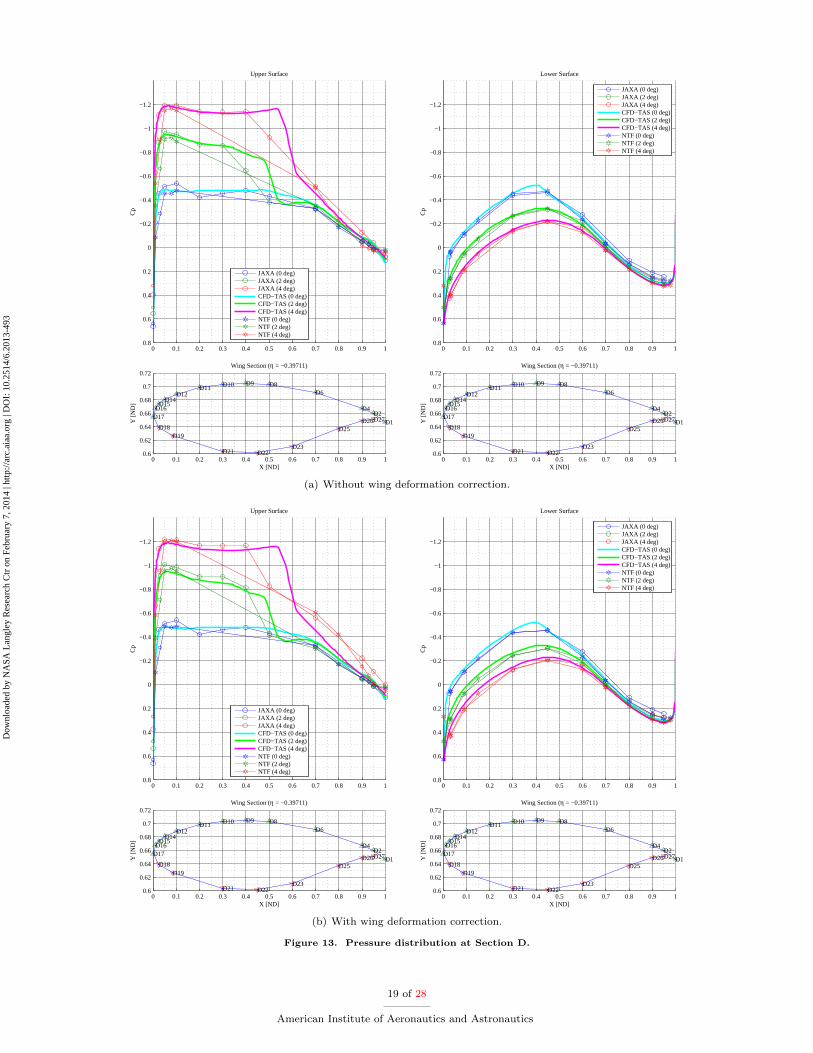
Pressure distribution on each wing section should be corrected by replacing data at the angle of attack which was calculated subtracting angle of attack deformation in Fig. 7(b). Because the wing deformation data was acquired on dispersed wing sections, the data was interpolated to acquire change in twist at each section. Then, the change in twist was subtracted at each wing section from the model angle of attack which was output as the model attitude. Each pressure distribution was replaced with the data which was computed by interpolation at the corrected angle of attack. Thus, the pressure data was mostly replaced with the data at the higher model angle of attack.
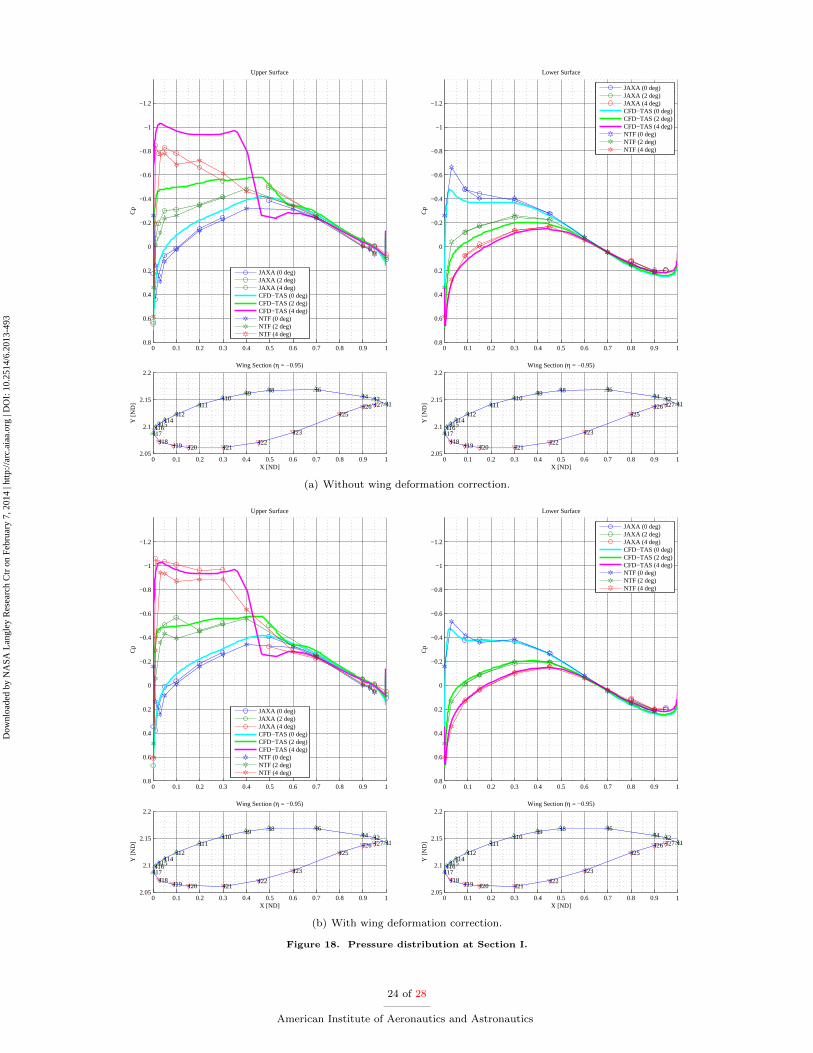
Both of the uncorrected and the corrected pressure distributions are shown from Fig. 10–18. In the figures, the pressure distributions from JAXA’s wind tunnel test at the Reynolds number of 2.2 × 10⁶, JAXA’s CFD test at the Reynolds number of 5 × 10⁶ and the NASA NTF’s wind tunnel test at the Reynolds number of 5 × 10⁶ are shown. Data at three angles of attack of 0, 2 and 4 are compared. Because the wind tunnel data were not acquired at those angles of attack, the data were interpolated to the angles. Model deformation data of JAXA’s wind tunnel test come from the data explained above (Section II.C.2). All the NASA’s data was acquired from the NASA CRM web site.22 Especially at the wing sections which is close to the wing tip, such as Section I (Fig. 18, deformation correction effectiveness is remarkable. Dynamic pressure generally twist the main wing harder than the original shape, and the actual angle of attack at each wing section is lowered. Thus, the negative pressure distributions appear lower than that of CFD data. However, with applying wing deformation corrections, the wind tunnel data go closer to the CFD data.
IV.B.2. Balance Output
The balance output is also affected by model deformation because the change in twist distribution changes pressure distribution so that the net force varies from that of the designed shape. To make a comparison among data from various data sources, normalization of net aerodynamic forces is desirable. To accomplish this, surface pressure data was used again. As the results of numerical integration of surface pressures at each wing section, 2-dimensional lift (cl) and drag (cd) at each section can be approximately computed:
cn = Nt
i=1
(x(i + 1) − x(i)) cp(i + 1) + cp(i)
2 + (x(1) − x(N))
cp(1) + cp(N) 2
(6)
ca = − Nt
i=1
(z(i + 1) − z(i)) cp(i + 1) + cp(i)
2 − (z(1) − z(N))
cp(1) + cp(N) 2
(7)
cl = cn cos α − ca sin α, (8)
cd = ca cos α + cn sin α. (9)
Span-wise distributions of cl × c (lift distribution) are shown in Fig. 19. They can be replaced by the data at the proper angles of attack which was acquired by subtracting the
change in twist angles interpolated at the wing sections with the same way to compute section pressure distribution in Sec. IV.B.1. Integrating those section force coefficients in span-wise direction eventually gives the forces which is to be exerted if the shape of the wind tunnel model were not deformed due to the dynamic pressure.
CLwing = Mt
j=1
(cl(j)cΔb) , (10)
CDwing = Mt
j=1
(cd(j)cΔb) . (11)
Without pressure replacement, the integral brings the force actually exerts under the conditions of deformation due to dynamic pressure. The difference of those two integrals could be expected to give the correction of force coefficients.
ΔCLwing deformation = CLwing
ddnormalized
− CLwing
dddeformed
, (12)
ΔCDwing deformation = CDwing
ddnormalized
− CDwing
dddeformed
(13)
10 of 28
American Institute of Aeronautics and Astronautics
Dow
nloa
ded
by N
ASA
Lan
gley
Res
earc
h C
tr o
n Fe
brua
ry 7
, 201
4 | h
ttp://
arc.
aiaa
.org
| D
OI:
10.
2514
/6.2
013-
493

Finally, the CL and the CD were corrected as follow:
CLcorrected = CL + ΔCLwing deformation, (14)
CDcorrected = CD + ΔCD0 + ΔCDwing deformation (15)
The uncorrected and corrected lift and drag are shown in Fig. 20–22.
11 of 28
American Institute of Aeronautics and Astronautics
Dow
nloa
ded
by N
ASA
Lan
gley
Res
earc
h C
tr o
n Fe
brua
ry 7
, 201
4 | h
ttp://
arc.
aiaa
.org
| D
OI:
10.
2514
/6.2
013-
493
Dow
nloa
ded
by N
ASA
Lan
gley
Res
earc
h C
tr o
n Fe
brua
ry 7
, 201
4 | h
ttp://
arc.
aiaa
.org
| D
OI:
10.
2514
/6.2
013-
493
V. Analysis
V.A. Pressure Distribution
V.A.1. Wing Deformation Correction Effect
As stated in Section IV.B.1, the pressure distribution at the wing section where the static pressure ports are located are shown in Fig. 10–18. Without wing deformation correction, negative pressure levels on the upper surface of the wind tunnel tests are largely different from estimated pressure level of CFD, especially around the wing tip where the changes in twist are large. However, when the wing deformation was corrected, those discrepancy decrease remarkably. The differences between the data of the JTWT and the NTF also agree fairly well while the Reynolds number of those tests are different.
V.A.2. Shock Location
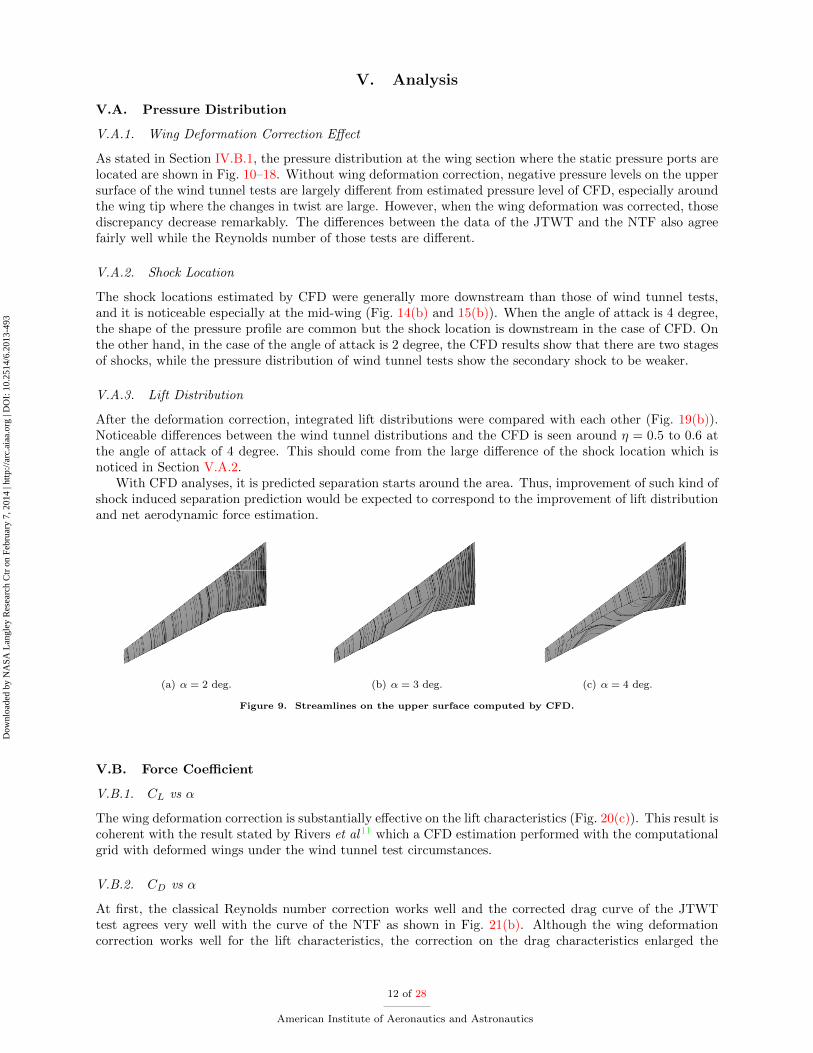
The shock locations estimated by CFD were generally more downstream than those of wind tunnel tests, and it is noticeable especially at the mid-wing (Fig. 14(b) and 15(b)). When the angle of attack is 4 degree, the shape of the pressure profile are common but the shock location is downstream in the case of CFD. On the other hand, in the case of the angle of attack is 2 degree, the CFD results show that there are two stages of shocks, while the pressure distribution of wind tunnel tests show the secondary shock to be weaker.
V.A.3. Lift Distribution
After the deformation correction, integrated lift distributions were compared with each other (Fig. 19(b)). Noticeable differences between the wind tunnel distributions and the CFD is seen around η = 0.5 to 0.6 at the angle of attack of 4 degree. This should come from the large difference of the shock location which is noticed in Section V.A.2.
With CFD analyses, it is predicted separation starts around the area. Thus, improvement of such kind of shock induced separation prediction would be expected to correspond to the improvement of lift distribution and net aerodynamic force estimation.
(a) α = 2 deg. (b) α = 3 deg. (c) α = 4 deg.
Figure 9. Streamlines on the upper surface computed by CFD.
V.B. Force Coefficient
V.B.1. CL vs α
The wing deformation correction is substantially effective on the lift characteristics (Fig. 20(c)). This result is coherent with the result stated by Rivers et al11 which a CFD estimation performed with the computational grid with deformed wings under the wind tunnel test circumstances.
V.B.2. CD vs α
At first, the classical Reynolds number correction works well and the corrected drag curve of the JTWT test agrees very well with the curve of the NTF as shown in Fig. 21(b). Although the wing deformation correction works well for the lift characteristics, the correction on the drag characteristics enlarged the
12 of 28
American Institute of Aeronautics and Astronautics

discrepancy between the results of the JTWT and the NTF while average of them moved closer to the CFD curve (Fig. 21(c)).
V.B.3. Drag Polar
In the case of drag polar, agreement among the data of the JTWT, the NTF and the CFD seems to be the closest only with the Reynolds number correction. However, the agreement between the wind tunnel test results is the best when the wing deformation correction is applied, except the range of CL from 0.2 to 0.5.
VI. Summary
A set of wind tunnel test of the 80% scaled NASA Common Research Model was performed at the 2m × 2m transonic wind tunnel (JTWT) of Japan Aerospace Exploration Agency. The results was compared with the results of the NTF and the CFD estimation which employed the grid simulating the existence of the support sting.
Besides the basic classical wind tunnel corrections, a Reynolds number correction based on the turbulent friction estimation and the wing deformation correction were applied to the wind tunnel data for normalization to make a comparison among the data from different sources.
The pressure distribution at each wing section, the span-wise lift distribution and the net lift and drag characteristics were examined.
Thus, the following conclusions were acquired for pressure distributions:
• The wing deformation correction for the wing sections improved the agreement among the pressure distributions from the JTWT, the NTF and the CFD.
• The shock location predicted by the CFD is generally at more downstream than the wind tunnel results.
Then, the span-wise lift distributions were acquired by integrating the pressure distribution on the main wings, and:
• The noticeable discrepancy between the wind tunnel data and the CFD is observed in the wing deformation corrected case of the angle of attack of 4 degree around the mid-wing.
• The discrepancy was assumed to be caused by shock induced separation difference between the test and the CFD.
Eventually, the conclusions for the net aerodynamic lift and drag were acquired as follows:
• The wing deformation correction is remarkably effective for the lift coefficient characteristics.
• The Reynolds number correction based on the turbulent friction estimation successfully brings a good agreement between the data of the JTWT at the Reynolds number of 2.27 × 10⁶ and that of the NTF at 5 × 10⁶ .
• The wing deformation correction enlarges the discrepancy between the wind tunnel results while the mean value of them are made closer to the CFD estimation.
• The wing deformation correction achieves the agreement of the drag polar curves between the wind tunnel test results except for the range of CL from 0.2 to 0.5 while the discrepancy between the wind tunnel test and the CFD is enlarged.
The corrections applied in this article are significantly effective for the study of pressure distribution and lift. On the other hand, it is not enough for examining drag. Nevertheless, data normalization techniques are crucial to make fair comparisons among the data from various sources. Therefore, improvement of the techniques would be anticipated.
13 of 28
American Institute of Aeronautics and Astronautics
Dow
nloa
ded
by N
ASA
Lan
gley
Res
earc
h C
tr o
n Fe
brua
ry 7
, 201
4 | h
ttp://
arc.
aiaa
.org
| D
OI:
10.
2514
/6.2
013-
493

Acknowledgments
The authors would like to gratefully acknowledge Ms. Melissa B. Rivers of NASA Langley Research Center for providing essential advices to fabricate a copy of the NASA CRM. She and the staffs of the National Transonic Facility of NASA kindly gave the authors various information about the NASA CRM. The authors also would like to appreciate Dr. John C. Vassberg for cleaning up the surface data of the nose part of the CRM. The authors would also like to appreciate Mr. Kentaro Tanaka and Mr. Tohru Hirai for their support mainly for computational operations and Dr. Kanako Yasue and Dr. Kentaro Imagawa for their long term efforts of output definitions of JAXA’s CRM test campaigns.
References 1Levy, D., Wahls, R., Zickuhr, T., Vassberg, J., Agrawal, S., Pirzadeh, S., and Hemsch, M., “Summary of Data from
the First AIAA CFD Drag Prediction Workshop,” AIAA Paper AIAA 2002–841, 40th AIAA Aerospace Sciences Meeting and Exhibit, Jan. 2002.
2Laflin, K., Brodersen, O., Rakowitz, M., Vassberg, J., Wahls, R., Morrison, J., Tinoco, E., and Godard, J.-L., “Summary of Data from the Second AIAA CFD Drag Prediction Workshop,” AIAA Paper 2004–555, 42nd AIAA Aerospace Sciences Meeting and Exhibit, Reno, NV, Jan. 2004.
3Vassberg, J., Tinoco, E., Mani, M., Brodersen, O., Eisfeld, B., Wahls, R., Morrison, J., Zickuhr, T., Laflin, K., and Mavriplis, D., “Summary of the Third AIAA CFD Drag Prediction Workshop,” AIAA Paper 2007–260, 45th AIAA Aerospace Sciences Meeting and Exhibit, jan 2007.
4Vassberg, J., Tinoco, E., Mani, M., Rider, B., Zickuhr, T., Levy, D., Brodersen, O., Eisfeld, B., Crippa, S., Wahls, R., Morrison, J., Mavriplis, D., and Murayama, M., “Summary of the Fourth AIAA CFD Drag Prediction Workshop,” AIAA Paper 2010–4547, 28th AIAA Applied Aerodynamics Conference, jan 2010.
5John C. Vassberg, Mark A. DeHaan, S. M. R. and Wahls, R. A., “Development of a Common Reesearch Model for Applied CFD Validation Studies,” AIAA Paper 2008–6919, Aug. 2008.
6Rivers, M. B. and Dittberner, A., “Experimental Investigations of the NASA Common Research Model in the NASA Langley National Transonic Facility and NASA Ames 11-Ft Transonic Wind Tunnel,” AIAA Paper 2011–1126, Jan. 2011.
7Blakrishna, S. and Acheson, M. J., AIAA Paper 2011–1127, 49th AIAA Aerospace Sciences Meeting including the New Horizons Forum and Aerospace Exposition, Orlando, FL, Jan.
8Bell, J. H., “Pressure-Sensitive Paint Measurements on the NASA Common Research Model in the NASA 11-ft Transonic Wind Tunnel,” AIAA Paper 2011–1128, 49th AIAA Aerospace Sciences Meeting including the New Horizons Forum and Aerospace Exposition, Orlando, FL, Jan. 2011.
9Zilliac, G. G., Pulliam, T. H., Rivers, M. B., Zerr, J., Delgado, M., Halcomb, N., and Lee, H., “A Comparison of the Measured and Computed Skin Friction Distribution on the Common Research Model,” AIAA Paper 2011–1129, 49th AIAA Aerospace Sciences Meeting including the New Horizons Forum and Aerospace Exposition, Orlando, FL, Jan.
10Rivers, M. B. and Hunter, C. A., “Support System Effects on the NASA Common Research Model,” AIAA Paper 2012– 0707, 50th AIAA Aerospace Sciences Meeting including the New Horizons Forum and Aerospace Exposition, Nashville, TN, Jan. 2012.
11Rivers, M. B., Hunter, C. A., and Campbell, R. L., “Further Investigation of the Support System Effects and Wing Twist on the NASA Common Research Model,” AIAA Paper 2012–3209, 30th AIAA Applied Aerodynamics Conference, New Orleans, LO, June 2012.
12Yamamoto, K., Tanaka, K., and Murayama, M., “Comparison Study of Drag Prediction for the 4th CFD Drag Prediction Workshop using Structured and Unstructured Mesh Methods,” AIAA Paper 2010–4222, 28th AIAA Applied Aerodynamics Conference, June 2010.
13Koga, S., Kohzai, M., Ueno, M., Nakakita, K., and Sudani, N., “Analysis of NASA Common Research Model Dynamic Data in JAXA Wind Tunnel Tests,” Aiaa paper, Jan. 2013.
14Nakahashi, K., Ito, Y., and Togashi, F., “Some Challenges of Realistic Flow Simulations by Unstructured Grid CFD,” International Journal for Numerical Methods in Fluids, Vol. 43, No. 6–7, oct 2003, pp. 769–783.
15Obayashi, S. and Guruswamy, G., “Convergence Acceleration of an Aeroelastic Navier-Stokes Solver,” AIAA Journal , , No. 6, 1995, pp. 1134–1141.
16Sharov, D. and Nakahashi, K., “Reordering of Hybrid Unstructured Grids for Lower-Upper Symmetric Gauss-Seidel Computations,” AIAA Journal , , No. 3, 1998, pp. 484–486.
17Spalart, P. and Allmaras, S., “A One-Equation Turbulence Model for Aerodynamic Flows,” Tech. Rep. AIAA 92–0439, 30th Aerospace Sciences Meeting and Exhibit, Reno, NV, jan 6–9 1992.
18Spalart, P., “Strategies for turbulence modelling and simulations,” International Journal of Heat and Fluid Flow , Vol. 21, 2000, pp. 252–263.
19Braslow, A. L. and Knox, E. C., “Simplified Method for Determination of Critical Height of Distributed Roughness Particles for Boundary-Layer Transition at Mach Numbers from 0 to 5,” NACA Technocal Note 4363, Sept. 1958.
20Kohzai, M., Ueno, M., Koga, S., and Sudani, N., “Wall Interference Corrections of a NASA Common Research Model in JAXA Wind Tunnel Tests,” Aiaa paper, Jan. 2013.
21Raymer, D. P., Aircraft design: A conceptual approach, AIAA education series, American Institute of Aeronautics and Astronautics, Reston, Va., 3rd ed., 1999.
22NASA, Langley Research Center, “Common Research Model,” http://commonresearchmodel.larc.nasa.gov/.
14 of 28
American Institute of Aeronautics and Astronautics
Dow
nloa
ded
by N
ASA
Lan
gley
Res
earc
h C
tr o
n Fe
brua
ry 7
, 201
4 | h
ttp://
arc.
aiaa
.org
| D
OI:
10.
2514
/6.2
013-
493
A. Data Figures
A.A. Pressure Distribution on Each Wing Section
15 of 28
American Institute of Aeronautics and Astronautics
Dow
nloa
ded
by N
ASA
Lan
gley
Res
earc
h C
tr o
n Fe
brua
ry 7
, 201
4 | h
ttp://
arc.
aiaa
.org
| D
OI:
10.
2514
/6.2
013-
493

0 0.1 0.2 0.3 0.4 0.5 0.6 0.7 0.8 0.9 1
−1.2
−1
−0.8
−0.6
−0.4
−0.2
0
0.2
0.4
0.6
0.8
Upper Surface
Cp
0 0.1 0.2 0.3 0.4 0.5 0.6 0.7 0.8 0.9 1
−1.2
−1
−0.8
−0.6
−0.4
−0.2
0
0.2
0.4
0.6
0.8
Lower Surface
Cp
0 0.1 0.2 0.3 0.4 0.5 0.6 0.7 0.8 0.9 10.25
0.3
0.35
0.4
0.45
X [ND]
Y [
ND
]
A1A2
A3A5A6
A8A10
A11A13A15A16A17A19A20A21
A22
A23A24
A26
A28 A30A32
A34
Wing Section (η = −0.13059)
0 0.1 0.2 0.3 0.4 0.5 0.6 0.7 0.8 0.9 10.25
0.3
0.35
0.4
0.45
X [ND]
Y [
ND
]A1
A2A3
A5A6A8
A10A11
A13A15A16A17A19A20A21A22
A23A24
A26
A28 A30A32
A34
Wing Section (η = −0.13059)
JAXA (0 deg)JAXA (2 deg)JAXA (4 deg)CFD−TAS (0 deg)CFD−TAS (2 deg)CFD−TAS (4 deg)NTF (0 deg)NTF (2 deg)NTF (4 deg)
JAXA (0 deg)JAXA (2 deg)JAXA (4 deg)CFD−TAS (0 deg)CFD−TAS (2 deg)CFD−TAS (4 deg)NTF (0 deg)NTF (2 deg)NTF (4 deg)
(a) Without wing deformation correction.
0 0.1 0.2 0.3 0.4 0.5 0.6 0.7 0.8 0.9 1
−1.2
−1
−0.8
−0.6
−0.4
−0.2
0
0.2
0.4
0.6
0.8
Upper Surface
Cp
0 0.1 0.2 0.3 0.4 0.5 0.6 0.7 0.8 0.9 1
−1.2
−1
−0.8
−0.6
−0.4
−0.2
0
0.2
0.4
0.6
0.8
Lower Surface
Cp
0 0.1 0.2 0.3 0.4 0.5 0.6 0.7 0.8 0.9 10.25
0.3
0.35
0.4
0.45
X [ND]
Y [
ND
]
A1A2
A3A5A6
A8A10
A11A13A15A16A17A19A20A21
A22
A23A24
A26
A28 A30A32
A34
Wing Section (η = −0.13059)
0 0.1 0.2 0.3 0.4 0.5 0.6 0.7 0.8 0.9 10.25
0.3
0.35
0.4
0.45
X [ND]
Y [
ND
]
A1A2
A3A5A6
A8A10
A11A13A15A16A17A19A20A21
A22
A23A24
A26
A28 A30A32
A34
Wing Section (η = −0.13059)
JAXA (0 deg)JAXA (2 deg)JAXA (4 deg)CFD−TAS (0 deg)CFD−TAS (2 deg)CFD−TAS (4 deg)NTF (0 deg)NTF (2 deg)NTF (4 deg)
JAXA (0 deg)JAXA (2 deg)JAXA (4 deg)CFD−TAS (0 deg)CFD−TAS (2 deg)CFD−TAS (4 deg)NTF (0 deg)NTF (2 deg)NTF (4 deg)
(b) With wing deformation correction.
Figure 10. Pressure distribution at Section A.
16 of 28
American Institute of Aeronautics and Astronautics
Dow
nloa
ded
by N
ASA
Lan
gley
Res
earc
h C
tr o
n Fe
brua
ry 7
, 201
4 | h
ttp://
arc.
aiaa
.org
| D
OI:
10.
2514
/6.2
013-
493

0 0.1 0.2 0.3 0.4 0.5 0.6 0.7 0.8 0.9 1
−1.2
−1
−0.8
−0.6
−0.4
−0.2
0
0.2
0.4
0.6
0.8
Upper Surface
Cp
0 0.1 0.2 0.3 0.4 0.5 0.6 0.7 0.8 0.9 1
−1.2
−1
−0.8
−0.6
−0.4
−0.2
0
0.2
0.4
0.6
0.8
Lower Surface
Cp
0 0.1 0.2 0.3 0.4 0.5 0.6 0.7 0.8 0.9 10.35
0.4
0.45
0.5
X [ND]
Y [
ND
]
B1B2
B3B5
B6B8
B10B11B13B15B16B17
B19B20B21B22
B23B24
B26
B28 B30
B32
B34
Wing Section (η = −0.2009)
0 0.1 0.2 0.3 0.4 0.5 0.6 0.7 0.8 0.9 10.35
0.4
0.45
0.5
X [ND]
Y [
ND
]
B1B2
B3B5
B6B8
B10B11B13B15B16B17
B19B20B21B22
B23B24
B26
B28 B30
B32
B34
Wing Section (η = −0.2009)
JAXA (0 deg)JAXA (2 deg)JAXA (4 deg)CFD−TAS (0 deg)CFD−TAS (2 deg)CFD−TAS (4 deg)NTF (0 deg)NTF (2 deg)NTF (4 deg)
JAXA (0 deg)JAXA (2 deg)JAXA (4 deg)CFD−TAS (0 deg)CFD−TAS (2 deg)CFD−TAS (4 deg)NTF (0 deg)NTF (2 deg)NTF (4 deg)
(a) Without wing deformation correction.
0 0.1 0.2 0.3 0.4 0.5 0.6 0.7 0.8 0.9 1
−1.2
−1
−0.8
−0.6
−0.4
−0.2
0
0.2
0.4
0.6
0.8
Upper Surface
Cp
0 0.1 0.2 0.3 0.4 0.5 0.6 0.7 0.8 0.9 1
−1.2
−1
−0.8
−0.6
−0.4
−0.2
0
0.2
0.4
0.6
0.8
Lower Surface
Cp
0 0.1 0.2 0.3 0.4 0.5 0.6 0.7 0.8 0.9 10.35
0.4
0.45
0.5
X [ND]
Y [
ND
]
B1B2
B3B5
B6B8
B10B11B13B15B16B17
B19B20B21B22
B23B24
B26
B28 B30
B32
B34
Wing Section (η = −0.2009)
0 0.1 0.2 0.3 0.4 0.5 0.6 0.7 0.8 0.9 10.35
0.4
0.45
0.5
X [ND]
Y [
ND
]
B1B2
B3B5
B6B8
B10B11B13B15B16B17
B19B20B21B22
B23B24
B26
B28 B30
B32
B34
Wing Section (η = −0.2009)
JAXA (0 deg)JAXA (2 deg)JAXA (4 deg)CFD−TAS (0 deg)CFD−TAS (2 deg)CFD−TAS (4 deg)NTF (0 deg)NTF (2 deg)NTF (4 deg)
JAXA (0 deg)JAXA (2 deg)JAXA (4 deg)CFD−TAS (0 deg)CFD−TAS (2 deg)CFD−TAS (4 deg)NTF (0 deg)NTF (2 deg)NTF (4 deg)
(b) With wing deformation correction.
Figure 11. Pressure distribution at Section B.
17 of 28
American Institute of Aeronautics and Astronautics
Dow
nloa
ded
by N
ASA
Lan
gley
Res
earc
h C
tr o
n Fe
brua
ry 7
, 201
4 | h
ttp://
arc.
aiaa
.org
| D
OI:
10.
2514
/6.2
013-
493

0 0.1 0.2 0.3 0.4 0.5 0.6 0.7 0.8 0.9 1
−1.2
−1
−0.8
−0.6
−0.4
−0.2
0
0.2
0.4
0.6
0.8
Upper Surface
Cp
0 0.1 0.2 0.3 0.4 0.5 0.6 0.7 0.8 0.9 1
−1.2
−1
−0.8
−0.6
−0.4
−0.2
0
0.2
0.4
0.6
0.8
Lower Surface
Cp
0 0.1 0.2 0.3 0.4 0.5 0.6 0.7 0.8 0.9 10.4
0.45
0.5
0.55
0.6
X [ND]
Y [
ND
]
C1C2
C3C5C6
C8C10C11C13C15C16C17C19C20C21C22
C23C24
C26C28 C30
C32C34
Wing Section (η = −0.28281)
0 0.1 0.2 0.3 0.4 0.5 0.6 0.7 0.8 0.9 10.4
0.45
0.5
0.55
0.6
X [ND]
Y [
ND
]C1
C2C3
C5C6C8C10C11C13C15C16C17C19C20C21
C22C23
C24
C26C28 C30
C32C34
Wing Section (η = −0.28281)
JAXA (0 deg)JAXA (2 deg)JAXA (4 deg)CFD−TAS (0 deg)CFD−TAS (2 deg)CFD−TAS (4 deg)NTF (0 deg)NTF (2 deg)NTF (4 deg)
JAXA (0 deg)JAXA (2 deg)JAXA (4 deg)CFD−TAS (0 deg)CFD−TAS (2 deg)CFD−TAS (4 deg)NTF (0 deg)NTF (2 deg)NTF (4 deg)
(a) Without wing deformation correction.
0 0.1 0.2 0.3 0.4 0.5 0.6 0.7 0.8 0.9 1
−1.2
−1
−0.8
−0.6
−0.4
−0.2
0
0.2
0.4
0.6
0.8
Upper Surface
Cp
0 0.1 0.2 0.3 0.4 0.5 0.6 0.7 0.8 0.9 1
−1.2
−1
−0.8
−0.6
−0.4
−0.2
0
0.2
0.4
0.6
0.8
Lower Surface
Cp
0 0.1 0.2 0.3 0.4 0.5 0.6 0.7 0.8 0.9 10.4
0.45
0.5
0.55
0.6
X [ND]
Y [
ND
]
C1C2
C3C5C6
C8C10C11C13C15C16C17C19C20C21C22
C23C24
C26C28 C30
C32C34
Wing Section (η = −0.28281)
0 0.1 0.2 0.3 0.4 0.5 0.6 0.7 0.8 0.9 10.4
0.45
0.5
0.55
0.6
X [ND]
Y [
ND
]
C1C2
C3C5C6
C8C10C11C13C15C16C17C19C20C21C22
C23C24
C26C28 C30
C32C34
Wing Section (η = −0.28281)
JAXA (0 deg)JAXA (2 deg)JAXA (4 deg)CFD−TAS (0 deg)CFD−TAS (2 deg)CFD−TAS (4 deg)NTF (0 deg)NTF (2 deg)NTF (4 deg)
JAXA (0 deg)JAXA (2 deg)JAXA (4 deg)CFD−TAS (0 deg)CFD−TAS (2 deg)CFD−TAS (4 deg)NTF (0 deg)NTF (2 deg)NTF (4 deg)
(b) With wing deformation correction.
Figure 12. Pressure distribution at Section C.
18 of 28
American Institute of Aeronautics and Astronautics
Dow
nloa
ded
by N
ASA
Lan
gley
Res
earc
h C
tr o
n Fe
brua
ry 7
, 201
4 | h
ttp://
arc.
aiaa
.org
| D
OI:
10.
2514
/6.2
013-
493
0 0.1 0.2 0.3 0.4 0.5 0.6 0.7 0.8 0.9 1
−1.2
−1
−0.8
−0.6
−0.4
−0.2
0
0.2
0.4
0.6
0.8
Upper Surface
Cp
0 0.1 0.2 0.3 0.4 0.5 0.6 0.7 0.8 0.9 1
−1.2
−1
−0.8
−0.6
−0.4
−0.2
0
0.2
0.4
0.6
0.8
Lower Surface
Cp
0 0.1 0.2 0.3 0.4 0.5 0.6 0.7 0.8 0.9 10.6
0.62
0.64
0.66
0.68
0.7
0.72
X [ND]
Y [
ND
]
D1D2
D4
D6D8D9D10D11
D12D14
D15D16
D17
D18D19
D21 D22D23
D25D26D27
Wing Section (η = −0.39711)
0 0.1 0.2 0.3 0.4 0.5 0.6 0.7 0.8 0.9 10.6
0.62
0.64
0.66
0.68
0.7
0.72
X [ND]
Y [
ND
]D1
D2D4
D6D8D9D10D11
D12D14
D15D16
D17
D18D19
D21 D22D23
D25D26D27
Wing Section (η = −0.39711)
JAXA (0 deg)JAXA (2 deg)JAXA (4 deg)CFD−TAS (0 deg)CFD−TAS (2 deg)CFD−TAS (4 deg)NTF (0 deg)NTF (2 deg)NTF (4 deg)
JAXA (0 deg)JAXA (2 deg)JAXA (4 deg)CFD−TAS (0 deg)CFD−TAS (2 deg)CFD−TAS (4 deg)NTF (0 deg)NTF (2 deg)NTF (4 deg)
(a) Without wing deformation correction.
0 0.1 0.2 0.3 0.4 0.5 0.6 0.7 0.8 0.9 1
−1.2
−1
−0.8
−0.6
−0.4
−0.2
0
0.2
0.4
0.6
0.8
Upper Surface
Cp
0 0.1 0.2 0.3 0.4 0.5 0.6 0.7 0.8 0.9 1
−1.2
−1
−0.8
−0.6
−0.4
−0.2
0
0.2
0.4
0.6
0.8
Lower Surface
Cp
0 0.1 0.2 0.3 0.4 0.5 0.6 0.7 0.8 0.9 10.6
0.62
0.64
0.66
0.68
0.7
0.72
X [ND]
Y [
ND
]
D1D2
D4
D6D8D9D10D11
D12D14
D15D16
D17
D18D19
D21 D22D23
D25D26D27
Wing Section (η = −0.39711)
0 0.1 0.2 0.3 0.4 0.5 0.6 0.7 0.8 0.9 10.6
0.62
0.64
0.66
0.68
0.7
0.72
X [ND]
Y [
ND
]
D1D2
D4
D6D8D9D10D11
D12D14
D15D16
D17
D18D19
D21 D22D23
D25D26D27
Wing Section (η = −0.39711)
JAXA (0 deg)JAXA (2 deg)JAXA (4 deg)CFD−TAS (0 deg)CFD−TAS (2 deg)CFD−TAS (4 deg)NTF (0 deg)NTF (2 deg)NTF (4 deg)
JAXA (0 deg)JAXA (2 deg)JAXA (4 deg)CFD−TAS (0 deg)CFD−TAS (2 deg)CFD−TAS (4 deg)NTF (0 deg)NTF (2 deg)NTF (4 deg)
(b) With wing deformation correction.
Figure 13. Pressure distribution at Section D.
19 of 28
American Institute of Aeronautics and Astronautics
Dow
nloa
ded
by N
ASA
Lan
gley
Res
earc
h C
tr o
n Fe
brua
ry 7
, 201
4 | h
ttp://
arc.
aiaa
.org
| D
OI:
10.
2514
/6.2
013-
493

0 0.1 0.2 0.3 0.4 0.5 0.6 0.7 0.8 0.9 1
−1.2
−1
−0.8
−0.6
−0.4
−0.2
0
0.2
0.4
0.6
0.8
Upper Surface
Cp
0 0.1 0.2 0.3 0.4 0.5 0.6 0.7 0.8 0.9 1
−1.2
−1
−0.8
−0.6
−0.4
−0.2
0
0.2
0.4
0.6
0.8
Lower Surface
Cp
0 0.1 0.2 0.3 0.4 0.5 0.6 0.7 0.8 0.9 10.7
0.72
0.74
0.76
0.78
0.8
0.82
X [ND]
Y [
ND
] E1E2
E4
E6E8E9E10
E11E12
E14E15
E16E17
EL18EL19
EL20EL21 EL22 EL23
EL24
EL25
EL26EL27EL28
Wing Section (η = −0.5021)
0 0.1 0.2 0.3 0.4 0.5 0.6 0.7 0.8 0.9 10.7
0.72
0.74
0.76
0.78
0.8
0.82
X [ND]
Y [
ND
] E1E2
E4
E6E8E9E10
E11E12
E14E15
E16E17
EL18EL19
EL20EL21 EL22 EL23
EL24
EL25
EL26EL27EL28
Wing Section (η = −0.5021)
JAXA (0 deg)JAXA (2 deg)JAXA (4 deg)CFD−TAS (0 deg)CFD−TAS (2 deg)CFD−TAS (4 deg)NTF (0 deg)NTF (2 deg)NTF (4 deg)
JAXA (0 deg)JAXA (2 deg)JAXA (4 deg)CFD−TAS (0 deg)CFD−TAS (2 deg)CFD−TAS (4 deg)NTF (0 deg)NTF (2 deg)NTF (4 deg)
(a) Without wing deformation correction.
0 0.1 0.2 0.3 0.4 0.5 0.6 0.7 0.8 0.9 1
−1.2
−1
−0.8
−0.6
−0.4
−0.2
0
0.2
0.4
0.6
0.8
Upper Surface
Cp
0 0.1 0.2 0.3 0.4 0.5 0.6 0.7 0.8 0.9 1
−1.2
−1
−0.8
−0.6
−0.4
−0.2
0
0.2
0.4
0.6
0.8
Lower Surface
Cp
0 0.1 0.2 0.3 0.4 0.5 0.6 0.7 0.8 0.9 10.7
0.72
0.74
0.76
0.78
0.8
0.82
X [ND]
Y [
ND
] E1E2
E4
E6E8E9E10
E11E12
E14E15
E16E17
EL18EL19
EL20EL21 EL22 EL23
EL24
EL25
EL26EL27EL28
Wing Section (η = −0.5021)
0 0.1 0.2 0.3 0.4 0.5 0.6 0.7 0.8 0.9 10.7
0.72
0.74
0.76
0.78
0.8
0.82
X [ND]
Y [
ND
] E1E2
E4
E6E8E9E10
E11E12
E14E15
E16E17
EL18EL19
EL20EL21 EL22 EL23
EL24
EL25
EL26EL27EL28
Wing Section (η = −0.5021)
JAXA (0 deg)JAXA (2 deg)JAXA (4 deg)CFD−TAS (0 deg)CFD−TAS (2 deg)CFD−TAS (4 deg)NTF (0 deg)NTF (2 deg)NTF (4 deg)
JAXA (0 deg)JAXA (2 deg)JAXA (4 deg)CFD−TAS (0 deg)CFD−TAS (2 deg)CFD−TAS (4 deg)NTF (0 deg)NTF (2 deg)NTF (4 deg)
(b) With wing deformation correction.
Figure 14. Pressure distribution at Section E.
20 of 28
American Institute of Aeronautics and Astronautics
Dow
nloa
ded
by N
ASA
Lan
gley
Res
earc
h C
tr o
n Fe
brua
ry 7
, 201
4 | h
ttp://
arc.
aiaa
.org
| D
OI:
10.
2514
/6.2
013-
493

0 0.1 0.2 0.3 0.4 0.5 0.6 0.7 0.8 0.9 1
−1.2
−1
−0.8
−0.6
−0.4
−0.2
0
0.2
0.4
0.6
0.8
Upper Surface
Cp
0 0.1 0.2 0.3 0.4 0.5 0.6 0.7 0.8 0.9 1
−1.2
−1
−0.8
−0.6
−0.4
−0.2
0
0.2
0.4
0.6
0.8
Lower Surface
Cp
0 0.1 0.2 0.3 0.4 0.5 0.6 0.7 0.8 0.9 10.86
0.88
0.9
0.92
0.94
0.96
0.98
X [ND]
Y [
ND
]
F1F2
F4
F6F8F9F10F11
F12F14
F15F16
F17
F18F19
F20 F21 F22F23
F25F26 F27
Wing Section (η = −0.6028)
0 0.1 0.2 0.3 0.4 0.5 0.6 0.7 0.8 0.9 10.86
0.88
0.9
0.92
0.94
0.96
0.98
X [ND]
Y [
ND
]
F1F2
F4
F6F8F9F10F11
F12F14
F15F16
F17
F18F19
F20 F21 F22F23
F25F26 F27
Wing Section (η = −0.6028)
JAXA (0 deg)JAXA (2 deg)JAXA (4 deg)CFD−TAS (0 deg)CFD−TAS (2 deg)CFD−TAS (4 deg)NTF (0 deg)NTF (2 deg)NTF (4 deg)
JAXA (0 deg)JAXA (2 deg)JAXA (4 deg)CFD−TAS (0 deg)CFD−TAS (2 deg)CFD−TAS (4 deg)NTF (0 deg)NTF (2 deg)NTF (4 deg)
(a) Without wing deformation correction.
0 0.1 0.2 0.3 0.4 0.5 0.6 0.7 0.8 0.9 1
−1.2
−1
−0.8
−0.6
−0.4
−0.2
0
0.2
0.4
0.6
0.8
Upper Surface
Cp
0 0.1 0.2 0.3 0.4 0.5 0.6 0.7 0.8 0.9 1
−1.2
−1
−0.8
−0.6
−0.4
−0.2
0
0.2
0.4
0.6
0.8
Lower Surface
Cp
0 0.1 0.2 0.3 0.4 0.5 0.6 0.7 0.8 0.9 10.86
0.88
0.9
0.92
0.94
0.96
0.98
X [ND]
Y [
ND
]
F1F2
F4
F6F8F9F10F11
F12F14
F15F16
F17
F18F19
F20 F21 F22F23
F25F26 F27
Wing Section (η = −0.6028)
0 0.1 0.2 0.3 0.4 0.5 0.6 0.7 0.8 0.9 10.86
0.88
0.9
0.92
0.94
0.96
0.98
X [ND]
Y [
ND
]
F1F2
F4
F6F8F9F10F11
F12F14
F15F16
F17
F18F19
F20 F21 F22F23
F25F26 F27
Wing Section (η = −0.6028)
JAXA (0 deg)JAXA (2 deg)JAXA (4 deg)CFD−TAS (0 deg)CFD−TAS (2 deg)CFD−TAS (4 deg)NTF (0 deg)NTF (2 deg)NTF (4 deg)
JAXA (0 deg)JAXA (2 deg)JAXA (4 deg)CFD−TAS (0 deg)CFD−TAS (2 deg)CFD−TAS (4 deg)NTF (0 deg)NTF (2 deg)NTF (4 deg)
(b) With wing deformation correction.
Figure 15. Pressure distribution at Section F.
21 of 28
American Institute of Aeronautics and Astronautics
Dow
nloa
ded
by N
ASA
Lan
gley
Res
earc
h C
tr o
n Fe
brua
ry 7
, 201
4 | h
ttp://
arc.
aiaa
.org
| D
OI:
10.
2514
/6.2
013-
493

0 0.1 0.2 0.3 0.4 0.5 0.6 0.7 0.8 0.9 1
−1.2
−1
−0.8
−0.6
−0.4
−0.2
0
0.2
0.4
0.6
0.8
Upper Surface
Cp
0 0.1 0.2 0.3 0.4 0.5 0.6 0.7 0.8 0.9 1
−1.2
−1
−0.8
−0.6
−0.4
−0.2
0
0.2
0.4
0.6
0.8
Lower Surface
Cp
0 0.1 0.2 0.3 0.4 0.5 0.6 0.7 0.8 0.9 11.1
1.15
1.2
1.25
X [ND]
Y [
ND
]
G1G2G4
G6G8G9G10G11
G12G14
G15G16
G17
GL18GL19GL20 GL21 GL22 GL23GL24
GL25GL26
GL27GL28
Wing Section (η = −0.72681)
0 0.1 0.2 0.3 0.4 0.5 0.6 0.7 0.8 0.9 11.1
1.15
1.2
1.25
X [ND]
Y [
ND
]
G1G2G4
G6G8G9G10G11
G12G14
G15G16
G17
GL18GL19GL20 GL21 GL22 GL23GL24
GL25GL26
GL27GL28
Wing Section (η = −0.72681)
JAXA (0 deg)JAXA (2 deg)JAXA (4 deg)CFD−TAS (0 deg)CFD−TAS (2 deg)CFD−TAS (4 deg)NTF (0 deg)NTF (2 deg)NTF (4 deg)
JAXA (0 deg)JAXA (2 deg)JAXA (4 deg)CFD−TAS (0 deg)CFD−TAS (2 deg)CFD−TAS (4 deg)NTF (0 deg)NTF (2 deg)NTF (4 deg)
(a) Without wing deformation correction.
0 0.1 0.2 0.3 0.4 0.5 0.6 0.7 0.8 0.9 1
−1.2
−1
−0.8
−0.6
−0.4
−0.2
0
0.2
0.4
0.6
0.8
Upper Surface
Cp
0 0.1 0.2 0.3 0.4 0.5 0.6 0.7 0.8 0.9 1
−1.2
−1
−0.8
−0.6
−0.4
−0.2
0
0.2
0.4
0.6
0.8
Lower Surface
Cp
0 0.1 0.2 0.3 0.4 0.5 0.6 0.7 0.8 0.9 11.1
1.15
1.2
1.25
X [ND]
Y [
ND
]
G1G2G4
G6G8G9G10G11
G12G14
G15G16
G17
GL18GL19GL20 GL21 GL22 GL23GL24
GL25GL26
GL27GL28
Wing Section (η = −0.72681)
0 0.1 0.2 0.3 0.4 0.5 0.6 0.7 0.8 0.9 11.1
1.15
1.2
1.25
X [ND]
Y [
ND
]
G1G2G4
G6G8G9G10G11
G12G14
G15G16
G17
GL18GL19GL20 GL21 GL22 GL23GL24
GL25GL26
GL27GL28
Wing Section (η = −0.72681)
JAXA (0 deg)JAXA (2 deg)JAXA (4 deg)CFD−TAS (0 deg)CFD−TAS (2 deg)CFD−TAS (4 deg)NTF (0 deg)NTF (2 deg)NTF (4 deg)
JAXA (0 deg)JAXA (2 deg)JAXA (4 deg)CFD−TAS (0 deg)CFD−TAS (2 deg)CFD−TAS (4 deg)NTF (0 deg)NTF (2 deg)NTF (4 deg)
(b) With wing deformation correction.
Figure 16. Pressure distribution at Section G.
22 of 28
American Institute of Aeronautics and Astronautics
Dow
nloa
ded
by N
ASA
Lan
gley
Res
earc
h C
tr o
n Fe
brua
ry 7
, 201
4 | h
ttp://
arc.
aiaa
.org
| D
OI:
10.
2514
/6.2
013-
493

0 0.1 0.2 0.3 0.4 0.5 0.6 0.7 0.8 0.9 1
−1.2
−1
−0.8
−0.6
−0.4
−0.2
0
0.2
0.4
0.6
0.8
Upper Surface
Cp
0 0.1 0.2 0.3 0.4 0.5 0.6 0.7 0.8 0.9 1
−1.2
−1
−0.8
−0.6
−0.4
−0.2
0
0.2
0.4
0.6
0.8
Lower Surface
Cp
0 0.1 0.2 0.3 0.4 0.5 0.6 0.7 0.8 0.9 11.5
1.55
1.6
1.65
X [ND]
Y [
ND
]
H1H2H4
H6H8H9H10
H11H12
H14H15
H16H17
H18H19 H20 H21
H22H23
H25H26H27
Wing Section (η = −0.8456)
0 0.1 0.2 0.3 0.4 0.5 0.6 0.7 0.8 0.9 11.5
1.55
1.6
1.65
X [ND]
Y [
ND
]
H1H2H4
H6H8H9H10
H11H12
H14H15
H16H17
H18H19 H20 H21
H22H23
H25H26H27
Wing Section (η = −0.8456)
JAXA (0 deg)JAXA (2 deg)JAXA (4 deg)CFD−TAS (0 deg)CFD−TAS (2 deg)CFD−TAS (4 deg)NTF (0 deg)NTF (2 deg)NTF (4 deg)
JAXA (0 deg)JAXA (2 deg)JAXA (4 deg)CFD−TAS (0 deg)CFD−TAS (2 deg)CFD−TAS (4 deg)NTF (0 deg)NTF (2 deg)NTF (4 deg)
(a) Without wing deformation correction.
0 0.1 0.2 0.3 0.4 0.5 0.6 0.7 0.8 0.9 1
−1.2
−1
−0.8
−0.6
−0.4
−0.2
0
0.2
0.4
0.6
0.8
Upper Surface
Cp
0 0.1 0.2 0.3 0.4 0.5 0.6 0.7 0.8 0.9 1
−1.2
−1
−0.8
−0.6
−0.4
−0.2
0
0.2
0.4
0.6
0.8
Lower Surface
Cp
0 0.1 0.2 0.3 0.4 0.5 0.6 0.7 0.8 0.9 11.5
1.55
1.6
1.65
X [ND]
Y [
ND
]
H1H2H4
H6H8H9H10
H11H12
H14H15
H16H17
H18H19 H20 H21
H22H23
H25H26H27
Wing Section (η = −0.8456)
0 0.1 0.2 0.3 0.4 0.5 0.6 0.7 0.8 0.9 11.5
1.55
1.6
1.65
X [ND]
Y [
ND
]
H1H2H4
H6H8H9H10
H11H12
H14H15
H16H17
H18H19 H20 H21
H22H23
H25H26H27
Wing Section (η = −0.8456)
JAXA (0 deg)JAXA (2 deg)JAXA (4 deg)CFD−TAS (0 deg)CFD−TAS (2 deg)CFD−TAS (4 deg)NTF (0 deg)NTF (2 deg)NTF (4 deg)
JAXA (0 deg)JAXA (2 deg)JAXA (4 deg)CFD−TAS (0 deg)CFD−TAS (2 deg)CFD−TAS (4 deg)NTF (0 deg)NTF (2 deg)NTF (4 deg)
(b) With wing deformation correction.
Figure 17. Pressure distribution at Section H.
23 of 28
American Institute of Aeronautics and Astronautics
Dow
nloa
ded
by N
ASA
Lan
gley
Res
earc
h C
tr o
n Fe
brua
ry 7
, 201
4 | h
ttp://
arc.
aiaa
.org
| D
OI:
10.
2514
/6.2
013-
493
0 0.1 0.2 0.3 0.4 0.5 0.6 0.7 0.8 0.9 1
−1.2
−1
−0.8
−0.6
−0.4
−0.2
0
0.2
0.4
0.6
0.8
Upper Surface
Cp
0 0.1 0.2 0.3 0.4 0.5 0.6 0.7 0.8 0.9 1
−1.2
−1
−0.8
−0.6
−0.4
−0.2
0
0.2
0.4
0.6
0.8
Lower Surface
Cp
0 0.1 0.2 0.3 0.4 0.5 0.6 0.7 0.8 0.9 12.05
2.1
2.15
2.2
X [ND]
Y [
ND
] I1I2I4
I6I8I9I10
I11
I12I14
I15I16I17
I18I19 I20 I21
I22
I23
I25I26 I27
Wing Section (η = −0.95)
0 0.1 0.2 0.3 0.4 0.5 0.6 0.7 0.8 0.9 12.05
2.1
2.15
2.2
X [ND]
Y [
ND
] I1I2I4
I6I8I9I10
I11
I12I14
I15I16I17
I18I19 I20 I21
I22
I23
I25I26 I27
Wing Section (η = −0.95)
JAXA (0 deg)JAXA (2 deg)JAXA (4 deg)CFD−TAS (0 deg)CFD−TAS (2 deg)CFD−TAS (4 deg)NTF (0 deg)NTF (2 deg)NTF (4 deg)
JAXA (0 deg)JAXA (2 deg)JAXA (4 deg)CFD−TAS (0 deg)CFD−TAS (2 deg)CFD−TAS (4 deg)NTF (0 deg)NTF (2 deg)NTF (4 deg)
(a) Without wing deformation correction.
0 0.1 0.2 0.3 0.4 0.5 0.6 0.7 0.8 0.9 1
−1.2
−1
−0.8
−0.6
−0.4
−0.2
0
0.2
0.4
0.6
0.8
Upper Surface
Cp
0 0.1 0.2 0.3 0.4 0.5 0.6 0.7 0.8 0.9 1
−1.2
−1
−0.8
−0.6
−0.4
−0.2
0
0.2
0.4
0.6
0.8
Lower Surface
Cp
0 0.1 0.2 0.3 0.4 0.5 0.6 0.7 0.8 0.9 12.05
2.1
2.15
2.2
X [ND]
Y [
ND
] I1I2I4
I6I8I9I10
I11
I12I14
I15I16I17
I18I19 I20 I21
I22
I23
I25I26 I27
Wing Section (η = −0.95)
0 0.1 0.2 0.3 0.4 0.5 0.6 0.7 0.8 0.9 12.05
2.1
2.15
2.2
X [ND]
Y [
ND
] I1I2I4
I6I8I9I10
I11
I12I14
I15I16I17
I18I19 I20 I21
I22
I23
I25I26 I27
Wing Section (η = −0.95)
JAXA (0 deg)JAXA (2 deg)JAXA (4 deg)CFD−TAS (0 deg)CFD−TAS (2 deg)CFD−TAS (4 deg)NTF (0 deg)NTF (2 deg)NTF (4 deg)
JAXA (0 deg)JAXA (2 deg)JAXA (4 deg)CFD−TAS (0 deg)CFD−TAS (2 deg)CFD−TAS (4 deg)NTF (0 deg)NTF (2 deg)NTF (4 deg)
(b) With wing deformation correction.
Figure 18. Pressure distribution at Section I.
24 of 28
American Institute of Aeronautics and Astronautics
Dow
nloa
ded
by N
ASA
Lan
gley
Res
earc
h C
tr o
n Fe
brua
ry 7
, 201
4 | h
ttp://
arc.
aiaa
.org
| D
OI:
10.
2514
/6.2
013-
493

A.B. Lift Distribution
0 0.1 0.2 0.3 0.4 0.5 0.6 0.7 0.8 0.9 1−0.1
0
0.1
0.2
0.3
0.4
0.5
0.6
0.7
0.8
0.9
η
Sect
ion
CL
Section CL distribution
JTWT (0 deg)JTWT (2 deg)JTWT (4 deg)cfd (0 deg)cfd (2 deg)cfd (4 deg)NTF (0 deg)NTF (2 deg)NTF (4 deg)
(a) Without wing deformation correction.
0 0.1 0.2 0.3 0.4 0.5 0.6 0.7 0.8 0.9 10
0.1
0.2
0.3
0.4
0.5
0.6
0.7
0.8
0.9
1
η
Sect
ion
CL
Section CL distribution
JTWT (0 deg)JTWT (2 deg)JTWT (4 deg)cfd (0 deg)cfd (2 deg)cfd (4 deg)NTF (0 deg)NTF (2 deg)NTF (4 deg)
(b) With wing deformation correction.
Figure 19. Lift distribution on the main wing including JTWT, CFD and NTF data.
25 of 28
American Institute of Aeronautics and Astronautics
Dow
nloa
ded
by N
ASA
Lan
gley
Res
earc
h C
tr o
n Fe
brua
ry 7
, 201
4 | h
ttp://
arc.
aiaa
.org
| D
OI:
10.
2514
/6.2
013-
493

A.C. Force Coefficients
A.C.1. CL
0 0.5 1 1.5 2 2.5 3 3.5 4 4.5 50.1
0.2
0.3
0.4
0.5
0.6
0.7
0.8
α [deg]
CL
Uncorrected at all
CFDJTWTNTF
(a) Neither with Reynolds number nor wing deformation correction.
0 0.5 1 1.5 2 2.5 3 3.5 4 4.5 50.1
0.2
0.3
0.4
0.5
0.6
0.7
0.8
α [deg]
CL
Uncorrected for wing deformation
CFDJTWTNTF
(b) With Reynolds number correction but not with wing deformation correction.
0 0.5 1 1.5 2 2.5 3 3.5 4 4.5 50.1
0.2
0.3
0.4
0.5
0.6
0.7
0.8
α [deg]
CL
Corrected for wing deformation
CFDJTWTNTF
(c) With Reynolds number and wing deformation correction.
Figure 20. CL vs α.
26 of 28
American Institute of Aeronautics and Astronautics
Dow
nloa
ded
by N
ASA
Lan
gley
Res
earc
h C
tr o
n Fe
brua
ry 7
, 201
4 | h
ttp://
arc.
aiaa
.org
| D
OI:
10.
2514
/6.2
013-
493

A.C.2. CD
0 0.5 1 1.5 2 2.5 3 3.5 4 4.5 50.015
0.02
0.025
0.03
0.035
0.04
0.045
0.05
0.055
0.06
0.065
α [deg]
CD
Uncorrected at all
CFDJTWTNTF
(a) Neither with Reynolds number nor wing deformation correction.
0 0.5 1 1.5 2 2.5 3 3.5 4 4.5 50.015
0.02
0.025
0.03
0.035
0.04
0.045
0.05
0.055
0.06
0.065
α [deg]
CD
Uncorrected for wing deformation
CFDJTWTNTF
(b) With Reynolds number correction but not with wing deformation correction.
0 0.5 1 1.5 2 2.5 3 3.5 4 4.5 50.01
0.02
0.03
0.04
0.05
0.06
0.07
α [deg]
CD
Corrected for wing deformation
CFDJTWTNTF
(c) With Reynolds number and wing deformation correction.
Figure 21. CD vs α.
27 of 28
American Institute of Aeronautics and Astronautics
Dow
nloa
ded
by N
ASA
Lan
gley
Res
earc
h C
tr o
n Fe
brua
ry 7
, 201
4 | h
ttp://
arc.
aiaa
.org
| D
OI:
10.
2514
/6.2
013-
493

A.C.3. Drag Polar
0.015 0.02 0.025 0.03 0.035 0.04 0.045 0.05 0.055 0.06 0.0650.1
0.2
0.3
0.4
0.5
0.6
0.7
0.8
CD
CL
Not corrected at all
CFDJTWTNTF
(a) Neither with Reynolds number nor wing deformation correction.
0.015 0.02 0.025 0.03 0.035 0.04 0.045 0.05 0.055 0.06 0.0650.1
0.2
0.3
0.4
0.5
0.6
0.7
0.8
CD
CL
Uncorrected for wing deformation
CFDJTWTNTF
(b) With Reynolds number correction but not with wing deformation correction.
0.01 0.02 0.03 0.04 0.05 0.06 0.070.1
0.2
0.3
0.4
0.5
0.6
0.7
0.8
CD
CL
Corrected for wing deformation
CFDJTWTNTF
(c) With Reynolds number and wing deformation correction.
Figure 22. CL vs CD .
28 of 28
American Institute of Aeronautics and Astronautics
Dow
nloa
ded
by N
ASA
Lan
gley
Res
earc
h C
tr o
n Fe
brua
ry 7
, 201
4 | h
ttp://
arc.
aiaa
.org
| D
OI:
10.
2514
/6.2
013-
493