nasa ksc internship final report · major: chemical engineering major: chemistry lava integration...
TRANSCRIPT
NASA KSC – Internship Final Report
NASA Kennedy Space Center Page | 1 4/9/2014
Test and Recommendation of Flight-Forward Resistive Temperature Detector for Resource Prospector Mission
Jesse Hinricher NASA Kennedy Space Center Major: Chemical Engineering
Major: Chemistry LAVA Integration and Testing Spring Session
Date: 04 / 09 / 2014
https://ntrs.nasa.gov/search.jsp?R=20140007528 2018-05-30T06:06:01+00:00Z
NASA KSC – Internship Final Report
NASA Kennedy Space Center Page | 2 4/9/2014
Test and Recommendation of Flight-Forward Resistive Temperature Detector for Resource Prospector Mission
Jesse Hinricher1 South Dakota School of Mines and Technology, Rapid City, SD 57701
The Resource Prospector Mission (RPM) is an in-situ resource utilization (ISRU) technology demonstration mission planned to launch in 2018. The mission will use the Regolith and Environment Science & Oxygen and Lunar Volatile Extraction (RESOLVE) Payload to prospect for lunar volatiles such as water, oxygen, and carbon dioxide. These compounds will validate ISRU capability. The payload, particularly the Lunar
Advanced Volatile Analysis (LAVA) subsystem, requires numerous temperature measurements to accurately control on-board heaters that keep the volatiles in the vapor phase to allow quantification and prevent the
clogging of delivery lines.
Previous spaceflight missions have proven that Resistive Temperature Detector (RTD) failure impedes mission success. The research resulted in a recommendation for a flight-forward RTD. The recommendation
was based on accuracy, consistency, and ease of installation of RTDs procured from IST, QTI, and Honeywell.
Nomenclature
A = 3.9083 E-3 °C-1 B = -5.775 E-7 °C-2 C = -4.183 E-12 °C-4 R(t) ≡ Resistance at a temperature, t, in ohms R(0) ≡ Resistance at 0°C = 1000 Ω for each RTD tested t ≡ Temperature, in °C
°C Degrees Celsius Ω Ohm(s) ETU Engineering Test Unit GC-MS Gas Chromatograph – Mass Spectrometer ISRU In-Situ Resource Utilization IST Innovative Sensor Technology LAVA Lunar Advanced Volatile Analysis NIRVSS Near Infrared Volatile Spectrometer Subsystem NSS Neutron Spectrometer System OVEN Oxygen Volatile Extraction Node PI Proportional – Integral QTI Quality Thermistor, Inc. RESOLVE Regolith and Environment Science & Oxygen and Lunar Volatile Analysis RPM Resource Prospector Mission RTD Resistive Temperature Detector RTV Room Temperature Vulcanizing SATS Sample Acquisition and Transfer System TC Thermocouple
NASA KSC – Internship Final Report
NASA Kennedy Space Center Page | 3 4/9/2014
TEC Thermal-Electric Cooler WDD Water Droplet Demonstration
I. Introduction
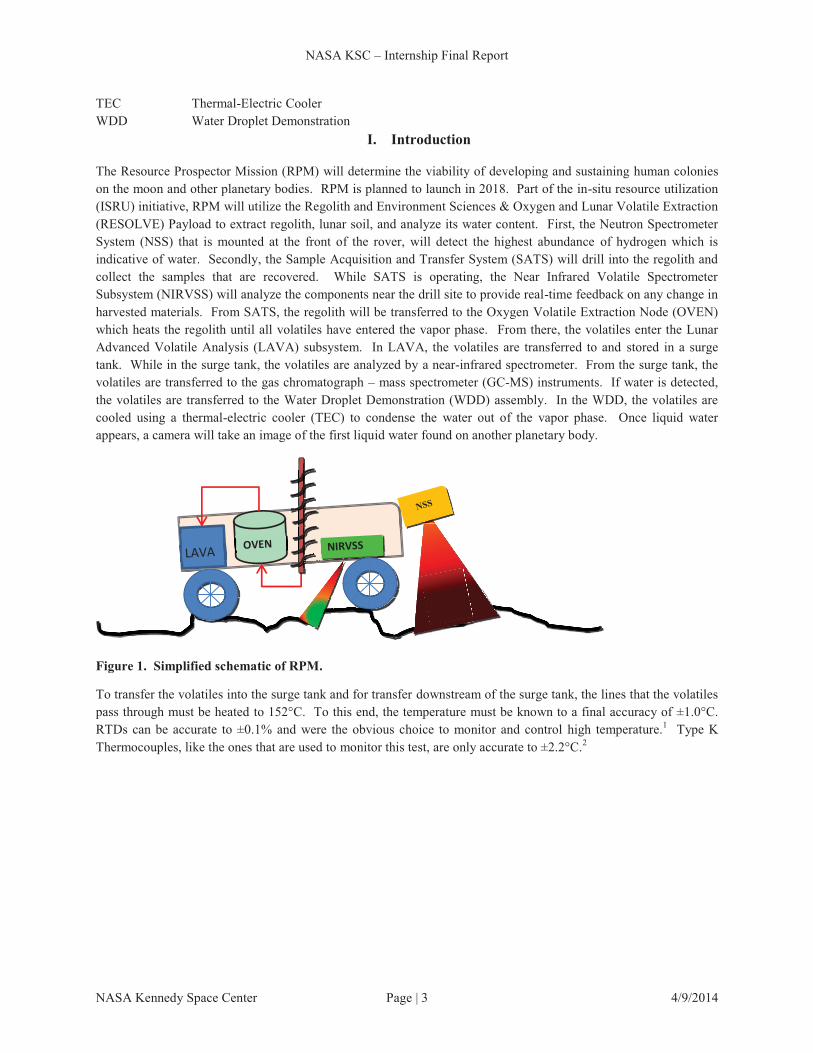
The Resource Prospector Mission (RPM) will determine the viability of developing and sustaining human colonies on the moon and other planetary bodies. RPM is planned to launch in 2018. Part of the in-situ resource utilization (ISRU) initiative, RPM will utilize the Regolith and Environment Sciences & Oxygen and Lunar Volatile Extraction (RESOLVE) Payload to extract regolith, lunar soil, and analyze its water content. First, the Neutron Spectrometer System (NSS) that is mounted at the front of the rover, will detect the highest abundance of hydrogen which is indicative of water. Secondly, the Sample Acquisition and Transfer System (SATS) will drill into the regolith and collect the samples that are recovered. While SATS is operating, the Near Infrared Volatile Spectrometer Subsystem (NIRVSS) will analyze the components near the drill site to provide real-time feedback on any change in harvested materials. From SATS, the regolith will be transferred to the Oxygen Volatile Extraction Node (OVEN) which heats the regolith until all volatiles have entered the vapor phase. From there, the volatiles enter the Lunar Advanced Volatile Analysis (LAVA) subsystem. In LAVA, the volatiles are transferred to and stored in a surge tank. While in the surge tank, the volatiles are analyzed by a near-infrared spectrometer. From the surge tank, the volatiles are transferred to the gas chromatograph – mass spectrometer (GC-MS) instruments. If water is detected, the volatiles are transferred to the Water Droplet Demonstration (WDD) assembly. In the WDD, the volatiles are cooled using a thermal-electric cooler (TEC) to condense the water out of the vapor phase. Once liquid water appears, a camera will take an image of the first liquid water found on another planetary body.
Figure 1. Simplified schematic of RPM.
To transfer the volatiles into the surge tank and for transfer downstream of the surge tank, the lines that the volatiles pass through must be heated to 152°C. To this end, the temperature must be known to a final accuracy of ±1.0°C. RTDs can be accurate to ±0.1% and were the obvious choice to monitor and control high temperature.1 Type K Thermocouples, like the ones that are used to monitor this test, are only accurate to ±2.2°C.2
NASA KSC – Internship Final Report
NASA Kennedy Space Center Page | 4 4/9/2014
RTDs relate resistance to temperature by the Callendar – Van Dusen Equation3:
For temperatures above 0°C:
R(t) = R(0) (1 + A*t + B*t2) Eq. 1
For temperatures below 0°C:
R(t) = R(0) [1 + A*t + B*t2 + (t – 100)*C*t3] Eq. 2
Where: R(t) ≡ Resistance at a temperature, t, in ohms R(0) ≡ Resistance at 0°C = 1000 Ω for each RTD tested t ≡ Temperature, in °C A = 3.9083 E-3 °C-1 B = -5.775 E-7 °C-2 C = -4.183 E-12 °C-4
Using Eq. 1 above, the temperature, t, can be calculated using the measured resistance, R(t) which was done using the computer software LabVIEW.
II. Experimental
The RTDs were evaluated on their accuracy, consistency, and ease of installation. Accuracy was defined for this test as the ability of the RTD to read as close to the true temperature as possible. This was determined by comparing the RTDs to each other, the PI Setpoint, and in the case of each manifold, the calibrated thermocouple reading. Consistency was defined as the ability of the RTD to maintain an accurate temperature reading for 20 minutes. The ease of installation was defined as the ability of the RTD to be installed easily and quickly using as little adhesive as possible.
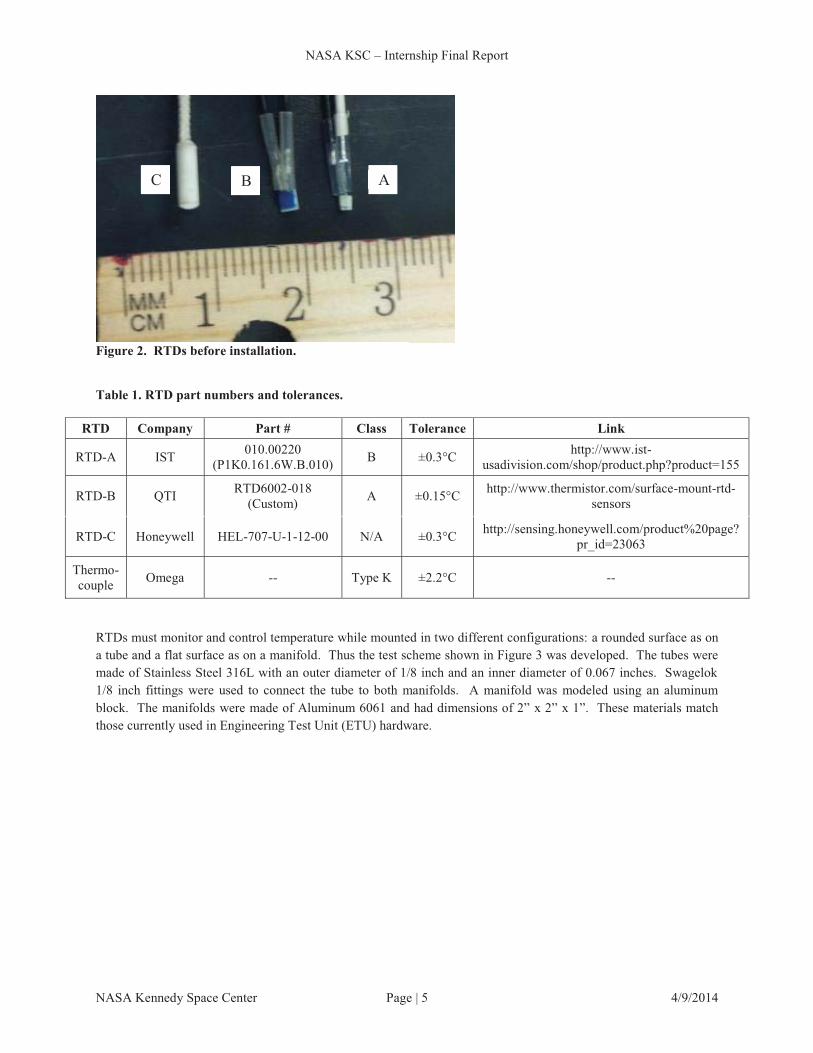
The RTDs under examination can be seen in Figure 2 and part numbers are given in Table 1. RTD-A is made by Innovative Sensor Technology (IST); RTD-B is made by Quality Thermistor, Inc. (QTI); RTD-C is made by Honeywell. Each RTD used a 1000Ω platinum resistor. The 1000Ω RTD was selected because the change in resistance for 1000Ω was larger, and therefore easier to detect, than the change in resistance for a 100Ω RTD for the same change in temperature. For every 1°C change, the 1000Ω RTD changed 3.5Ω, whereas the 100Ω RTD changed only 0.5Ω. Any larger resistances than 1000Ω would decrease the current flow to barely detectable limits using 28 volts, as was used for this study.
RTD-A is Class B and has a tolerance of ±0.3°C; RTD-B is Class A and has a tolerance of ±0.15°C.1 RTD-C was not designated to any class and had a tolerance of ±0.3°C.4 Type K Thermocouples are accurate to ±2.2°C.2 This information is shown in Table 1.
NASA KSC – Internship Final Report
NASA Kennedy Space Center Page | 5 4/9/2014
Table 1. RTD part numbers and tolerances.
RTDs must monitor and control temperature while mounted in two different configurations: a rounded surface as on a tube and a flat surface as on a manifold. Thus the test scheme shown in Figure 3 was developed. The tubes were made of Stainless Steel 316L with an outer diameter of 1/8 inch and an inner diameter of 0.067 inches. Swagelok 1/8 inch fittings were used to connect the tube to both manifolds. A manifold was modeled using an aluminum block. The manifolds were made of Aluminum 6061 and had dimensions of 2” x 2” x 1”. These materials match those currently used in Engineering Test Unit (ETU) hardware.
RTD Company Part # Class Tolerance Link
RTD-A IST 010.00220 (P1K0.161.6W.B.010) B ±0.3°C http://www.ist-
usadivision.com/shop/product.php?product=155
RTD-B QTI RTD6002-018 (Custom) A ±0.15°C http://www.thermistor.com/surface-mount-rtd-
sensors
RTD-C Honeywell HEL-707-U-1-12-00 N/A ±0.3°C http://sensing.honeywell.com/product%20page?pr_id=23063
Thermo-couple Omega -- Type K ±2.2°C --
Figure 2. RTDs before installation.
A B C

NASA KSC – Internship Final Report
NASA Kennedy Space Center Page | 6 4/9/2014
Figure 3. Test scheme with Tube #1 installed.
Tube #1 can be interchanged with Tube #2 and Tube #3 on which two of each RTD-A, RTD-B, and RTD-C are mounted respectively. Each tube was 6 inches long and the RTDs were mounted 2 inches from either end (shown in Figure 4Figure 3). The tube length, 6 inches, was chosen so that two RTDs would easily fit on one tube while the tube remained small enough to be easily interchanged between the manifolds. Each RTD was mounted on the same surface of each manifold (shown in Figure 5).
The thermocouple (TC) was used to check the validity of the RTD readings. This was done by reading the thermocouple using a Calibrated Thermocouple Reader. See Appendix 1.2 for calibration information. This was verified by comparing LabVIEW’s thermocouple reading to the calibrated thermocouple reading. These results in Table 2 show that the LabVIEW reading was extremely close to the calibrated thermocouple reading, meaning the LabVIEW reading was accurate for the thermocouples. There was no absolute standard for comparison on any of the tubes, instead they were judged on how close both RTDs were to each other and to the PI Setpoint.
Table 2. Thermocouple data compared to LabVIEW data.
Thermocouple LabVIEW Reading (°C) Calibrated Reading (°C) Δ 1 25.22 25.2 0.02 1 30.69 30.4 0.29 1 50.47 50.4 0.07 1 76.08 76.0 0.08 1 152.18 152.0 0.18 2 31.65 31.5 0.15 2 76.02 76.0 0.02 2 153.15 153.2 -0.05
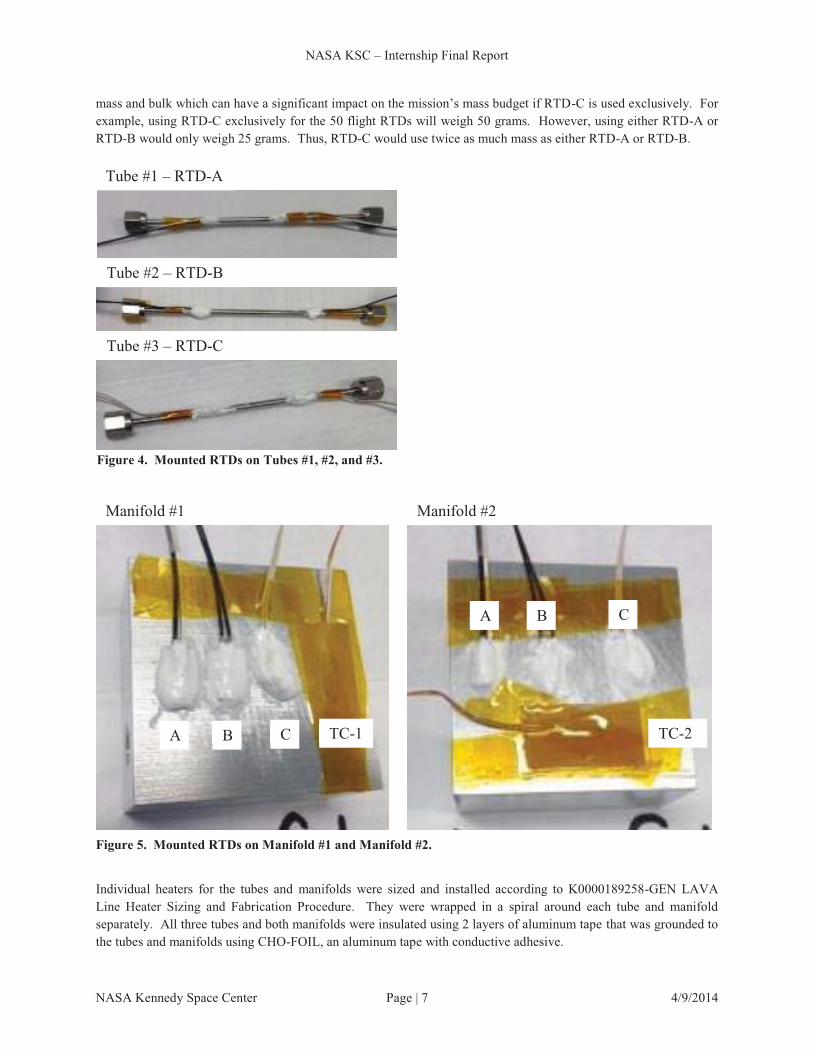
RTD-A and RTD-B mounted easily using 0.50 grams per two RTDs of CV-2946, a room temperature vulcanizing (RTV) adhesive with good thermal conductivity and minimal off gassing5. All of the RTV was used to install both RTD-A and RTD-B. The RTV was cured at 65°C for 2 hours. However, RTD-C was relatively bulky and therefore needed 1.00 gram of RTV per two RTDs to properly adhere to both surfaces (see Figure 4 and Figure 5). This adds
Manifold #1 Manifold #2
Tube #1
NASA KSC – Internship Final Report
NASA Kennedy Space Center Page | 7 4/9/2014
mass and bulk which can have a significant impact on the mission’s mass budget if RTD-C is used exclusively. For example, using RTD-C exclusively for the 50 flight RTDs will weigh 50 grams. However, using either RTD-A or RTD-B would only weigh 25 grams. Thus, RTD-C would use twice as much mass as either RTD-A or RTD-B.
Individual heaters for the tubes and manifolds were sized and installed according to K0000189258-GEN LAVA Line Heater Sizing and Fabrication Procedure. They were wrapped in a spiral around each tube and manifold separately. All three tubes and both manifolds were insulated using 2 layers of aluminum tape that was grounded to the tubes and manifolds using CHO-FOIL, an aluminum tape with conductive adhesive.
Tube #2 – RTD-B
Tube #1 – RTD-A
Tube #3 – RTD-C
Figure 4. Mounted RTDs on Tubes #1, #2, and #3.
Manifold #1 Manifold #2
Figure 5. Mounted RTDs on Manifold #1 and Manifold #2.
A B C TC-1
A B C
TC-2
NASA KSC – Internship Final Report
NASA Kennedy Space Center Page | 8 4/9/2014
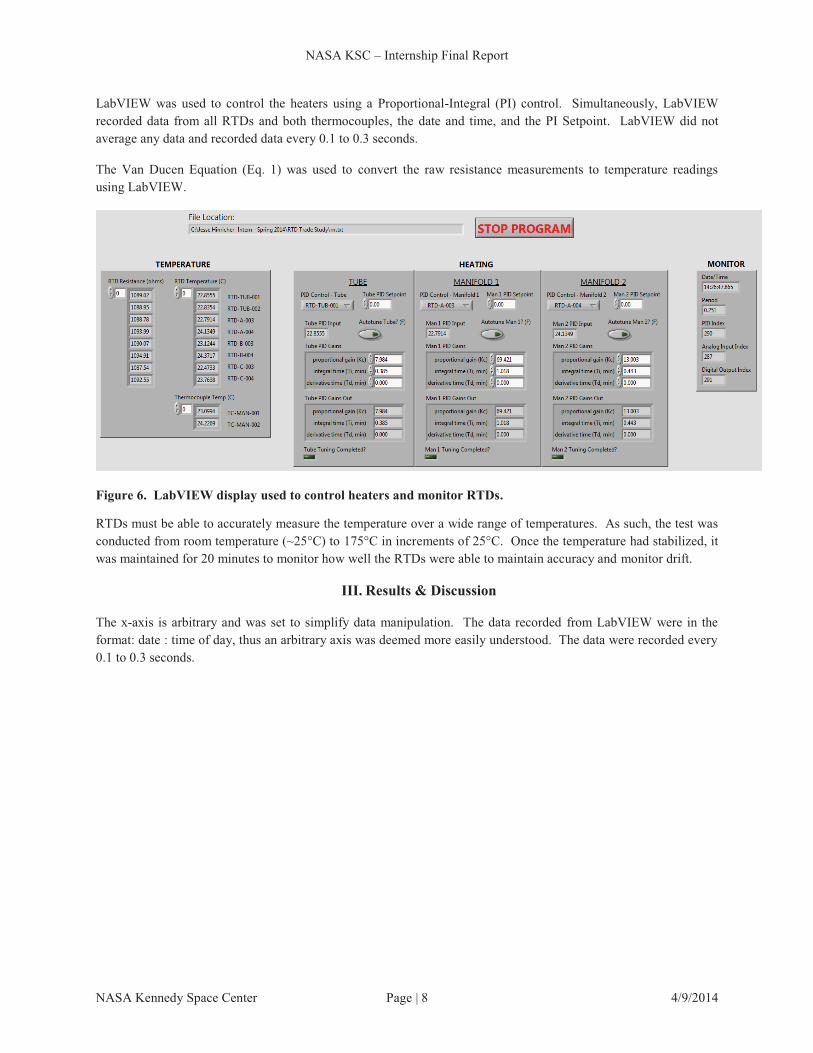
LabVIEW was used to control the heaters using a Proportional-Integral (PI) control. Simultaneously, LabVIEW recorded data from all RTDs and both thermocouples, the date and time, and the PI Setpoint. LabVIEW did not average any data and recorded data every 0.1 to 0.3 seconds.
The Van Ducen Equation (Eq. 1) was used to convert the raw resistance measurements to temperature readings using LabVIEW.
Figure 6. LabVIEW display used to control heaters and monitor RTDs.
RTDs must be able to accurately measure the temperature over a wide range of temperatures. As such, the test was conducted from room temperature (~25°C) to 175°C in increments of 25°C. Once the temperature had stabilized, it was maintained for 20 minutes to monitor how well the RTDs were able to maintain accuracy and monitor drift.
III. Results & Discussion
The x-axis is arbitrary and was set to simplify data manipulation. The data recorded from LabVIEW were in the format: date : time of day, thus an arbitrary axis was deemed more easily understood. The data were recorded every 0.1 to 0.3 seconds.
NASA KSC – Internship Final Report
NASA Kennedy Space Center Page | 9 4/9/2014
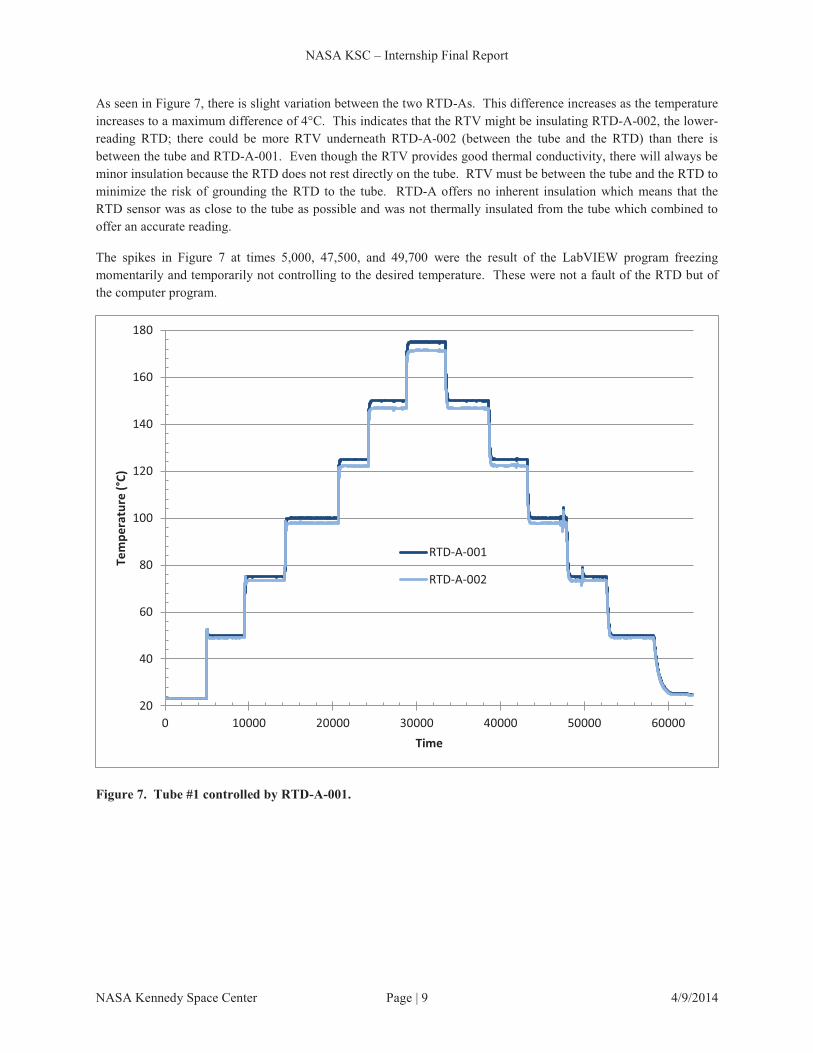
As seen in Figure 7, there is slight variation between the two RTD-As. This difference increases as the temperature increases to a maximum difference of 4°C. This indicates that the RTV might be insulating RTD-A-002, the lower-reading RTD; there could be more RTV underneath RTD-A-002 (between the tube and the RTD) than there is between the tube and RTD-A-001. Even though the RTV provides good thermal conductivity, there will always be minor insulation because the RTD does not rest directly on the tube. RTV must be between the tube and the RTD to minimize the risk of grounding the RTD to the tube. RTD-A offers no inherent insulation which means that the RTD sensor was as close to the tube as possible and was not thermally insulated from the tube which combined to offer an accurate reading.
The spikes in Figure 7 at times 5,000, 47,500, and 49,700 were the result of the LabVIEW program freezing momentarily and temporarily not controlling to the desired temperature. These were not a fault of the RTD but of the computer program.
Figure 7. Tube #1 controlled by RTD-A-001.
20
40
60
80
100
120
140
160
180
0 10000 20000 30000 40000 50000 60000
Tem
pera
ture
(°C)
Time
RTD-A-001
RTD-A-002
NASA KSC – Internship Final Report
NASA Kennedy Space Center Page | 10 4/9/2014
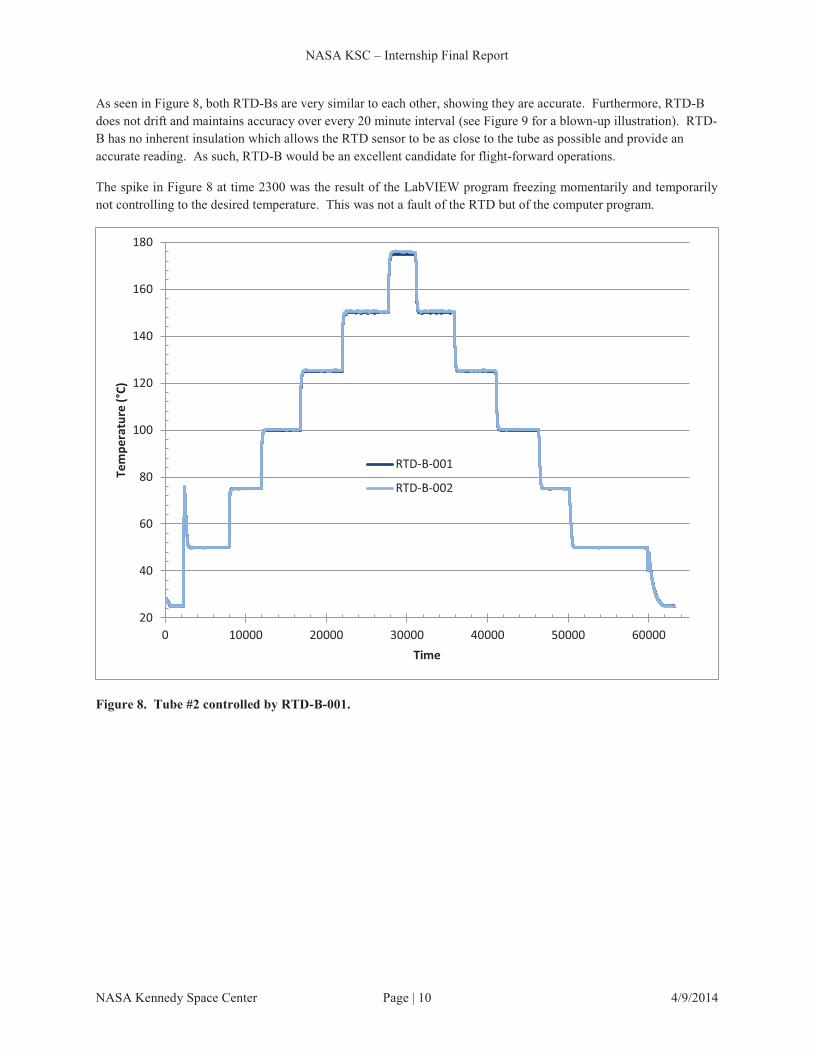
As seen in Figure 8, both RTD-Bs are very similar to each other, showing they are accurate. Furthermore, RTD-B does not drift and maintains accuracy over every 20 minute interval (see Figure 9 for a blown-up illustration). RTD-B has no inherent insulation which allows the RTD sensor to be as close to the tube as possible and provide an accurate reading. As such, RTD-B would be an excellent candidate for flight-forward operations.
The spike in Figure 8 at time 2300 was the result of the LabVIEW program freezing momentarily and temporarily not controlling to the desired temperature. This was not a fault of the RTD but of the computer program.
Figure 8. Tube #2 controlled by RTD-B-001.
20
40
60
80
100
120
140
160
180
0 10000 20000 30000 40000 50000 60000
Tem
pera
ture
(°C)
Time
RTD-B-001
RTD-B-002

NASA KSC – Internship Final Report
NASA Kennedy Space Center Page | 11 4/9/2014
Figure 9 shows minimal deviation over 20 minutes between RTD-B-001 and RTD-B-002. Both RTDs are never more than 0.7°C different from each other.
Figure 9. Blown up section of data from Tube #2.
120
130
140
150
160
170
180
30000 31000 32000 33000 34000 35000 36000 37000
Tem
pera
ture
(°C)
Time
RTD-B-001
RTD-B-002
NASA KSC – Internship Final Report
NASA Kennedy Space Center Page | 12 4/9/2014
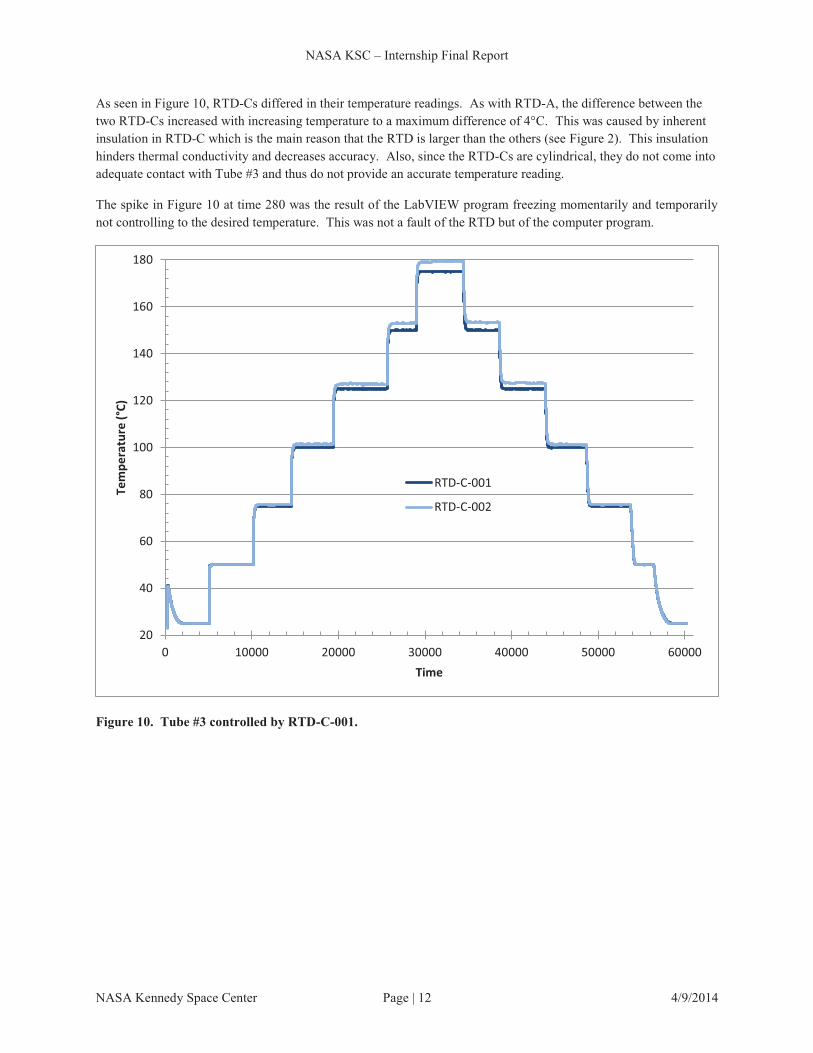
As seen in Figure 10, RTD-Cs differed in their temperature readings. As with RTD-A, the difference between the two RTD-Cs increased with increasing temperature to a maximum difference of 4°C. This was caused by inherent insulation in RTD-C which is the main reason that the RTD is larger than the others (see Figure 2). This insulation hinders thermal conductivity and decreases accuracy. Also, since the RTD-Cs are cylindrical, they do not come into adequate contact with Tube #3 and thus do not provide an accurate temperature reading.
The spike in Figure 10 at time 280 was the result of the LabVIEW program freezing momentarily and temporarily not controlling to the desired temperature. This was not a fault of the RTD but of the computer program.
Figure 10. Tube #3 controlled by RTD-C-001.
20
40
60
80
100
120
140
160
180
0 10000 20000 30000 40000 50000 60000
Tem
pera
ture
(°C)
Time
RTD-C-001
RTD-C-002

NASA KSC – Internship Final Report
NASA Kennedy Space Center Page | 13 4/9/2014
As shown in Figure 11, RTD-A-003 and RTD-B-003 read almost exactly the same. The thermocouple reads slightly hotter than RTD-A-003 and RTD-B-003 while RTD-C-003 reads slightly cooler. One possible reason the thermocouple could read hotter is that no RTV was used to encapsulate the thermocouple. Thus, the thermocouple is in direct contact with both the heater and Manifold #1. RTD-C-003 reads cooler than RTD-A-003 and RTD-B-003 because it is thermally insulated by the RTV. Furthermore, RTD-C-003 is cylindrical and does not contact Manifold #1 like the other RTDs or the thermocouples.
The spike at time 9350 occurred when the thermocouple was disconnected to check the accuracy against the calibrated thermocouple reader. The trough in Figure 11 at time 35,500 was the result of the LabVIEW program freezing momentarily and temporarily not controlling to the desired temperature. This was not a fault of the RTD but of the computer program.
Figure 11. Manifold #1 controlled by RTD-A-003.
20
40
60
80
100
120
140
160
180
0 20000 40000 60000 80000 100000
Tem
pera
ture
(°C)
Time
RTD-A-003
RTD-B-003
RTD-C-003
TC-MAN-001
NASA KSC – Internship Final Report
NASA Kennedy Space Center Page | 14 4/9/2014
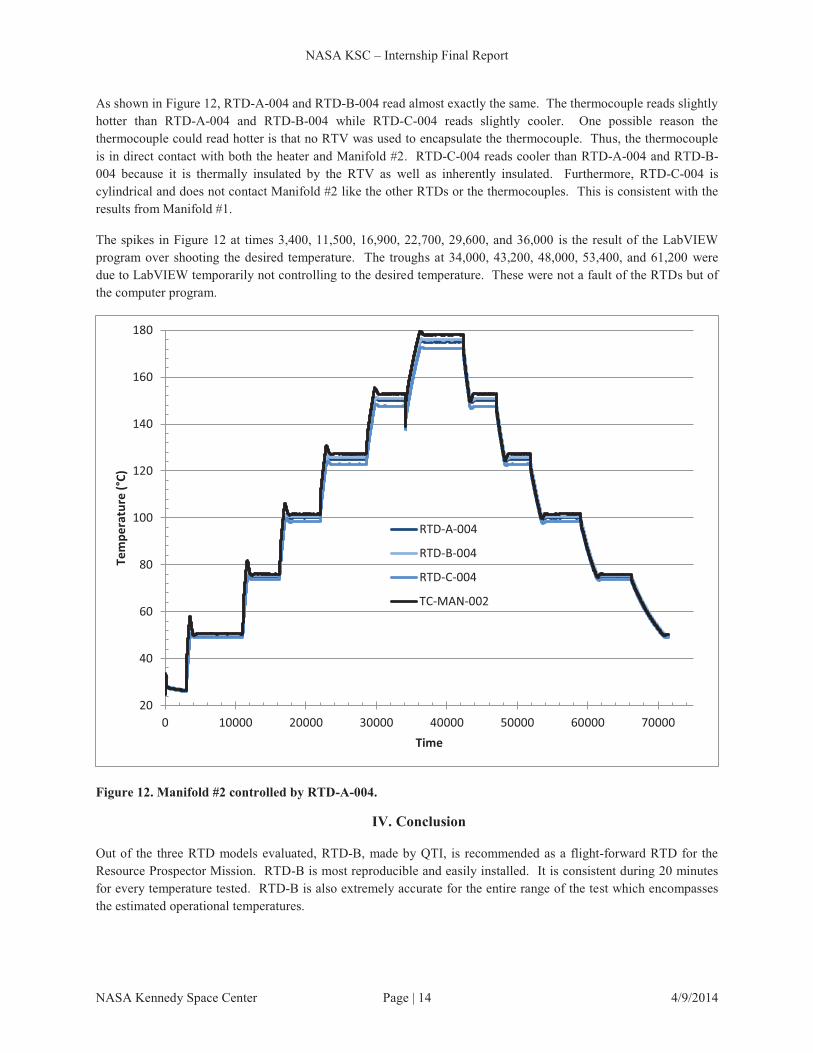
As shown in Figure 12, RTD-A-004 and RTD-B-004 read almost exactly the same. The thermocouple reads slightly hotter than RTD-A-004 and RTD-B-004 while RTD-C-004 reads slightly cooler. One possible reason the thermocouple could read hotter is that no RTV was used to encapsulate the thermocouple. Thus, the thermocouple is in direct contact with both the heater and Manifold #2. RTD-C-004 reads cooler than RTD-A-004 and RTD-B-004 because it is thermally insulated by the RTV as well as inherently insulated. Furthermore, RTD-C-004 is cylindrical and does not contact Manifold #2 like the other RTDs or the thermocouples. This is consistent with the results from Manifold #1.
The spikes in Figure 12 at times 3,400, 11,500, 16,900, 22,700, 29,600, and 36,000 is the result of the LabVIEW program over shooting the desired temperature. The troughs at 34,000, 43,200, 48,000, 53,400, and 61,200 were due to LabVIEW temporarily not controlling to the desired temperature. These were not a fault of the RTDs but of the computer program.
Figure 12. Manifold #2 controlled by RTD-A-004.
IV. Conclusion
Out of the three RTD models evaluated, RTD-B, made by QTI, is recommended as a flight-forward RTD for the Resource Prospector Mission. RTD-B is most reproducible and easily installed. It is consistent during 20 minutes for every temperature tested. RTD-B is also extremely accurate for the entire range of the test which encompasses the estimated operational temperatures.
20
40
60
80
100
120
140
160
180
0 10000 20000 30000 40000 50000 60000 70000
Tem
pera
ture
(°C)
Time
RTD-A-004
RTD-B-004
RTD-C-004
TC-MAN-002
NASA KSC – Internship Final Report
NASA Kennedy Space Center Page | 15 4/9/2014
The heaters were controlled using only RTD-A-001, RTD-A-003, RTD-A-004, RTD-B-001, and RTD-C-001. For future tests, every RTD should be used to control the heaters for separate runs. This would verify each RTD’s reproducibility and provide more data from which to judge accuracy and consistency.
NASA KSC – Internship Final Report
NASA Kennedy Space Center Page | 16 4/9/2014
References
1. Omega. (n.d.). Introduction to Thermocouples. Retrieved from <http://www.omega.com/prodinfo/thermocouples.html>.
2. Van Dusen, M.S., J. Am. Chem. Soc., 1925, 47 (2), pp. 326-332. 3. Honeywell. (n.d.). Sensing and control. Retrieved from
<http://sensing.honeywell.com/index.php?ci_id=50012> 4. NASA. (2013, December 13). Outgassing Section C: Materials having a TML of 1.0% or less and a CVCM
of 0.10% or less. Retrieved from <http://outgassing.nasa.gov/cgi/uncgi/sectionc/sectionc.sh>.
NASA KSC – Internship Final Report
NASA Kennedy Space Center Page | 17 4/9/2014
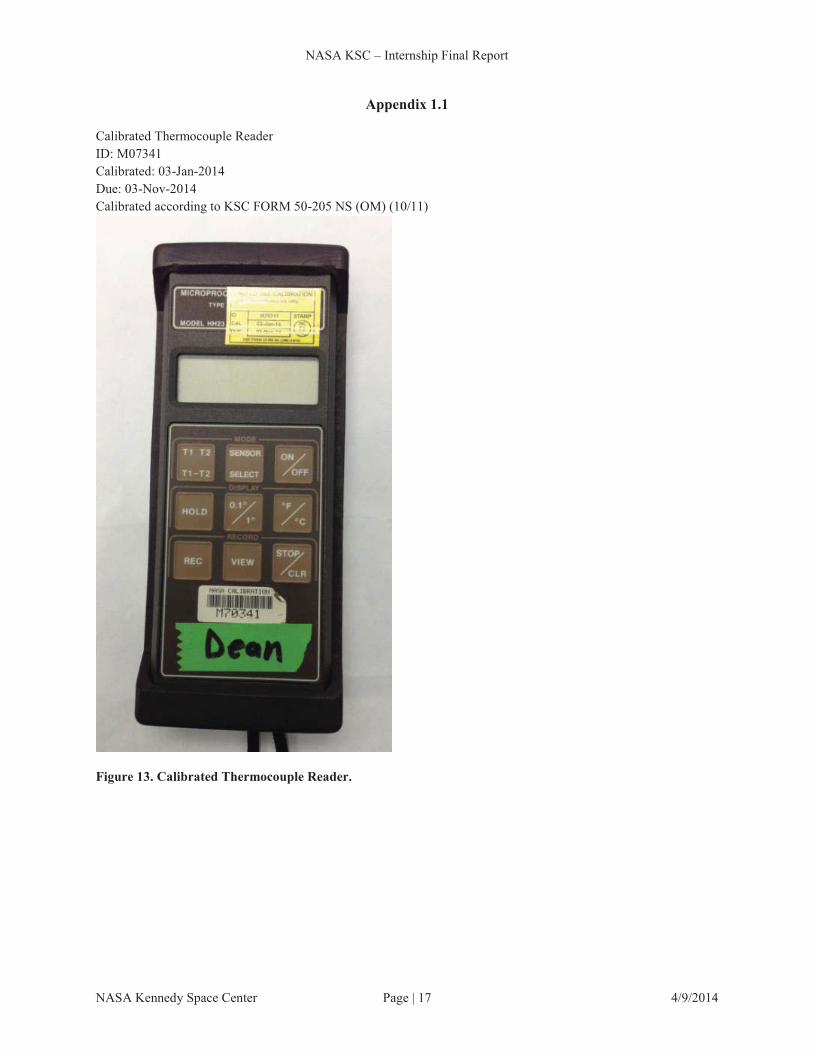
Appendix 1.1
Calibrated Thermocouple Reader ID: M07341 Calibrated: 03-Jan-2014 Due: 03-Nov-2014 Calibrated according to KSC FORM 50-205 NS (OM) (10/11)
Figure 13. Calibrated Thermocouple Reader.