nasa - indian institute of technology...
TRANSCRIPT

AA 1142 0 35NJASATechnicalPaper2023
AVRADCOMTechnicalReport Analytical and Experimental82-C-4 Investigation of StatorOctober 1982 Endwall Conatouring in a
Small Axial-Flow Turbine
I - Stator Perforinance
Jeffrey E. Haas
a.
82 11 01 183
NASA

NASATechnicalPaper2023
AVRADCOMTechimicalReport Analytical and Experimental
82-C-4 Investigation of Stator
1982 Endwall Contouring in aSmall Axial-Flow Turbine
I - Stator Performance
Jeffrey E. HaasPropulsion Laboratory
AVRADCOM Research and Technology LaboratoriesLewis Research CenterCleveland, Ohio
0'
AcoNssin For
NiIS .A&I rW
b'Istiwibut ion/Availability CodesNASAvail axkd/or
NatinalAernauics Dist Speoialand Space Administration
Soft and TeduisalI 10_____ Brai hlow

Summalry for reducing secondary flows. One concept that has thispotential is stator endwall contouring. Contouring the
An analytical and experimental investigation of three stator endwall reduces the radial and cross-channelstator configurations was made to determine the effect of pressure gradients and reduces boundary layer growth,stator outer endwall contouring on stator performance. thus inhibiting the movement of low-momentum fluidOne of the stator configurations was a cylindrical stator and reducing loss.design with an exit tip diameter of 12.77 cm. One The effect of stator endwall contouring was firstcontoured stator configuration had an S-shaped outer reported in reference 1. This reference indicatedendwall. The other contoured stator configuration had a efficiency improvements to 3.5 percent and developedconical-convergent outer endwall. The experimental parametric data to optimize contour geometries. Severalinvestigation consisted of annular surveys of stator exit other investigations have been conducted since thetotal pressure and flow angle for each stator publication of reference 1 to further evaluate the effect of
* configuration over a range of stator pressure ratio. stator contouring. The results from some of theseRadial variations in stator loss and aftermixed flow investigations are reported in references 2 to 7. In theseconditions were obtained. The experimental data were programs, reductions in stator kinetic energy losscompared with analytical results to assess the validity of coefficient ranging from 0.0031 to 0.056 were obtained.the analysis. The experimental data were in good To provide better understanding of the lossagreement with the analysis. mechanisms associated with stator contouring, a
At design stator pressure ratio the reduction in kinetic program was conducted at Lewis to design and evaluateenergy loss coefficient with contouring was 0.005. More experimentally and analytically two different contouredimportantly, however, contouring enabled the low- stator endwall designs for a 12.77-cm-tip-diameter axial-momentum fluid at the tip to be contained in the tip flow turbine. The first configuration had an S-shapedregion, which would be expected to significantly improve outer wall profile and was designed by using thethe flow conditions entering following blade rows. parametric data reported in reference 1. The secondBecause of differences in the movement of low- configuration had a conical-convergent outer wall profilemomentum fluid, the radial variations in loss for the and was designed by simply connecting the stator inletthree stator configurations showed that the two and exit tip diameters with a straight line. A cylindricalcontoured stators had higher loss near the tip and lower stator was also evaluated to provide a reference.loss near the hub than the cylindrical stator. The test sequence consisted of stator and stage tests. In
The results of the investigation indicated that the the stator tests, which are presented in this report, allamount of loss attributed to secondary flows was nearly three stator configurations were evaluated in a cold-air,constant for the three stator configurations. The full-annular cascade environment. Performance wasreduction in loss with the two contoured stators was determined from detailed stator exit radial andattributed to a reduction in boundary layer growth along circumferential surveys of flow angle and total pressure.the vane and endwall surfaces. The stator losses predicted This report describes the contoured stator designs, thefrom the analysis for each stator configuration were experimental procedure, the experimental results, and thewithin 0.022 of those measured. The analysis was able to analytical results. The experimental variations in statorpredict the reduction in loss with the two contoured loss and exit flow conditions with circumferential andstators to within 0.002 of that measured. Good radial position are presented for the three statoragreement with the experimental data was obtained in the configurations. Also presented are the analyticalradial variation of stator exit flow angle. variations in stator loss and exit flow angle for the three
stator configurations. For each stator configuration theIntroduction analysis was used to calculate a profile loss and an
endwall loss.
Axial turbines being designed for advanced high-pressure gas generators in the I- to 5-kg/sec engine Symbolsairflow size class are characterized by small blade heights,long chord lengths, and thickened blade profiles. The E kinetic energy loss coefficientefficiency levels associated with these small, low-aspect- p pressure, Paratio turbines are low as compared with large turbines, R gas constant, J/kg Klargely because of size effects such as boundary layerthickness, fillet radius, and surface finish and the T r atio, Kinfluence of secondary flows. An important goal of the T temperature, Ksmall turbine research at the NASA Lewis Research V velocity, m/secCenter is to Investigate concepts that offer the potential w mass flow rate, kg/sec

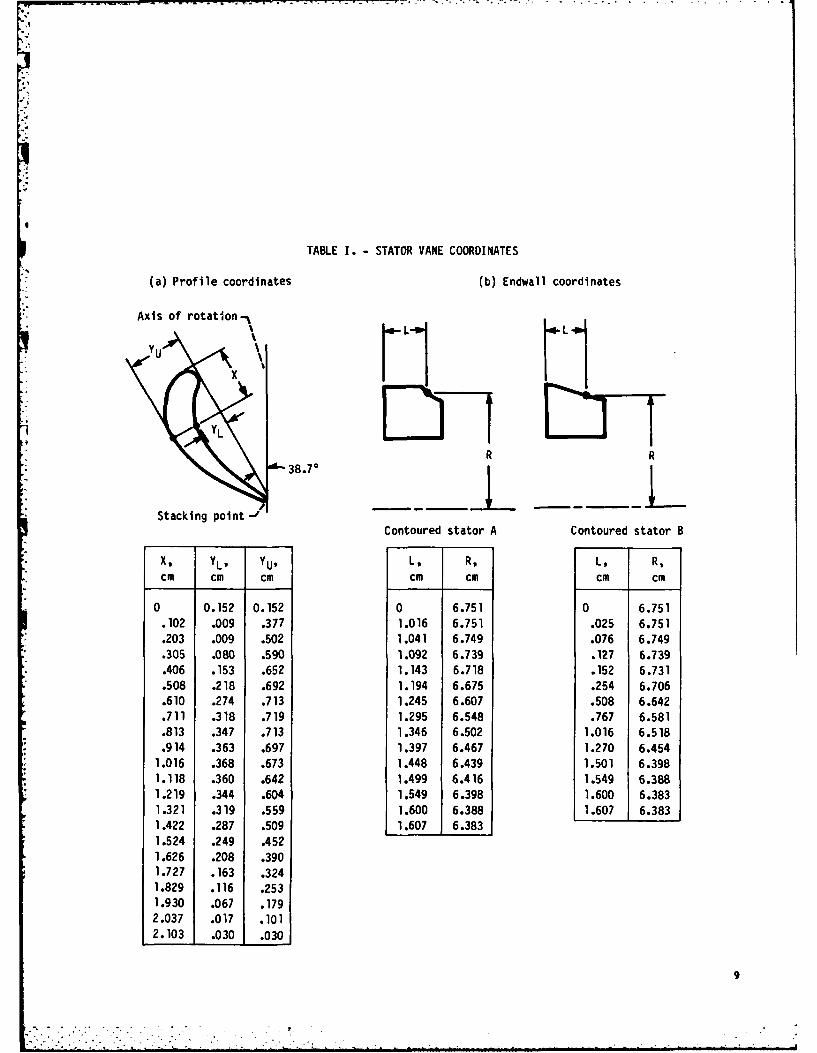
a flow angle measured from axial direction, deg were designed. For both configurations the same vane7 ratio of specific heats profile shape was used as for the cylindrical stator. The
a ratio of inlet tot.*- pressure to U.S. standard tip sections were extended to define the outer endwall
sea-level pressure, PJ/P* contour shape. The first contoured-endwall statorfugconfiguration (designated contoured stator A) had anuto of using di int cntins aates Uo S-shaped outer wall profile and was designed by using the' those using air inlet conditions at U.S.
standard sea-level conditions, (0.740/y) parametric data reported in reference 1. These datax [(v + 1)/2]"/(- 1) indicated that, for an aspect ratio (based on axial chord)of 0.66, an optimum height ratio (inlet height divided by
Oct squared ratio of critical velocity at turbine inlet exit height) of about 1.35 should be chosen.temperature to critical velocity at U.S. stand- The second contoured-endwall stator configurationard sea-level temperature, (Vcr/Vcr) 2 (designated contoured stator B) was designed by using the
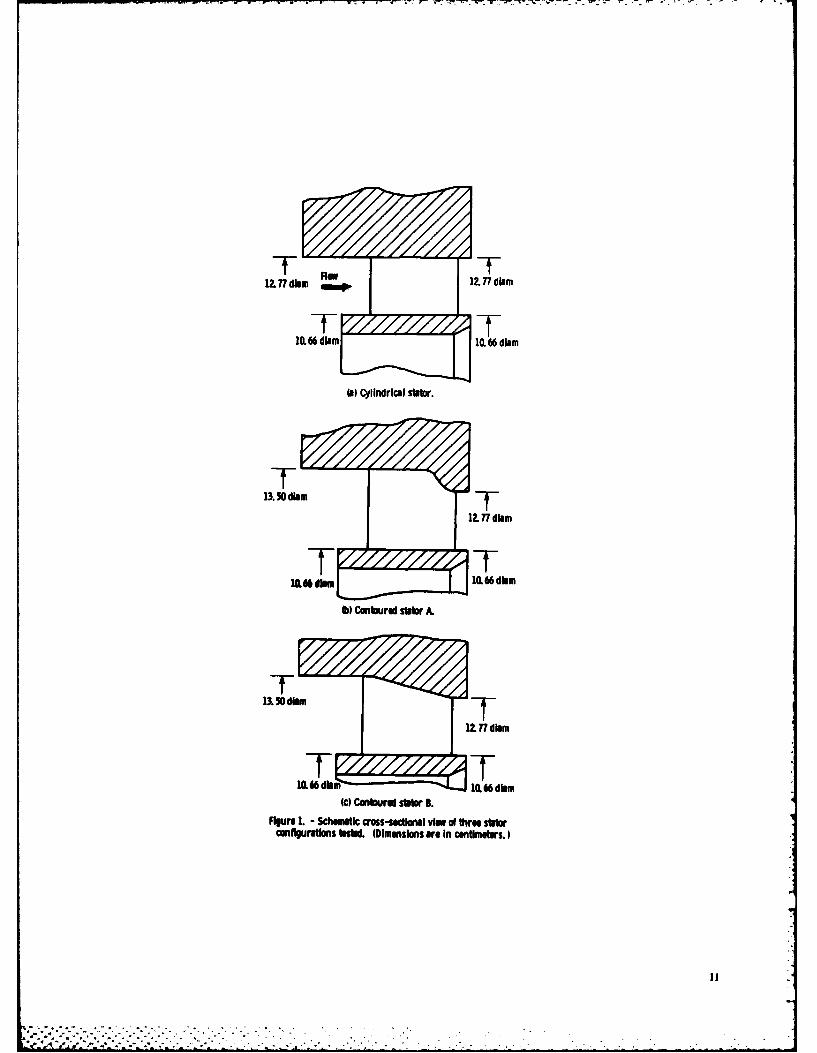
p density, kg/m 3 same inlet and exit tip diameters as contoured stator A.. However, instead of an S-shaped curve along the outer
endwall, a straight line was used, thereby providing aSubscripts: conical-convergent configuration. Cross-sectional
, cr flow conditions at Mach 1 schematics of the three stator configurations are shown infs free stream figure 1. The exit vane height for all three configurations
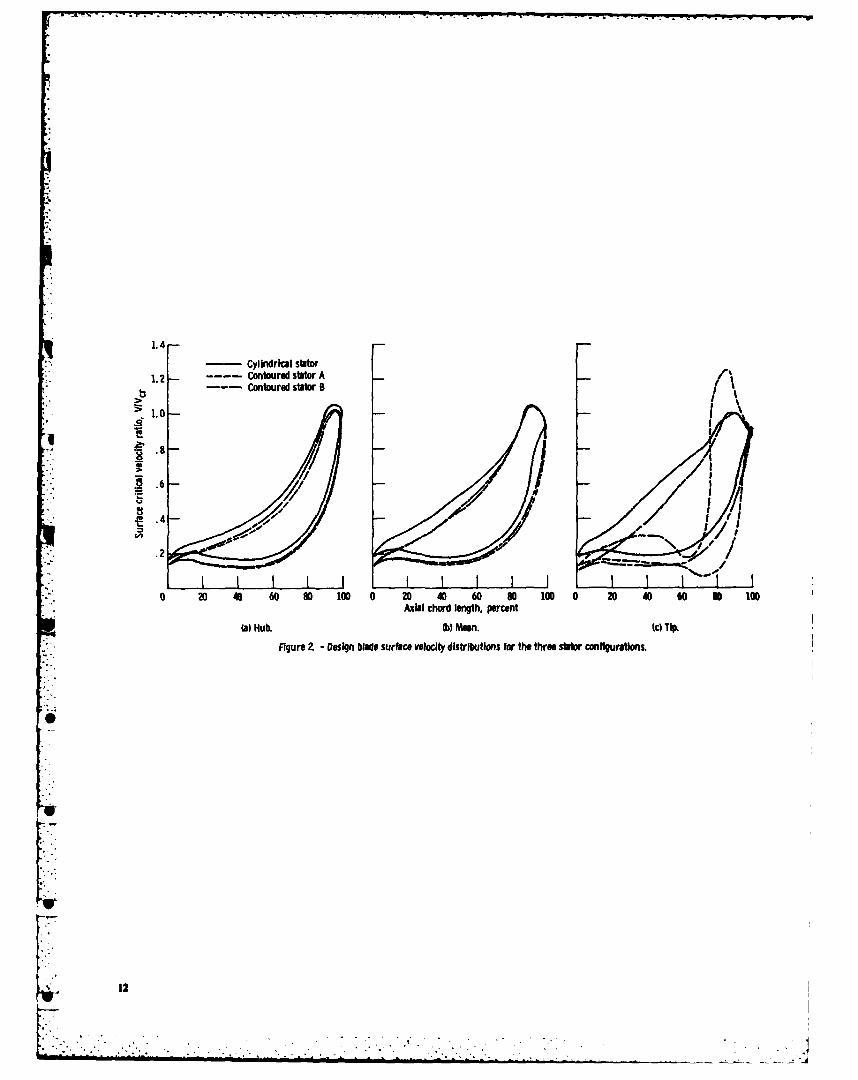
was 1.05 cm. For the two contoured-endwallid ideal or isentropic configurations the inlet vane height was 1.42 cm. Table Im mean lists the profile and endwall coordinates for the threex axial direction stator configurations.0 station at turbine inlet (fig. 7) The design blade surface velocities for the three statorI1 station at stator inlet (fig. 7) configurations are shown in figure 2. These were2.5 station 0.52 cm downstream of vane trailing obtained by using the MERIDL and TSONIC computer
edge (fig. 7) codes (refs. 9 and 10). For TSONIC cases with significant
3M station downstream of vane trailing edge where supersonic regions the modifications of reference 11 wereused. As a result of high solidity, the surface velocity
flow is assumed to be circumferentially unf- distributions show the stator to be lightly loaded. Except-- form (fig. 7)fm i7at the tip, the surface velocities were similar for all three
stators. At the hub and mean, the surface velocities wereslightly lower for the two contoured stators. This was a
Superscripts: result of the increased passage height. When the contour()' total state condition geometry for contoured stator A deflected the tip flow
S( ) U.S. standard sea-level conditions (temp- radially inward, the surface velocities decreased. This waserature, 288.15 K; pressure, 101.3 kPa) followed by a large overshoot in the suction-surface
() mass-averaged value velocity. Since all three stator configurations were lightlyloaded, the cross-channel pressure gradients wereminimized.
Stator Design The reduction in the cross-channel pressure gradientscan be better illustrated by using the blade surface
In this investigation two different contoured-outer- velocities to generate hub and tip endwall pressureendwall stator configurations were designed and contour plots. These are presented in figure 3. Lines ofevaluated to determine their aerodynamic performance. constant static to inlet total pressure ratio are shownTheir performance was compared with that of a reference along both endwalls for each of the three statorcylindrical stator configuration, which was the same configurations. The blade profiles at the tip section fordesign reported in reference 8. The cylindrical-endwall the two contoured stator configurations appear slightlystator was designed for a single-stage, axial-flow turbine distorted because the views shown are projections along athat had a tip diameter of 12.77 cm, a mass flow rate of meridional length at the tip. For the cylindrical statorabout I kg/sec, and an inlet temperature and pressure of (fig. 3(a)) the contour lines are widely spaced through the1478 K and 9.1 bars absolute, respectively. The stator flow passage along both endwalls and the low-pressureheight was 1.05 cm with an aspect ratio of 0.50 (based on regions extend only a short distance along the suctionactual chord) and 4 blade number of 28. surface near the trailing edge. These characteristics are
To evaluate the effect of stator endwall contouring, indicative of a lightly loaded stator and illustrate thetwo different contoured-endwall stator configurations reduced cross-channel pressure gradients. For contoured
2

stator A (fig. 3(b)) the tip endwall shows no cross-channel The three stator configurations are shown in figure 6.pressure contour lines along the first half of the suctionsurface length. The pressure contour lines become closelyspaced nearer the trailing edge and reflect the rapid Apparatusacceleration along the suction surface that was noted inthe discussion of figure 2. For contoured stator B (fig. The experimental apparatus consisted of the test3(c)) the pressure contour lines at the tip endwall appear turbine, the air supply system, and the flow controlsimilar to those for the cylindrical stator, except that the valves. A cross-sectional view of the test turbine is showncontour lines are pushed slightly farther downstream. For in figure 7. The research rig and a diagram of the testall three stator configurations the pressure contour lines installation are shown in figures 8 and 9, respectively.are nearly the same at the hub endwall. Dry, pressurized room-temperature air from a central
Using the velocity distributions of figure 2, analytical supply system flowed through the test section and waspressure distributions along the suction surfaces of the exhausted into the central exhaust system. Pressurethree stator configurations were also obtained. These are control valves at the cascade inlet and exit were used toplotted in figure 4. Lines of constant static to inlet total control the flow conditions upstream and downstream ofpressure ratio are shown. These plots can be used to the test section.judge qualitatively how secondary flows on the suctionsurface will differ among the three stator configurations.
The cylindrical stator (fig. 4(a)) shows pressure Instrumentationcontours that have a slight negative slope from hub to tipfrom the leading edge to about 70 percent of the suction The station nomenclature and the instrumentationsurface length (85 percent of the axial chord length). This used to measure wall static pressure, total temperature,negative slope indicates that the pressure along a given total pressure, and flow angle are shown in figure 10.radial line would be higher at the hub. Thus low- Instrumentation at the turbine inlet (station 0)momentum fluid that forms along the hub wall could measured total temperature and total pressure. Themigrate radially upward toward the tip. Near the stator temperature was measured with three thermocoupleexit the contour lines do not extend from hub to tip and rakes, each containing three thermocouples at the areathe pressure becomes lower near the hub. Therefore the center radii of three annular areas. A single total pressurelow-momentum fluid that migrated radially upward from probe was located in the center of the pipe.
the hub as well as low-momentum fluid that formed At the stator inlet (station 1), static pressure and totalalong the tip wall would migrate to the hub wall. pressure were measured. Static pressures were obtainedinContoured stator A (fig. 4(b)) shows pressure contours from eight taps, with four on the inner wall and four onin the inlet region that extend from hub to tip but change the outer wall. A radial survey of total pressure was madeslope near the midspan region. Thus low-momentum at one circumferential position by using a shielded (Kielfluid along the hub could not migrate radially upward type) total pressure probe. The sensing tube had anbeyond the midspan. At about 60 percent of the suction outside diameter of 0.050 cm and a shield diameter ofsurface length (80 percent of the axial chord length) there 0.16 cm.is a low-pressure region near the tip. For this stator the At station 2.5, located 0.52 cm downstream of the vanelow-momentum fluid at the tip would remain there, trailing edge, the static pressure, total pressure, and flowcausing a loss region. Since the low-momentum fluid at angle were measured. This location corresponded to thethe hub could not migrate radially to the tip, this fluid plane of the rotor leading edge. Static pressures werewould remain near the hub. again obtained from eight taps, with four on the inner
Contoured stator B (fig. 4(c)) shows pressure contours wall and four on the outer wall. Two survey probes weresimilar to those for the cylindrical stator. However, the used to determine the radial and circumferentiallow-pressure region near the stator exit hub is not as variations in total pressure and flow angle over the vanesevere. For contoured stator B there does not appear to height and one vane pitch. The two survey probes arebe a strong driving force to cause the low-momentum shown in figure 11. Two survey probes were requiredfluid to be moved to either the hub or the tip. The low- since a single probe could not survey along the entire vanemomentum fluid would remain in the area where it was height because of the high endwall curvature of the testformed. Therefore from these plots it appears that a hardware. The survey probe shown on the left in figuresignificant effect of endwall contouring is to reduce the 1 I was used to survey the vane from 20 percent of theradial migration of low-momentum fluid. vane height to 97.5 percent. The probe was positioned at
Mean-radius blading information for the cylindrical a fixed angle of 60, and the total pressure and flow anglestator design is shown in figure 5. A stator exit flow angle were determined from calibration curves.of 73.5" and a critical velocity ratio of 0.938 are shown. The survey probe shown on the right in figure 11 was
32. 2

* used to survey the vane from 2.5 percent of the vane 3M). At each radius the conservation of mass,height to 20 percent. Because the sensing end of the probe momentum, and energy was used to obtair thiswas in line with the probe axis, the probe was used in a aftermixed state (i.e., V3Ma, V3M, T3M, 03M, etc.) fromself-nulling mode, in which case the probe aligned itself the survey measurements. The calculation procedure isautomatically with the direction of flow. Both survey described more fully in reference 12. The aftermixed lossprobes were of a three-tube design in which the center was used herein because it is theoretically independent oftube measured the total pressure and the two side tubes the axial location of the survey measurement plane. Ithad their sensing ends cut off to form a 90° wedge to should be noted that the aftermixed loss contains notmeasure the flow angle. Each of the stainless steel tubes only the stator profile loss, but also the mixing loss. Thehad an outside diameter of 0.050 cm. The survey probes aftermixed flow conditions can then be directly comparedwere inserted into two circumferential slots in the outer with the stator design velocity diagrams and loss.casing so that the sensing ends of both probes would be in The stator aftermixed loss based on kinetic energy canthe plane of station 2.5. During testing the survey regions be defined as a function of radius 03M(r) or as an overallof the two probes were allowed to overlap in order to quantity 03M as given by the following equations:verify that good agreement in both measured totalpressure and flow angle was obtained. M VM
- e43M(r) = 3M (1)
3M,idProcedure
Stator exit radial and circumferential surveys were -43M =d (2)conducted on the three stator configurations to obtain V r drbasic aerodynamic data. The surveys for each hP3M V3Mx3Midconfiguration were conducted at three stator inlet total tostator exit mean static pressure ratios, nominally, 1.35, where1.8, and 2.1. The tests were conducted at nominal inletconditions of 300 K and pressures that ranged from 1.3 to V3Mid1) [ - (P3M ' ]1 2 (3)2.1 bars absolute. The inlet pressure was varied to set the 'id= - TI l P I)stator pressure ratio so that the stator exit tip staticpressure would be maintained at about 1 bar Absolute.,iiFor each stator configuration and stator pressure ratio, As noted in equation (2) the integrations were
- Fperformed over the entire stator height. Since the flowstator exit total pressure and flow angle data were measurements were only taken from 2.5 to 97.5 percentobtained at 15 radii ranging from 2.5 to 97.5 percent ofthe vane height and over one vane pitch (19.2) in 20 of the stator blade height, extrapolations of flow angle
and total pressure were made for each pressure ratio andincrements of about 0.65 ° each. At ach discrete point stator configuration. These extrapolations werethe probe movement was stopped and the probe pressures essentially straight lines, with the total pressure at thewere allowed to reach equilibrium before data were endwalls set equal to the wall static pressure.taken.
A single radial total pressure survey was also made atstation 1. The survey was conducted at a stator pressureratio of 1.8, and data were obtained at several radial Results and Discussion
-!!i positions ranging from about 5 to 95 percent of the inlet This section presents the aerodynamic data for the
vane height. three stator configurations. Stator experimental andanalytical data are presented in terms of exit flowmeasurements and overall aftermixed stator loss.
Experimental ResultsThe stator kinetic energy loss coefficient was calculated
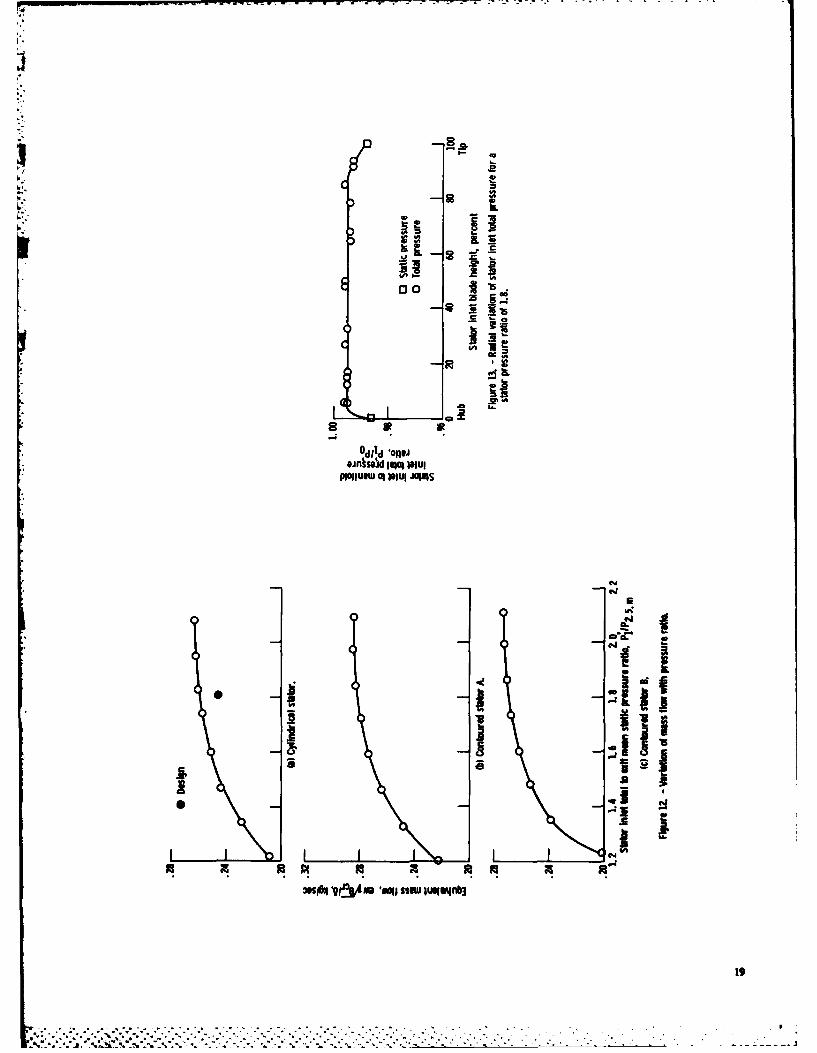
V - from the stator exit surveys of total pressure and flow Mass flow. -The variation of equivalent mass flow
angle. In the calculation the static pressure was assumed with stator pressure ratio is shown in figure 12 for theto vary linearly between the hub and tip wall values, three stator configurations. For the cylindrical stator the
The calculation of the stator kinetic energy loss mass flow at design pressure ratio was 5.3 percent largercoefficient was based on the determination of a than design. Most of this increase was due to an oversizedhypothetical state where it was assumed that the flow had throat area. Measurements indicated that the statormixed to a circumferentially uniform condition (station throat area was about 7.2 percent larger than that
4 .....r i ..

required to pass design mass flow. The difference (1.9 incidence and reaction effects. This type of effect waspercent) was attributed to larger than design aerodynamic noted in reference 2, where cascade tests of a cylindricallosses, and a contoured outer endwall stator showed only a 0.002
The mass flows for contoured stators A and B were 8.9 reduction in loss for the contoured stator, but stage testspercent and 4.3 percent larger, respectively, than that for indicated a 1.5 point increase in overall stage efficiency.the cylindrical stator. The throat areas for contoured The increase was attributed to improved rotor inlet flow
* stators A and B were about 9.6 and 4.3 percent larger conditions.* than the cylindrical stator throat area, respectively. Thus, Aftermixed flow angle. - The radial variations in
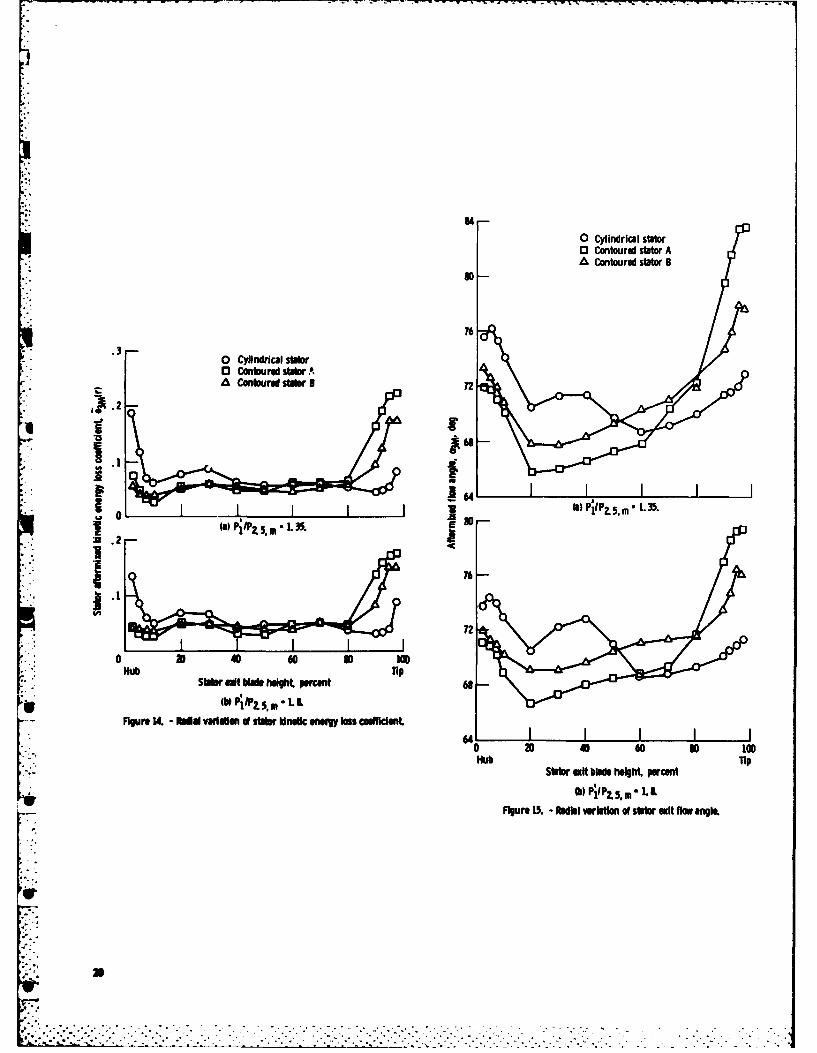
as compared with the cylindrical stator, the percentage aftermixed flow angle at stator pressure ratios of 1.35changes in mass flow for the contoured stators were on and 1.8 are shown in figure 15 for the three statorthe average proportional to the increases in throat area. configurations. At each pressure ratio both contouredThis would indicate that aerodynamic losses for the stator configurations showed higher turning near the tip,contoured stators were about the same as that for the whereas the cylindrical stator had higher turning from thecylindrical stator. hub to about 50 percent of the blade height. For the
Stator inlet total pressure. - Figure 13 shows the radial pressure ratio of 1.8 the overall, mass-averaged flowvariation in stator inlet total pressure at a stator pressure angles were 70.8, 69.7, and 71.00 for the cylindricalratio of 1.8. The stator inlet total pressure is normalized stator, contoured stator A, and contoured stator B,by the turbine inlet total pressure. The stator inlet total respectively. The lower-than-design, mass-averaged flowpressure was obtained from a radial survey at one angles for the three stator configurations were consistentcircumferential location by using a shielded (Kiel type) with the higher-than-design mass flow rates shown intotal pressure probe. A shielded total pressure probe was figure 12, although the percentage changes in the cosineschosen because of its ability to measure a true total of the overall flow angles among the three statorpressure over a wide flow angle range. The survey was configurations were less than the percentage changes inconducted over a range from about 5 to 95 percent of the mass flow. Even though the levels of flow angle may havestator inlet blade height. Based on the data, the boundary been in error - a 1 error in an overall flow angle of 700layer height at the hub was less than 5 percent of the would account for a 5 percent error in calculating a massblade height, whereas the boundary layer height at the tip flow- the trends shown in figure 15 are consideredwas about 10 percent of the blade height. From these accurate.data, calculations were made to obtain the displacement Mass flux. -Figure 16 shows the radial variation inand momentum thicknesses on each endwall. These were normalized mass flux for the three stator configurationssubsequently used as the initial conditions in the endwall at a stator pressure ratio of 1.8. The normalized massboundary layer analysis. flux for each stator configuration is defined as the local
Aftermixed stator loss. -The radial variation in product of p V, divided by the mass-averaged value p Vx.aftermixed kinetic energy loss coefficient for the three The biggest factor in the calculation of p Vx is the flowstator configurations is shown in figure 14 at stator angle. From the results of figure 15 it is apparent thatpressure ratios of 1.35 and 1.8. The data indicate that at there would be a change in the mass flow distributionboth pressure ratios the cylindrical stator had lower loss radially. There was a much higher percentage of the flownear the tip and higher loss near the hub than the two near the hub for the two contoured stator configurationscontoured stator configurations. At the design pressure and more flow near the tip for the cylindrical stator.ratio of 1.8, the overall kinetic energy loss coefficients Pressure ratio contours. - Plots of the stator totalwere 0.057, 0.052, and 0.052 for the cylindrical stator, pressure ratio contours Pi.5/p are shown in figure 17 forcontoured stator A, and contoured stator B, respectively, the three stator configurations at a stator pressure ratioAt the stator pressure ratio of 1.35, the overall loss values of 1.8. The contour plots were generated for one vanewere 0.069, 0.062, and 0.061 for the same respective spacing and over the blade height surveyed. Thestator configurations. projection of the trailing edge obtained by using the vane
Although the reductions in loss due to contouring were mean camber angle is shown on each plot. All three statorsmall, the radial trends shown in figure 14 indicate that configurations show wide wake regions. All three statorsthe main effect of endwall contouring was to change the also show loss cores centered at about 30 and 70 percentradial distribution of loss. For the two contoured stator of the blade height. These loss cores are located on theconfigurations the loss region remained near the tip suction side of the trailing-edge projection and areinstead of migrating radially toward the hub as was the associated with the boundary layers on both endwallscase for the cylindrical stator. The difference in loss being deflected across the vane passage, being turneddistribution should be reflected more noticeably in the away from the endwalls, and rolling up to form passagestage performance, where the large loss region at the hub vortices in the corners formed by the endwalls and thefor the cylindrical stator may cause detrimental rotor suction surface. Contoured stators A and B both show
5
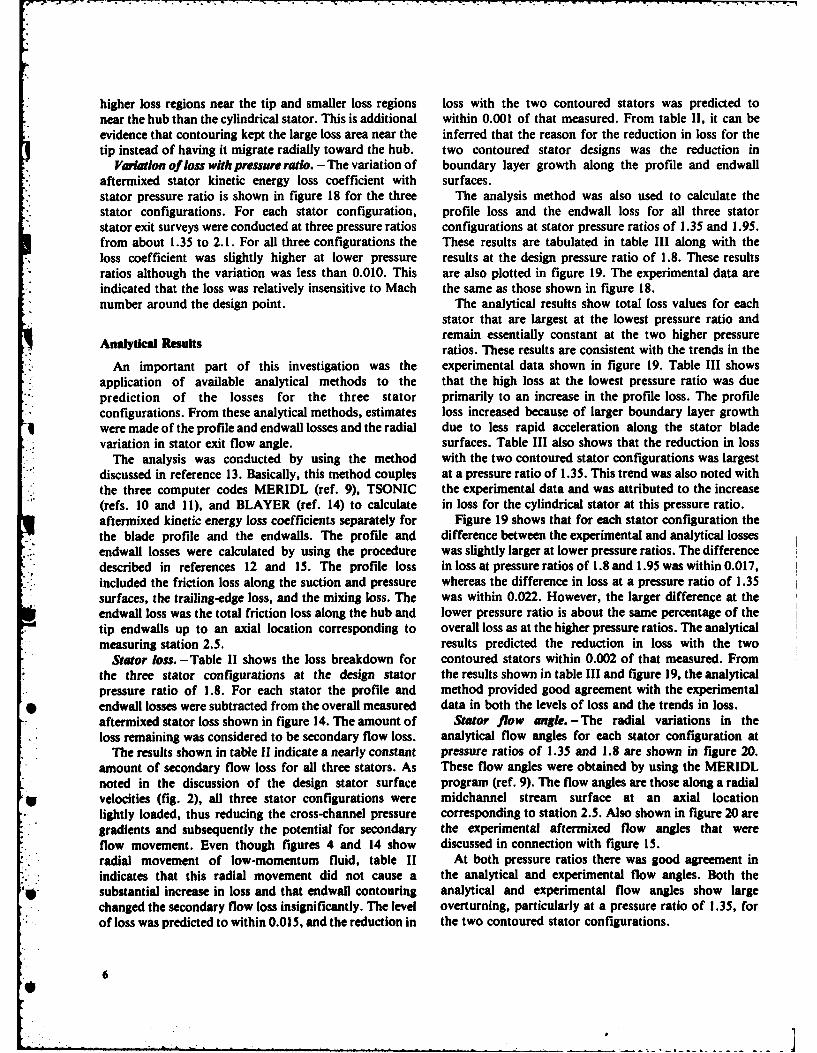
higher loss regions near the tip and smaller loss regions loss with the two contoured stators was predicted tonear the hub than the cylindrical stator. This is additional within 0.001 of that measured. From table II, it can beevidence that contouring kept the large loss area near the inferred that the reason for the reduction in loss for thetip instead of having it migrate radially toward the hub. two contoured stator designs was the reduction in
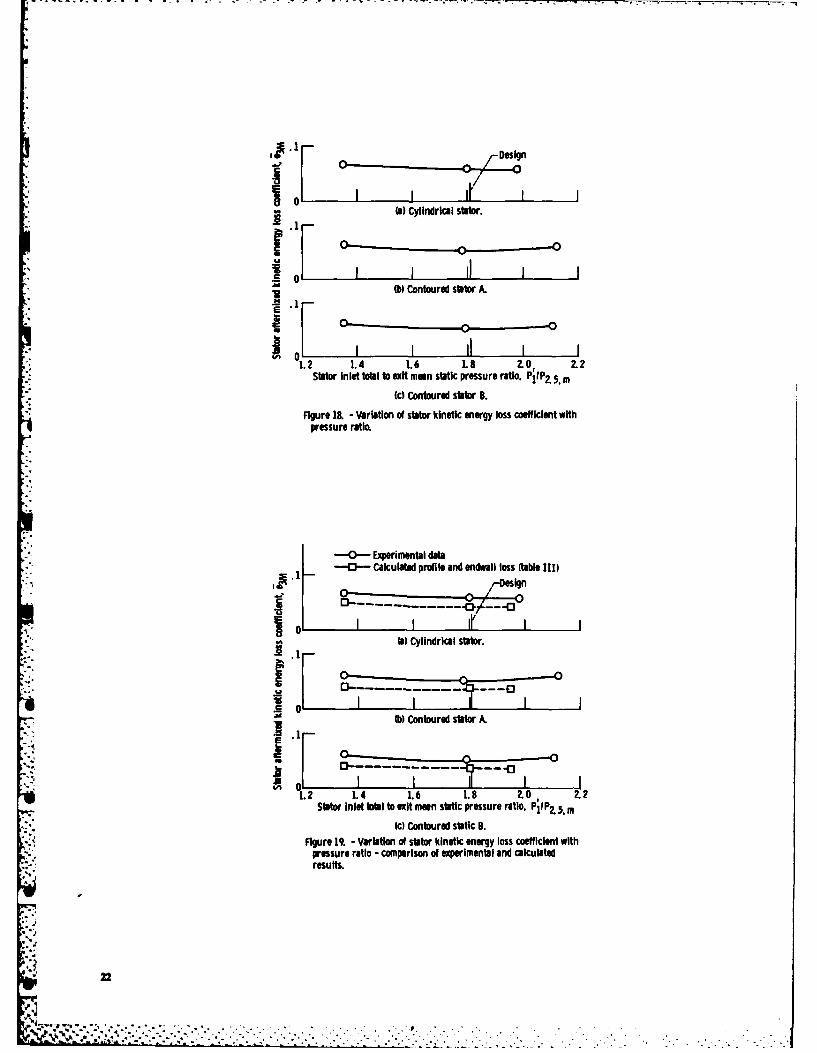
Variation of loss with pressure ratio. - The variation of boundary layer growth along the profile and endwallaftermixed stator kinetic energy loss coefficient with surfaces.stator pressure ratio is shown in figure 18 for the three The analysis method was also used to calculate thestator configurations. For each stator configuration, profile loss and the endwall loss for all three statorstator exit surveys were conducted at three pressure ratios configurations at stator pressure ratios of 1.35 and 1.95.from about 1.35 to 2.1. For all three configurations the These results are tabulated in table III along with theloss coefficient was slightly higher at lower pressure results at the design pressure ratio of 1.8. These resultsratios although the variation was less than 0.010. This are also plotted in figure 19. The experimental data areindicated that the loss was relatively insensitive to Mach the same as those shown in figure 18.number around the design point. The analytical results show total loss values for each
stator that are largest at the lowest pressure ratio andA c Rremain essentially constant at the two higher pressureAnalytical Results ratios. These results are consistent with the trends in the
An important part of this investigation was the experimental data shown in figure 19. Table III showsapplication of available analytical methods to the that the high loss at the lowest pressure ratio was due
prediction of the losses for the three stator primarily to an increase in the profile loss. The profile, configurations. From these analytical methods, estimates loss increased because of larger boundary layer growth* were made of the profile and endwall losses and the radial due to less rapid acceleration along the stator blade* variation in stator exit flow angle. surfaces. Table III also shows that the reduction in loss
The analysis was conducted by using the method with the two contoured stator configurations was largestdiscussed in reference 13. Basically, this method couples at a pressure ratio of 1.35. This trend was also noted withthe three computer codes MERIDL (ref. 9), TSONIC the experimental data and was attributed to the increase(refs. 10 and 11), and BLAYER (ref. 14) to calculate in loss for the cylindrical stator at this pressure ratio.aftermixed kinetic energy loss coefficients separately for Figure 19 shows that for each stator configuration thethe blade profile and the endwalls. The profile and difference between the experimental and analytical lossesendwal losses were calculated by using the procedure was slightly larger at lower pressure ratios. The differencedescribed in references 12 and 15. The profile loss in loss at pressure ratios of 1.8 and 1.95 was within 0.017,included the friction loss along the suction and pressure whereas the difference in loss at a pressure ratio of 1.35surfaces, the trailing-edge loss, and the mixing loss. The was within 0.022. However, the larger difference at theendwail loss was the total friction loss along the hub and lower pressure ratio is about the same percentage of thetip endwalls up to an axial location corresponding to overall loss as at the higher pressure ratios. The analyticalmeasuring station 2.5. results predicted the reduction in loss with the two
Stator loss. -Table II shows the loss breakdown for contoured stators within 0.002 of that measured. Fromthe three stator configurations at the design stator the results shown in table III and figure 19, the analyticalpressure ratio of 1.8. For each stator the profile and method provided good agreement with the experimental
* endwall losses were subtracted from the overall measured data in both the levels of loss and the trends in loss.aftermixed stator loss shown in figure 14. The amount of Stator flow angle. -The radial variations in theloss remaining was considered to be secondary flow loss. analytical flow angles for each stator configuration at
The results shown in table II indicate a nearly constant pressure ratios of 1.35 and 1.8 are shown in figure 20.amount of secondary flow loss for all three stators. As These flow angles were obtained by using the MERIDLnoted in the discussion of the design stator surface program (ref. 9). The flow angles are those along a radial
* velocities (fig. 2), all three stator configurations were midchannel stream surface at an axial locationlightly loaded, thus reducing the cross-channel pressure corresponding to station 2.5. Also shown in figure 20 are
gradients and subsequently the potential for secondary the experimental aftermixed flow angles that wereflow movement. Even though figures 4 and 14 show discussed in connection with figure 15.radial movement of low-momentum fluid, table II At both pressure ratios there was good agreement inindicates that this radial movement did not cause a the analytical and experimental flow angles. Both thesubstantial increase in loss and that endwall contouring analytical and experimental flow angles show large
- *changed the secondary flow loss insignificantly. The level overturning, particularly at a pressure ratio of 1.35, forof loss was predicted to within 0.015, and the reduction in the two contoured stator configurations.
6
bI

%J Concluding Remarks each stator configuration were within 0.022 of thosemeasured. The analysis was able to predict the reduction
The results obtained in this investigation were in loss with the two contoured stators to within 0.002 ofbeneficial for two reasons. First, even though the that measured. Good agreement with the experimentalreduction in loss with contouring was small, the radial data was obtained in the radial variation of stator exitredistribution of loss should have a significantly larger flow angle.effect on stage performance. Second, the analysis method 5. The measured mass flows for the two contouredproved to be an accurate means for predicting the stator configurations were 4.3 and 9.6 percent greaterreduction in loss with stator endwall contouring. Further than that for the cylindrical stator, primarily because ofvalidation of this method is desirable. A more differences in the physical throat areas.meaningful case would be to predict the loss reductionfor a much more highly loaded stator configuration in Lewis Research Centerwhich the radial and cross-channel pressure gradients, National Aeronautics and Space Administrationand therefore the potential for secondary flows, would be Cleveland, Ohio, May 17, 1982greater.
Summary of Results References
An analytical and experimental investigation of three 1. Deich, M. E.; et al.: Method of Increasing the Efficiency of
stator configurations was made to evaluate the effect of Turbine Stages and Short Blades. Translation No. 2816,Associated Electrical Industries Ltd., England, 1960.
stator outer endwall contouring on stator performance. 2. Ewen, J. S.; Huber, F. W.; and Mitchell, J. P.: Investigation of the
One of the stator configurations was a cylindrical endwall Aerodynamic Performance of Small Axial Turbines. ASME Paperdesign having an exit tip diameter of 12.77 cm. One 73-GT-3, Apr. 1973.contoured stator configuration had an S-shaped outer 3. Due, H. F., Jr.; et al.: Advanced Small Axial Turbine Technology.
*~i endwall. The other ontoured stator onfiguration had a USAAMRDL-TR-77-1, Teledyne CAE, 1977. (AD-A042517.)nnil-cTheeother contoured altatorconfiruration hala 4. Morris, A. W. H.; and Hoare, R. G.: Secondary LossMeasurements in a Cascade of Turbine Blades with Meridional
investigation consisted of annular surveys of stator exit Wall Profiling. ASME Paper 75-WA/GT-13, Nov. 1975.total pressure and flow angle for each stator 5. Kopper, F. C.; Milano, R.; and Vanco, M.: An Experimental
configuration over a range of stator pressure ratio. Stator Investigation of Endwall Profiling in a Turbine Vane Cascade.
loss and aftermixed flow conditions were varied with AIAA Paper 80-1089, June 1980.radial position. The experimental data were compared 6. Okapuu, U.: Some Results from Tests on a High Work Axial Gas
Generator Turbine. ASME Paper 74-GT-81, Mar. 1974.
with analytical results to assess the validity of the 7. Tipton, D. L.: Experimental Investigation of Turbine Endwallanalysis. The results of the investigation are summarized Contouring. TDR AX0400-174, Detroit Diesel Allison Technical
as follows: Data Report, 1981.1. At design stator pressure ratio the reduction in 8. Haas, Jeffrey E.; and Kofskey, Milton G.: Cold-Air Performanceof a 12.766-Centimeter-Tip-Diameter Axial-Flow Cooled Turbine.
kinetic energy loss coefficient with contouring was 0.005. II - Effect of Air Ejection on Turbine Performance. NASAMore importantly, however, contouring enabled the low- TP-1018, 1977.momentum fluid at the tip to be contained in the tip 9. Katsanis, Theodore; and McNally, William D.: Revisedregion, and this would be expected to significantly FORTRAN Program for Calculating Velocities and Streamlinesimprove the flow conditions entering following blade on the Hub-Shroud Midchannel Stream Surface of an Axial-,
Radial-, or Mixed-Flow Turbomachine or Annular Duct.rows. Vol. I-User's Manual. NASA TN D-8430, 1977.
2. Because of differences in the movement of low- 10. Katsanis. Theodore: FORTRAN Program for Calculatingmomentum fluid, the radial variations in loss for the Transonic Velocities on a Blade-to-Blade Stream Surface of athree stator configurations showed that the two Turbomachine. NASA TN D-5427, 1969.contoured stators had higher loss near the tip and lower !1. Wood, Jerry R.: Improved Method for Calculating Transonic
Velocities on Blade-to-Blade Stream Surfaces of a Turbomachine.loss near the hub than the cylindrical stator. NASA TP-1772, 1961.
3. The results of the investigation indicated that the 12. Goldman, Louis J.; and McLalin, Kerry L.: Cold-Air Annular-amount of loss attributed to secondary flows was nearly Cascade Investigation of Aerodynamic Performance of Cooledconstant for the three stator configurations. The Turbine Vanes. I - Facility Description and Base (Solid) Vanereduction in loss with the two contoured stators was Performance. NASA TM X-3006, 1974.attributed to a reduction in the boundary layer growth 13. Boyle, Robert J.; Rohlik, Harold E.; and Goldman, Louis J.:
Analytic Investigation of the Effect of Endwall Contouring onalong the vane and endwall surfaces. Stator Performance. NASA TP-1943, 1981.
4. The stator losses predicted from the analysis for 14. McNally, William D.: FORTRAN Program for Calculating
7

ComruiisLanminar and Turbulent Boundary Layers in Flow Loss Characteristics Downstream of Turbomaine BladeA~ryPressure Giradients. NASA TN D-4681. 1970. Rows in Term of Basic Boundary Layer Characteristics. NACA
15. Bwait. Warner L.: Analysis of Two-Dimensional Compressible- Th-35 15. 1955.
I
TABLE I. - STATOR VANE COORDINATES
(a) Profile coordinates (b) Endwall coordinates
Axis of rotation-%
DLT38.70
Stacking point_Contoured stator A Contoured stator B
X, L YU9 L, R, L, R,
cm cm cm cm cm cm cm
0 0.152 0.152 0 6.751 0 6.751.102 .009 .377 1.016 6.751 .025 6.751.203 .009 .502 1.041 6.749 .076 6.749.305 .080 .590 1.092 6.739 .127 6.739.406 .153 .652 1.143 6.718 .152 6.731.508 .218 .692 1.194 6.675 .254 6.706.610 .274 .713 1.245 6.607 .508 6.642.711 .318 .719 1.295 6.548 .767 6.581.813 .347 .713 1.346 6.502 1.016 6.518.914 .363 .697 1.397 6.467 1.270 6.454
1.016 .368 .673 1.448 6.439 1.501 6.3981.118 .360 .642 1.499 6.416 1.549 6.3881.219 .344 .604 1.549 6.398 1.600 6.3831.321 .319 .559 1.600 6.388 1.607 6.3831.422 .287 .509 1.607 6.3831.524 .249 .4521.626 .208 .3901.727 .163 .3241.829 .116 .2531.930 .067 .1792.037 .017 .1012.103 .030 .030
. . .. . .. . . .

TABLE 11. -STATOR LOSS BREAKDOWN
(Stator pressure ratio, 1.8.]
Cylindrical Contoured ContouredStator stator A stator B
Overall stator 0.057 0.052 0.052aftermixed loss(measured)
Profile loss 0.025 0.024 0.023Endwall loss .017 .014 .015Secondary flow loss .015 .014 .014Total loss .057 .052 .052
TABLE III. -COMPARISON OF CALCULATED PROFILE
AND ENDWALL LOSSES
Pl/P2m Loss Cylindrical Contoured Contouredstator stator A stator B
1.35 Profile 0.030 0.026 0.026Endwall .019 .014 .016Total .049 .040 .042
*1.8 Prof ile 0.025 0.024 0.023Endwall .017 .014 .015Total .042 .038 .08
1.95 Profile 0.025 0.023 0.024Endwall .017 .013 .014
*Total .042 .036 .038
10
EM --
T TIOL66 diam10. 66 diam
(a) Cylindrical Afta.
T
6) Confoured sif A.
II
1.4
-Cylindrical stator1.2 Contoured stator A
b Contoured stator B
1.0- CI'
Axia chr egh ec n
1)Hub. (b) Mean. Icl Tw.
Figure Z -Design blade surface velocity distributions for the three stator configurations.
12

~Ct
U0
a ad
do Q
C-
490I UA
a1

_____________________________________Static to InletTip I D total pressure
E PIP1F A 0.90
HB .80EG) .70
HubL \ I E .55
la) Cylindrical stator. F .52
TipTi .9
\\ \.48Itacalgsutosuac
Ip
Ditac Vanesrf
Va~s 0. s73 a c n rlin
Radus ?3
152)~ . 3
1.60

Figure 6. - StW configurafts.
Flow
F~gure?.- Schemc ciussSurveya al a sturw
is

Figure &. - Turbine test Instaflation.
Pressure
Figre .- Tes ItHih-resur diarm
Pre1ur
...............................

x Total temperature0 S*Utc pressure Total pressure13 Totaml pressure arW flo angle
survey softo-\,
stton 0 Slation.1 Station 2.3Flo
-. StatIon 0 (upstream-. totaltemperaturo and total pressure)
SbtatI1 (sttIc pressure and-------------------------------------------l lprssurel
Stati pressure tap--"'IL 81cm
-- -- - raffing edge
o.52 anS-- Stationz 5 (statc pressure.
total pressure, and fkwangle survey
Probe travel-'
-------- ------- Sto 3M Malormixed
conditions)
Figure M1 - now pith Instrumentation aN sltion IcitiOns.

0. 1cm O.cm
Survey pro*e used from Survey Probe used from 20 toZ.5tbo20prCeIM OfvWN 97.5perCentOfSPmn Weeheight h@4ht.
0) She vwn. 6) Front Wion
Figure 11. - Sbw eaft survey probes.
C) 0
35
2r
00n
cC
j allUSN O AM SIWILlw3
.0Is
0 Cyindricalstatoo Contoured stator AA Contoured stator B
.30 Cylindrical stalero6 Contoured stalBr'.
1.2
I( -£~0 _______________ IPap -135.
18) PjIPZ S. L 35
1 7'j.1
Inn
Hub 7ipStai 3dt blade he"ht percent
Figure 14. - Nod vutieon of staior Mnedlc eneey Ios coefdent
0o 20 4 0 s 100Hub Tip
Stair =it blad height percentlb) PjIP.Sm -L&
Figure 15. - RaidlI veriation of stator exit flu angWe

1.2-
I-E . ---- - - -
.8
o Cylindrical statoro Contoured stator A
.6 Contoured stator BDesign
Hub TipStator exit blade height, percent
Figure 16. - Radial variation of mass flux at a stator pressure ratioof L.
VaneI spcing ITotal pressureA7 13 C--. C A ratio,,
CPressure P .aCTh surface A 0.9{ Suction~ 6B .96iioVaneufeD .94
heigh E (using vanemean
ic 0 -0 B Ccamber angle)
C CCC
AsA
B A
IN Contoured stator A. IcICotue stto B,.Figure 17. - Contours of stator total Pressure ratio at a stator Inlet total to exit maen static pressure ratio of 1.,
21
/Design
(a) Cylindrical stati'
(b) Contoured stator A.
Staor nlt ttaltoexit man static pressure ratio. P,11 Z5 M
(c) Contoured stator B.Figure 18 - Vrainostorkinetic energyloscefintwh
pressure ratio.
--0- Experimental data
-0 -Calculated profile and endwall loss (table 111)
11 Cylindrical stator.
.S 0
ad Mi Contoured stator A.
-IN
- ---I -1l. 2 1. 4 1.6 1.8 2.0 , 2.2
Stator inlet tot1 to exit moon static pressure ratio. P1IIP2. 5. mfci Contoured static B.
Figure 19. - Variation of stator kinetic energy loss coefficient withpressure ratio - comparison of experimental andl calculatedresults.
22. . .. . . .. . .

4 84-
WaDi Cylindrical stator. (b-i) Cylindrical stator.84-
76
68 -
(A-2) Contoured stator A. (b-2) Contoured stator A.84-
76-
0 20 4Q 60 O0 100 0 20 40 60 so IODStator exit blade height pecent
ta-3) Contoured stator B. (b-3) Contoured stator B.
Ia) PI -s 1.35. 1b PlIP2.5. m - 1.
Figure 20. - Comparison of radial variations In measured and calculated stator exit fk angles.
23

!.I
1. Report No. NASA TP -2023 Li G enment Ac 2 njo 3. Recipient's Catalog No.
AVRADCOM TR 82-C-4 i4. Title and Subtitle ANALYTICAL AND EXPERIMENTAL 5. Report Date
INVESTIGATION OF STATOR ENDWALL CONTOURING October 1982IN A SMALL AXIAL-FLOW TURBINE 6. Performing Organization Code
" I - STATOR PERFORMANCE 505-32-2B
. 7. Author(s) 8. Performing Organization Report No.
. Jeffrey E. Haas E-1180i 10. Work Unit No.
9. Performing Organization Name and Address
NASA Lewis Research Center andAVRADCOM Research and Technology Laboratories 11. Contract or Grant No.
: Cleveland, Ohio 44135- C13. Type of Report and Period Covered
12. Sponsoring Agency Name and Address Technical Paper
National Aeronautics and Space Administration Tecnic PapeWashington, D. C. 20546 and U. S. Army Aviation Research and 14. Sponsoring Agency CodeDevelopment Command, St. Louis, Mo. 63166
15. Supplementary Notes
16. Abstract
- -An analytical and experimental investigation of three stator configurations was made to deter -mine the effect of stator outer endwall contouring on stator performance. One of the stator
-* configurations was a cylindrical stator design. One contoured stator configuration had anS-shaped outer endwall. The other contoured stator configuration had a conical -convergentouter endwall. The experimental investigation consisted of annular surveys of stator exit total
- pressure and flow angle for each stator configuration over a range of stator pressure ratio.Radial variations in stator loss and aftermixed flow conditions were obtained. The experimental
*data were compared with the analytical results to assess the validity of the analysis. Theexperimental data were in good agreement with the analysis. -
17. Key Words (Suggsted by Authorls)) 18. Distribution Statement
Stator contouring Unclassified - unlimitedEndwall contouring STAR Category 07Axial turbineStator performance
19. Security Claif. (of this report) 20. Security Clanif. (of this page) 21. No. of Pages 22. Price'
Unclassified Unclassified 24 A02
For sale by the National Technical Information Service, Springfield, Virginia 22161 SIA-LangleY. 1982
--:........ ..-... '.........