narragansett bay commission
TRANSCRIPT

Comprehensive Annual Financial Report
For the Fiscal Year Ended June 30, 2015
Narragansett Bay Commission
RHODE island


Narragansett Bay Commission Rhode Island
Comprehensive Annual Financial Report Fiscal Year Ended June 30, 2015
Prepared by: The Division of Administration and Finance of the Narragansett Bay Commission

This page was intentionally left blank.

Narragansett Bay Commission’s Mission Statement
“The mission of the Narragansett Bay Commission is
to maintain a leadership role in the protection and enhancement of water quality
in Narragansett Bay and its tributaries by providing safe and reliable
wastewater collection and treatment services to its customers at a reasonable cost.”

This page was intentionally left blank.

NARRAGANSETT BAY COMMISSION COMPREHENSIVE ANNUAL FINANCIAL REPORT
For the Fiscal Year Ended 2015
Table of Contents
Introductory Section Transmittal letter ................................................................................................................................................... 1‐8 GFOA Certificate of Achievement ............................................................................................................................. 9 List of Appointed Officials ....................................................................................................................................... 10
Organization Chart .................................................................................................................................................. 11 Service Area Map ..................................................................................................................................................... 12 Financial Section Independent Auditor’s Report ........................................................................................................................... 13‐15 Management’s Discussion and Analysis (Unaudited) ....................................................................................... 16‐23 Basic Financial Statements Statement of Net Position ............................................................................................................................ 24‐25
Statement of Revenues, Expenses and Changes in Net Position ...................................................................... 26 Statement of Cash Flows ............................................................................................................................. 27‐28
Notes to Financial Statements ..................................................................................................................... 29‐56 Required Supplementary Information (Unaudited) Schedule of Changes in Net Position Liability and Related Ratios – Non‐Union Defined Benefit Plan ...... 57‐58
Schedule of Employer Contributions ‐ Non‐Union Defined Benefit Plan .......................................................... 59 Schedule of Investment Returns – Non‐Union Defined Benefit Plan ................................................................ 60
Schedule of Proportionate Share of the Net Pension Liability ‐ Employees’ Retirement System RI ................. 61 Schedule of Contribution ‐ Employees’ Retirement System RI ......................................................................... 62 Other Supplementary Information Schedule of Expenses ‐ Budget and Actual (budgetary basis) ..................................................................... 63‐65
Combining Schedule of Net Position ........................................................................................................... 66‐67 Combining Schedule of Revenues, Expenses and Changes in Net Position ................................................. 68‐69 Statistical Section (Unaudited) Introduction ............................................................................................................................................................. 70 Net Position by Component ................................................................................................................................... 71 Changes in Net Position ........................................................................................................................................... 72
Revenue by Source .................................................................................................................................................. 73 Expenses by Function ............................................................................................................................................. 74 User Fee Revenue by Customer Type .................................................................................................................... 75 Residential Sewer Rates ......................................................................................................................................... 76
Non‐Residential Sewer Rates ................................................................................................................................. 77 Comparative Sewer Rates – RI Municipalities ........................................................................................................ 78 Principal Commercial Users .................................................................................................................................... 79 Ratios of Outstanding Debt .................................................................................................................................... 80 Debt Service Coverage ............................................................................................................................................. 81
Demographic Statistics ............................................................................................................................................ 82 Principal Employers ................................................................................................................................................ 83 Operating Indicators by Division ........................................................................................................................... 84 Budgeted Employees by Activity ............................................................................................................................ 85 (Continued)

NARRAGANSETT BAY COMMISSION COMPREHENSIVE ANNUAL FINANCIAL REPORT
For the Fiscal Year Ended 2015
Table of Contents
Compliance Section Report on Internal Control Over Financial Reporting and on Compliance and Other Matters Based on an Audit of Financial Statements Performed in Accordance with Government Auditing Standards .......................................................................................... 86‐87 Schedule of Travel ............................................................................................................................................ 88‐89

INTRODUCTORY SECTION
INTRODUCTORY SECTION

This page was intentionally left blank.

Transmittal Letter
1
The Narragansett Bay Commission Vincent J. Mesolella One Service Road Chairman Providence, Rhode Island 02905 Raymond J. Marshall, P.E. 401 • 461 • 8848 Executive Director 401 • 461 • 6540 FAX http://www.narrabay.com SEPTEMBER 8, 2015 TO THE CHAIRMAN AND THE COMMISSIONS OF NARRAGANSETT BAY COMMISSION: We are pleased to submit the Comprehensive Annual Financial Report (CAFR) for the Narragansett Bay Commission (NBC) for the fiscal year ended June 30, 2015. The purpose of the report is to provide a broad financial picture of the NBC to the Board of Commissioners, NBC’s customers, the public, and other interested parties. State law requires that related parties of the State of Rhode Island publish a complete set of audited financial statements within three months of the close of each fiscal year. This report is published to fulfill that requirement for the fiscal year ended June 30, 2015. This Comprehensive Annual Financial Report (CAFR) was prepared by the NBC’s staff following guidelines set forth by the Governmental Accounting Standards Board (GASB). Management assumes full responsibility for the completeness and reliability of the information contained in this report, based upon a comprehensive framework of internal controls that it has established for this purpose. Because the cost of internal control should not exceed anticipated benefits, the objective is to provide reasonable, rather than absolute, assurance that the financial statements are free of any material misstatements. Hague, Sahady & Co. have issued an unqualified (“clean”) opinion on the NBC’s financial statements for the fiscal year ended June 30, 2015. The Independent Auditor’s report is located in the front of the financial section of this report. Management’s Discussion and Analysis (MD&A) immediately follows the Independent Auditor’s report and in a narrative form provides an introduction, overview, and analysis of the financial statements. The MD&A complements and should be read in conjunction with this letter of transmittal. PROFILE OF NARRAGANSETT BAY COMMISSION The NBC is a non‐profit public corporation established in 1980 by an act of the Rhode Island Legislature. The NBC was created for purposes of acquiring, operating and upgrading the metropolitan Providence wastewater collection and treatment facilities. NBC assumed operational control of the Fields’ Point Waste Water Treatment Facility on May 1, 1982. On June 27, 1991, the Governor of the State of Rhode Island signed into law legislation mandating the merger of the NBC and the former Blackstone Valley District Commission (BVDC). The merger became effective on January 1, 1992.

Transmittal Letter
2
PROFILE OF NARRAGANSETT BAY COMMISSION (Continued) The NBC is a Related Organization of the State of Rhode Island for financial reporting purposes. Accordingly, the financial statements of the NBC will not be included in the State of Rhode Island’s annual financial report. A 19‐member Board of Commissioners (Board) governs the NBC. The Board represents the municipalities in the service area with nine appointments, and in addition there are ten gubernatorial appointments. Empowered with responsibilities that range from ensuring that the NBC operates a balanced budget, to approving contracts for improving and sustaining the treatment facilities and wastewater collection system, the Board meets regularly to guide the direction of the NBC. The NBC is regulated by the Rhode Island Public Utilities Commission (PUC). Accordingly, both the Board and the PUC must authorize adjustments to sewer user rates. NBC funds its operations and maintenance costs as well as debt service. In addition, the NBC’s Citizen Advisory Committee (CAC) is a diverse group of dedicated individuals, representing municipalities throughout the NBC’s service area, industrial and residential users, environmental organizations and the general public. The CAC also advises the Board on matters pertaining to sewer usage fees, sewer construction, pretreatment, public awareness and education. The NBC prepares its operating budget on a modified cash basis. Accordingly, certain non‐cash expenses such as depreciation and amortization are not provided for in the operating budget. The budget includes the debt service principal payments on all debt, including debt issued to finance capital projects included in NBC’s Capital Improvement Program (CIP). A line item budget is maintained for each individual section or program. Finance staff reviews the budget versus actual status on a monthly basis. All budget transfers must be approved by the Division Director and the Director of Administration and Finance. The Executive Director notifies the NBC’s Finance Committee of these adjustments on a monthly basis. In addition, the Finance Committee reviews and approves the monthly financial statements and the budget versus actual expenses before they are presented at the regularly scheduled Board Meeting. NBC provides reliable, cost‐effective wastewater collection and treatment services to over 360,000 residents and approximately 7,750 businesses in the metropolitan Providence, and Blackstone Valley areas. These communities include: Providence, North Providence, Johnston, Pawtucket, Central Falls, Cumberland, Lincoln, the northern portion of East Providence and small sections of Cranston and Smithfield. NBC’s customer base consists of residential and non‐residential customer classes, which include commercial and industrial users. Of the eight major communities, Providence, Pawtucket and North Providence represent more than 71% of the accounts. The residential customer class has approximately 75,900 accounts, while the non‐residential class has approximately 7,750 accounts.

Transmittal Letter
3
PROFILE OF NARRAGANSETT BAY COMMISSION (Continued)
The following chart illustrates the distribution of accounts across the eight communities.
Percentage of Accounts by Community
East Providence4%
Providence40%
Pawtucket20%
Cumberland8%
North Providence11%
Johnston7%
Lincoln7%
Central Falls3%
LOCAL ECONOMY According to the Rhode Island Department of Economic Development, the economic base of Rhode Island has shifted from manufacturing and goods to service industries over the last decades. It should also be mentioned that one of the primary service industries in Rhode Island is tourism, which is largely focused on recreational activities on and around Narragansett Bay. The chart below shows estimated employment by industry for the calendar year 2013.
Estimated Employment by Industry
Administrative and Waste Services,
5.53%
Arts, Entertainment, Recreation,
Accommodation & Food Services,
10.65%
Educational, Health Care & Social
Assistance, 19.59%Farm Employment, 0.27%Federal Civilian,
1.71%
Finance, Insurance, Real Estate, Rental &
Leasing, 9.76%
Local Government, 5.46%
Management of Companies and
Enterprises, 1.96%
Manufacturing, 7.05%
Military, 1.26%
Other, 12.80%
Professional, Scientific, Information & Technical Services,
8.03%
Retail Trade, 9.24%
State Government, 3.59%
Wholesale Trade, 3.10%
*Source: United States Regional Economic Analysis Project Industries by State 2013

Transmittal Letter
4
LOCAL ECONOMY (Continued) Employment in Rhode Island reflects the national trend towards increasing employment in the services sector. The cart below illustrates Rhode Island’s average annual earnings per employee in each major industry for 2013.
Management of Companies and EnterprisesFederal Civilian
InformationLocal Government
Finance & Insurance,Wholesale Trade
State GovernmentManufacturing
Professional, Scientific, & Technical ServicesMilitary
Other/Suppressed IndustriesHealth Care & Social Assistance
Educational ServicesAdministrative and Waste Services
Other Services (except Public Administration)Retail Trade
Real Estate, Rental & LeasingAccommodation & Food ServicesArts, Entertainment & Recreation
Farm
*Source: US Regional Economic Analysis Project. Average Earnings per Job by Major Industry, Rhode Island 2013 The graph below, compiled from data from the Bureau of Labor Statistics, shows historical unemployment figures over the past ten years for Rhode Island. Rhode Island unemployment rates increased significantly from 2008 to a peak rate of 11.8% in 2010 and have since declined to a rate of 7.7% in 2014.
Rhode Island Average Annual Unemployment Rates
-3%
-2%
-1%
0%
1%
2%
3%
4%
0%
2%
4%
6%
8%
10%
12%
14%
2005 2006 2007 2008 2009 2010 2011 2012 2013 2014
Perc
en
t D
ecre
ase /
Incre
ase
Rh
od
e I
sla
nd
Un
em
plo
ym
en
t R
ate
s
RI Unemployment Rate % Change
*Source: Bureau of Labor Statistics. RI state‐wide Unemployment Rates Seasonally Adjusted

Transmittal Letter
5
LOCAL ECONOMY (Continued) The graph below shows the median household income in Rhode Island for the years 2004‐2013 compared to national statistics. With the exception of 2011, Rhode Island’s median household income has been higher than the national median household income.
Median Household Income ‐ Rhode Island vs. United States
$-
$10,000
$20,000
$30,000
$40,000
$50,000
$60,000
2004 2005 2006 2007 2008 2009 2010 2011 2012 2013RI Median Household Income US Median Household Income
*Source: United States Census Bureau – Historical Income Tables LONG‐TERM FINANCIAL PLANNING The NBC maintains and updates a long‐term financial model that takes into consideration the Capital Improvement Program (CIP), cash flows, NBC’s annual operating revenues and expenses, debt service coverage, State Revolving Fund capacity and other relevant items. The model is used to develop and support financing strategies that will provide stability, continuity and minimize rate increases. MAJOR INITIATIVES NBC’s current CIP identifies 60 projects totaling approximately $155.3 million, either in progress, to be initiated, or to be completed during the fiscal years of 2017 ‐2021. In addition, the CIP includes $33.6 million in expenditures in fiscal year 2016, for a total of approximately $188.9 million over the six‐year period. Expenditures on these projects are necessary in order to comply with current and future regulatory requirements, take advantage of technological changes, and ensure the integrity of the NBC’s infrastructure.

Transmittal Letter
6
MAJOR INITIATIVES (Continued)
The most significant project included in NBC’s 2017‐2021 CIP is the third and final phase of the federally mandated Combined Sewer Overflow (CSO) Abatement Program. The CSO Phase III Facilities account for $104.3 million or 67% of the total CIP expenses during the five‐year window. The Consent Agreement between NBC and the Rhode Island Department of Environmental Management (RIDEM) requires completion of preliminary design within one year following completion of Phase II and final design within one year of RIDEM’s approval of preliminary design. The pre‐design cost projection for the proposed alternative is $815 million.
Expenditures by Major Project (In Millions)
$0
$10
$20
$30
$40
$50
$60
$70
$80
FY 2017 FY 2018 FY 2019 FY 2020 FY 2021
CSO Phase III Facilities Other
FUNDING OF THE CIP In FY 2016, NBC plans to fund the CIP with approximately $14.0 million in Restricted Funds and also two loans totaling $76.3 million from the Rhode Island Infrastructure Bank (RIIB) (formerly known as Rhode Island Clean Water Finance Agency (RICWFA). NBC’s long‐term financing strategy includes funding as much as possible from the RIIB. Accordingly, this plan is based on loan capacity figures provided by RIIB to the extent that additional capital funding is needed. As a result of the CSO Phase III Facilities reevaluation process in FY 2015, NBC’s programmed capital needs during the next several years are significantly lower than previously projected. The long‐term model reflects the use of $121.3 million in existing and planned borrowings from the RIIB and the use of $90.9 million in restricted funds or “pay‐as‐you‐go” capital. The updated cash flows do not reflect any new borrowings from RIIB during the fiscal years 2017 through 2020 or the issuance of any revenue bonds during the fiscal years 2016 through 2021. The actual timing and the type of debt issuance will be determined based upon cash flows, market conditions, RIIB loans and other factors. The graph on the next page illustrates the projected sources of funds for the fiscal years 2016 through 2021.

Transmittal Letter
7
FUNDING OF THE CIP (Continued) Sources of Funds
$‐
$10.0
$20.0
$30.0
$40.0
$50.0
$60.0
$70.0
$80.0
FY 2016 FY 2017 FY 2018 FY 2019 FY 2020 FY 2021
Millions
Capital Account Restricted Account 2014 Series A (SRF)2015 Series B (SRF) 2016 Series A (SRF) New Revenue Bonds (SRF)
IMPACT OF CIP ON DEBT SERVICE Since the CIP is financed primarily through the issuance of long‐term debt, the capital program’s primary impact on the operating budget is the payment of the associated principal and interest. Overall, debt service is anticipated to increase from approximately $46.6 million in FY 2016 to approximately $49.6 million in FY 2021. The chart below shows debt service as a percentage of actual and projected revenues through FY 2021. Annual debt service as a percentage of total revenue is projected to decline from 47.5% in FY 2016 to 44.8% in FY 2021. All debt service projections are based on a number of assumptions including the cash flow estimates outlined in the CIP.
Debt Service vs. Annual Revenue
30%
35%
40%
45%
50%
55%
60%
$‐
$20,000,000
$40,000,000
$60,000,000
$80,000,000
$100,000,000
$120,000,000
FY 2012 FY 2013 FY 2014 FY 2015 FY 2016 FY 2017 FY 2018 FY 2019 FY 2020 FY 2021
% Deb
t Service
Annu
al Reven
ue
Approved Revenue Debt Service

AWARDS AND ACKNOWLEDGEMENTS
The Government Finance Officers Association of the United States and Canada (GFOA) awardeda Certificate of Achievement for Excellence in Finance Reporting to the NBCfor its CAFRfor thefiscal year ended June 3D, 2014. This was the thirteenth consecutive year that the NBC hasreceived this prestigious award. In order to be awarded a Certificate of Achievement, the NBCissued an easily readable and efficiently organized CAFR which satisfied both generallyaccepted accounting principles and applicable legal requirements.
A Certificate of Achievement is valid for a period of one year only. We believe that our currentCAFR meets the high standards of the Certificate of Achievement Program's requirement andwe are submitting it to the GFOAto determine its eligibility for another certificate.
In addition, the NBC received the GFOA's Distinguished Budget Presentation Award for itsannual budget document for the fiscal year beginning July 1, 2014. The GFOA also awarded NBCSpecial Performance Measures Recognition and Special Capital Recognition. In order to qualifyfor the Distinguished Budget Presentation award, the budget document had to be judgedproficient as a policy document, a financial plan, an operations guide, and a communicationsdevice.
The preparation of this report would not have been possible without the efficient anddedicated services of the entire staff of the NBC's Division of Administration and Finance. Creditalso must be given to the Chairman and the Board of Commissioners for their unfailing supportfor maintaining the highest standards of professionalism in the management of the NBC'sfinances.
Respectfully Submitted,
tt~~ t~Executive Director Director of Administration and Finance
~4Leah E. Foster, CPAAccounting Manager
Transmittal Letter 8

Government Finance Officers Association
Certificate of
Achievement
for Excellence
in Financial
Reporting
Presented to
Narragansett Bay Commission
Rhode Island
For its Comprehensive
Annual Financial Report
for the Fiscal Year Ended
June 30, 2014
Executive Director/CEO
9

NARRAGANSETT BAY COMMISSION
BOARD OF COMMISSIONERS
Vincent J. Mesolella, Jr. Chairman
Angelo S. Rotella, Esq., Vice Chairman Robert P. Andrade, Treasurer
James S. Bennett Dr. Richard Burroughs
Dr. Bruce Campbell Mario Carlino
Michelle R. DeRoche Michael DiChiro, Esq. Jonathan K. Farnum Seth H. Handy, Esq.
Joseph Kimball Paul Lemont, Esq.
Ronald Leone John MacQueen
Joan P. Milas Alessandro Montanari
Alan Nathan Richard D. Worrell
10

Narragansett Bay Commission Organization Chart
Construction Services
11 Positions
Citizens Advisory Committee 15 Members Executive Director/
Secretary of the Board
Board of Commissioners 19 Members
Director Executive
Affairs
Director Construction
Services
Public Affairs 3 Positions
Director Administration
& Finance
Human Resources 4 Positions
Finance 5 Positions
Accounting 10 Positions
Information Technology 12 Positions
Customer Service
25 Positions
Purchasing 4 Positions
General Admin. 0 Positions
Director Operations & Engineering
Interceptor Maintenance 20 Positions
Engineering 9 Positions
Field's Point WWTF
59 Positions
Bucklin Point WWTF
43 Positions
Director Planning, Policy
& Regulation
Planning 5 Positions
Pretreatment 14 Positions
Laboratory 17 Positions
Enviro. Safety & Tech. Assistance
4 Positions
Enviro. Monitoring & Data Analysis
17 Positions
Planning, Policy & Regulation
57 Positions
Operations & Engineering 131 Positions
Executive Affairs 13 Positions
Administration & Finance 60 Positions
Construction Services
11 Positions
Legal 5 Positions
Government Affairs
1 Position
Labor Relations 1 Position
Executive Affairs
3 Positions
3 Positions
11

This page was intentionally left blank.
11
11
11

Narragansett Bay Commission Service Area
12

This page was intentionally left blank.

Photo by Patty Pinilla: Narragansett Bay
FINANCIAL SECTION

This page was intentionally left blank.
HAGUE, SAHADY & CO., P.C.….…..
CERTIFIED PUBLIC ACCOUNTANTS 126 President Avenue
Fall River, MA 02720 TEL. (508) 675-7889 FAX (508) 675-7859
www.hague-sahady.com Independent Auditor’s Report
To the Board of Commissioners Narragansett Bay Commission Providence, Rhode Island
We have audited the accompanying financial statements of the Narragansett Bay Commission (NBC), as of and for the year ended June 30, 2015, and the related notes to the financial statements, which collectively comprise NBC’s basic financial statements as listed in the table of contents. Management’s Responsibility for the Financial Statements Management is responsible for the preparation and fair presentation of these financial statements in accordance with accounting principles generally accepted in the United States of America; this includes the design, implementation, and maintenance of internal control relevant to the preparation and fair presentation of financial statements that are free from material misstatement, whether due to fraud or error. Auditor’s Responsibility Our responsibility is to express opinions on these financial statements based on our audit. We conducted our audit in accordance with auditing standards generally accepted in the United States of America and the standard applicable to financial audits contained in Governmental Auditing Standards issued by the Comptroller General of the United States. Those standards require that we plan and perform the audit to obtain reasonable assurance about whether the financial statements are free from material misstatement. An audit involves performing procedures to obtain audit evidence about the amounts and disclosures in the financial statements. The procedures selected depend on the auditor’s judgment, including the assessment of the risks of material misstatement of the financial statements, whether due to fraud or error. In making those risk assessments, the auditor considers internal control relevant to the entity’s preparation and fair presentation of the financial statements in order to design audit procedures that are appropriate in the circumstances, but not for the purpose of expressing an opinion on the effectiveness of the entity’s internal control. Accordingly, we express no such opinion. An audit also includes evaluating the appropriateness of accounting policies used and the reasonableness of significant accounting estimates made by management, as well as evaluating the overall presentation of the financial statements. We believe that the audit evidence we have obtained is sufficient and appropriate to provide a basis for our audit opinions.
13

Opinions
In our opinion, the financial statements referred to above present fairly, in all material respects, the respective financial position of NBC, as of June 30, 2015, and the respective changes in financial position and cash flows thereof for the year then ended in accordance with accounting principles generally accepted in the United States of America.
Emphasis of Matter
As discussed in Note 2 to the financial statements, in 2015, NBC adopted new accounting guidance, GASB No. 67, Financial Reporting for Pension Plans and GASB No. 68, Accounting and Financial Reporting for Pensions. Our opinion is not modified with respect to this matter.
Other Matters
Required Supplementary Information
Accounting principles generally accepted in the United States of America require that the management’s discussion and analysis and Pension Plan information as listed on the table of contents, be presented to supplement the basic financial statements. Such information, although not a part of the basic financial statements, is required by the Governmental Accounting Standards Board, who considers it to be an essential part of financial reporting for placing the basic financial statements in an appropriate operational, economic, or historical context. We have applied certain limited procedures to the required supplementary information in accordance with auditing standards generally accepted in the United States of America, which consisted of inquiries of management about the methods of preparing the information and comparing the information for consistency with management’s responses to our inquiries, the basic financial statements, and other knowledge we obtained during our audit of the basic financial statements. We do not express an opinion or provide any assurance on the information because the limited procedures do not provide us with sufficient evidence to express an opinion or provide any assurance.
Other Information
Our audit was conducted for the purpose of forming opinions on the financial statements that collectively comprise NBC’s basic financial statements. The schedule of expenses - budget to actual, the combining schedule of net position, the combining schedule of revenue, expenses, and changes in net position, and the schedule of travel expenses are presented for purposes of additional analysis and are not a required part of the basic financial statements.
The schedule of expenses - budget to actual, the combining schedule of net position, the combining schedule of revenue, expenses, and changes in net position, and the schedule of travel expenses are the responsibility of management and were derived from and relate directly to the underlying accounting and other records used to prepare the basic financial statements. Such information has been subjected to the auditing procedures applied in the audit of the basic financial statements and certain additional procedures, including comparing and reconciling such information directly to the underlying accounting and other records used to prepare the basic financial statements or to the basic financial statements themselves, and other additional procedures in accordance with auditing standards generally accepted in the United States of America. In our opinion, the schedule of expenses - budget to actual, the combining schedule of net position, the combining schedule of revenue, expenses, and changes in net position, and the schedule of travel expenses are fairly stated, in all material respects, in relation to the basic financial statements as a whole.
14

The introductory and statistical sections have not been subjected to the auditing procedures applied in the audit of the basic financial statements and, accordingly, we do not express an opinion or provide any assurance on them.
Other Reporting Required by Government Auditing Standards In accordance with Government Auditing Standards, we have also issued our report dated September 8, 2015, on our consideration of NBC’s internal control over financial reporting and on our tests of its compliance with certain provisions of laws, regulations, contracts, and grant agreements and other matters. The purpose of that report is to describe the scope of our testing of internal control over financial reporting and compliance and the results of that testing, and not to provide an opinion on internal control over financial reporting or on compliance. That report is an integral part of an audit performed in accordance with Government Auditing Standards in considering NBC’s internal control over financial reporting and compliance.
Fall River, Massachusetts September 8, 2015
15

This page was intentionally left blank.

NARRAGANSETT BAY COMMISSION MANAGEMENT’S DISCUSSION AND ANALYSIS
MD&A
16
Our discussion and analysis of the Narragansett Bay Commission’s financial performance provides an overview of NBC’s financial activities for the fiscal year ended June 30, 2015. It should be read in conjunction with the transmittal letter beginning on page 1 and NBC’s basic financial statements, which begin on page 24. FINANCIAL STATEMENTS Our discussion and analysis is intended to serve as an introduction to the NBC’s basic financial statements, which consist of the financial statements and Notes to the Financial Statements. This report also contains other supplementary information in addition to the basic financial statements. The financial statements report information about the NBC based upon an accrual accounting method similar to those used by private sector companies. The financial statements include a Statement of Net Position; Statement of Revenues, Expenses, and Changes in Net Position; Statement of Cash Flows; and Notes to the Financial Statements. The Statement of Net Position presents the financial position of the NBC on the accrual basis of accounting, with the exception of fine assessments and monitoring fees that are recorded on a cash basis. Over time, increases or decreases in net position may serve as a useful indicator of whether the financial position of the NBC is improving or deteriorating. All the current year’s revenues and expenses are accounted for in the Statement of Revenues, Expenses, and Changes in Net Position. This statement measures the success of the NBC’s operations over the past year and can be used to determine whether the NBC has successfully recovered all its costs through its user fees and other charges. The final required financial statement is the Statement of Cash Flows. The purpose of this statement is to provide information about the changes in cash and cash equivalents, resulting from operating, capital and related financing, non‐capital financing, and investing activities. This statement presents cash receipts and cash disbursement information, without consideration of the earnings event, when an obligation arises, or depreciation of assets. The Notes to the Financial Statements provide additional information that is essential for a full understanding of the data provided in the statements. The Notes to the Financial Statements can be found on pages 29‐56 of this report. FINANCIAL HIGHLIGHTS The NBC’s financial condition is strong and the NBC’s performance for the current year exceeded the budget. The following are the key financial highlights:
NBC’s FY 2015 total net position was $423,709,343 which is an increase of $7,925,319. Of this amount, $76,548,661 (unrestricted) may be used to meet NBC’s ongoing obligations.

NARRAGANSETT BAY COMMISSION MANAGEMENT’S DISCUSSION AND ANALYSIS (CONTINUED)
MD&A
17
FINANCIAL HIGHLIGHTS (Continued)
The total change in net position was $27,838,073 in FY 2015 compared to $25,062,307 in FY 2014, which is an increase of $2,775,766.
During FY 2015, NBC implemented GASB 67 and 68 which changed the Statement of Net Position to include total net pension liability as a liability as opposed to the previously reported Net Pension Obligation under GASB 25 and 27. The new implementation also changed the presentation of the Notes to the Financial Statements and the Required Supplementary Information (RSI).
NBC restated the beginning net position by $(19,912,754) for the implementation of GASB 68, which requires Net Pension Liability to be recorded in the Statement of Net Position.
Total revenues increased from $92,335,532 in FY 2014 to $95,190,225 in FY 2015, which is a $2,854,693 increase.
Total expenses decreased from $67,354,190 in FY 2014 to $67,352,152 in FY 2015, which is a $2,038 decrease.
Debt Service Coverage calculated as gross revenue, less operating expenses exclusive of depreciation and amortization, divided by total debt service was 144% for fiscal year 2015, exceeding the 125% debt service coverage level recommended by credit rating agencies.
Effective September 19, 2014, NBC raised its flat fees and consumption fees by 3.97%.
In FY 2015, NBC successfully refunded both the 2005 Series A and the 2007 Series A Wastewater System Revenue Bonds.
FINANCIAL ANALYSIS
NET POSITION Net position over time may serve as a useful indicator of a government’s financial position. In the case of NBC, assets plus deferred outflows of resources exceeded liabilities plus deferred inflows of resources by $423,709,343 as of June 30, 2015. The FY 2015 change in net position was $27,838,073. Of this amount, $19,912,754 was used to restate Net Position for the implementation of GASB 68. The remaining $7,925,319 represents an increase in total net position and demonstrates that the financial position of NBC is improving.

NARRAGANSETT BAY COMMISSION MANAGEMENT’S DISCUSSION AND ANALYSIS (CONTINUED)
MD&A
18
FINANCIAL ANALYSIS (Continued)
Condensed Statement of Net Position
Assets 2015 2014Current assets 39,495,708$ 74,003,337$ Restricted assets 74,973,824 66,879,869 Capital assets (net) 952,446,642 931,850,699 Other assets 213,413
Total assets 1,066,916,174 1,072,947,318
Deferred Outflows of ResourcesDeferred Outflows of Resources 5,558,781 488,263
Total deferred outflows 5,558,781 488,263
LiabilitiesCurrent liabilities 39,573,560 47,280,741 Noncurrent liabilities 606,847,938 610,098,671
Total liabilities 646,421,498 657,379,412
Deferred Inflows of ResourcesDeferred Inflows of Resources 2,344,114 272,145
Total deferred inflows 2,344,114 272,145
Net PositionNet investment in capital assets 347,106,277 330,483,472 Restricted 54,405 72,426 Unrestricted 76,548,661 85,228,126
Total net position 423,709,343$ 415,784,024$
The condensed statement above reflects a decrease in current assets of $34,507,629 from FY 2014 to FY 2015. This decrease reflects a reduction in the amount due from the Rhode Island Infrastructure Bank (RIIB) related to unspent proceeds from NBC’s $45,000,000 borrowing on March 6, 2014. In FY 2015, the NBC shows restricted assets of $74,973,824. Of this amount $54,405 is restricted for future environmental enforcement activities in accordance with Rhode Island General Law Section 46‐25‐38.1. These funds are held in a restricted cash account and are reflected as a restricted net position. In addition, $39,986,303 is restricted cash held in the Debt Service Fund for debt service and debt service coverage in accordance with the Report and Order of the Rhode Island Public Utilities Commission (PUC) as well as the Trust Indenture. As of June 30, 2015, the NBC’s restricted cash account for future acquisition and construction of capital assets had a balance of $26,935,758. Also, $3,497,335 is restricted in the Debt Service Reserve Fund and $4,500,023 is restricted for Operation Reserve for Revenue Stability Fund.

NARRAGANSETT BAY COMMISSION MANAGEMENT’S DISCUSSION AND ANALYSIS (CONTINUED)
MD&A
19
FINANCIAL ANALYSIS (Continued)
There is also a significant increase in Capital assets (net) of $20,595,943 from FY 2014 to FY 2015. This increase is the result of substantial progress that NBC made in FY 2015 on the initiatives identified in the Capital Improvement Program (CIP).
In FY 2015, the total deferred outflows of resources increased from $488,263 in FY 2014 to $5,558,781 in FY 2015. The increase of $5,070,518 was a result of implementation of GASB 68 relating to pensions and an increase to loss on refunding of debt.
In FY 2015, the current liabilities decreased by $7,707,181. This is the result of a decrease in the current portion of the contracts payable. The non‐current liabilities decreased by $3,250,733 which was due to the payment of debt service and the refunding of two bond issues.
In FY 2015, the total deferred inflows of resources increased from $272,145 in FY 2014 to $2,344,114 in FY 2015. The increase of $2,071,969 was a result of the implementation of GASB 68 relating to pensions.
The largest portion of the NBC’s net position, 82%, reflects its net investment in capital assets. The NBC uses these capital assets to provide wastewater treatment and collection services to its customers. Consequently, only the unrestricted net position is available for future spending. Although the NBC’s investment in its capital assets is reported net of related debt, it should be noted that the resources needed to repay this debt must be provided from other sources, since the capital assets themselves cannot be used to liquidate these liabilities. NBC ended the FY 2015 with an increase in net position of $27,838,073. NBC has included a Condensed Statement of Revenues, Expenses and Changes in Net Position on the following page.
Net Position As of June 30, 2015
82%
0%
18%
Net investment in capital assets Restricted Unrestricted

NARRAGANSETT BAY COMMISSION MANAGEMENT’S DISCUSSION AND ANALYSIS (CONTINUED)
MD&A
20
FINANCIAL ANALYSIS (Continued)
Condensed Statement of Revenues, Expenses and Changes in Net Position
2015 2014Operating Revenues User fees 92,007,299$ 89,182,519$ Pretreatment 1,076,481 1,095,551
Septage income 336,037 310,136 Late charge penalties 999,867 1,013,240 Other operating revenues 596,158 546,569
Non‐operating Revenue 174,383 187,517 Total revenue 95,190,225 92,335,532
Operating ExpensesPersonnel services 20,946,735 21,090,749 General and administration 979,426 961,936 Operations and maintenance 6,930,801 7,081,179 Depreciation and amortization 12,983,750 11,812,153 Contractual Services 7,469,034 8,036,730 Miscellaneous 846,462 795,751
Non‐operating Expenses 17,195,944 17,575,692 Total expenses 67,352,152 67,354,190
Net income (loss) before capital contributions 27,838,073 24,981,342
Capital Contributions ‐ 80,965
Change in net position 27,838,073 25,062,307
Total Net Position ‐ beginning of year 415,784,024 396,866,751
Net Position Restatement (19,912,754) (6,145,034)
Total Net Position ‐ end of year 423,709,343$ 415,784,024$
REVENUES User fees are NBC’s primary source of revenue, representing approximately 97% of total operating revenues. Fiscal Year 2015 user fee revenue was $92,007,299 which is $2,824,780 more than the prior year. The increase in user fees is the result of a 3.97% rate increase effective September 19, 2014. These PUC approved rate increases applied to both consumption and flat fees. In FY 2015, the non‐user fee operating revenue increased by $43,047 primarily as the result of the increase in other operating revenues and septage income.

NARRAGANSETT BAY COMMISSION MANAGEMENT’S DISCUSSION AND ANALYSIS (CONTINUED)
MD&A
21
FINANCIAL ANALYSIS (Continued)
Operating Revenue for FY 2015
Septage income Pretreatment
Late charge penalties Other operating revenues
Residential Non‐Residential
User Fees Residential57%
Non-Residential
43%
EXPENSES
Total expenses in FY 2015 decreased $2,038 over the prior year. Operating expenses were $377,710 higher in FY 2015 than the prior year. The increase in operating expenses was driven by a number of factors. Most notably, Depreciation expense increased by $1,171,597 as NBC finished a number of major capital projects. These projects were reclassified to completed projects and NBC began to depreciate them. The higher depreciation expense was offset partially by a $144,014 decrease in Personnel services resulting from the change in pension expense as prescribed to GASB 68. In addition, Contractual services decreased by $567,696 in FY 2015 due to lower biosolids disposal costs resulting from lower dry ton production at Fields Point. Non‐operating expenses decreased $379,748 as a result of decreased interest expense on bonds and notes payable and bond and note fees.
Operating Expenses for FY 2015 and FY 2014
$0
$5
$10
$15
$20
$25
FY 2015 FY 2014
Million
s

NARRAGANSETT BAY COMMISSION MANAGEMENT’S DISCUSSION AND ANALYSIS (CONTINUED)
MD&A
22
FINANCIAL ANALYSIS (Continued)
NET POSITION RESTATEMENT
The FY 2014 net position was restated for the implementation of GASB 65. The FY 2015 net position was restated for the implementation of GASB 68.
CAPITAL ASSETS AND DEBT ADMINISTRATION
CAPITAL ASSETS
At the end of FY 2015, the NBC had $952.4 million invested in net capital assets. This amount represents an increase of more than $20.6 million, or 2.2% over last year. The following table summarizes the NBC’s capital assets and changes therein, for the years ended June 30, 2015 and June 30, 2014.
Capital Assets
2015 2014Capital Assets
Land 2,754,407$ 2,754,407$ Plant and equipment 88,933,709 86,302,765 Capital projects completed 708,054,132 646,648,276 Construction in progress 329,874,143 360,531,394
1,129,616,391 1,096,236,842 Less accumulated depreciation (177,169,749) (164,386,143)
Net capital assets 952,446,642$ 931,850,699$
Capital Assets June 30, 2015
Land.2%
Plant and equipment
7.9%
Capital projects completed62.7%
Construction in progress29.2%

NARRAGANSETT BAY COMMISSION MANAGEMENT’S DISCUSSION AND ANALYSIS (CONTINUED)
MD&A
23
CAPITAL ASSETS AND DEBT ADMINISTRATION (Continued)
LONG‐TERM DEBT During fiscal year 2015, the NBC successfully refunded both the 2005 Series A and the 2007 Series A Wastewater System Revenue Bonds. The combined net present value savings of these two refundings was $10.1 million. In addition NBC’s FY 2015 debt service expense was a net $0.6 million lower on these bond issues as a result. Due to timing issues, the FY 2015 planned borrowing through the RIIB did not close during the fiscal year and therefore NBC did not have any associated debt service. NBC continues to benefit from historic low short‐term interest rates and realized interest savings of more than $1.6 million on the Variable Rate Demand Bonds (VRDBs). The combination of these events resulted in debt service expense that was $3.1 million less than the budgeted amount. The total debt to net capital asset ratio is 64% and 68% for fiscal years ending June 30, 2015 and 2014, respectively. Standard and Poor’s performed credit reviews as part of the bond refundings in September 2014 and March 2015. As a result of their review, they assigned NBC’s refunding bonds an AA‐ credit rating and reaffirmed NBC’s underlying rating on outstanding wastewater system revenue bonds as AA‐ with a stable outlook. Standard and Poor’s also affirmed the AAA/A‐1+ rating on the NBC’s 2008 VRDBs, based on the application of joint criteria with NBC’s AA‐ and the letter of credit provided by U.S. Bank N.A. This credit rating will ensure NBC’s continued access to credit markets and is advantageous for the marketability of NBC’s VRDBs. For additional information related to capital assets or long‐term debt see the Notes to the Financial Statements. The Notes to the Financial Statements can be found on pages 35‐40 of this report. ECONOMIC FACTORS AND NEXT YEAR’S BUDGET AND RATES NBC is governed by a 19‐member Board of Commissioners (Board) and is also regulated by the Rhode Island Public Utilities Commission (PUC). Both NBC’s Board and the PUC must authorize all adjustments to user charges. On June 29, 2015 the PUC approved a 2.37% user fee increase effective July 1, 2015, for debt service and debt service coverage. This factor was considered during the preparation of the NBC’s FY 2016 operating budget. CONTACTING NBC’S FINANCIAL MANAGEMENT This financial report is designed to provide the Board, the NBC’s ratepayers, bond investors and other interested parties with a general overview of the NBC’s finances, and to demonstrate the NBC’s accountability for the financial resources it manages. If there are any questions concerning this report or a need for additional financial information please contact the Director of Administration and Finance at One Service Road, Providence, RI 02905.

Assets
Current assets
Cash and cash equivalents 15,999,803$ Accounts receivable Sewer use (net of allowance) 10,487,394 Sewer use unbilled 4,819,849 Receivables, other 42,422 Due from Rhode Island Infrastructure Bank 6,713,012 Prepaid expenses 1,433,228
Total current assets 39,495,708
Non‐current assets
Restricted assets
Cash and cash equivalents, environmental enforcement 54,405 Cash and cash equivalents, operating reserve for revenue stability fund 4,500,023 Cash and cash equivalents, restricted for debt service 39,986,303 Cash and cash equivalents, restricted for debt service reserve fund 3,497,335 Cash and cash equivalents, restricted for acquisition and construction of plant assets 26,935,758
Total restricted assets 74,973,824
Capital assets
Land 2,754,407 Plant and equipment 88,933,709 Capital projects completed 708,054,132 Construction in progress 329,874,143
Subtotal 1,129,616,391 Less: accumulated depreciation 177,169,749
Total net capital assets 952,446,642
Total non‐current assets 1,027,420,466
Total assets 1,066,916,174
Deferred outflows of resources
Loss on refunding of debt 2,196,681 ERSRI ‐ contribution paid subsequent to measurement date 1,329,983 Non‐union Pension ‐ change in assumptions 1,560,180 Non‐union Pension ‐ difference between expected and actual experience 210,013 Non‐union Pension ‐ difference between projected and actual earnings 261,924
Total deferred outflows of resources 5,558,781$
(Continued)
NARRAGANSETT BAY COMMISSIONStatement of Net Position
June 30, 2015
The Notes to Financial Statements are an integral part of this statement.
24

Liabilities
Current liabilities
Accounts payable 2,667,517$ Contracts payable 5,072,450 Accrued interest payable 5,331,179 Accrued expenses 993,612 Current portion of the other accrued expenses 80,865 Current portion of loans payable 25,284,371 Current portion of leases payable 143,566
Total current liabilities 39,573,560
Non‐current liabilities
Long‐term other accrued expenses, net 2,867,961 Long‐term net pension liability ‐ ERSRI 15,554,087 Long‐term net pension liability ‐ Non‐Union Plan 4,864,294 Long‐term loans payable, net 320,847,681 Long‐term leases payable, net 109,731 Long‐term debt, net 262,604,184
Total non‐current liabilities 606,847,938
Total liabilities 646,421,498
Deferred inflows of resources
Unearned revenue billed in advance 271,768 Gain on refunding of debt 188,075 ERSRI ‐ change in assumptions 168,936 ERSRI ‐ difference between projected and actual earrings 1,193,124 Non‐union Pension ‐ difference between expected and actual experience 150,858 Non‐union Pension ‐ difference between projected and actual earnings 371,353
Total deferred inflows of resources 2,344,114
Net position
Net investment in capital assets 347,106,277 Restricted for environmental enforcement 54,405 Unrestricted 76,548,661
Total Net Position 423,709,343$
NARRAGANSETT BAY COMMISSIONStatement of Net Position (Continued)
June 30, 2015
The Notes to Financial Statements are an integral part of this statement.
25

Operating revenues
User fees, residential 53,044,437$ User fees, commercial and industrial 38,962,862 Permit and connection fees 100,906 Pretreatment fees 1,076,481 Environmental enforcement 5,972 Septage income 336,037 Late charge penalties 999,867 Miscellaneous revenue 489,280
Total operating revenues 95,015,842
Operating expenses
Personnel services 20,946,735 General and administration 979,426 Operations and maintenance 6,930,801 Depreciation 12,983,750 Contractual services 7,469,034 Miscellaneous 846,462
Total operating expenses 50,156,208
Operating income 44,859,634
Non‐operating revenues (expenses)
Interest expense (16,475,516) Interest income 5,839 Grant income 4,910 Bond and note fees (720,428) Miscellaneous 163,634
Total non‐operating revenues (expenses) (17,021,561)
Change in net position 27,838,073
Total net position, beginning of year 415,784,024
Net position restatement (19,912,754)
Total net position, end of year 423,709,343$
NARRAGANSETT BAY COMMISSIONSchedule of Revenue, Expenses and Changes in Net Position
For the Year Ended June 30, 2015
The Notes to Financial Statements are an integral part of this statement.
26

Cash flows from operating activities
Cash received from customers 94,733,065$ Cash paid to supplies for goods and services (30,953,465) Cash paid to employees for services (16,225,723) Other non‐operating revenues 168,544
Net cash provided by operating activities 47,722,421
Cash flows from capital related financing activities
Proceeds from capital debt 36,985,695 Acquisitions and construction of capital assets (33,579,692) Principal paid on capital debt (23,028,273) Interest paid on capital debt (17,188,998) Bonds and note fees (720,428)
Net cash used from capital related financing activities (37,531,696)
Cash flows from investing activities
Interest income 5,839
Net cash provided by investing activities 5,839
Net increase in cash and cash equivalents 10,196,564
Cash and cash equivalents, beginning of year 80,777,063
Cash and cash equivalents, end of year 90,973,627$
(Continued)
NARRAGANSETT BAY COMMISSIONStatement of Cash Flow
For the Year Ended June 30, 2015
The Notes to Financial Statements are an integral part of this statement.
27

Reconciliation of operating income to net cash provided by operating activities
Operating Income 44,859,634$
Adjustments to reconcile operating income to net cash provided by operating activities
Depreciation 12,983,750
Changes in assets, deferred outflows, liabilities, and deferred inflowsDecrease in accounts receivable user fees 308,557 Increase in unbilled revenue (578,702) Increase in other receivables (12,255) Increase in prepaid expenses (372,145) Increase in pension deferred outflows of resources (1,662,410) Increase in pension deferred inflows of resources 1,217,900 Decrease in net pension liability (314,279) Decrease in accounts and contracts payable (9,214,211) Increase in accrued expenses 338,415 Decrease in unearned revenue billed in advance (377)
Non‐operating revenue reported as operating revenue received 168,544
Total adjustments 2,862,787
Net cash provided by operating activities 47,722,421$
Non‐cash capital and related financing activities
The NBC participates in the State Revolving Loan Fund as described in Note 6 to the financialstatements. Project costs are paid directly by the Rhode Island Infrastructure Bank (RIIB) onbehalf of the NBC. The debt forgiveness, which is reported as contributed capital is reportedin the financial statements. The State Revolving Loan Project activity during the year was as follows:
Decrease in amount due from RIIB 37,264,782$ Increase in capital assets 37,264,782 Decrease in bond and note fees 574,077 Decrease in loan payable 23,028,273
NARRAGANSETT BAY COMMISSIONStatement of Cash Flow (Continued)
For the Year Ended June 30, 2015
The Notes to Financial Statements are an integral part of this statement.
28

NARRAGANSETT BAY COMMISSION Notes to Financial Statements
June 30, 2015
Notes to Financial Statements
29
The financial statements of the Narragansett Bay Commission (NBC) have been prepared in conformity with accounting principles generally accepted in the United States of America as applied to governmental entities. The Governmental Accounting Standards Board (GASB) is the accepted standard setting body for establishing governmental accounting and financial reporting principles. The following Notes to the Financial Statements are an integral part of NBC's financial statements.
NOTE 1 ‐ REPORTING ENTITY
The Narragansett Bay Commission (NBC) is a public corporation established in 1980 by an Act of the Rhode Island Legislature. NBC was created for purposes of acquiring, planning, constructing, extending, improving, operating and maintaining publicly owned wastewater treatment facilities (Field's Point Facility) in the District. NBC took over operational control on May 1, 1982. The Field's Point service area includes the City of Providence and the Towns of North Providence and Johnston and portions of the Town of Lincoln and the City of Cranston.
On June 27, 1991, the Governor of the State of Rhode Island signed into law legislation mandating the merger of NBC and the Blackstone Valley District Commission (BVDC). The merger became effective January 1, 1992. The Bucklin Point service area includes the City of Pawtucket, the City of Central Falls, the Rumford area of the City of East Providence and portions of the Towns of Lincoln, Cumberland and Smithfield. NBC also accepts septage generated from within the State of Rhode Island at its Lincoln septage facility. NBC can provide service to other communities as long as it is a mutual agreement between the two parties. NBC is considered a related organization of the State of Rhode Island for financial reporting purposes. NBC is reported as a related organization of the State of Rhode Island, and not as a component unit, based on the criteria of GASB Statement No. 14 "The Financial Reporting Entity", as amended by GASB Statement No. 39 "Determining Whether Certain Organizations are Component Units" and as amended by GASB Statement No. 61 "Financial Reporting Entity ‐ Omnibus".
The State of Rhode Island is accountable for NBC due to the fact that the Governor appoints the voting majority of NBC's Board of Commissioners. The State of Rhode Island, however, is not financially accountable for the following reasons: it is unable to impose its will on NBC; NBC provides no specific financial benefit to, or imposes no specific financial burden on the State of Rhode Island and NBC is not fiscally dependent on the State of Rhode Island. NOTE 2 ‐ SUMMARY OF SIGNIFICANT ACCOUNTING POLICIES
The accounting policies of NBC conform to generally accepted accounting principles as applicable to governmental proprietary fund types (enterprise funds). For enterprise funds, the intent of the governing body is that costs of providing goods or services to the general public on a continuing basis be financed or recovered through user charges.
NARRAGANSETT BAY COMMISSION Notes to Financial Statements (Continued)
June 30, 2015
Notes to Financial Statements
30
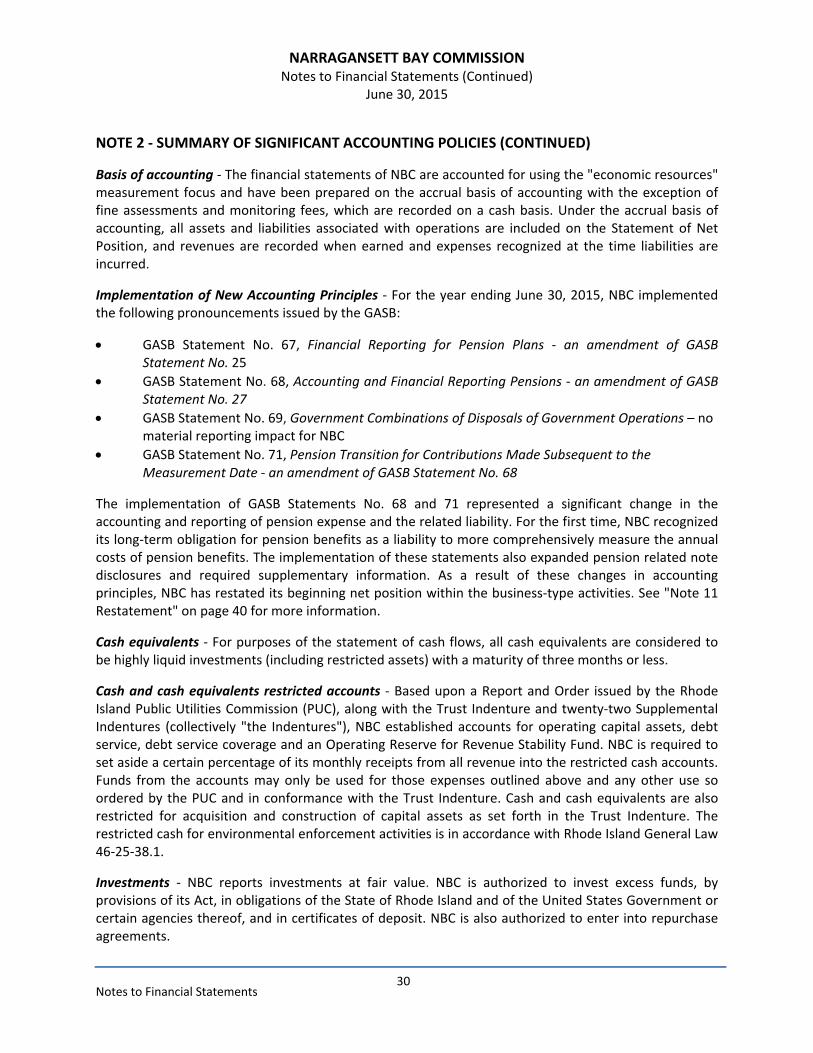
NOTE 2 ‐ SUMMARY OF SIGNIFICANT ACCOUNTING POLICIES (CONTINUED)
Basis of accounting ‐ The financial statements of NBC are accounted for using the "economic resources" measurement focus and have been prepared on the accrual basis of accounting with the exception of fine assessments and monitoring fees, which are recorded on a cash basis. Under the accrual basis of accounting, all assets and liabilities associated with operations are included on the Statement of Net Position, and revenues are recorded when earned and expenses recognized at the time liabilities are incurred.
Implementation of New Accounting Principles ‐ For the year ending June 30, 2015, NBC implemented the following pronouncements issued by the GASB:
GASB Statement No. 67, Financial Reporting for Pension Plans ‐ an amendment of GASB Statement No. 25
GASB Statement No. 68, Accounting and Financial Reporting Pensions ‐ an amendment of GASB Statement No. 27
GASB Statement No. 69, Government Combinations of Disposals of Government Operations – no material reporting impact for NBC
GASB Statement No. 71, Pension Transition for Contributions Made Subsequent to the Measurement Date ‐ an amendment of GASB Statement No. 68
The implementation of GASB Statements No. 68 and 71 represented a significant change in the accounting and reporting of pension expense and the related liability. For the first time, NBC recognized its long‐term obligation for pension benefits as a liability to more comprehensively measure the annual costs of pension benefits. The implementation of these statements also expanded pension related note disclosures and required supplementary information. As a result of these changes in accounting principles, NBC has restated its beginning net position within the business‐type activities. See "Note 11 Restatement" on page 40 for more information.
Cash equivalents ‐ For purposes of the statement of cash flows, all cash equivalents are considered to be highly liquid investments (including restricted assets) with a maturity of three months or less.
Cash and cash equivalents restricted accounts ‐ Based upon a Report and Order issued by the Rhode Island Public Utilities Commission (PUC), along with the Trust Indenture and twenty‐two Supplemental Indentures (collectively "the Indentures"), NBC established accounts for operating capital assets, debt service, debt service coverage and an Operating Reserve for Revenue Stability Fund. NBC is required to set aside a certain percentage of its monthly receipts from all revenue into the restricted cash accounts. Funds from the accounts may only be used for those expenses outlined above and any other use so ordered by the PUC and in conformance with the Trust Indenture. Cash and cash equivalents are also restricted for acquisition and construction of capital assets as set forth in the Trust Indenture. The restricted cash for environmental enforcement activities is in accordance with Rhode Island General Law 46‐25‐38.1.
Investments ‐ NBC reports investments at fair value. NBC is authorized to invest excess funds, by provisions of its Act, in obligations of the State of Rhode Island and of the United States Government or certain agencies thereof, and in certificates of deposit. NBC is also authorized to enter into repurchase agreements.

NARRAGANSETT BAY COMMISSION Notes to Financial Statements (Continued)
June 30, 2015
Notes to Financial Statements
31
NOTE 2 ‐ SUMMARY OF SIGNIFICANT ACCOUNTING POLICIES (CONTINUED)
Receivables ‐ Fixed fees for sewer usage are billed to all customers in advance on a monthly basis. Consumption based fees are billed in arrears on a monthly basis, based on estimated and actual water consumption meter readings.
The allowance for doubtful accounts for June 30, 2015 was $1,524,527.
Capital assets ‐ Capital assets are valued at cost. Plant and equipment and capital projects completed are depreciated using the straight‐line method over the estimated useful lives of the respective assets. Construction in progress and land are not depreciated. NBC's asset capitalization threshold is $2,500. Depreciation expense is recognized over the following useful lives: Years
Plant and equipment 3‐50 Capital projects completed 5‐100
Construction in progress ‐ Construction in progress consists of the capital projects' design, planning and construction costs. Upon completing the project and finalizing the financial transaction, the construction in progress is transferred into the completed project capital asset account. Once transferred, NBC will start to depreciate the completed capital project.
Long‐term debt ‐ Long‐term debt is reported as a liability in the Statement of Net Position. Bond premiums are deferred and amortized over the life of the bonds. Bonds payable are reported net of the applicable bond premium.
The total bond premiums as of June 30, 2015 were $19,784,184.
The total bond and loan fees for the year ending June 30, 2015 were $720,428.
Pensions ‐ For purposes of measuring the net pension liability, deferred outflows of resources and deferred inflows of resources related to pensions, and pension expense, information about the fiduciary net position of the Employees' Retirement System Plan Rhode Island (ERSRI) and the additions to/deductions from ERSRI's fiduciary net position have been determined on the same basis as they are reported by ERSRI. For further information on both the ERSRI plan and Non‐Union Defined Benefit Plan, please refer to Note 12 of the financial statements. For this purpose, benefit payments (including refunds of employee contributions) are recognized when due and payable in accordance with the benefit terms. Investments are reported at fair value.
The ERSRI plan has a measurement date of June 30, 2014 while the NBC’s non‐union pension plan has a measurement date of June 30, 2015.
Unearned revenue billed in advance ‐ Unearned revenue represents amounts billed in the current fiscal year for pretreatment fees relating to the subsequent fiscal year.
Capital contributions ‐ Capital contributions represent financial assistance from Federal and State governments for the construction and upgrade of wastewater treatment facilities and related capital projects.

NARRAGANSETT BAY COMMISSION Notes to Financial Statements (Continued)
June 30, 2015
Notes to Financial Statements
32
NOTE 2 ‐ SUMMARY OF SIGNIFICANT ACCOUNTING POLICIES (CONTINUED)
Operating revenues and expenses ‐ Operating revenues and expenses for NBC are those that result from providing wastewater treatment and collection services and related activities. They also include all revenue and expenses not related to capital and related financing, noncapital financing or investing activities. All revenues and expenses not meeting this definition are reported as non‐operating revenues and expenses.
Income taxes ‐ NBC is exempt from Federal and State income taxes.
Regulatory ‐ NBC is a regulated utility, and its rates are set by the PUC. For rate‐making purposes, depreciation expense is excluded while principal payments and capital outlays are included in the total expenses to arrive at a regulatory net income (loss). For this reason, the net income (loss) on a regulatory basis differs from the change in net position in the audited financial statements, which are prepared in conformance with generally accepted accounting principles.
Estimates ‐ The preparation of financial statements in conformity with the generally accepted accounting principles requires management to make estimates and assumptions that affect the reported amounts of assets and liabilities and disclosure of contingent assets and liabilities at the date of the financial statements and the reported amounts of revenues and expenses during the reporting period. Actual results could differ from those estimates.
NOTE 3 ‐ CASH DEPOSITS AND INVESTMENTS
Cash deposits ‐ NBC's cash deposits are in one financial institution. The carrying amount of deposits is separately displayed on the Statement of Net Position as "cash and cash equivalents".
The carrying value of deposits, investments and petty cash funds reported on the Statement of Net Position as "cash and cash equivalents" are as follows:
Cash deposits 13,575,257$ Cash equivalents 77,397,345 Petty cash 625 Cash with Customer Service 400
Total cash and cash equivalents 90,973,627$
In accordance with Rhode Island General Laws, Chapter 35‐10.1, depository institutions holding deposits of the State, its agencies or governmental subdivisions of the State, shall at a minimum, insure or pledge eligible collateral equal to one hundred percent of time deposits with maturities greater than sixty days. Any of these institutions, which do not meet minimum capital standards prescribed by federal regulators, shall insure or pledge eligible collateral equal to one hundred percent of deposits, regardless of maturity.

NARRAGANSETT BAY COMMISSION Notes to Financial Statements (Continued)
June 30, 2015
Notes to Financial Statements
33
NOTE 3 ‐ CASH DEPOSITS AND INVESTMENTS (CONTINUED)
The carrying amount of NBC's deposits at June 30, 2015 was $13,575,257 and the bank balance was $13,758,943. Custodial Credit Risk ‐ Custodial credit risk for deposits is the risk that in the event of the failure of a depository financial institution, NBC will not be able to recover deposits or will not be able to recover collateral securities that are in the possession of an outside party. As of June 30, 2015, $13,508,943 of NBC's bank balance of $13,758,943 was exposed to custodial credit risk as follows:
Bank Balance
Insured (Federal depository insurance funds) 250,000$ Collateralized with securities held by pledging financial institution or its agent, in NBC's name 13,508,943
13,758,943$
Investments ‐ Generally Accepted Accounting Principles (GAAP) requires the following accounts to be considered cash equivalents, however, NBC considers them to be investments. For financial statement purposes, they have been recorded in accordance with GAAP. For disclosure purposes only, NBC's investments as of June 30, 2015 were as follows:
Fair Value Maturity
Goldman Sachs Financial Square Government Fund 75,569,206$ Average 57 daysOcean State Investment Pool 1,828,139 N/A
77,397,345$
Interest rate risk ‐ Funds held by NBC are invested in accordance with NBC’s investment policy. This policy does not limit investment maturities as a means of limiting its exposure to fair value losses arising from interest rates. Money held by the Trustee under the Indenture must be invested in accordance with permitted investments as defined under the Trust Indenture and all supplemental indentures, which mitigates interest rate exposure by limiting federal funds or bankers acceptances to a maximum term of one year and requires Bond Insurer approval of Repurchase Agreements which exceed 30 days.
Credit risk ‐ NBC's investment policy objective states that all financial assets held by NBC shall be invested in a manner that will preserve the value and safety of capital. NBC shall invest funds in order to maximize earnings and minimize risk during the period of availability of the funds. NBC's investment policy limits investments to U.S. Treasury securities, securities of the U.S. Government agencies and instrumentalities that are backed by the full faith and credit or guarantee of the U.S. Government, which have a liquid market with a readily determinable market value, investment‐ grade obligations of the State of Rhode Island, or any municipality or political subdivision of the State of Rhode Island, repurchase agreements backed by collateral, certificate of deposits, money market mutual funds whose portfolios consist of U.S. Treasury securities, U.S. agency obligations and repurchase agreements fully collateralized by such securities and governmental investment products backed by collateral consisting of U.S. Treasury and U.S. Agency securities. The Ocean State Investment Pool is not rated. Money held by the Trustee under the Trust Indenture is invested at the direction of an Authorized Officer from NBC and must be invested in accordance with Permitted Investments as defined under the Trust Indenture. The monies invested in the Money Market Funds held by the Trustee were rated Aaa‐mf by Moody's Investor Service, Inc.

NARRAGANSETT BAY COMMISSION Notes to Financial Statements (Continued)
June 30, 2015
Notes to Financial Statements
34
NOTE 3 ‐ CASH DEPOSITS AND INVESTMENTS (CONTINUED)
Concentration of credit risk ‐ NBC's investment policy is not specific but states that investments shall be diversified to minimize the risk of loss that may occur due to concentration in a specific maturity, a specific issue or a specific class of securities.
NOTE 4 ‐ CAPITAL ASSETS
The following is a summary of changes in capital assets for the year ended June 30, 2015: June 30, 2014 Additions Retirements June 30, 2015
Land $ 2,754,407 $ ‐ $ ‐ $ 2,754,407 Construction in Progress 360,531,394 30,748,605 (61,405,856) 329,874,143 Total non‐depreciable assets 363,285,801 30,748,605 (61,405,856) 332,628,550
Plant and equipment 86,302,765 2,831,088 (200,144) 88,933,709 Capital projects completed 646,648,276 61,405,856 ‐ 708,054,132 Total depreciable assets 732,951,041 64,236,944 (200,144) 796,987,841
Plant and equipment (64,819,513) (3,192,419) 200,144 (67,811,788)Capital projects completed (99,566,630) (9,791,331) ‐ (109,357,961) Less accumulated depreciation (164,386,143) (12,983,750) 200,144 (177,169,749)
Total capital assets, net 931,850,699$ 82,001,799$ (61,405,856)$ 952,446,642$
Non‐depreciable assets
Depreciable assets
Less accumulated depreciation for
NOTE 5 ‐ COMPENSATED ABSENCES
NBC's employees are granted vacation and sick leave in varying amounts based on years of service with NBC. At the termination of service, an employee is paid for accumulated unused vacation leave and sick leave. Sick leave payments are based on age and years of service for both union and non‐union employees. NBC has determined that the dollar value of accumulated accrued vacation leave and sick leave, valued at the current rate of pay, at June 30, 2015 to be $2,948,825. The accrued vacation and sick leave is reported on the Statement of Net Position as other accrued expenses.
The changes in compensated absences for the year ended June 30, 2015 were as follows:
June 30, 2014 Additions Payments June 30, 2015
Amount Due
Within One Year
Compensated absences 2,680,716$ 297,709$ 29,600$ 2,948,825$ 80,865$

NARRAGANSETT BAY COMMISSION Notes to Financial Statements (Continued)
June 30, 2015
Notes to Financial Statements
35
NOTE 6 ‐ LOANS PAYABLE
NBC has eighteen loans outstanding with the Rhode Island Infrastructure Bank (RIIB) at June 30, 2015 as follows:
June 30, 2014 Additions Payments June 30, 2015Pooled Loan #1 ‐ Series 1993 ‐ The total loan authorized is $14,781,000, dated March 10, 1993, with an interest rate of 3.16917%. 2,004,000$ ‐$ 983,750$ 1,020,250$
Pooled Loan #2 ‐ Series 1994 ‐ The total loan authorized is $17,279,000, dated June 29, 1994, with an interest rate of 2.9938%. 2,301,140 ‐ 1,130,719 1,170,421
Pooled Loan #3 ‐ Series 1997 ‐ The total loan authorized is $8,150,000, dated March 3, 1997, with an interest rate of 3.14473%. 3,084,334 ‐ 468,955 2,615,379
Pooled Loan #4 ‐ Series 1999 ‐ The total loan authorized is $23,955,000, dated February 4, 1999, with an interest rate of 3.032%. 10,730,000 ‐ 1,195,000 9,535,000
Pooled Loan #5 ‐ Series 2001 ‐ The total loan authorized is $57,000,000 dated November 1, 2001, with an interest rate of 2.671%. 22,795,000 ‐ 3,205,000 19,590,000
Pooled Loan #6 ‐ Series 2002 ‐ The total loan authorized is $57,000,000, dated October 24, 2002, with an interest rate of 1.0785%. 29,360,665 ‐ 2,930,718 26,429,947
Pooled Loan #7 ‐ Series 2003 ‐ The total loan authorized is $40,000,000, dated November 13, 2003, with an interest rate of 1.349%. 23,792,000 ‐ 1,953,000 21,839,000
Pooled Loan #8 ‐ 2004 Series B ‐ The total loan authorized is $40,000,000, dated December 30, 2004, with an interest rate of 1.404%. 29,252,000 ‐ 2,045,000 27,207,000
Pooled Loan #9 ‐ 2005 Series B ‐ The total loan authorized is $30,000,000, dated December 15, 2005, with an interest rate of 1.397%. 19,317,000 ‐ 1,444,000 17,873,000
Pooled Loan #10 ‐ 2006 Series A ‐ The total loan authorized is $30,000,000, dated December 21, 2006, with an interest rate of 1.27%. 20,659,000 ‐ 1,427,000 19,232,000 ‐ Pooled Loan #11 ‐ 2007 Series B ‐ The total loan authorized is $25,000,000, dated December 12, 2007, with an interest rate of 1.475%. 21,292,000 ‐ 1,236,000 20,056,000

NARRAGANSETT BAY COMMISSION Notes to Financial Statements (Continued)
June 30, 2015
Notes to Financial Statements
36
NOTE 6 ‐ LOANS PAYABLE (CONTINUED)
June 30, 2014 Additions Payments June 30, 2015Pooled Loan #12 ‐ 2009 Series A ‐ The total loan authorized is $55,000,000, dated October 6, 2009, with principal forgiveness of $8,302,114 with an interest rate of .877%. 45,424,308$ ‐$ 849,052$ 44,575,256$
Pooled Loan #12 ‐ Takeover ‐ 2010 Series A ‐ The total loan authorized is $2,000,000, dated February 2, 2010, with principal forgiveness of $301,895 and an interest rate of .522%. 1,424,711 ‐ 71,321 1,353,390
Pooled Loan #13 ‐ 2010 Series B ‐ The total loan authorized is $20,000,000, dated June 24, 2010, with an interest rate of 2.143%. 17,566,000 ‐ 831,000 16,735,000
Pooled Loan #14 ‐ 2011 Series A ‐ The total loan authorized is $30,000,000, dated March 29, 2011, with principal forgiveness of $1,845,345 and an interest rate of 2.259%. 25,920,114 ‐ 1,136,510 24,783,604
Pooled Loan #15 ‐ 2012 Series A ‐ The total loan authorized is $27,750,000, dated June 28, 2012, with principal forgiveness of $354,202 and an interest rate of 2.088%. 24,320,016 ‐ 1,066,703 23,253,313
Pooled Loan #16 ‐ 2013 Series B ‐ The total loan authorized is $25,000,000, dated June 6, 2013, with principal forgiveness of $80,966 and an interest rate of 2.092%. 24,918,037 ‐ 1,054,545 23,863,492
Pooled Loan #17 ‐ Series 2014 A ‐ The total loan authorized is $45,000,000, dated March 6, 2014, with an interest rate of 2.467%. 45,000,000 ‐ ‐ 45,000,000
Total loans payable 369,160,325$ ‐$ 23,028,273$ 346,132,052$ Less current portion (23,028,273) (25,284,371)Net long‐term loans payable 346,132,052$ 320,847,681$

NARRAGANSETT BAY COMMISSION Notes to Financial Statements (Continued)
June 30, 2015
Notes to Financial Statements
37
NOTE 6 ‐LOANS PAYABLE (CONTINUED)
The RIIB pays all invoices, which have been certified by the NBC, directly to the contractors or reimburses NBC for costs incurred on the projects funded by the RIIB loans. As of June 30, 2015, loans payable of $346,132,052 are reported on the Statement of Net Position. A receivable from RIIB of $6,713,012 is reported on the Statement of Net Position for that portion of the loans which have not been drawn down as of June 30, 2015. The total loan authorized must be drawn down within three years. NBC is obligated for the total loan amount once the underlying bonds are issued on NBC's behalf by RIIB.
Maturities of loans payable as of June 30, 2015 are due in future years as follows:
Year Ending
June 30, Principal Interest Total
2016 $ 25,284,371 $ 8,307,329 $ 33,591,700 2017 25,783,150 7,785,435 33,568,5852018 26,495,360 7,233,676 33,729,0362019 26,790,985 6,658,485 33,449,4702020 26,812,719 6,067,847 32,880,566
2021‐2025 114,219,493 21,816,110 136,035,6032026‐2030 67,748,052 10,454,725 78,202,7762031‐2035 32,997,922 1,993,469 34,991,391
$ 346,132,052 $ 70,317,075 $ 416,449,127
NOTE 7 – CAPITAL LEASES
Amortization of assets acquired under capital leases is included in depreciation expense for the year ended June 30, 2015. As of June 30, 2015, future minimum rental commitments under capital leases are as follows:
Year Ending
June 30,
2016 147,711$ 2017 111,315
Total future minimum rental payments 259,026 Less interest portion of payments (5,729)Present value of minimum lease payments 253,297 Less current maturities of capital leases (143,566)
Net long‐term capital leases 109,731$
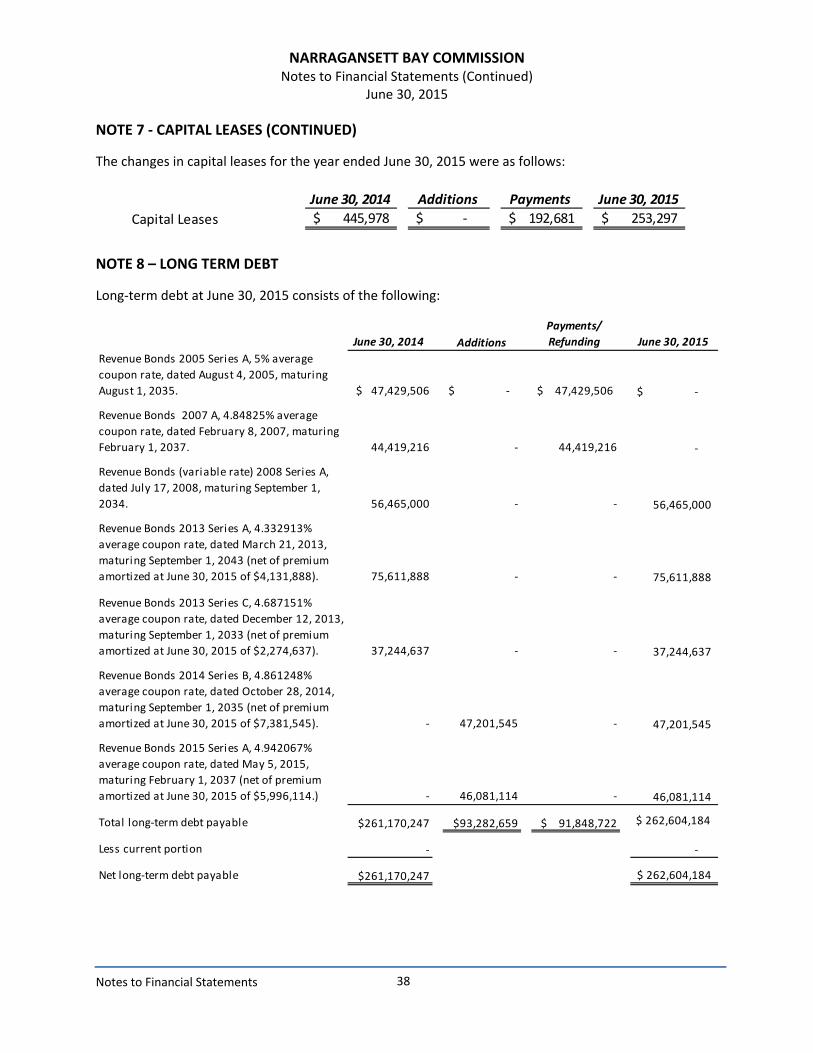
NARRAGANSETT BAY COMMISSION Notes to Financial Statements (Continued)
June 30, 2015
Notes to Financial Statements
38
NOTE 7 ‐ CAPITAL LEASES (CONTINUED)
The changes in capital leases for the year ended June 30, 2015 were as follows:
June 30, 2014 Additions Payments June 30, 2015
Capital Leases 445,978$ ‐$ 192,681$ 253,297$
NOTE 8 – LONG TERM DEBT
Long‐term debt at June 30, 2015 consists of the following:
June 30, 2014 Additions
Payments/
Refunding June 30, 2015
Revenue Bonds 2005 Series A, 5% average coupon rate, dated August 4, 2005, maturing August 1, 2035. $ 47,429,506 $ ‐ $ 47,429,506 ‐$
Revenue Bonds 2007 A, 4.84825% average coupon rate, dated February 8, 2007, maturing February 1, 2037. 44,419,216 ‐ 44,419,216 ‐
Revenue Bonds (variable rate) 2008 Series A, dated July 17, 2008, maturing September 1, 2034. 56,465,000 ‐ ‐ 56,465,000
Revenue Bonds 2013 Series A, 4.332913% average coupon rate, dated March 21, 2013, maturing September 1, 2043 (net of premium amortized at June 30, 2015 of $4,131,888). 75,611,888 ‐ ‐ 75,611,888
Revenue Bonds 2013 Series C, 4.687151% average coupon rate, dated December 12, 2013, maturing September 1, 2033 (net of premium amortized at June 30, 2015 of $2,274,637). 37,244,637 ‐ ‐ 37,244,637
Revenue Bonds 2014 Series B, 4.861248% average coupon rate, dated October 28, 2014, maturing September 1, 2035 (net of premium amortized at June 30, 2015 of $7,381,545). ‐ 47,201,545 ‐ 47,201,545
Revenue Bonds 2015 Series A, 4.942067% average coupon rate, dated May 5, 2015, maturing February 1, 2037 (net of premium amortized at June 30, 2015 of $5,996,114.) ‐ 46,081,114 ‐ 46,081,114
Total long‐term debt payable $ 262,604,184
Less current portion ‐
Net long‐term debt payable 262,604,184$ $261,170,247
$261,170,247 $93,282,659 $ 91,848,722
‐

NARRAGANSETT BAY COMMISSION Notes to Financial Statements (Continued)
June 30, 2015
Notes to Financial Statements
39
NOTE 8 ‐ LONG TERM DEBT (CONTINUED) Maturities of long‐term debt for the year ending June 30, 2016 through 2044 are as follows:
Year Ending
June 30, Principal Interest Total
2016 $ ‐ $ 10,174,662 $ 10,174,662 2017 ‐ 10,682,351 10,682,3512018 ‐ 10,685,975 10,685,9752019 ‐ 10,685,975 10,685,9752020 ‐ 10,689,599 10,689,599
2021‐2025 16,300,000 52,129,144 68,429,1442026‐2030 62,835,000 43,663,078 106,498,0782031‐2035 82,335,000 27,478,145 109,813,1452036‐2040 45,675,000 12,252,550 57,927,5502041‐2044 35,675,000 2,925,300 38,600,300
* $ 242,820,000 $ 191,366,779 $ 434,186,779
*Principal total of $242,820,000 plus premium to be amortized as of June 30, 2015 on bonds of $19,784,184 equals total long‐term debt of $262,604,184.
The above bonds are subject to federal arbitrage regulations. Based on current calculations, NBC has no arbitrage liability.
On July 17, 2008, NBC issued $66,360,000 in Wastewater System Revenue Refunding Bonds to refund on a current basis, $65,765,000 of the outstanding Wastewater System Revenue Bonds, 2004 Series A and to pay the costs of issuance associated therewith. The reacquisition price exceeded the net carrying amount of the old debt by $627,767. This amount is being amortized over the new debt's life as deferred outflows of resources.
These bonds have been issued in weekly rate mode but can be changed by NBC to a daily, commercial paper or term rate mode. The interest rate is determined weekly or daily based on the mode and interest is paid monthly. The interest rate for the bonds outstanding during fiscal year 2015 ranged from .02% to .12%. The Bonds shall be repaid from Revenues, as defined in the Indenture of the Commission pledged under the Indenture and funds drawn under an irrevocable direct pay letter of credit issued by US Bank. Under the Letter of Credit, the Bank is obligated to pay to the Trustee, upon presentation of required documentation, the amount necessary to pay the principal and purchase price of and interest on the Bonds of up to 60 days at the maximum rate of 10% on the Bonds. The Letter of Credit provides that it will expire on July 13, 2016.
On October 28, 2014, NBC issued $39,820,000 in Wastewater System Revenue Refunding Bonds to refund, on an advanced refunding basis, $45,000,000 of the outstanding Wastewater System Revenue Bonds, 2005 Series A and to pay the costs of issuance associated therewith. The net carrying value of the old debt exceeded the reacquisition price by $197,031 which is being amortized over the new debt's life as a deferred inflow of resources.

NARRAGANSETT BAY COMMISSION Notes to Financial Statements (Continued)
June 30, 2015
Notes to Financial Statements
40
NOTE 8 ‐ LONG TERM DEBT (CONTINUED)
Also, on May 5, 2015, NBC issued $40,085,000 in Wastewater System Revenue Refunding Bonds to refund, on an advanced basis, $42,500,000 of the outstanding Wastewater System Revenue Bonds, 2007 Series A and to pay the costs of issuance associated therewith. The reacquisition price exceeded the net carrying value of the old debt by $1,810,381 which is being amortized over the new debt's life as a deferred outflow of resources.
NOTE 9 ‐ RISK MANAGEMENT
NBC is exposed to various risk of loss relating to torts; theft of, damage to, and destruction of assets; errors and omissions; injuries to employees; health of employees and natural disasters. NBC purchases commercial insurance for property damage, general liability, errors and omissions and employee health coverage.
NBC has been commercially insured for workers' compensation benefits since March 1, 2000. Prior to that date, NBC was self‐insured and the workers' compensation benefits were administered by the State of Rhode Island. Settled claims resulting from these risks have not exceeded insurance coverage in any of the past three fiscal years.
NOTE 10 ‐ NET POSITION
Net investment in Capital Assets is intended to reflect the portion of net position that is associated with nonliquid capital assets, less outstanding capital asset related debt. Chapter 46‐25‐38.1 of the general laws enacted by the General Assembly established a restricted environmental enforcement fund. The fund consists of sums recovered by administrative or civil enforcement action and may be used as outlined in chapter 46‐25‐38.1. NBC has restricted net position equal to the balance of funds in the environmental enforcement restricted cash and cash equivalent account.
NBC considers restricted resources to have been spent when an expense is incurred for which both restricted and unrestricted net position are available.
NOTE 11‐ RESTATEMENT
The net position has been restated as a result of GASB 68 retrospective adjustments made to reclassify prior year balances. Such adjustments are summarized as follows:
Net Position
Beginning balance, July 1, 2014 415,784,024$
To restate prior year to include net pension liability GASB 68 (19,912,754)
Beginning balance, July 1, 2014, restated $ 395,871,270

NARRAGANSETT BAY COMMISSION Notes to Financial Statements (Continued)
June 30, 2015
Notes to Financial Statements
41
NOTE 12 ‐ PENSION PLANS
EMPLOYEES' RETIREMENT SYSTEM OF THE STATE OF RHODE ISLAND
Effective July 1, 2012, the State administered retirement system was modified to include both defined benefit and defined contribution plan components.
General Information about the Pension Plan
Plan description ‐ All NBC eligible full‐time union employees participate in a cost‐sharing multiple‐employer defined benefit pension plan ‐ the Employees' Retirement System plan ‐ administered by the Employees' Retirement System of the State of Rhode Island (ERSRI). Under a cost‐sharing plan, pension obligations for employees of all employers are pooled and plan assets are available to pay the benefits of the employees of any participating employer providing pension benefits through the plan, regardless of the status of the employers' payment of its pension obligation to the plan. The plan provides retirement, disability benefits and death benefits to plan members and beneficiaries.
The System issues a publicly available financial report that includes financial statements and required supplementary information for the plans. The report may be obtained at www.ersri.org.
Benefit provisions ‐ The level of benefits provided to participants is established by Chapter 36‐10 of the General Laws, which is subject to amendment by the General Assembly. Member benefit provisions vary based on service credits accumulated at dates specified in various amendments to the General Laws outlining minimum retirement age, benefit accrual rates and maximum benefit provisions. In general, members accumulate service credits for each year of service subject to maximum benefit accruals of 80% or 75%. For those hired after June 30, 2012, the benefit accrual rate is 1% per year with a maximum benefit accrual of 40%. Members eligible to retire at September 30, 2009 may retire with 10 years of service at age 60 or after 28 years of service at any age. The retirement eligibility age increases proportionately for other members reflecting years of service and other factors until it aligns with the Social Security Normal Retirement Age, which applies to any member with less than 5 years of service as of July 1, 2012. Members are vested after 5 years of service.
The plan provides for survivor's benefits for service connected death and certain lump sum death benefits. Joint and survivor benefit provision options are available to members.
Cost of living adjustments are provided but are currently suspended until the collective plans covering state employees and teachers reach a funded status of 80%. Until the plans reach an 80% funded status, interim cost of living adjustments are provided at five‐year intervals.
The plan also provides nonservice‐connected disability benefits after five years of service and service connected disability benefits with no minimum service requirement.
Contributions ‐ The funding policy, as set forth in the General Laws, Section 36‐10‐2, provides for actuarially determined periodic contributions to the plan. For fiscal 2015, NBC employees were required to contribute 3.75% of their annual covered salary. The NBC is required to contribute at an actuarially determined rate; the rate was 23.33% of annual covered payroll for the fiscal year ended June 30, 2015. The NBC contributed $1,329,983, $1,317,046 and $1,164,519 for the fiscal years ended June 30, 2015, 2014 and 2013, respectively, equal to 100% of the required contributions for each year.

NARRAGANSETT BAY COMMISSION Notes to Financial Statements (Continued)
June 30, 2015
Notes to Financial Statements
42
NOTE 12 ‐ PENSION PLANS (CONTINUED)
EMPLOYEES' RETIREMENT SYSTEM OF THE STATE OF RHODE ISLAND (CONTINUED)
Pension Liabilities, Pension Expense, and Deferred Outflows and Deferred Inflows of Resources
At June 30, 2015 the NBC reported a liability of $15,554,087 for its proportionate share of the net pension liability related to its participation in ERSRI. The net pension liability was measured as of June 30, 2014, the measurement date, and the total pension liability used to calculate the net pension liability was determined by an actuarial valuation as of June 30, 2013 rolled forward to June 30, 2014. The NBC proportion of the net pension liability was based on its share of contributions to the ERSRI for fiscal year 2014 relative to the total contributions of all participating employers for that fiscal year. At June 30, 2014 the NBC proportion was 0.87%.
Subsequent to June 30, 2014 (the measurement date), litigation challenging the various pension reform measures enacted in previous years by the General Assembly (2009, 2010, and 2011) was settled. The final settlement approved by the Court on July 8, 2015 also included enactment of the pension settlement provisions by the General Assembly.
The amended benefit provisions in the newly enacted legislation and settlement agreement have not been reflected in the determination of the net pension liability at June 30, 2014 (the measurement date). These amended benefit provisions are summarized below:
Employees with more than 20 years of service at July 1, 2012 will increase their employee contribution rate from 3.75% to 11% and participate solely in the defined benefit plan going forward ‐ service credit accruals will increase from 1% to 2% per year.
Employees with more than 10 but less than 20 years of service at July 1, 2012 will receive an increased employer contribution to the defined contribution plan.
Retirees as of June 30, 2015 will receive two $500 stipends; the interim cost of living increases will occur at 4 year rather 5 year intervals.
Minor adjustments were made to the actuarial reduction for employees choosing to retire early.
These amendments are not considered to have a material effect on the net pension liability had they been retroactively applied to the calculation of the total pension liability at June 30, 2013 rolled forward to June 30, 2014. An actuarial analysis of the pension settlement provisions enacted by the General Assembly and approved by the Court indicated that the funded ratio at June 30, 2014 for state employees (determined on a funding basis) decreased from 57.4% to 56.1%.
For the year ended June 30, 2015 the NBC recognized pension expense of $1,148,282. At June 30, 2015 the NBC reported deferred outflows of resources and deferred inflows of resources related to pensions from the following sources:
Deferred Outflows
of Resources
Deferred Inflows
of Resources
Contribution paid subsequent to measurement date $ 1,329,983 ‐$ Change in assumptions ‐ (168,936) Net difference between projected and actual earnings ‐ (1,193,124)
Total deferred outflows / (inflows) $ 1,329,983 $ (1,362,060)

NARRAGANSETT BAY COMMISSION Notes to Financial Statements (Continued)
June 30, 2015
Notes to Financial Statements
43
NOTE 12 ‐ PENSION PLANS (CONTINUED)
EMPLOYEES' RETIREMENT SYSTEM OF THE STATE OF RHODE ISLAND (CONTINUED)
Pension Liabilities, Pension Expense, and Deferred Outflows and Deferred Inflows of Resources (Continued)
The NBC's contributions of $1,329,983 paid in fiscal year 2015 subsequent to the measurement date were reported as deferred outflows of resources and will be recognized as a reduction of the net pension liability for the fiscal year ended June 30, 2016. Other amounts reported as deferred outflows of resources and deferred inflows of resources related to pensions will be recognized in pension expense as follows:
Year ended June 30:
Deferred Inflows and
Outflows of Resources
2015 $ (336,760)2016 (336,760)2017 (336,760)2018 (336,760)2019 (15,020)Total $ (1,362,060)
Actuarial Assumptions ‐ The total pension liability was determined using the following actuarial assumptions, applied to all periods included in the measurement:
Inflation 2.75% Salary increases 3.50% to 6.50% Investment rate of return 7.50%
Mortality rates were based on 115% (males) and 95% (females) of the RP‐2000 combined healthy mortality tables with white collar adjustments projected with scale AA from 2000.
The actuarial assumptions used in the June 30, 2013 valuation rolled forward to June 30, 2014 and the calculation of the total pension liability at June 30, 2014 were consistent with the results of an actuarial experience study performed as of June 30, 2013.
The long‐term expected rate of return best‐estimate on pension plan investments was determined by the actuary using a building‐block method. The actuary started by calculating best‐estimate future expected real rates of return (expected returns net of pension plan investment expense and inflation) for each major asset class, based on forward‐looking medium‐term (10 year) capital market return assumptions developed by eight investment consulting firms.

NARRAGANSETT BAY COMMISSION Notes to Financial Statements (Continued)
June 30, 2015
Notes to Financial Statements
44
NOTE 12 ‐ PENSION PLANS (CONTINUED)
EMPLOYEES' RETIREMENT SYSTEM OF THE STATE OF RHODE ISLAND (CONTINUED)
Actuarial Assumptions (Continued)
The June 30, 2014 expected arithmetic returns over the medium term by asset class as developed by the State Investment Commission's investment consultant, which are generally consistent with the averages utilized by the actuary, are summarized in the following table:
Asset Class
Target
Allocation
Medium‐term expected
real rate of return
Global Equity 38% 6.50%Private Equity 7% 9.05%Equity Hedge Funds 8% 4.75%Absolute Return Hedge 7% 2.95%Real Return 14% 3.85%Real Estate 8% 4.45%Core Fixed 15% 0.25%Cash 3% ‐0.50%
100%
These return assumptions are then weighted by the target asset allocation percentage, factoring in correlation effects, to develop the overall medium‐term expected rate of return best‐estimate on an arithmetic basis. To arrive at the long‐term expected return estimate, the actuary adjusts the medium‐term number to reflect the longer 30‐year time frame required for actuarial calculations. This process produces the actuarial expected return, which is based on a 30‐year horizon, and can differ from the medium‐term, 10‐year‐horizon return expectations.
Discount rate ‐ The discount rate used to measure the total pension liability was 7.5%. The projection of cash flows used to determine the discount rate assumed that contributions from plan members will be made at the current contribution rate and that contributions from the employers will be made at statutorily required rates, actuarially determined. Based on those assumptions, the pension plan's fiduciary net position was projected to be available to make all projected future benefit payments of current plan members. Therefore, the long‐term expected rate of return on pension plan investments was applied to all periods of projected benefit payments to determine the total pension liability.
Sensitivity of the net pension liability (asset) to changes in the discount rate ‐ The following presents the net pension liability (asset) calculated using the discount rate of 7.5% as well as what the net pension liability (asset) would be if it were calculated using a discount rate that is 1‐percentage‐point lower or 1‐ percentage‐point higher than the current rate.
1% Decrease
(6.5%)
Current Discount
Rate (7.5%)
1% Increase
(8.5%)
Plan's Net Pension Liability 19,210,681$ 15,554,087$ 11,822,522$

NARRAGANSETT BAY COMMISSION Notes to Financial Statements (Continued)
June 30, 2015
Notes to Financial Statements
45
NOTE 12 ‐ PENSION PLANS (CONTINUED)
EMPLOYEES' RETIREMENT SYSTEM OF THE STATE OF RHODE ISLAND (CONTINUED)
Defined Contribution Plan:
Plan Description ‐ Employees participating in the defined benefit plan, as described above, also participate in a defined contribution plan of the Employees' Retirement System as authorized by General Law Chapter 36‐10.3. The defined contribution plan is established under IRS section 401(a) and is administered by TIAA‐CREF. The Retirement Board is the plan administrator and plan trustee. The Employees may choose among various investment options available to plan participants. The State Investment Commission is responsible for implementing the investment policy of the plan and selecting the investment options available to members.
Plan contributions ‐ Employees contribute 5% of their annual covered salary and employers contribute 1% of annual covered salary. Employee contributions are immediately vested while employer contributions are vested after three years of contributory service. Contributions required under the plan by both the employee and employer are established by the General Laws, which are subject to amendment by the General Assembly. As previously indicated in the disclosure of recently‐enacted pension legislation, the employer contribution for certain qualifying employees will increase slightly beginning in fiscal 2016.
The NBC contributed $57,009 for the fiscal year ended June 30, 2015, equal to 100% of the required contributions for the fiscal year.
Plan vesting and contribution forfeiture provisions ‐ The total amount contributed by the member, including associated investment gains and losses, shall immediately vest in the member's account and is nonforfeitable. The total amount contributed by the employer, including associated investment gains and losses, vests with the member and is non‐forfeitable upon completion of three (3) years of contributory service. Non‐vested employer contributions are forfeited upon termination of employment. Such forfeitures can be used by employers to offset future remittances to the plan.
Retirement benefits ‐ Benefits may be paid to a member after severance from employment, death, plan termination, or upon a deemed severance from employment for participants performing quality military service. At a minimum, retirement benefits must begin no later than April 1 of the calendar year following the year in which the member attains age 70½ or terminates employment, if later.
The System issues a publicly available financial report that includes financial statements and required supplementary information for plans administered by the system. The report may be obtained at http://www.ersri.org.

NARRAGANSETT BAY COMMISSION Notes to Financial Statements (Continued)
June 30, 2015
Notes to Financial Statements
46
NOTE 12 ‐ PENSION PLANS (CONTINUED)
NON‐UNION PROFIT‐SHARING PLAN
NBC's Board of Commissioners approved a resolution at the regular business meeting on May 15, 2002 adopting the Narragansett Bay Commission Non‐union Defined Contribution Plan, which is a profit‐sharing plan for its non‐union employees pursuant to 401(a) of the Internal Revenue Code. The profit‐sharing plan is a defined contribution, single employer pension plan. As of June 30, 2015, there were 120 active participants.
Contributions are discretionary and established annually and may be amended by the Board of Commissioners. NBC's contribution to the profit‐sharing plan for the year ended June 30, 2015 amounted to $422,569 representing a contribution rate of 5% of eligible employee compensation for the year ended June 30, 2015. Employees are allowed to make voluntary contributions to the profit‐sharing plan on an after‐tax basis. The employees' contribution to the plan for the year ended June 30, 2015 amounted to $0. Non‐union employees are eligible to participate in the profit‐sharing plan if they have performed one year of service and are at least twenty‐one years of age. These provisions were adopted and may be amended by the Board of Commissioners.
NBC funds the annual profit‐sharing plan contribution biweekly based on each eligible employee's biweekly compensation. The plan is administered by a third‐party administrator and Reliance Trust Company is the Plan's trustee. NBC's payroll for employees covered by the profit‐sharing plan was $8,939,428 for the year ended June 30, 2015. The total payroll for the year ended June 30, 2015 amounted to $15,456,170.
NON‐UNION DEFINED BENEFIT PLAN
Plan Description
Plan Administration ‐ The Board of the Narragansett Bay Commission (Board) approved a resolution at the regular business meeting on December 20, 2004 adopting a defined benefit plan for its non‐union employees effective February 1, 2005, pursuant to 401(a) of the Internal Revenue Code. The plan is a single‐employer, defined benefit pension plan. The plan year begins January 1 and ends December 31, with the initial plan year ending December 31, 2005. The Plan assets are invested under a group annuity contract issued by MassMutual Financial Group, which also provides certain administrative services. NBC has a third party administrator, The Angell Pension Group, Inc. and Reliance Trust Company is the Plan's trustee. Various asset classes and investment manager styles are used to create a broadly diversified portfolio. The Investment Committee (IC) develops long‐term asset allocation ranges, and works in conjunction with NBC's investment advisor GPS Investment Advisors, LLC, a fiduciary to the Plan, to select investments and review asset allocations and performance. Please refer to the Notes of the Financial Statements under "Investment Policy" for more information on asset allocations.
Plan Membership ‐ All full‐time, non‐seasonal non‐union employees of NBC become participants of the Plan upon completion of the eligibility requirements. As of June 30, 2015, there were 148 Plan participants: 35 were inactive participants, of which 24 were vested and terminated and 11 were retirees, and 113 participants were active.

NARRAGANSETT BAY COMMISSION Notes to Financial Statements (Continued)
June 30, 2015
Notes to Financial Statements
47
NOTE 12 ‐ PENSION PLANS (CONTINUED)
NON‐UNION DEFINED BENEFIT PLAN (CONTINUED)
Plan Description (Continued)
Benefits Provided ‐ All non‐union employees are eligible to participate in the plan after the completion of one year of service and attaining age 21. The monthly retirement benefit is based on 1% of average monthly compensation multiplied by total years of service limited to 30 years. Participants are eligible to retire at age 65 after 5 years of service. A participant is eligible for early actuarially adjusted retirement after 20 years of service and if they have attained age 62. The Plan has cliff vesting after 7 years. There were no retirement benefit payment distributions for the first five years of the plan. The Board is authorized to establish and amend all plan provisions. Effective as of January 1, 2007 the Plan was amended such that 1,000 hours of service were added to the definitions of both "Period of Service" and "Period of Participation."
Contributions ‐ The Plan was established, and is sponsored and administered by the Board. The Plan document provides for periodic NBC contributions at actuarially determined amounts sufficient to accumulate the necessary assets to pay benefits when due. The Board's funding policy during 2015 and in prior years provided for periodic contributions of at least the actuarial required contribution (ARC) sufficient to accumulate the necessary assets to pay benefits when due. The contribution requirements of the Plan participants and the NBC are established and may be amended by the Board. Eligible Plan participants must contribute 5% of covered earnings. To the extent that the resources are available, the Board's operating budget resolution provides for additional contributions to the Plan above the minimum ARC. The annual required NBC contribution for the fiscal year ending June 30, 2015 was $657,313.
The contributions made to the plan for the fiscal year ended June 30, 2015 were $1,397,053 which consists of employer contributions of $986,656 and employee contributions of $410,397.
Summary of Significant Accounting Policies
Basis of Accounting ‐ The Plan's financial statements are prepared using the accrual basis of accounting and in accordance with generally accepted accounting principles that apply to governmental accounting for defined benefit plans. Employer contributions are recognized when made, because there are no required due dates for contributions. Other additions are recognized when due. Benefits and refunds are recognized when due and payable in accordance with the terms of the Plan document. Plan expenses, other than benefits and refunds, are recognized on the accrual basis in accordance with generally accepted accounting principles.
Plan Expenses ‐ Certain expenses are paid from the assets of the Plan and are recorded as administrative expenses on the financial statements. These expenses include benefit payment processing fees and other administrative expenses.
Income Taxes ‐ Pursuant to a determination letter received from the Internal Revenue Service (IRS) dated October 25, 2011, the Plan is exempt from federal income taxes. Although the Plan has been subsequently amended, NBC's legal counsel is of the opinion that the Plan, as amended, meets the IRS requirements and, therefore, continues to be tax exempt.

NARRAGANSETT BAY COMMISSION Notes to Financial Statements (Continued)
June 30, 2015
Notes to Financial Statements
48
NOTE 12 ‐ PENSION PLANS (CONTINUED)
NON‐UNION DEFINED BENEFIT PLAN (CONTINUED)
Summary of Significant Accounting Policies (Continued)
Fair Value of Investments ‐ Plan investments are reported at fair value. The Plan's custodian provides pricing for all Plan investments. Plan investments in market‐traded securities, including U.S. Government and agency securities, municipal and corporate bonds and debentures, and common stock are reported at last quoted sales/bid prices provided by independent pricing vendors. These holdings are valued by investment managers in accordance with the authoritative guidance on fair value measurements and disclosures. Valuation policies and procedures are generally described in the investment managers' financial statements. Cash equivalents are valued at cost, which approximates fair value.
Use of Estimates ‐ The preparation of financial statements in conformity with accounting principles generally accepted in the United States of America requires the Plan's management to make estimates and assumptions that affect the reported amounts of assets, liabilities, and changes therein, disclosure of contingent assets and liabilities, and the actuarial values at the date of the financial statements. Actual results could differ from these estimates.
Investments
Investment Policy ‐ The Plan's policy in regard to the allocation of invested assets is established and may be amended by the IC by a majority vote of its members. It is the policy of the IC to pursue an investment strategy that reduces risk through the prudent diversification of the portfolio across a broad selection of distinct asset classes. The Plan's investment policy discourages the use of cash equivalents, except for liquidity purposes, and aims to refrain from dramatically shifting asset class allocations over short time spans.
The primary objective of the IC's investment policy is to preserve the actuarial soundness of the Plan by achieving a long‐term return of at least the actuarial return rate and to prudently manage the inherent investment risks that are related to the achievement of this goal. The IC recognizes that the investment objective is long term in nature, and that actual year‐to‐year returns achieved may be above or below the actuarially assumed rate of return. The following was the IC's adopted asset allocation policy as of June 30, 2015:
Asset Class
Target
Allocation
Large Cap US Equity 30%Small / Mid Cap US Equity 10%International Equity 15%Intermediate to Long‐Term Bonds 35%Short‐Term Bonds and Cash 10%
Total 100%

NARRAGANSETT BAY COMMISSION Notes to Financial Statements (Continued)
June 30, 2015
Notes to Financial Statements
49
NOTE 12 ‐ PENSION PLANS (CONTINUED)
NON‐UNION DEFINED BENEFIT PLAN (CONTINUED) Investments (Continued)
Investment Policy (Continued) ‐ The long‐term expected rate of return on pension plan investments was determined using a building‐block method in which best‐estimate ranges of expected future real rates of return (expected returns, net of pension plan investment expense and inflation) are developed for each major asset class. These ranges are combined to produce the long‐term expected rate of return by weighting the expected future real rates of return by the target asset allocation percentage and by adding expected inflation.
Concentrations of Credit Risk – Concentration of credit risk is the risk of loss attributed to the magnitude of an investment in a single issuer. Investments issued or explicitly guaranteed by the U.S. Government and investments in diversified mutual funds, external investment pools, and other pooled investments are excluded. As of June 30, 2015, the Plan had no investments in any one organization that represented 5% or more of the Plan's net position restricted for pension.
Money‐Weighted Rate of Return ‐ For the year ended June 30, 2015 the annual money‐weighted rate of return on Plan investments, net of investment expense, was 2.81%. The money‐weighted rate of return considers the changing amounts actually invested during a period and weights the amount of pension plan investments by the proportion of time they are available to earn a return during that period. External cash flows are determined on a monthly basis and are assumed to occur at the end of each month. External cash inflows are netted with external cash outflows, resulting in a net external cash flow in each month. The money‐weighted rate of return is calculated net of investment expenses.
Custody and Management of Assets ‐ During 2015 MassMutual Financial Group served as asset custodian for all Plan assets. The Board has elected to hire professional investment managers to invest the assets of the Plan on a fully discretionary basis, subject to the investment policy of the IC. The Plan is evaluated periodically against the appropriate benchmark for asset class and style. Failure to achieve the desired result does not necessitate, nor does achievement of the desired result preclude, a change in investments or termination of investment managers.
Custodial Credit Risk – Custodian credit risk is the risk that, in the event of a failure of the counterparty, the Plan will not be able to recover its investment or collateral securities that are in the possession of an outside party. Investment securities are exposed to custodial credit risk if the securities are uninsured, are not registered in the name of the Plan, and are held by either the counterparty or the counterparty's trust department or agent but not in the Plan's name.
At June 30, 2015, there were no deposits subject to custodial credit risk.

NARRAGANSETT BAY COMMISSION Notes to Financial Statements (Continued)
June 30, 2015
Notes to Financial Statements
50
NOTE 12 ‐ PENSION PLANS (CONTINUED)
NON‐UNION DEFINED BENEFIT PLAN (CONTINUED)
Investments (Continued)
Interest Rate Risk ‐ Interest rate risk is the risk that changes in interest rates will adversely affect the fair value of the investment. Since the debt investment portfolio may contain holdings with prepayments and variable cash flows, an analysis of interest rate risk using the money‐weighted selected period performance method is presented in the schedule below:
Sector Market Value 3 Months 1 Year 3 Year
Inception to
Date
(44 Months)
MassMutual Core SAGIC $ 522,291 0.71 2.62 2.44 2.48 Select MetroWest Total Return Bond 2,143,646 (1.36) 1.02 2.11 2.82 Permier Babson Capital Inf.‐Protect. and Income 533,918 (1.28) (2.47) (1.72) (0.48)Delaware Extended Duration Bond 1,004,458 (7.00) (0.87)Alliance Bernstein Global Bond Advisor 532,182 (2.21) 2.08 American Funds Washington Mutual 755,914 (1.24) 3.32 MassMutual S&P 500 Index Fund 1,642,542 0.12 6.95 13.59 13.49 MFS Growth I 767,966 0.20 10.01 MFS Mid Cap Value 214,921 (1.53) (0.21)MassMutual S&P Mid Cap Index 323,989 (1.26) 6.14 Select T. Rowe Price/Frontier Mid Cap Growth II 221,982 1.35 14.56 JP Morgan Small Cap Value 213,439 (2.01) 1.37 T. Rowe Price New Horizons 222,355 1.23 11.30 26.16 23.38 MassMutual MSCI EAFE International Index 544,927 0.52 (4.29)American Funds EuroPacific Growth 1,095,253 1.01 1.39 12.48 10.24
Total fund $ 10,739,783 (1.10) 2.81 8.03 7.74
Credit Risk – Credit risk is the risk that an issuer or other counterparty to a debt instrument will not fulfill its obligations to the Plan. There are no Plan‐wide policy limitations for credit risk exposures within the portfolio.
Foreign Currency Risk ‐ Foreign currency risk is the risk that changes in exchange rates will adversely impact the fair value of an investment or a deposit. At June 30, 2015, there were no deposits subject to foreign currency risk.

NARRAGANSETT BAY COMMISSION Notes to Financial Statements (Continued)
June 30, 2015
Notes to Financial Statements
51
NOTE 12 ‐ PENSION PLANS (CONTINUED)
NON‐UNION DEFINED BENEFIT PLAN (CONTINUED)
Investments (Continued)
Derivatives ‐ Derivatives are financial instruments whose values depend upon, or are derived from, the value of something else, such as one or more underlying investments, indexes or currencies. Derivatives may be used both for hedging and to enhance returns. Derivatives may be traded on organized exchanges, or individually negotiated transactions with other parties, known as over‐the‐counter derivatives. Derivatives involve special risks and costs and may result in losses to the Plan. The successful use of derivatives requires sophisticated management, and, to the extent that derivatives are used, the Plan will depend on the investment managers and their advisors to analyze and manage derivatives transactions. Certain commingled funds held by the Plan at the year‐end were permitted through their individual investment guidelines to use derivative instruments, including forwards, futures, swaps, and options. Disclosures about derivative holdings of the commingled fund managers can be found in their respective audited financial statements. The plan did not directly own any derivatives as of June 30, 2015.
Net Pension Liability ‐ The components of the NBC’s net pension liability at June 30, 2015, were as follows:
Total pension liability 16,104,077$ Plan fiduciary net position (11,239,783)
NBC's net pension liability 4,864,294$
Plan fiduciary net position as a percentage of the total pension liability 69.79%
Total Pension
Liability
Plan Fiduciary
Net Position
Net Pension
Liability
13,349,388$ 9,701,640$ 3,647,748$ Changes for the year: Service cost 504,855 ‐ 504,855 Interest on total pension liability 803,212 ‐ 803,212 Differences between expected and actual experience 232,651 ‐ 232,651 Change in assumptions 1,350,562 1,350,562 Contributions ‐ employer ‐ 986,656 (986,656) Contributions ‐ employee ‐ 410,397 (410,397) Net investment income ‐ 283,708 (283,708) Benefit payments (136,591) (136,591) ‐ Administrative expense ‐ (6,027) 6,027 Net changes 2,754,689 1,538,143 1,216,546
16,104,077$ 11,239,783$ 4,864,294$
Balance as of July 1, 2014
Balance as of June 30, 2015

NARRAGANSETT BAY COMMISSION Notes to Financial Statements (Continued)
June 30, 2015
Notes to Financial Statements
52
NOTE 12 ‐ PENSION PLANS (CONTINUED)
NON‐UNION DEFINED BENEFIT PLAN (CONTINUED)
Actuarial Assumptions ‐ The total pension liability was determined by an actuarial valuation as of June 30, 2015, using the following actuarial assumptions, applied to all periods included in the measurement:
Inflation N/A Salary increases 3.50%, average, including inflation Investment rate of return 6.00%, net of pension plan investment expense,
including inflation
Mortality rates were based on RP‐2014 blended 60% white collar and 40% blue collar tables for annuitants and non‐annuitants (separate tables for male/female) with MP‐2014 mortality improvement scale.
The actuarial assumptions used in the June 30, 2015 valuation were based on the results of an actuarial experience study for the period ended June 30, 2015.
The long‐term expected rate of return on pension plan investments was determined using a building‐block method in which best‐estimate ranges of expected future real rates of return (expected returns, net of pension plan investment expense and inflation) are developed for each major asset class. These ranges are combined to produce the long‐term expected rate of return by weighting the expected future real rates of return by the target asset allocation percentage and by adding expected inflation. Best estimates of arithmetic real rates of return for each major asset class included in the pension plan's target asset allocation as of June 30, 2015 (see the discussion of the pension plan's investment policy) are summarized in the following table based upon the actuaries assumptions:
Asset Class
Long‐Term Expected
Real Rate of Return
Large Cap US Equity 7.5%Small / Mid Cap US Equity 7.7%International Equity 8.0%Intermediate to Long‐Term Bonds 4.0%Short‐Term Bonds and Cash 2.2%
Discount Rate – The discount rate used to measure the total pension liability was 6.00%. The projection of cash flows used to determine the discount rate assumed that plan participant contributions will be made at the current contribution rate and that NBC contributions will be made at rates equal to the difference between actuarially determined contribution rates and the participant rate. Based on those assumptions, the pension plan's fiduciary net position was projected to be available to make all projected future benefit payments of current plan members. Therefore, the long‐term expected rate of return on pension plan investments was applied to all periods of projected benefit payments to determine the total pension liability.

NARRAGANSETT BAY COMMISSION Notes to Financial Statements (Continued)
June 30, 2015
Notes to Financial Statements
53
NOTE 12 ‐ PENSION PLANS (CONTINUED)
NON‐UNION DEFINED BENEFIT PLAN (CONTINUED)
Sensitivity of the Net Pension Liability to Changes in the Discount Rate ‐ The following presents the net pension liability of the NBC, calculated using the discount rate of 6.00%, as well as what the NBC's net pension liability would be if it were calculated using a discount rate that is 1‐ percentage‐point lower (5.00%) or I‐percentage‐point higher (7.00%) than the current rate:
1% Decrease
(5%)
Current Discount
Rate (6%)
1% Increase
(7%)
Plan's Net Pension Liability 7,199,095$ 4,864,294$ 2,917,109$
Pension Expense and Deferred Outflows and Deferred Inflows of Resources Related to Pensions
For the year ended June 30, 2015, the NBC recognized pension expense of $427,540. At June 30, 2015, the NBC reported deferred outflows of resources and deferred inflows of resources related to pensions from the following sources:
Deferred Outflows
of Resources
Deferred Inflows
of Resources
Difference between expected and actual experience $ 210,013 (150,858)$ Change in assumptions 1,560,180 ‐ Net difference between projected and actual earnings 261,924 (371,353) $ 2,032,117 (522,211)$
Amounts reported as deferred outflows of resources and deferred inflows of resources related to pensions will be recognized in pension expense as follows:
Year ended June 30:
Deferred Inflows and Outflows of Resources
2016 $ 118,462 2017 118,4622018 119,9402019 242,7392020 177,258
Thereafter 733,045 Total $ 1,509,906

NARRAGANSETT BAY COMMISSION Notes to Financial Statements (Continued)
June 30, 2015
Notes to Financial Statements
54
NOTE 13 ‐ SALARY DEFERRAL
Under a salary reduction plan adopted by NBC, the gross pay of non‐union employees of the Field's Point service area was reduced by 12½% from March 10, 1991 through June 29, 1991; the gross pay of union employees of the Bucklin Point service area was reduced 14% from April 21, 1991 through June 29, 1991; and the gross pay of all non‐union employees of the Field's Point service area was reduced 10% from June 30, 1991 through March 21, 1992. The equivalent number of pay hours was accrued as deferred vacation days. Field's Point service area employees may discharge this additional deferred leave during any payroll period following the payroll period(s) in which it was earned commencing July 1, 1991.
Bucklin Point service area employees may discharge this additional deferred leave during any payroll period following the payroll period(s) in which it was earned. Cash payment may be elected for one additional day of paid leave per calendar month commencing July 1, 1992.
Employees at either facility may retain this additional deferred leave to be paid upon termination and at such time, receive payment at their then‐current rate of pay.
Salary deferred under the salary reduction plan is included in compensated absences as of June 30, 2015 and is reported as a long‐term liability within other accrued expenses.
NOTE 14 ‐ USER BILLING
At its 1983 session, the Rhode Island General Assembly enacted Public Law 1983 Chapter 235, which amended NBC's enabling legislation (Title 46, Chapter 25 of the General Laws). The amendment required that NBC institute a retail billing system with rates and fees subject to review and approval by the PUC. A PUC approved retail billing system went into effect July 1, 1985, for the Field's Point service area, and January 1, 1992, for the Bucklin Point service area.
NOTE 15 ‐ COMMITMENTS AND CONTINGENCIES
NBC has entered into various engineering and construction contracts for the design and improvement of its facilities as part of its capital improvement program. Commitments under these contracts aggregated approximately $28,127,935 at June 30 2015.
NBC, during the ordinary course of its operations, is a party to various claims, legal actions and complaints. In the opinion of NBC's management and legal counsel, the potential liability to NBC, if any, or an evaluation of the outcome to these matters cannot be made at the present time.
NOTE 16 ‐ POST‐EMPLOYMENT UNION HEALTHCARE PLAN
Plan Description ‐ The NBC contributes (for union employees) to the State Employees' defined benefit post‐employment health care plan, a cost sharing multiple employer plan administered through the RI State Employees' and Electing Teachers Other Post Employment Benefit System (OPEB). The State of Rhode Island OPEB Board (Board) was authorized, created and established under Chapter 36‐12.1 of the RI General Laws. The Board was established to independently hold and administer, in trust, the funds of the OPEB system. The plan provides medical benefits to certain retired employees of participating employers including NBC.

NARRAGANSETT BAY COMMISSION Notes to Financial Statements (Continued)
June 30, 2015
Notes to Financial Statements
55
NOTE 16 ‐ POST‐EMPLOYMENT UNION HEALTHCARE PLAN (CONTINUED)
Plan Description (Continued)
Pursuant to legislation enacted by the General Assembly, a trust has been established to accumulate assets and pay benefits and other costs associated with the system.
The OPEB system issues a stand‐alone, publically available financial report that includes the financial statements and required supplementary information. A copy of the report can be obtained from the State Controller's Office, 1 Capitol Hill, Providence, RI 02903.
Funding Policy ‐ RIGL Sections 36‐12.1, 36‐12‐2.2, and 36‐12‐4 govern the provisions of the OPEB System. The contribution requirements of plan members, the State, and other participating employers are established and may be amended by the General Assembly. Active employees make no contribution to the OPEB plan. Employees who retired after October 1, 2008 must contribute 20% of the annual estimated benefit cost (working rate) or annual premium for Medicare supplemental coverage. Employees retiring before October 1, 2008 have varying co‐pay percentages ranging from 0% to 50% based on age and years of service at retirement. Further information about the contributions of plan members can be found in the financial report of the OPEB System.
All participating employers are required by law to fund the actuarially determined annual required contribution (ARC), which for fiscal year 2014 was 7.07% of covered payroll. The ARC represents a level of funding that, if paid on an ongoing basis, is projected to cover normal costs each year and amortize any unfunded actuarial liabilities (or funding excess) over a period not to exceed thirty years. The Narragansett Bay Commission's contributions to the plan for the fiscal years ended June 30, 2015, 2014, and 2013 were $405,562, $405,491, and $375,736 respectively, which represents 100% of the ARC.
NOTE 17 ‐ SUBSEQUENT EVENTS
Management has evaluated subsequent events through September 8, 2015, the date the financial statements were available to be issued. The following events occurred subsequent to June 30, 2014, the measurement date of the State pension plan.
Subsequent to June 30, 2014 (the measurement date), litigation challenging the various pension reform measures enacted in previous years by the General Assembly (2009, 2010, and 2011) was settled. The final settlement approved by the Court on July 8, 2015 also included enactment of the pension settlement provisions by the General Assembly.
The amended benefit provisions in the newly enacted legislation and settlement agreement have not been reflected in the determination of the net pension liability at June 30, 2014 (the measurement date). These amended benefit provisions are summarized below:
Employees with more than 20 years of service at July 1, 2012 will increase their employee contribution rate from 3.75% to 11% and participate solely in the defined benefit plan going forward ‐ service credit accruals will increase from 1% to 2% per year.

NARRAGANSETT BAY COMMISSION Notes to Financial Statements (Continued)
June 30, 2015
Notes to Financial Statements 56
NOTE 17 ‐ SUBSEQUENT EVENTS (CONTINUED)
Employees with more than 10 but less than 20 years of service at July 1, 2012 will receive an
increased employer contribution to the defined contribution plan. Retirees as of June 30, 2015 will receive two $500 stipends; the interim cost of living
increases will occur at 4 year rather 5 year intervals. • Minor adjustments were made to the actuarial reduction for employees choosing to retire early. These amendments are not considered to have a material effect on the net pension liability had they been retroactively applied to the calculation of the total pension liability at June 30, 2013 rolled forward to June 30, 2014. An actuarial analysis of the pension settlement provisions enacted by the General Assembly and approved by the Court indicated that the funded ratio at June 30, 2014 for state employees (determined on a funding basis) decreased from 57.4% to 56.1%. The NBC closed on Pooled Loan #18 ‐ Series 2015 B from RIIB dated July 30, 2015 in the amount of $41,753,500 with $512,070 of principal forgiveness at an interest rate of 2.549%.

This page was intentionally left blank.

June 30, 2015 June 30, 2014Total pension liability
Service cost 504,855$ 441,297$ Interest 803,212 729,646 Differences between expected and actual experience 232,651 (187,670) Change in assumptions 1,350,562 424,254 Benefit payments, including refunds of participant contributions (136,591) (120,730)
Net Change in total pension liability 2,754,689 1,286,797
Total pension liability ‐ beginning 13,349,388 12,062,591
Total pension liability ‐ ending 16,104,077$ 13,349,388$
Pension fiduciary net position
Contributions ‐ employer 986,656$ 789,435$ Contributions ‐ employee 410,397 398,975 Net Investment income 283,708 1,101,958 Benefit payments (136,591) (120,730) Administrative expense (6,027) (2,639)
Net change in plan fiduciary net position 1,538,143 2,166,999
Plan fiduciary net position ‐ beginning 9,701,640 7,534,821
Plan fiduciary net position ‐ ending 11,239,783$ 9,701,820$
NBC's net pension liability ‐ ending 4,864,294$ 3,647,568$
(Continued)
* First year of implementation of GASB 68, therefore only two years of the 10 years required data is available.
Last 10 Fiscal Years*
NARRAGANSETT BAY COMMISSION
Required Supplementary InformationSchedule of Changes in Net Pension Liability and Related Ratios‐
Non‐Union Defined Benefit Plan (Unaudited) For the Year Ended June 30, 2015
See independent auditor's report
57

June 30, 2015 June 30, 2014
Total pension liability 16,104,077$ 13,349,388$ Plan fiduciary net position 11,239,783 9,701,640
NBC's net pension liability 4,864,294$ 3,647,748$
Plan fiduciary net position as a percentage of total pension liability 69.79% 72.67%
Covered‐employee payroll 9,118,088$ 8,813,634$
Net pension liability as a percentage of covered‐employee payroll 53.35% 41.39%
* First year of implementation of GASB 68, therefore only two years of the 10 years required data is available.
Last 10 Fiscal Years*
NARRAGANSETT BAY COMMISSION
Required Supplementary Information
For the Year Ended June 30, 2015
Schedule of Changes in Net Pension Liability and Related Ratios‐Non‐Union Defined Benefit Plan (Unaudited) (Continued)
See independent auditor's report
58
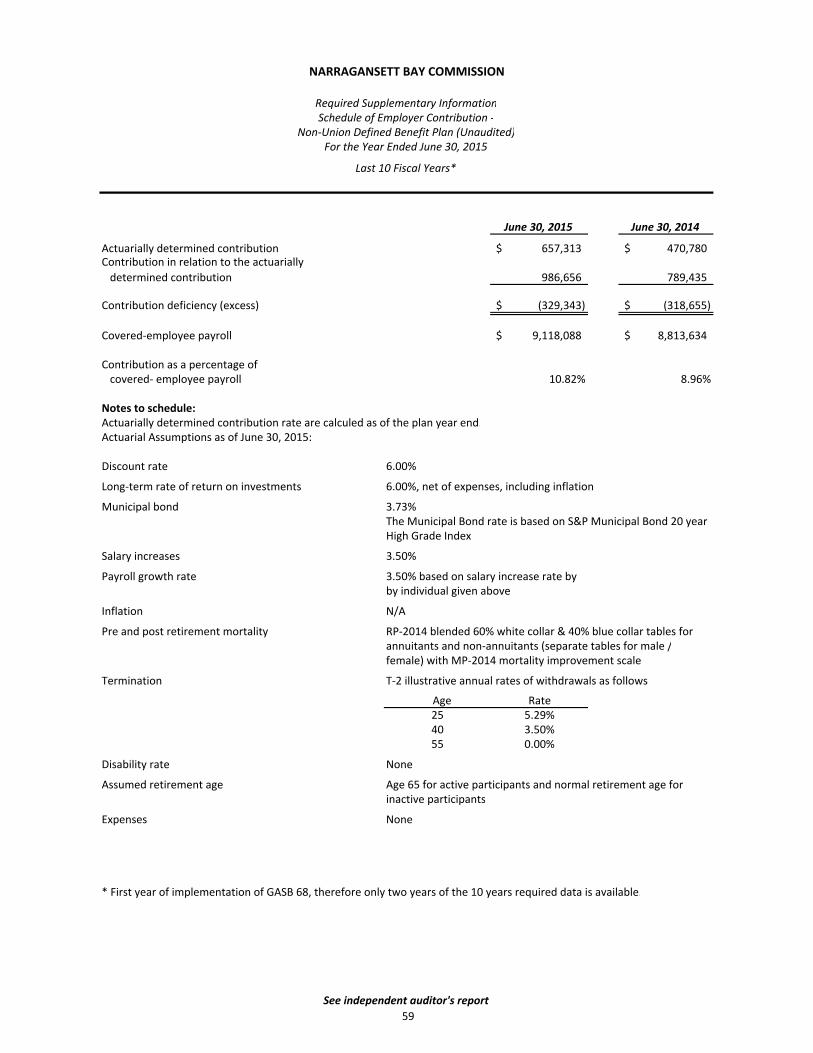
June 30, 2015 June 30, 2014
Actuarially determined contribution 657,313$ 470,780$ Contribution in relation to the actuarially determined contribution 986,656 789,435
Contribution deficiency (excess) (329,343)$ (318,655)$
Covered‐employee payroll 9,118,088$ 8,813,634$
Contribution as a percentage of covered‐ employee payroll 10.82% 8.96%
Notes to schedule:Actuarially determined contribution rate are calculed as of the plan year end.Actuarial Assumptions as of June 30, 2015:
Discount rate 6.00%
Long‐term rate of return on investments 6.00%, net of expenses, including inflation
Municipal bond 3.73%The Municipal Bond rate is based on S&P Municipal Bond 20 year High Grade Index
Salary increases 3.50%
Payroll growth rate 3.50% based on salary increase rate byby individual given above
Inflation N/A
Pre and post retirement mortality RP‐2014 blended 60% white collar & 40% blue collar tables for annuitants and non‐annuitants (separate tables for male /female) with MP‐2014 mortality improvement scale
Termination T‐2 illustrative annual rates of withdrawals as follows:
Age Rate25 5.29%
40 3.50%55 0.00%
Disability rate None
Assumed retirement age Age 65 for active participants and normal retirement age for inactive participants
Expenses None
* First year of implementation of GASB 68, therefore only two years of the 10 years required data is available.
For the Year Ended June 30, 2015
Last 10 Fiscal Years*
NARRAGANSETT BAY COMMISSION
Required Supplementary InformationSchedule of Employer Contribution ‐
Non‐Union Defined Benefit Plan (Unaudited)
See independent auditor's report
59

June 30, 2015 June 30, 2014
Annual money‐weighted rate of returnnet of investment expense 2.81% 13.84%
* First year of implementation of GASB 68, therefore only two years of the 10 years required data is available.
For the Year Ended June 30, 2015
NARRAGANSETT BAY COMMISSION
Required Supplementary InformationSchedule of Investment Returns ‐
Non‐Union Defined Benefit Plan (Unaudited)
Last 10 Fiscal Years*
See independent auditor's report
60

June 30, 2014
NBC's proportion of the net pension liability 15,554,087$
NBC's proportionate share of the net pension liability 0.873%
NBC's covered‐employee payroll 5,713,866$
NBC's proportionate share of the net pension liabilityas a percentage of its covered employee payroll 272.22%
Plan fiduciary net position as a percentage of the totalpension liability 0.879%
Note:
The amount presented for this fiscal year was based on the prior fiscal year June 30 measurement date.
*First year of implementation of GASB 68, therefore only one year of 10 years required data is available.
Last 10 Fiscal Years*
NARRAGANSETT BAY COMMISSION
Required Supplementary InformationSchedule of Proportionate Share of the Net Pension Liability
Employees' Retirement System RI (Unaudited)For the Year Ended June 30, 2015
See independent auditor's report
61

June 30, 2014
Statutorily determined contribution 1,317,046$
Contributions in relation to the statutorily determine contribution 1,317,046
Contribution deficiency (excess) ‐$
Covered‐employee payroll 5,713,866$
Contribution as a percentage of covered‐employee payroll 23.05%
Note:
Employers participating in the State Employees' Retirement System are required by the RI General Laws Section 36‐10‐2,to contribute an actuarially determined contribution rate each year.
*First year of implementation of GASB 68, therefore only one year of 10 years required data is available.
Last 10 Fiscal Years*
NARRAGANSETT BAY COMMISSION
Required Supplementary InformationSchedule of Contributions
Employees' Retirement System RI (Unaudited)For the Year Ended June 30, 2015
See independent auditor's report
62

Budget Actual
Variance Favorable
(Unfavorable)
OPERATING EXPENSES
Personnel servicesUnion regular 6,169,039$ 5,857,836$ 311,203$ Union overtime 508,900 473,737 35,163 Non‐union regular 9,290,678 9,059,328 231,350 Non‐union overtime 83,400 58,760 24,640 Non‐union limited 27,133 6,479 20,654 Fringe benefits 7,993,182 8,012,948 (19,766) Project salaries and fringe benefits capitalized (1,980,646) (1,702,712) (277,934)
Total personnel services 22,091,686 21,766,376 325,310
General and administrationInsurance 640,000 589,344 50,656 Workers' compensation insurance 410,000 391,756 18,244 Workers' compensation old claims 30,000 (1,674) 31,674
Total general and administration 1,080,000 979,426 100,574
OPERATIONS AND MAINTENANCE
TravelLocal travel 4,700 2,435 2,265 Long distance travel 59,300 46,297 13,003
Total travel 64,000 48,732 15,268
Repairs and maintenanceBuilding and ground maintenance 160,982 136,733 24,249 Vehicle fuel and maintenance 232,650 212,146 20,504 Repairs, building and structures 440,350 445,276 (4,926) Repairs, highway and walks 23,400 13,704 9,696 Maintenance/service agreements 1,067,404 1,021,170 46,234 Highway and landscape 13,000 10,316 2,684 Diesel for equipment 18,000 14,325 3,675
Total repairs and maintenance 1,955,786 1,853,670 102,116
UtilitiesTelephone 175,720 168,613 7,107 Central telephone services 4,500 3,288 1,212 Fuel, gas 470,233 373,971 96,262 Electricity 3,560,694 3,162,725 397,969 Water 38,500 33,407 5,093
Total utilities 4,249,647 3,742,004 507,643
(Continued)
For the Year Ended June 30, 2015
NARRAGANSETT BAY COMMISSIONSchedule of Expenses ‐ Budget and Actual (Budgetary Basis)
63

Budget Actual
Variance Favorable
(Unfavorable)
OPERATIONS AND MAINTENANCE (CONTINUES)
SuppliesClothing and clothing materials 32,700$ 23,470$ 9,230$ Building and machinery supplies and expenses 285,300 256,984 28,316 Educational expenses 67,500 43,370 24,130 Lab supplies 300,665 301,497 (832) computer supplies 85,750 61,932 23,818 Other operating supplies and expenses 17,950 14,543 3,407 Chemicals 777,040 584,599 192,441
Total Supplies 1,566,905 1,286,395 280,510
TOTAL OPERATIONS AND MAINTENANCE 7,836,338 6,930,801 905,537
Contract servicesMedical services 10,790 10,327 463 Biosolids disposal 5,505,623 4,177,385 1,328,238 Screening and grit disposal 128,456 99,919 28,537 Service agreements 181,774 202,861 (21,087) Security services 47,600 30,640 16,960 Regulatory expenses 472,850 419,921 52,929 Legal services 211,000 162,491 48,509 Management/audit services 2,191,875 2,174,068 17,807 Special clerical services 33,767 29,437 4,330 Other special services 224,900 161,985 62,915
Total contract services 9,008,635 7,469,034 1,539,601
MiscellaneousOffice expenses 92,675 86,506 6,169 Postage 448,855 398,412 50,443 Dues and subscriptions 59,865 58,412 1,453 Freight 36,450 30,974 5,476 Printing and binding 146,840 133,690 13,150 Advertising 16,700 3,445 13,255 Rental of outside property 3,200 2,153 1,047 Rental of equipment 33,520 26,922 6,598 Rental of clothing 32,500 28,625 3,875 Safety equipment 44,100 42,064 2,036 Miscellaneous 4,600 4,139 461 Public outreach education 20,000 19,620 380
Total miscellaneous 939,305 834,962 104,343
TOTAL OPERATING EXPENSES 40,955,964 37,980,599 2,975,365
(Continued)
NARRAGANSETT BAY COMMISSIONSchedule of Expenses ‐ Budget and Actual (Budgetary Basis)(Continued)
For the Year Ended June 30, 2015
64
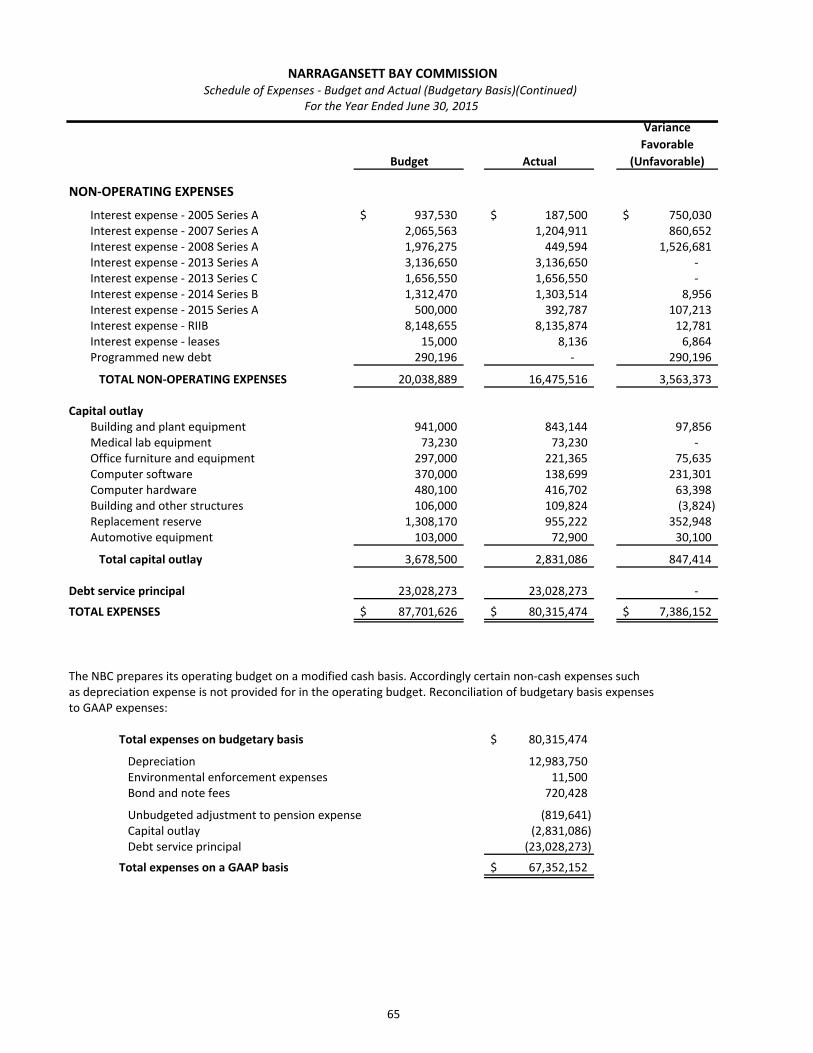
Budget Actual
Variance Favorable
(Unfavorable)
NON‐OPERATING EXPENSES
Interest expense ‐ 2005 Series A 937,530$ 187,500$ 750,030$ Interest expense ‐ 2007 Series A 2,065,563 1,204,911 860,652 Interest expense ‐ 2008 Series A 1,976,275 449,594 1,526,681 Interest expense ‐ 2013 Series A 3,136,650 3,136,650 ‐ Interest expense ‐ 2013 Series C 1,656,550 1,656,550 ‐ Interest expense ‐ 2014 Series B 1,312,470 1,303,514 8,956 Interest expense ‐ 2015 Series A 500,000 392,787 107,213 Interest expense ‐ RIIB 8,148,655 8,135,874 12,781 Interest expense ‐ leases 15,000 8,136 6,864 Programmed new debt 290,196 ‐ 290,196
TOTAL NON‐OPERATING EXPENSES 20,038,889 16,475,516 3,563,373
Capital outlayBuilding and plant equipment 941,000 843,144 97,856 Medical lab equipment 73,230 73,230 ‐ Office furniture and equipment 297,000 221,365 75,635 Computer software 370,000 138,699 231,301 Computer hardware 480,100 416,702 63,398 Building and other structures 106,000 109,824 (3,824) Replacement reserve 1,308,170 955,222 352,948 Automotive equipment 103,000 72,900 30,100
Total capital outlay 3,678,500 2,831,086 847,414
Debt service principal 23,028,273 23,028,273 ‐
TOTAL EXPENSES 87,701,626$ 80,315,474$ 7,386,152$
The NBC prepares its operating budget on a modified cash basis. Accordingly certain non‐cash expenses suchas depreciation expense is not provided for in the operating budget. Reconciliation of budgetary basis expensesto GAAP expenses:
Total expenses on budgetary basis 80,315,474$ Depreciation 12,983,750 Environmental enforcement expenses 11,500 Bond and note fees 720,428
Unbudgeted adjustment to pension expense (819,641) Capital outlay (2,831,086) Debt service principal (23,028,273)
Total expenses on a GAAP basis 67,352,152$
NARRAGANSETT BAY COMMISSIONSchedule of Expenses ‐ Budget and Actual (Budgetary Basis)(Continued)
For the Year Ended June 30, 2015
65

Operating Reserve
Reven
ue
O & M
Project
Deb
t Service
for Reven
ue
Deb
t Service
Fund
Fund
Fund
Fund
Stability Fund
Reserve Fund
Total
Assets
Curren
t assets
Cash and
cash eq
uivalents
7,72
4,61
4$
7,62
5,40
1$
649,78
8$
‐$
‐$
‐$
15,999
,803
$
Accoun
ts re
ceivable
Sewer use (n
et of allowance)
10,487
,394
‐
‐
‐
‐
‐
10,487
,394
Sewer use unb
illed
4,81
9,84
9
‐
‐
‐
‐
‐
4,81
9,84
9
Re
ceivables, othe r
20,582
21,840
‐
‐
‐
‐
42,422
Due from
Rho
de Island
Infrastructure Bank
‐
‐
6,71
3,01
2
‐
‐
‐
6,71
3,01
2
Prep
aid expe
nses
‐
1,43
3,22
8
‐
‐
‐
‐
1,43
3,22
8
Total current assets
23,052
,439
9,08
0,46
9
7,36
2,80
0
‐
‐
‐
39,495
,708
Non
‐current assets
Re
stric
ted assets
Cash and
cash eq
uivalents, enviro
nmen
tal enforcemen
t54
,405
‐
‐
‐
‐
‐
54,405
Cash and
cash eq
uivalents, ope
ratin
g reserve for reven
ue stability fu
n d‐
‐
‐
‐
4,50
0,02
3
‐
4,50
0,02
3
Cash and
cash eq
uivalents, re
stricted for d
ebt servic e
‐
‐
‐
39,986
,303
‐
‐
39,986
,303
Cash and
cash eq
uivalents, re
stricted for d
ebt service re
serve fun d
‐
‐
‐
‐
‐
3,49
7,33
5
3,49
7,33
5
Cash and
cash eq
uivalents, re
stricted for a
cquisition and constructio
n ‐
of plant assets
‐
‐
26,935
,758
‐
‐
‐
26,935
,758
To
tal restricted asset s
54,405
‐
26,935
,758
39,986
,303
4,50
0,02
3
3,49
7,33
5
74,973
,824
Ca
pital assets
Land
‐
‐
2,75
4,40
7
‐
‐
‐
2,75
4,40
7
Plant a
nd equ
ipmen
t‐
‐
88,933
,709
‐
‐
‐
88,933
,709
Capital projects c
ompleted
‐
‐
708,05
4,13
2
‐
‐
‐
708,05
4,13
2
Constructio
n in progress
‐
‐
329,87
4,14
3
‐
‐
‐
329,87
4,14
3
Subtotal
‐
‐
1,12
9,61
6,39
1
‐
‐
‐
1,12
9,61
6,39
1
Less: accum
ulated
dep
reciation
‐
‐
177,16
9,74
9
‐
‐
‐
177,16
9,74
9
To
tal net cap
ital assets
‐
‐
952,44
6,64
2
‐
‐
‐
952,44
6,64
2
Total non
‐current assets
54,405
‐
979,38
2,40
0
39,986
,303
4,50
0,02
3
3,49
7,33
5
1,02
7,42
0,46
6
Total assets
23,106
,844
9,08
0,46
9
986,74
5,20
0
39,986
,303
4,50
0,02
3
3,49
7,33
5
1,06
6,91
6,17
4
Deferred ou
tflows o
f resou
rces
Loss on refund
ing of deb
t‐
‐
2,19
6,68
1
‐
‐
‐
2,19
6,68
1
ERSRI ‐ con
tribution paid su
bseq
uent to
measuremen
t date
‐
1,32
9,98
3
‐
‐
‐
‐
1,32
9,98
3
Non
‐union
Pen
sion ‐ change in assum
ption s
‐
1,56
0,18
0
‐
‐
‐
‐
1,56
0,18
0
Non
‐union
Pen
sion ‐ d
ifferen
ce between expe
cted
and
actual experience
‐
210,01
3
‐
‐
‐
‐
210,01
3
Non
‐union
Pen
sion ‐ d
ifferen
ce between projected and actual earnings
‐
261,92
4
‐
‐
‐
‐
261,92
4
Total deferred ou
tflows o
f resou
rces
‐$
3,36
2,10
0$
2,19
6,68
1$
‐$
‐$
‐$
5,55
8,78
1$
(Continued)
NARRAGANSETT
BAY COMMISSION
Combining Schedule of Net Position
For the Year Ended
June 30, 2015
66

Operating Reserve
Reven
ue
O & M
Project
Deb
t Service
for Reven
ue
Deb
t Service
Fund
Fund
Fund
Fund
Stability Fund
Reserve Fund
Total
Liab
ilitie
s
Curren
t liabilities
Accoun
ts payable
‐$
2,66
7,51
7$
‐$
‐$
‐$
‐$
2,66
7,51
7$
Contracts p
ayable
‐
‐
5,07
2,45
0
‐
‐
‐
5,07
2,45
0
Accrue
d interest payable
‐
‐
‐
5,33
1,17
9
‐
‐
5,33
1,17
9
Accrue
d expe
nses
‐
993,61
2
‐
‐
‐
‐
993,61
2
Curren
t portio
n of th
e othe
r accrued
expen
ses
‐
80,865
‐
‐
‐
‐
80,865
Curren
t portio
n of loans p
ayable
‐
‐
25,284
,371
‐
‐
‐
25,284
,371
Curren
t portio
n of leases payable
‐
‐
143,56
6
‐
‐
‐
143,56
6
Total current liab
ilitie
s‐
3,74
1,99
4
30,500
,387
5,33
1,17
9
‐
‐
39,573
,560
Non
‐current liab
ilitie
s
Long
‐term other accrued
expen
ses, net
‐
2,86
7,96
1
‐
‐
‐
‐
2,86
7,96
1
Long
‐term net pen
sion liability ‐ E
RSRI
‐
15,554
,087
‐
‐
‐
‐
15,554
,087
Long
‐term net pen
sion liability ‐ N
on‐Union
Plan
‐
4,86
4,29
4
‐
‐
‐
‐
4,86
4,29
4
Long
‐term loans p
ayable, net
‐
‐
320,84
7,68
1
‐
‐
‐
320,84
7,68
1
Long
‐term leases payable, net
‐
‐
109,73
1
‐
‐
‐
109,73
1
Long
‐term deb
t, ne
t‐
‐
262,60
4,18
4
‐
‐
‐
262,60
4,18
4
Total non
‐current liab
ilitie
s‐
23,286
,342
583,56
1,59
6
‐
‐
‐
606,84
7,93
8
Total liabilities
‐
27,028
,336
614,06
1,98
3
5,33
1,17
9
‐
‐
646,42
1,49
8
Deferred inflo
ws o
f resou
rces
Une
arne
d revenu
e billed in advance
271,76
8
‐
‐
‐
‐
‐
271,76
8
Gain on
refund
ing of deb
t‐
‐
188,07
5
‐
‐
‐
188,07
5
ERSRI ‐ change in assum
ptions
‐
168,93
6
‐
‐
‐
‐
168,93
6
ERSRI ‐ differen
ce between projected and actual earrin
gs‐
1,19
3,12
4
‐
‐
‐
‐
1,19
3,12
4
Non
‐union
Pen
sion ‐ d
ifferen
ce between expe
cted
and
actual experience
‐
150,85
8
‐
‐
‐
‐
150,85
8
Non
‐union
Pen
sion ‐ d
ifferen
ce between projected and actual earnings
‐
371,35
3
‐
‐
‐
‐
371,35
3
Total deferred inflo
ws o
f resou
rces
271,76
8
1,88
4,27
1
188,07
5
‐
‐
‐
2,34
4,11
4
Net position
Net investmen
t in capital assets
‐
‐
347,10
6,27
7
‐
‐
‐
347,10
6,27
7
Restricted for e
nviro
nmen
tal enforcemen
t54
,405
‐
‐
‐
‐
‐
54,405
Unrestricted
22,780
,671
(16,47
0,03
8)
27,585
,546
34,655
,124
4,50
0,02
3
3,49
7,33
5
76,548
,661
Total N
et Position
22,835
,076
$
(16,47
0,03
8)$
374,69
1,82
3$
34,655
,124
$
4,50
0,02
3$
3,49
7,33
5$
423,70
9,34
3$
NARRAGANSETT
BAY COMMISSION
Combining Schedule of Net Position (Continued)
For the Year Ended
June 30, 2015
67

Operating Reserve
Reven
ue
O & M
Project
Debt Service
for Reven
ue
Deb
t Service
Fund
Fund
Fund
Fund
Stability Fund
Reserve Fund
Total
Ope
ratin
g revenu
eUser fees, re
siden
tial
53,044
,437
$
‐$
‐$
‐$
‐$
‐$
53,044
,437
$
User fees, com
mercial and
indu
stria
l38,962,862
‐
‐
‐
‐
‐
38,962
,862
Perm
it and conn
ectio
n fees
100,90
6
‐
‐
‐
‐
‐
100,90
6
Pretreatmen
t fees
1,07
6,48
1
‐
‐
‐
‐
‐
1,07
6,48
1
Environm
ental enforcemen
t5,972
‐
‐
‐
‐
‐
5,97
2
Septage income
336,03
7
‐
‐
‐
‐
‐
336,03
7
Late charge pe
nalties
999,867
‐
‐
‐
‐
‐
999,86
7
Misc
ellane
ous
489,28
0
‐
‐
‐
‐
‐
489,28
0
Total ope
ratin
g revenu
es95
,015
,842
‐
‐
‐
‐
‐
95,015
,842
Ope
ratin
g expe
nses
Person
nel services
‐
20,946
,735
‐
‐
‐
‐
20,946
,735
Gen
eral and
adm
inistratio
n‐
979,42
6
‐
‐
‐
‐
979,42
6
Ope
ratio
ns and
mainten
ance
‐
6,93
0,80
1
‐
‐
‐
‐
6,93
0,80
1
Depreciatio
n‐
12,983
,750
‐
‐
‐
‐
12,983
,750
Contractual services
‐
7,46
9,03
4
‐
‐
‐
‐
7,46
9,03
4
Misc
ellane
ous
‐
846,46
2
‐
‐
‐
‐
846,46
2
Total ope
ratin
g expe
nses
‐$
50,156
,208
$
‐$
‐$
‐$
‐$
50,156
,208
$ (C
ontinued)
NARRAGANSETT
BAY COMMISSION
Combining Schedule of Revenue, Expenses and Changes in
Net Position
For the Year Ended
June 30, 2015
68

Operating Reserve
Reven
ue
O & M
Project
Deb
t Service
for Reven
ue
Deb
t Service
Fund
Fund
Fund
Fund
Stability Fund
Reserve Fund
Total
Non
‐ope
ratin
g revenu
es (e
xpen
ses)
Interest expen
se‐
$
(8,136
)$
‐$
(16,46
7,38
0)$
‐$
‐$
(16,47
5,51
6)$
Interest income
2,04
9
‐
1,79
7
1,49
5
280
218
5,83
9
Grant income
4,91
0
‐
‐
‐
‐
‐
4,91
0
Bond
and
note issuance fees
‐
‐
‐
(720
,428
)
‐
‐
(720
,428
)
misc
ellane
ous incom
e16
3,63
4
‐
‐
‐
‐
‐
163,63
4
Total non
‐ope
ratin
g revenu
es (e
xpen
ses)
170,59
3
(8,136
)
1,79
7
(17,18
6,31
3)
280
218
(17,02
1,56
1)
Net income be
fore cap
ital con
tribution an
d tran
sfers
95,186
,435
(50,16
4,34
4)
1,79
7
(17,18
6,31
3)
280
218
27,838
,073
Transfers in (out)
(95,53
8,86
5)
52,841
,604
23,481
,446
15,722
,468
(3,770
)
3,49
7,11
7
‐
Chan
ge in
net position
(352
,430
)
2,67
7,26
0
23,483
,243
(1,463
,845
)
(3,490
)
3,49
7,33
5
27,838
,073
Total net position
, beginning
of y
ear
23,187
,506
765,45
6
351,20
8,58
0
36,118
,969
4,50
3,51
3
‐
415,78
4,02
4
Net position
restatem
ent*
‐
(19,91
2,75
4)
‐
‐
‐
‐
(19,91
2,75
4)
Total net position
, end
of y
ear
22,835
,076
$
(16,47
0,03
8)$
374,69
1,82
3$
34,655
,124
$
4,50
0,02
3$
3,49
7,33
5$
423,70
9,34
3$
* Net position
restatem
ent see
note 11
For the Year Ended
June 30, 2015
NARRAGANSETT
BAY COMMISSION
Combining Schedule of Revenue, Expenses and Changes in Net Position (Continued)
69

This page was intentionally left blank.


This page was intentionally left blank.

STATISTICAL SECTION
This part of the NBC’s comprehensive annual financial report presents detailed information as a context for understanding what the information in the financial statement, note disclosure, and required supplementary information says about the NBC’s overall financial health.
Financial Trends These schedules contain trend information to help the reader understand how the NBC’s financial performance and well-being have changed over time.
Net Position by Component
Changes in Net Position
Revenue by Source
Expenses by Function
Revenue Capacity These schedules contain information to help the reader assess the NBC’s most significant revenue sources.
User Fee Revenue by Customer Type
Residential Sewer Rates
Non-Residential Sewer Rates
Comparative Sewer Rates – RI Municipalities
Principal Commercial Users
Debt Capacity These schedules contain information to help the reader assess the affordability of the NBC’s current levels of outstanding debt and the NBC’s ability to issue additional debt in the future.
Ratios of Outstanding Debt
Debt Service Coverage
Demographic and Economic Information These schedules offer demographic and economic indicators to help the reader understand the environment within which the NBC’s financial activities take place.
Demographic Statistics
Principal Employers
Operating Information These schedules contain service and infrastructure data to help the reader understand how the information in the NBC’s financial report relates to the Services the NBC provides and the activities it performs.
Operating Indicators by Division
Budgeted Employees by Activity
Sources: Unless otherwise noted, the information in these schedules was derived from the comprehensive annual financial report for the relevant year.
70

This page was intentionally left blank.

NARRAGANSETT BAY COMMISSION
Net Position by Component - (Unaudited)
Last Ten Fiscal Years
* Restated net position - See Note 11
** Restated net position - implementation of GASB 65
71
Restricted
Years Ending Net Investment in Environmental Total
June 30, Capital Assets Enforcement Unrestricted Net Position
2006 $ 205,752,364 $ 84,735 $ 50,790,866 $ 256,627,965
2007 214,974,154 127,370 54,514,025 269,615,549
2008 228,385,908 189,545 58,174,511 286,749,964
2009 240,723,854 157,021 64,044,903 304,925,778
2010 264,347,077 146,170 63,493,654 327,986,901
2011 281,322,303 118,796 71,793,204 353,234,303
2012 298,407,024 87,748 77,704,224 376,198,996
2013 320,372,754 74,841 76,419,156 396,866,751
**2014 330,483,472 72,426 85,228,126 415,784,024
*2015 347,106,277 54,405 76,548,661 423,709,343

2015*
2014**
2013
2012
2011
2010
2009
2008
2007
2006
Ope
ratin
g Re
venu
esUser fees
92,007
,299
$
89,182
,519
$
77,949
,901
$
75,921
,752
$
73,412
,706
$
69,224
,415
$
67,958
,753
$
64,462
,984
$
56,094
,973
$
56,395
,730
$
Pretreatmen
t fees
1,07
6,48
1
1,09
5,55
1
1,07
7,887
1,08
7,140
1,10
9,70
9
1,11
4,004
1,12
6,654
1,11
5,52
9
1,16
3,397
1,16
5,74
9
Other ope
ratin
g revenu
e1,93
2,06
2
1,86
9,94
5
1,32
0,94
4
1,41
0,29
8
1,39
0,16
0
1,43
5,63
0
1,45
8,27
4
1,49
9,21
8
1,39
9,03
7
1,46
4,68
5
Total O
peratin
g Re
venu
es95
,015
,842
92,148
,015
80,348
,732
78,419
,190
75,912
,575
71,774
,049
70,543
,681
67,077
,731
58,657
,407
59,026
,164
Non
‐Ope
ratin
g Re
venu
e sInterest income
5,83
9
5,43
3
22,907
10,868
11,609
47,803
420,01
7
2,19
5,657
2,84
9,25
2
2,48
3,388
Grant Income
4,91
0
‐
14,980
129,32
7
66,851
279,97
8
34,300
27,653
49,037
20,695
Other non
‐ope
ratin
g revenu
es16
3,63
4
182,08
4
190,92
3
247,74
0
263,23
8
280,65
6
185,83
2
95,316
111,70
3
30,465
Total N
on‐Ope
ratin
g Re
venu
es17
4,38
3
187,51
7
228,810
387,93
5
341,69
8
608,43
7
640,14
9
2,31
8,626
3,00
9,99
2
2,53
4,548
Ope
ratin
g Expe
nse s
Person
nel services
20,946
,735
21,090
,749
19,858
,457
19,412
,763
18,751
,300
18,767
,282
17,832
,832
17,052
,860
16,043
,809
15,681
,061
Contractual services
7,46
9,034
8,03
6,730
7,10
4,834
6,78
0,53
3
6,61
4,01
9
7,00
8,21
3
7,22
1,93
9
7,21
4,38
2
6,47
4,726
5,29
9,76
2
Gen
eral and
adm
inistratio
n8,75
6,68
9
8,83
8,866
8,60
7,39
1
8,78
3,624
8,22
3,64
1
8,52
9,977
8,62
2,100
7,38
4,874
7,41
3,41
5
7,31
9,290
Depreciatio
n and am
ortization
12,983
,75 0
11,812
,153
10,974
,885
10,569
,625
10,437
,059
9,06
5,008
7,30
1,816
7,46
3,646
6,80
3,21
3
6,12
9,01
9
Total O
peratin
g Expe
nses
50,156
,208
49,778
,498
46,545
,567
45,546
,545
44,026
,019
43,370
,480
40,978
,687
39,115
,762
36,735
,163
34,429
,132
Non
‐Ope
ratin
g Expe
nse s
Interest expen
se16
,475
,516
16,660
,404
13,587
,442
11,785
,551
10,887
,026
10,820
,471
12,013
,384
13,121
,460
11,913
,538
9,83
6,18
2
Other expen
ses
720,42
8
915,28
8
130,980
60,883
136,664
36,381
15,945
24,720
36,740
1,01
6,836
Total N
on‐Ope
ratin
g Expe
nses
17,195
,944
17,575
,692
13,718
,422
11,846
,434
11,023
,690
10,856
,852
12,029
,329
13,146
,180
11,950
,278
10,853
,018
Net income be
fore capita
l con
tributions
27,838
,073
24,981
,342
20,313
,533
21,414
,146
21,204
,564
18,155
,154
18,175
,814
17,134
,415
12,981
,958
16,535
,995
Capital con
tributions
‐
80,965
354,20
2
1,55
0,547
4,04
2,838
4,90
5,96
9
‐
‐
5,62
6
1,16
5,958
Change in
Net Position
27,838
,073
25,062
,307
20,667
,735
22,964
,693
25,247
,402
23,061
,123
18,175
,814
17,134
,415
12,987
,584
17,701
,953
Net Position
, beginning
395,87
1,27
0
390,72
1,717
376,19
8,996
353,23
4,30
3
327,98
6,901
304,92
5,778
286,74
9,964
269,61
5,549
256,62
7,965
238,92
6,012
Net Position
, end
ing
423,70
9,34
3$
415,78
4,024
$
396,86
6,731
$
376,19
8,996
$
353,23
4,30
3$
327,98
6,901
$
304,92
5,778
$
286,74
9,964
$
269,61
5,549
$
256,62
7,965
$
* In 201
5, beginning
net position
was re
stated
as a
result of GAS
B 68
which re
quire
d ne
t pen
sion liability to be includ
ed on the fin
ancial statem
ents.
** In
201
4, beginning
net position
was re
stated
as a
result of GAS
B 65
which re
classified bo
nd issuance costs from
a liability to
an expe
nse.
NARRAGANSETT
BAY COMMISSION
Change in Net Position (Unaudited)
Last Ten
Fiscal Years
72

Permit and
Total
Yea
rs Ending
User
Connection
Pretrea
tmen
tEn
vironmen
tal
Septage
Late Charges
BOD/TSS
Other
Operating
Grant
Interest
Miscellaneo
us
Total
June 30,
Fees
Fees
Fees
Enforcem
ent
Income
Pen
alties
Surcharge
Reven
ue
Reven
ue
Income
Income
Reven
ue
Reven
ue
2006
56,395
,730
$
357,49
6$
1,16
5,74
9$
81,398
$
387,06
8$
447,67
2$
152,12
3$
38,928
$
59,026
,164
$
20,695
$
2,48
3,38
8$
30,465
$
61,560
,712
$
2007
56,094
,973
205,58
9
1,16
3,39
7
52,525
357,20
6
631,18
3
139,81
5
12,719
58,657
,407
49
,037
2,84
9,25
2
111,70
3
61,667
,399
20
0864
,462
,984
181,29
0
1,11
5,52
9
75,500
372,71
1
741,83
4
116,09
6
11,787
67,077
,731
27
,653
2,19
5,65
7
95,316
69,396
,357
20
0967
,958
,753
140,82
2
1,12
6,65
4
3,70
0
382,95
5
849,12
7
66,439
15,231
70,543
,681
34
,300
420,01
7
185,83
2
71,183
,830
20
1069
,224
,415
86,009
1,11
4,00
4
13,650
380,57
9
901,61
9
29,419
24,354
71,774
,049
27
9,97
8
47,803
280,65
6
72,382
,486
20
1173
,412
,706
82,914
1,10
9,70
9
8,31
5
293,71
8
951,35
1
44,704
9,15
8
75,912
,575
66
,851
11,609
263,23
8
76,254
,273
20
1275
,921
,752
85,487
1,08
7,14
0
1,00
0
304,15
7
918,94
3
93,462
7,24
9
78,419
,190
12
9,32
7
10,868
247,74
0
78,807
,125
20
1377
,949
,901
95,609
1,07
7,88
7
‐
300,31
9
918,13
4
‐
6,88
2
80,348
,732
14
,980
22,907
190,92
3
80,577
,542
20
1489
,182
,519
112,77
3
1,09
5,55
1
15,229
310,13
6
1,01
3,24
0‐
418,56
7
92,148
,015
‐
5,43
3
182,08
4
92,335
,532
20
1592
,007
,299
100,90
6
1,07
6,48
1
5,97
2
336,03
7
999,86
7
‐
489,28
0
95,015
,842
4,91
0
5,83
9
163,63
4
95,190
,225
Operating Reven
ue
Non‐Operating Reven
ue
NARRAGANSETT
BAY COMMISSION
Revenue by Source (Unaudited)
Last Ten
Fiscal Years
73

NA
RR
AG
AN
SETT
BA
Y C
OM
MIS
SIO
N
Exp
ense
s b
y Fu
nct
ion
(U
na
ud
ited
)
Last
Ten
Fis
cal Y
ears
60
Yea
rs E
nd
ing
Per
son
nel
Co
ntr
act
ua
lR
epa
irs
an
dD
epre
cia
tio
n a
nd
Op
era
tin
gIn
tere
stO
ther
Tota
l
Jun
e 30
, Se
rvic
esSe
rvic
esM
ain
ten
an
ceU
tili
ties
Sup
pli
esA
mo
rtiz
ati
on
Mis
cell
an
eou
sEx
pen
ses
Exp
ense
sEx
pen
ses
Exp
ense
s
2006
15,6
81,0
61$
5,
299,
762
$
1,25
9,87
4$
3,47
0,52
1$
1,
044,
137
$
6,38
6,45
2$
1,
287,
325
$
34,4
29,1
32$
9,
836,
182
$
759,
403
$
45,0
24,7
17$
2007
16,0
43,8
09
6,
474,
726
1,34
9,60
9
3,34
5,58
5
1,
067,
524
6,80
3,21
3
1,
650,
697
36,7
35,1
63
11
,913
,538
46,7
40
48,6
85,4
41
2008
17,0
52,8
60
7,
214,
382
1,25
8,78
3
3,43
5,79
0
1,
183,
308
7,46
3,64
6
1,
506,
993
39,1
15,7
62
13
,121
,460
24,7
20
52,2
61,9
42
2009
17,8
32,8
32
7,
221,
939
1,30
4,72
0
4,15
6,17
2
1,
479,
232
7,30
1,81
6
1,
681,
976
40,9
78,6
87
12
,013
,384
15,9
45
53,0
08,0
16
2010
18,7
67,2
82
7,
008,
213
1,26
5,65
9
4,18
7,38
5
1,
474,
302
9,06
5,00
8
1,
602,
631
43,3
70,4
80
10
,820
,471
36,3
81
54,2
27,3
32
2011
18,7
51,3
00
6,
614,
019
1,31
5,88
7
3,94
0,12
5
1,
255,
828
10,4
37,0
59
1,71
1,80
1
44
,026
,019
10,8
87,0
26
13
6,66
4
55
,049
,709
2012
19,4
12,7
63
6,
780,
533
1,61
7,87
9
4,24
7,86
7
1,
143,
635
10,5
69,6
25
1,77
4,24
3
45
,546
,545
11,7
85,5
51
60
,883
57
,392
,979
2013
19,8
58,4
57
7,
104,
834
1,59
5,80
3
4,00
8,39
2
1,
294,
849
10,9
74,8
85
1,70
8,34
7
46
,545
,567
13,5
87,4
42
13
0,98
0
60
,263
,989
2014
21,0
90,7
49
8,
036,
730
1,72
5,07
9
3,85
0,26
0
1,
462,
692
11,8
12,1
53
1,80
0,83
5
49
,778
,498
16,6
60,4
04
91
5,28
8
67
,354
,190
2015
20,9
46,7
35
7,
469,
034
1,90
5,47
3
3,75
3,04
1
1,
423,
101
12,9
83,7
50
1,67
5,07
4
50
,156
,208
16,4
75,5
16
72
0,42
8
67
,352
,152
Op
era
tin
g E
xpen
ses
No
n-O
per
ati
ng
Exp
ense
s
74

NA
RR
AG
AN
SETT
BA
Y C
OM
MIS
SIO
N
Use
r Fe
e R
even
ue
by
Cu
sto
mer
Typ
e (U
na
ud
ited
)
Last
Ten
Fis
cal Y
ears
75
2015
2014
2013
2012
2011
2010
2009
2008
2007
2006
Res
iden
tia
l53
,044
,437
$
51,1
29,4
79$
45
,021
,105
$
43
,266
,302
$
41
,892
,869
$
39,3
92,7
98$
38
,727
,419
$
36,1
13,0
07$
30
,990
,979
$
30,8
75,8
96$
Co
mm
erci
al
36,6
23,6
17
36
,073
,080
31,1
11,1
75
30,8
86,2
03
29,7
13,6
82
28
,295
,493
27,6
47,0
95
26
,584
,703
23,4
12,8
34
23
,454
,508
Ind
ust
ria
l2,
339,
245
1,
979,
960
1,
817,
621
1,76
9,24
7
1,
806,
155
1,
536,
124
1,
584,
239
1,
765,
274
1,
691,
160
2,
065,
326
92,0
07,2
99$
89
,182
,519
$
77,9
49,9
01$
75,9
21,7
52$
73,4
12,7
06$
69
,224
,415
$
67,9
58,7
53$
64
,462
,984
$
56,0
94,9
73$
56
,395
,730
$

NARRAGANSETT BAY COMMISSION
Schedule of Residential Sewer Rates - (Unaudited)
Last Ten Fiscal Years
76
Fiscal Effective Fixed Rate Consumption Rate
Year Date (per Dwelling Unit) (HCF)*
2006 1-Jul-05 $ 94.38 1.942$
2007 1-Jul-06 98.21 2.021
2008 1-Jul-07 112.35 2.309
2009 1-Jul-08 124.98 2.569
2010 1-Jul-09 159.21 2.569
2011 1-Jul-10 162.79 2.627
2012 1-Jul-11 168.21 2.714
2013 1-Jul-12 171.99 2.775
2013 1-Jan-13 184.63 2.979
2014 1-Jul-13 202.47 3.267
2015 19-Sep-14 210.51 3.397
* HCF - per hundred cubic feet

NARRAGANSETT BAY COMMISSION
Schedule of Non-residential Sewer Rates - (Unaudited)
Last Ten Fiscal Years
77
Non-Residential Industrial Commercial
Fiscal Effective Fixed Rate Consumption Rate Consumption Rate
Year Date (Based on 5/8" meter) (HCF)* (HCF)*
2006 1-Jul-05 212$ 1.810$ 2.813$
2007 1-Jul-06 221 1.884 2.927
2008 1-Jul-07 253 2.153 3.349
2009 1-Jul-08 281 2.395 3.725
2010 1-Jul-09 380 2.395 3.725
2011 1-Jul-10 389 2.449 3.809
2012 1-Jul-11 402 2.531 3.936
2013 1-Jul-12 411 2.588 4.025
2013 1-Jan-13 441 2.778 4.321
2014 1-Jul-13 484 3.046 4.738
2015 19-Sep-14 503 3.167 4.926
* HCF - per hundred cubic feet

This page was intentionally left blank.

Source: 2014 Narragansett Bay Commission Residential Sewer User SurveyIn this survey, all annual residential sewer charges are based on 150 gallons per day.
Annual Residential Sewer Charges Rhode Island Cities & Towns
The survey shown below, conducted by the Narragansett Bay Commission (NBC) in 2014, comparesthe annual residential sewer charges for participating Rhode Island Cities & Towns. It shows, despiteNBC's large operations and significant capital improvements, NBC's average residential user rateremains below the state average.
$843
$737
$680
$621
$471
$470
$459
$440
$424
$417
$401
$400
$393
$330
$301
$284
$229
Newport
Middletown
Jamestown
East Greenwich
Warwick
East Providence
NBC Service Area
Barrington
Narragansett
Cranston
North Smithfield
Burrillville
Woonsocket
West Warwick
Smithfield
Westerly
South Kingstown
78

This page was intentionally left blank.

2015
2006
Percentage of
Percentage of
Company
Annual billing
Rank
total billing
Annual billing
Rank
total billing
Rhod
e Island
Hospital
1,56
0,84
1$
11.68
%1,02
6,61
4$
31.82
%Providen
ce Hou
sing Au
thority
1,44
1,25
0
21.55
%1,06
8,85
8
21.90
%Brow
n University
1,41
0,63
4
31.51
%1,58
4,84
2
12.81
%Co
nopco, Inc. dba
Unilever*
1,15
7,41
7
41.24
%‐
‐
City of P
rovide
nce
742,91
5
50.80
%53
0,09
8
50.94
%City of P
awtucket
730,39
3
60.78
%40
5,78
2
60.72
%Providen
ce Schoo
l Dep
artm
ent
508,77
0
70.55
%54
1,91
9
40.96
%Providen
ce College
453,60
4
80.49
%28
0,27
3
80.50
%John
son & W
ales
431,11
4
90.46
%26
5,14
7
90.47
%State of Rho
de Island
359,91
1
100.39
%25
1,97
5
100.45
%Rh
ode Island
College
‐
‐
309,60
1
70.55
%
8,79
6,84
9$
9.45
%6,26
5,10
9$
11.12%
Source: N
BC's billing
records
* Cu
stom
er is in
disp
ute with
NBC
regarding curren
t and
past b
illing. How
ever, no paym
ent d
oes n
ot have a material adverse effe
ct on NBC
's fin
ances.
Principal Commercial U
sers (Unaudited)
2015 and 2006
NARRAGANSETT
BAY COMMISSION
79

NA
RR
AG
AN
SETT
BA
Y C
OM
MIS
SIO
N
Ra
tio
s of
Out
sta
nd
ing
Deb
t -
(Un
au
dit
ed)
Last
Ten
Yea
rs
80
Per
cen
tag
e
Ra
tio
of
Ra
tio
of
Per
son
al
Fisc
al Y
ear
Tota
lO
uts
tan
din
gO
uts
tan
din
gIn
com
e to
End
edLo
an
sB
on
ds
Lea
seO
uts
tan
din
gC
ap
ita
lize
dC
on
stru
ctio
nTo
tal C
ap
ita
lD
ebt
to C
ap
ita
lD
ebt
per
Ou
tsta
nd
ing
Jun
e 30
,P
aya
ble
Pa
yab
leP
aya
ble
Deb
tA
sset
s*in
Pro
cess
Ass
ets
Ass
ets
Po
pu
lati
on
(1)
Deb
t (1
)
2006
247,
768,
485
$
11
6,06
4,50
6$
49
5,45
3$
36
4,32
8,44
4$
220,
781,
312
$
330,
122,
836
$
55
0,90
4,14
8$
0.
66
344.
030.
011%
2007
269,
690,
992
15
9,06
8,72
2
587,
356
429,
347,
070
22
5,42
8,49
1
37
8,54
7,61
0
603,
976,
101
0.
71
407.
680.
010%
2008
269,
026,
900
15
7,61
3,72
2
585,
756
427,
226,
378
22
6,01
5,83
9
41
2,85
2,91
6
638,
868,
755
0.
67
406.
580.
010%
2009
271,
381,
022
15
6,08
9,20
6
441,
456
427,
911,
684
22
5,32
4,13
7
43
1,24
3,89
8
656,
568,
035
0.
65
406.
290.
010%
2010
255,
695,
266
15
4,54
7,45
7
365,
855
410,
608,
578
47
9,51
2,21
7
19
3,84
3,86
6
673,
356,
083
0.
61
390.
100.
011%
2011
269,
436,
595
15
2,95
0,70
8
282,
318
422,
669,
621
47
6,71
3,01
3
22
8,40
2,55
0
705,
115,
563
0.
60
402.
040.
011%
2012
340,
979,
944
15
1,30
3,95
8
249,
436
492,
533,
338
46
9,06
7,39
1
28
9,78
2,52
1
758,
849,
912
0.
65
468.
950.
010%
2013
345,
706,
020
22
5,20
4,09
7
617,
136
571,
527,
253
53
2,11
9,80
5
32
0,24
9,53
9
852,
369,
344
0.
67
543.
530.
012%
2014
369,
160,
326
26
1,17
0,24
7
445,
978
630,
776,
551
57
1,31
9,30
5
36
0,53
1,39
4
931,
850,
699
0.
68
597.
790.
008%
2015
346,
132,
052
26
2,60
4,18
4
253,
297
608,
989,
533
62
2,57
2,49
9
32
9,87
4,14
3
952,
446,
642
0.
64
N/A
N/A
* C
apit
aliz
ed
ass
ets
ne
t o
f ac
cum
ula
ted
de
pre
ciat
ion
(1)
See
th
e D
em
ogr
aph
ics
and
Eco
no
mic
Sta
tist
ics
for
the
pe
rso
nal
inco
me
an
d p
op
ula
tio
n
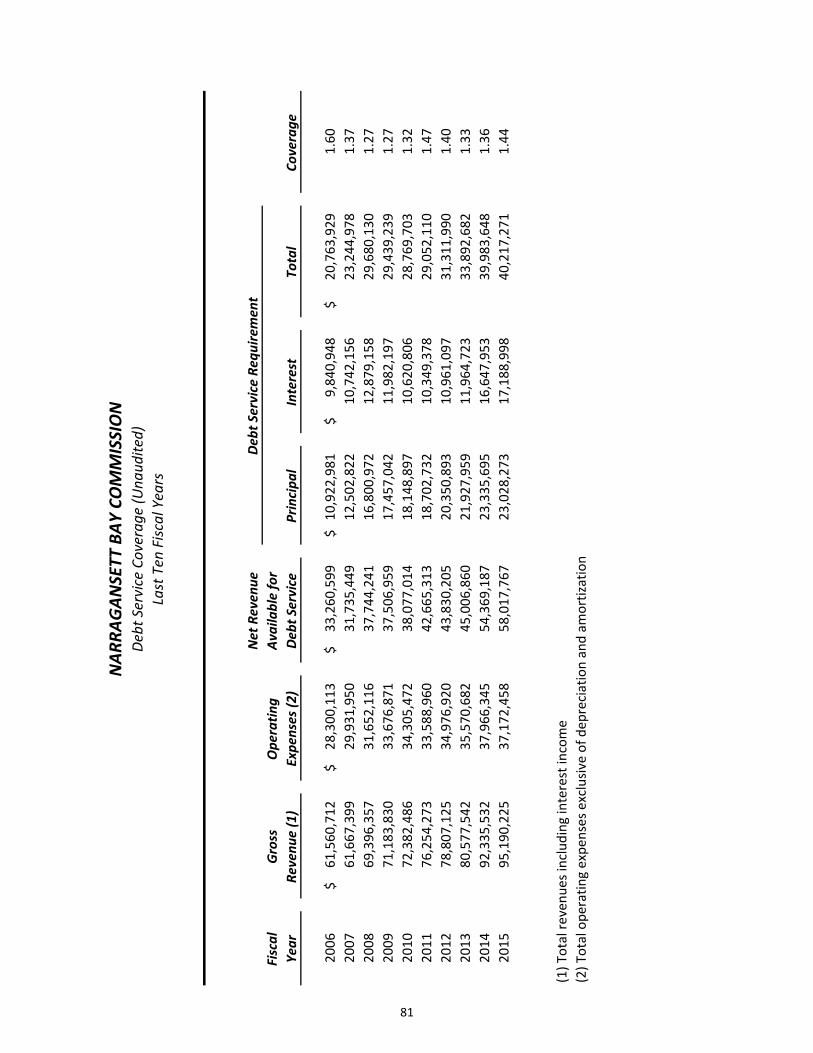
Net Reven
ue
Fiscal
Gross
Operating
Availa
ble for
Yea
rReven
ue (1)
Expen
ses (2)
Deb
t Service
Principal
Interes t
Total
Coverage
2006
61,560
,712
$
28,300
,113
$
33,260
,599
$
10,922
,981
$
9,84
0,94
8$
20,763
,929
$
1.60
2007
61,667
,399
29,931
,950
31,735
,449
12,502
,822
10,742
,156
23,244
,978
1.37
2008
69,396
,357
31,652
,116
37,744
,241
16,800
,972
12,879
,158
29,680
,130
1.27
2009
71,183
,830
33,676
,871
37,506
,959
17,457
,042
11,982
,197
29,439
,239
1.27
2010
72,382
,486
34,305
,472
38,077
,014
18,148
,897
10,620
,806
28,769
,703
1.32
2011
76,254
,273
33,588
,960
42,665
,313
18,702
,732
10,349
,378
29,052
,110
1.47
2012
78,807
,125
34,976
,920
43,830
,205
20,350
,893
10,961
,097
31,311
,990
1.40
2013
80,577
,542
35,570
,682
45,006
,860
21,927
,959
11,964
,723
33,892
,682
1.33
2014
92,335
,532
37,966
,345
54,369
,187
23,335
,695
16
,647
,953
39,983
,648
1.36
2015
95,190
,225
37,172
,458
58,017
,767
23,028
,273
17,188
,998
40,217
,271
1.44
(1) T
otal re
venu
es includ
ing interest income
(2) T
otal ope
ratin
g expe
nses exclusiv
e of dep
reciation and am
ortization
Deb
t Service Req
uirem
ent
NARRAGANSETT
BAY COMMISSION
Debt Service Coverage (Unaudited)
Last Ten
Fiscal Years
81

NARRAGANSETT BAY COMMISSION Demographic Statistics - (Unaudited)
State of Rhode Island Last Ten Fiscal Years
82
Personal
Income
Fiscal (Millions of Per Capita Labor School Unemployment
Year Population (1) dollars)(1) Income (1) Force (2) Enrollment (3) Rate (2)
2006 1,063,096 41,257$ 38,809$ 572,567 153,417 5.10%
2007 1,057,315 43,125 40,788 573,472 151,619 5.10%
2008 1,055,003 44,143 41,842 572,473 145,342 7.60%
2009 1,053,646 43,470 41,257 565,414 145,231 10.90%
2010 1,052,769 45,267 42,999 573,804 145,118 11.70%
2011 1,050,646 46,881 44,621 562,886 142,854 11.30%
2012 1,050,292 48,184 45,877 558,027 142,481 10.40%
2013 1,051,511 49,433 47,012 556,679 142,008 9.50%
2014 1,055,173 51,532 48,838 559,578 142,008 7.90%
2015 N/A N/A N/A 558,600 N/A 5.90%
(1) Source United States Bureau of Economic Analysis
(2) Source Bureau of Labor Statistics, RI state-wide Unemployment Rates Seasonally Adjusted
(3) Source Rhode Island Department of Education
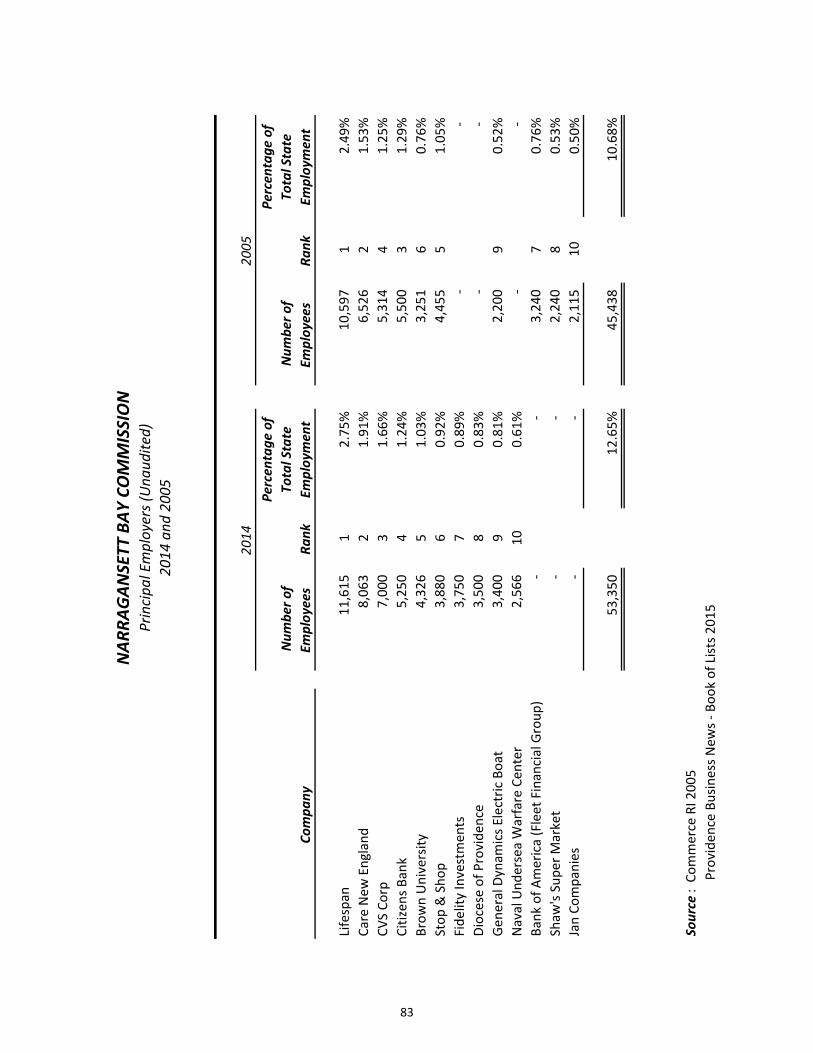
Company
Number of
Employees
Rank
Percentage of
Total State
Employm
ent
Number of
Employees
Rank
Percentage of
Total State
Employm
ent
Lifespan
11,615
12.75%
10,597
12.49%
Care New
England
8,063
21.91%
6,526
21.53%
CVS Co
rp7,000
31.66%
5,314
41.25%
Citizen
s Bank
5,250
41.24%
5,500
31.29%
Brow
n University
4,326
51.03%
3,251
60.76%
Stop
& Sho
p3,880
60.92%
4,455
51.05%
Fide
lity Investmen
ts3,750
70.89%
‐
‐
Diocese of Provide
nce
3,500
80.83%
‐
‐
Gen
eral Dynam
ics E
lectric
Boat
3,400
90.81%
2,200
90.52%
Naval Und
ersea Warfare Cen
ter
2,566
100.61%
‐
‐
Bank
of A
merica (Fleet Financial Group
)‐
‐
3,240
70.76%
Shaw
's Supe
r Market
‐
‐
2,240
80.53%
Jan Co
mpanies
‐
‐
2,115
100.50%
53,350
12.65%
45,438
10.68%
Source: Co
mmerce RI 2005
Provide
nce Bu
siness N
ews ‐ Boo
k of Lists 2
015
2014
2005
NARRAGANSETT
BAY COMMISSION
Principal Employers (Unaudited)
2014 and 2005
83

2015
2014
2013
2012
2011
2010
2009
2008
2007
2006
Num
ber o
f treatmen
t plants
2
2
2
2
2
2
2
2
2
2
Num
ber o
f employees
257
245
254
246
246
244
237
241
245
247
Field's Point Plant (Lar gest WWTF in
RI)
Dail y average treatm
ent in gallons (m
gd)
40.55
42.50
43.06
45.66
43.49
51.75
47.20
49.39
53.07
45.69
Total w
et weather treatm
ent ca pacity
treatm
ent (mgd)
200
200
200
200
200
200
200
200
200
200
Num
ber o
f pum
p stations
4
4
4
4
4
4
4
4
4
4
Num
ber o
f active combine
d sewer overflows (CSOs)
35
37
38
38
38
38
38
38
39
39
Miles o
f interceptor
80
80
80
80
80
80
80
80
80
80
Num
ber o
f tide gates
32
32
32
32
32
32
32
32
32
32
Bucklin
Point Plant (Second largest WWTF in
RI)
Daily average treatm
ent in gallons (m
gd)
19.2
21.7
19.8
20.4
20.0
19.7
24.0
24.83
24.83
24.61
Maxim
um daily capacity
of treatmen
t (mgd)
116
116
116
116
116
116
116
116
116
46
Num
ber o
f pum
p stations
3
3
3
3
3
3
3
3
3
3
Num
ber o
f active combine
d sewer overflows (CSOs)
26
26
26
26
26
26
26
26
27
27
Miles o
f interceptor
30
30
30
30
30
30
30
30
30
30
mgd
= m
illion g allons per day
Source: Managem
ent o
f NBC
NARRAGANSETT
BAY COMMISSION
Operating Indicators by Division ‐ (Unaudited)
Last Ten
Fiscal Years
84

Dep
artmen
ts2015
2014
2013
2012
2011
2010
2009
2008
2007
2006
Executive Affairs
8.0
8.0
8.0
8.0
8.0
8.0
8.0
8.0
8.0
8.0
Constructio
n Services
13.0
13.0
13.0
12.0
12.0
10.0
10.0
9.0
10.0
10.0
Human
Resou
rces
4.0
4.0
4.0
4.0
4.0
4.0
4.0
4.0
4.0
4.0
Legal
5.0
5.0
5.0
5.0
5.0
5.0
5.0
5.0
5.0
5.0
Finance
5.0
5.0
5.0
5.0
5.0
5.0
5.0
5.0
5.0
5.0
Accoun
ting
10.0
10.0
10.0
10.0
10.0
10.0
10.0
10.0
10.0
11.0
Inform
ation Techno
logy
12.0
12.0
12.0
11.0
11.0
11.0
11.0
11.0
11.0
11.0
Custom
er Service
24.0
24.0
24.0
24.0
24.0
24.0
22.0
22.0
22.0
21.0
Purchasin
g4.0
4.0
4.0
4.0
4.0
4.0
4.0
4.0
4.0
4.0
Planning
5.0
5.0
5.0
5.0
5.0
4.0
4.0
4.0
4.0
4.0
Pretreatmen
t14
.0
14.0
14.0
14.0
15.0
15.0
15.0
15.0
15.0
15.0
Labo
ratory
17.0
16.0
16.0
16.0
16.0
17.0
15.0
15.0
15.0
15.0
Environm
ental Safety and Technical
A
ssistance
4.0
4.0
4.0
4.0
4.0
4.0
4.0
4.0
4.0
4.0
Environm
ental M
onito
ring and Da
ta A
nalysis
17.0
17.0
17.0
17.0
17.0
17.0
17.0
17.0
17.0
17.0
Intercep
tor M
ainten
ance
20.0
20.0
20.0
21.0
22.0
22.0
22.0
22.0
22.0
21.0
Engine
ering
9.0
9.0
8.0
9.0
10.0
10.0
11.0
11.0
10.0
10.0
Field's P
oint W
WTF
59.0
57.0
57.0
58.0
56.0
56.0
56.0
56.0
56.0
56.0
Bucklin
Point W
WTF
35.0
34.0
33.0
33.0
32.0
32.0
32.0
32.0
32.0
32.0
Total B
udgeted
Employees
265.0
261.0
25
9.0
26
0.0
26
0.0
25
8.0
25
5.0
25
4.0
25
4.0
25
3.0
NARRAGANSETT
BAY COMMISSION
Budgeted
Employees by Activity (Unaudited)
Last Ten
Fiscal Years
85

This page was intentionally left blank.

This page was intentionally left blank.
COMPLIANCE SECTION

This page was intentionally left blank.

HAGUE, SAHADY & CO., P.C.….…..
CERTIFIED PUBLIC ACCOUNTANTS 126 President Avenue
Fall River, MA 02720 TEL. (508) 675-7889 FAX (508) 675-7859
www.hague-sahady.com
INDEPENDENT AUDITOR’S REPORT ON INTERNAL CONTROL OVER FINANCIAL REPORTING AND ON COMPLIANCE AND OTHER MATTERS BASED ON AN AUDIT OF FINANCIAL STATEMENTS
PERFORMED IN ACCORDANCE WITH GOVERNMENT AUDITING STANDARDS To the Board of Commissioners Narragansett Bay Commission Providence, Rhode Island We have audited, in accordance with the auditing standards generally accepted in the United States of America and the standards applicable to financial audits contained in Government Auditing Standards issued by the Comptroller General of the United States, the financial statements of the Narragansett Bay Commission (NBC), as of and for the year ended June 30, 2015, and the related notes to the financial statements, which collectively comprise NBC’s basic financial statements, and have issued our report thereon dated September 8, 2015.
Internal Control over Financial Reporting
In planning and performing our audit of the financial statements, we considered NBC’s internal control over financial reporting (internal control) to determine the audit procedures that are appropriate in the circumstances for the purpose of expressing our opinions on the financial statements, but not for the purpose of expressing an opinion on the effectiveness of NBC’s internal control. Accordingly, we do not express an opinion on the effectiveness of NBC’s internal control.
A deficiency in internal control exists when the design or operation of a control does not allow management or employees, in the normal course of performing their assigned functions, to prevent, or detect and correct, misstatements on a timely basis. A material weakness is a deficiency, or a combination of deficiencies, in internal control, such that there is a reasonable possibility that a material misstatement of the entity’s financial statements will not be prevented, or detected and corrected on a timely basis. A significant deficiency is a deficiency, or a combination of deficiencies, in internal control that is less severe than a material weakness, yet important enough to merit attention by those charged with governance.
Our consideration of internal control was for the limited purpose described in the first paragraph of this section and was not designed to identify all deficiencies in internal control that might be material weaknesses or, significant deficiencies. Given these limitations, during our audit we did not identify any deficiencies in internal control that we consider to be material weaknesses. However, material weaknesses may exist that have not been identified.
86

Compliance and Other Matters As part of obtaining reasonable assurance about whether NBC’s financial statements are free from material misstatement, we performed tests of its compliance with certain provisions of laws, regulations, contracts, and grant agreements, noncompliance with which could have a direct and material effect on the determination of financial statement amounts. However, providing an opinion on compliance with those provisions was not an objective of our audit, and accordingly, we do not express such an opinion. The results of our tests disclosed no instances of noncompliance or other matters that are required to be reported under Government Auditing Standards. Purpose of this Report The purpose of this report is solely to describe the scope of our testing of internal control and compliance and the results of that testing, and not to provide an opinion on the effectiveness of the entity’s internal control or on compliance. This report is an integral part of an audit performed in accordance with Government Auditing Standards in considering the entity’s internal control and compliance. Accordingly, this communication is not suitable for any other purpose.
Fall River, Massachusetts September 8, 2015
87

Nar
raga
nset
t Bay
Com
mis
sion
Long
Dis
tanc
e Tr
avel
For t
he Y
ear E
nded
Jun
e 30
, 201
5
TR
AV
EL
D
AT
E P
AID
T
RA
VE
LE
RPA
YE
ED
AT
ES
CH
EC
K
BY
NB
CPU
RPO
SE O
F T
RA
VE
LD
EST
INA
TIO
NT
OT
AL
S Executive (21)
Ray
mon
d M
arsh
all
Ray
mon
d M
arsh
all
S7/
12/1
4-7/
17/1
489
548
7/22
/14
NA
CW
A 2
014
Sum
mer
Con
fere
nce
Portl
and,
OR
686
$
Jam
ie R
Sam
ons
Jam
ie R
Sam
ons
S7/
12/1
4-7/
14/1
489
957
8/26
/14
NA
CW
A 2
014
Sum
mer
Con
fere
nce
Portl
and,
OR
347
Vin
cent
Mes
olel
la Jr
Vin
cent
Mes
olel
la Jr
S9/
9/14
-9/1
1/14
9060
410
/14/
14B
ond
& F
inan
cing
Sem
inar
Was
hing
ton,
DC
1,83
7Ja
mie
R S
amon
sJa
mie
R S
amon
sA
2/1/
15-2
/4/1
591
625
1/13
/15
NA
CW
A 2
015
Win
ter C
onfe
renc
eC
harle
ston
, SC
863
Dia
ne M
Bue
rger
Dia
ne M
Bue
rger
R6/
28/1
5-7/
1/15
9192
62/
10/1
5SH
RM
201
5La
s Veg
as, N
V1,
280
Jam
ie R
Sam
ons
NA
CW
AR
2/1/
15-2
/4/1
592
334
3/17
/15
NA
CW
A 2
015
Win
ter C
onfe
renc
eC
harle
ston
, SC
850
Dia
ne M
Bue
rger
Dia
ne M
Bue
rger
A6/
27/1
5-7/
2/15
9216
03/
10/1
5SH
RM
201
5La
s Veg
as, N
V77
2Ja
mie
R S
amon
sJa
mie
R S
amon
sA
4/13
/15-
4/14
/15
9248
14/
1/15
NA
CW
A 2
015
Wat
er P
olic
y Fo
rum
Was
hing
ton,
DC
579
Jam
ie R
Sam
ons
Jam
ie R
Sam
ons
S2/
1/15
-2/4
/15
9248
14/
1/15
NA
CW
A 2
015
Win
ter C
onfe
renc
eC
harle
ston
, SC
285
Jam
ie R
Sam
ons
Jam
ie R
Sam
ons
S4/
13/1
5-4/
14/1
592
963
5/12
/15
NA
CW
A 2
015
Wat
er P
olic
y Fo
rum
Was
hing
ton,
DC
132
Ray
mon
d M
arsh
all
Ray
mon
d M
arsh
all
S4/
12/1
5-4/
14/1
592
989
5/12
/15
NA
CW
A L
egis
lativ
e C
onfe
renc
eW
ashi
ngto
n, D
C1,
292
Jam
ie R
Sam
ons
Jam
ie R
Sam
ons
S4/
28/1
5-4/
30/1
592
962
5/12
/15
NA
CW
A C
onse
nt D
ecre
e W
orks
hop
Phila
delp
hia,
PA
1,14
8R
aym
ond
Mar
shal
lN
AC
WA
R4/
13/1
5-4/
14/1
592
890
5/5/
2015
NA
CW
A 2
015
Wat
er P
olic
y Fo
rum
Was
hing
ton,
DC
250
Ray
mon
d M
arsh
all
Ray
mon
d M
arsh
all
S6/
4/15
-6/5
/15
9338
36/
16/2
015
NA
CW
A C
EO S
earc
h Pr
oces
sC
hica
go, I
L 74
7Ja
mie
R S
amon
sN
AC
WA
R4/
6/14
-4/9
/14
9347
56/
23/2
015
NA
CW
A 2
014
Wat
er P
olic
y Fo
rum
Was
hing
ton,
DC
250
Jam
ie R
Sam
ons
NA
CW
AR
7/12
/14-
7/14
/14
9347
56/
23/2
015
NA
CW
A 2
014
Sum
mer
Con
fere
nce
Portl
and,
OR
850
Jam
ie R
Sam
ons
NA
CW
AR
4/13
/15-
4/14
/15
9347
56/
23/2
015
NA
CW
A 2
015
Wat
er P
olic
y Fo
rum
Was
hing
ton,
DC
250
Jam
ie R
Sam
ons
NA
CW
AR
4/28
/15-
4/30
/15
9347
56/
23/2
015
NA
CW
A C
onse
nt D
ecre
e W
orks
hop
Phila
delp
hia,
PA
425
12
,844
Legal (24
)Je
nnife
r Gal
ego
NA
CW
AR
11/1
9/14
-11/
21/1
490
199
9/16
/14
NA
CW
A L
aw S
emin
arSt
. Pet
e B
each
, FL
850
Jenn
ifer G
aleg
oJe
nnife
r Gal
ego
A11
/18/
14-1
1/21
/14
9019
19/
16/1
4N
AC
WA
Law
Sem
inar
St. P
ete
Bea
ch, F
L88
8Je
nnife
r Gal
ego
Jenn
ifer G
aleg
oS
11/1
8/14
-11/
22/1
491
199
12/2
/14
NA
CW
A L
aw S
emin
arSt
. Pet
e B
each
, FL
271
Jenn
ifer G
aleg
oJe
nnife
r Gal
ego
A4/
28/1
5-4/
30/1
592
328
3/17
/15
NA
CW
A 2
015
Wet
Wea
ther
Con
sent
Dec
ree
WS
Phila
delp
hia,
PA
910
Jenn
ifer G
aleg
oN
AC
WA
R4/
29/1
5-4/
30/1
592
334
3/17
/15
NA
CW
A 2
015
Wet
Wea
ther
Con
sent
Dec
ree
WS
Phila
delp
hia,
PA
425
Jenn
ifer G
aleg
oJe
nnife
r Gal
ego
S4/
28/1
5-4/
30/1
592
963
5/12
/15
NA
CW
A 2
015
Wet
Wea
ther
Con
sent
Dec
ree
WS
Phila
delp
hia,
PA
195
3,53
9Fina
nce (31)
Kar
en L
Gie
bink
Kar
en L
Gie
bink
S9/
10/1
4-9/
11/1
490
193
9/16
/14
Mun
icip
al Is
suer
s Con
fere
nce
Was
hing
ton,
DC
759
Kar
en L
Gie
bink
Kar
en L
Gie
bink
A12
/8/1
4-12
/8/1
491
200
12/2
/14
EPA
Ses
sion
on
WIF
IAW
ashi
ngto
n, D
C28
7K
aren
L G
iebi
nkK
aren
L G
iebi
nkS
12/8
/14-
12/8
/14
9134
412
/16/
14EP
A S
essi
on o
n W
IFIA
Was
hing
ton,
DC
274
Kar
en L
Gie
bink
Kar
en L
Gie
bink
S5/
30/1
5-6/
3/15
9346
96/
23/1
5N
atio
nal G
FOA
Con
fere
nce
Phila
delp
hia,
PA
1,37
4
2,69
4IT (3
3)K
athl
een
Smith
Kat
hlee
n Sm
ithA
8/4/
14-8
/6/1
489
520
7/22
/14
NEL
AC
Env
ironm
enta
l Mea
sure
men
t Sym
posi
umW
ashi
ngto
n, D
C1,
044
Kat
hlee
n Sm
ithK
athl
een
Smith
S8/
4/14
-8/6
/14
8995
88/
26/1
4N
ELA
C E
nviro
nmen
tal M
easu
rem
ent S
ympo
sium
Was
hing
ton,
DC
259
1,30
3IM
(43)
Meg Gou
let
Meg Gou
let
A9/
26/1
4-10
/2/1
489
866
8/19
/14
WEF
TEC
201
4 C
onfe
renc
eN
ew O
rlean
s, LA
1,82
5Meg Gou
let
Meg Gou
let
S9/
26/1
4-10
/2/1
490
565
10/1
4/14
WEF
TEC
201
4 C
onfe
renc
eN
ew O
rlean
s, LA
735
Michael J Caruolo
Michael J Caruolo
A7/
19/1
5-7/
24/1
592
096
2/24
/15
ESR
I Use
r Con
fere
nce
San
Die
go, C
A2,
242
4,80
2
88

Nar
raga
nset
t Bay
Com
mis
sion
Long
Dis
tanc
e Tr
avel
For t
he Y
ear E
nded
Jun
e 30
, 201
5
TR
AV
EL
D
AT
E P
AID
T
RA
VE
LE
RPA
YE
ED
AT
ES
CH
EC
K
BY
NB
CPU
RPO
SE O
F T
RA
VE
LD
EST
INA
TIO
NT
OT
AL
S EN
G (4
4)Iz
iarh
Rob
erts
Jr.
Izia
rh R
ober
ts Jr
.A
7/19
/15-
7/24
/15
9217
43/
3/15
ESR
I Use
r Con
fere
nce
San
Die
go, C
A2,
073
Euge
ne S
orki
nEu
gene
Sor
kin
A6/
28/1
5-7/
1/15
9363
57/
8/15
Fact
ory
test
ing
for B
low
ers a
t HSI
Fac
ility
Hou
ston
, TX
1,44
5Eu
gene
Sor
kin
Euge
ne S
orki
nS
6/28
/15-
7/1/
1593
704
7/14
/15
Fact
ory
test
ing
for B
low
ers a
t HSI
Fac
ility
Hou
ston
, TX
300
3,81
8Plan
ning
(51)
Pam
ela
Rei
tsm
aW
ater
Env
ironm
ent F
edR
9/26
/14-
10/2
/14
8971
98/
5/14
WEF
TEC
201
4 C
onfe
renc
eN
ew O
rlean
s, LA
875
Pam
ela
Rei
tsm
aPa
mel
a R
eits
ma
A9/
27/1
4-10
/1/1
489
778
8/12
/14
WEF
TEC
201
4 C
onfe
renc
eN
ew O
rlean
s, LA
350
Pam
ela
Rei
tsm
aPa
mel
a R
eits
ma
S9/
27/1
4-10
/1/1
490
580
10/1
4/14
WEF
TEC
201
4 C
onfe
renc
eN
ew O
rlean
s, LA
1,10
2Pa
mel
a R
eits
ma
NEW
EAR
9/29
/14-
9/29
/14
9064
510
/21/
14N
EWEA
Lun
cheo
n M
eetin
gN
ew O
rlean
s, LA
55
2,38
2PT
(52)
Ker
ry B
ritt
NA
CW
AR
5/12
/15-
5/15
/15
9282
14/
28/1
5N
AC
WA
201
5 N
at'l
PT &
Pol
lutio
n Pr
even
tion
Wor
ksho
pG
reen
ville
, SC
600
Ker
ry B
ritt
Ker
ry B
ritt
A5/
12/1
5-5/
15/1
592
634
4/14
/15
NA
CW
A 2
015
Nat
'l PT
& P
ollu
tion
Prev
entio
n W
orks
hop
Gre
envi
lle, S
C25
0K
erry
Brit
tK
erry
Brit
tS
5/12
/15-
5/15
/15
9314
65/
26/1
5N
AC
WA
201
5 N
at'l
PT &
Pol
lutio
n Pr
even
tion
Wor
ksho
pG
reen
ville
, SC
765
1,61
5Lab (53)
Nor
a Lo
ugh
Nor
a Lo
ugh
S9/
23/1
4-9/
23/1
490
650
10/2
1/14
Inst
rum
ent R
esea
rch
Mel
ville
, NY
242
Ang
elin
a G
late
rA
ngel
ina
Gla
ter
A3/
8/15
-3/1
2/15
9198
32/
17/1
520
15 P
ittco
n C
onfe
renc
e &
Exp
oN
ew O
rlean
s. LA
1,59
5N
ora
Loug
hN
ora
Loug
hA
6/7/
15-6
/10/
1592
824
4/28
/15
NEW
EA S
prin
g M
eetin
gB
retto
n W
oods
, NH
20
0W
alte
r Pal
mW
alte
r Pal
mA
6/7/
15-6
/10/
1592
851
4/28
/15
NEW
EA S
prin
g M
eetin
gB
retto
n W
oods
, NH
82
2A
ngel
ina
Gla
ter
Ang
elin
a G
late
rS
3/8/
15-3
/12/
1592
449
4/1/
1520
15 P
ittco
n C
onfe
renc
e &
Exp
oN
ew O
rlean
s. LA
1,24
0N
ora
Loug
hN
ora
Loug
hS
6/7/
15-6
/10/
1593
481
6/23
/15
NEW
EA C
onfe
renc
e Sp
ring
Mee
ting
& E
xhib
itB
retto
n W
oods
, NH
53
9W
alte
r Pal
mW
alte
r Pal
mS
6/7/
15-6
/10/
1593
509
6/23
/15
NEW
EA C
onfe
renc
e Sp
ring
Mee
ting
& E
xhib
itB
retto
n W
oods
, NH
17
9N
ora
Loug
hN
EWEA
R6/
7/15
-6/1
0/15
9379
67/
21/1
5N
EWEA
Con
fere
nce
Sprin
g M
eetin
g &
Exh
ibit
Bre
tton
Woo
ds, N
H
380
Wal
ter P
alm
NEW
EAR
6/7/
15-6
/10/
1593
796
7/21
/15
NEW
EA C
onfe
renc
e Sp
ring
Mee
ting
& E
xhib
itB
retto
n W
oods
, NH
38
0
5,57
8ESTA
(54)
Dav
id J
Auc
oin
Dav
id J
Auc
oin
A10
/28/
14-1
0/30
/14
8994
48/
26/1
4N
atio
nal W
AR
N C
hairs
Mee
ting
Atla
nta,
GA
45Ja
mes
C M
cCau
ghey
Wat
er E
nviro
nmen
t Fed
R9/
26/1
4-10
/2/1
489
719
8/5/
14W
EFTE
C 2
014
Con
fere
nce
New
Orle
ans,
LA87
5Ja
mes
C M
cCau
ghey
Jam
es C
McC
augh
eyS
9/27
/14-
10/2
/14
9056
010
/14/
14W
EFTE
C 2
014
Con
fere
nce
New
Orle
ans,
LA1,
471
Bar
ry W
ensk
owic
zN
EWEA
R10
/22/
14-1
0/23
/14
9096
011
/12/
14N
orth
Eas
t Res
idua
ls &
Bio
solid
s Con
fere
nce
Portl
and,
ME
220
Bar
ry W
ensk
owic
zB
arry
Wen
skow
icz
S10
/22/
14-1
0/23
/14
9082
211
/3/1
4N
orth
Eas
t Res
idua
ls &
Bio
solid
s Con
fere
nce
Portl
and,
ME
262
Jam
es C
McC
augh
eyJa
mes
C M
cCau
ghey
C9/
27/1
4-10
/2/1
490
847
11/3
/14
WEF
TEC
201
4 C
onfe
renc
eN
ew O
rlean
s, LA
180
Dav
id J
Auc
oin
Dav
id J
Auc
oin
S10
/28/
14-1
0/30
/14
9091
311
/12/
14N
atio
nal W
AR
N M
eetin
gA
tlant
a, G
A22
3D
avid
J A
ucoi
nD
avid
J A
ucoi
nS
12/9
/14-
12/9
/14
9141
312
/23/
14EP
A W
orks
hop
Portl
and,
CT
121
Jam
es C
McC
augh
eyN
AC
WA
R5/
12/1
5-5/
15/1
593
151
5/26
/15
NA
CW
A 2
015
Nat
'l PT
& P
ollu
tion
Prev
entio
n W
orks
hop
Gre
envi
lle, S
C60
0Ja
mes
C M
cCau
ghey
Jam
es C
McC
augh
eyS
4/28
/15-
4/29
/15
9296
15/
12/1
5D
OE
Con
fere
nce
Was
hing
ton,
DC
641
Jam
es C
McC
augh
eyJa
mes
C M
cCau
ghey
S5/
12/1
5-5/
15/1
593
203
6/2/
15N
AC
WA
Con
fere
nce
Cha
rlest
on, S
C1,
012
Jam
es C
McC
augh
eyJa
mes
C M
cCau
ghey
S6/
7/15
-6/1
1/15
9346
76/
22/1
5W
EF W
ater
& E
nerg
y C
onfe
renc
eW
ashi
ngto
n, D
C1,
179
Bar
ry W
ensk
owic
zB
arry
Wen
skow
icz
S5/
26/1
5-5/
28/1
593
334
6/16
/15
Ener
gy S
umm
itW
ashi
ngto
n, D
C89
3
7,72
2
Tota
l Lon
g D
ista
nce
Trav
el46
,297
$
89