nanoscale study of the phase decomposition in model ni-al-cr …cecamp/spring07/phase decomposition...
TRANSCRIPT

Chris Booth-Morrison, David Seidman
Nanoscale Study of the Phase Decomposition in Model Ni-Al-Cr Superalloys

Project Background
Part of a larger study of model Nickel-base superalloys involving experimental and simulated results for [1-5]:- Ternary Ni-Al-Cr alloys- Quaternary Ni-Al-Cr-Re, Ni-Al-Cr-Ru, Ni-Al-Cr-W, and Ni-
Al-Cr-Ta alloys
[1] Sudbrack CK. Ph.D. thesis, Northwestern University, Decomposition Behavior in Model Ni-Al-Cr-X Superalloys:Nanostructural Evolution and Compositional Pathways, December 2004. [2] Yoon KE. Ph.D. thesis, Northwestern University, Temporal Evolution of the Chemistry and Nanostructure of Multicomponent Model Ni-Based Superalloys, June 2004. [3] Booth-Morrison C, Weninger J, Sudbrack CK, Noebe RD, Seidman DN. Effect of solute Concentrations on the Kinetic Pathways in Ni-Al-Cr Alloys. to be submitted to Acta Mat. 2006.[4] Mao Z, Sinnott SB, Martin G, D.N. S. Determination of Pair-Wise Interaction Energies and the Calculation of Ternary Phase Diagrams of Ni-Al-Cr Alloys by First-Principles Calculations. to be submitted to Acta Materialia 2006. [5] Mao Z, Sudbrack C, Yoon K, Martin G, Seidman D. Diffusion Mechanism as a Selection Process for Nucleation, Growth and Coarsening Pathway in Multicomponent Concentrated Alloys. submitted to Nature Materials 2006.
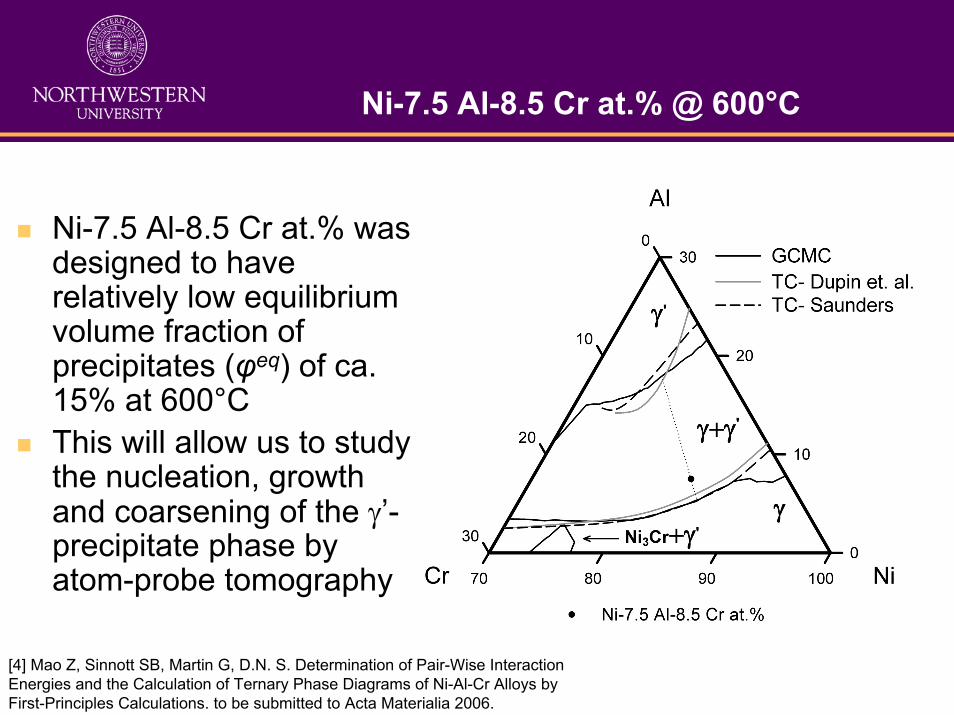
Ni-7.5 Al-8.5 Cr at.% @ 600°C
Ni-7.5 Al-8.5 Cr at.% was designed to have relatively low equilibrium volume fraction of precipitates (φeq) of ca. 15% at 600°CThis will allow us to study the nucleation, growth and coarsening of the γ’-precipitate phase by atom-probe tomography
[4] Mao Z, Sinnott SB, Martin G, D.N. S. Determination of Pair-Wise Interaction Energies and the Calculation of Ternary Phase Diagrams of Ni-Al-Cr Alloys by First-Principles Calculations. to be submitted to Acta Materialia 2006.

Atom Probe Tomography (APT)
Time of flight Chemical nature
Impact Position Atom position on tip surface
APT involves ionization of atoms from the surface of a sharp microtipIons are repelled by the anode (tip) and drawn toward the cathode (electrode)

APT Mass Spectrum
Al Cr Ni
Cou
nt
Mass-to-Charge Ratio
APT Results
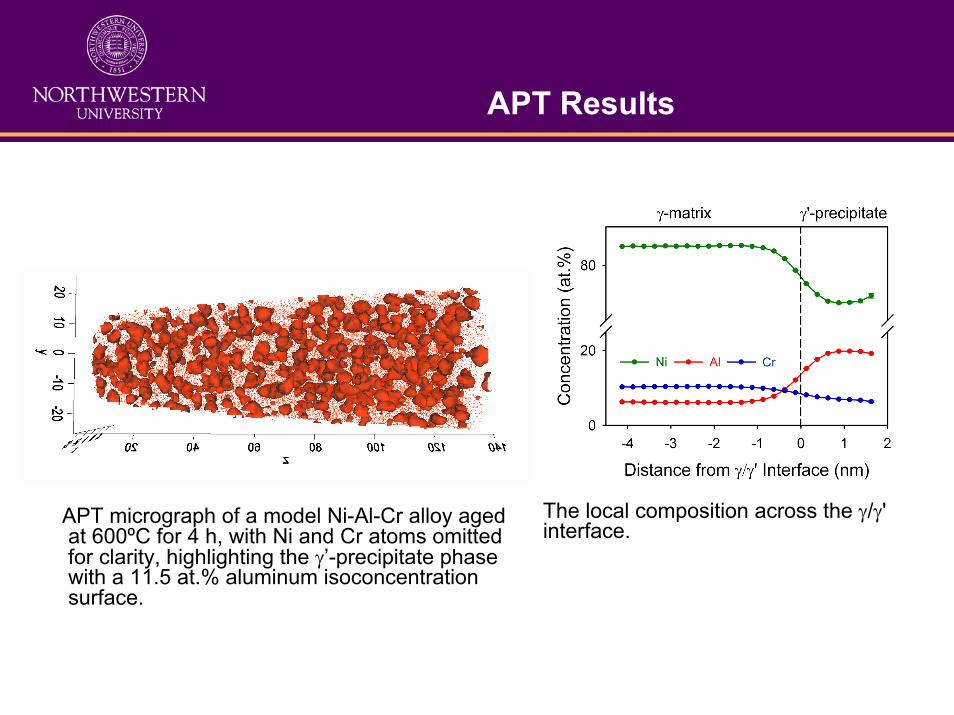
APT micrograph of a model Ni-Al-Cr alloy aged at 600ºC for 4 h, with Ni and Cr atoms omitted for clarity, highlighting the γ’-precipitate phase with a 11.5 at.% aluminum isoconcentration surface.
The local composition across the γ/γ' interface.

Atom Probe Tomography (APT)
2) Composition- evolution of the γ and γ'-phases- equilibrium phase compositions - concentration profile at the γ/γ’ interface
Phase transformation characterized over a range of aging times from 0 to 1024 hours by APT:
1) Nanostructure- precipitate morphology - average radius, <R(t)>- precipitate number density, Nv(t)- precipitate volume fraction, φ

γ’-precipitate Morphology by APT
Nanometer-sized spheroidal γ’-precipitates are detected in both alloys over the full range of aging times, from 1/6 to 1024 hours
5 nm
{110}γ-matrix
γ’-precipitate
The temporal evolution of the γ’-precipitate morphology in Ni-7.5 Al-8.5 Cr at.% aged at 600ºC.
A γ’-precipitate of radius ca. 9 nm is delineated by the dark 10.5 Al at.% isoconcentration surface, and shows {110} planes with an interplanar spacing of 0.26 nm.

TEM
TEM shows the spheroidal morphology of the γ’-precipitates is maintained to an aging time of 1024 h
100 nm
g = [111]
A centered superlattice reflection dark–field image of spheroidal γ’-precipitates, for a Ni-7.5 Al- 8.5 Cr at.% sample aged for 1024 h at 600°C. Image recorded near the [011] zone axis, with g = [111] being the operating reflection.
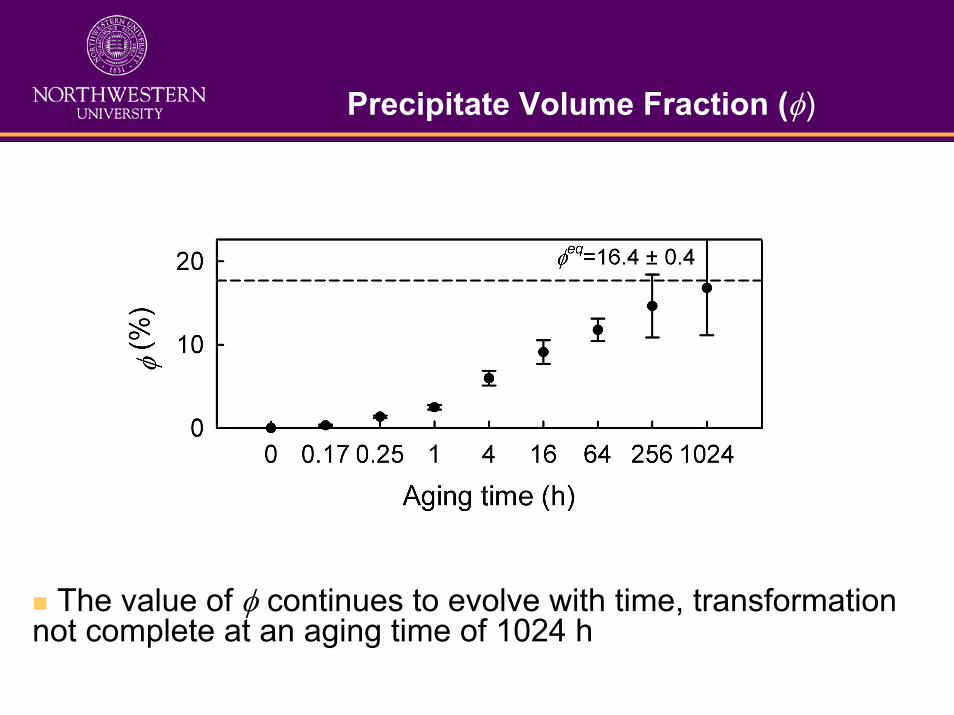
Precipitate Volume Fraction (φ)
The value of φ continues to evolve with time, transformation not complete at an aging time of 1024 h
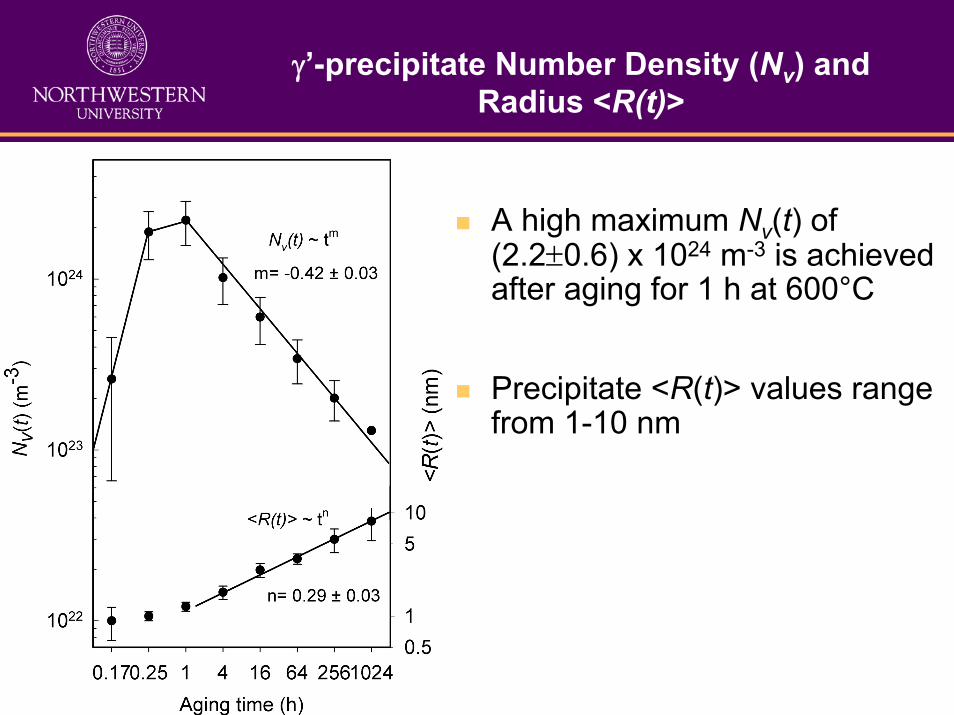
γ’-precipitate Number Density (Nv) and Radius <R(t)>
A high maximum Nv(t) of (2.2±0.6) x 1024 m-3 is achieved after aging for 1 h at 600°C
Precipitate <R(t)> values range from 1-10 nm
nucleation
nucleation& growth
growth & coarsening

Precipitate Coalescence
Precipitate coalescence at the outset of the coarsening regime in both alloys, characterized by the formation of “necked”regions which exhibit L12-type ordering.
γ’-precipitate coagulation and coalescence is believed to result from the overlap of the diffusion fields associated with adjacent γ’-precipitates [5].
[5] Mao Z, Sudbrack C, Yoon K, Martin G, Seidman D. Diffusion Mechanism as a Selection Process for Nucleation, Growth and Coarsening Pathway in Multicomponent Concentrated Alloys. submitted to Nature Materials 2006.
Atomic view of two γ’-precipitates coalescing together across a “neck”region in Ni-7.5 Al-8.5 Cr at.% after aging for 1 h at 600°

Precipitate Coalescence & Spacing
The fraction of interconnected precipitates, f(%), achieves a maximum at 1 h, corresponding to minimum in the value of the interprecipitate spacing, λe-e, and the peak Nv(t)

Calculated tracer D values: Ni-5.2 Al-14.2 Cr at.% @ 600°C
m2/s Di
Ni 2.5 x 10⁻²¹
Al 9.7 x 10⁻²¹
Cr 3.0 x 10⁻²¹
Thermodynamics : Ni-Data (N. Saunders) Diffusion Mobilities: Ni-Mob database (NIST C. E. Campbell)

Compositional Evolution
C(t=∞) = 5.42±0.03 at.%
C(t=∞) = 9.39±0.04 at.%
C(t=∞) = 17.79±0.3 at.%
C(t=∞) = 5.87±0.4 at.%
C(t=∞) = 85.19±0.02 at.%C(t=∞) = 76.34±0.2 at.%
γ’−precipitate γ−matrix
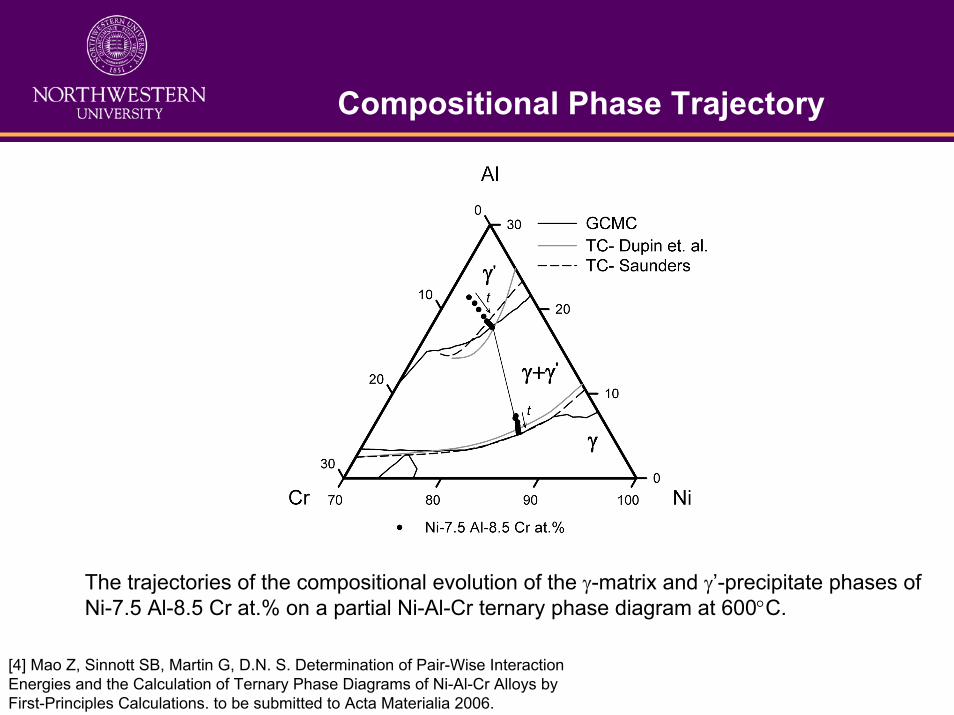
Compositional Phase Trajectory
The trajectories of the compositional evolution of the γ-matrix and γ’-precipitate phases of Ni-7.5 Al-8.5 Cr at.% on a partial Ni-Al-Cr ternary phase diagram at 600°C.
[4] Mao Z, Sinnott SB, Martin G, D.N. S. Determination of Pair-Wise Interaction Energies and the Calculation of Ternary Phase Diagrams of Ni-Al-Cr Alloys by First-Principles Calculations. to be submitted to Acta Materialia 2006.

Interfaces in Ni-7.5 Al-8.5 Cr at.%
γ-matrix and γ’-precipitate compositions continue to evolve with timeA transient enrichment of chromium and a depletion of aluminum are observed on the γ-matrix side of γ/γ'-interfaces This transient behavior is believed to be a result of flux coupling
Al
Cr
Ni

Basic Conclusions from APT
A spheroidal γ’-precipitate morphology is maintained over the full range of aging times, with some γ’-precipitate coalescence around the peak in number density
APT allows for the quantification of the nanostructural and compositional evolution during phase decomposition

Where does diffusion fit into this?
In order to understand phase decomposition, it is essential to understand:1) Thermodynamics (driving force for phase decomposition)
- ThermoCalc- APT chemical characterization
2) Kinetics (nucleation and coarsening rates, coalescence)- Dictra- Comparison of APT experimental data and KMC data (Zugang)

Questions?